
Επικοινωνιακά Συστήματα Διευρυμένου Φάσματος ( Spread Spectrum )
Lowest triplet (n,π∗) state of 2-cyclohexen-1-one:
Characterization by cavity ringdown spectroscopy and
quantum-chemical calculations
Michael O. McAnally,1, 2, ∗ Katherine L. Zabronsky,1, 2, † Daniel J. Stupca,1, ‡
Kaitlyn Phillipson,1, § Nathan R. Pillsbury,1, ¶ and Stephen Drucker1, ∗∗
1Department of Chemistry, University of Wisconsin-Eau Claire,
Eau Claire, Wisconsin, U.S.A. 54702-4004
2M. O. McAnally and K. L. Zabronsky contributed equally to this work.
(Dated: October 16, 2013)
1
Abstract
The cavity ringdown (CRD) absorption spectrum of 2-cyclohexen-1-one (2CHO) was recorded
over the range 401.5–410.5 nm in a room-temperature gas cell. The very weak band system (ϵ ≤
0.1 M−1 cm−1) in this spectral region is due to the T1(n, π*) ← S0 electronic transition. The
000 origin band was assigned to the feature observed at 24,558.8 ±0.3 cm−1. We have assigned 46
vibronic transitions in a region extending from −200 to +350 cm−1 relative to the origin band.
For the majority of these transitions we have made corresponding assignments in the spectrum
of the deuterated derivative 2CHO-2,6,6-d3. From the assignments we determined fundamental
frequencies for several vibrational modes in the T1(n, π∗) excited state of 2CHO, including the
lowest ring-twisting (99.6 cm−1) and ring-bending (262.2 cm−1) modes. These values compare
to fundamentals of 122.2 cm−1 and 251.9 cm−1, respectively, determined previously for the iso-
configurational S1(n, π∗) excited state of 2CHO and 99 cm−1 and 248 cm−1, respectively, for the
S0 ground state. With the aid of quantum-mechanical calculations, we have also ascertained de-
scriptions for these two modes, thereby resolving ambiguities appearing in the previous literature.
The ring-twisting mode (ν39) contains a significant contribution from O=C–C=C torsion, whereas
the ring-bending mode (ν38 in the ground state) involves mainly the motion of C–5 with respect to
the plane containing the other heavy atoms. The CRD spectroscopic data for the T1(n, π∗) state
have allowed us to benchmark several computational methods for treating excited states, including
time-dependent density functional theory (TDDFT) and an equation-of-motion coupled cluster
method (EOM-EE-CCSD). In turn, the computational results provide an explanation for observed
differences in the T1(n, π∗) vs. S1(n, π
∗) ring frequencies.
2
INTRODUCTION
Conjugated enone molecules undergo a variety of light-initiated reactions, including pho-
tocycloaddition and several types of photochemical rearrangement [1]. Such reactions are
typically mediated by enone excited states having triplet spin multiplicity. Computa-
tional investigations [2–10] have focused on the participation of cyclic enones, especially
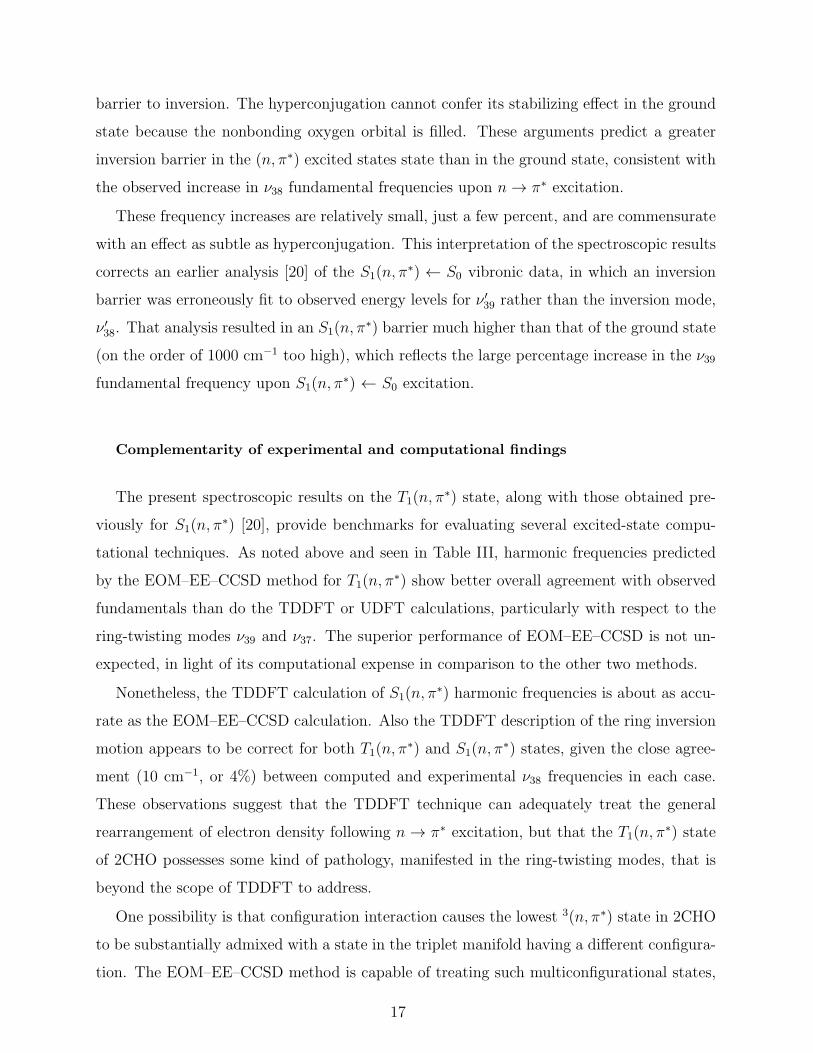
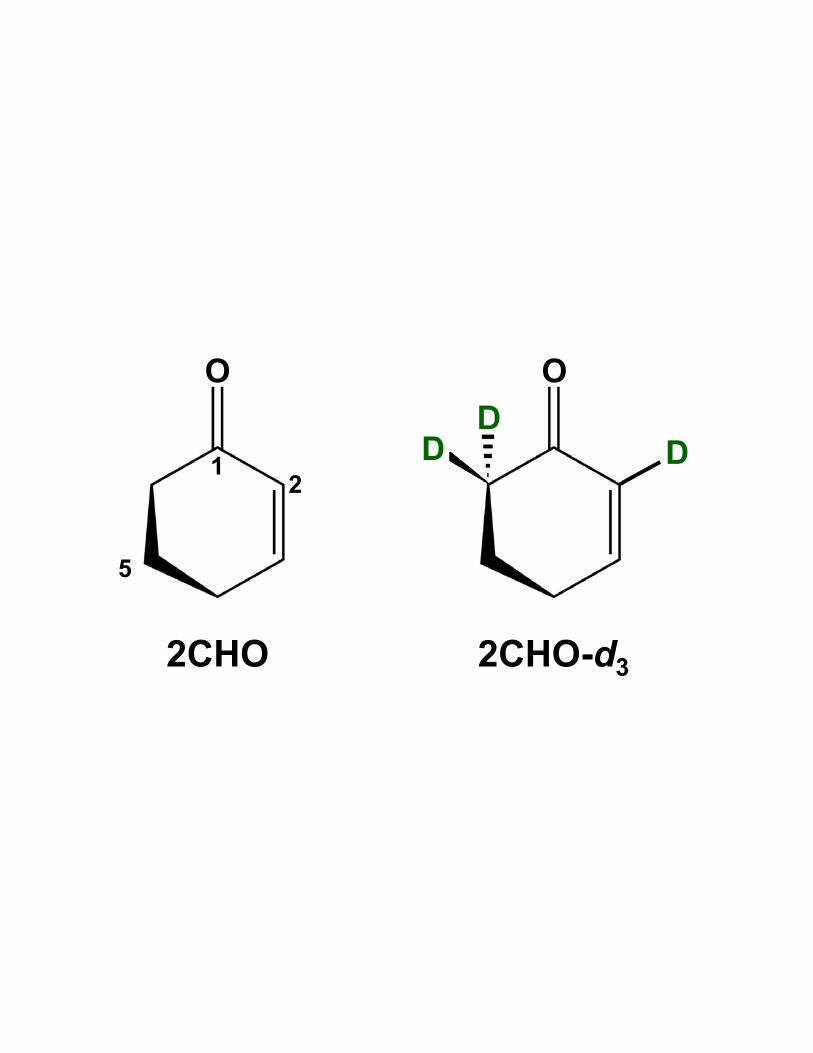
2-cyclohexen-1-one (2CHO, Fig. 1) [3, 6, 7, 9], and its substituted derivatives [4, 8] in these
processes.
To support computational work of this kind, it is desirable to have experimental bench-
mark data on the triplet enone species. Motivated by this goal, we have recorded the
vibronically resolved cavity ringdown (CRD) absorption spectrum of 2CHO in the region
of its T1(n, π∗) ← S0 transition, from 400.5 nm to 410.5 nm. As an aid in interpreting the
spectral patterns, we have also recorded the CRD spectrum of the deuterated derivative
2-cyclohexen-1-one-2,6,6-d3 (2CHO-d3, Fig. 1). In this paper we present a vibronic analysis
of the spectra and report fundamental frequencies for the lowest-energy vibrational modes
in the T1(n, π∗) state of 2CHO and 2CHO-d3.
We chose the CRD technique to investigate the T1(n, π∗)← S0 band system of 2CHO be-
cause the very high sensitivity of CRD detection is well matched to the demands of recording
spin-forbidden singlet-triplet transitions [11, 12]. An alternative for measuring such transi-
tions is phosphorescence excitation, which we used previously to study the T1(n, π∗) ← S0
band system of 2-cyclopenten-1-one (2CPO) [13]. However for 2CHO, the phosphorescence
quantum yield for T1 excitation is nearly zero, as is the fluorescence quantum yield for S1
excitation. Computational studies of enone excited states attribute the low quantum yield
to very rapid nonradiative processes that populate high vibrational levels of the S0 ground
state [2, 6]. This photophysical behavior is characteristic of skeletally flexible enones, in-
cluding the prototype acrolein molecule (CH2=CH—CH=O), as well as monocyclic enones
with six or greater ring atoms [6, 14].
For CRD studies of 2CHO we used a 75-cm static cell at room temperature. This arrange-
ment provides a sufficiently long absorption path to detect the very weak T1(n, π∗) ← S0
bands in 2CHO and 2CHO-d3 with reasonable signal-to-noise ratio, on the order of 100–
200. The pathlength requirement precludes investigation under jet-cooled conditions with
a simple pinhole source. Therefore in the present work we needed to contend with spectral
3
congestion due to vibronic hot bands (v′′ > 0) at room temperature. However, the hot bands
also provided a benefit: we have used combination differences involving observed hot bands,
along with known ground-state vibrational intervals for both 2CHO [15–17] and 2CHO-d3
[17], to aid in the assignment of the T1(n, π∗) ← S0 origin bands as well as other vibronic
origins of the type X10 . The latter provide fundamental frequencies for several T1 vibrational
modes.
The ground electronic state (S0) of 2CHO has been characterized previously via mi-
crowave spectroscopy [18] as well as computational studies [17, 19, 20] using density func-
tional theory (DFT). These investigations show that the 2CHO molecule has a half-chair
equilibrium geometry in its ground state, with all heavy atoms except C–5 nearly coplanar.
The C–5 atom lies approximately 0.4 A above the plane of the other atoms, according to
DFT calculations [19]. Previous Raman [15] and far-infrared [16] investigations analyzed
the vibrational band structure of the lowest frequency modes, ν39 and ν38, in the S0 state
of 2CHO. These studies focused on determining the barrier to inversion of C–5 through
the molecular plane, although the Raman and far-infrared investigations led the respective
authors to different conclusions about whether the inversion descriptor applies to ν39 or ν38.
In collaboration with Laane et al., we reported CRD spectra of 2CHO and 2CHO-
d3 near 385 nm, in the region of the S1(n, π∗) ← S0 band system [20]. We presented a
vibronic analysis of these spectra, providing fundamental frequencies for the four lowest-
energy vibrations in the S1 state. We also assumed ν39 corresponds to inversion and fit one-
dimensional inversion potentials for S0 and S1, based on ν ′′39 and ν ′
39 progressions observed
in the spectra.
In the present paper we compare the S1 fundamental frequencies determined previously
[20] with the corresponding T1 frequencies we report now. These comparisons again raise
questions about the appropriate mode descriptions for ν39 and ν38. To address these ques-
tions we have conducted a computational study of the S1 and T1 states. We report here
the computed equilibrium geometries and fundamental vibrational frequencies of CHO in
the two excited states. As we will discuss, this computational investigation clarifies the
ν38 and ν39 mode descriptions and allows us to rationalize observed differences between ν39
fundamental frequencies in the two excited states.
We employed several different excited-state computational techniques in this work, in-
cluding time-dependent density functional theory (TDDFT), unrestricted density func-
4
tional theory (UDFT), and equation-of-motion electronic excitation coupled-cluster singles
doubles (EOM-EE-CCSD). We used experimental vibrational frequency data from the
T1(n, π∗) ← S0 and S1(n, π
∗) ← S0 [20] CRD spectra to benchmark these computational
methods. In turn, the computational results have provided insights about the multiconfig-
urational quality of the T1(n, π∗) and S1(n, π
∗) excited states.
EXPERIMENTAL AND COMPUTATIONAL DETAILS
Experiment
The light source for the CRD spectroscopy system is a pulsed dye laser (Sirah Cobra)
operated using Exalite 404 or Exalite 411 dye (Exciton) and pumped by the third harmonic
of a Nd:YAG laser (Continuum Surelite II) running at 10 Hz. The dye-laser output (2–5
mJ/pulse) is sent through a Keplerian telescope to reduce its beam diameter to approxi-
mately 2 mm. The laser beam is then directed into the sample cell, a stainless-steel tube
of length 0.75 m, which is vacuum-sealed on the ends by adjustable high-reflectivity mirrors
(Layertec, quoted R > 0.9998).
The ringdown decay transient is detected by a photomultiplier module (Hamamatsu
H6780) located just outside the exit mirror. The photomultiplier output is sent through a
100-ohm terminator to a fast A/D card (Measurement Computing PCI-DAS4020) installed
in a PC. The card samples the input CRD signal at a rate of 20 Ms/sec. The digitized
transient is fit to a monoexponential decay function (including baseline offset) using a Lab-
VIEW program. At a given laser wavelength, the fitted decay rate constants (k) from 10-20
successive laser pulses are averaged and stored. To produce a CRD spectrum, the decay
constant of the evacuated sample cell, kempty, is subtracted from the average k value at a
given wavelength with the sample present, and the resulting ∆ksample is converted to frac-
tional photon loss per pass (f), via the expression f = (∆ksample)L/c [11], where L is the
cell length, and c is the speed of light.
For the present experiment, the cell was evacuated to a pressure of < 1 mTorr using a
diffusion pump. Then, following several freeze-pump-thaw cycles, the vapor in equilibrium
with a sample of liquid 2CHO was introduced into the cell at room temperature until the
vapor reached its maximum pressure of 1.6 Torr.
5
The sample of 2CHO-d3 was prepared as described previously [20]. Analysis of the liquid
product by NMR and of its vapor by FTIR indicated that it contained approximately 85%
of the desired 2CHO-2,6,6 trideuterated product, with the remainder 2CHO-6,6-d2. After
recording CRD spectra of the nondeuterated sample, and before commencing the CRD
studies of 2CHO-d3, the cell was passivated by rinsing many times with the deuterated
sample vapor.
Computational methods
To investigate the T1(n, π∗) and S1(n, π
∗) states of 2CHO, we employed computational
methods based on ab initio theory or DFT and developed explicitly for treating excited
states. For the T1(n, π∗) state we also used UDFT, which is a ground-state method but is
appropriate for the T1(n, π∗) state of 2CHO because this state has the lowest energy of its
its spin multiplicity at a geometry corresponding to the Franck-Condon active region of the
spectrum [21]. Each calculation involved geometry optimization followed by a normal-modes
analysis and determination of harmonic vibrational frequencies.
The ab initio (wavefunction-based) technique we used was EOM–EE–CCSD, which ap-
plies an equation-of-motion (EOM) approach to calculate electronic excited-state (EE) prop-
erties and incorporates high-level coupled-cluster singles doubles excitations (CCSD) to treat
dynamic electron correlation [22]. EOM-EE-CCSD calculations were done using the CC-
MAN module of the Q-Chem 4.0.0.1 package [23] and employed the cc-pVDZ or 6-31G* basis
set. We used the WebMO program [24] as a graphical interface for submission of certain
jobs to Q-Chem.
DFT methods included TDDFT for both the S1(n, π∗) and T1(n, π
∗) states and UDFT for
the T1(n, π∗) state. For the TDDFT calculations we used the Becke three-parameter Lee-
Yang-Parr (B3LYP) hybrid functional [25–27] with the cc-pVTZ or 6-311+G** basis set
in Q-Chem 4.0.0.1. For the UDFT calculations we used either the B3LYP or the Perdew-
Burke-Ernzerhof (PBE0) hybrid functional [28] with the TZ2P basis set in the ADF2013
software package [29].
We chose TDDFT in particular to compute the barrier to ring inversion for the T1(n, π∗) and
S1(n, π∗) states. We ran these calculations to complement a previous DFT investigation [20]
of the S0 ground state. Here we define the inversion barrier as the energy difference between
6
the equilibrium geometry of 2CHO, which has C1 symmetry, and the structure optimized
under the constraint of Cs symmetry, in which all the heavy atoms are coplanar.
RESULTS
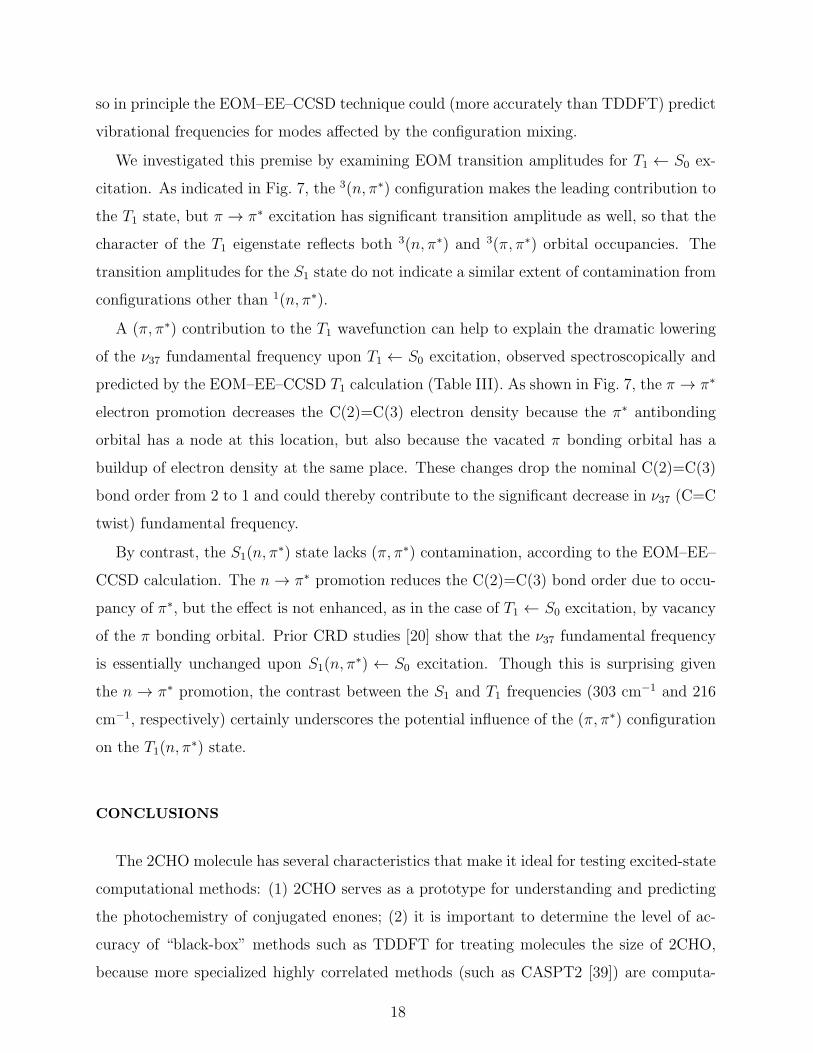
Assignment of origin bands
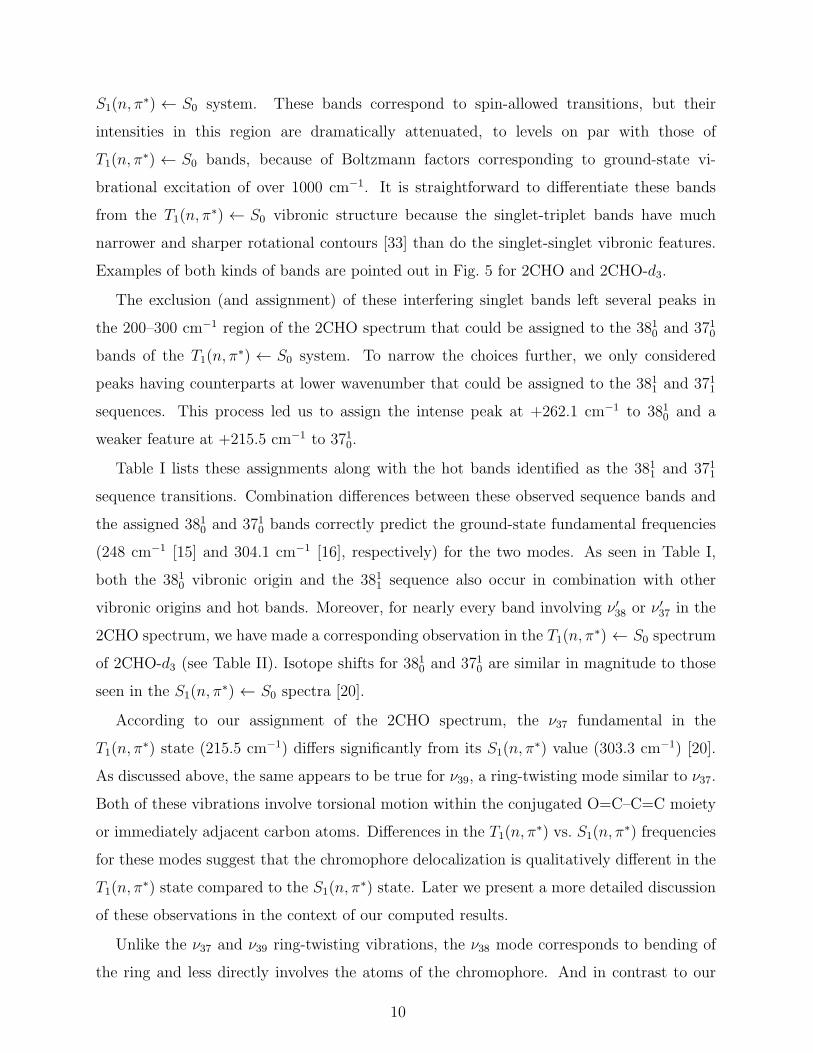
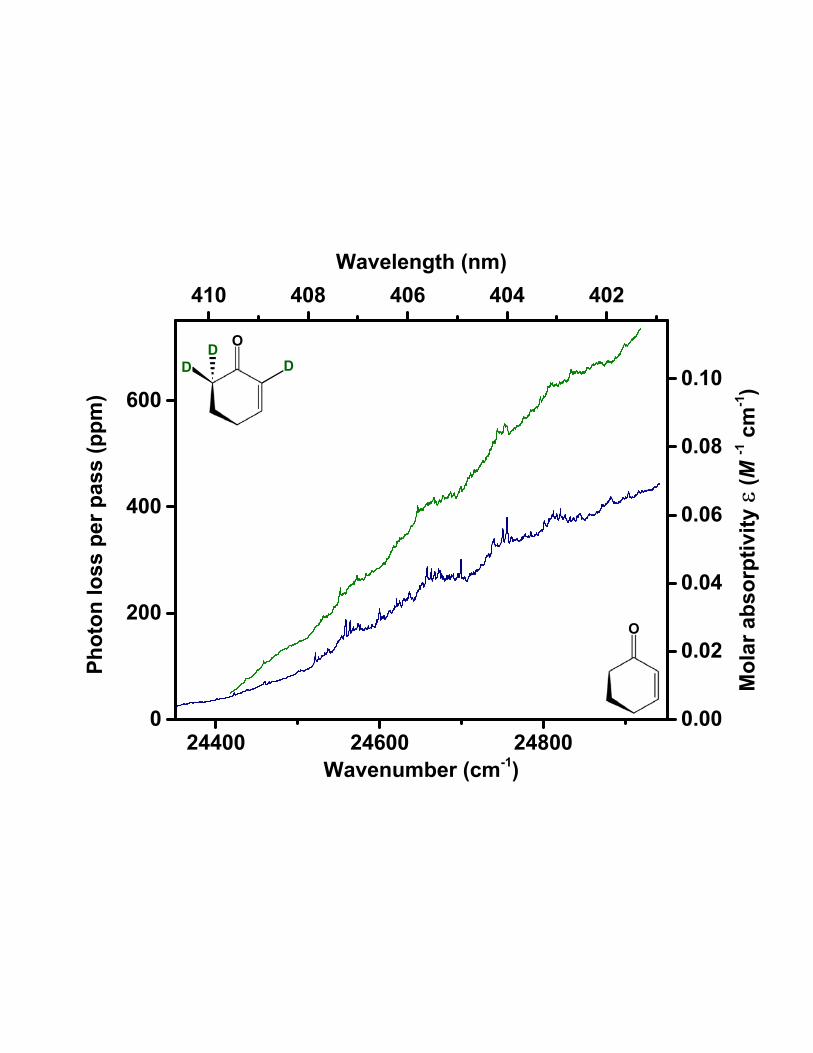
Fig. 2 shows CRD spectra of 2CHO and 2CHO-d3. We have assigned the T1(n, π∗) ← S0 ori-
gin band (000) to the feature at 24558.8 cm−1 in the 2CHO spectrum and 24552.0 cm−1 in
the 2CHO-d3 spectrum. These assignments are based on the following considerations:
1) In the spectra of 2CHO and 2CHO-d3, the assigned T1(n, π∗) ← S0 origin bands mark the
onset of a group of relatively intense resolved bands occurring toward higher wavenumber,
atop a gradually increasing baseline. Vibronic origins of the ring vibrations, such as 3910 and
3810, are expected to occur among the resolved bands in this higher wavenumber region, up
to +300 cm−1 with respect to the assigned origin position. The steepening baseline can be
ascribed to the accumulation of closely spaced and unresolved sequence bands of the types
X11 , X
21 , X
22 , etc., attached to the 000 band and other vibronic origins. To lower wavenumber
of the assigned 000 band in each spectrum is a series of low-intensity peaks on a gradually
flattening baseline. The resolved features in this region are identified as hot bands involving
little or no vibrational excitation in the upper state.
2) In the 2CHO spectrum, the assigned T1(n, π∗) ← S0 origin band is located 1523 cm−1 be-
low that of the S1(n, π∗) ← S0 transition [20]. This S1 − T1 energy gap is comparable to
those of other small α, β-unsaturated carbonyl compounds having the same chromophore,
including acrolein (with a singlet–triplet gap of 1615 cm−1 [30, 31]) and 2CPO (gap of 1256
cm−1 [13, 32]).
3) For the assigned T1(n, π∗) ← S0 origin bands, the isotope shift associated with 2, 6, 6-d3
substitution of 2CHO is −6.8 cm−1. This shift is in the same direction and nearly the same
magnitude as the shift of −6.0 cm−1 observed [20] for the S1(n, π∗) ← S0 transition of 2CHO.
7
4) In the wavenumber region below each assigned origin, the CRD spectra of 2CHO and
2CHO-d3 contain weak but well resolved features assignable to the 3901 and 3902 transitions
(see Tables I and II and Fig. 3). These assignments are based on combination differences with
the presumed 000 band in each spectrum, compared with ground-state ν39 spacings obtained
from near-infrared [16] and Raman [15] spectra of 2CHO. In the T1(n, π∗) ← S0 spectrum of
each isotopomer, the 3901 and 3902 band positions, relative to the assigned origin, agree with
the corresponding band positions in the S1(n, π∗) ← S0 spectrum [20] to within 1 cm−1.
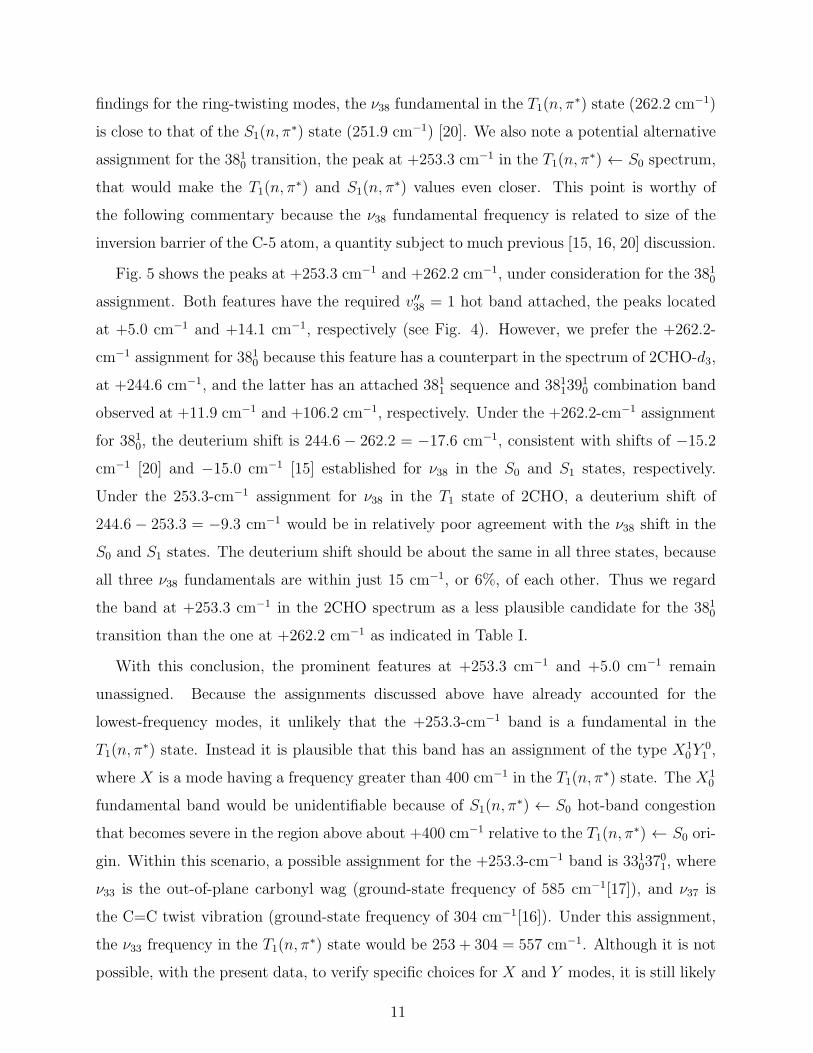
Vibronic analysis
In the spectrum of undeuterated 2CHO (Fig. 4), the pattern of peaks starting at the 000
band and continuing up to about +20 cm−1 with respect to the origin is repeated nearly
identically, beginning with a prominent peak at +99.6 cm−1. An analogous set of repeated
peaks occurs in the 2CHO-d3 spectrum (Fig. 4), beginning with the feature at +94.5 cm−1.
These observations suggest that the peak at the start of the repetition in each case is a
vibronic origin, specifically the 3910 transition involving the lowest-frequency mode. Further
support for the 000 and 3910 assignments comes from the observation of bands at +198.0
cm−1 and 188.1 cm−1 in the 2CHO and 2CHO-d3 spectra, respectively (Fig. 5). These bands
can be assigned to the 3920 transition in each spectrum, implying anharmonic shifts of −1.2
cm−1 (2CHO) and −0.9 cm−1 (2CHO-d3) for the v′39 = 2− 1 gap compared to v′39 = 1− 0.
Shifts of this magnitude are similar to those ascertained for the S0 and S1(n, π∗) states from
the S1(n, π∗) ← S0 spectrum [20].
Given the prominent role of ν39 in contributing to the spectral patterns, a detailed descrip-
tion of this mode is desirable and has motivated portions of the computational investigation
discussed later. In brief, we have determined that ν39 corresponds to a ring twisting mo-
tion roughly analogous to the C=C–C=O torsion mode in acrolein, the lowest-frequency
vibration in that molecule. From assignments in the present T1(n, π∗) ← S0 spectrum of
2CHO, we may compare the ν39 fundamental frequency in the T1(n, π∗) state (99.6 cm−1 /
94.5 cm−1 for the parent/deuterated species) with that in the S0 and S1(n, π∗) states. The
T1(n, π∗) and S0 values are nearly the same, given the ground-state fundamental of 98.6
cm−1 / 93.7 cm−1, inferred here from 3901 assignments. The present analysis also indicates
that the ν39 fundamental for T1(n, π∗) is significantly lower than that in the S1(n, π
∗) state,
8
122.1 cm−1 / 114.4 cm−1 [20].
Presuming the T1(n, π∗) state is structurally more similar to S1(n, π
∗) than to S0, the
comparisons above raise doubt about the band assigned to 3910 in the T1(n, π∗) ← S0 spec-
trum. An alternative is to assign this band as 000, with the band currently identified as the
origin reassigned to 3901. However, several factors argue against this interpretation and sup-
port the original assignments shown in Tables I and II. First, the 000 band under the original
assignment has about the same intensity as the 3910 band, whereas the former would likely
be less intense if it were subject to a reduced Boltzmann factor associated with the 3901 hot
band. Second, we observe satellites, with wavenumber shifts close to +99.6 cm−1 (2CHO)
or 94.5 (2CHO-d3), attached to many assigned vibronic bands in the two spectra. The
satellites may be assigned as combination bands involving the 3910 transition (see Tables I
and II). Third, we observe no progression with intervals close to 120 cm−1 (2CHO) or 115
cm−1 (2CHO-d3) in the spectra, whereas such progressions would be expected if the ν ′39
potentials were very similar in the T1(n, π∗) and S1(n, π
∗) states.
Moreover, the intensity patterns we observe in the T1(n, π∗) ← S0 spectra are consistent
with a ν ′39 potential that is not signficantly different from that of the ground state: the
features we assign to 3920 are much weaker than the 3910 bands (see Figs. 4 and 5), and no
further members of a ν ′39 progression are detected in the present CRD spectra; this is in
contrast to the long progression (extending to v′39 = 6) observed in the S1(n, π∗) ← S0 spec-
trum of 2CHO [20]. Thus the Franck-Condon factors for v′39 > 1 appear to be much larger
for S1(n, π∗) compared to T1(n, π
∗) excitation, consistent with differing ν ′39 fundamental
frequencies.
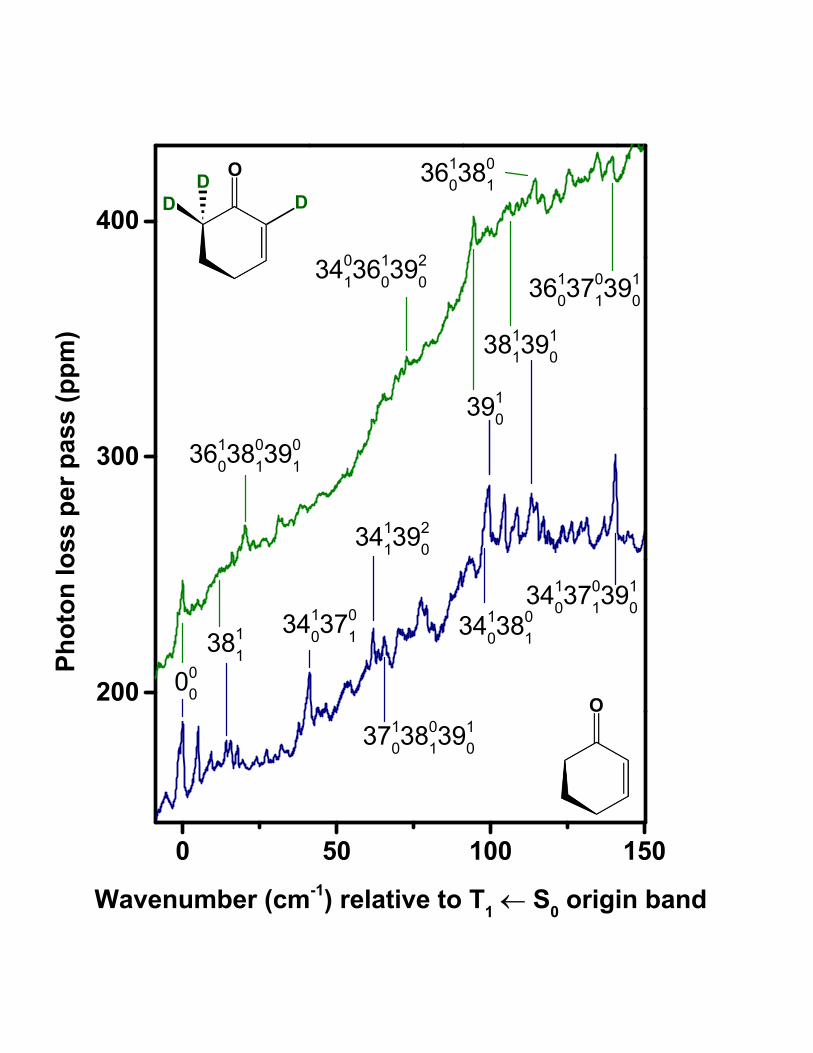
We have characterized other ring vibrations besides ν39 in the T1(n, π∗) state of 2CHO.
The wavenumber region above +200 cm−1 in the T1(n, π∗) ← S0 spectrum, shown in Fig.
5, is expected to contain the 3810 and 3710 bands, given ν38 and ν37 fundamentals of 252
cm−1 and 303 cm−1, respectively [20], for the S1(n, π∗) state of the undeuterated species.
Our computational results indicate that ν38 is a ring-bending mode; a detailed description
is presented in a later section. Prior spectroscopic investigations, as well as our present
computational results, reflect agreement that ν37 corresponds to a ring vibration with a
substantial contribution from C=C twisting.
The region of the T1(n, π∗) ← S0 spectrum containing the ν ′
37 and ν ′38 fundamen-
tals shows moderate vibronic congestion, due partly to hot bands associated with the
9
S1(n, π∗) ← S0 system. These bands correspond to spin-allowed transitions, but their
intensities in this region are dramatically attenuated, to levels on par with those of
T1(n, π∗) ← S0 bands, because of Boltzmann factors corresponding to ground-state vi-
brational excitation of over 1000 cm−1. It is straightforward to differentiate these bands
from the T1(n, π∗) ← S0 vibronic structure because the singlet-triplet bands have much
narrower and sharper rotational contours [33] than do the singlet-singlet vibronic features.
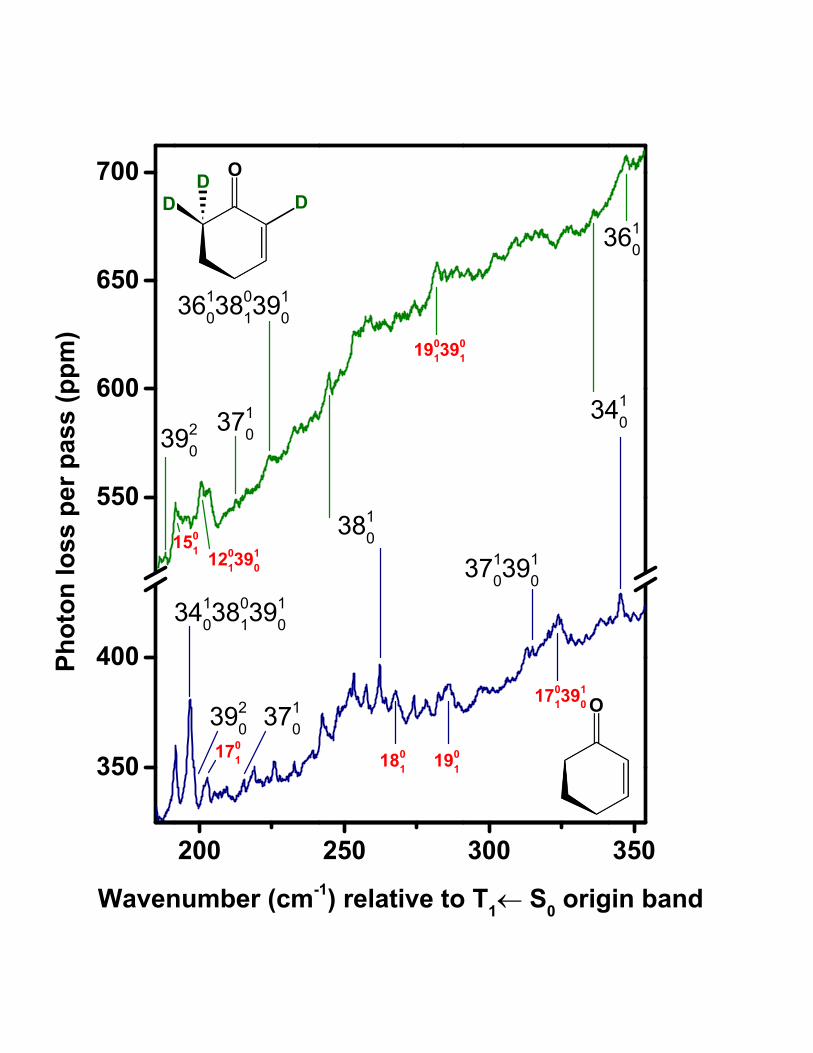
Examples of both kinds of bands are pointed out in Fig. 5 for 2CHO and 2CHO-d3.
The exclusion (and assignment) of these interfering singlet bands left several peaks in
the 200–300 cm−1 region of the 2CHO spectrum that could be assigned to the 3810 and 3710
bands of the T1(n, π∗) ← S0 system. To narrow the choices further, we only considered
peaks having counterparts at lower wavenumber that could be assigned to the 3811 and 3711
sequences. This process led us to assign the intense peak at +262.1 cm−1 to 3810 and a
weaker feature at +215.5 cm−1 to 3710.
Table I lists these assignments along with the hot bands identified as the 3811 and 3711
sequence transitions. Combination differences between these observed sequence bands and
the assigned 3810 and 3710 bands correctly predict the ground-state fundamental frequencies
(248 cm−1 [15] and 304.1 cm−1 [16], respectively) for the two modes. As seen in Table I,
both the 3810 vibronic origin and the 3811 sequence also occur in combination with other
vibronic origins and hot bands. Moreover, for nearly every band involving ν ′38 or ν ′
37 in the
2CHO spectrum, we have made a corresponding observation in the T1(n, π∗) ← S0 spectrum
of 2CHO-d3 (see Table II). Isotope shifts for 3810 and 3710 are similar in magnitude to those
seen in the S1(n, π∗) ← S0 spectra [20].
According to our assignment of the 2CHO spectrum, the ν37 fundamental in the
T1(n, π∗) state (215.5 cm−1) differs significantly from its S1(n, π
∗) value (303.3 cm−1) [20].
As discussed above, the same appears to be true for ν39, a ring-twisting mode similar to ν37.
Both of these vibrations involve torsional motion within the conjugated O=C–C=C moiety
or immediately adjacent carbon atoms. Differences in the T1(n, π∗) vs. S1(n, π
∗) frequencies
for these modes suggest that the chromophore delocalization is qualitatively different in the
T1(n, π∗) state compared to the S1(n, π
∗) state. Later we present a more detailed discussion
of these observations in the context of our computed results.
Unlike the ν37 and ν39 ring-twisting vibrations, the ν38 mode corresponds to bending of
the ring and less directly involves the atoms of the chromophore. And in contrast to our
10
findings for the ring-twisting modes, the ν38 fundamental in the T1(n, π∗) state (262.2 cm−1)
is close to that of the S1(n, π∗) state (251.9 cm−1) [20]. We also note a potential alternative
assignment for the 3810 transition, the peak at +253.3 cm−1 in the T1(n, π∗) ← S0 spectrum,
that would make the T1(n, π∗) and S1(n, π
∗) values even closer. This point is worthy of
the following commentary because the ν38 fundamental frequency is related to size of the
inversion barrier of the C-5 atom, a quantity subject to much previous [15, 16, 20] discussion.
Fig. 5 shows the peaks at +253.3 cm−1 and +262.2 cm−1, under consideration for the 3810
assignment. Both features have the required v′′38 = 1 hot band attached, the peaks located
at +5.0 cm−1 and +14.1 cm−1, respectively (see Fig. 4). However, we prefer the +262.2-
cm−1 assignment for 3810 because this feature has a counterpart in the spectrum of 2CHO-d3,
at +244.6 cm−1, and the latter has an attached 3811 sequence and 38113910 combination band
observed at +11.9 cm−1 and +106.2 cm−1, respectively. Under the +262.2-cm−1 assignment
for 3810, the deuterium shift is 244.6 − 262.2 = −17.6 cm−1, consistent with shifts of −15.2
cm−1 [20] and −15.0 cm−1 [15] established for ν38 in the S0 and S1 states, respectively.
Under the 253.3-cm−1 assignment for ν38 in the T1 state of 2CHO, a deuterium shift of
244.6 − 253.3 = −9.3 cm−1 would be in relatively poor agreement with the ν38 shift in the
S0 and S1 states. The deuterium shift should be about the same in all three states, because
all three ν38 fundamentals are within just 15 cm−1, or 6%, of each other. Thus we regard
the band at +253.3 cm−1 in the 2CHO spectrum as a less plausible candidate for the 3810
transition than the one at +262.2 cm−1 as indicated in Table I.
With this conclusion, the prominent features at +253.3 cm−1 and +5.0 cm−1 remain
unassigned. Because the assignments discussed above have already accounted for the
lowest-frequency modes, it unlikely that the +253.3-cm−1 band is a fundamental in the
T1(n, π∗) state. Instead it is plausible that this band has an assignment of the type X1
0Y01 ,
where X is a mode having a frequency greater than 400 cm−1 in the T1(n, π∗) state. The X1
0
fundamental band would be unidentifiable because of S1(n, π∗) ← S0 hot-band congestion
that becomes severe in the region above about +400 cm−1 relative to the T1(n, π∗) ← S0 ori-
gin. Within this scenario, a possible assignment for the +253.3-cm−1 band is 33103701, where
ν33 is the out-of-plane carbonyl wag (ground-state frequency of 585 cm−1[17]), and ν37 is
the C=C twist vibration (ground-state frequency of 304 cm−1[16]). Under this assignment,
the ν33 frequency in the T1(n, π∗) state would be 253 + 304 = 557 cm−1. Although it is not
possible, with the present data, to verify specific choices for X and Y modes, it is still likely
11
that the feature at +5.0 cm−1 involves the X10Y
01 transition (+253.3cm−1) in combination
with 3801. This is based on the known ν33 ground-state frequency of 248 cm−1 [15], along our
observation of other relatively intense combination bands in the T1(n, π∗) ← S0 spectrum
involving the 3801 transition.
The final component of the vibronic analysis involves an isolated band at +345.4 cm−1 in
the T1(n, π∗) ← S0 spectrum of 2CHO (Fig. 5), which we assign to the 3410 transition. The
ν34 vibrational mode in 2CHO corresponds to wagging of the C=O group within the plane
established by the C–6, C–1, and C–2 atoms. In the ground state of 2CHO, this mode has
a fundamental frequency of 485 cm−1 [17], and this drops significantly, to 343.9 cm−1 [17],
upon excitation to the S1(n, π∗) state [34].
Because the carbonyl moiety involved in the ν34 vibration is part of the chromophore for
S1(n, π∗) ← S0 or T1(n, π
∗) ← S0 excitation, the large change in fundamental frequency is to
be expected, along with a potentially long Franck-Condon progression involving this mode.
In the T1(n, π∗) ← S0 spectrum, observation of other members of the progression, beyond
3410, would secure the initial assignment; however all the T1(n, π∗) ← S0 vibronic bands
above about +400 cm−1 are obscured by broad and relatively intense S1(n, π∗) ← S0 hot
bands. These bands grow more intense closer to the S1(n, π∗) ← S0 origin. Therefore the
3420 transition within the T1(n, π∗) ← S0 system, predicted near +690 cm−1, or about −830
cm−1 with respect to the singlet origin, remains unobserved.
Although such higher-energy bands are inaccessible in this work, we do observe numerous
well-defined peaks at lower wavenumber that show predictable combination differences with
the feature assigned as 3410. Two prominent examples are the bands at 41.2 cm−1 and at
97.6 cm−1; as shown in Table I and Fig. 4, these are assigned as combinations of 3410 with
3701 and 3801, respectively. Also, we observe the 3411 transition as a weak but sharp and
isolated band at −136.4 cm−1, shown in Fig. 3. This is close [35] to a predicted value
of 345.4 − 485 = −140 cm−1, which is based on the ν38 ground-state fundamental of 485
cm−1 [17] obtained from the vapor-phase near-infrared and Raman spectra. The assigned
3411 band also has a relatively intense satellite observed at −136.4 + 99.2 = −37.2 cm−1,
which can be assigned as 34113910, and another at −136.4 + 198.3 = +61.9 cm−1, assigned as
34113920. These bands are shown in Figs. 3 and 4, respectively.
To summarize this discussion of ν34, the in-plane carbonyl wagging vibration of 2CHO,
we assign the peak at +345.4 cm−1 in the T1(n, π∗) ← S0 spectrum to the 3410 transition. We
12
base this assignment on the anticipated sizeable drop in ν34 fundamental frequency compared
to the S0 ground state, along with the extensive Franck-Condon activity evidenced by the
numerous assigned combination hot bands that involve 3410.
Importantly, we also observe an analogous, relatively intense peak at +347.0 cm−1 in the
T1(n, π∗) ← S0 spectrum of 2CHO-d3 (see Fig. 5). Associated with this transition is the
same pattern of combination hot bands as observed for the +345.4-cm−1 peak in the 2CHO-
d0 spectrum. However, is unlikely that the 2CHO-d3 peak at +347.0 cm−1 has the same
3410 (in-plane carbonyl wag) assignment as in the spectrum of parent molecule, because the
deuterium shift would be positive in that case, which is physically unrealistic. A plausible
assignment for the +347.0-cm−1 transition is 3610, the fundamental band for a ring-bending
vibration that has a frequency of 394 cm−1 in the ground state of 2CHO-d3 [17]. The
ν36 vibration is similar to the ν38 ring-inversion mode, but calculation of the atomic force
vectors for ν36 [36] shows that it also has a significant contribution from in-plane carbonyl
wagging, nearly as much as in ν34. This helps to rationalize our assignment of the hot band
observed at −115.0 cm−1 (see Fig. 3) to the 34013610 combination band. This transition is
expected to have a relatively large Franck-Condon factor because of the significant carbonyl
wagging content of ν36. Under a 34013610 assignment, the 3610− 340136
10 combination difference
of +347.0 − (−115.0) = 462 cm−1 correctly predicts the ν34 ground-state frequency, which
has a value of 464 cm−1 as measured in the infrared spectrum of the liquid [17].
Though the assigned 3610 band is the dominant feature in its region of the 2CHO-d3
T1(n, π∗) ← S0 spectrum, we also observe the 3410 transition (in-plane carbonyl wag funda-
mental). It is assigned as the weaker but isolated peak at +335.9 cm−1. Its isotope shift with
respect to the 3410 transition of the parent molecule is within a few cm−1 of that observed
for the S1(n, π∗) state.
Computational results
Table III lists computed T1(n, π∗) and S1(n, π
∗) harmonic frequencies for the modes we
assigned in the present T1(n, π∗) ← S0 CRD spectrum. Calculated frequencies for all 39
vibrational modes in the T1(n, π∗) and S1(n, π
∗) states, along with equilibrium geometries,
are available as supplementary material [37]. Table IV lists computed inversion barriers for
the two excited states.
13
DISCUSSION
Mode descriptions for low-frequency ring vibrations
A primary finding of this work is that the lowest vibrational mode, ν39, has nearly the
same fundamental frequency in the T1(n, π∗) excited state of 2CHO as in the S0 state. By
contrast, the ν39 frequency increases by more than 20% upon excitation from the S0 state
to S1(n, π∗).
In previous literature on 2CHO [15–17, 19, 20], ν39 has most often [16, 17, 19, 20] been
understood as a ring-inversion motion that interconverts the two equivalent half-chair con-
formations of the molecule. Viewed schematically, such motion is governed by a double-well
potential with a barrier at a Cs geometry in which all heavy atoms are coplanar. At low
levels of vibrational excitation, the ring-inversion mode in 2CHO is essentially the motion
of C–5 toward and away from the plane containing the other heavy atoms [20]. The barrier
exists at a Cs geometry because of angle strain in a planar six-membered ring, along with
torsional strain engendered by the eclipsed methylene hydrogens.
Under the prevailing assumption that ν39 corresponds to ring inversion, the increase in
its fundamental frequency from 99 cm−1 in the S0 state [16, 17] to 122 cm−1 in S1(n, π∗) [20]
suggests that the inner walls of the double-well potential become steeper upon excitation,
indicative of a higher barrier in the S1(n, π∗) state than the ground state. This could be
attributed to hyperconjugation, which would extend the effects of the excitation to atoms
beyond the nominal O=C—C=C chromophore; details of this argument are presented in the
next section. However, this line of reasoning raises the question of why the ν39 fundamental
does not increase upon T1(n, π∗) ← S0 excitation, considering that both S1 and T1 excita-
tions involve the same nominal change in electron configuration and only differ by a spin
flip.
This question motivated the computational investigations reported herein. Our objectives
were to: 1) use the present spectroscopic results on the T1(n, π∗) state to assess the accuracy
of harmonic frequency calculations from several different methods; and 2) examine the details
of the most reliable calculations, considering equilibrium geometries, force constants, and
reduced masses, to understand the origin of differences between T1(n, π∗) vs. S1(n, π
∗) ring
frequencies (particularly ν39) and to explain how these differences bear on the inversion
14
potentials.
Table III shows that, among the computational methods considered here, the EOM–
EE–CCSD technique affords the best overall agreement between calculated ring har-
monic frequencies (ν39, ν38, and ν37) and spectroscopically observed fundamentals for the
T1(n, π∗) state. Later we discuss possible reasons for the superior performance of the
EOM-EE-CCSD in this application.
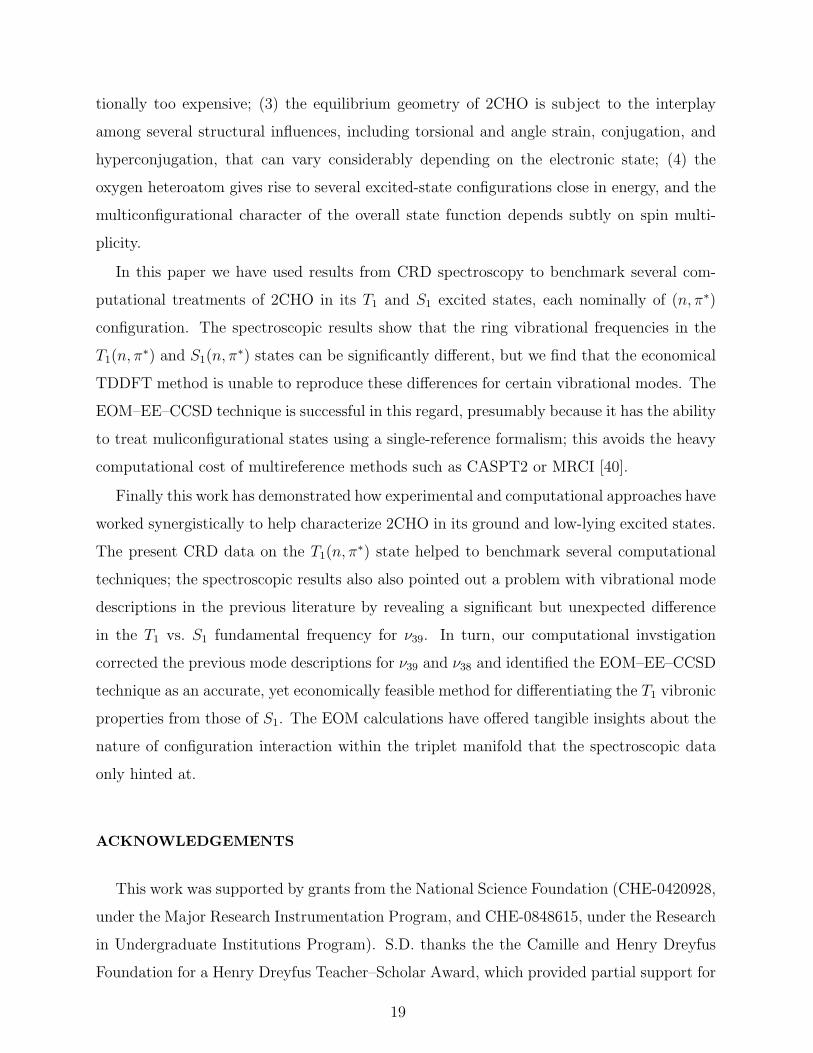
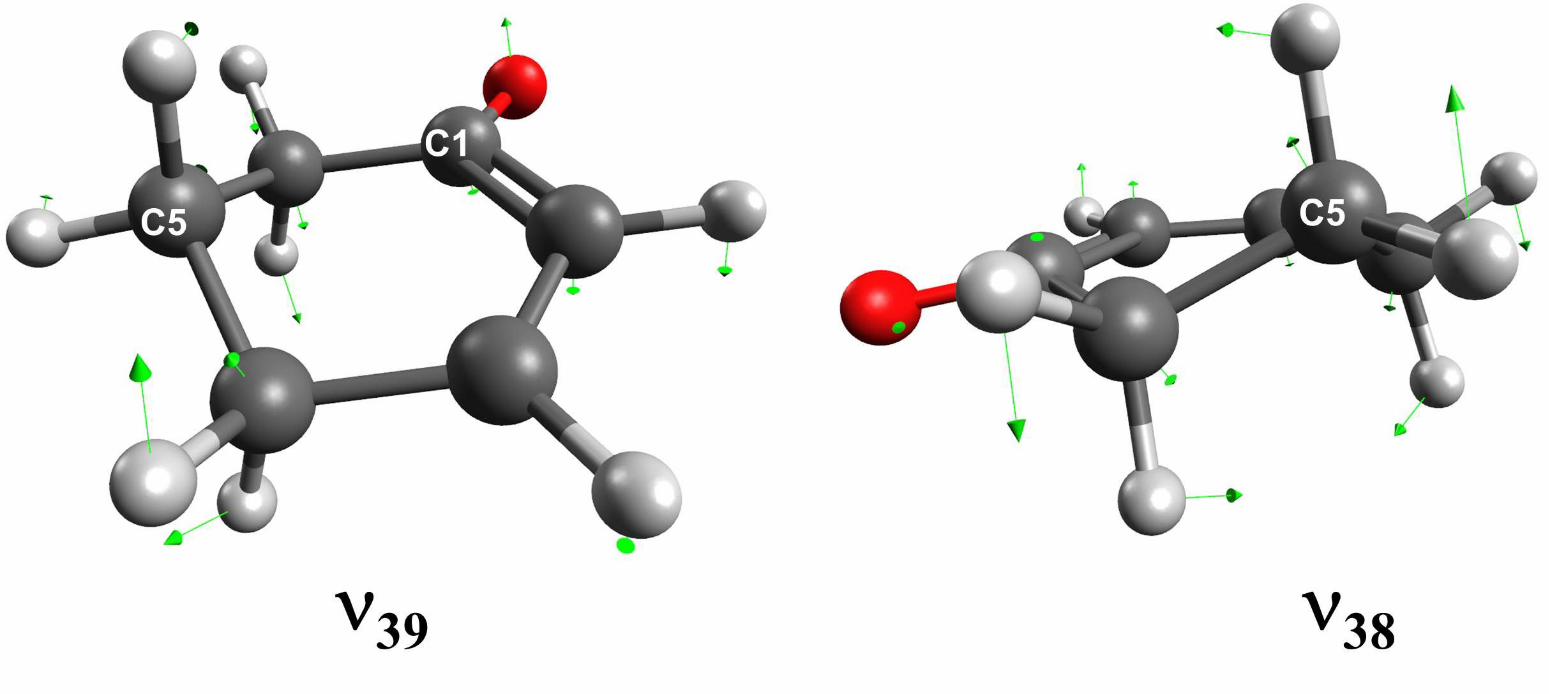
One aspect of the EOM–EE–CCSD calculations, depicted in Fig. 6, provides unantici-
pated information about ν39 and helps to explain how its observed fundamental frequency
could differ in the T1(n, π∗) vs. S1(n, π
∗) states. The figure shows sets of atomic force
vectors for ν39 and ν38, obtained from the EOM–EE–CCSD normal-modes analysis of the
T1(n, π∗) state. The vectors indicate that ν39 does not involve ring inversion, as originally
supposed, but instead is a twisting motion in which C–4 and C–6 move out of phase. The
distance of C–5 to the plane containing the other heavy atoms does not change appreciably
in ν39. By contrast, the ν38 vibration does involve movement of the C–5 atom toward and
away from the plane of heavy atoms, as seen in Fig. 6. The atomic force vectors for ν38
show unambiguously that this mode, rather than ν39, corresponds to ring inversion at large
amplitude [38].
To investigate the generality of these findings, we have also calculated the normal modes
for the S1(n, π∗) state using EOM–EE–CCSD. The resulting harmonic frequencies, listed in
Table III, agree very well with spectroscopically determined fundamentals, indicating that
the accuracy of the S1(n, π∗) calculation is on par with that of the T1(n, π
∗) state. We find
that the atomic force vectors calculated for ν39 and ν38 of S1 are nearly identical to their
counterparts in T1.
Considering our identification of ν38 as ring inversion, and given the closeness of ν38 fun-
damentals determined from the T1(n, π∗) ← S0 and S1(n, π
∗) ← S0 CRD spectra (see Table
III), we conclude that the inversion potentials for the T1 and S1 states are similar. This
corrects our initial impression, based on observed ν39 fundamentals, that the T1(n, π∗) in-
version potential is very similar to that of the ground state and that the T1(n, π∗) barrier is
significantly lower than that of S1(n, π∗).
By the same token, in recognizing ν39 as a ring-twisting motion that more directly involves
the chromophore than does inversion, we can rationalize the relatively large percentage
difference between the ν39 fundamentals in T1 vs. S1. Fig. 6 shows that ν39 involves O=C–
15
C=C torsion, and therefore subtle differences in T1 vs. S1 electron density at the C(1)—
C(2) bond could affect the shape of the ν39 potential. The EOM–EE–CCSD normal-modes
analysis bears this out; the calculated ν39 force constant is 0.019 mdyn/A for T1 and 0.024
mdyn/A for S1. Moreover, the atomic force vectors in Fig. 6 imply that the ν39 reduced mass
depends sensitively on the equilibrium geometry at the carbonyl moiety, and in particular
on the O=C–C=C dihedral angle. According to the EOM–EE-CCSD/cc-pVDZ calculation
of the T1 state, the dihedral angle (170.4◦) deviates considerably from coplanarity, compared
to an essentially planar value (177.1◦) in S1; the calculated reduced masses for ν39 are 3.16
amu and 2.74 amu, respectively. (By contrast, the ν38 reduced mass is not significantly
affected by the carbonyl geometry, as this mode mainly involves motion of C–5 rather than
the oxygen atom.) Thus for ν39, the calculated magnitudes of both reduced mass and force
constant in the T1(n, π∗) state make its harmonic frequency lower than in the S1(n, π
∗) state,
which is consistent with spectroscopic observation. In these ways the fundamental frequency
of ν39 could be very sensitive to the spin flip from S1(n, π∗) to T1(n, π
∗).
Computed inversion barriers
Table IV shows the results of DFT-based calculations of the barriers to ring inversion
in the S0, S1(n, π∗), and T1(n, π
∗) states. We are using DFT results for comparing the
inversion barriers because a DFT-calculated barrier for S0 is available from previous work
[20], and the ν38 harmonic frequency calculated by DFT [17] is in very good agreement with
the fundamental frequency obtained from the Raman spectrum [15]. We expect TDDFT
to provide accurate inversion barriers for the excited states because of similarly favorable
comparisons between calculated ν38 frequencies and those observed specroscopically in this
and previous [20] work.
As seen in Table IV, the calculated barriers for the two (n, π∗) excited states are nearly the
same and slightly greater than that of the ground state. This finding can be rationalized by
considering hyperconjugation occurring in an (n, π∗) excited state of 2CHO. The interaction
involves overlap of the half-filled nonbonding oxygen orbital with a C—H σ orbtital at the
C–6 atom. The hyperconjugation lowers the energy of the filled σ orbital but requires
an equatorially disposed C—H bond for optimal orbital overlap; therefore it preferentially
stabilizes the half-chair equilibrium conformation over the Cs structure, in effect raising the
16
barrier to inversion. The hyperconjugation cannot confer its stabilizing effect in the ground
state because the nonbonding oxygen orbital is filled. These arguments predict a greater
inversion barrier in the (n, π∗) excited states state than in the ground state, consistent with
the observed increase in ν38 fundamental frequencies upon n→ π∗ excitation.
These frequency increases are relatively small, just a few percent, and are commensurate
with an effect as subtle as hyperconjugation. This interpretation of the spectroscopic results
corrects an earlier analysis [20] of the S1(n, π∗) ← S0 vibronic data, in which an inversion
barrier was erroneously fit to observed energy levels for ν ′39 rather than the inversion mode,
ν ′38. That analysis resulted in an S1(n, π
∗) barrier much higher than that of the ground state
(on the order of 1000 cm−1 too high), which reflects the large percentage increase in the ν39
fundamental frequency upon S1(n, π∗) ← S0 excitation.
Complementarity of experimental and computational findings
The present spectroscopic results on the T1(n, π∗) state, along with those obtained pre-
viously for S1(n, π∗) [20], provide benchmarks for evaluating several excited-state compu-
tational techniques. As noted above and seen in Table III, harmonic frequencies predicted
by the EOM–EE–CCSD method for T1(n, π∗) show better overall agreement with observed
fundamentals than do the TDDFT or UDFT calculations, particularly with respect to the
ring-twisting modes ν39 and ν37. The superior performance of EOM–EE–CCSD is not un-
expected, in light of its computational expense in comparison to the other two methods.
Nonetheless, the TDDFT calculation of S1(n, π∗) harmonic frequencies is about as accu-
rate as the EOM–EE–CCSD calculation. Also the TDDFT description of the ring inversion
motion appears to be correct for both T1(n, π∗) and S1(n, π
∗) states, given the close agree-
ment (10 cm−1, or 4%) between computed and experimental ν38 frequencies in each case.
These observations suggest that the TDDFT technique can adequately treat the general
rearrangement of electron density following n→ π∗ excitation, but that the T1(n, π∗) state
of 2CHO possesses some kind of pathology, manifested in the ring-twisting modes, that is
beyond the scope of TDDFT to address.
One possibility is that configuration interaction causes the lowest 3(n, π∗) state in 2CHO
to be substantially admixed with a state in the triplet manifold having a different configura-
tion. The EOM–EE–CCSD method is capable of treating such multiconfigurational states,
17
so in principle the EOM–EE–CCSD technique could (more accurately than TDDFT) predict
vibrational frequencies for modes affected by the configuration mixing.
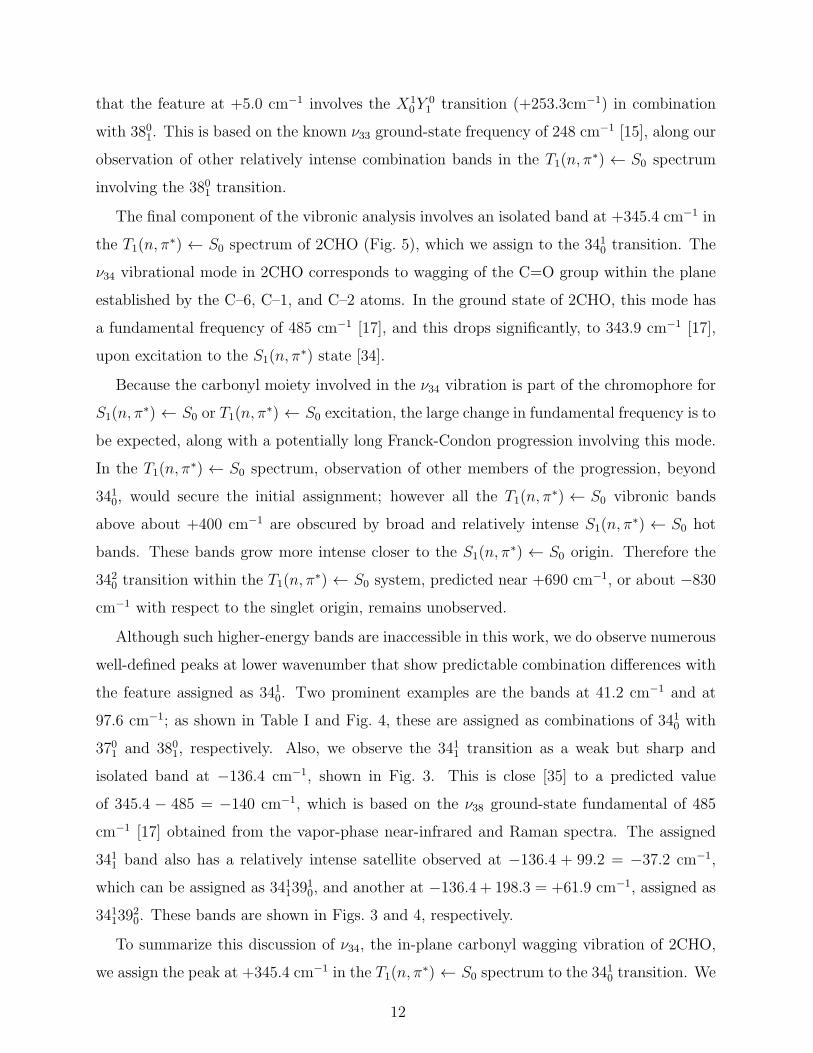
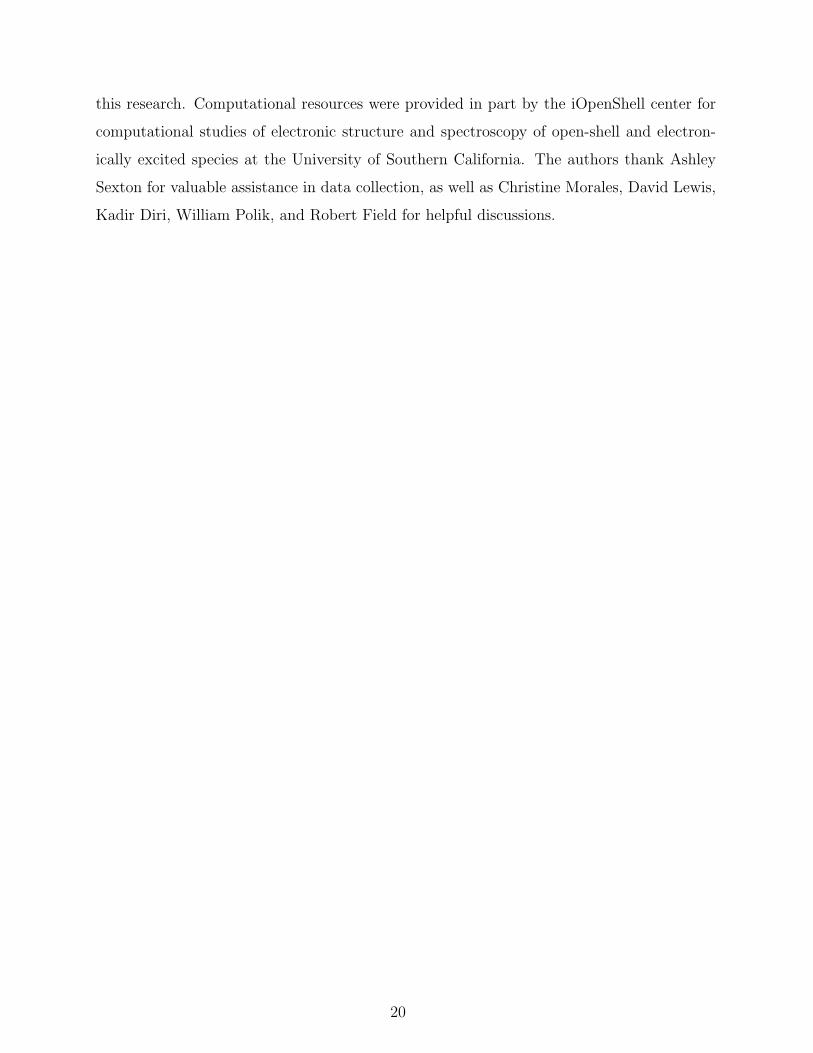
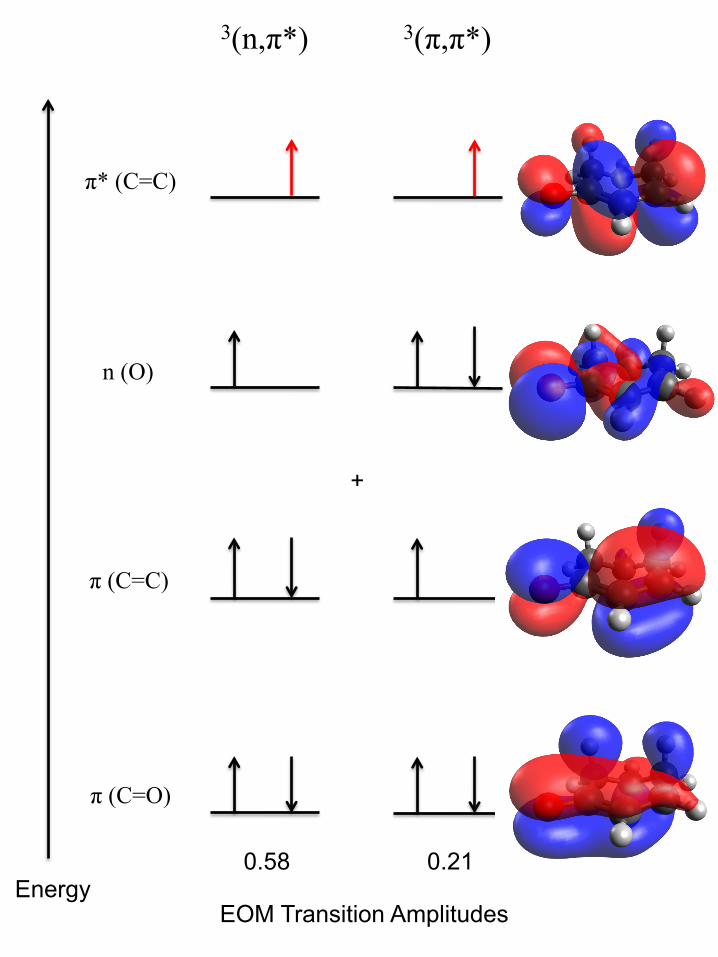
We investigated this premise by examining EOM transition amplitudes for T1 ← S0 ex-
citation. As indicated in Fig. 7, the 3(n, π∗) configuration makes the leading contribution to
the T1 state, but π → π∗ excitation has significant transition amplitude as well, so that the
character of the T1 eigenstate reflects both 3(n, π∗) and 3(π, π∗) orbital occupancies. The
transition amplitudes for the S1 state do not indicate a similar extent of contamination from
configurations other than 1(n, π∗).
A (π, π∗) contribution to the T1 wavefunction can help to explain the dramatic lowering
of the ν37 fundamental frequency upon T1 ← S0 excitation, observed spectroscopically and
predicted by the EOM–EE–CCSD T1 calculation (Table III). As shown in Fig. 7, the π → π∗
electron promotion decreases the C(2)=C(3) electron density because the π∗ antibonding
orbital has a node at this location, but also because the vacated π bonding orbital has a
buildup of electron density at the same place. These changes drop the nominal C(2)=C(3)
bond order from 2 to 1 and could thereby contribute to the significant decrease in ν37 (C=C
twist) fundamental frequency.
By contrast, the S1(n, π∗) state lacks (π, π∗) contamination, according to the EOM–EE–
CCSD calculation. The n→ π∗ promotion reduces the C(2)=C(3) bond order due to occu-
pancy of π∗, but the effect is not enhanced, as in the case of T1 ← S0 excitation, by vacancy
of the π bonding orbital. Prior CRD studies [20] show that the ν37 fundamental frequency
is essentially unchanged upon S1(n, π∗) ← S0 excitation. Though this is surprising given
the n → π∗ promotion, the contrast between the S1 and T1 frequencies (303 cm−1 and 216
cm−1, respectively) certainly underscores the potential influence of the (π, π∗) configuration
on the T1(n, π∗) state.
CONCLUSIONS
The 2CHO molecule has several characteristics that make it ideal for testing excited-state
computational methods: (1) 2CHO serves as a prototype for understanding and predicting
the photochemistry of conjugated enones; (2) it is important to determine the level of ac-
curacy of “black-box” methods such as TDDFT for treating molecules the size of 2CHO,
because more specialized highly correlated methods (such as CASPT2 [39]) are computa-
18
tionally too expensive; (3) the equilibrium geometry of 2CHO is subject to the interplay
among several structural influences, including torsional and angle strain, conjugation, and
hyperconjugation, that can vary considerably depending on the electronic state; (4) the
oxygen heteroatom gives rise to several excited-state configurations close in energy, and the
multiconfigurational character of the overall state function depends subtly on spin multi-
plicity.
In this paper we have used results from CRD spectroscopy to benchmark several com-
putational treatments of 2CHO in its T1 and S1 excited states, each nominally of (n, π∗)
configuration. The spectroscopic results show that the ring vibrational frequencies in the
T1(n, π∗) and S1(n, π
∗) states can be significantly different, but we find that the economical
TDDFT method is unable to reproduce these differences for certain vibrational modes. The
EOM–EE–CCSD technique is successful in this regard, presumably because it has the ability
to treat muliconfigurational states using a single-reference formalism; this avoids the heavy
computational cost of multireference methods such as CASPT2 or MRCI [40].
Finally this work has demonstrated how experimental and computational approaches have
worked synergistically to help characterize 2CHO in its ground and low-lying excited states.
The present CRD data on the T1(n, π∗) state helped to benchmark several computational
techniques; the spectroscopic results also also pointed out a problem with vibrational mode
descriptions in the previous literature by revealing a significant but unexpected difference
in the T1 vs. S1 fundamental frequency for ν39. In turn, our computational invstigation
corrected the previous mode descriptions for ν39 and ν38 and identified the EOM–EE–CCSD
technique as an accurate, yet economically feasible method for differentiating the T1 vibronic
properties from those of S1. The EOM calculations have offered tangible insights about the
nature of configuration interaction within the triplet manifold that the spectroscopic data
only hinted at.
ACKNOWLEDGEMENTS
This work was supported by grants from the National Science Foundation (CHE-0420928,
under the Major Research Instrumentation Program, and CHE-0848615, under the Research
in Undergraduate Institutions Program). S.D. thanks the the Camille and Henry Dreyfus
Foundation for a Henry Dreyfus Teacher–Scholar Award, which provided partial support for
19
this research. Computational resources were provided in part by the iOpenShell center for
computational studies of electronic structure and spectroscopy of open-shell and electron-
ically excited species at the University of Southern California. The authors thank Ashley
Sexton for valuable assistance in data collection, as well as Christine Morales, David Lewis,
Kadir Diri, William Polik, and Robert Field for helpful discussions.
20
∗ Current address: Department of Chemistry, Northwestern University.
† Current address: Penford Corp.
‡ Current address: Pace Analytical Services, Inc.
§ Current address: Department of Mathematics, Texas A&M University
¶ Current address: Appvion, Inc.
∗∗ Author to whom correspondence should be addressed; email: [email protected]
[1] N. Hoffmann, Chem. Rev. 108, 1052 (2008).
[2] M. Reguero, M. Olivucci, F. Bernardi, and M. A. Robb, J. Am. Chem. Soc. 116, 2103 (1994).
[3] J. L. Broeker, J. E. Eksterowicz, A. J. Belk, and K. N. Houk, J. Am. Chem. Soc. 117, 1847
(1995).
[4] M. Reguero, F. Bernardi, M. Olivucci, and M. A. Robb, J. Org. Chem. 62, 6897 (1997).
[5] S. Wilsey, L. Gonzalez, M. A. Robb, and K. N. Houk, J. Am. Chem. Soc. 122, 5866 (2000).
[6] E. Garcıa-Exposito, M. J. Bearpark, R. M. Ortuno, V. Branchadell, M. A. Robb, and S. J.
Wilsey, J. Org. Chem. 66, 8811 (2001).
[7] E. Garcıa-Exposito, M. J. Bearpark, R. M. Ortuno, M. A. Robb, and V. Branchadell,
J. Org. Chem. 67, 6070 (2002).
[8] E. Garcıa-Exposito, A. Alvarez Larena, V. Branchadell, and R. Ortuno, J. Org. Chem. 69,
1120 (2004).
[9] F. De Proft, S. Fias, C. Van Alsenoy, and P. Geerlings, J. Phys. Chem. A 109, 6335 (2005).
[10] P. Jaque, A. Torro-Labbe, P. Geerlings, and F. De Proft, J. Phys. Chem. 113, 332 (2009).
[11] A. O’Keefe and D. A. G. Deacon, Rev. Sci. Instrum. 59, 2544 (1988).
[12] S. Drucker, J. L. Van Zanten, N. D. Gagnon, E. J. Gilles, and N. R. Pillsbury, J. Molec. Struct.
692, 1 (2004).
[13] N. R. Pillsbury, T. S. Zwier, R. H. Judge, and S. Drucker, J. Phys. Chem. A 111, 8357 (2007).
[14] D. I. Schuster, D. A. Dunn, G. E. Heibel, P. B. Brown, J. M. Rao, J. Woning, and R. Bonneau,
J. Am. Chem. Soc. 113, 6245 (1991).
[15] L. A. Carreira, T. G. Towns, and T. B. Malloy, J. Chem. Phys. 70, 2273 (1979).
[16] T. L. Smithson and H. Wieser, J. Chem. Phys. 73, 2518 (1980).
[17] M. Z. M. Rishard and J. Laane, J. Molec. Struct. 976, 56 (2010).
21
[18] S. A. Manley and J. K. Tyler, Chem. Commun. 1970, 382 (1970).
[19] E. J. Gilles, J. Choo, D. Autrey, M. Rishard, S. Drucker, and J. Laane, Can. J. Chem. 82,
867 (2004).
[20] M. Z. M. Rishard, E. A. Brown, L. K. Ausman, S. Drucker, J. Choo, and J. Laane,
J. Phys. Chem. A 112, 38 (2008).
[21] In the manifold of 2CHO triplet states, the lowest-energy point occurs on a surface having
a nominal 3(π, π∗) configuration. The molecular geometry at this point departs significantly
from that of the ground state, and the Franck-Condon active transitions we observe in the
present spectroscopic investigation do not terminate on this T1(π, π∗) surface, but rather the
lowest surface of 3(n, π∗) configuration. We designate the latter state as T1(n, π∗) to denote
that at the Franck-Condon active geometry near that of the ground state, the 3(n, π∗) surface
is lower than the 3(π, π∗).
[22] A. Krylov, Ann. Rev. Phys. Chem. 59, 433 (2008).
[23] Y. Shao, L. F. Molnar, Y. Jung, J. Kussmann, C. Ochsenfeld, S. T. Brown, A. T. B. Gilbert,
L. V. Slipchenko, S. V. Levchenko, D. P. Oneill, R. A. Distasio, R. C. Lochan, T. Wang,
G. J. O. Beran, N. A. Besley, J. M. Herbert, C. Y. Lin, T. Van Voorhis, S. H. Chien, A. Sodt,
R. P. Steele, V. A. Rassolov, P. E. Maslen, P. P. Korambath, R. D. Adamson, B. Austin,
J. Baker, E. F. C. Byrd, H. Dachsel, R. J. Doerksen, A. Dreuw, B. D. Dunietz, A. D. Dutoi,
T. R. Furlani, S. R. Gwaltney, A. Heyden, S. Hirata, C.-P. Hsu, G. Kedziora, R. Z. Khalliulin,
P. Klunzinger, A. M. Lee, M. S. Lee, W. Liang, I. Lotan, N. Nair, B. Peters, E. I. Proynov, P. A.
Pieniazek, Y. M. Rhee, J. Ritchie, E. Rosta, D. C. Sherrill, A. C. Simmonett, J. E. Subotnik,
L. H. Woodcock, W. Zhang, A. T. Bell, and A. K. Chakraborty, Phys. Chem. Chem. Phys.
8, 3172 (2006).
[24] J. R. Schmidt and W. F. Polik, “WebMO Enterprise version 10.1,” WebMO LLC, Holland
MI (2010).
[25] A. D. Becke, J. Chem. Phys. 98, 1372 (1993).
[26] C. Lee, W. Yang, and R. G. Parr, Phys. Rev. B 37, 785 (1988).
[27] P. J. Stephens, F. J. Devlin, C. F. Chabalowski, and M. J. Frisch, J. Phys. Chem. 98, 11623
(1994).
[28] C. Adamo and V. Barone, J. Chem. Phys. 110, 6158 (1999).
22
[29] E. Baerends, T. Ziegler, J. Autschbach, D. Bashford, A. Brces, F. Bickelhaupt, C. Bo, P. Boer-
rigter, L. Cavallo, D. Chong, L. Deng, R. Dickson, D. Ellis, M. van Faassen, L. Fan, T. Fischer,
C. F. Guerra, M. Franchini, A. Ghysels, A. Giammona, S. van Gisbergen, A. Gtz, J. Groen-
eveld, O. Gritsenko, M. Grning, S. Gusarov, F. Harris, P. van den Hoek, C. Jacob, H. Ja-
cobsen, L. Jensen, J. Kaminski, G. van Kessel, F. Kootstra, A. Kovalenko, M. Krykunov,
E. van Lenthe, D. McCormack, A. Michalak, M. Mitoraj, S. Morton, J. Neugebauer, V. Nicu,
L. Noodleman, V. Osinga, S. Patchkovskii, M. Pavanello, P. Philipsen, D. Post, C. Pye,
W. Ravenek, J. Rodrguez, P. Ros, P. Schipper, G. Schreckenbach, J. Seldenthuis, M. Seth,
J. Snijders, M. Sol, M. Swart, D. Swerhone, G. te Velde, P. Vernooijs, L. Versluis, L. Visscher,
O. Visser, F. Wang, T. Wesolowski, E. van Wezenbeek, G. Wiesenekker, S. Wolff, T. Woo, and
A. Yakovlev, SCM Theoretical Chemistry, Vrije Universiteit, Amsterdam, The Netherlands.
[30] K. W. Paulisse, T. O. Friday, M. L. Graske, and W. F. Polik, J. Chem. Phys. 113, 184 (2000).
[31] N. C. Hlavacek, M. O. McAnally, and S. Drucker, J. Chem. Phys. 138, 064303 (2013).
[32] C. M. Cheatham and J. Laane, J. Chem. Phys. 94, 7734 (1991).
[33] J. Hougen, Can. J. Phys. 42, 433 (1964).
[34] The large change leads to a renumbering that technically makes this vibration mode 36 in the
S1(n, π∗) and T1(n, π
∗) excited states. For simplicity we retain the ground-state numbering
when referring to the excited state in notation such as 3410.
[35] To explain the discrepancy, we note that the band locations reported in the spectroscopic
data sets correspond to band maxima rather than rotationless band origins. Differences in
rotational contour among the various kinds of spectra could affect the prediction of CRD
bands based on Raman or near-infrared data.
[36] In Ref. [17], the ν36 vibration of 2CHO-d3, with a fundamental frequency of 394 cm−1, is
described as in-plane carbonyl wagging. However, the assigned carbonyl wag fundamental for
the 2CHO-d0 parent species is 485 cm−1, implying an unrealistically large deuterium shift for
this mode. The parent species has a ring-bending vibration with an assigned fundamental of
428 cm−1 [17], suggesting that it is the same mode as the 394-cm−1 vibration in the deuterated
molecule. We performed a DFT calculation identical to that reported in Ref. [17], and the
atomic force vectors obtained for ν36 confirm that an appropriate mode description for both
isotopomers is ring bending with a contribution from carbonyl wagging.
23
[37] See the supplementary material at http://dx.doi.org/XX/YY for computed equilibrium ge-
ometries and harmonic frequencies.
[38] The controversy about the mode description of ν39 vs. ν38 arose following the observation of
a B-type band contour for the v38 = 0 − 1 transition in the far-infrared spectrum of 2CHO
[16]. This observation led the authors of the study to reject an earlier assignment [15] of
ν38 as inversion, reasoning that the oxygen atom would have to move perpendicularly to the
molecular plane during inversion; such motion would give rise to an A-type, rather than B-
type, contour in the infrared spectrum. Because ν39 shows an A-type contour in the far-infrared
spectrum, this mode was assigned as inversion [16]. Other research groups (including ours)
adhered to this mode description for ν39 in the course of subsequent investigations [17, 19, 20].
However computational results reported here contradict the prevailing assumptions about the
inversion mode. Fig. 6 shows that the oxygen atom does not move perpendicularly to the
molecular plane during inversion, but instead moves a small amount within the plane and
roughly in the direction of the b inertial axis. This result implies that the inversion fundamental
in the far-infrared spectrum should indeed show a B-type contour and thereby supports the
original assignment [15] of ν38 as inversion. The excellent agreement between computed and
observed ν38 fundamental frequencies for the S0, S1(n, π∗), and T1(n, π
∗) states add confidence
that the computational methods are providing a reliable description for this mode. The same
can be said of ν39. Moreover, the identification of ν39 as a ring-twisting mode, as shown in
Fig. 6, is consistent with the A-type band contour observed for the ν39 fundamental in the
far-infrared spectrum of 2CHO [16].
[39] K. Andersson, P. A. Malmqvist, B. O. Roos, A. J. Sadlej, and K. Wolinski, J. Phys. Chem.
94, 583 (1990).
[40] H. J. Werner and P. J. Knowles, J. Chem. Phys. 89, 5803 (1988).
24
FIGURE CAPTIONS
FIG. 1. 2-cyclohexen-1-one (2CHO) and its trideuterated derivative 2-cyclohexen-1-one-2,6,6-d3
(2CHO-d3).
FIG. 2. Cavity ringdown spectra of 2CHO (lower, black) and 2CHO-d3 (upper, green) vapor
recorded at room temperature. The sample pressure in each case was 1.6 Torr. Each spectrum
is a composite of individual scans recorded over several successive wavelength regions. At each
wavelength in the spectrum, the cavity ringdown rate constant from 10-20 laser pulses was averaged
and then converted to fractional photon loss per pass (left vertical axis). The molar absorptivity
(right vertical axis) was determined from the fractional photon loss via Beer’s Law.
FIG. 3. Expanded view of the low-wavenumber region of the cavity ringdown spectra of 2CHO and
2CHO-d3 shown in Fig. 1. Assignments pertain to the T1(n, π∗) ← S0 absorption band system.
The lowered signal-to-noise ratio in the 2CHO-d3 spectrum is attributable to fractionation resulting
from 6,6-d2 isotopic contamination.
FIG. 4. Expanded view of the central region of the cavity ringdown spectra of 2CHO and 2CHO-d3
shown in Fig. 1. Assignments pertain to the T1(n, π∗) ← S0 absorption band system.
FIG. 5. Expanded view of the high-wavenumber region of the cavity ringdown spectra of 2CHO
and 2CHO-d3 shown in Fig. 1. Assignments in black pertain to the T1(n, π∗) ← S0 absorption
band system; assignments in red are hot bands associated with the S1(n, π∗) ← S0 system.
25
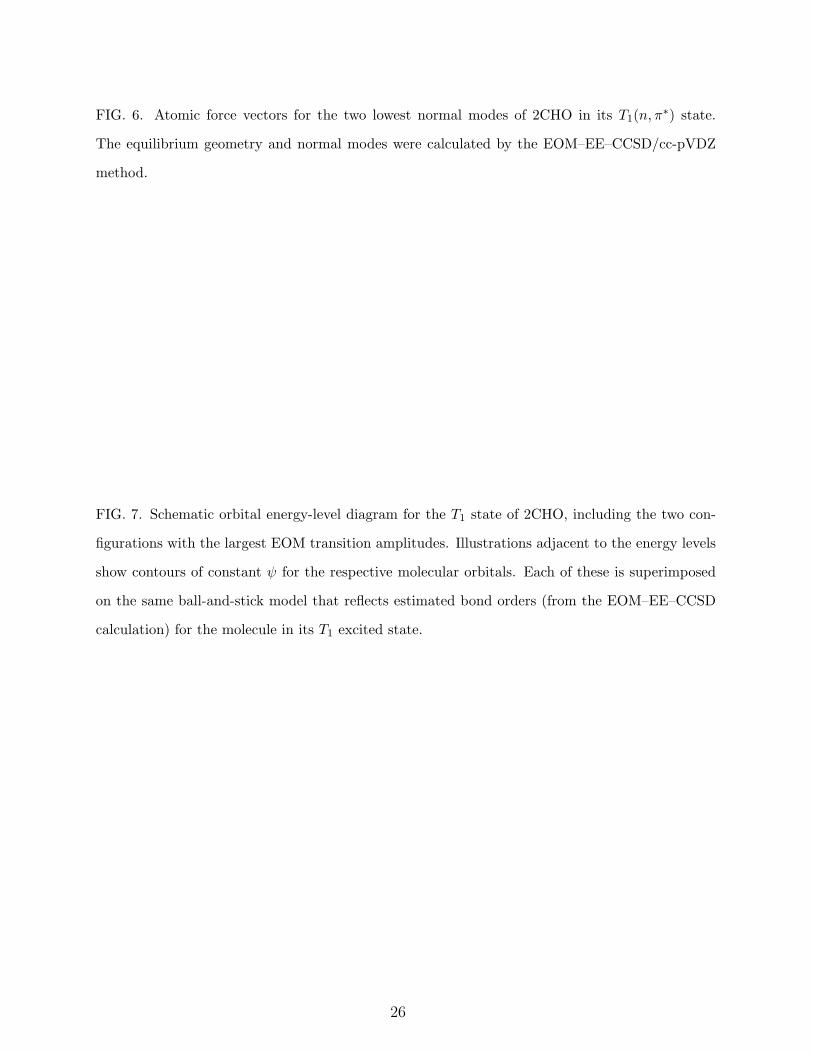
FIG. 6. Atomic force vectors for the two lowest normal modes of 2CHO in its T1(n, π∗) state.
The equilibrium geometry and normal modes were calculated by the EOM–EE–CCSD/cc-pVDZ
method.
FIG. 7. Schematic orbital energy-level diagram for the T1 state of 2CHO, including the two con-
figurations with the largest EOM transition amplitudes. Illustrations adjacent to the energy levels
show contours of constant ψ for the respective molecular orbitals. Each of these is superimposed
on the same ball-and-stick model that reflects estimated bond orders (from the EOM–EE–CCSD
calculation) for the molecule in its T1 excited state.
26
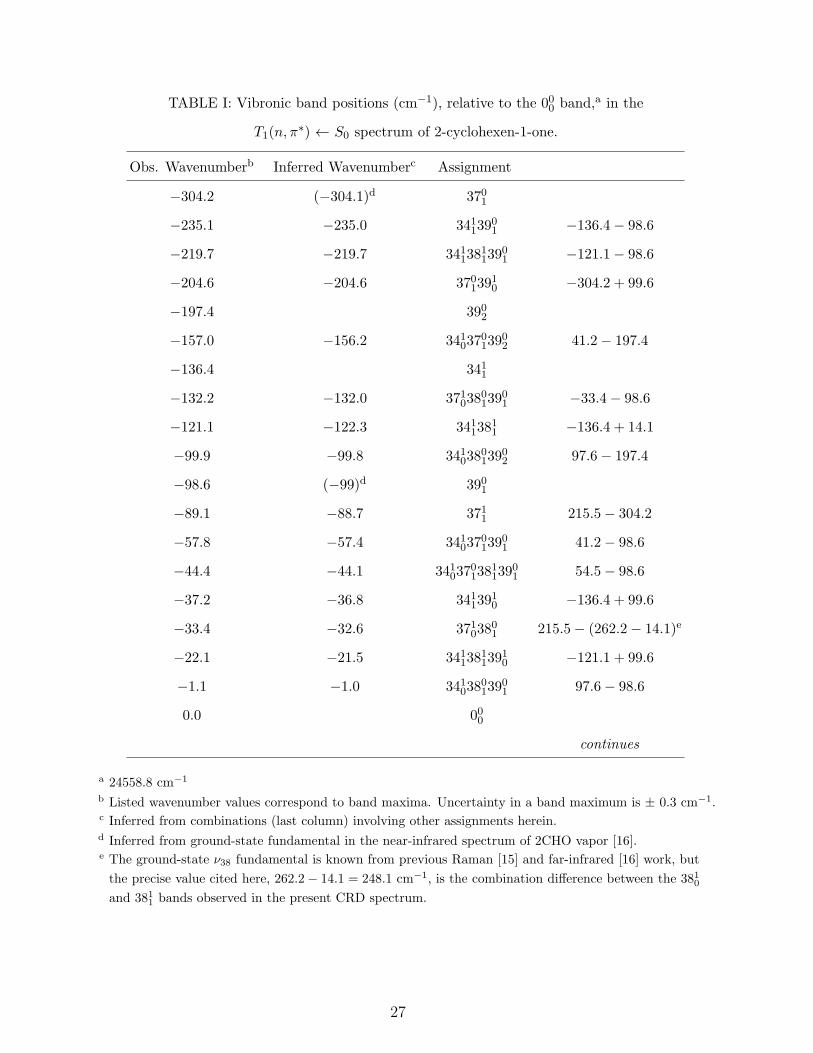
TABLE I: Vibronic band positions (cm−1), relative to the 000 band,a in the
T1(n, π∗) ← S0 spectrum of 2-cyclohexen-1-one.
Obs. Wavenumberb Inferred Wavenumberc Assignment
−304.2 (−304.1)d 3701
−235.1 −235.0 34113901 −136.4− 98.6
−219.7 −219.7 3411381139
01 −121.1− 98.6
−204.6 −204.6 37013910 −304.2 + 99.6
−197.4 3902
−157.0 −156.2 3410370139
02 41.2− 197.4
−136.4 3411
−132.2 −132.0 3710380139
01 −33.4− 98.6
−121.1 −122.3 34113811 −136.4 + 14.1
−99.9 −99.8 3410380139
02 97.6− 197.4
−98.6 (−99)d 3901
−89.1 −88.7 3711 215.5− 304.2
−57.8 −57.4 3410370139
01 41.2− 98.6
−44.4 −44.1 3410370138
1139
01 54.5− 98.6
−37.2 −36.8 34113910 −136.4 + 99.6
−33.4 −32.6 37103801 215.5− (262.2− 14.1)e
−22.1 −21.5 3411381139
10 −121.1 + 99.6
−1.1 −1.0 3410380139
01 97.6− 98.6
0.0 000
continues
a 24558.8 cm−1
b Listed wavenumber values correspond to band maxima. Uncertainty in a band maximum is ± 0.3 cm−1.c Inferred from combinations (last column) involving other assignments herein.d Inferred from ground-state fundamental in the near-infrared spectrum of 2CHO vapor [16].e The ground-state ν38 fundamental is known from previous Raman [15] and far-infrared [16] work, but
the precise value cited here, 262.2− 14.1 = 248.1 cm−1, is the combination difference between the 3810and 3811 bands observed in the present CRD spectrum.
27
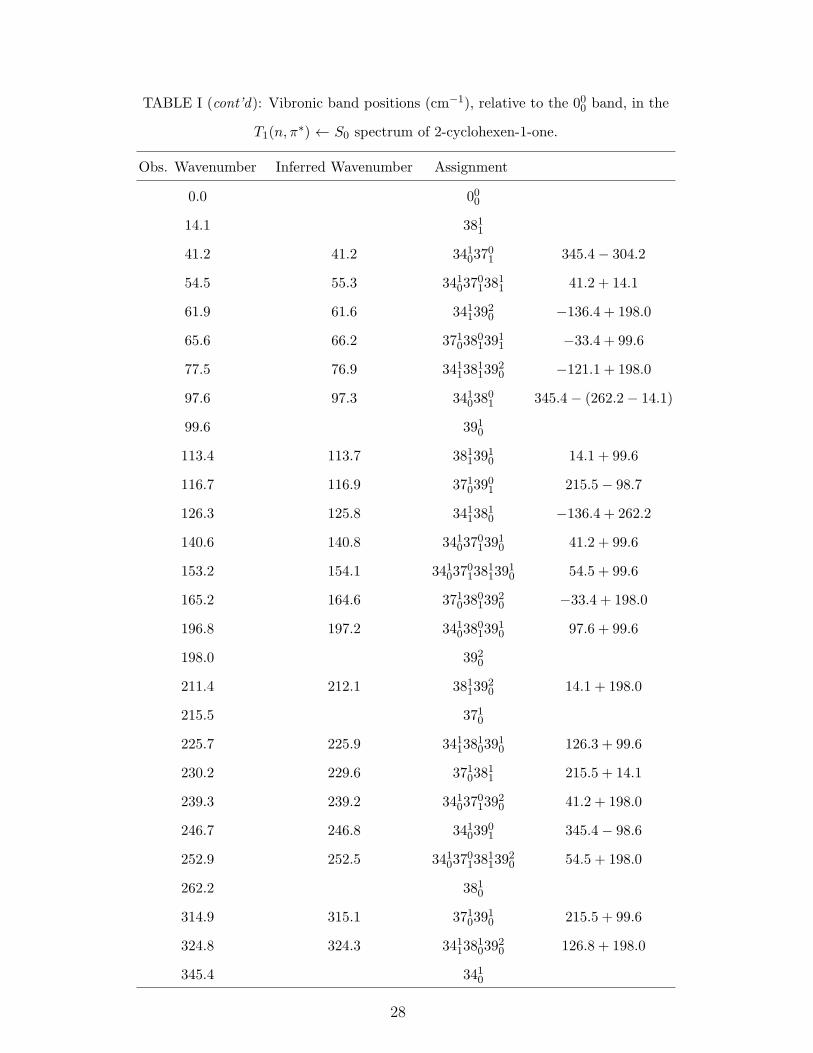
TABLE I (cont’d): Vibronic band positions (cm−1), relative to the 000 band, in the
T1(n, π∗) ← S0 spectrum of 2-cyclohexen-1-one.
Obs. Wavenumber Inferred Wavenumber Assignment
0.0 000
14.1 3811
41.2 41.2 34103701 345.4− 304.2
54.5 55.3 3410370138
11 41.2 + 14.1
61.9 61.6 34113920 −136.4 + 198.0
65.6 66.2 3710380139
11 −33.4 + 99.6
77.5 76.9 3411381139
20 −121.1 + 198.0
97.6 97.3 34103801 345.4− (262.2− 14.1)
99.6 3910
113.4 113.7 38113910 14.1 + 99.6
116.7 116.9 37103901 215.5− 98.7
126.3 125.8 34113810 −136.4 + 262.2
140.6 140.8 3410370139
10 41.2 + 99.6
153.2 154.1 3410370138
1139
10 54.5 + 99.6
165.2 164.6 3710380139
20 −33.4 + 198.0
196.8 197.2 3410380139
10 97.6 + 99.6
198.0 3920
211.4 212.1 38113920 14.1 + 198.0
215.5 3710
225.7 225.9 3411381039
10 126.3 + 99.6
230.2 229.6 37103811 215.5 + 14.1
239.3 239.2 3410370139
20 41.2 + 198.0
246.7 246.8 34103901 345.4− 98.6
252.9 252.5 3410370138
1139
20 54.5 + 198.0
262.2 3810
314.9 315.1 37103910 215.5 + 99.6
324.8 324.3 3411381039
20 126.8 + 198.0
345.4 3410
28
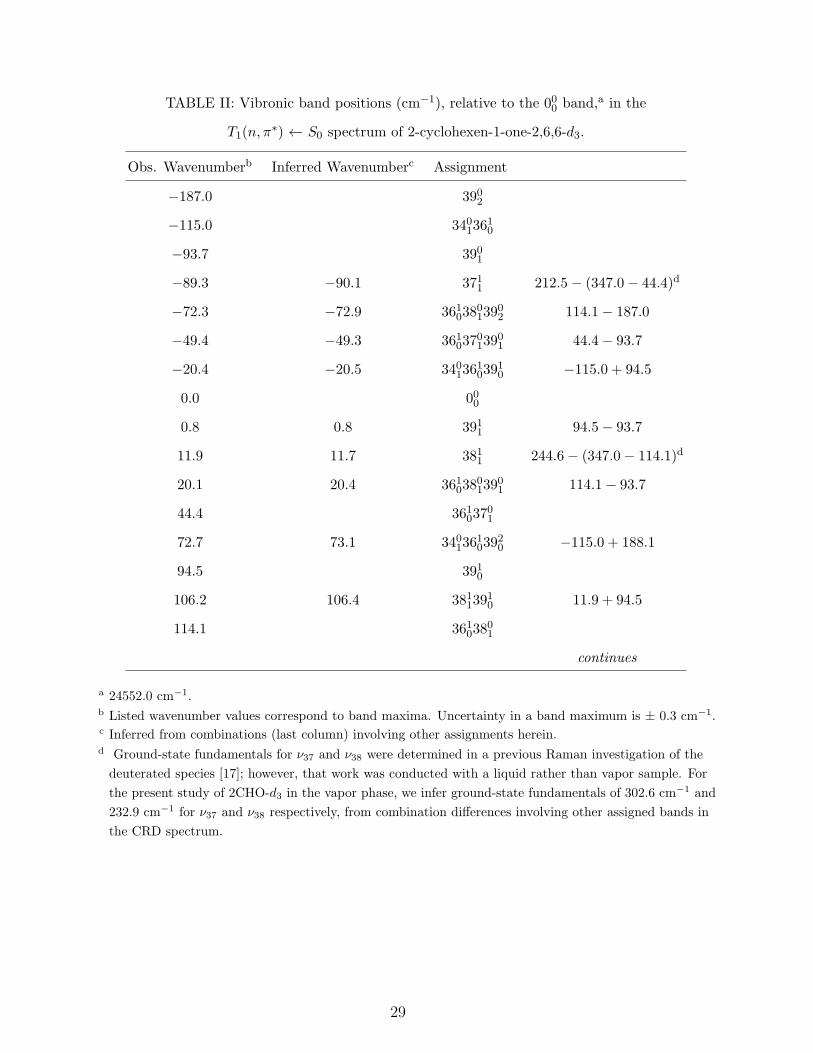
TABLE II: Vibronic band positions (cm−1), relative to the 000 band,a in the
T1(n, π∗) ← S0 spectrum of 2-cyclohexen-1-one-2,6,6-d3.
Obs. Wavenumberb Inferred Wavenumberc Assignment
−187.0 3902
−115.0 34013610
−93.7 3901
−89.3 −90.1 3711 212.5− (347.0− 44.4)d
−72.3 −72.9 3610380139
02 114.1− 187.0
−49.4 −49.3 3610370139
01 44.4− 93.7
−20.4 −20.5 3401361039
10 −115.0 + 94.5
0.0 000
0.8 0.8 3911 94.5− 93.7
11.9 11.7 3811 244.6− (347.0− 114.1)d
20.1 20.4 3610380139
01 114.1− 93.7
44.4 36103701
72.7 73.1 3401361039
20 −115.0 + 188.1
94.5 3910
106.2 106.4 38113910 11.9 + 94.5
114.1 36103801
continues
a 24552.0 cm−1.b Listed wavenumber values correspond to band maxima. Uncertainty in a band maximum is ± 0.3 cm−1.c Inferred from combinations (last column) involving other assignments herein.d Ground-state fundamentals for ν37 and ν38 were determined in a previous Raman investigation of the
deuterated species [17]; however, that work was conducted with a liquid rather than vapor sample. For
the present study of 2CHO-d3 in the vapor phase, we infer ground-state fundamentals of 302.6 cm−1 and
232.9 cm−1 for ν37 and ν38 respectively, from combination differences involving other assigned bands in
the CRD spectrum.
29
TABLE II (continued): Vibronic band positions (cm−1), relative to the 000 band, in the
T1(n, π∗) ← S0 spectrum of 2-cyclohexen-1-one-2,6,6-d3.
Obs. Wavenumber Inferred Wavenumber Assignment
139.5 138.9 3610370139
10 44.4 + 94.5
188.1 3920
208.4 208.6 3610380139
10 114.1 + 94.5
212.5 3710
232.7 232.5 3610370139
20 44.4 + 188.1
244.6 3810
253.3 253.3 36103901 347.0− 93.7
301.9 302.2 3610380139
20 114.1 + 188.1
335.9 3410
347.0 3610
30
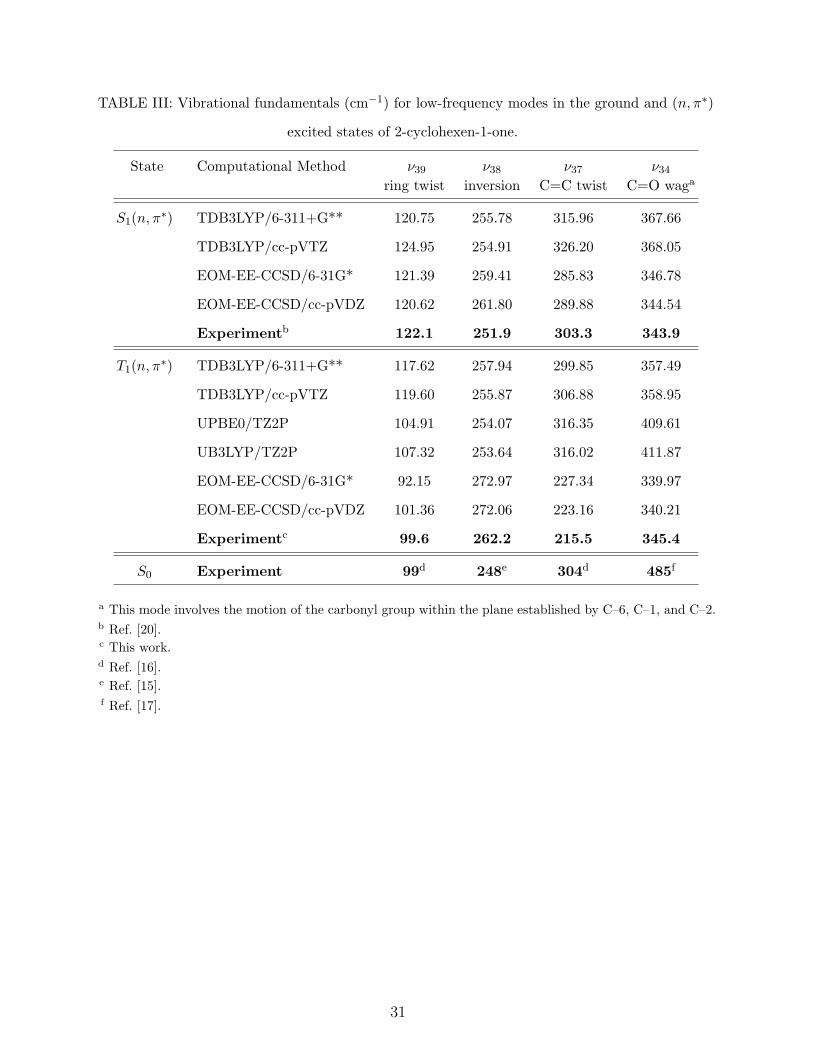
TABLE III: Vibrational fundamentals (cm−1) for low-frequency modes in the ground and (n, π∗)
excited states of 2-cyclohexen-1-one.
State Computational Method ν39 ν38 ν37 ν34ring twist inversion C=C twist C=O waga
S1(n, π∗) TDB3LYP/6-311+G** 120.75 255.78 315.96 367.66
TDB3LYP/cc-pVTZ 124.95 254.91 326.20 368.05
EOM-EE-CCSD/6-31G* 121.39 259.41 285.83 346.78
EOM-EE-CCSD/cc-pVDZ 120.62 261.80 289.88 344.54
Experimentb 122.1 251.9 303.3 343.9
T1(n, π∗) TDB3LYP/6-311+G** 117.62 257.94 299.85 357.49
TDB3LYP/cc-pVTZ 119.60 255.87 306.88 358.95
UPBE0/TZ2P 104.91 254.07 316.35 409.61
UB3LYP/TZ2P 107.32 253.64 316.02 411.87
EOM-EE-CCSD/6-31G* 92.15 272.97 227.34 339.97
EOM-EE-CCSD/cc-pVDZ 101.36 272.06 223.16 340.21
Experimentc 99.6 262.2 215.5 345.4
S0 Experiment 99d 248e 304d 485f
a This mode involves the motion of the carbonyl group within the plane established by C–6, C–1, and C–2.b Ref. [20].c This work.d Ref. [16].e Ref. [15].f Ref. [17].
31
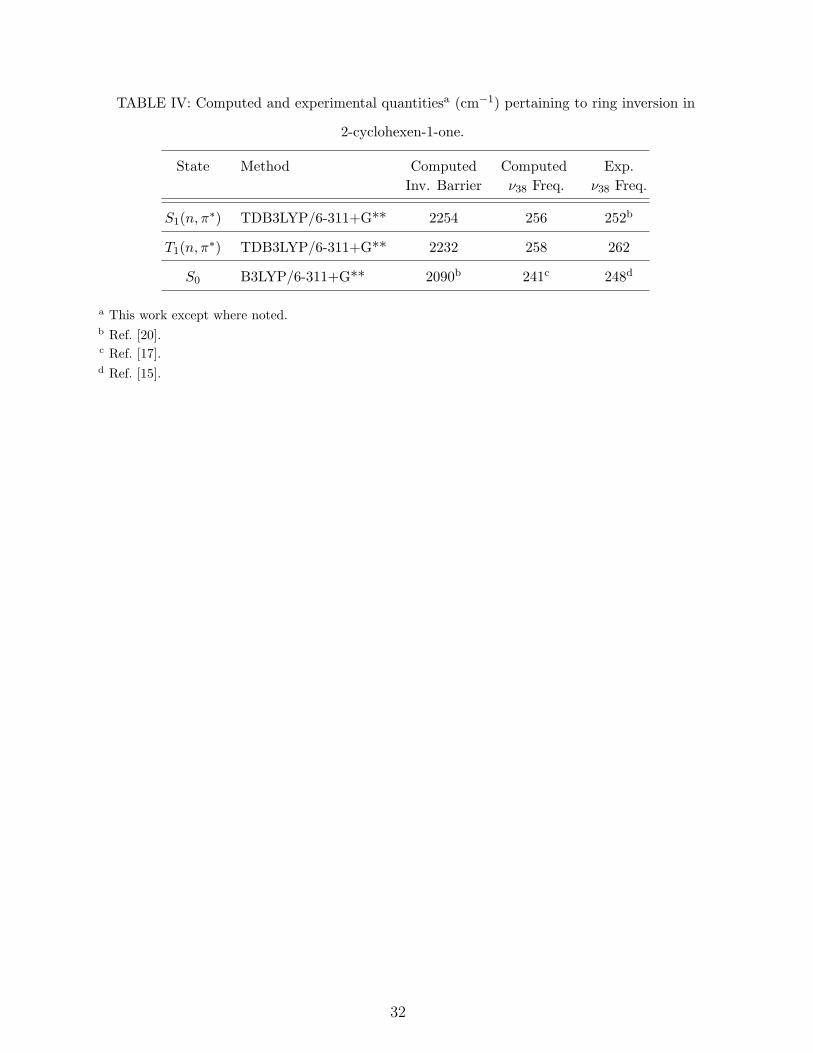
TABLE IV: Computed and experimental quantitiesa (cm−1) pertaining to ring inversion in
2-cyclohexen-1-one.
State Method Computed Computed Exp.
Inv. Barrier ν38 Freq. ν38 Freq.
S1(n, π∗) TDB3LYP/6-311+G** 2254 256 252b
T1(n, π∗) TDB3LYP/6-311+G** 2232 258 262
S0 B3LYP/6-311+G** 2090b 241c 248d
a This work except where noted.b Ref. [20].c Ref. [17].d Ref. [15].
32
2CHO 2CHO-d3
O
12
DD
D
5
O
24400 24600 248000
200
400
600
Phot
on lo
ss p
er p
ass
(ppm
)
0.00
0.02
0.04
0.06
0.08
0.10
Mol
ar a
bsor
ptiv
ity �
(M -1
cm
-1)
410 408 406 404 402
Wavenumber (cm-1)
Wavelength (nm)
O
DDD
O
O
DDD
O
50
100
150
200
3710380
1
3710380
13901
3401361
0
3401361
03910
3610370
13901
3411381
1
3901
3411381
13910341
03701390
1
3411391
0
3410380
13901
3411
Phot
on lo
ss p
er p
ass
(ppm
)
-100 -50 0
Wavenumber (cm-1) relative to T1�� S0 origin band
O
DDD
O200
300
400
3710380
13910
3401361
03920
3410370
13910
3610380
13901
3610380
1
3411392
0
3610370
13910
3410380
1341
03701
3811391
0
3811Ph
oton
loss
per
pas
s (p
pm)
3910
000
0 50 100 150
Wavenumber (cm-1) relative to T1�� S0 origin band
O
DDD
O
350
400
550
600
650
700
3610380139
10
3610
3710
1201391
0
1501
3710170
13910
3920
1701
3920
3410
3410380139
10
3810
Phot
on lo
ss p
er p
ass
(ppm
)
37103910
1801 190
1
1901390
1
200 250 300 350
Wavenumber (cm-1) relative to T1� S0 origin band
Energy 0.58 0.21
EOM Transition Amplitudes
3(n,π*) 3(π,π*)
π (C=O)
n (O)
+
π (C=C)
π* (C=C)