Looking back on the future of climate change
54
Looking back on the future of climate change Brian Rose and Daniel Enderton IAP 2008
Transcript of Looking back on the future of climate change
Looking back on the future of climate change
Brian Rose and Daniel Enderton IAP 2008
Looking back on the future of climate change
Part 1: The early years of greenhouse theory. A tale of ice ages and carbon dioxide
Brian Rose ([email protected])
Program in Atmospheres, Oceans and Climate
MIT
January 14, 2008
In the beginning… o There was an energy balance model
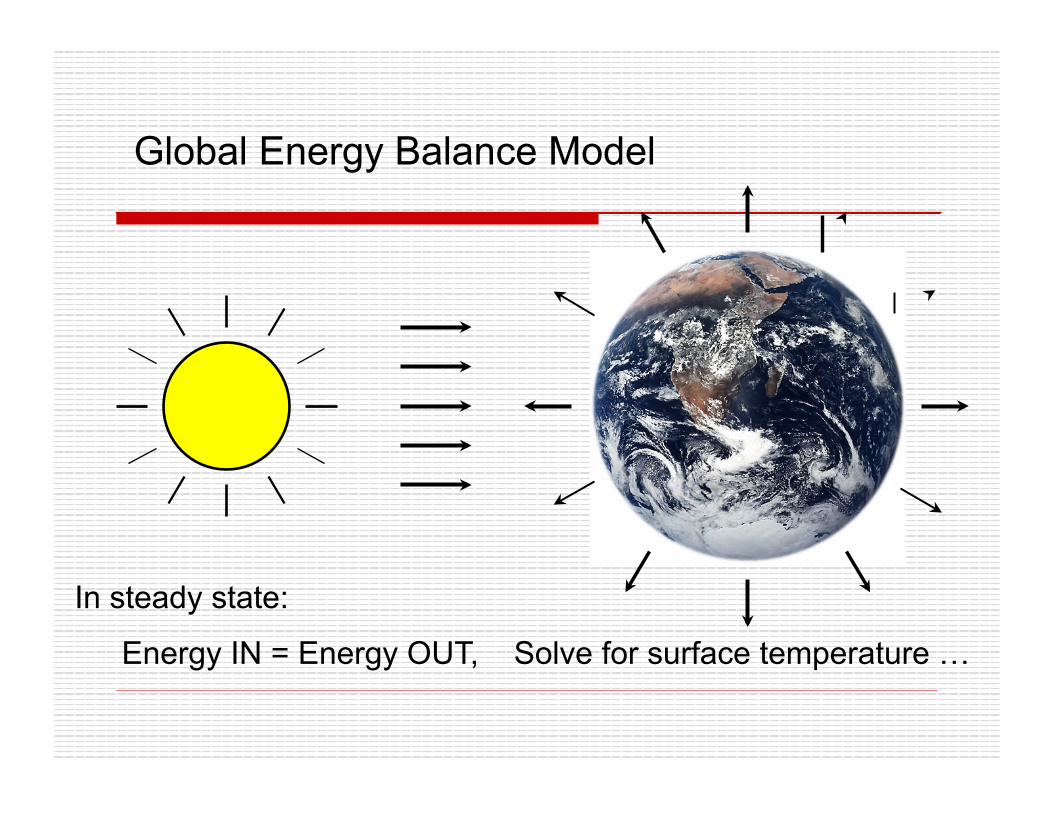
Global Energy Balance Model
In steady state:
Energy IN = Energy OUT, Solve for surface temperature …
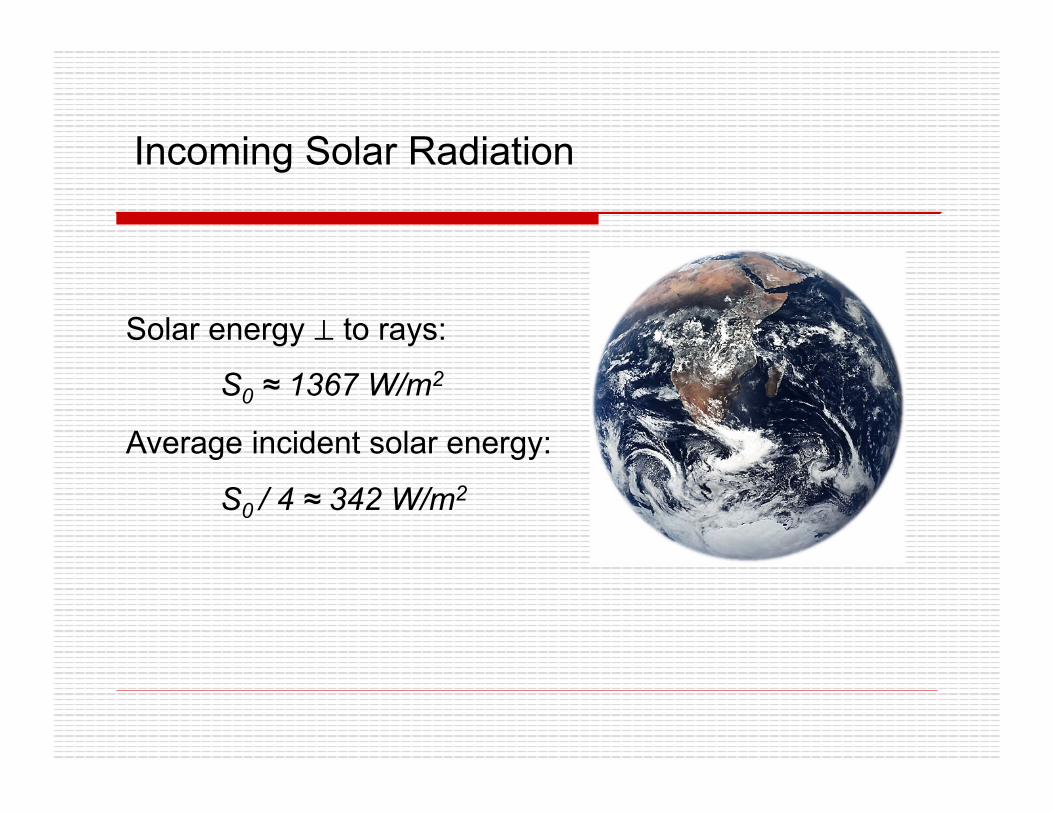
Incoming Solar Radiation
Solar energy ⊥ to rays:
S0 ≈ 1367 W/m2
Average incident solar energy:
S0 / 4 ≈ 342 W/m2
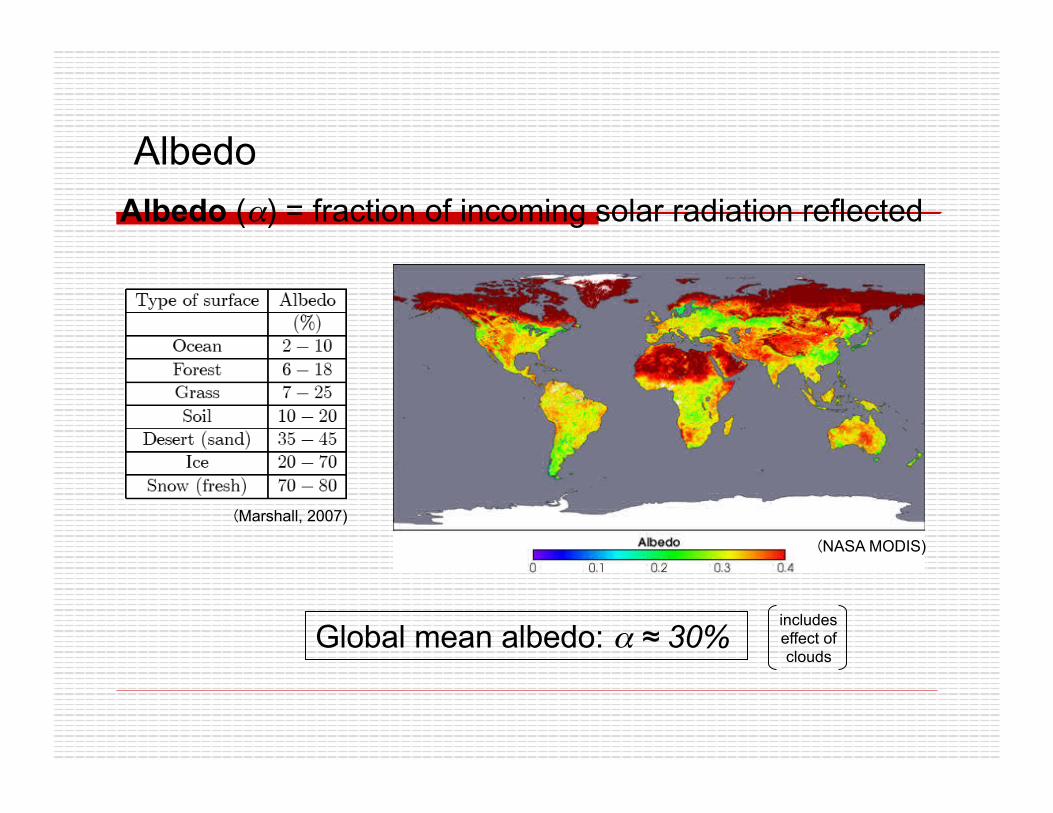
Albedo Albedo (α) = fraction of incoming solar radiation reflected
Global mean albedo: α ≈ 30% includes effect of clouds
(Marshall, 2007)
(NASA MODIS)
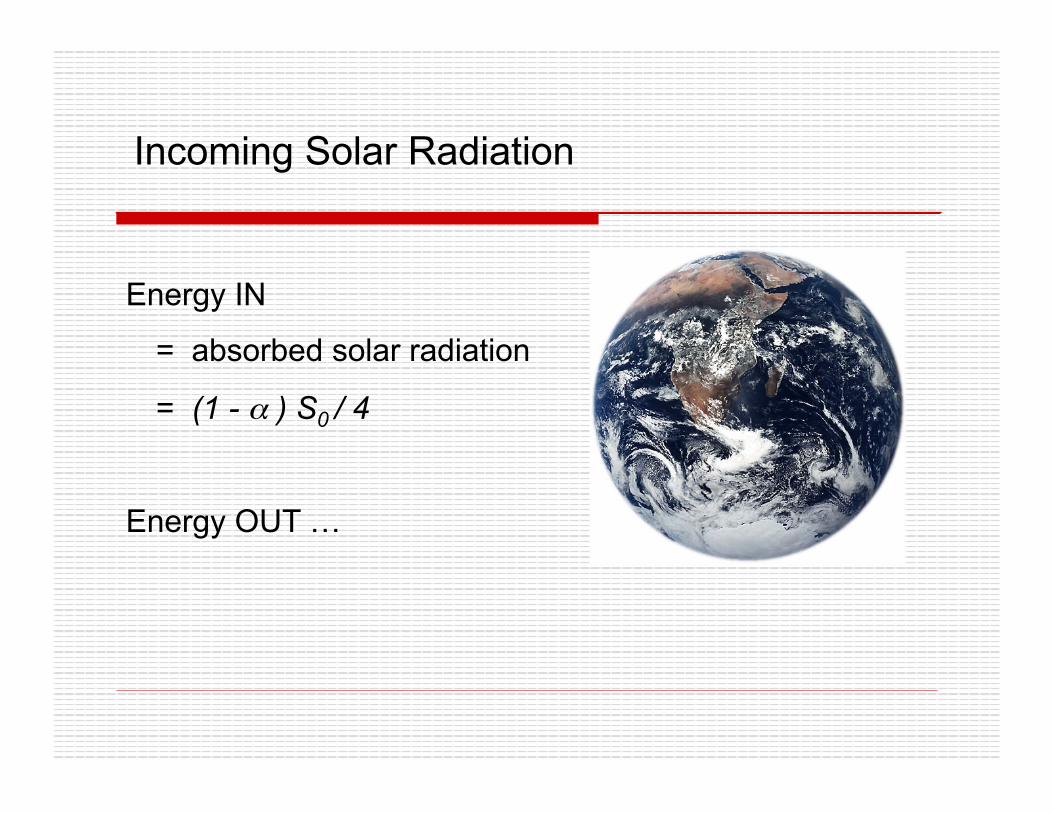
Incoming Solar Radiation
Energy IN
= absorbed solar radiation
= (1 - α ) S0 / 4
Energy OUT …
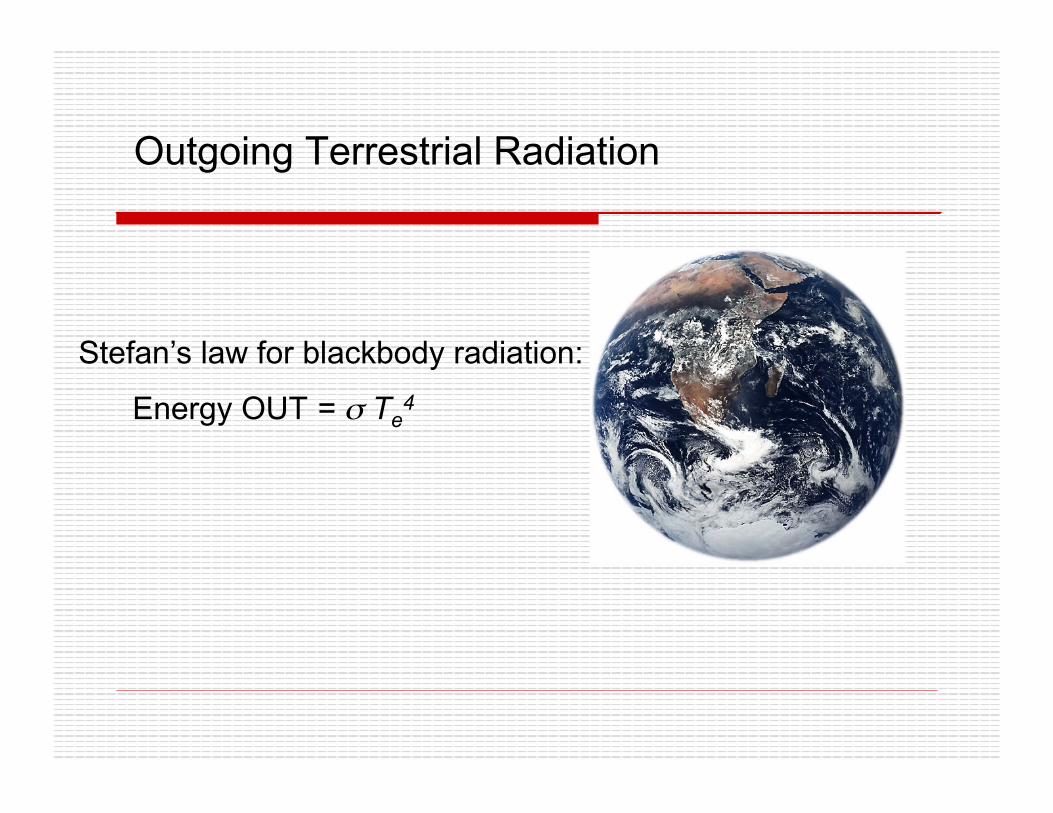
Outgoing Terrestrial Radiation
Stefan’s law for blackbody radiation:
Energy OUT = σ Te4
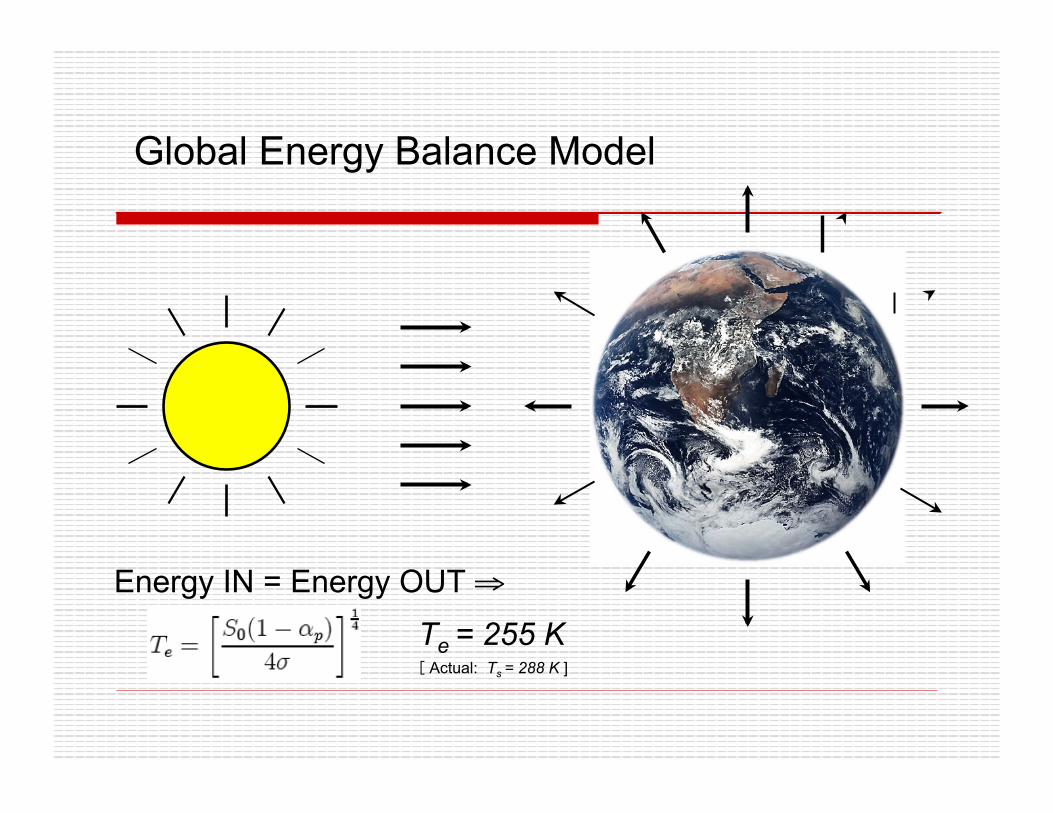
Global Energy Balance Model
Energy IN = Energy OUT ⇒
Te = 255 K
[ Actual: Ts = 288 K ]
Joseph Fourier (1768-1830)
o First to recognize the concept of planetary energy balance (though infrared radiation had not yet been discovered)
o Calculated a radiative equilibrium temperature much too cold
o Inferred that the atmosphere interferes with the transmission of outgoing terrestrial heat
o This is what eventually came to be called the greenhouse effect
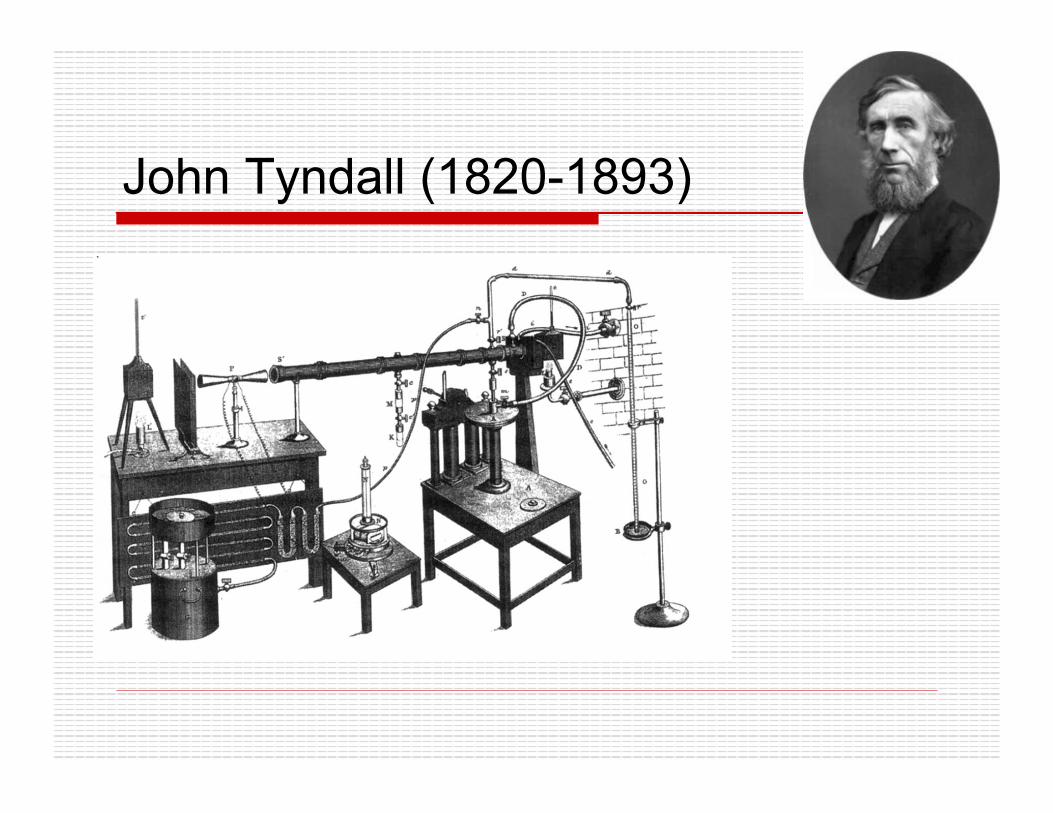
John Tyndall (1820-1893)
John Tyndall (1820-1893) o Conducted laboratory experiments,
showed that several atmospheric gases absorb heat, notably H2O and CO2
o Recognized the important implications for the energy balance of the earth:
“As a dam built across a river causes a local deepening of the stream, so our atmosphere, thrown as a barrier across the terrestrial rays, produces a local heightening of the temperature at the Earth’s surface.” Tyndall, 1862
John Tyndall (1820-1893)
Water vapor “is a blanket more necessary to the vegetable life of England than clothing is to man. Remove for a single summer-night the aqueous vapour from the air… and the sun would rise upon an island held fast in the iron grip of frost.” Tyndall, 1863
Tyndall’s motivation o An avid alpinist with first-hand knowledge
of glaciers, he had become convinced by the evidence that all of northern Europe had once been covered by a colossal ice sheet
o He was looking for mechanisms to explain how the climate could change so radically!
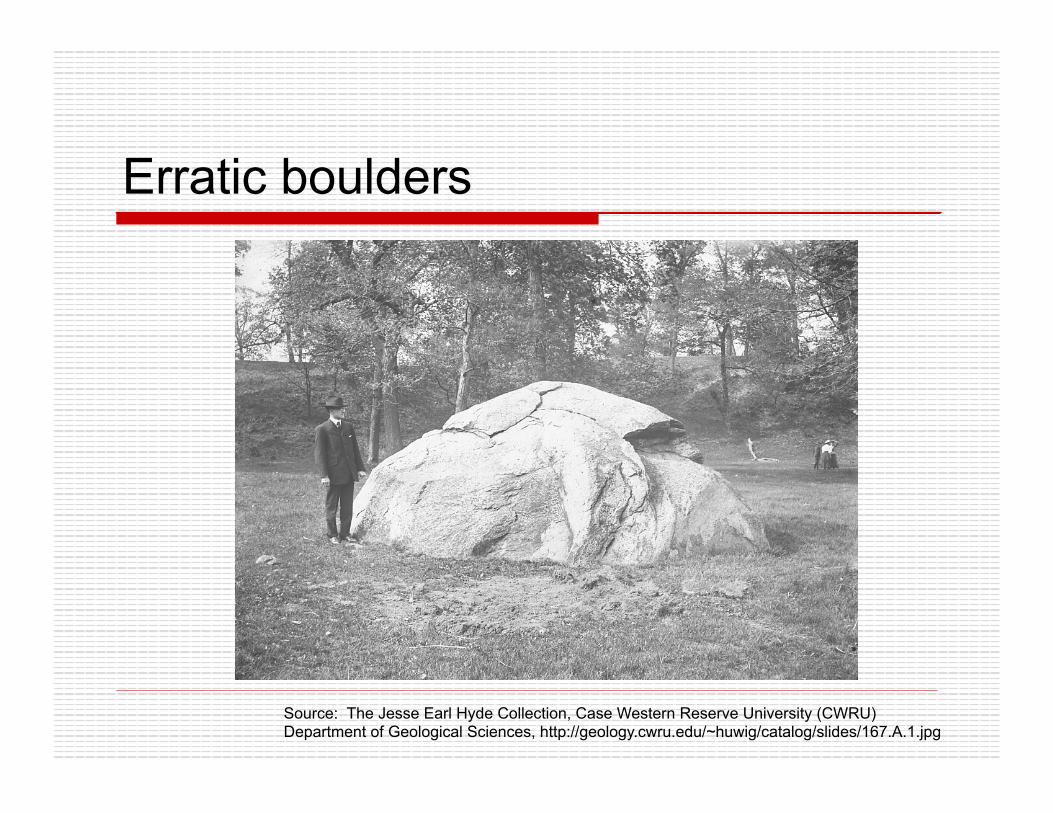
Erratic boulders
Source: The Jesse Earl Hyde Collection, Case Western Reserve University (CWRU) Department of Geological Sciences, http://geology.cwru.edu/~huwig/catalog/slides/167.A.1.jpg
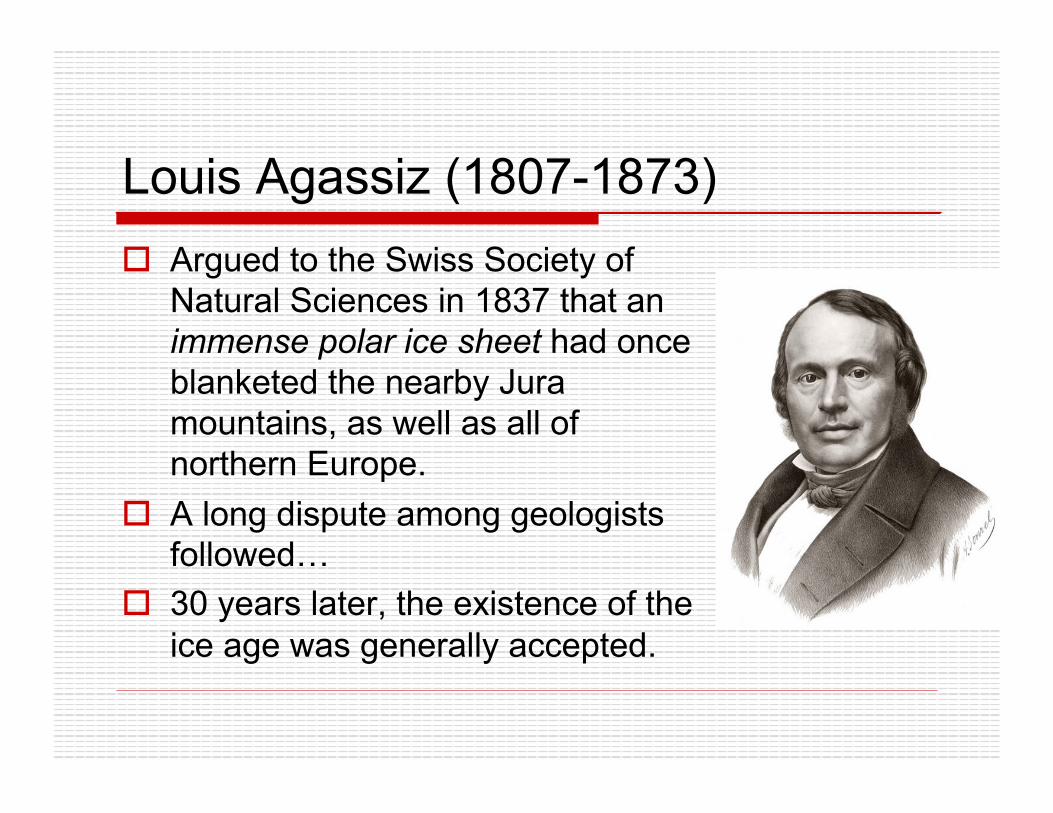
Louis Agassiz (1807-1873) o Argued to the Swiss Society of
Natural Sciences in 1837 that an immense polar ice sheet had once blanketed the nearby Jura mountains, as well as all of northern Europe.
o A long dispute among geologists followed…
o 30 years later, the existence of the ice age was generally accepted.
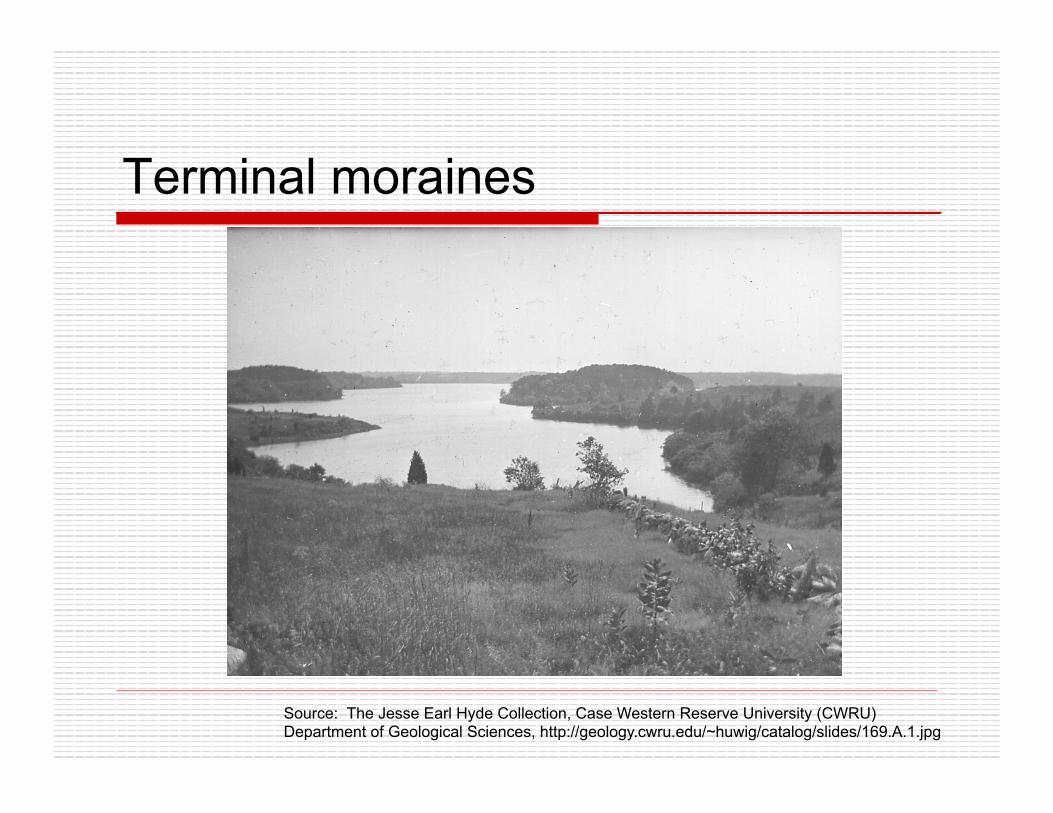
Terminal moraines
Source: The Jesse Earl Hyde Collection, Case Western Reserve University (CWRU) Department of Geological Sciences, http://geology.cwru.edu/~huwig/catalog/slides/169.A.1.jpg
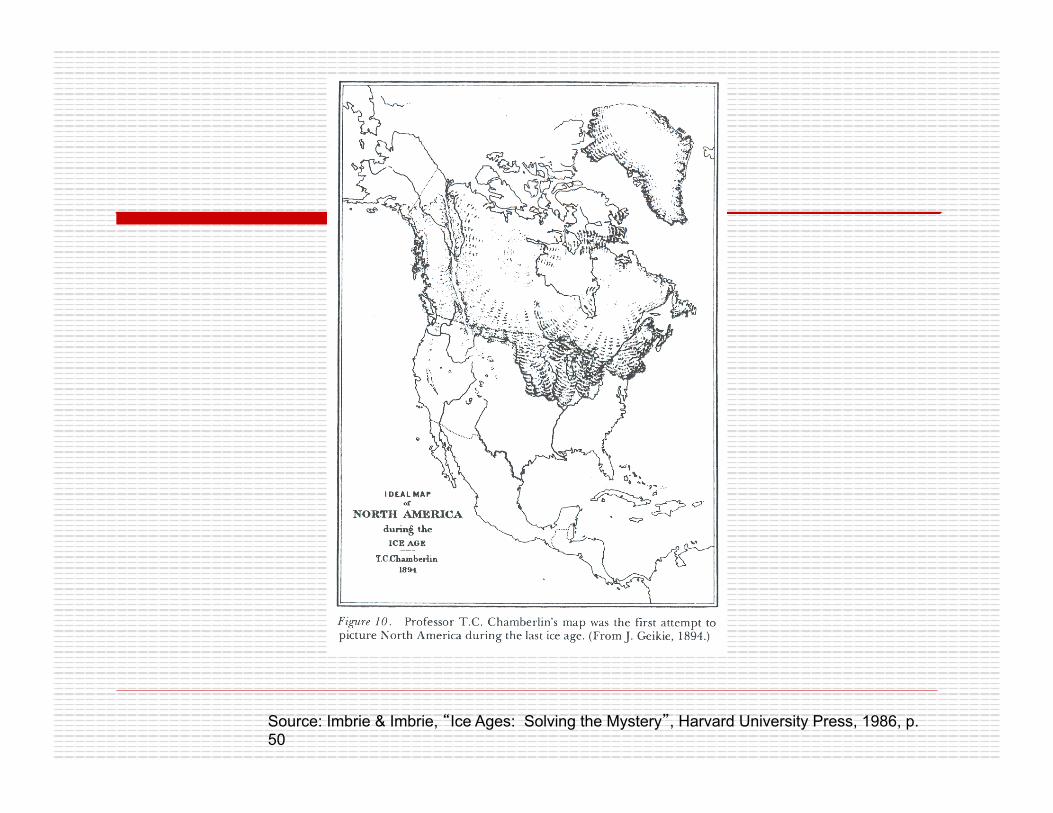
Source: Imbrie & Imbrie, “Ice Ages: Solving the Mystery”, Harvard University Press, 1986, p.50
Not one ice age, but several!
But why and how did it happen? o By the end of the 19th century, geologists
had amassed a great deal of information about the ice ages.
o Multiple ice ages suggested that the climate had fluctuated enormously over time
o Explaining the ice ages became the “holy grail” of climate studies (and still is!)
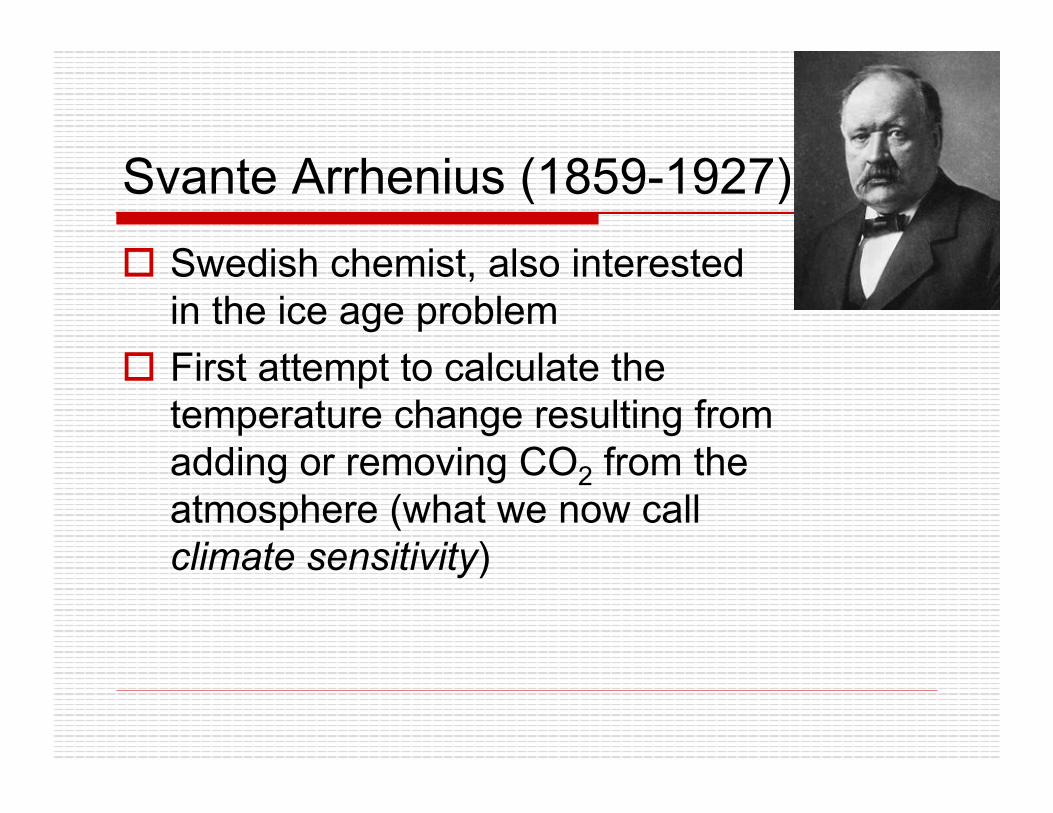
Svante Arrhenius (1859-1927) o Swedish chemist, also interested
in the ice age problem o First attempt to calculate the
temperature change resulting from adding or removing CO2 from the atmosphere (what we now call climate sensitivity)
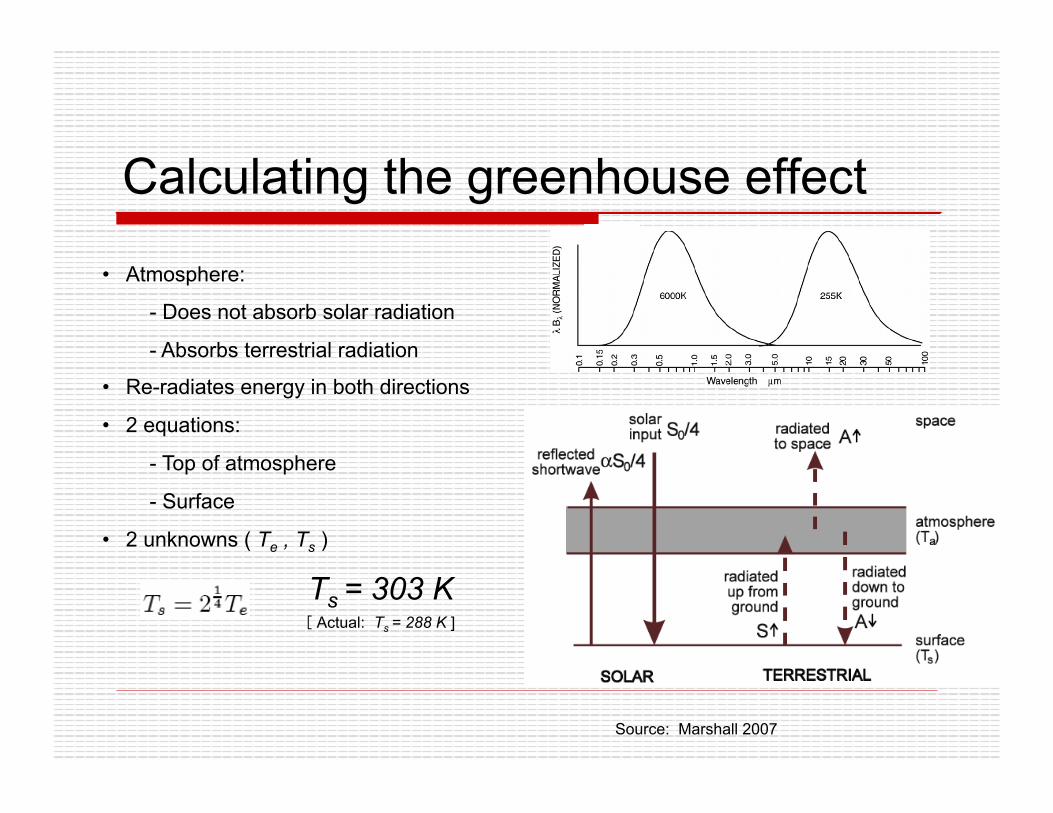
Calculating the greenhouse effect
• Atmosphere:
- Does not absorb solar radiation
- Absorbs terrestrial radiation
• Re-radiates energy in both directions
• 2 equations:
- Top of atmosphere
- Surface
• 2 unknowns ( Te , Ts )
Ts = 303 K
[ Actual: Ts = 288 K ]
Source: Marshall 2007
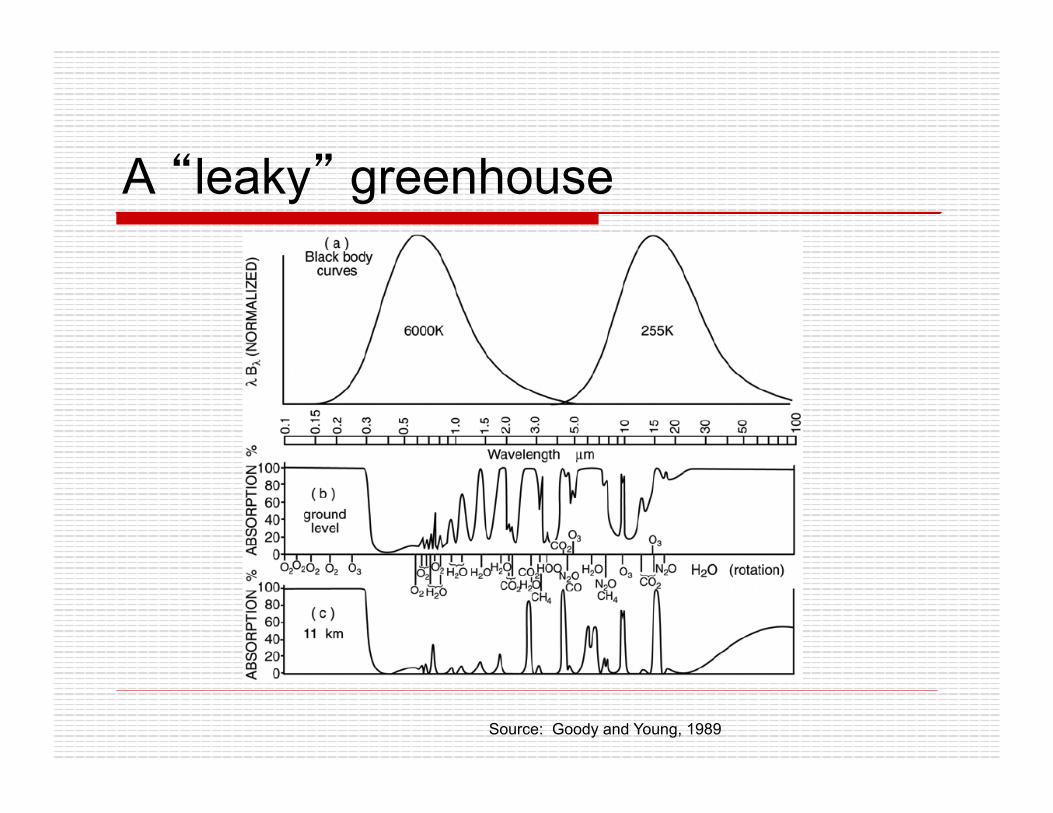
A “leaky” greenhouse
Source: Goody and Young, 1989
Water vapor feedback o Tyndall’s work had shown that H2O is the
dominant greenhouse gas in the atmosphere (was and still is much more abundant that CO2).
o Warmer air can hold more water vapor o Warmer ---> more H2O ---> more greenhouse
warming o A positive feedback! o Arrhenius recognized the crucial importance of
this feedback and included it in his calculations
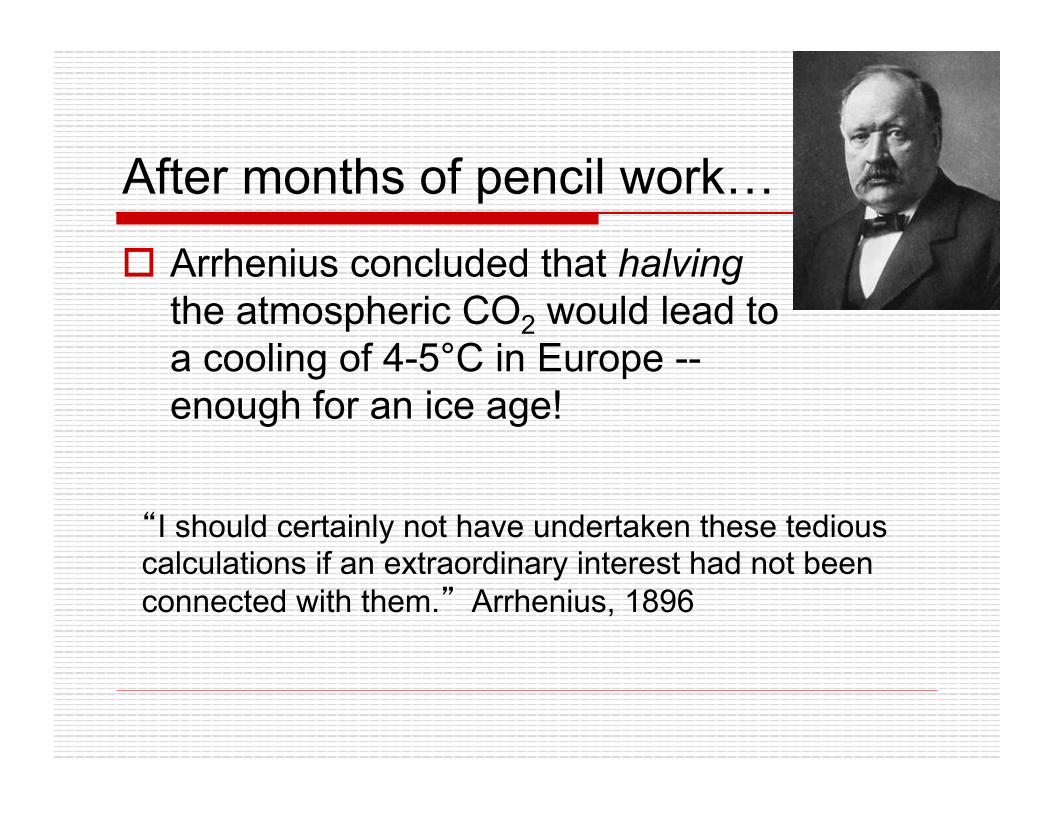
After months of pencil work… o Arrhenius concluded that halving
the atmospheric CO2 would lead to a cooling of 4-5°C in Europe -- enough for an ice age!
“I should certainly not have undertaken these tedious calculations if an extraordinary interest had not been connected with them.” Arrhenius, 1896
Could CO2 vary that much? o Arrhenius turned to a colleague named Arvid
Högbom who was studying how CO2 cycles through natural geochemical processes (e.g. volcanoes, oceans)
o Högbom found something remarkable: industrial sources were emitting CO2 at a rate comparable to geochemical sources!
o They realized that given enough time there was a possibility for artificial warming of the climate.
So Arrhenius did another calculation o Now curious about the warming question, he
calculated the effect of doubling the CO2 in atmosphere.
o Answer: 5-6°C warming o With the rate of coal consumption in 1896, this
doubling would take 3000 years (revised in 1908 to hundreds of years)
o Arrhenius had demonstrated anthropogenic global warming… as a curious theoretical concept.
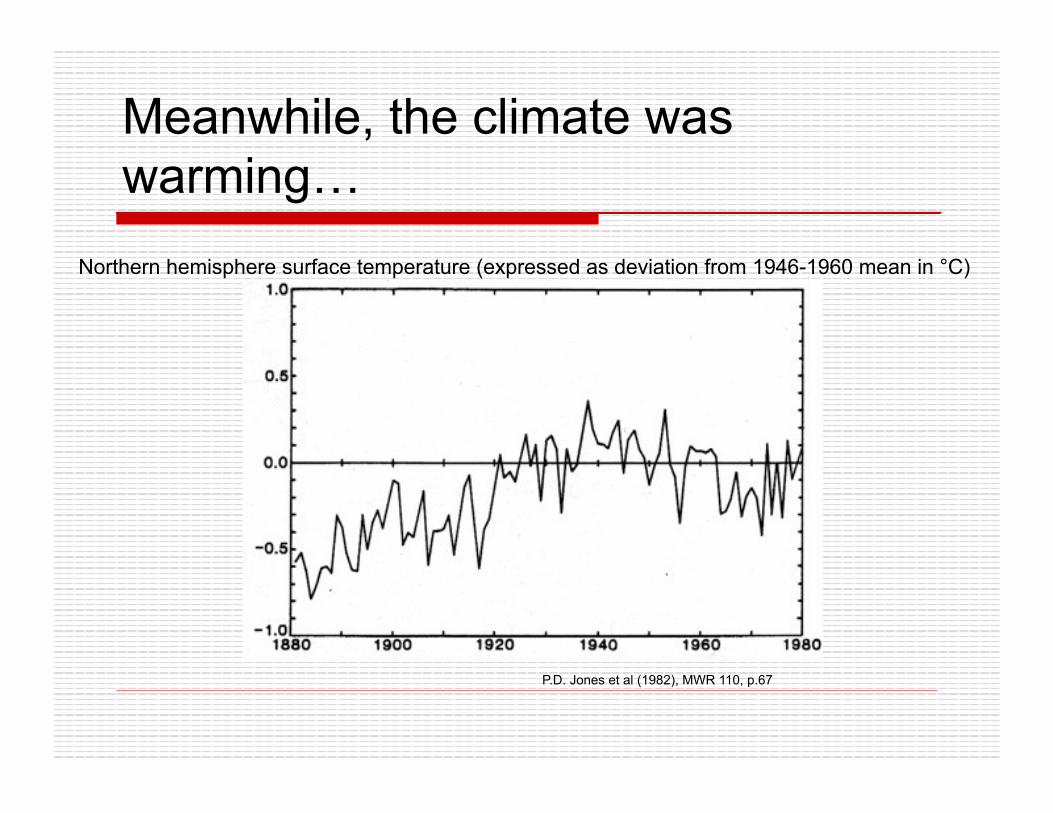
Meanwhile, the climate was warming…
P.D. Jones et al (1982), MWR 110, p.67
Northern hemisphere surface temperature (expressed as deviation from 1946-1960 mean in °C)
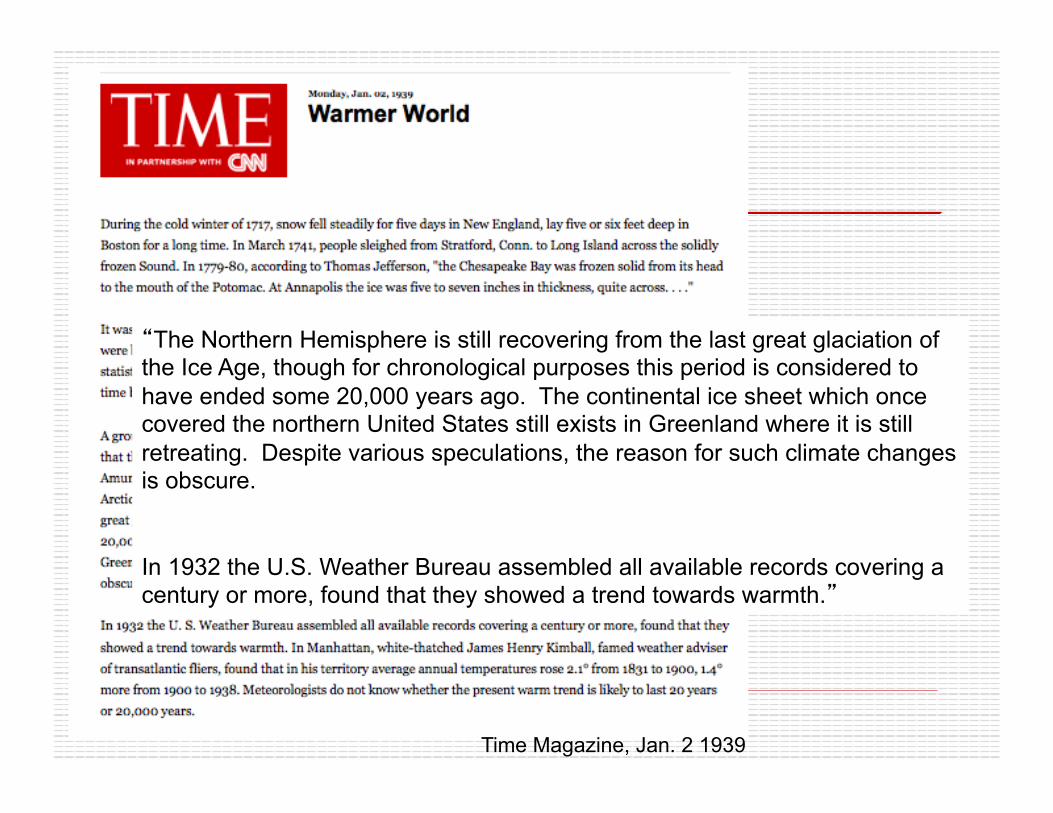
Time magazine, 1939
“The Northern Hemisphere is still recovering from the last great glaciation of the Ice Age, though for chronological purposes this period is considered to have ended some 20,000 years ago. The continental ice sheet which once covered the northern United States still exists in Greenland where it is still retreating. Despite various speculations, the reason for such climate changes is obscure.
In 1932 the U.S. Weather Bureau assembled all available records covering a century or more, found that they showed a trend towards warmth.”
Time Magazine, Jan. 2 1939
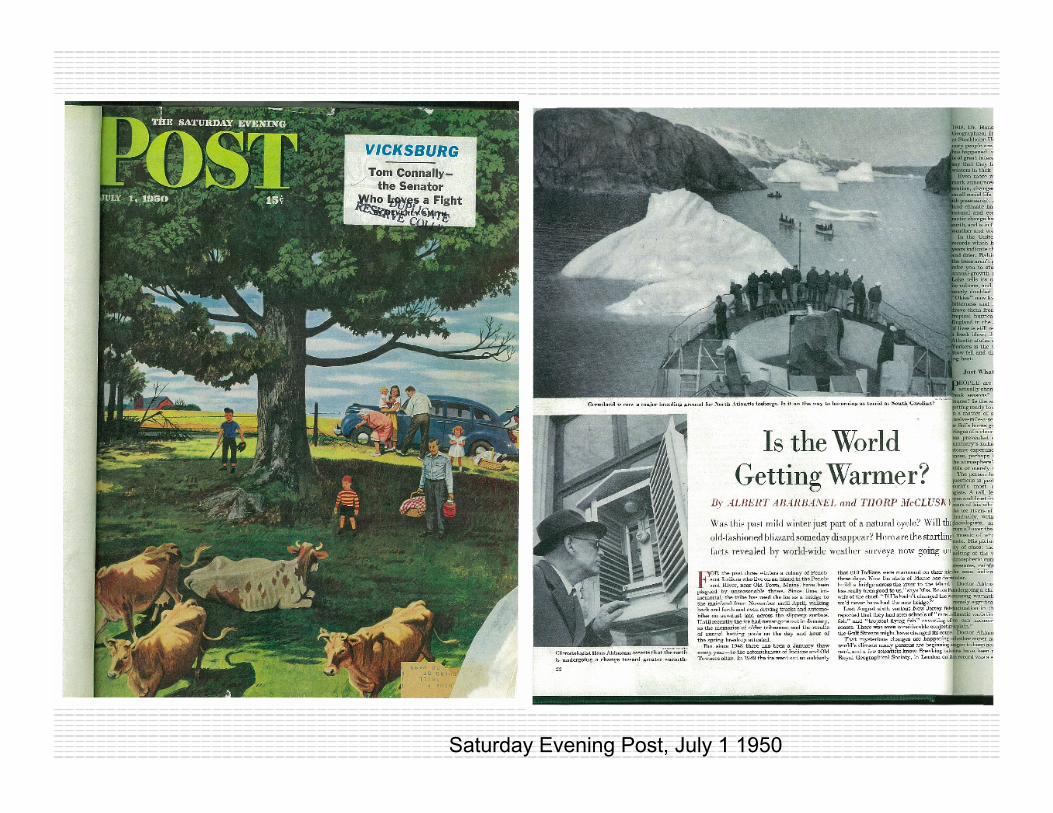
Saturday Evening Post
Saturday Evening Post, July 1 1950
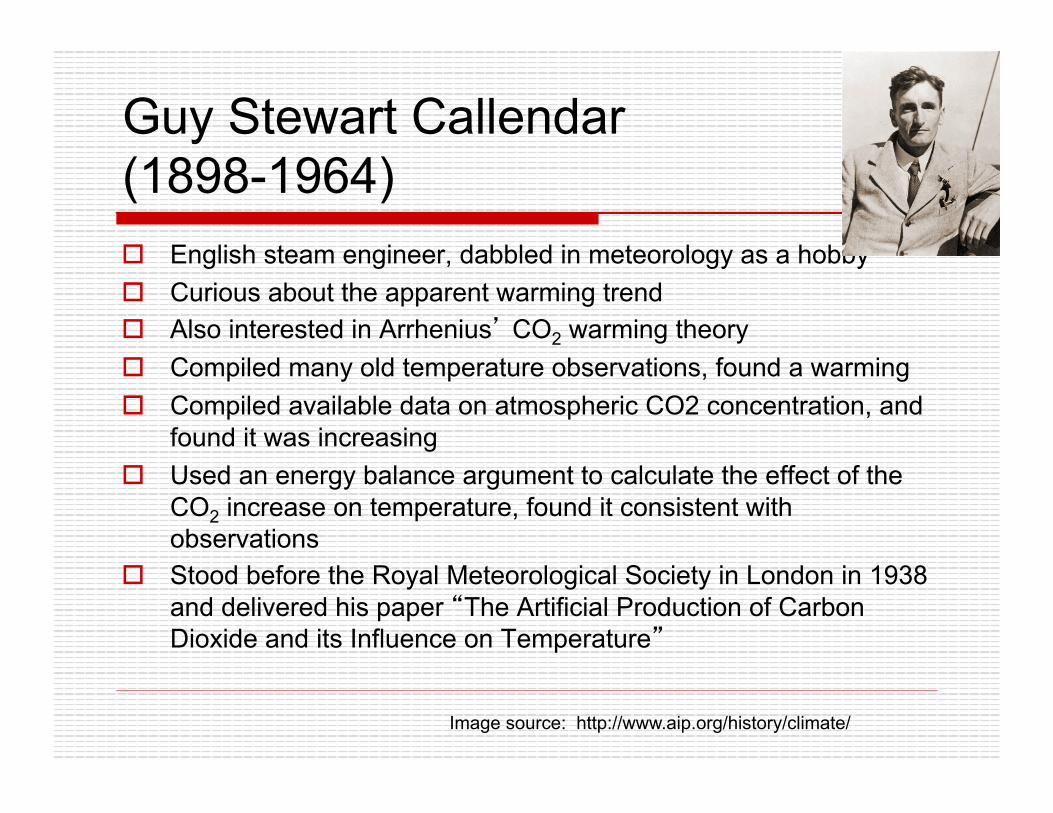
Guy Stewart Callendar (1898-1964) o English steam engineer, dabbled in meteorology as a hobby o Curious about the apparent warming trend o Also interested in Arrhenius’ CO2 warming theory o Compiled many old temperature observations, found a warming o Compiled available data on atmospheric CO2 concentration, and
found it was increasing o Used an energy balance argument to calculate the effect of the
CO2 increase on temperature, found it consistent with observations
o Stood before the Royal Meteorological Society in London in 1938 and delivered his paper “The Artificial Production of Carbon Dioxide and its Influence on Temperature”
Image source: http://www.aip.org/history/climate/
Guy Stewart Callendar
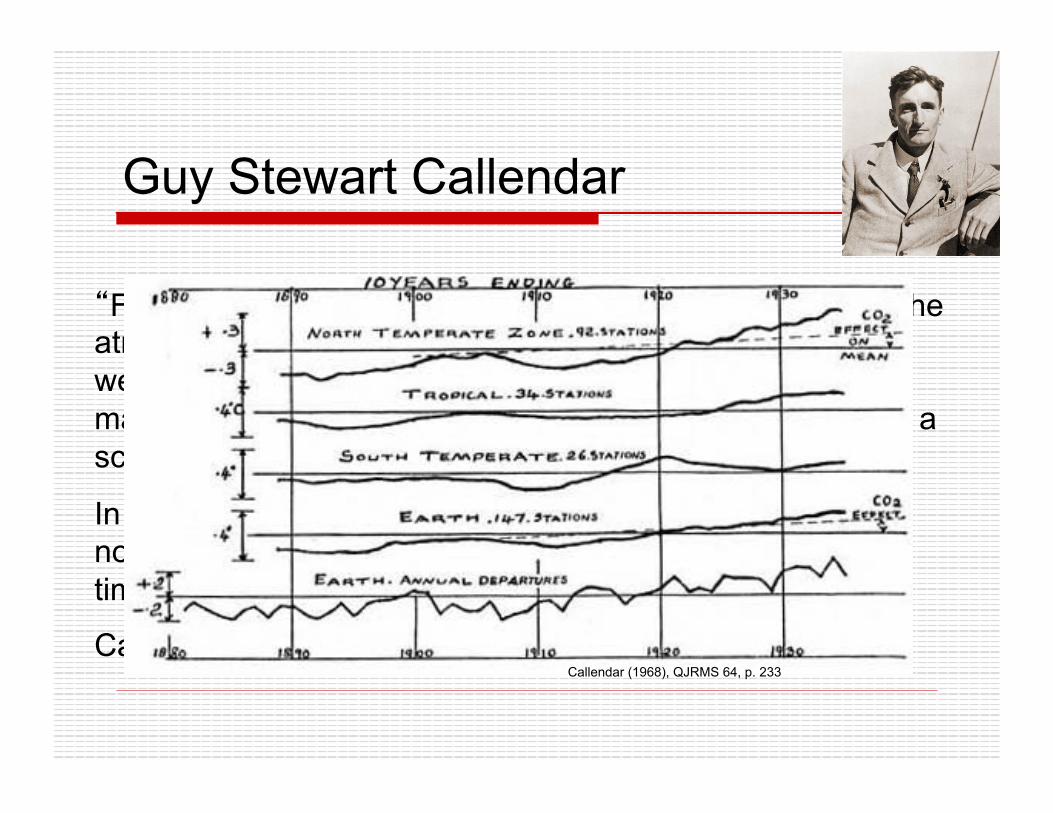
“Few of those familiar with the natural heat exchanges of the atmosphere, which go into the making of our climates and weather, would be prepared to admit that the activities of man could have any influence upon phenomena of so vast a scale.
In the following paper I hope to show that such influence is not only possible, but is actually occurring at the present time.”
Callendar, 1938 Callendar (1968), QJRMS 64, p. 233
Guy Stewart Callendar
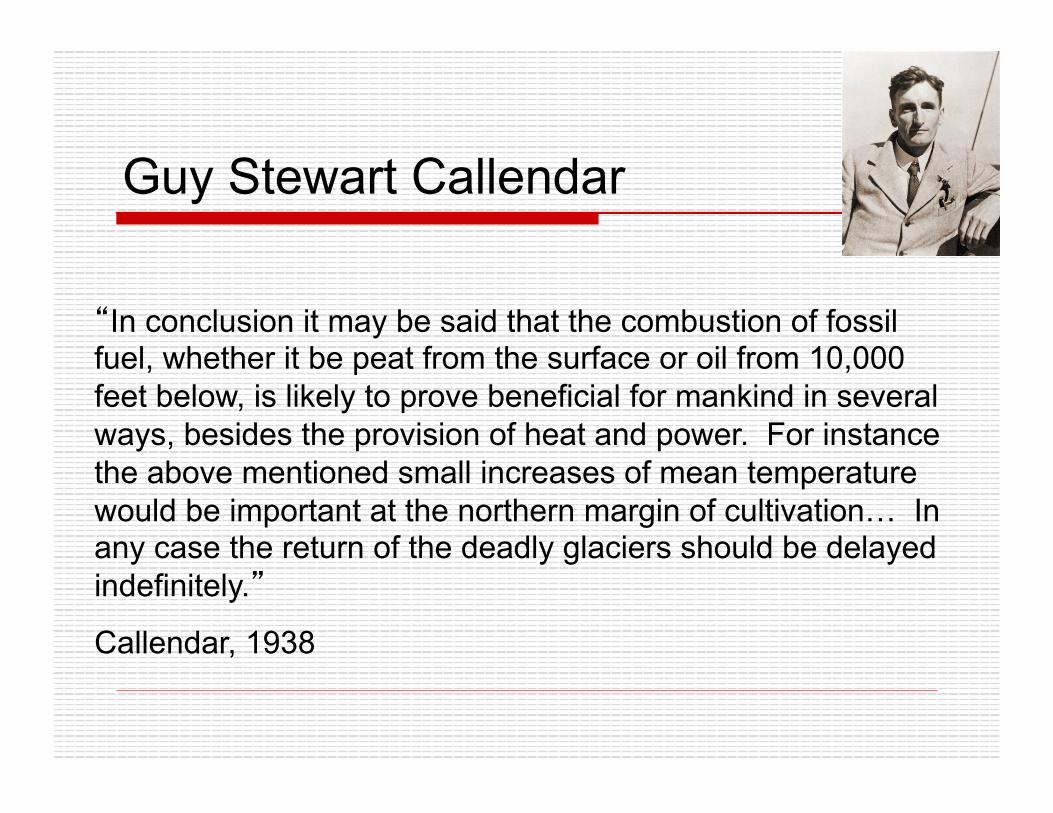
“In conclusion it may be said that the combustion of fossil fuel, whether it be peat from the surface or oil from 10,000 feet below, is likely to prove beneficial for mankind in several ways, besides the provision of heat and power. For instance the above mentioned small increases of mean temperature would be important at the northern margin of cultivation… In any case the return of the deadly glaciers should be delayed indefinitely.”
Callendar, 1938
Guy Stewart Callendar o Continued to argue for the next 20
years that CO2-induced greenhouse warming was occurring.
o Sometimes called the “Callendar Effect”
o However, few people were convinced at the time.
A few persistent arguments against CO2 greenhouse warming
o Lab results showed CO2 absorption already saturated
o Oceans are a huge carbon sink, probably taking up excess emissions
o Simple calculations by Arrhenius, Callendar and others completely neglected many important meteorological processes, including changes in cloud cover
Whither the carbon? o As late as 1950’s, reliable measurements of
atmospheric CO2 were lacking. Were emissions accumulating in the atmosphere, or being quickly taken up by the oceans?
o Meanwhile, radiometric 14C dating was invented. o In 1955 Hans Suess was measuring carbon
isotopes in tree rings to better calibrate 14C dates. o He found “old” carbon in recent growth rings.
Whither the carbon? o Some saw in Suess’s discovery a great new
opportunity to study the circulation of the ocean and the gas exchange with the atmosphere.
o Suess collaborated with Roger Revelle at the Scripps Institution of Oceanography
o They calculated an average lifetime of 10 years for a molecule of CO2 in the atmosphere
o Along the way, Revelle discovered a peculiar buffering mechanism in seawater: to equilibrate with a given increase in atmospheric CO2, the amount of dissolved carbon need only increase by about 1/10th as much.
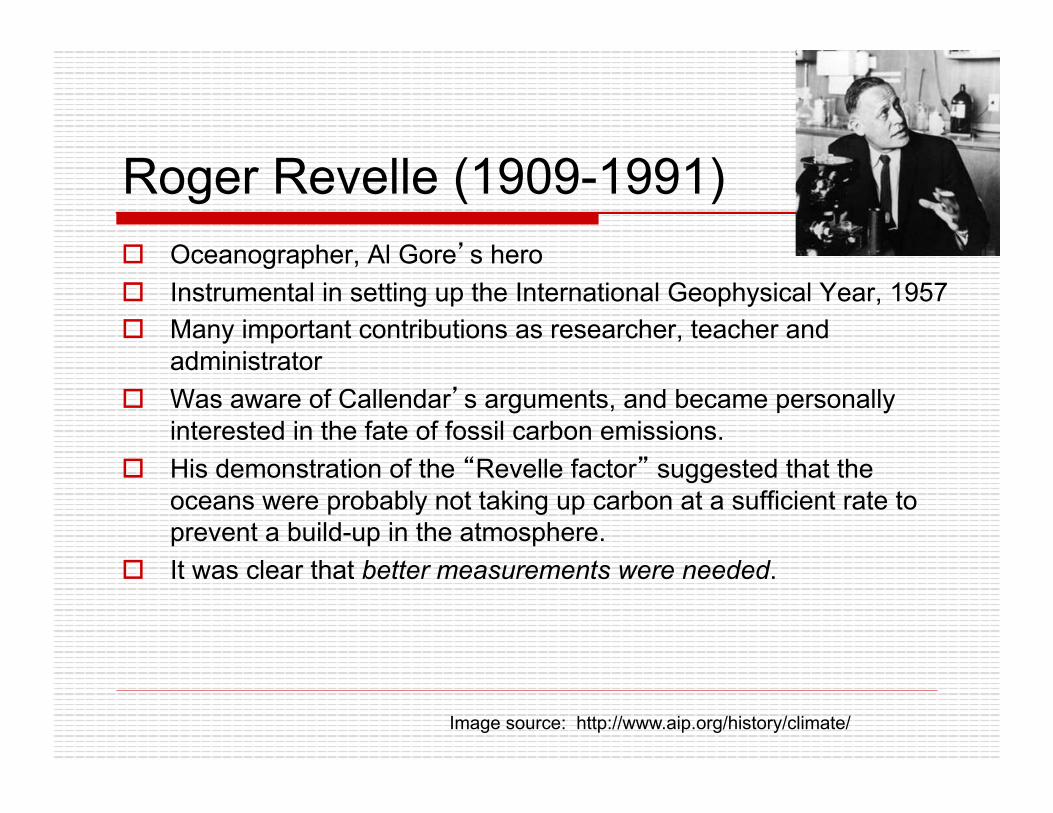
Roger Revelle (1909-1991) o Oceanographer, Al Gore’s hero o Instrumental in setting up the International Geophysical Year, 1957 o Many important contributions as researcher, teacher and
administrator o Was aware of Callendar’s arguments, and became personally
interested in the fate of fossil carbon emissions. o His demonstration of the “Revelle factor” suggested that the
oceans were probably not taking up carbon at a sufficient rate to prevent a build-up in the atmosphere.
o It was clear that better measurements were needed.
Image source: http://www.aip.org/history/climate/
Roger Revelle
“Human beings are now carrying out a large scale geophysical experiment of a kind that could not have happened in the past nor be reproduced in the future.”
Revelle and Suess, 1957
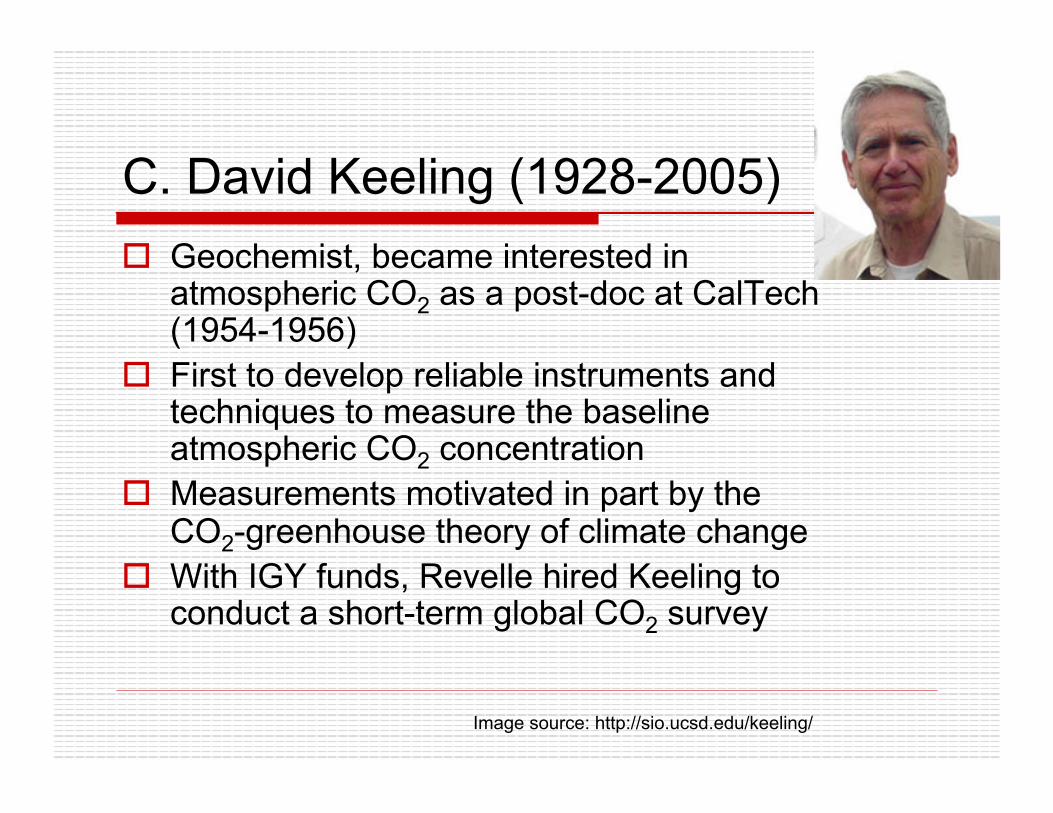
C. David Keeling (1928-2005) o Geochemist, became interested in
atmospheric CO2 as a post-doc at CalTech (1954-1956)
o First to develop reliable instruments and techniques to measure the baseline atmospheric CO2 concentration
o Measurements motivated in part by the CO2-greenhouse theory of climate change
o With IGY funds, Revelle hired Keeling to conduct a short-term global CO2 survey
Image source: http://sio.ucsd.edu/keeling/
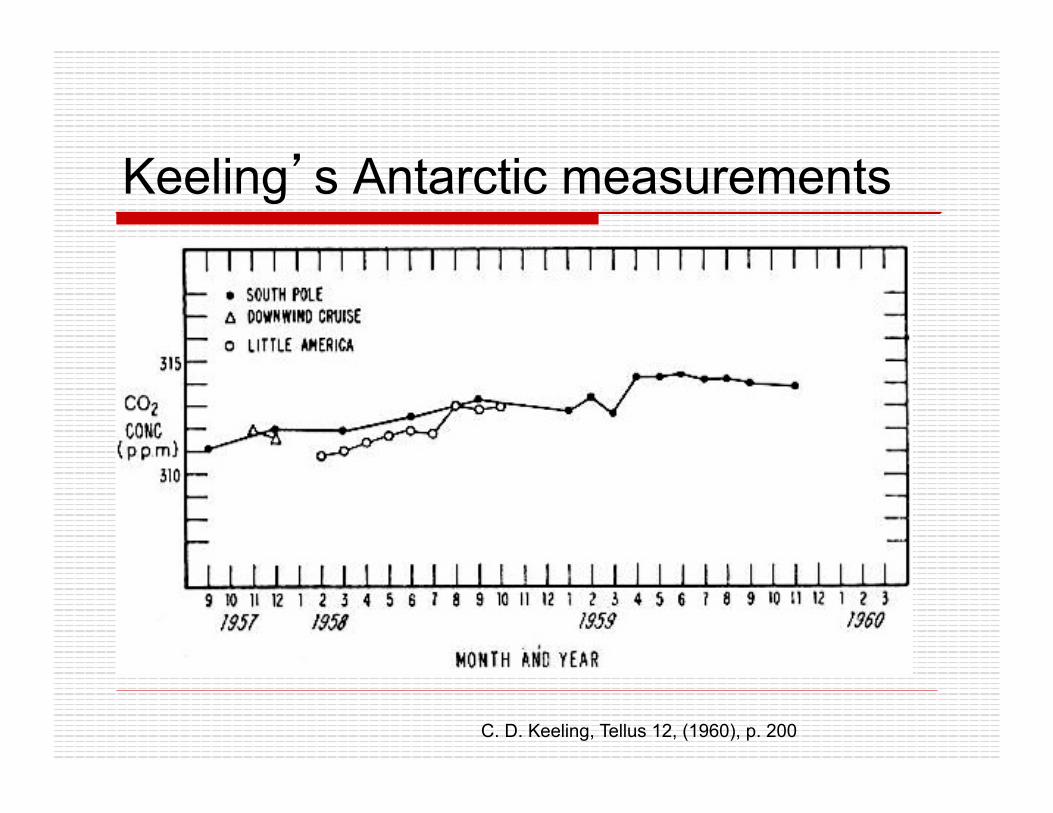
Keeling’s Antarctic measurements
C. D. Keeling, Tellus 12, (1960), p. 200
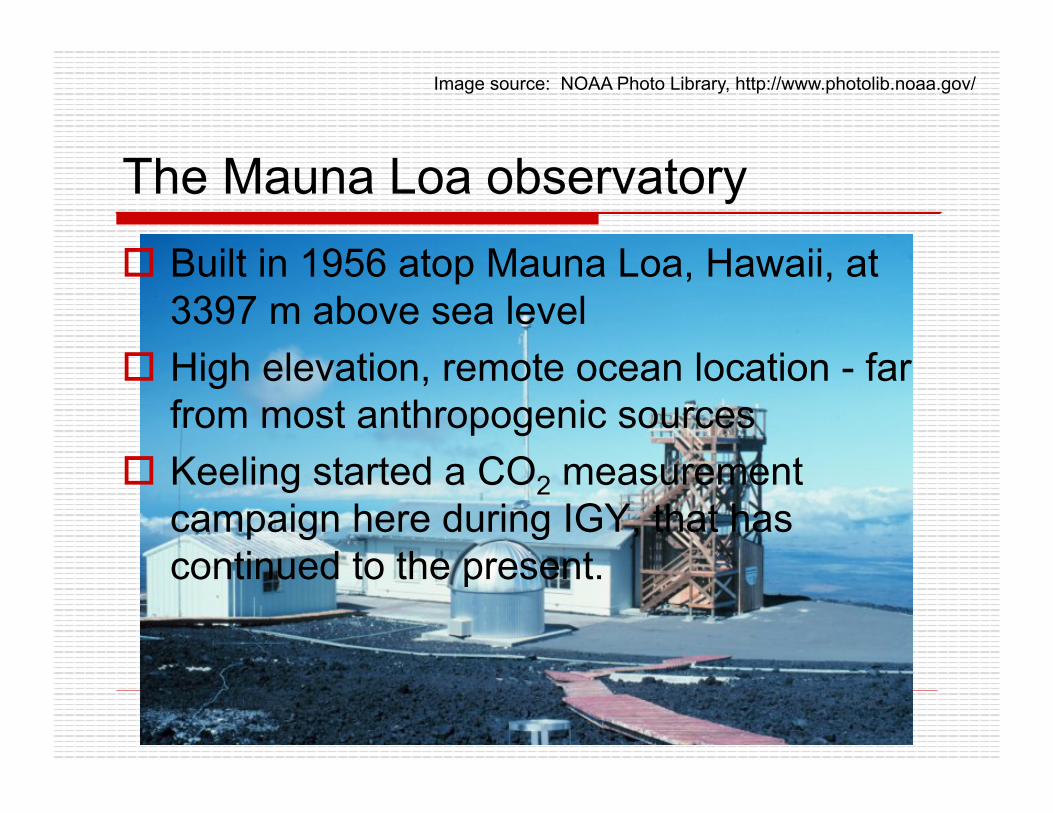
The Mauna Loa observatory o Built in 1956 atop Mauna Loa, Hawaii, at
3397 m above sea level o High elevation, remote ocean location - far
from most anthropogenic sources o Keeling started a CO2 measurement
campaign here during IGY, that has continued to the present.
Image source: NOAA Photo Library, http://www.photolib.noaa.gov/
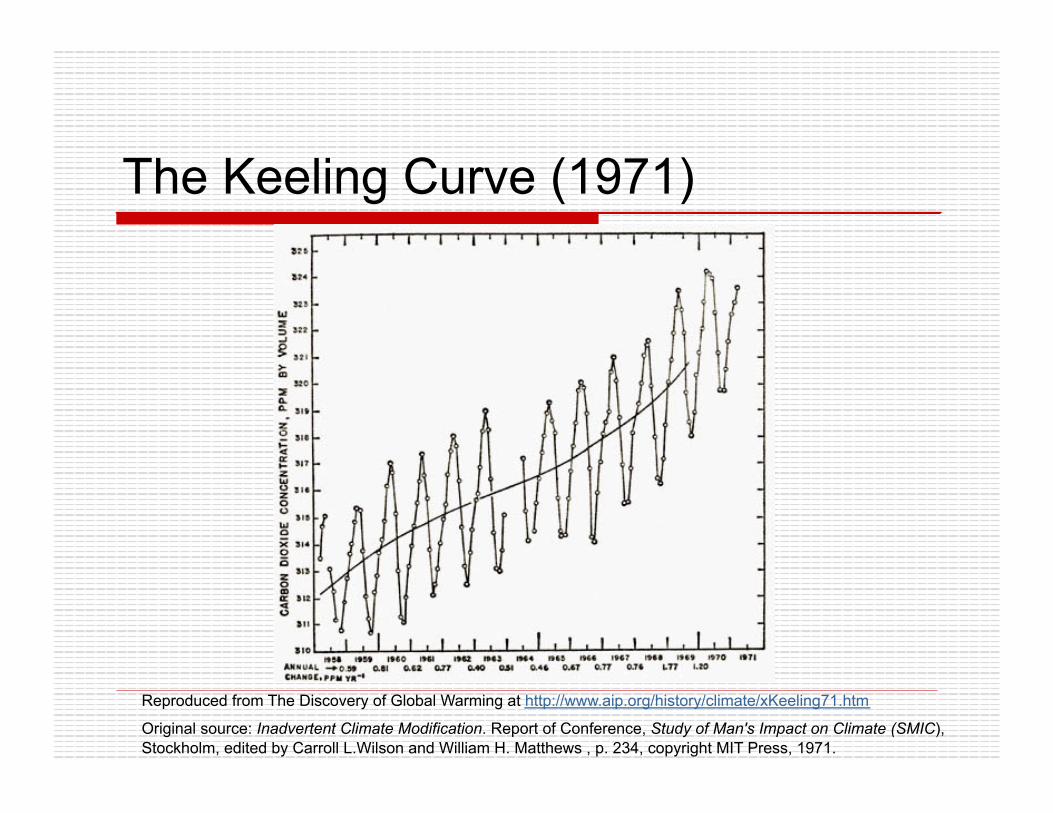
The Keeling Curve (1971)
Reproduced from The Discovery of Global Warming at http://www.aip.org/history/climate/xKeeling71.htm
Original source: Inadvertent Climate Modification. Report of Conference, Study of Man's Impact on Climate (SMIC), Stockholm, edited by Carroll L.Wilson and William H. Matthews , p. 234, copyright MIT Press, 1971.
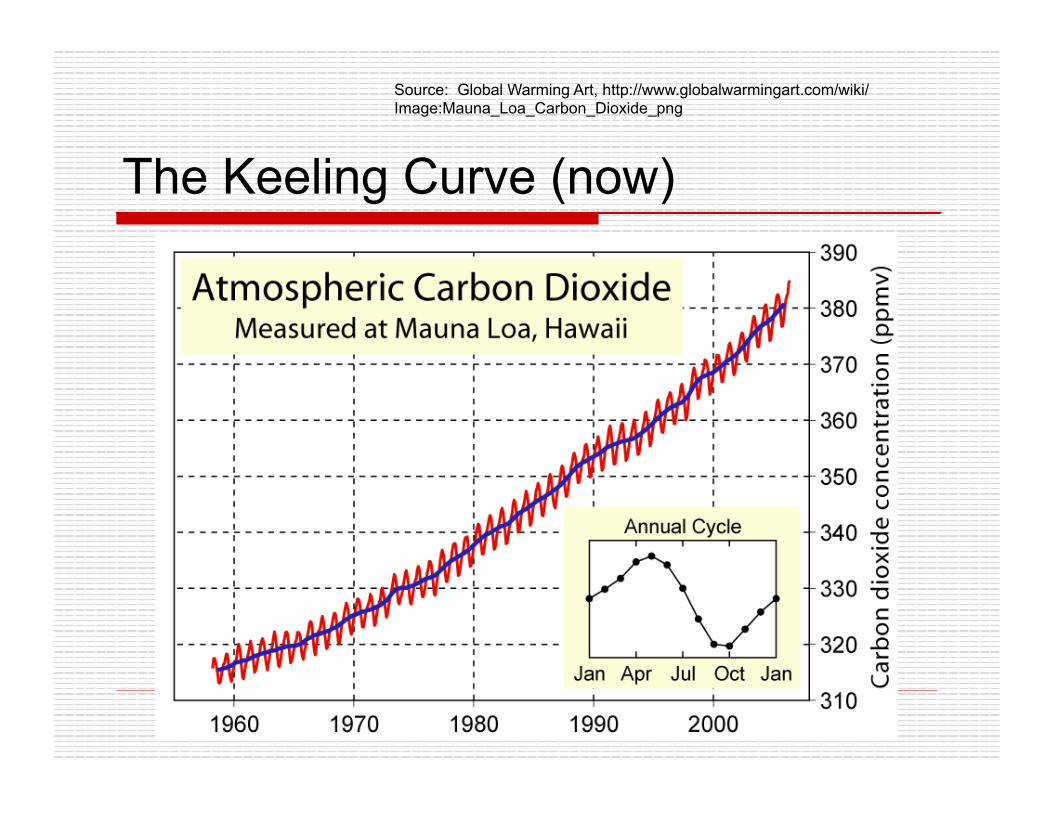
The Keeling Curve (now)
Source: Global Warming Art, http://www.globalwarmingart.com/wiki/Image:Mauna_Loa_Carbon_Dioxide_png
So now we know o As Keeling’s measurements continued,
there could no longer be any doubt that anthropogenic CO2 was accumulating in the atmosphere.
o The possibility of a greenhouse warming had to be taken seriously
o Meanwhile, progress was being made on the theoretical side, helped tremendously by the invention of computers
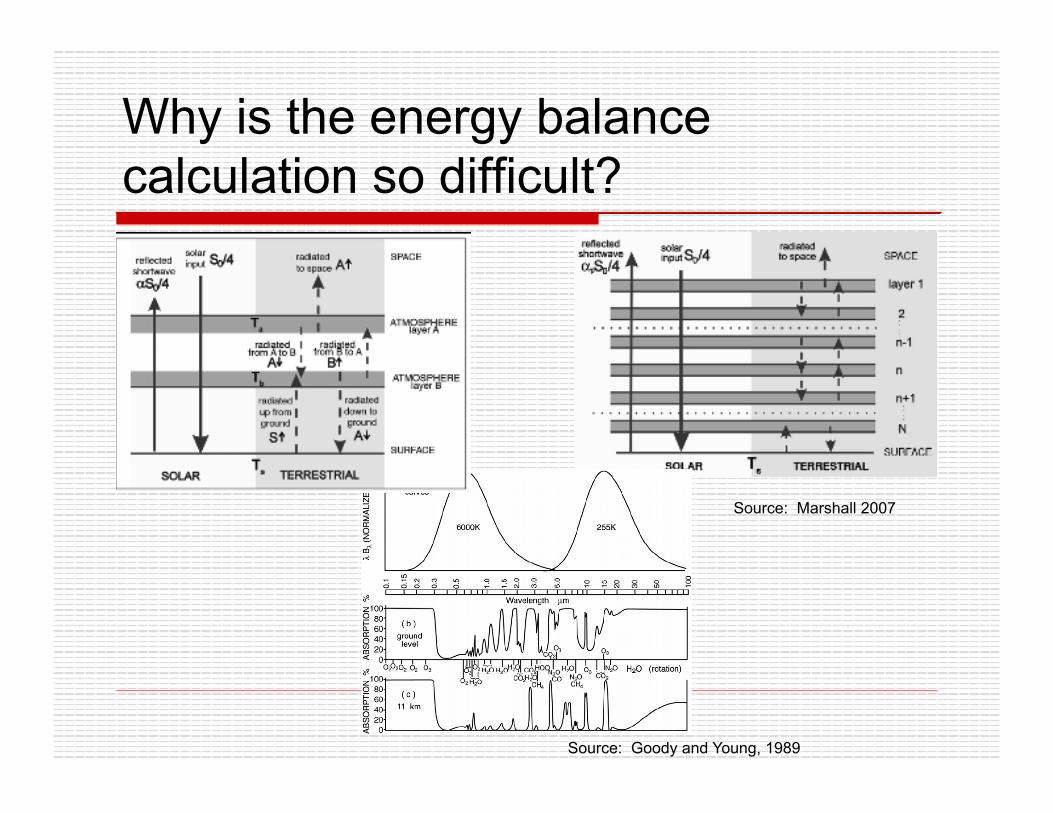
Why is the energy balance calculation so difficult?
Source: Goody and Young, 1989
Source: Marshall 2007
Why is the energy balance calculation so difficult? o Details of absorption spectra depended on
quantum mechanics; not worked out until WWII era. n 1956: Gilbert Plass made the first accurate calculation
of vertical radiative transfer; CO2 shown to have warming effect
o Need to know vertical distribution of absorbing gases, which depends on temperature (water vapor feedback) n 1963: Fritz Möller publishes a similar calculation, but
taking account of the water vapor feedback; model is extremely sensitive to CO2
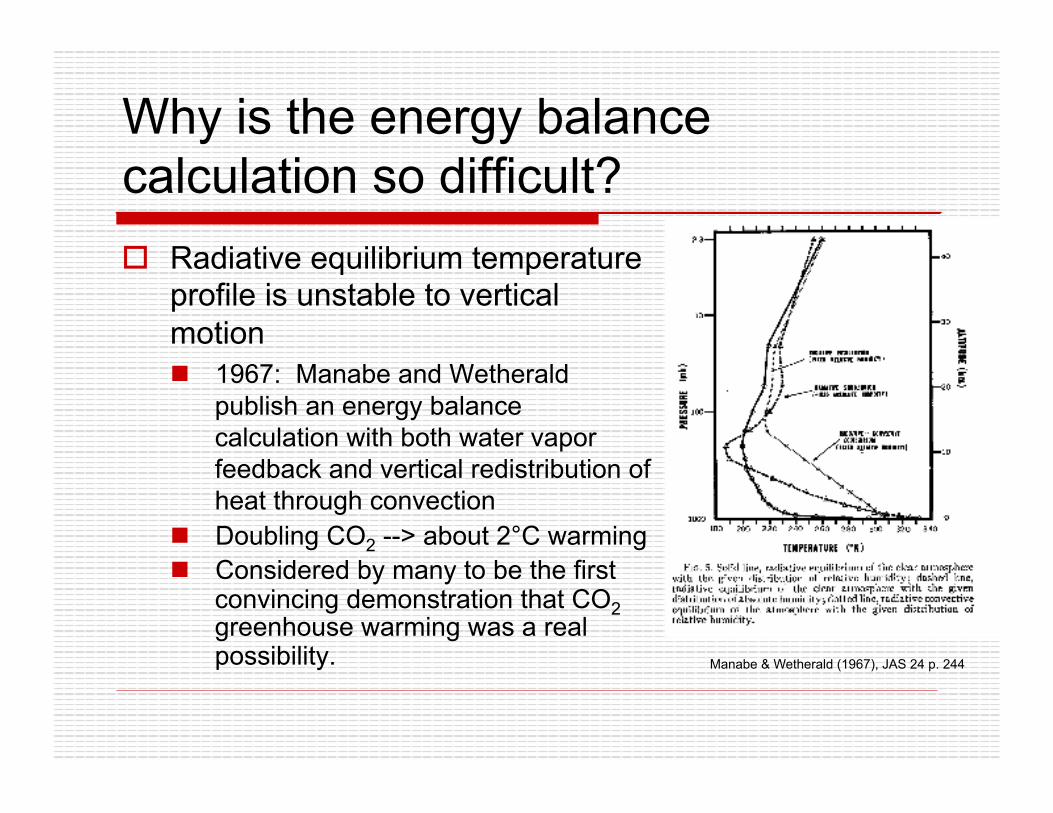
Why is the energy balance calculation so difficult? o Radiative equilibrium temperature
profile is unstable to vertical motion n 1967: Manabe and Wetherald
publish an energy balance calculation with both water vapor feedback and vertical redistribution of heat through convection
n Doubling CO2 --> about 2°C warming n Considered by many to be the first
convincing demonstration that CO2 greenhouse warming was a real possibility. Manabe & Wetherald (1967), JAS 24 p. 244
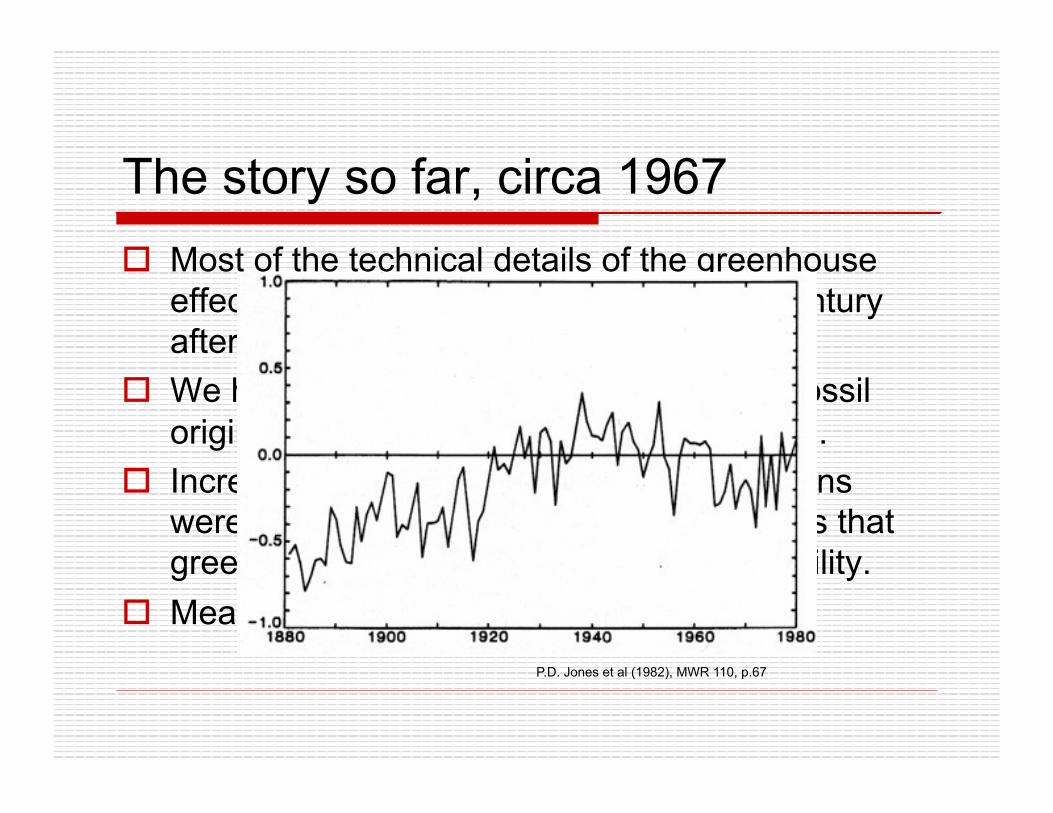
The story so far, circa 1967 o Most of the technical details of the greenhouse
effect were understood by the 1960s, a century after its discovery by Tyndall.
o We had convincing evidence that CO2 of fossil origin was accumulating in the atmosphere.
o Increasingly sophisticated model calculations were beginning to convince many scientists that greenhouse warming was a distinct possibility.
o Meanwhile, the climate was cooling. P.D. Jones et al (1982), MWR 110, p.67
CO2 and the ice age story o In 1897, inspired by Arrhenius’s calculation, T.C. Chamberlin
publishes a theory of the ice ages as a self-oscillating cycle driven by CO2 feedbacks (involving, among other things, the temperature dependence of the chemical weathering of rocks and the increased solubility of CO2 in cold oceans)
o This sort of CO2 ice age theory was pitted against the astronomical theory championed first by James Croll in the 1860s, and later by Milutin Milankovic in the early 20th century.
o In more recent times, ice cores and ocean sediment cores have given us a very detailed picture of the ice ages.
o The debate has not gone away: CO2 and orbital changes both seem to be involved in ice age cycles.
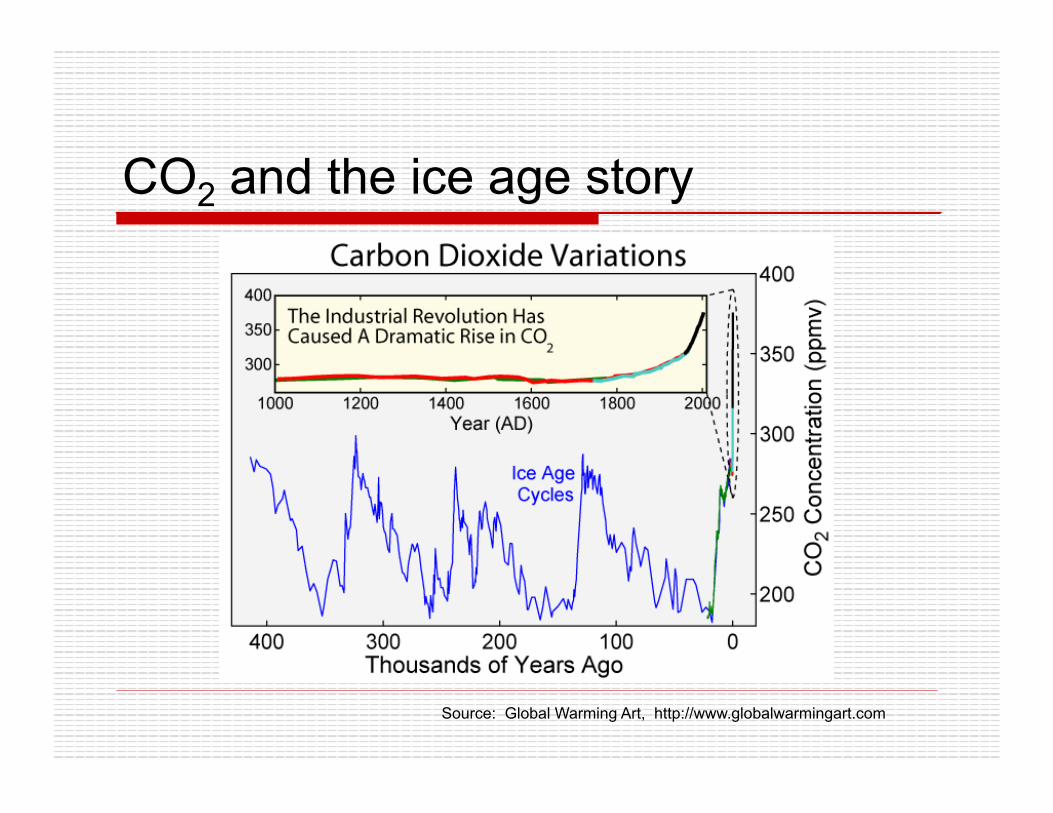
CO2 and the ice age story
Source: Global Warming Art, http://www.globalwarmingart.com
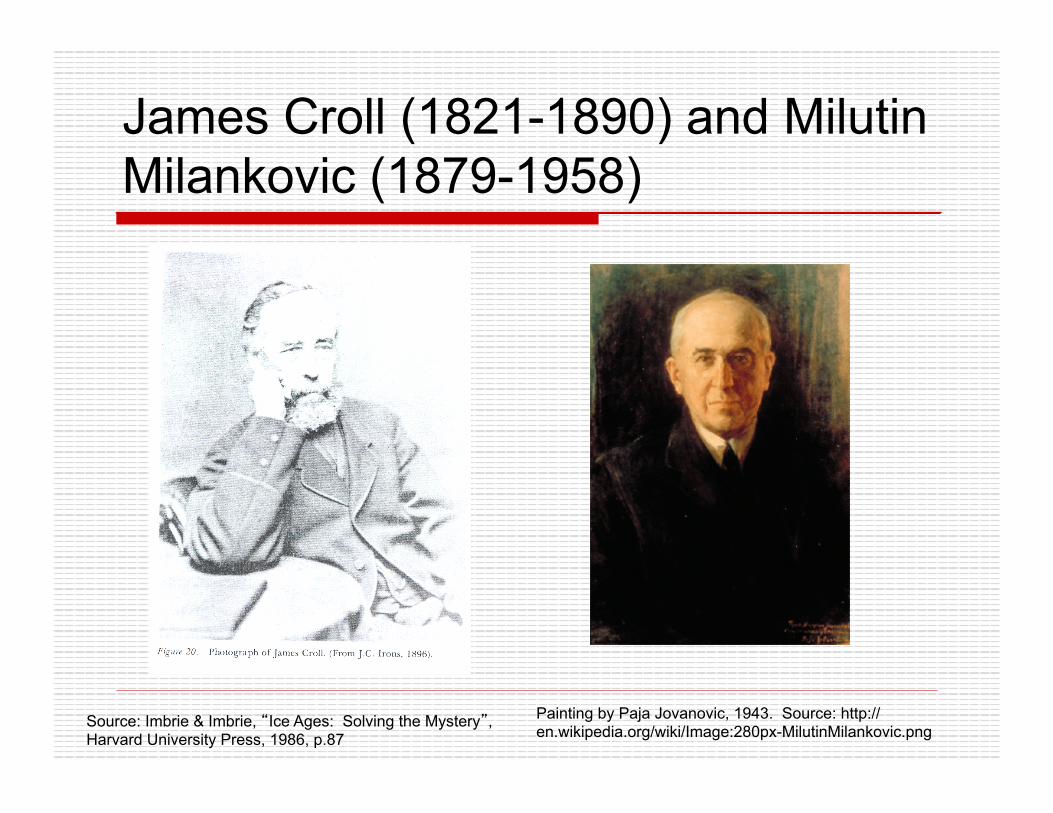
James Croll (1821-1890) and Milutin Milankovic (1879-1958)
Source: Imbrie & Imbrie, “Ice Ages: Solving the Mystery”, Harvard University Press, 1986, p.87
Painting by Paja Jovanovic, 1943. Source: http://en.wikipedia.org/wiki/Image:280px-MilutinMilankovic.png
For more information o “The discovery of global warming” by
Spencer R. Weart, Harvard University Press, 2003
o Weart’s excellent website http://www.aip.org/history/climate/
o “Ice Ages: Solving the Mystery” by Imbrie and Imbrie, Harvard University Press, 1986
Please join us tomorrow for Part 2
Daniel Enderton will talk about the observations of climate change, and what can and can’t say about the role of greenhouse warming in those changes.
1 pm, E40-298