
Lecture 5: Hypothesis Testingeckel/biostat2/slides/lecture5.pdfA note about approaches to two-sided...
29
Transcript of Lecture 5: Hypothesis Testingeckel/biostat2/slides/lecture5.pdfA note about approaches to two-sided...
Recap: Statistical Inference
Estimation
Point estimationConfidence intervals
Hypothesis Testing
Application to means of distributions for continuous variables,extension to proportionsRelation between confidence intervals and hypothesis testingP-values, Type I error (α), Type II error (β), Power ((1− β))
2 / 29
Basic steps of Hypothesis Testing
Define the null hypothesis, H0
Define the alternative hypothesis, Ha, where Ha is usually ofthe form “not H0”
Define the type I error (probability of falsely rejecting thenull), α, usually 0.05
Calculate the test statistic
Calculate the p-value (probability of getting a result ‘as ormore extreme’ than observed if the null is true)
If the p-value is ≤ α, reject H0
Otherwise, fail to reject H0
3 / 29
Hypothesis test for a single mean I
Birthweight example
Assume a population of normally distributed birth weightswith a known standard deviation, σ = 1000 grams
Birth weights are obtained on a sample of 10 infants; thesample mean is calculated as 2500 grams
Question: Is the mean birth weight in this population differentfrom 3000 grams?
Set up a two-sided test of
H0 : µ = 3000
vs. Ha : µ 6= 3000
Let α = 0.05 denote a 5% significance level
4 / 29
Hypothesis test for a single mean II
Calculate the test statistic:
zobs =X̄ − µ0
σ/√
n=
2500− 3000
1000/√
10= −1.58
What does this mean? Our observed mean is 1.58 standarderrors below the hypothesized mean
The test statistic is the standardized value of our dataassuming the null hypothesis is true
Question: If the true mean is 3000 grams, is our observedsample mean of 2500 “common” or is this value unlikely tooccur?
5 / 29
Hypothesis test for a single mean III
Calculate the p-value to answer our question:
p-value = P(Z ≤ −|zobs |)+P(Z ≥ |zobs |) = 2×0.057 = 0.114
If the true mean is 3000 grams, our data or data moreextreme than ours would occur in 11 out of 100 studies(of the same size, n=10)
In other words, in 11 out of 100 studies with sample sizen = 10, just by chance we are likely to observe a sample meanof 2500 or more extreme if the true mean is 3000 grams
What does this say about our hypothesis?
General guideline: if p-value ≤ α, then reject H0
Conclusion: we fail to reject the null hypothesis since wechose α = 0.05 and our p-value is 0.114
6 / 29
A note about approaches to two-sided hypothesis testing
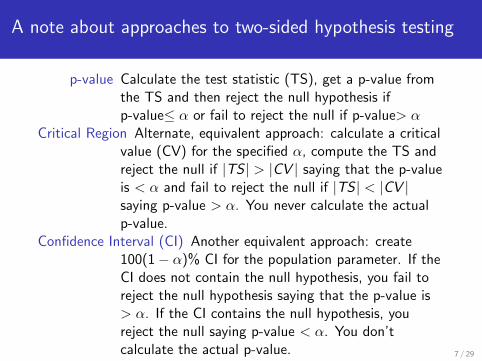
p-value Calculate the test statistic (TS), get a p-value fromthe TS and then reject the null hypothesis ifp-value≤ α or fail to reject the null if p-value> α
Critical Region Alternate, equivalent approach: calculate a criticalvalue (CV) for the specified α, compute the TS andreject the null if |TS | > |CV | saying that the p-valueis < α and fail to reject the null if |TS | < |CV |saying p-value > α. You never calculate the actualp-value.
Confidence Interval (CI) Another equivalent approach: create100(1− α)% CI for the population parameter. If theCI does not contain the null hypothesis, you fail toreject the null hypothesis saying that the p-value is> α. If the CI contains the null hypothesis, youreject the null saying p-value < α. You don’tcalculate the actual p-value. 7 / 29
Hypothesis test for a single mean: critical value
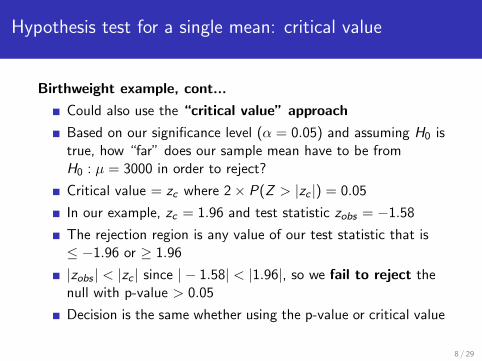
Birthweight example, cont...
Could also use the “critical value” approach
Based on our significance level (α = 0.05) and assuming H0 istrue, how “far” does our sample mean have to be fromH0 : µ = 3000 in order to reject?
Critical value = zc where 2× P(Z > |zc |) = 0.05
In our example, zc = 1.96 and test statistic zobs = −1.58
The rejection region is any value of our test statistic that is≤ −1.96 or ≥ 1.96
|zobs | < |zc | since | − 1.58| < |1.96|, so we fail to reject thenull with p-value > 0.05
Decision is the same whether using the p-value or critical value
8 / 29
Hypothesis test for a single mean: confidence interval
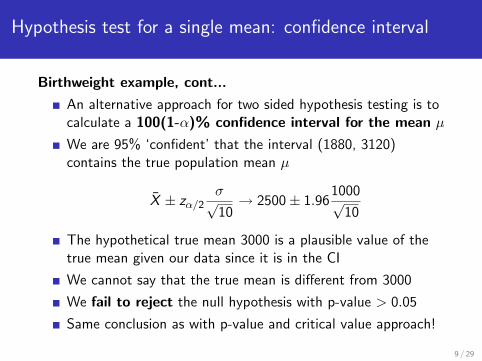
Birthweight example, cont...
An alternative approach for two sided hypothesis testing is tocalculate a 100(1-α)% confidence interval for the mean µ
We are 95% ‘confident’ that the interval (1880, 3120)contains the true population mean µ
X̄ ± zα/2σ√10→ 2500± 1.96
1000√10
The hypothetical true mean 3000 is a plausible value of thetrue mean given our data since it is in the CI
We cannot say that the true mean is different from 3000
We fail to reject the null hypothesis with p-value > 0.05
Same conclusion as with p-value and critical value approach!
9 / 29
General rule on the 100(1-α)% confidence intervalapproach to two-sided hypothesis testing
If the null hypothesis value is not contained in the confidenceinterval, you reject the null hypothesis with p-value≤ α
If the null hypothesis value is contained in the confidenceinterval, you fail to reject the null hypothesis with p-value> α
Note: The confidence interval approach doesn’t work withone-sided tests but the critical value and p-value approaches do
10 / 29
P-values
Definition: The p-value for a hypothesis test is the probability ofobtaining a value of the test statistic as or more extreme than theobserved test statistic when the null hypothesis is true
The rejection region is determined by α, the desired level ofsignificance, or probability of committing a type I error or theprobability of falsely rejecting the null
Reporting the p-value associated with a test gives anindication of how common or rare the computed value of thetest statistic is, given that H0 is true
We often use zobs to denote the computed value of the teststatistic
11 / 29
Choosing the correct test statistic
Depends on population sd (σ) assumption and sample size
The test statistic depends on your assumptions on σ
When σ is known, we have a standard normal test statistic
When σ is unknown and
our sample size is relatively small, the test statistic has at-distributionour sample size is large, we have a standard normal teststatistic (CLT)
The only difference in the procedure is the calculation of thep-value or rejection region uses a t- instead of normal distribution
12 / 29
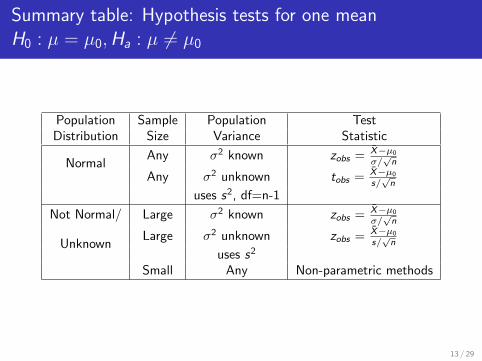
Summary table: Hypothesis tests for one meanH0 : µ = µ0,Ha : µ 6= µ0
Population Sample Population TestDistribution Size Variance Statistic
NormalAny σ2 known zobs = X̄−µ0
σ/√
n
Any σ2 unknown tobs = X̄−µ0
s/√
n
uses s2, df=n-1
Not Normal/ Large σ2 known zobs = X̄−µ0
σ/√
n
UnknownLarge σ2 unknown zobs = X̄−µ0
s/√
n
uses s2
Small Any Non-parametric methods
13 / 29
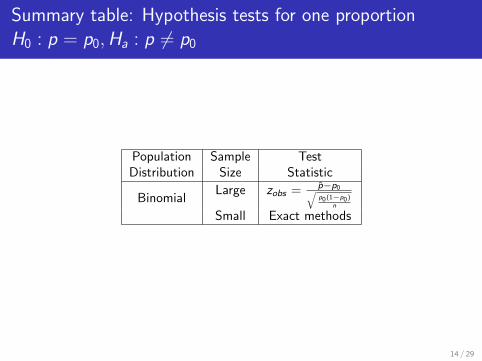
Summary table: Hypothesis tests for one proportionH0 : p = p0,Ha : p 6= p0
Population Sample TestDistribution Size Statistic
BinomialLarge zobs = p̂−p0√
p0(1−p0)n
Small Exact methods
14 / 29
Moving from one to two means
So far, we’ve been looking at only a single mean. What happenswhen we want to compare the means in two groups?
We can compare two means by looking at the difference in themeans
Consider the question: is µ1 = µ2?This is equivalent to the question: is µ1 − µ2 = 0 ?
The work done for testing hypotheses about single meansextends to comparing two means
Assumptions about the two population standard deviationsdetermine the formula you’ll use
15 / 29
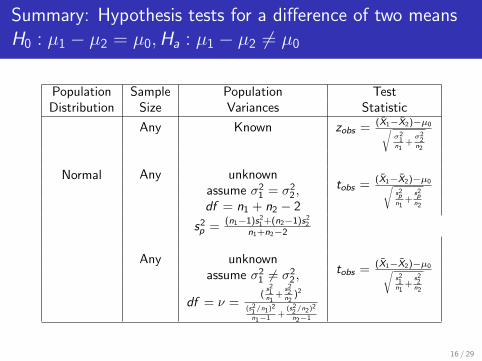
Summary: Hypothesis tests for a difference of two meansH0 : µ1 − µ2 = µ0,Ha : µ1 − µ2 6= µ0
Population Sample Population TestDistribution Size Variances Statistic
Normal
Any Known zobs = (X̄1−X̄2)−µ0√σ2
1n1
+σ2
2n2
Any unknowntobs = (X̄1−X̄2)−µ0√
s2p
n1+
s2p
n2
assume σ21 = σ2
2 ,df = n1 + n2 − 2
s2p =
(n1−1)s21 +(n2−1)s2
2
n1+n2−2
Any unknowntobs = (X̄1−X̄2)−µ0√
s21
n1+
s22
n2
assume σ21 6= σ2
2 ,
df = ν =(
s21
n1+
s22
n2)2
(s21/n1)2
n1−1 +(s2
2/n2)2
n2−1
16 / 29
Example: Hypothesis test for difference of two means(two independent samples) I
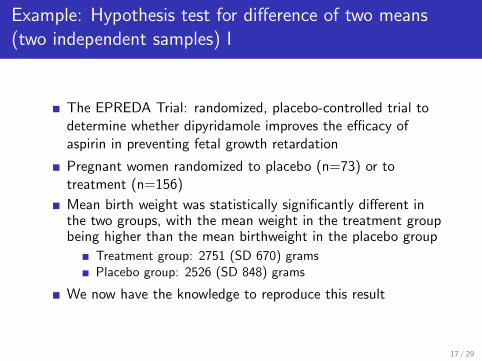
The EPREDA Trial: randomized, placebo-controlled trial todetermine whether dipyridamole improves the efficacy ofaspirin in preventing fetal growth retardation
Pregnant women randomized to placebo (n=73) or totreatment (n=156)
Mean birth weight was statistically significantly different inthe two groups, with the mean weight in the treatment groupbeing higher than the mean birthweight in the placebo group
Treatment group: 2751 (SD 670) gramsPlacebo group: 2526 (SD 848) grams
We now have the knowledge to reproduce this result
17 / 29
Example: Hypothesis test for difference of two means(two independent samples) II
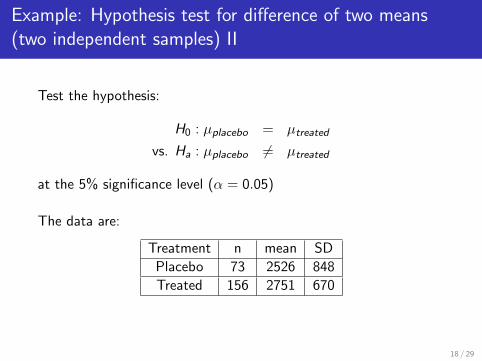
Test the hypothesis:
H0 : µplacebo = µtreated
vs. Ha : µplacebo 6= µtreated
at the 5% significance level (α = 0.05)
The data are:
Treatment n mean SD
Placebo 73 2526 848
Treated 156 2751 670
18 / 29
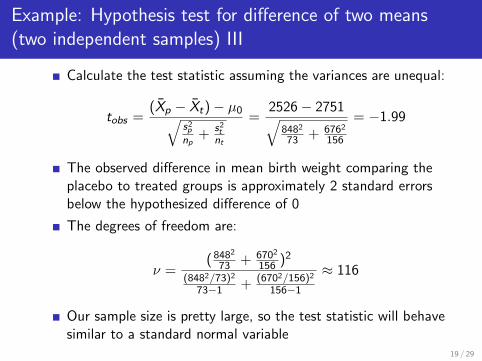
Example: Hypothesis test for difference of two means(two independent samples) III
Calculate the test statistic assuming the variances are unequal:
tobs =(X̄p − X̄t)− µ0√
s2p
np+ s2
tnt
=2526− 2751√
8482
73 + 6762
156
= −1.99
The observed difference in mean birth weight comparing theplacebo to treated groups is approximately 2 standard errorsbelow the hypothesized difference of 0
The degrees of freedom are:
ν =( 8482
73 + 6702
156 )2
(8482/73)2
73−1 + (6702/156)2
156−1
≈ 116
Our sample size is pretty large, so the test statistic will behavesimilar to a standard normal variable
19 / 29
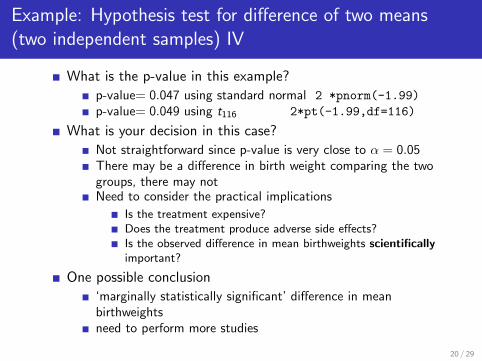
Example: Hypothesis test for difference of two means(two independent samples) IV
What is the p-value in this example?
p-value= 0.047 using standard normal 2 *pnorm(-1.99)p-value= 0.049 using t116 2*pt(-1.99,df=116)
What is your decision in this case?
Not straightforward since p-value is very close to α = 0.05There may be a difference in birth weight comparing the twogroups, there may notNeed to consider the practical implications
Is the treatment expensive?Does the treatment produce adverse side effects?Is the observed difference in mean birthweights scientificallyimportant?
One possible conclusion
‘marginally statistically significant’ difference in meanbirthweightsneed to perform more studies
20 / 29
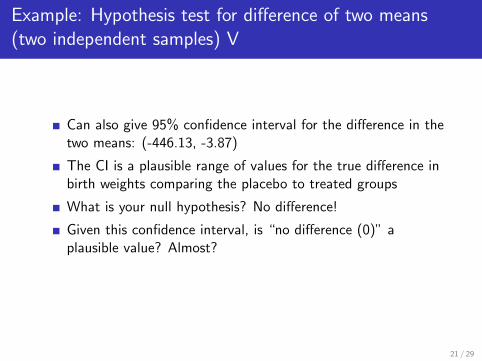
Example: Hypothesis test for difference of two means(two independent samples) V
Can also give 95% confidence interval for the difference in thetwo means: (-446.13, -3.87)
The CI is a plausible range of values for the true difference inbirth weights comparing the placebo to treated groups
What is your null hypothesis? No difference!
Given this confidence interval, is “no difference (0)” aplausible value? Almost?
21 / 29
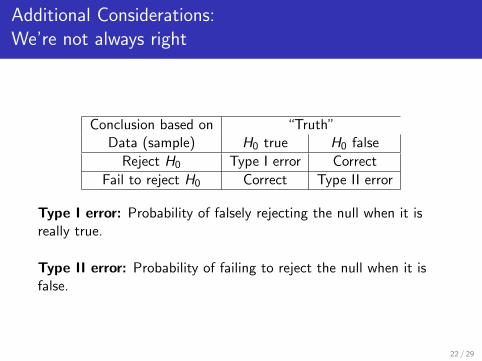
Additional Considerations:We’re not always right
Conclusion based on “Truth”Data (sample) H0 true H0 false
Reject H0 Type I error Correct
Fail to reject H0 Correct Type II error
Type I error: Probability of falsely rejecting the null when it isreally true.
Type II error: Probability of failing to reject the null when it isfalse.
22 / 29
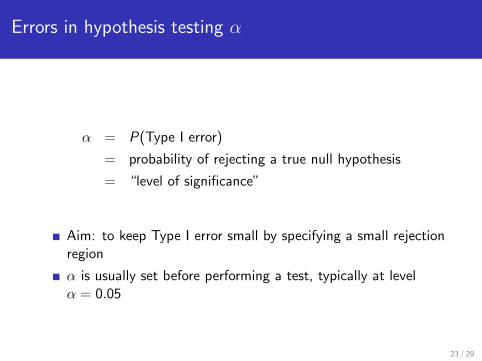
Errors in hypothesis testing α
α = P(Type I error)
= probability of rejecting a true null hypothesis
= “level of significance”
Aim: to keep Type I error small by specifying a small rejectionregion
α is usually set before performing a test, typically at levelα = 0.05
23 / 29
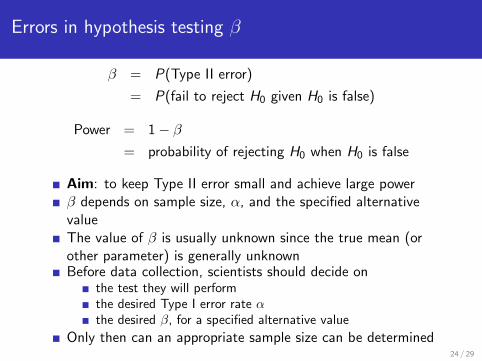
Errors in hypothesis testing β
β = P(Type II error)
= P(fail to reject H0 given H0 is false)
Power = 1− β= probability of rejecting H0 when H0 is false
Aim: to keep Type II error small and achieve large powerβ depends on sample size, α, and the specified alternativevalueThe value of β is usually unknown since the true mean (orother parameter) is generally unknownBefore data collection, scientists should decide on
the test they will performthe desired Type I error rate αthe desired β, for a specified alternative value
Only then can an appropriate sample size can be determined24 / 29
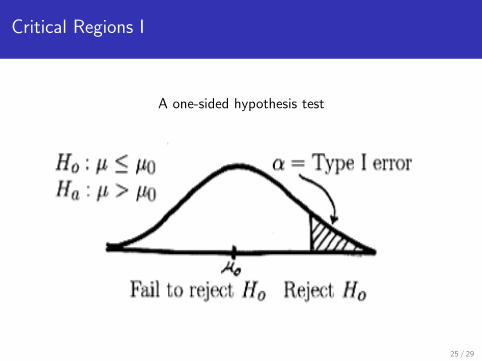
Critical Regions I
A one-sided hypothesis test
25 / 29
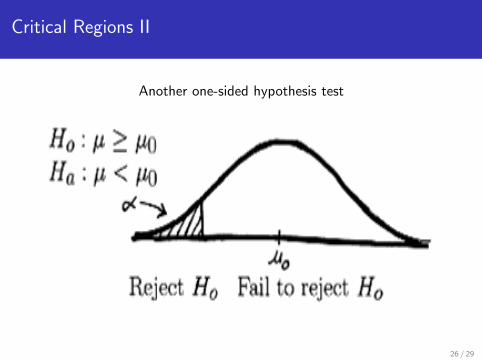
Critical Regions II
Another one-sided hypothesis test
26 / 29
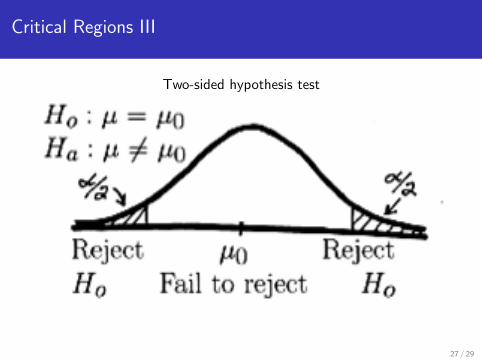
Critical Regions III
Two-sided hypothesis test
27 / 29
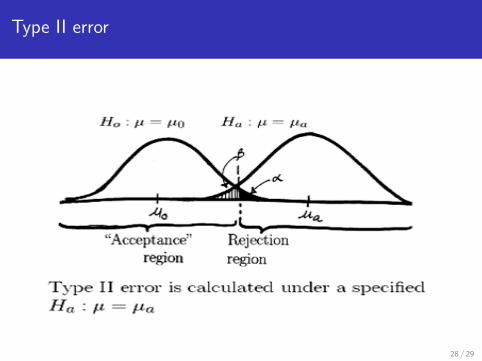
Type II error
28 / 29
Summary of Lecture 5
Today we’ve finished talking about a key foundational topic forstatistical analysis - Statistical Inference
Confidence Intervals (CI)
Hypothesis testing
Relation between CI and hypothesis testing
Type I error (α), Type II error (β), Power ((1− β))
You will find these topics mentioned in (nearly) every scientificjournal article you read!
29 / 29