MARE 250 Dr. Jason Turner Hypothesis Testing. This is not a Test… Hypothesis testing – used for...
22
MARE 250 Dr. Jason Turner Hypothesis Testing
-
date post
22-Dec-2015 -
Category
Documents
-
view
227 -
download
3
Transcript of MARE 250 Dr. Jason Turner Hypothesis Testing. This is not a Test… Hypothesis testing – used for...
MARE 250 Dr. Jason Turner
Hypothesis Testing
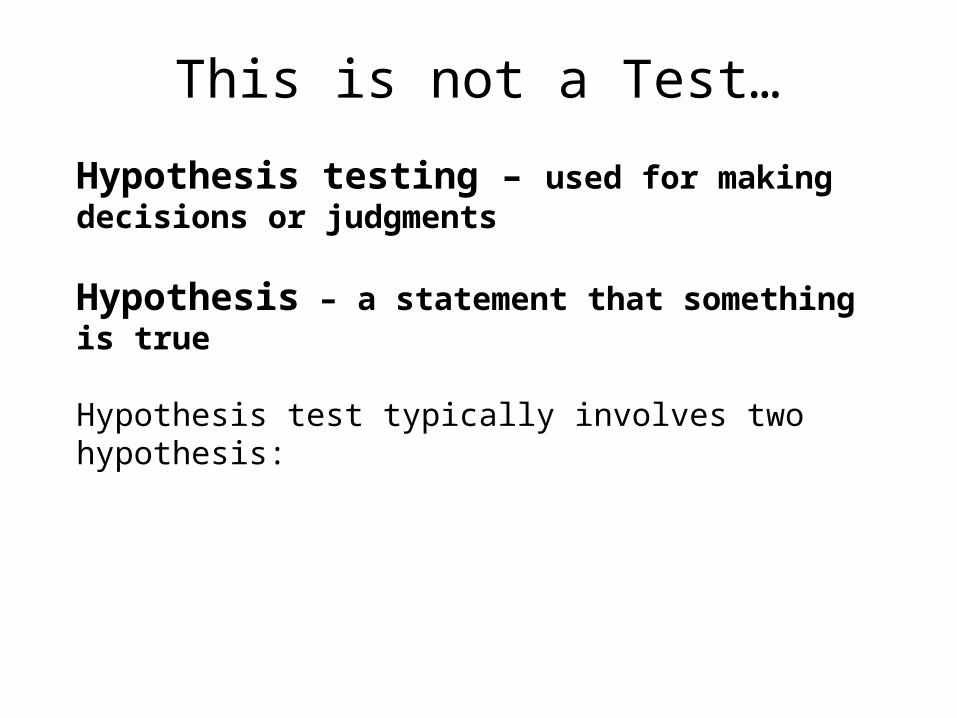
This is not a Test…
Hypothesis testing – used for making decisions or judgments
Hypothesis – a statement that something is true
Hypothesis test typically involves two hypothesis:
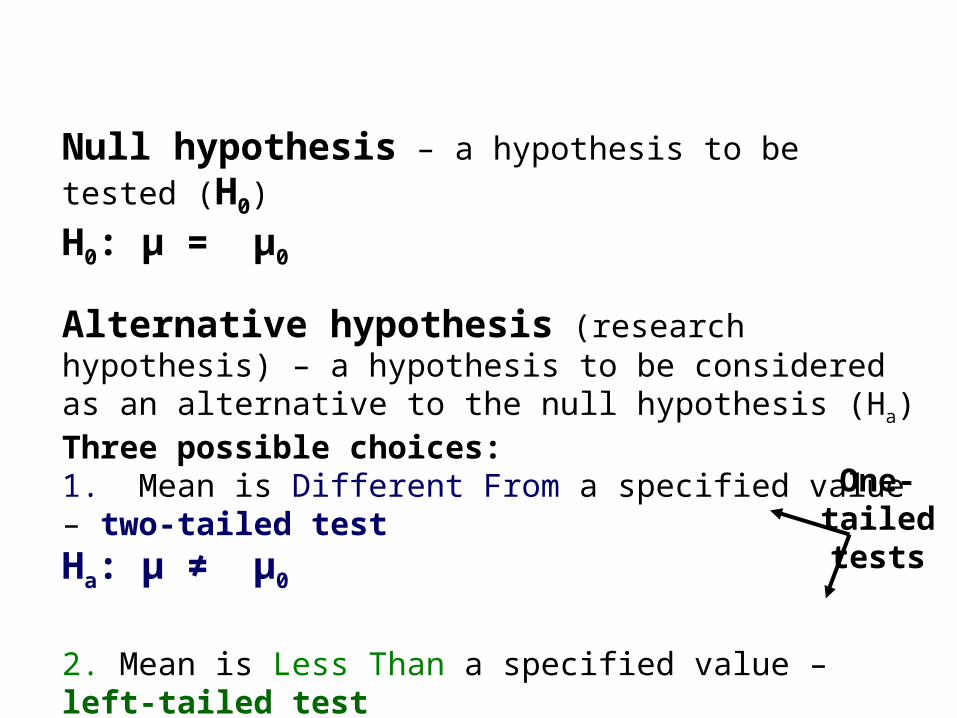
Null hypothesis – a hypothesis to be tested (H0)
H0: μ = μ0
Alternative hypothesis (research hypothesis) – a hypothesis to be considered as an alternative to the null hypothesis (Ha)Three possible choices:1. Mean is Different From a specified value – two-tailed testHa: μ ≠ μ0
2. Mean is Less Than a specified value – left-tailed testHa: μ < μ0
3. Mean is Greater Than a specified value – right-tailed testHa: μ > μ0
One-tailed tests
For Example…
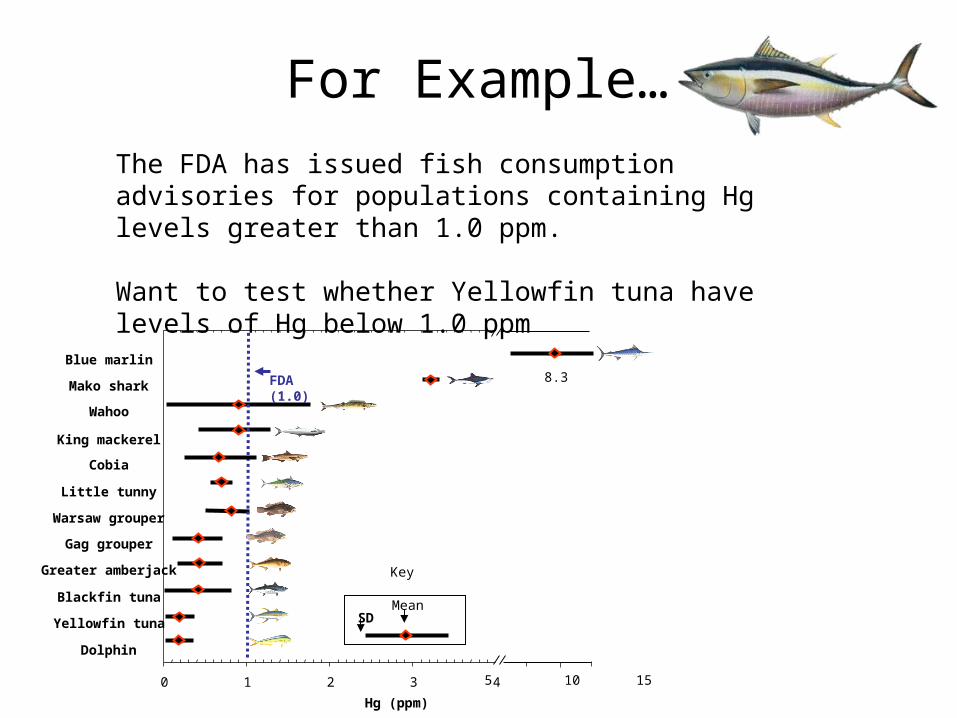
The FDA has issued fish consumption advisories for populations containing Hg levels greater than 1.0 ppm.
Want to test whether Yellowfin tuna have levels of Hg below 1.0 ppm
0 1 2 3 4
Blue marlin
Mako shark
Little tunny
Warsaw grouper
Greater amberjack
Blackfin tuna
Yellowfin tuna
Dolphin
5 10 15
8.3
Key
Mean
FDA(1.0)
Wahoo
King mackerel
Cobia
Gag grouper
Hg (ppm)
SD
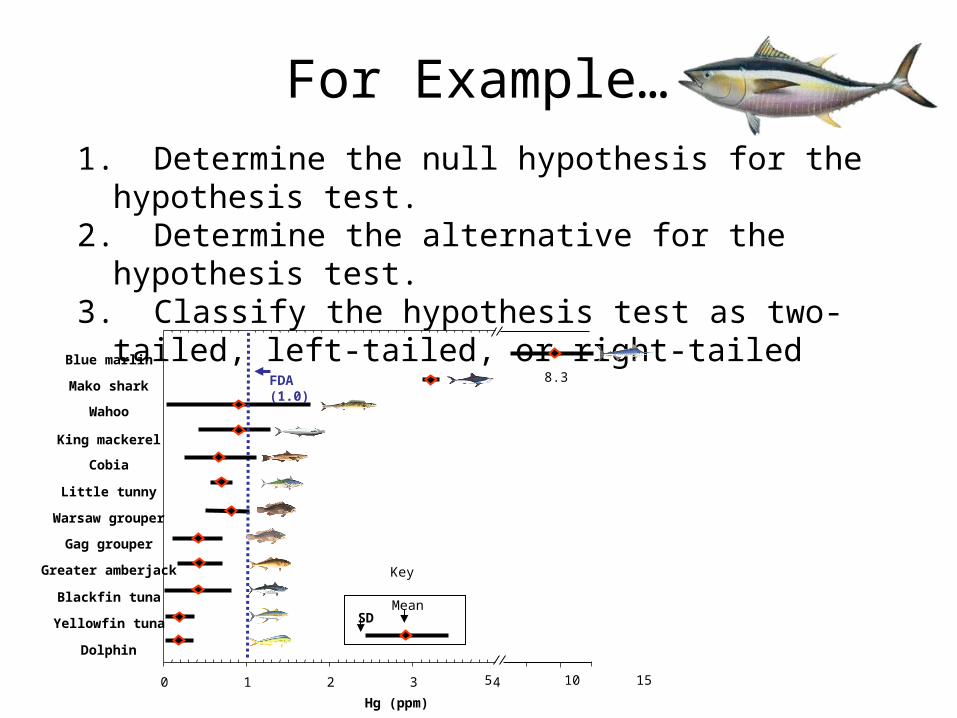
For Example…1. Determine the null hypothesis for the hypothesis test.2. Determine the alternative for the hypothesis test.3. Classify the hypothesis test as two-tailed, left-tailed,
or right-tailed
0 1 2 3 4
Blue marlin
Mako shark
Little tunny
Warsaw grouper
Greater amberjack
Blackfin tuna
Yellowfin tuna
Dolphin
5 10 15
8.3
Key
Mean
FDA(1.0)
Wahoo
King mackerel
Cobia
Gag grouper
Hg (ppm)
SD
For Example…One Sample t-test
1. The null hypothesis for this test is:
“the mean Hg level for yellowfin tuna equals the FDA level of 1.0 ppm”
H0: μ = 1.0 ppm
2. The alternative for the hypothesis test is:
“the mean Hg level for yellowfin tuna is less than 1.0 ppm”
Ha: μ < 1.0 ppm
3. The hypothesis test is left-tailed because the less-than-sign (<) appears in the alternative hypothesis
Hypothesis Testing for the Rest of UsHypothesis tests for one population mean when σ is unknown
Hypothesis Testing for Two Means
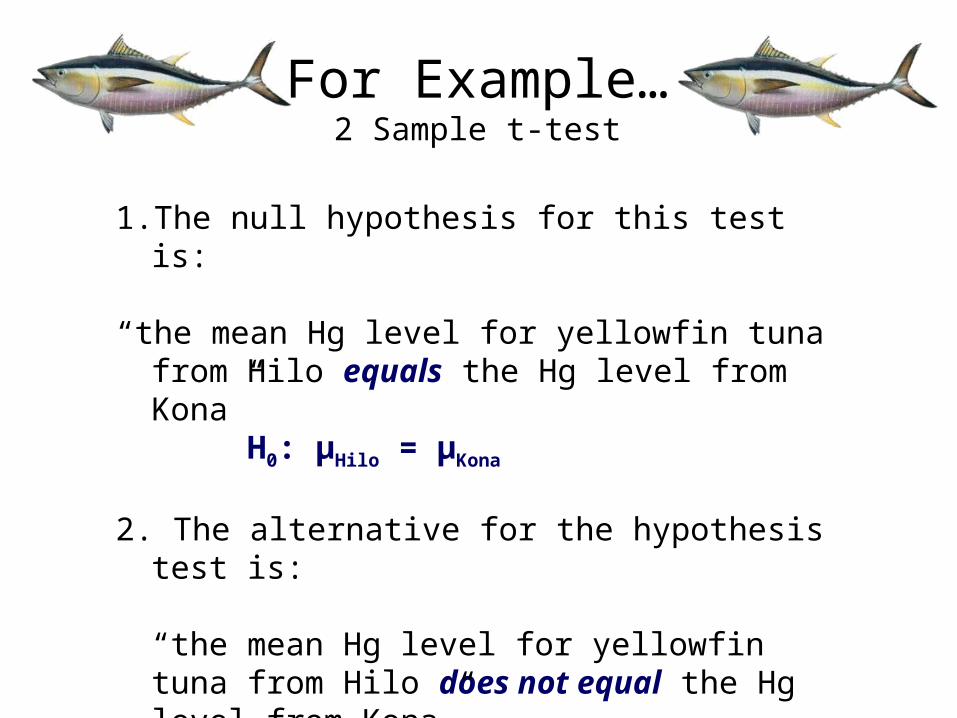
For Example…2 Sample t-test
1. The null hypothesis for this test is:
“the mean Hg level for yellowfin tuna from Hilo equals the Hg level from Kona”
H0: μHilo = μKona
2. The alternative for the hypothesis test is:
“the mean Hg level for yellowfin tuna from Hilo does not equal the Hg level from Kona”
H0: μHilo = μKona
Hold on, I have to pP-value approach – indicates how likely (or unlikely) the observation of the value obtained for the test statistic would be if the null hypothesis is true
It basically gives you odds that you sample test is a correct representation of your population
Didn’t you go before we leftP-value – equals the smallest significance level at which the null hypothesis can be rejected - the smallest significance level for which the observed sample data results in rejection of H0
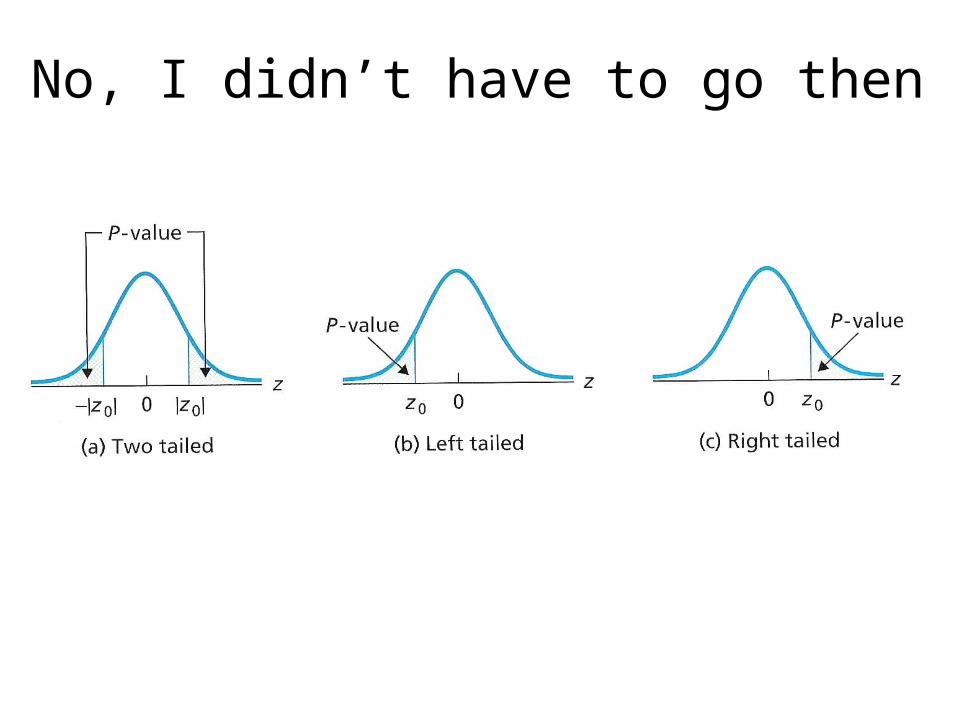
No, I didn’t have to go then
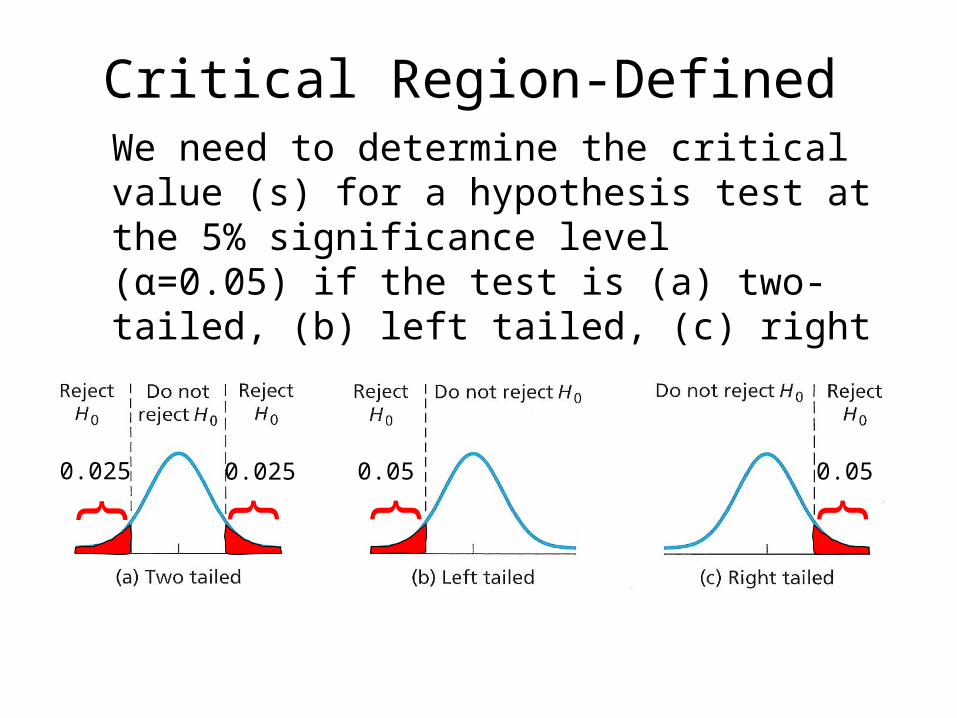
Critical Region-DefinedWe need to determine the critical value (s) for a hypothesis test at the 5% significance level (α=0.05) if the test is (a) two-tailed, (b) left tailed, (c) right tailed
{0.025 0.025{ { {0.05 0.05
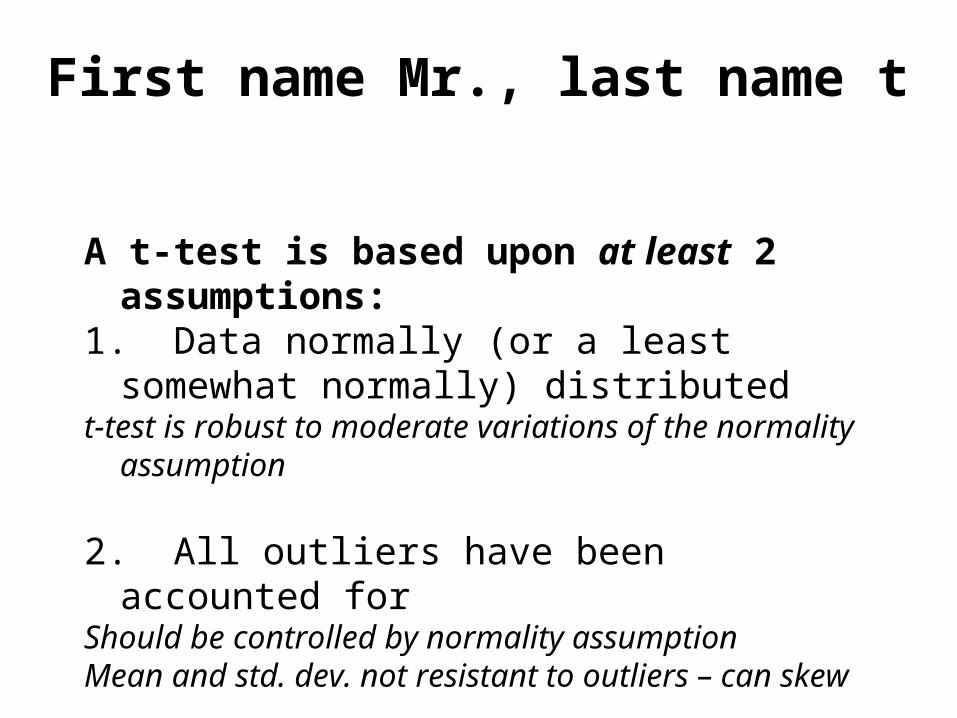
First name Mr., last name t
A t-test is based upon at least 2 assumptions:1. Data normally (or a least somewhat normally)
distributedt-test is robust to moderate variations of the normality
assumption
2. All outliers have been accounted forShould be controlled by normality assumptionMean and std. dev. not resistant to outliers – can skew
To ASSUME is to make an…
Four assumptions for t-test hypothesis testing:

Let Us Review…

Let Us Review…
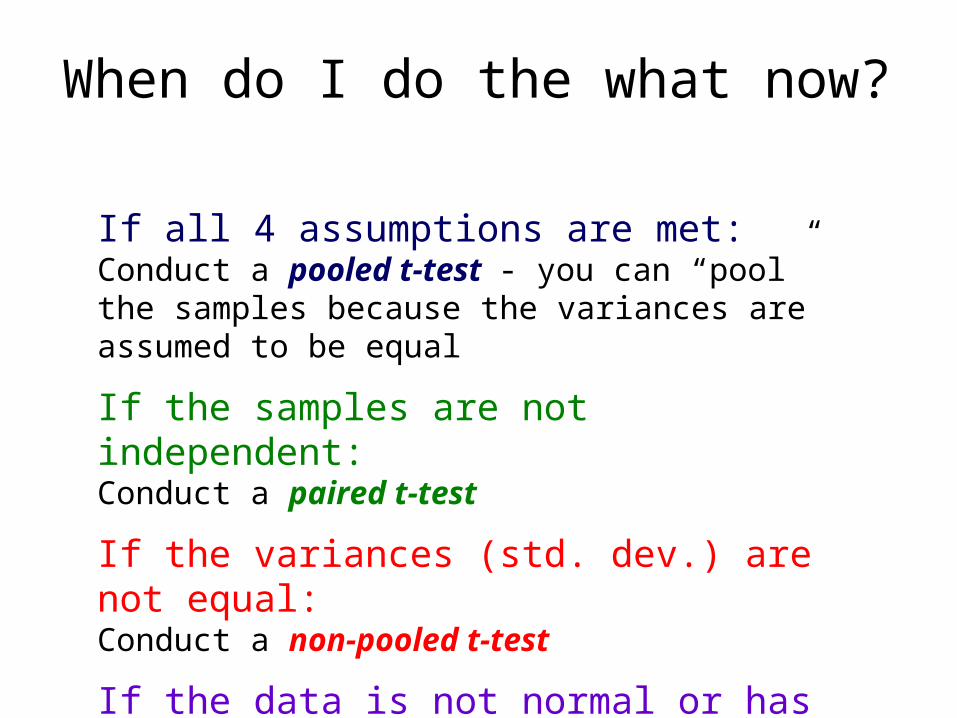
When do I do the what now?
If all 4 assumptions are met:Conduct a pooled t-test - you can “pool” the samples because the variances are assumed to be equal
If the samples are not independent:Conduct a paired t-test
If the variances (std. dev.) are not equal:Conduct a non-pooled t-test
If the data is not normal or has small sample size:Conduct a non-parametric t-test (Mann-Whitney)
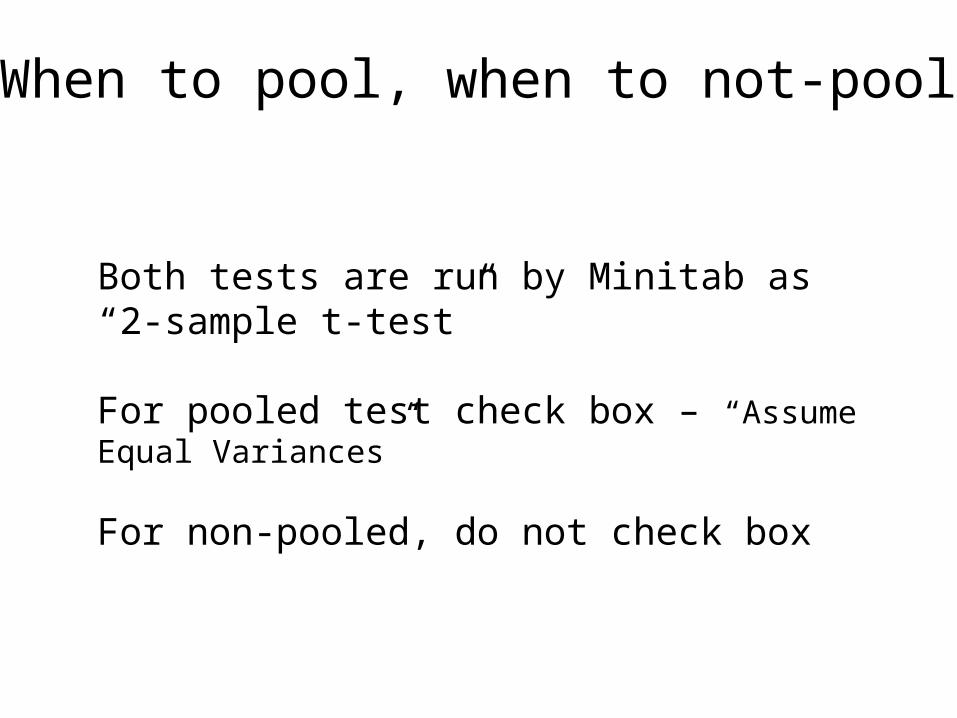
When to pool, when to not-pool
Both tests are run by Minitab as “2-sample t-test”
For pooled test check box – “Assume Equal Variances”
For non-pooled, do not check box
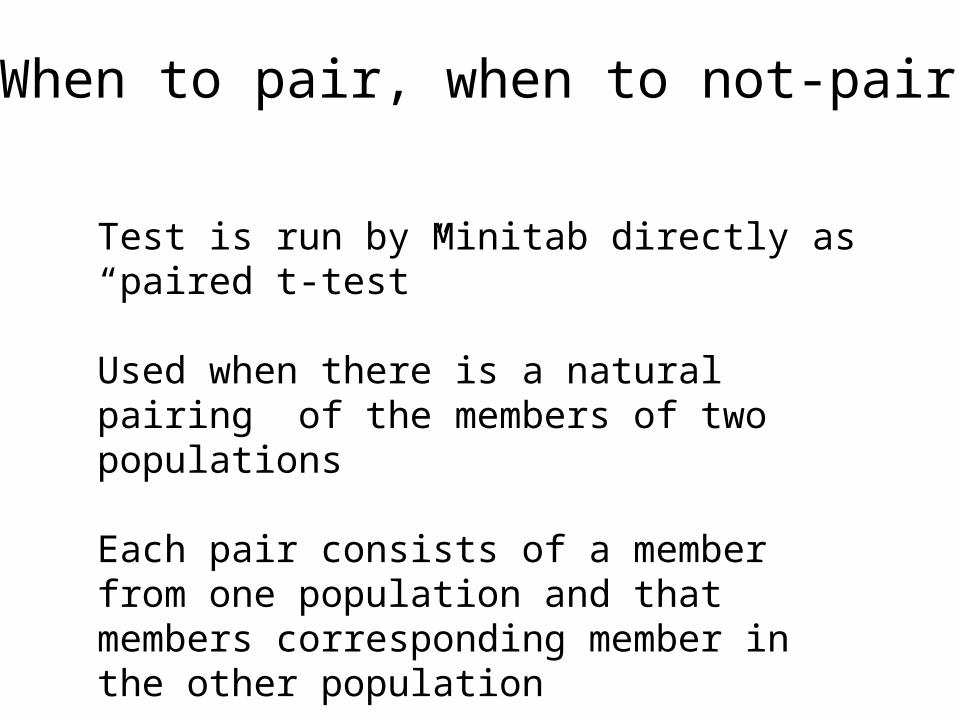
When to pair, when to not-pair
Test is run by Minitab directly as “paired t-test”
Used when there is a natural pairing of the members of two populations
Each pair consists of a member from one population and that members corresponding member in the other population
Use difference between the two sample means
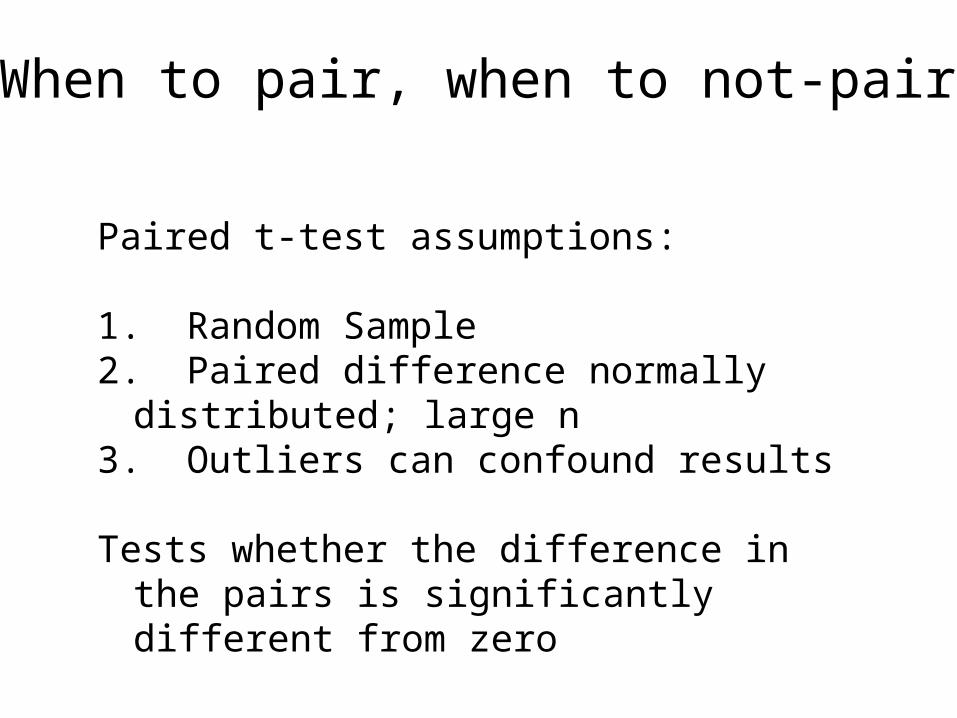
When to pair, when to not-pair
Paired t-test assumptions:
1. Random Sample2. Paired difference normally distributed; large n3. Outliers can confound results
Tests whether the difference in the pairs is significantly different from zero
When to parametric…Non-parametric t-test (Mann-Whitney):
1. Random Sample – small sample size OK!2. Do not require normally distributed data3. Outliers do not confound results
Tests whether the difference in the pairs is significantly different from zero
Non-parametric test are used heavily in some disciplines – although not typically in the natural sciences – often the “last resort” when data is not collected correctly, low “power”