LAMOST Views δ Scuti Pulsating Stars(2016). The comparisons are plotted in the four panels of Fig....
15
arXiv:1707.04006v4 [astro-ph.SR] 27 Dec 2017 MNRAS 000, 1–15 (2017) Preprint 29 December 2017 Compiled using MNRAS L A T E X style file v3.0 LAMOST Views δ Scuti Pulsating Stars Qian S.-B, 1,2,3,4 ⋆ Li L.-J., 1,2,3 He J.-J., 1,2,3 Zhang J., 1,2,3 Zhu L.-Y. 1,2,3,4 and Han Z.-T. 1,2,3 1 Yunnan Observatories, Chinese Academy of Sciences (CAS), P. O. Box 110, 650216 Kunming, China 2 Key Laboratory of the Structure and Evolution of Celestial Objects, Chinese Academy of Sciences, P. O. Box 110, 650216 Kunming, China 3 Center for Astronomical Mega-Science, Chinese Academy of Sciences, 20A Datun Road, Chaoyang Dis- trict, Beijing, 100012, P. R. China 4 University of Chinese Academy of Sciences, Yuquan Road 19#, Sijingshang Block, 100049 Beijing, China. Accepted XXX. Received YYY; in original form ZZZ ABSTRACT About 766 δ Scuti stars were observed by LAMOST by 2017 June 16. Stellar atmospheric parameters of 525 variables were determined, while spectral types were obtained for all sam- ples. In the paper, those spectroscopic data are catalogued. We detect a group of 131 unusual and cool variable stars (UCVs) that are distinguished from the normal δ Scuti stars (NDSTs). On the H−R diagram and the log g − T diagram, the UCVs are far beyond the red edge of pulsational instability trip. Their effective temperatures are lower than 6700 K with periods in the range from 0.09 to 0.22d. NDSTs have metallicity close to that of the Sun as expected, while UCVs are slightly metal poor than NDSTs. The two peaks on the distributions of the period and stellar atmospheric parameters are all caused by the existence of UCVs. When those UCVs are excluded, it is discovered that the effective temperature, the gravitational ac- celeration, and the metallicity all are correlated with the pulsating period for NDSTs and their physical properties and evolutionary states are discussed. Detection of those UCVs indicates that about 25% of the known δ Scuti stars may be misclassified. However, if some of them are confirmed to be pulsating stars, they will be a new-type pulsator and their investigations will shed light on theoretical instability domains and on the theories of interacting between the pulsation and the convection of solar-type stars. Meanwhile, 88 δ Scuti stars are detected to be the candidates of binary or multiple systems. Key words: Stars: variables: Scuti – Stars: fundamental parameters – Stars: oscillations — Stars: binaries: general 1 INTRODUCTION The δ Scuti-type pulsating stars lie inside the classical Cepheid in- stability strip with luminosity classes from III to V (e.g., Breger 1979, 2000; Lopez de Coca et al. 1990; Rodríguez et al. 2000). Their spectral types are in the range between A2 and F5 with masses from 3 to 1.4 M ⊙ . The pulsating amplitudes are usually in the range of 0.003-0.9 mag in the V band, with periods usually be- tween 0.02 and 0.3 d (e.g., Breger 1979; Chang et al. 2013). They exhibit both radial and non-radial pulsations with frequencies rang- ing between 3 and 80 d −1 and can oscillate in both p and g modes. These properties make them a good source for astroseismology in- vestigations and thus study stellar interiors and stellar evolution. Their great number of radial and non-radial pulsation modes are mainly driven by the κ mechanism that is mostly working in the He II ionization zone (e.g., Gautschy & Saio 1995; Breger et al. 2005; Rodríguez & Breger 2001). The theoretical blue edge of δ Scuti instability trip was well determined (e.g., Pamyatnykh 2000), ⋆ E-mail: [email protected] while the red edge is rather complicated because of the coupling between convection and oscillation together with the turbulent vis- cosity (e.g., Xiong & Deng 2001). In the recent catalogue of δ Scuti pulsating stars, about 18 ones including VX Hya (F6) and DE Lac (F7) were reported to be beyond the red edge and thus have cool temperatures with the spectroscopic/photometric spectral types later than F5 (e.g., Chang et al. 2013). A large number of δ Scuti stars were discovered by several photometric surveys in the world, e.g., All Sky Automated Sur- vey (ASAS: Pojmanski 1997; Pojmanski et al. 2005), the asteroid survey LINEAR (Palaversa et al. 2013), and northern sky variabil- ity survey (NSVS: Wo´ zniak et al. 2004). In particular, the Kepler (Borucki et al. 2010) space telescopes have produced high-quality data sets for thousands of stars and about 2000 δ Scuti stars were detected (e.g., Balona & Dziembowski 2011; Uytterhoeven et al. 2011). Since the data on variable stars including δ Scuti stars are constantly varying, the mission of VSX (the international variable star index) is bringing all of new information together in a single data repository (e.g., Watson et al. 2006). About 3689 δ Scuti vari- able stars have been detected and were listed in VSX by 2017 July c 2017 The Authors
Transcript of LAMOST Views δ Scuti Pulsating Stars(2016). The comparisons are plotted in the four panels of Fig....
arX
iv:1
707.
0400
6v4
[as
tro-
ph.S
R]
27
Dec
201
7
MNRAS 000, 1–15 (2017) Preprint 29 December 2017 Compiled using MNRAS LATEX style file v3.0
LAMOST Views δ Scuti Pulsating Stars
Qian S.-B,1,2,3,4⋆ Li L.-J.,1,2,3 He J.-J.,1,2,3 Zhang J.,1,2,3 Zhu L.-Y.1,2,3,4 and Han Z.-T.1,2,3
1Yunnan Observatories, Chinese Academy of Sciences (CAS), P. O. Box 110, 650216 Kunming, China2Key Laboratory of the Structure and Evolution of Celestial Objects, Chinese Academy of Sciences, P. O. Box 110, 650216 Kunming, China3Center for Astronomical Mega-Science, Chinese Academy of Sciences, 20A Datun Road, Chaoyang Dis- trict, Beijing, 100012, P. R. China4University of Chinese Academy of Sciences, Yuquan Road 19#, Sijingshang Block, 100049 Beijing, China.
Accepted XXX. Received YYY; in original form ZZZ
ABSTRACT
About 766 δ Scuti stars were observed by LAMOST by 2017 June 16. Stellar atmosphericparameters of 525 variables were determined, while spectral types were obtained for all sam-ples. In the paper, those spectroscopic data are catalogued. We detect a group of 131 unusualand cool variable stars (UCVs) that are distinguished from the normal δ Scuti stars (NDSTs).On the H−R diagram and the logg− T diagram, the UCVs are far beyond the red edge ofpulsational instability trip. Their effective temperatures are lower than 6700 K with periods inthe range from 0.09 to 0.22 d. NDSTs have metallicity close to that of the Sun as expected,while UCVs are slightly metal poor than NDSTs. The two peaks on the distributions of theperiod and stellar atmospheric parameters are all caused by the existence of UCVs. Whenthose UCVs are excluded, it is discovered that the effective temperature, the gravitational ac-celeration, and the metallicity all are correlated with the pulsating period for NDSTs and theirphysical properties and evolutionary states are discussed. Detection of those UCVs indicatesthat about 25% of the known δ Scuti stars may be misclassified. However, if some of themare confirmed to be pulsating stars, they will be a new-type pulsator and their investigationswill shed light on theoretical instability domains and on the theories of interacting betweenthe pulsation and the convection of solar-type stars. Meanwhile, 88 δ Scuti stars are detectedto be the candidates of binary or multiple systems.
Key words: Stars: variables: Scuti – Stars: fundamental parameters – Stars: oscillations —Stars: binaries: general
1 INTRODUCTION
The δ Scuti-type pulsating stars lie inside the classical Cepheid in-stability strip with luminosity classes from III to V (e.g., Breger1979, 2000; Lopez de Coca et al. 1990; Rodríguez et al. 2000).Their spectral types are in the range between A2 and F5 withmasses from 3 to 1.4 M⊙. The pulsating amplitudes are usually inthe range of 0.003-0.9 mag in the V band, with periods usually be-tween 0.02 and 0.3 d (e.g., Breger 1979; Chang et al. 2013). Theyexhibit both radial and non-radial pulsations with frequencies rang-ing between 3 and 80 d−1 and can oscillate in both p and g modes.These properties make them a good source for astroseismology in-vestigations and thus study stellar interiors and stellar evolution.Their great number of radial and non-radial pulsation modes aremainly driven by the κ mechanism that is mostly working in theHe II ionization zone (e.g., Gautschy & Saio 1995; Breger et al.2005; Rodríguez & Breger 2001). The theoretical blue edge of δScuti instability trip was well determined (e.g., Pamyatnykh 2000),
⋆ E-mail: [email protected]
while the red edge is rather complicated because of the couplingbetween convection and oscillation together with the turbulent vis-cosity (e.g., Xiong & Deng 2001). In the recent catalogue of δScuti pulsating stars, about 18 ones including VX Hya (F6) andDE Lac (F7) were reported to be beyond the red edge and thushave cool temperatures with the spectroscopic/photometric spectraltypes later than F5 (e.g., Chang et al. 2013).
A large number of δ Scuti stars were discovered by severalphotometric surveys in the world, e.g., All Sky Automated Sur-vey (ASAS: Pojmanski 1997; Pojmanski et al. 2005), the asteroidsurvey LINEAR (Palaversa et al. 2013), and northern sky variabil-ity survey (NSVS: Wozniak et al. 2004). In particular, the Kepler(Borucki et al. 2010) space telescopes have produced high-qualitydata sets for thousands of stars and about 2000 δ Scuti stars weredetected (e.g., Balona & Dziembowski 2011; Uytterhoeven et al.2011). Since the data on variable stars including δ Scuti stars areconstantly varying, the mission of VSX (the international variablestar index) is bringing all of new information together in a singledata repository (e.g., Watson et al. 2006). About 3689 δ Scuti vari-able stars have been detected and were listed in VSX by 2017 July
c© 2017 The Authors
2
0.00 0.05 0.10 0.15 0.20 0.25 0.30 0.35 0.40 0.45 0.500
50
100
150
200
250
300
350
400
450
500
550
N
Period (days)
VSX LAMOST
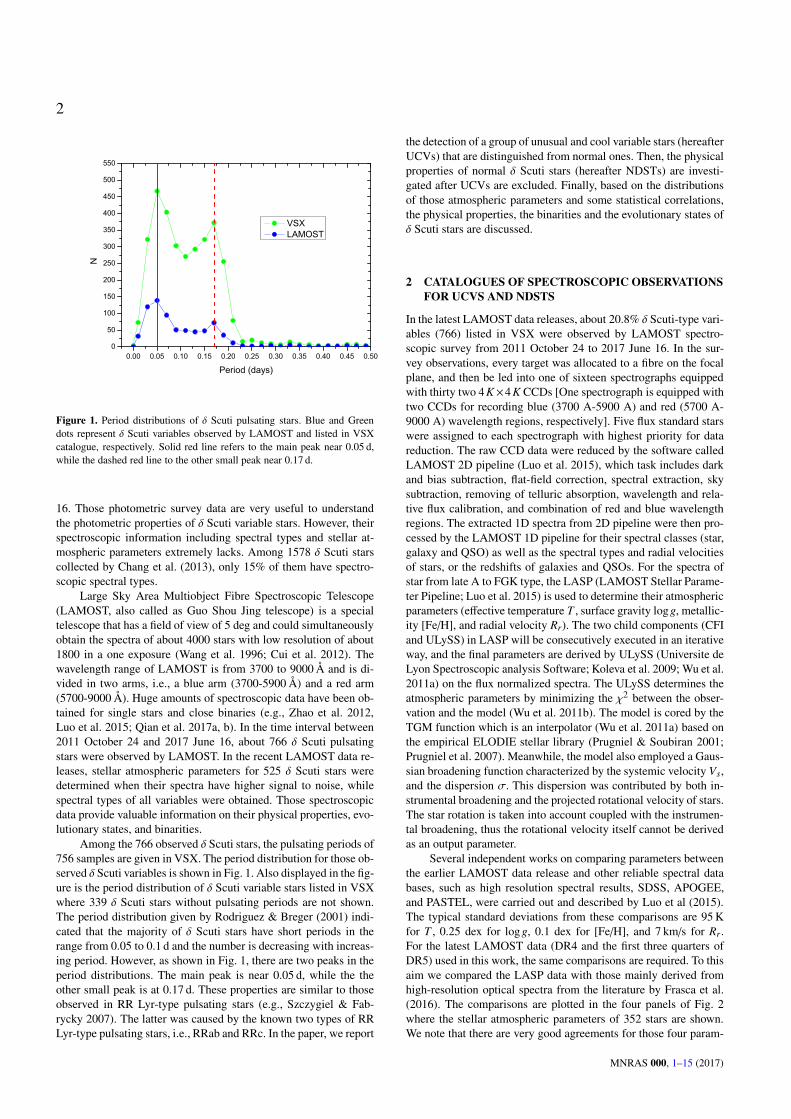
Figure 1. Period distributions of δ Scuti pulsating stars. Blue and Greendots represent δ Scuti variables observed by LAMOST and listed in VSXcatalogue, respectively. Solid red line refers to the main peak near 0.05 d,while the dashed red line to the other small peak near 0.17 d.
16. Those photometric survey data are very useful to understandthe photometric properties of δ Scuti variable stars. However, theirspectroscopic information including spectral types and stellar at-mospheric parameters extremely lacks. Among 1578 δ Scuti starscollected by Chang et al. (2013), only 15% of them have spectro-scopic spectral types.
Large Sky Area Multiobject Fibre Spectroscopic Telescope(LAMOST, also called as Guo Shou Jing telescope) is a specialtelescope that has a field of view of 5 deg and could simultaneouslyobtain the spectra of about 4000 stars with low resolution of about1800 in a one exposure (Wang et al. 1996; Cui et al. 2012). Thewavelength range of LAMOST is from 3700 to 9000 Å and is di-vided in two arms, i.e., a blue arm (3700-5900 Å) and a red arm(5700-9000 Å). Huge amounts of spectroscopic data have been ob-tained for single stars and close binaries (e.g., Zhao et al. 2012,Luo et al. 2015; Qian et al. 2017a, b). In the time interval between2011 October 24 and 2017 June 16, about 766 δ Scuti pulsatingstars were observed by LAMOST. In the recent LAMOST data re-leases, stellar atmospheric parameters for 525 δ Scuti stars weredetermined when their spectra have higher signal to noise, whilespectral types of all variables were obtained. Those spectroscopicdata provide valuable information on their physical properties, evo-lutionary states, and binarities.
Among the 766 observed δ Scuti stars, the pulsating periods of756 samples are given in VSX. The period distribution for those ob-served δ Scuti variables is shown in Fig. 1. Also displayed in the fig-ure is the period distribution of δ Scuti variable stars listed in VSXwhere 339 δ Scuti stars without pulsating periods are not shown.The period distribution given by Rodriguez & Breger (2001) indi-cated that the majority of δ Scuti stars have short periods in therange from 0.05 to 0.1 d and the number is decreasing with increas-ing period. However, as shown in Fig. 1, there are two peaks in theperiod distributions. The main peak is near 0.05 d, while the theother small peak is at 0.17 d. These properties are similar to thoseobserved in RR Lyr-type pulsating stars (e.g., Szczygiel & Fab-rycky 2007). The latter was caused by the known two types of RRLyr-type pulsating stars, i.e., RRab and RRc. In the paper, we report
the detection of a group of unusual and cool variable stars (hereafterUCVs) that are distinguished from normal ones. Then, the physicalproperties of normal δ Scuti stars (hereafter NDSTs) are investi-gated after UCVs are excluded. Finally, based on the distributionsof those atmospheric parameters and some statistical correlations,the physical properties, the binarities and the evolutionary states ofδ Scuti stars are discussed.
2 CATALOGUES OF SPECTROSCOPIC OBSERVATIONS
FOR UCVS AND NDSTS
In the latest LAMOST data releases, about 20.8% δ Scuti-type vari-ables (766) listed in VSX were observed by LAMOST spectro-scopic survey from 2011 October 24 to 2017 June 16. In the sur-vey observations, every target was allocated to a fibre on the focalplane, and then be led into one of sixteen spectrographs equippedwith thirty two 4 K×4 K CCDs [One spectrograph is equipped withtwo CCDs for recording blue (3700 A-5900 A) and red (5700 A-9000 A) wavelength regions, respectively]. Five flux standard starswere assigned to each spectrograph with highest priority for datareduction. The raw CCD data were reduced by the software calledLAMOST 2D pipeline (Luo et al. 2015), which task includes darkand bias subtraction, flat-field correction, spectral extraction, skysubtraction, removing of telluric absorption, wavelength and rela-tive flux calibration, and combination of red and blue wavelengthregions. The extracted 1D spectra from 2D pipeline were then pro-cessed by the LAMOST 1D pipeline for their spectral classes (star,galaxy and QSO) as well as the spectral types and radial velocitiesof stars, or the redshifts of galaxies and QSOs. For the spectra ofstar from late A to FGK type, the LASP (LAMOST Stellar Parame-ter Pipeline; Luo et al. 2015) is used to determine their atmosphericparameters (effective temperature T , surface gravity logg, metallic-ity [Fe/H], and radial velocity Rr). The two child components (CFIand ULySS) in LASP will be consecutively executed in an iterativeway, and the final parameters are derived by ULySS (Universite deLyon Spectroscopic analysis Software; Koleva et al. 2009; Wu et al.2011a) on the flux normalized spectra. The ULySS determines theatmospheric parameters by minimizing the χ2 between the obser-vation and the model (Wu et al. 2011b). The model is cored by theTGM function which is an interpolator (Wu et al. 2011a) based onthe empirical ELODIE stellar library (Prugniel & Soubiran 2001;Prugniel et al. 2007). Meanwhile, the model also employed a Gaus-sian broadening function characterized by the systemic velocity Vs,and the dispersion σ. This dispersion was contributed by both in-strumental broadening and the projected rotational velocity of stars.The star rotation is taken into account coupled with the instrumen-tal broadening, thus the rotational velocity itself cannot be derivedas an output parameter.
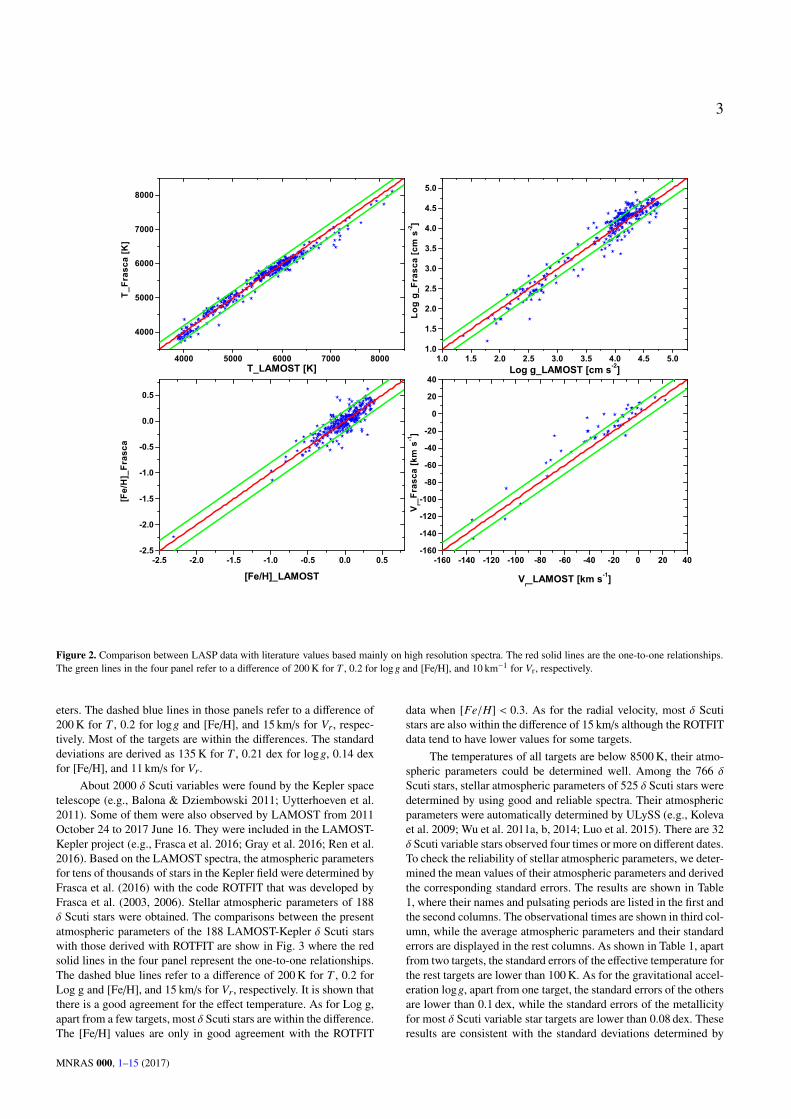
Several independent works on comparing parameters betweenthe earlier LAMOST data release and other reliable spectral databases, such as high resolution spectral results, SDSS, APOGEE,and PASTEL, were carried out and described by Luo et al (2015).The typical standard deviations from these comparisons are 95 Kfor T , 0.25 dex for logg, 0.1 dex for [Fe/H], and 7 km/s for Rr.For the latest LAMOST data (DR4 and the first three quarters ofDR5) used in this work, the same comparisons are required. To thisaim we compared the LASP data with those mainly derived fromhigh-resolution optical spectra from the literature by Frasca et al.(2016). The comparisons are plotted in the four panels of Fig. 2where the stellar atmospheric parameters of 352 stars are shown.We note that there are very good agreements for those four param-
MNRAS 000, 1–15 (2017)
3
4000 5000 6000 7000 8000
4000
5000
6000
7000
8000
1.0 1.5 2.0 2.5 3.0 3.5 4.0 4.5 5.01.0
1.5
2.0
2.5
3.0
3.5
4.0
4.5
5.0
-2.5 -2.0 -1.5 -1.0 -0.5 0.0 0.5-2.5
-2.0
-1.5
-1.0
-0.5
0.0
0.5
-160 -140 -120 -100 -80 -60 -40 -20 0 20 40-160
-140
-120
-100
-80
-60
-40
-20
0
20
40
T_Fr
asca
[K]
T_LAMOST [K]
Log
g_Fr
asca
[cm
s-2
]
Log g_LAMOST [cm s-2]
[Fe/
H]_
Fras
ca
[Fe/H]_LAMOST
Vr_F
rasc
a [k
m s
-1]
Vr_LAMOST [km s-1]
Figure 2. Comparison between LASP data with literature values based mainly on high resolution spectra. The red solid lines are the one-to-one relationships.The green lines in the four panel refer to a difference of 200 K for T , 0.2 for log g and [Fe/H], and 10 km−1 for Vr, respectively.
eters. The dashed blue lines in those panels refer to a difference of200 K for T , 0.2 for logg and [Fe/H], and 15 km/s for Vr, respec-tively. Most of the targets are within the differences. The standarddeviations are derived as 135 K for T , 0.21 dex for logg, 0.14 dexfor [Fe/H], and 11 km/s for Vr.
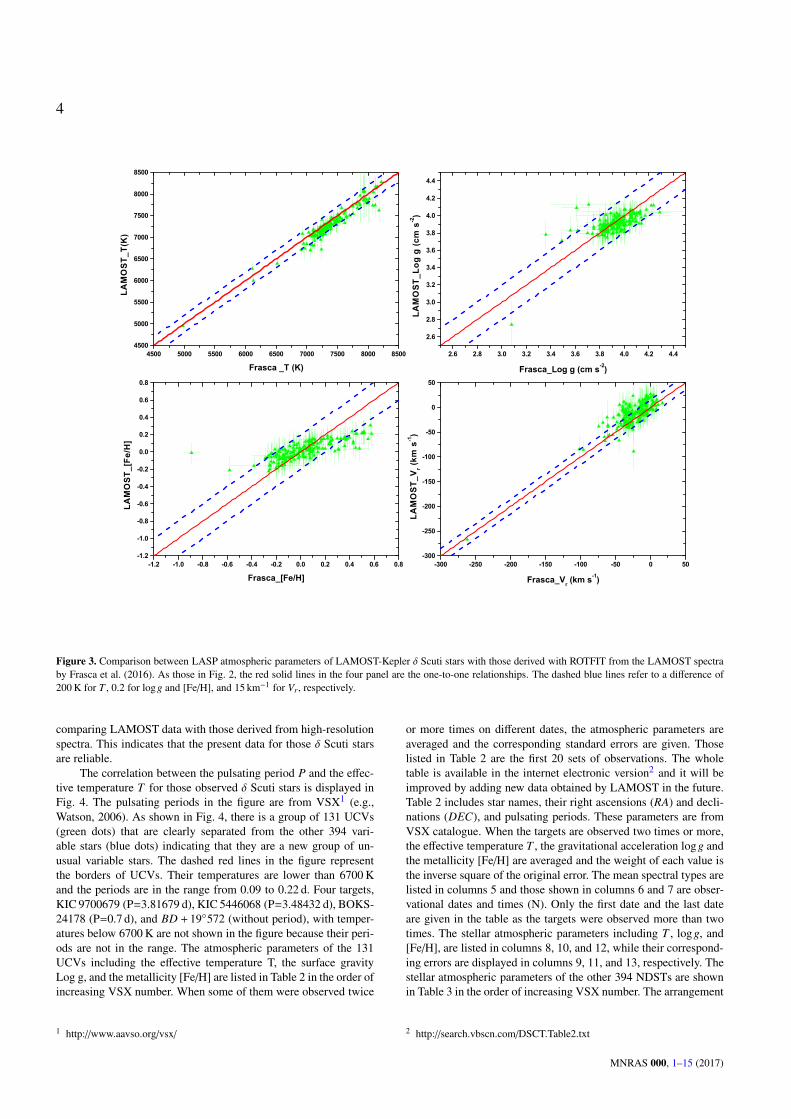
About 2000 δ Scuti variables were found by the Kepler spacetelescope (e.g., Balona & Dziembowski 2011; Uytterhoeven et al.2011). Some of them were also observed by LAMOST from 2011October 24 to 2017 June 16. They were included in the LAMOST-Kepler project (e.g., Frasca et al. 2016; Gray et al. 2016; Ren et al.2016). Based on the LAMOST spectra, the atmospheric parametersfor tens of thousands of stars in the Kepler field were determined byFrasca et al. (2016) with the code ROTFIT that was developed byFrasca et al. (2003, 2006). Stellar atmospheric parameters of 188δ Scuti stars were obtained. The comparisons between the presentatmospheric parameters of the 188 LAMOST-Kepler δ Scuti starswith those derived with ROTFIT are show in Fig. 3 where the redsolid lines in the four panel represent the one-to-one relationships.The dashed blue lines refer to a difference of 200 K for T , 0.2 forLog g and [Fe/H], and 15 km/s for Vr, respectively. It is shown thatthere is a good agreement for the effect temperature. As for Log g,apart from a few targets, most δ Scuti stars are within the difference.The [Fe/H] values are only in good agreement with the ROTFIT
data when [Fe/H] < 0.3. As for the radial velocity, most δ Scutistars are also within the difference of 15 km/s although the ROTFITdata tend to have lower values for some targets.
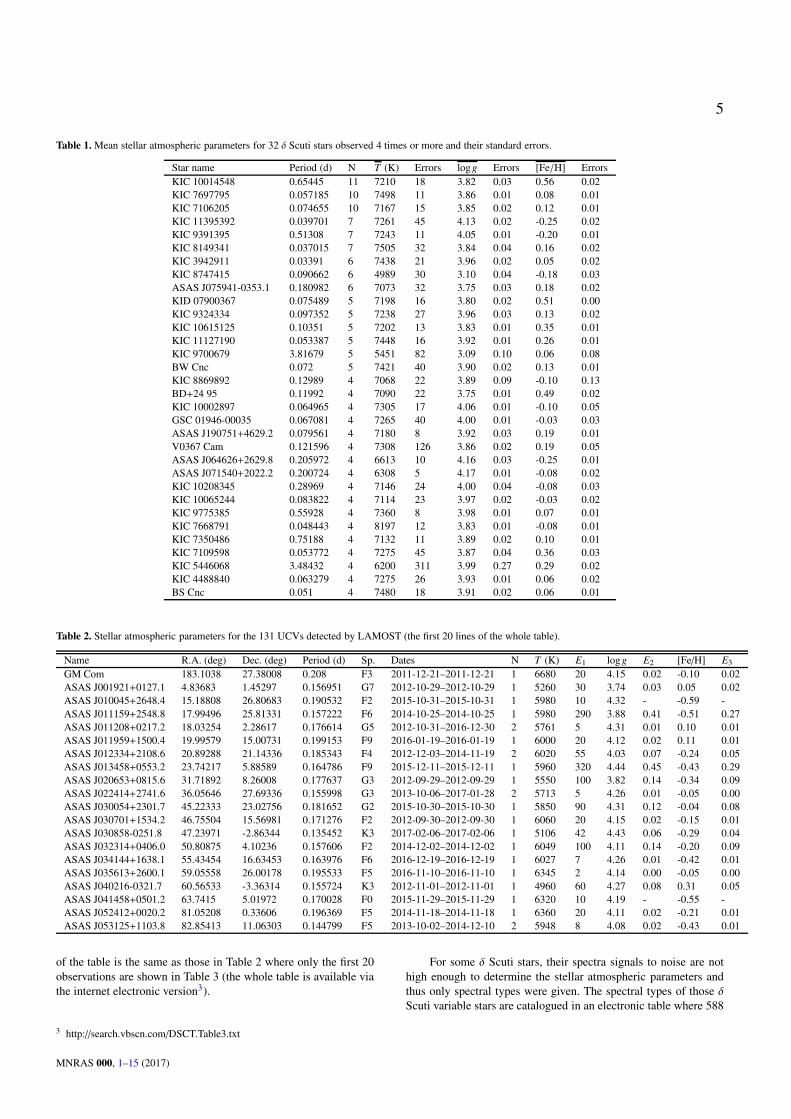
The temperatures of all targets are below 8500 K, their atmo-spheric parameters could be determined well. Among the 766 δScuti stars, stellar atmospheric parameters of 525 δ Scuti stars weredetermined by using good and reliable spectra. Their atmosphericparameters were automatically determined by ULySS (e.g., Kolevaet al. 2009; Wu et al. 2011a, b, 2014; Luo et al. 2015). There are 32δ Scuti variable stars observed four times or more on different dates.To check the reliability of stellar atmospheric parameters, we deter-mined the mean values of their atmospheric parameters and derivedthe corresponding standard errors. The results are shown in Table1, where their names and pulsating periods are listed in the first andthe second columns. The observational times are shown in third col-umn, while the average atmospheric parameters and their standarderrors are displayed in the rest columns. As shown in Table 1, apartfrom two targets, the standard errors of the effective temperature forthe rest targets are lower than 100 K. As for the gravitational accel-eration logg, apart from one target, the standard errors of the othersare lower than 0.1 dex, while the standard errors of the metallicityfor most δ Scuti variable star targets are lower than 0.08 dex. Theseresults are consistent with the standard deviations determined by
MNRAS 000, 1–15 (2017)
4
4500 5000 5500 6000 6500 7000 7500 8000 85004500
5000
5500
6000
6500
7000
7500
8000
8500
2.6 2.8 3.0 3.2 3.4 3.6 3.8 4.0 4.2 4.4
2.6
2.8
3.0
3.2
3.4
3.6
3.8
4.0
4.2
4.4
-1.2 -1.0 -0.8 -0.6 -0.4 -0.2 0.0 0.2 0.4 0.6 0.8-1.2
-1.0
-0.8
-0.6
-0.4
-0.2
0.0
0.2
0.4
0.6
0.8
-300 -250 -200 -150 -100 -50 0 50-300
-250
-200
-150
-100
-50
0
50
LAM
OS
T_T(
K)
Frasca _T (K)
LAM
OS
T_Lo
g g
(cm
s-2
)
Frasca_Log g (cm s-2)
LAM
OS
T_[F
e/H
]
Frasca_[Fe/H]
LAM
OS
T_V
r (km
s-1
)
Frasca_Vr (km s-1)
Figure 3. Comparison between LASP atmospheric parameters of LAMOST-Kepler δ Scuti stars with those derived with ROTFIT from the LAMOST spectraby Frasca et al. (2016). As those in Fig. 2, the red solid lines in the four panel are the one-to-one relationships. The dashed blue lines refer to a difference of200 K for T , 0.2 for logg and [Fe/H], and 15 km−1 for Vr, respectively.
comparing LAMOST data with those derived from high-resolutionspectra. This indicates that the present data for those δ Scuti starsare reliable.
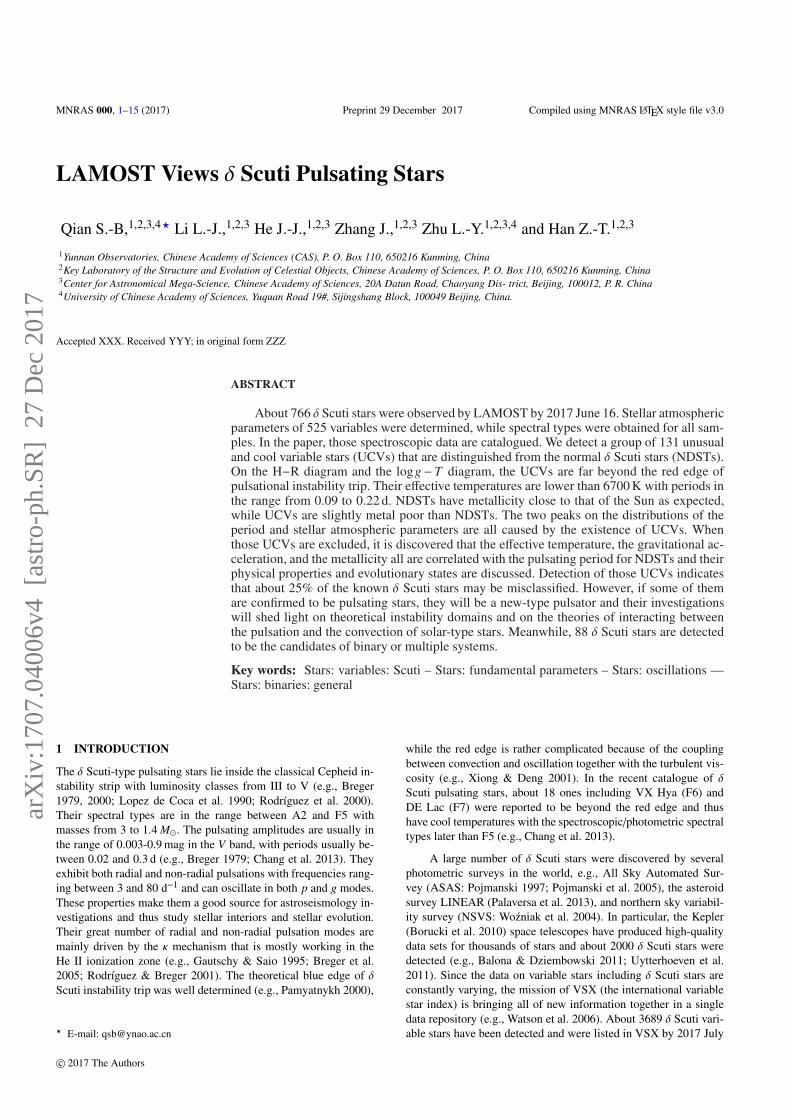
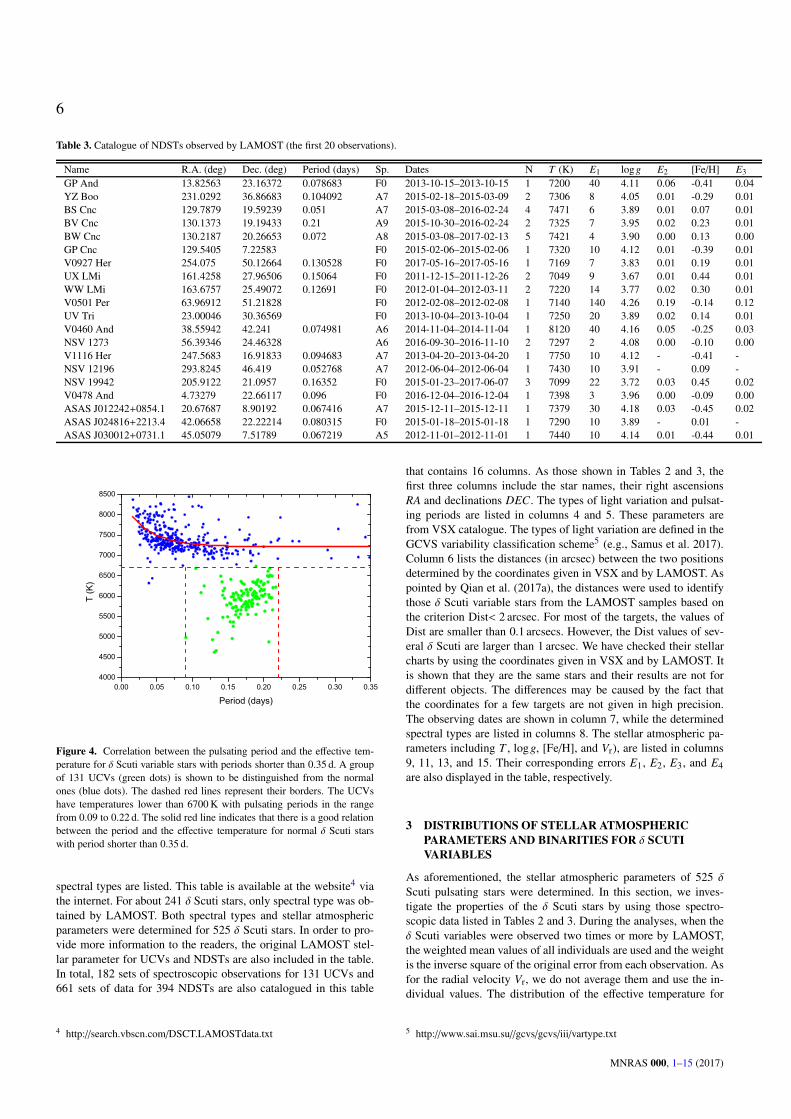
The correlation between the pulsating period P and the effec-tive temperature T for those observed δ Scuti stars is displayed inFig. 4. The pulsating periods in the figure are from VSX1 (e.g.,Watson, 2006). As shown in Fig. 4, there is a group of 131 UCVs(green dots) that are clearly separated from the other 394 vari-able stars (blue dots) indicating that they are a new group of un-usual variable stars. The dashed red lines in the figure representthe borders of UCVs. Their temperatures are lower than 6700 Kand the periods are in the range from 0.09 to 0.22 d. Four targets,KIC 9700679 (P=3.81679 d), KIC 5446068 (P=3.48432 d), BOKS-24178 (P=0.7 d), and BD + 19◦572 (without period), with temper-atures below 6700 K are not shown in the figure because their peri-ods are not in the range. The atmospheric parameters of the 131UCVs including the effective temperature T, the surface gravityLog g, and the metallicity [Fe/H] are listed in Table 2 in the order ofincreasing VSX number. When some of them were observed twice
1 http://www.aavso.org/vsx/
or more times on different dates, the atmospheric parameters areaveraged and the corresponding standard errors are given. Thoselisted in Table 2 are the first 20 sets of observations. The wholetable is available in the internet electronic version2 and it will beimproved by adding new data obtained by LAMOST in the future.Table 2 includes star names, their right ascensions (RA) and decli-nations (DEC), and pulsating periods. These parameters are fromVSX catalogue. When the targets are observed two times or more,the effective temperature T , the gravitational acceleration logg andthe metallicity [Fe/H] are averaged and the weight of each value isthe inverse square of the original error. The mean spectral types arelisted in columns 5 and those shown in columns 6 and 7 are obser-vational dates and times (N). Only the first date and the last dateare given in the table as the targets were observed more than twotimes. The stellar atmospheric parameters including T , logg, and[Fe/H], are listed in columns 8, 10, and 12, while their correspond-ing errors are displayed in columns 9, 11, and 13, respectively. Thestellar atmospheric parameters of the other 394 NDSTs are shownin Table 3 in the order of increasing VSX number. The arrangement
2 http://search.vbscn.com/DSCT.Table2.txt
MNRAS 000, 1–15 (2017)
5
Table 1. Mean stellar atmospheric parameters for 32 δ Scuti stars observed 4 times or more and their standard errors.
Star name Period (d) N T (K) Errors logg Errors [Fe/H] ErrorsKIC 10014548 0.65445 11 7210 18 3.82 0.03 0.56 0.02KIC 7697795 0.057185 10 7498 11 3.86 0.01 0.08 0.01KIC 7106205 0.074655 10 7167 15 3.85 0.02 0.12 0.01KIC 11395392 0.039701 7 7261 45 4.13 0.02 -0.25 0.02KIC 9391395 0.51308 7 7243 11 4.05 0.01 -0.20 0.01KIC 8149341 0.037015 7 7505 32 3.84 0.04 0.16 0.02KIC 3942911 0.03391 6 7438 21 3.96 0.02 0.05 0.02KIC 8747415 0.090662 6 4989 30 3.10 0.04 -0.18 0.03ASAS J075941-0353.1 0.180982 6 7073 32 3.75 0.03 0.18 0.02KID 07900367 0.075489 5 7198 16 3.80 0.02 0.51 0.00KIC 9324334 0.097352 5 7238 27 3.96 0.03 0.13 0.02KIC 10615125 0.10351 5 7202 13 3.83 0.01 0.35 0.01KIC 11127190 0.053387 5 7448 16 3.92 0.01 0.26 0.01KIC 9700679 3.81679 5 5451 82 3.09 0.10 0.06 0.08BW Cnc 0.072 5 7421 40 3.90 0.02 0.13 0.01KIC 8869892 0.12989 4 7068 22 3.89 0.09 -0.10 0.13BD+24 95 0.11992 4 7090 22 3.75 0.01 0.49 0.02KIC 10002897 0.064965 4 7305 17 4.06 0.01 -0.10 0.05GSC 01946-00035 0.067081 4 7265 40 4.00 0.01 -0.03 0.03ASAS J190751+4629.2 0.079561 4 7180 8 3.92 0.03 0.19 0.01V0367 Cam 0.121596 4 7308 126 3.86 0.02 0.19 0.05ASAS J064626+2629.8 0.205972 4 6613 10 4.16 0.03 -0.25 0.01ASAS J071540+2022.2 0.200724 4 6308 5 4.17 0.01 -0.08 0.02KIC 10208345 0.28969 4 7146 24 4.00 0.04 -0.08 0.03KIC 10065244 0.083822 4 7114 23 3.97 0.02 -0.03 0.02KIC 9775385 0.55928 4 7360 8 3.98 0.01 0.07 0.01KIC 7668791 0.048443 4 8197 12 3.83 0.01 -0.08 0.01KIC 7350486 0.75188 4 7132 11 3.89 0.02 0.10 0.01KIC 7109598 0.053772 4 7275 45 3.87 0.04 0.36 0.03KIC 5446068 3.48432 4 6200 311 3.99 0.27 0.29 0.02KIC 4488840 0.063279 4 7275 26 3.93 0.01 0.06 0.02BS Cnc 0.051 4 7480 18 3.91 0.02 0.06 0.01
Table 2. Stellar atmospheric parameters for the 131 UCVs detected by LAMOST (the first 20 lines of the whole table).
Name R.A. (deg) Dec. (deg) Period (d) Sp. Dates N T (K) E1 logg E2 [Fe/H] E3
GM Com 183.1038 27.38008 0.208 F3 2011-12-21–2011-12-21 1 6680 20 4.15 0.02 -0.10 0.02ASAS J001921+0127.1 4.83683 1.45297 0.156951 G7 2012-10-29–2012-10-29 1 5260 30 3.74 0.03 0.05 0.02ASAS J010045+2648.4 15.18808 26.80683 0.190532 F2 2015-10-31–2015-10-31 1 5980 10 4.32 - -0.59 -ASAS J011159+2548.8 17.99496 25.81331 0.157222 F6 2014-10-25–2014-10-25 1 5980 290 3.88 0.41 -0.51 0.27ASAS J011208+0217.2 18.03254 2.28617 0.176614 G5 2012-10-31–2016-12-30 2 5761 5 4.31 0.01 0.10 0.01ASAS J011959+1500.4 19.99579 15.00731 0.199153 F9 2016-01-19–2016-01-19 1 6000 20 4.12 0.02 0.11 0.01ASAS J012334+2108.6 20.89288 21.14336 0.185343 F4 2012-12-03–2014-11-19 2 6020 55 4.03 0.07 -0.24 0.05ASAS J013458+0553.2 23.74217 5.88589 0.164786 F9 2015-12-11–2015-12-11 1 5960 320 4.44 0.45 -0.43 0.29ASAS J020653+0815.6 31.71892 8.26008 0.177637 G3 2012-09-29–2012-09-29 1 5550 100 3.82 0.14 -0.34 0.09ASAS J022414+2741.6 36.05646 27.69336 0.155998 G3 2013-10-06–2017-01-28 2 5713 5 4.26 0.01 -0.05 0.00ASAS J030054+2301.7 45.22333 23.02756 0.181652 G2 2015-10-30–2015-10-30 1 5850 90 4.31 0.12 -0.04 0.08ASAS J030701+1534.2 46.75504 15.56981 0.171276 F2 2012-09-30–2012-09-30 1 6060 20 4.15 0.02 -0.15 0.01ASAS J030858-0251.8 47.23971 -2.86344 0.135452 K3 2017-02-06–2017-02-06 1 5106 42 4.43 0.06 -0.29 0.04ASAS J032314+0406.0 50.80875 4.10236 0.157606 F2 2014-12-02–2014-12-02 1 6049 100 4.11 0.14 -0.20 0.09ASAS J034144+1638.1 55.43454 16.63453 0.163976 F6 2016-12-19–2016-12-19 1 6027 7 4.26 0.01 -0.42 0.01ASAS J035613+2600.1 59.05558 26.00178 0.195533 F5 2016-11-10–2016-11-10 1 6345 2 4.14 0.00 -0.05 0.00ASAS J040216-0321.7 60.56533 -3.36314 0.155724 K3 2012-11-01–2012-11-01 1 4960 60 4.27 0.08 0.31 0.05ASAS J041458+0501.2 63.7415 5.01972 0.170028 F0 2015-11-29–2015-11-29 1 6320 10 4.19 - -0.55 -ASAS J052412+0020.2 81.05208 0.33606 0.196369 F5 2014-11-18–2014-11-18 1 6360 20 4.11 0.02 -0.21 0.01ASAS J053125+1103.8 82.85413 11.06303 0.144799 F5 2013-10-02–2014-12-10 2 5948 8 4.08 0.02 -0.43 0.01
of the table is the same as those in Table 2 where only the first 20observations are shown in Table 3 (the whole table is available viathe internet electronic version3).
3 http://search.vbscn.com/DSCT.Table3.txt
For some δ Scuti stars, their spectra signals to noise are nothigh enough to determine the stellar atmospheric parameters andthus only spectral types were given. The spectral types of those δScuti variable stars are catalogued in an electronic table where 588
MNRAS 000, 1–15 (2017)
6
Table 3. Catalogue of NDSTs observed by LAMOST (the first 20 observations).
Name R.A. (deg) Dec. (deg) Period (days) Sp. Dates N T (K) E1 logg E2 [Fe/H] E3
GP And 13.82563 23.16372 0.078683 F0 2013-10-15–2013-10-15 1 7200 40 4.11 0.06 -0.41 0.04YZ Boo 231.0292 36.86683 0.104092 A7 2015-02-18–2015-03-09 2 7306 8 4.05 0.01 -0.29 0.01BS Cnc 129.7879 19.59239 0.051 A7 2015-03-08–2016-02-24 4 7471 6 3.89 0.01 0.07 0.01BV Cnc 130.1373 19.19433 0.21 A9 2015-10-30–2016-02-24 2 7325 7 3.95 0.02 0.23 0.01BW Cnc 130.2187 20.26653 0.072 A8 2015-03-08–2017-02-13 5 7421 4 3.90 0.00 0.13 0.00GP Cnc 129.5405 7.22583 F0 2015-02-06–2015-02-06 1 7320 10 4.12 0.01 -0.39 0.01V0927 Her 254.075 50.12664 0.130528 F0 2017-05-16–2017-05-16 1 7169 7 3.83 0.01 0.19 0.01UX LMi 161.4258 27.96506 0.15064 F0 2011-12-15–2011-12-26 2 7049 9 3.67 0.01 0.44 0.01WW LMi 163.6757 25.49072 0.12691 F0 2012-01-04–2012-03-11 2 7220 14 3.77 0.02 0.30 0.01V0501 Per 63.96912 51.21828 F0 2012-02-08–2012-02-08 1 7140 140 4.26 0.19 -0.14 0.12UV Tri 23.00046 30.36569 F0 2013-10-04–2013-10-04 1 7250 20 3.89 0.02 0.14 0.01V0460 And 38.55942 42.241 0.074981 A6 2014-11-04–2014-11-04 1 8120 40 4.16 0.05 -0.25 0.03NSV 1273 56.39346 24.46328 A6 2016-09-30–2016-11-10 2 7297 2 4.08 0.00 -0.10 0.00V1116 Her 247.5683 16.91833 0.094683 A7 2013-04-20–2013-04-20 1 7750 10 4.12 - -0.41 -NSV 12196 293.8245 46.419 0.052768 A7 2012-06-04–2012-06-04 1 7430 10 3.91 - 0.09 -NSV 19942 205.9122 21.0957 0.16352 F0 2015-01-23–2017-06-07 3 7099 22 3.72 0.03 0.45 0.02V0478 And 4.73279 22.66117 0.096 F0 2016-12-04–2016-12-04 1 7398 3 3.96 0.00 -0.09 0.00ASAS J012242+0854.1 20.67687 8.90192 0.067416 A7 2015-12-11–2015-12-11 1 7379 30 4.18 0.03 -0.45 0.02ASAS J024816+2213.4 42.06658 22.22214 0.080315 F0 2015-01-18–2015-01-18 1 7290 10 3.89 - 0.01 -ASAS J030012+0731.1 45.05079 7.51789 0.067219 A5 2012-11-01–2012-11-01 1 7440 10 4.14 0.01 -0.44 0.01
0.00 0.05 0.10 0.15 0.20 0.25 0.30 0.354000
4500
5000
5500
6000
6500
7000
7500
8000
8500
T (K
)
Period (days)
Figure 4. Correlation between the pulsating period and the effective tem-perature for δ Scuti variable stars with periods shorter than 0.35 d. A groupof 131 UCVs (green dots) is shown to be distinguished from the normalones (blue dots). The dashed red lines represent their borders. The UCVshave temperatures lower than 6700 K with pulsating periods in the rangefrom 0.09 to 0.22 d. The solid red line indicates that there is a good relationbetween the period and the effective temperature for normal δ Scuti starswith period shorter than 0.35 d.
spectral types are listed. This table is available at the website4 viathe internet. For about 241 δ Scuti stars, only spectral type was ob-tained by LAMOST. Both spectral types and stellar atmosphericparameters were determined for 525 δ Scuti stars. In order to pro-vide more information to the readers, the original LAMOST stel-lar parameter for UCVs and NDSTs are also included in the table.In total, 182 sets of spectroscopic observations for 131 UCVs and661 sets of data for 394 NDSTs are also catalogued in this table
4 http://search.vbscn.com/DSCT.LAMOSTdata.txt
that contains 16 columns. As those shown in Tables 2 and 3, thefirst three columns include the star names, their right ascensionsRA and declinations DEC. The types of light variation and pulsat-ing periods are listed in columns 4 and 5. These parameters arefrom VSX catalogue. The types of light variation are defined in theGCVS variability classification scheme5 (e.g., Samus et al. 2017).Column 6 lists the distances (in arcsec) between the two positionsdetermined by the coordinates given in VSX and by LAMOST. Aspointed by Qian et al. (2017a), the distances were used to identifythose δ Scuti variable stars from the LAMOST samples based onthe criterion Dist< 2 arcsec. For most of the targets, the values ofDist are smaller than 0.1 arcsecs. However, the Dist values of sev-eral δ Scuti are larger than 1 arcsec. We have checked their stellarcharts by using the coordinates given in VSX and by LAMOST. Itis shown that they are the same stars and their results are not fordifferent objects. The differences may be caused by the fact thatthe coordinates for a few targets are not given in high precision.The observing dates are shown in column 7, while the determinedspectral types are listed in columns 8. The stellar atmospheric pa-rameters including T , logg, [Fe/H], and Vr), are listed in columns9, 11, 13, and 15. Their corresponding errors E1 , E2, E3 , and E4are also displayed in the table, respectively.
3 DISTRIBUTIONS OF STELLAR ATMOSPHERIC
PARAMETERS AND BINARITIES FOR δ SCUTI
VARIABLES
As aforementioned, the stellar atmospheric parameters of 525 δScuti pulsating stars were determined. In this section, we inves-tigate the properties of the δ Scuti stars by using those spectro-scopic data listed in Tables 2 and 3. During the analyses, when theδ Scuti variables were observed two times or more by LAMOST,the weighted mean values of all individuals are used and the weightis the inverse square of the original error from each observation. Asfor the radial velocity Vr, we do not average them and use the in-dividual values. The distribution of the effective temperature for
5 http://www.sai.msu.su//gcvs/gcvs/iii/vartype.txt
MNRAS 000, 1–15 (2017)
7
4500 5000 5500 6000 6500 7000 7500 8000 85000
10
20
30
40
50
60
70
80
90
100
N
T (K)
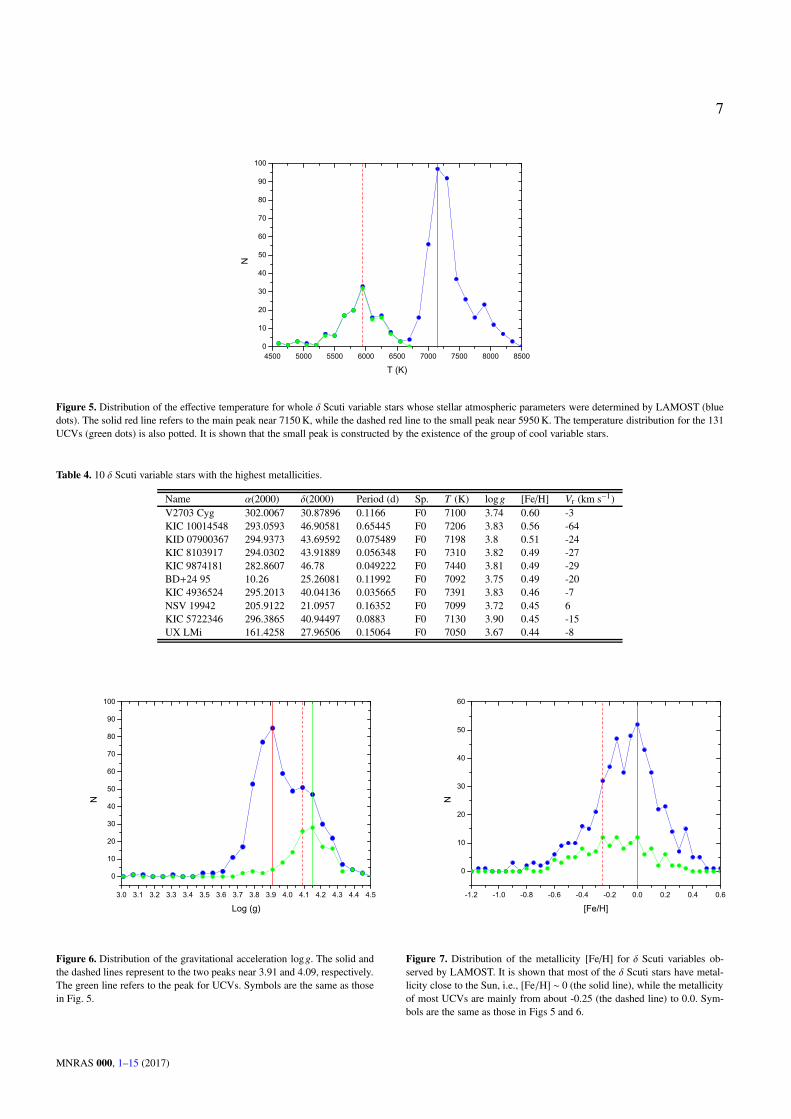
Figure 5. Distribution of the effective temperature for whole δ Scuti variable stars whose stellar atmospheric parameters were determined by LAMOST (bluedots). The solid red line refers to the main peak near 7150 K, while the dashed red line to the small peak near 5950 K. The temperature distribution for the 131UCVs (green dots) is also potted. It is shown that the small peak is constructed by the existence of the group of cool variable stars.
Table 4. 10 δ Scuti variable stars with the highest metallicities.
Name α(2000) δ(2000) Period (d) Sp. T (K) logg [Fe/H] Vr (km s−1)V2703 Cyg 302.0067 30.87896 0.1166 F0 7100 3.74 0.60 -3KIC 10014548 293.0593 46.90581 0.65445 F0 7206 3.83 0.56 -64KID 07900367 294.9373 43.69592 0.075489 F0 7198 3.8 0.51 -24KIC 8103917 294.0302 43.91889 0.056348 F0 7310 3.82 0.49 -27KIC 9874181 282.8607 46.78 0.049222 F0 7440 3.81 0.49 -29BD+24 95 10.26 25.26081 0.11992 F0 7092 3.75 0.49 -20KIC 4936524 295.2013 40.04136 0.035665 F0 7391 3.83 0.46 -7NSV 19942 205.9122 21.0957 0.16352 F0 7099 3.72 0.45 6KIC 5722346 296.3865 40.94497 0.0883 F0 7130 3.90 0.45 -15UX LMi 161.4258 27.96506 0.15064 F0 7050 3.67 0.44 -8
3.0 3.1 3.2 3.3 3.4 3.5 3.6 3.7 3.8 3.9 4.0 4.1 4.2 4.3 4.4 4.5
0
10
20
30
40
50
60
70
80
90
100
N
Log (g)
Figure 6. Distribution of the gravitational acceleration logg. The solid andthe dashed lines represent to the two peaks near 3.91 and 4.09, respectively.The green line refers to the peak for UCVs. Symbols are the same as thosein Fig. 5.
-1.2 -1.0 -0.8 -0.6 -0.4 -0.2 0.0 0.2 0.4 0.6
0
10
20
30
40
50
60
N
[Fe/H]
Figure 7. Distribution of the metallicity [Fe/H] for δ Scuti variables ob-served by LAMOST. It is shown that most of the δ Scuti stars have metal-licity close to the Sun, i.e., [Fe/H] ∼ 0 (the solid line), while the metallicityof most UCVs are mainly from about -0.25 (the dashed line) to 0.0. Sym-bols are the same as those in Figs 5 and 6.
MNRAS 000, 1–15 (2017)
8
Table 5. 50 δ Scuti pilsating stars with the difference of radial velocity larger than 15 km s−1.
Name Period (d) Dates Times T (K) logg [Fe/H] VLow VHigh ∆V
KIC 5722346 0.0883 2013-10-05–2015-10-08 3 7130 3.90 0.45 -53 11 64ASAS J081813-0049.8 0.139603 2013-11-25–2015-02-05 2 7129 3.80 0.21 -47 11 58KIC 10014548 0.65445 2012-06-04–2017-06-14 11 7206 3.83 0.56 -102 -50 52ASAS J085536+0215.5 0.207902 2012-02-10–2016-04-03 3 5970 4.30 -0.36 -25 18 43ASAS J022414+2741.6 0.155998 2013-10-06–2017-01-28 2 5713 4.26 -0.05 -85 -44.45 40.55ASAS J154613-0026.1 0.068991 2012-05-16–2016-05-18 3 7458 4.05 -0.37 -10 27 37NSVS 11000901 0.39787221 2017-04-22–2017-06-11 2 6899 4.10 -0.20 -49.3 -13.65 35.65KIC 4252757 0.046555 2012-06-15–2014-06-02 2 7541 3.95 -0.09 -68 -34 34KIC 7350486 0.75188 2013-09-26–2017-06-15 4 7127 3.89 0.10 -59 -25 34KIC 3634384 0.085852 2012-06-15–2014-06-02 3 7360 3.87 0.10 -5 27 32BS Cnc 0.051 2015-03-08–2016-02-24 4 7471 3.89 0.07 5 36 31KIC 5476864 0.59988 2013-10-05–2014-05-22 2 7068 4.08 0.09 -38 -9 29KID 4252716 0.076184 2012-06-15–2017-06-03 2 7505 3.86 -0.06 -40 -11.89 28.11KIC 3942911 0.03391 2012-06-15–2015-10-12 6 7438 3.96 0.05 -39 -11 28ASAS J125114+0917.7 0.182872 2014-01-13–2017-05-17 2 5795 4.18 0.03 -14 13.9 27.9NSVS 3820963 0.16784703 2014-11-04–2015-12-28 2 5660 4.26 -0.13 -98 -71 27BD+24 95 0.11992 2012-09-29–2013-12-19 4 7092 3.75 0.49 -33 -7 26KIC 9391395 0.51308 2014-05-02–2017-06-15 7 7236 4.05 -0.19 -30 -4 26KIC 11193046 0.78431 2013-05-22–2017-05-16 3 7993 3.92 -0.12 -25 0.6 25.6KIC 8429756 0.036041 2013-05-19–2015-10-11 2 7457 3.85 -0.06 -31 -6 25LINEAR 9272851 0.080104 2016-01-13–2016-02-06 2 7192 4.26 -0.88 249 273 24ASAS J075428+1407.8 0.189175 2013-02-15–2013-12-14 3 6073 4.29 -0.41 29 53 24ASAS J113810+1905.1 0.153786 2015-12-21–2017-05-15 2 5806 3.97 -0.21 -35.13 -12 23.13V0367 Cam 0.121596 2012-01-13–2016-01-19 4 7307 3.84 0.26 -16 7 23KIC 5768203 0.12807 2013-10-07–2017-06-07 2 6962 4.28 -0.59 -33 -10.27 22.73KIC 9072011 0.16351 2014-05-29–2017-05-14 2 7026 3.69 0.23 -34 -13.08 20.92NSV 19942 0.16352 2015-01-23–2017-06-07 3 7099 3.72 0.45 -2 18.27 20.27KIC 3119604 0.024301 2012-06-15–2017-06-13 2 7940 4.20 -0.26 -50 -30.42 19.58KIC 9450940 0.033337 2014-05-29–2015-10-06 3 7922 4.08 -0.20 -61 -42 19KIC 7106205 0.074655 2013-05-19–2017-06-15 10 7173 3.86 0.13 -29 -10 19ASAS J064626+2629.8 0.205972 2012-03-11–2016-01-18 4 6613 4.19 -0.25 0 19 19ASAS J083952+0052.4 0.133043 2013-03-24–2013-03-24 2 4660 4.37 0.03 51 70 19KID 6593488 0.10101 2015-09-25–2016-05-18 3 7026 3.96 -0.09 -42 -24 18BD+38 2361 0.049839 2014-01-12–2016-01-28 2 7411 3.97 -0.08 -34 -16 18KIC 8460993 0.05535 2013-09-25–2017-06-14 3 7193 3.90 0.25 -68 -50 18KIC 9700679 3.81679 2013-10-04–2017-06-15 5 5491 3.17 0.10 -23 -5.06 17.94KIC 9473000 0.11496 2012-06-04–2017-05-16 2 7376 3.99 0.04 -31.03 -14 17.03GSC 01946-00035 0.06708077 2013-12-01–2014-12-02 4 7267 4.00 -0.03 59 76 17ASAS J190751+4629.2 0.079561 2013-10-04–2015-05-30 4 7174 3.91 0.19 -71 -54 17NSVS 9420734 0.19695349 2014-09-17–2016-02-10 3 6015 3.97 0.04 -20 -3 17ASAS J163007+0125.2 0.160533 2013-03-24–2013-03-24 2 5542 4.26 -0.26 -33 -16 17KIC 5272673 0.059492 2012-06-17–2017-06-13 3 7156 3.95 0.38 -45 -28.26 16.74KID 2304168 0.123344 2012-06-15–2017-06-13 2 7222 3.86 0.09 -32 -15.42 16.58HAT 199-00623 0.29481 2012-06-17–2015-10-18 2 6930 3.49 0.42 -75 -59 16KIC 9052363 0.023829 2013-09-25–2015-10-03 3 7840 4.08 -0.15 -32 -16 16KIC 9156808 0.046995 2014-09-13–2017-06-14 3 7139 4.11 -0.03 -26 -10.56 15.44ASAS J093944+0010.3 0.196522 2012-02-16–2015-01-03 2 6170 4.15 -0.22 29 44 15NSVS 9431318 0.17746757 2013-02-09–2014-11-01 3 6089 4.08 -0.56 49 64 151SWASP J032748.43+343810.3 0.11771 2013-09-14–2014-11-01 2 7166 3.95 -0.25 -30 -15 15KIC 7977996 0.090662 2013-10-05–2015-10-08 2 7318 4.14 -0.11 2 17 15
525 δ Scuti stars observed by LAMOST is shown in Fig. 5 as bluedots. As displayed in the figure, there are two peaks in the distri-bution. The main peak is at 7150 K, while the other small peak isnear 5950 K. Also shown in the figure as green dots is the tem-perature distribution for the 131 UCVs. It suggests that the smallpeak is caused by the existence of the UCVs indicating that theyare solar-type cool stars.
The distribution of the gravitational acceleration logg is plot-ted in Fig. 6. The main peak of the distribution is near 3.91. Apartfrom the main peak, there is a small peak at 4.09. These propertiesreveal that δ Scuti variable stars populate on the instability strip
slightly above the zero-age main sequence (ZAMS), the main se-quence, and the early stages of H-shell burning. The green dots inthe figure represent the distribution of the gravitational accelerationlogg for UCVs where the peak is at 4.15 indicating that their grav-itational accelerations are higher than the others. The metallicity([Fe/H]) distribution is shown in Fig. 7. The peak of the distribu-tion is near [Fe/H] ∼ 0 indicating that most of the δ Scuti variableshave metallicity close to that of the Sun. 10 δ Scuti stars have thehighest metallicities are shown in Table 4. As those in Figs 5 and6, the green dots in Fig. 7 refer to the distribution for UCVs. It is
MNRAS 000, 1–15 (2017)
9
Table 6. 38 δ Scuti variable stars with radial velocities higher than 70 km s−1.
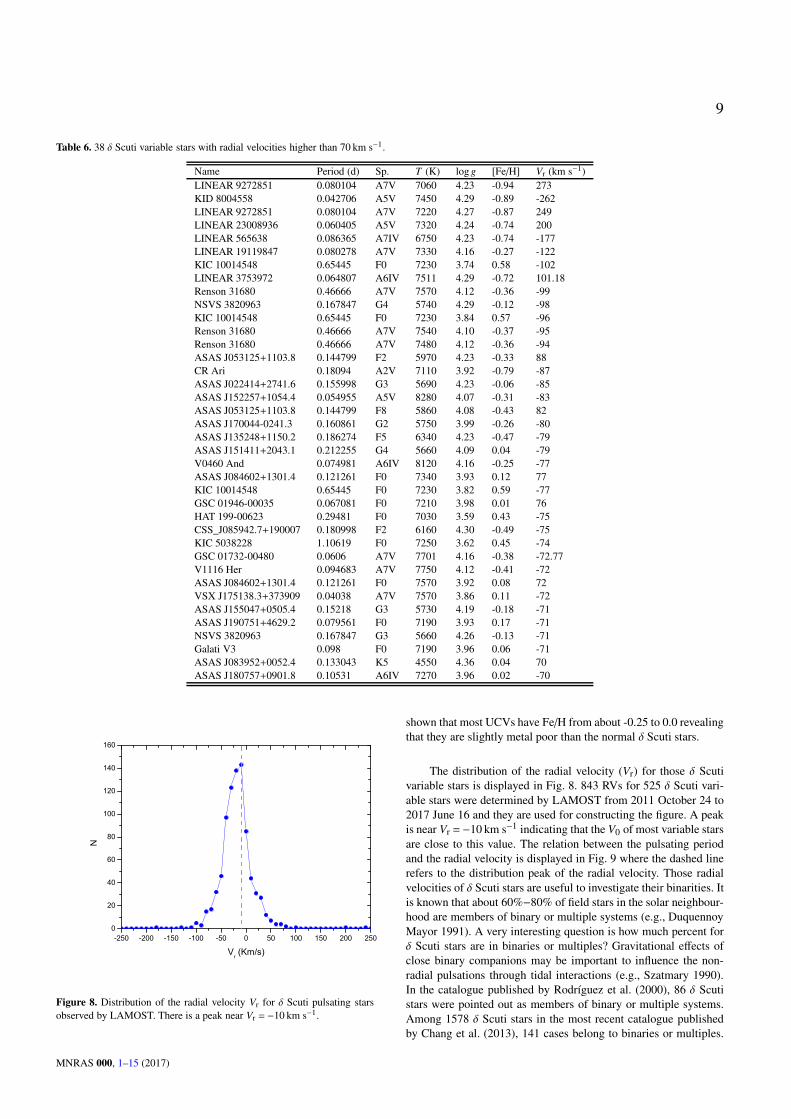
Name Period (d) Sp. T (K) log g [Fe/H] Vr (km s−1)LINEAR 9272851 0.080104 A7V 7060 4.23 -0.94 273KID 8004558 0.042706 A5V 7450 4.29 -0.89 -262LINEAR 9272851 0.080104 A7V 7220 4.27 -0.87 249LINEAR 23008936 0.060405 A5V 7320 4.24 -0.74 200LINEAR 565638 0.086365 A7IV 6750 4.23 -0.74 -177LINEAR 19119847 0.080278 A7V 7330 4.16 -0.27 -122KIC 10014548 0.65445 F0 7230 3.74 0.58 -102LINEAR 3753972 0.064807 A6IV 7511 4.29 -0.72 101.18Renson 31680 0.46666 A7V 7570 4.12 -0.36 -99NSVS 3820963 0.167847 G4 5740 4.29 -0.12 -98KIC 10014548 0.65445 F0 7230 3.84 0.57 -96Renson 31680 0.46666 A7V 7540 4.10 -0.37 -95Renson 31680 0.46666 A7V 7480 4.12 -0.36 -94ASAS J053125+1103.8 0.144799 F2 5970 4.23 -0.33 88CR Ari 0.18094 A2V 7110 3.92 -0.79 -87ASAS J022414+2741.6 0.155998 G3 5690 4.23 -0.06 -85ASAS J152257+1054.4 0.054955 A5V 8280 4.07 -0.31 -83ASAS J053125+1103.8 0.144799 F8 5860 4.08 -0.43 82ASAS J170044-0241.3 0.160861 G2 5750 3.99 -0.26 -80ASAS J135248+1150.2 0.186274 F5 6340 4.23 -0.47 -79ASAS J151411+2043.1 0.212255 G4 5660 4.09 0.04 -79V0460 And 0.074981 A6IV 8120 4.16 -0.25 -77ASAS J084602+1301.4 0.121261 F0 7340 3.93 0.12 77KIC 10014548 0.65445 F0 7230 3.82 0.59 -77GSC 01946-00035 0.067081 F0 7210 3.98 0.01 76HAT 199-00623 0.29481 F0 7030 3.59 0.43 -75CSS_J085942.7+190007 0.180998 F2 6160 4.30 -0.49 -75KIC 5038228 1.10619 F0 7250 3.62 0.45 -74GSC 01732-00480 0.0606 A7V 7701 4.16 -0.38 -72.77V1116 Her 0.094683 A7V 7750 4.12 -0.41 -72ASAS J084602+1301.4 0.121261 F0 7570 3.92 0.08 72VSX J175138.3+373909 0.04038 A7V 7570 3.86 0.11 -72ASAS J155047+0505.4 0.15218 G3 5730 4.19 -0.18 -71ASAS J190751+4629.2 0.079561 F0 7190 3.93 0.17 -71NSVS 3820963 0.167847 G3 5660 4.26 -0.13 -71Galati V3 0.098 F0 7190 3.96 0.06 -71ASAS J083952+0052.4 0.133043 K5 4550 4.36 0.04 70ASAS J180757+0901.8 0.10531 A6IV 7270 3.96 0.02 -70
-250 -200 -150 -100 -50 0 50 100 150 200 2500
20
40
60
80
100
120
140
160
N
Vr (Km/s)
Figure 8. Distribution of the radial velocity Vr for δ Scuti pulsating starsobserved by LAMOST. There is a peak near Vr = −10 km s−1.
shown that most UCVs have Fe/H from about -0.25 to 0.0 revealingthat they are slightly metal poor than the normal δ Scuti stars.
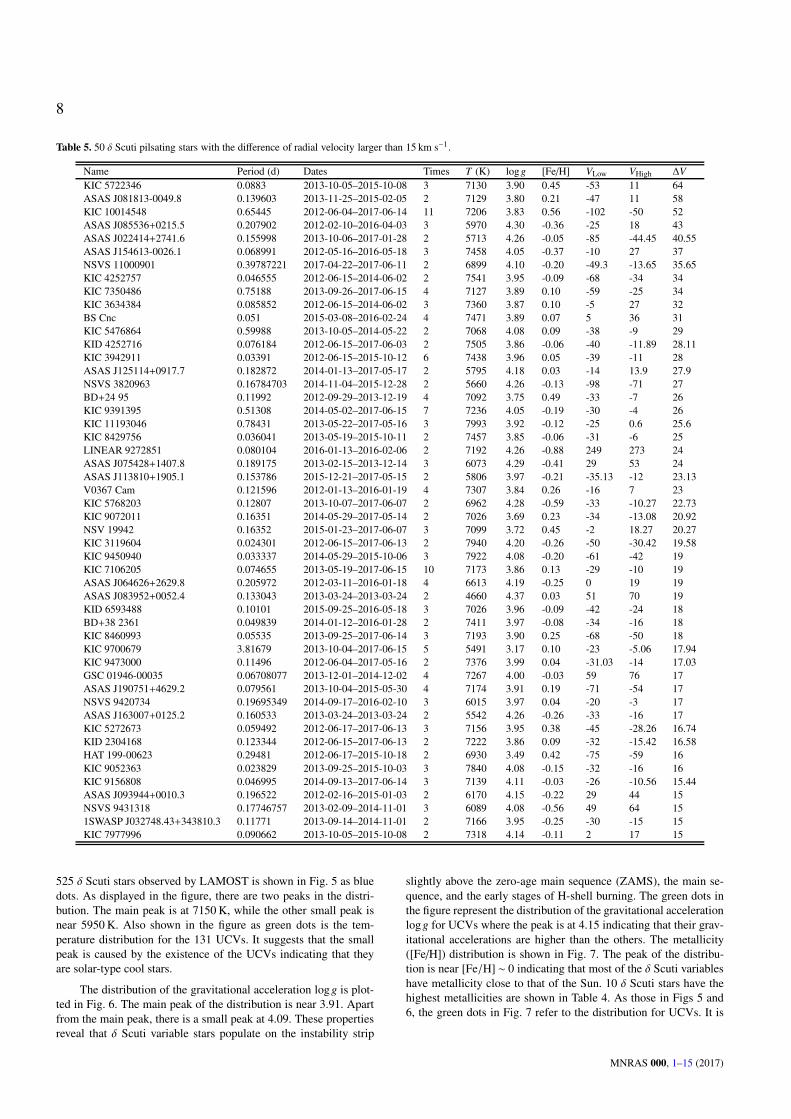
The distribution of the radial velocity (Vr) for those δ Scutivariable stars is displayed in Fig. 8. 843 RVs for 525 δ Scuti vari-able stars were determined by LAMOST from 2011 October 24 to2017 June 16 and they are used for constructing the figure. A peakis near Vr = −10 km s−1 indicating that the V0 of most variable starsare close to this value. The relation between the pulsating periodand the radial velocity is displayed in Fig. 9 where the dashed linerefers to the distribution peak of the radial velocity. Those radialvelocities of δ Scuti stars are useful to investigate their binarities. Itis known that about 60%−80% of field stars in the solar neighbour-hood are members of binary or multiple systems (e.g., DuquennoyMayor 1991). A very interesting question is how much percent forδ Scuti stars are in binaries or multiples? Gravitational effects ofclose binary companions may be important to influence the non-radial pulsations through tidal interactions (e.g., Szatmary 1990).In the catalogue published by Rodríguez et al. (2000), 86 δ Scutistars were pointed out as members of binary or multiple systems.Among 1578 δ Scuti stars in the most recent catalogue publishedby Chang et al. (2013), 141 cases belong to binaries or multiples.
MNRAS 000, 1–15 (2017)
10
0.00 0.05 0.10 0.15 0.20 0.25 0.30 0.35-300
-250
-200
-150
-100
-50
0
50
100
150
200
250
300
Vr (d
ays)
Period (days)
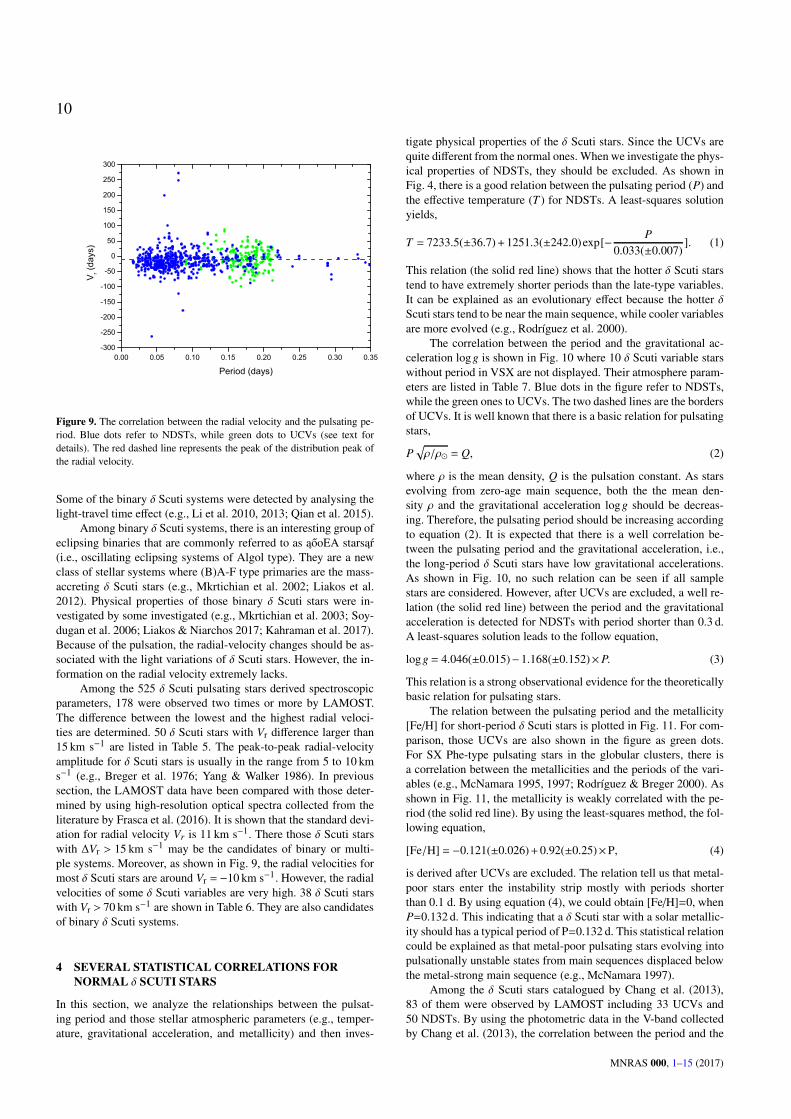
Figure 9. The correlation between the radial velocity and the pulsating pe-riod. Blue dots refer to NDSTs, while green dots to UCVs (see text fordetails). The red dashed line represents the peak of the distribution peak ofthe radial velocity.
Some of the binary δ Scuti systems were detected by analysing thelight-travel time effect (e.g., Li et al. 2010, 2013; Qian et al. 2015).
Among binary δ Scuti systems, there is an interesting group ofeclipsing binaries that are commonly referred to as aooEA starsar(i.e., oscillating eclipsing systems of Algol type). They are a newclass of stellar systems where (B)A-F type primaries are the mass-accreting δ Scuti stars (e.g., Mkrtichian et al. 2002; Liakos et al.2012). Physical properties of those binary δ Scuti stars were in-vestigated by some investigated (e.g., Mkrtichian et al. 2003; Soy-dugan et al. 2006; Liakos & Niarchos 2017; Kahraman et al. 2017).Because of the pulsation, the radial-velocity changes should be as-sociated with the light variations of δ Scuti stars. However, the in-formation on the radial velocity extremely lacks.
Among the 525 δ Scuti pulsating stars derived spectroscopicparameters, 178 were observed two times or more by LAMOST.The difference between the lowest and the highest radial veloci-ties are determined. 50 δ Scuti stars with Vr difference larger than15 km s−1 are listed in Table 5. The peak-to-peak radial-velocityamplitude for δ Scuti stars is usually in the range from 5 to 10 kms−1 (e.g., Breger et al. 1976; Yang & Walker 1986). In previoussection, the LAMOST data have been compared with those deter-mined by using high-resolution optical spectra collected from theliterature by Frasca et al. (2016). It is shown that the standard devi-ation for radial velocity Vr is 11 km s−1. There those δ Scuti starswith ∆Vr > 15 km s−1 may be the candidates of binary or multi-ple systems. Moreover, as shown in Fig. 9, the radial velocities formost δ Scuti stars are around Vr = −10 km s−1. However, the radialvelocities of some δ Scuti variables are very high. 38 δ Scuti starswith Vr > 70 km s−1 are shown in Table 6. They are also candidatesof binary δ Scuti systems.
4 SEVERAL STATISTICAL CORRELATIONS FOR
NORMAL δ SCUTI STARS
In this section, we analyze the relationships between the pulsat-ing period and those stellar atmospheric parameters (e.g., temper-ature, gravitational acceleration, and metallicity) and then inves-
tigate physical properties of the δ Scuti stars. Since the UCVs arequite different from the normal ones. When we investigate the phys-ical properties of NDSTs, they should be excluded. As shown inFig. 4, there is a good relation between the pulsating period (P) andthe effective temperature (T ) for NDSTs. A least-squares solutionyields,
T = 7233.5(±36.7)+1251.3(±242.0)exp[−P
0.033(±0.007)]. (1)
This relation (the solid red line) shows that the hotter δ Scuti starstend to have extremely shorter periods than the late-type variables.It can be explained as an evolutionary effect because the hotter δScuti stars tend to be near the main sequence, while cooler variablesare more evolved (e.g., Rodríguez et al. 2000).
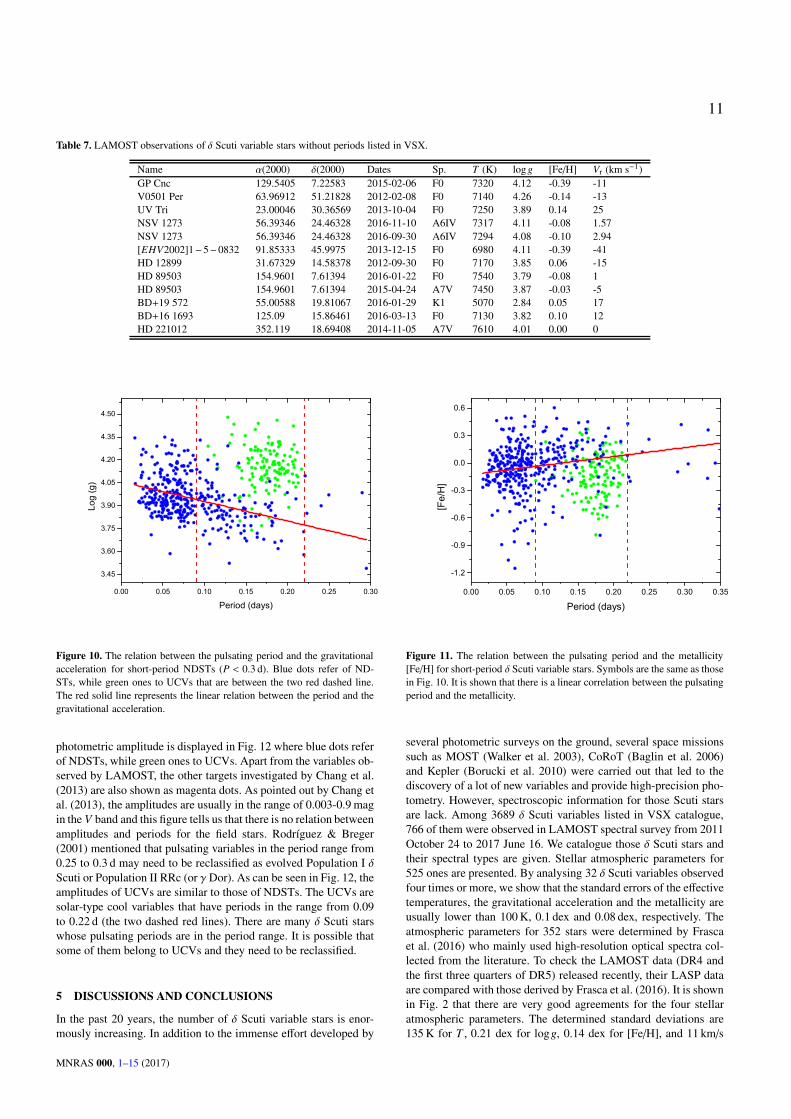
The correlation between the period and the gravitational ac-celeration logg is shown in Fig. 10 where 10 δ Scuti variable starswithout period in VSX are not displayed. Their atmosphere param-eters are listed in Table 7. Blue dots in the figure refer to NDSTs,while the green ones to UCVs. The two dashed lines are the bordersof UCVs. It is well known that there is a basic relation for pulsatingstars,
P√
ρ/ρ⊙ = Q, (2)
where ρ is the mean density, Q is the pulsation constant. As starsevolving from zero-age main sequence, both the the mean den-sity ρ and the gravitational acceleration logg should be decreas-ing. Therefore, the pulsating period should be increasing accordingto equation (2). It is expected that there is a well correlation be-tween the pulsating period and the gravitational acceleration, i.e.,the long-period δ Scuti stars have low gravitational accelerations.As shown in Fig. 10, no such relation can be seen if all samplestars are considered. However, after UCVs are excluded, a well re-lation (the solid red line) between the period and the gravitationalacceleration is detected for NDSTs with period shorter than 0.3 d.A least-squares solution leads to the follow equation,
logg = 4.046(±0.015)−1.168(±0.152)×P. (3)
This relation is a strong observational evidence for the theoreticallybasic relation for pulsating stars.
The relation between the pulsating period and the metallicity[Fe/H] for short-period δ Scuti stars is plotted in Fig. 11. For com-parison, those UCVs are also shown in the figure as green dots.For SX Phe-type pulsating stars in the globular clusters, there isa correlation between the metallicities and the periods of the vari-ables (e.g., McNamara 1995, 1997; Rodríguez & Breger 2000). Asshown in Fig. 11, the metallicity is weakly correlated with the pe-riod (the solid red line). By using the least-squares method, the fol-lowing equation,
[Fe/H] = −0.121(±0.026)+0.92(±0.25)×P, (4)
is derived after UCVs are excluded. The relation tell us that metal-poor stars enter the instability strip mostly with periods shorterthan 0.1 d. By using equation (4), we could obtain [Fe/H]=0, whenP=0.132 d. This indicating that a δ Scuti star with a solar metallic-ity should has a typical period of P=0.132 d. This statistical relationcould be explained as that metal-poor pulsating stars evolving intopulsationally unstable states from main sequences displaced belowthe metal-strong main sequence (e.g., McNamara 1997).
Among the δ Scuti stars catalogued by Chang et al. (2013),83 of them were observed by LAMOST including 33 UCVs and50 NDSTs. By using the photometric data in the V-band collectedby Chang et al. (2013), the correlation between the period and the
MNRAS 000, 1–15 (2017)
11
Table 7. LAMOST observations of δ Scuti variable stars without periods listed in VSX.
Name α(2000) δ(2000) Dates Sp. T (K) logg [Fe/H] Vr (km s−1)GP Cnc 129.5405 7.22583 2015-02-06 F0 7320 4.12 -0.39 -11V0501 Per 63.96912 51.21828 2012-02-08 F0 7140 4.26 -0.14 -13UV Tri 23.00046 30.36569 2013-10-04 F0 7250 3.89 0.14 25NSV 1273 56.39346 24.46328 2016-11-10 A6IV 7317 4.11 -0.08 1.57NSV 1273 56.39346 24.46328 2016-09-30 A6IV 7294 4.08 -0.10 2.94[EHV2002]1−5−0832 91.85333 45.9975 2013-12-15 F0 6980 4.11 -0.39 -41HD 12899 31.67329 14.58378 2012-09-30 F0 7170 3.85 0.06 -15HD 89503 154.9601 7.61394 2016-01-22 F0 7540 3.79 -0.08 1HD 89503 154.9601 7.61394 2015-04-24 A7V 7450 3.87 -0.03 -5BD+19 572 55.00588 19.81067 2016-01-29 K1 5070 2.84 0.05 17BD+16 1693 125.09 15.86461 2016-03-13 F0 7130 3.82 0.10 12HD 221012 352.119 18.69408 2014-11-05 A7V 7610 4.01 0.00 0
0.00 0.05 0.10 0.15 0.20 0.25 0.30
3.45
3.60
3.75
3.90
4.05
4.20
4.35
4.50
Log
(g)
Period (days)
Figure 10. The relation between the pulsating period and the gravitationalacceleration for short-period NDSTs (P < 0.3 d). Blue dots refer of ND-STs, while green ones to UCVs that are between the two red dashed line.The red solid line represents the linear relation between the period and thegravitational acceleration.
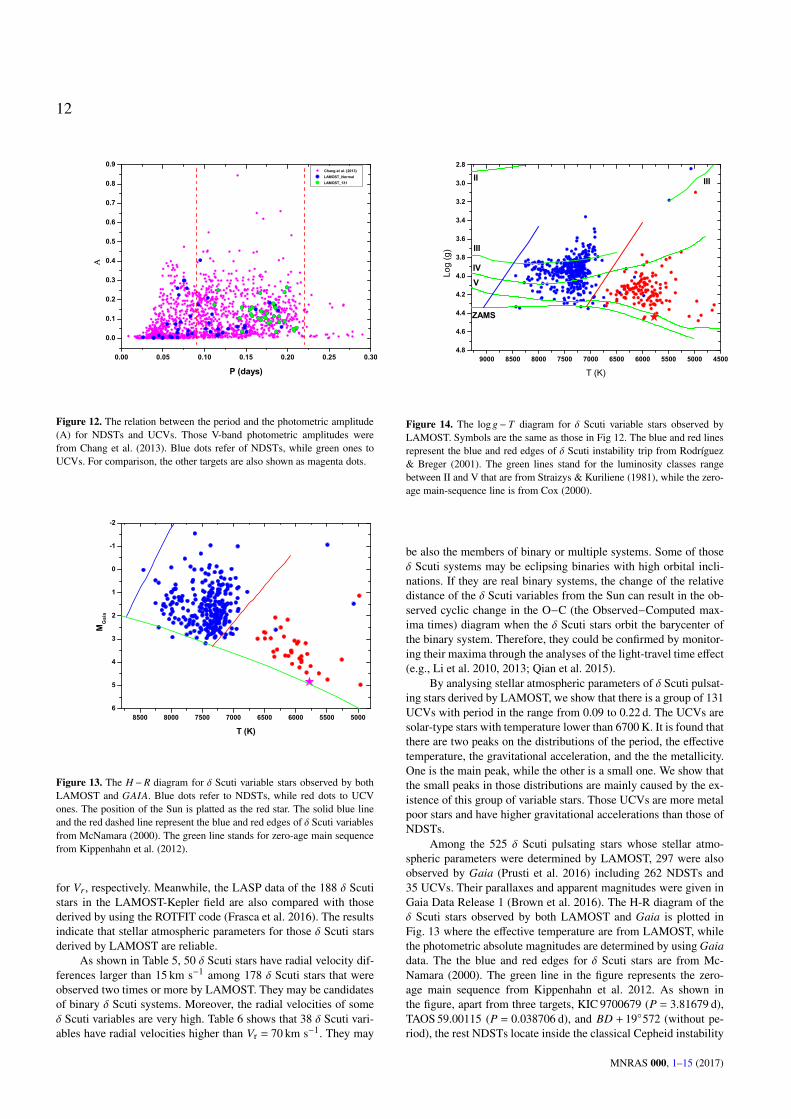
photometric amplitude is displayed in Fig. 12 where blue dots referof NDSTs, while green ones to UCVs. Apart from the variables ob-served by LAMOST, the other targets investigated by Chang et al.(2013) are also shown as magenta dots. As pointed out by Chang etal. (2013), the amplitudes are usually in the range of 0.003-0.9 magin the V band and this figure tells us that there is no relation betweenamplitudes and periods for the field stars. Rodríguez & Breger(2001) mentioned that pulsating variables in the period range from0.25 to 0.3 d may need to be reclassified as evolved Population I δScuti or Population II RRc (or γ Dor). As can be seen in Fig. 12, theamplitudes of UCVs are similar to those of NDSTs. The UCVs aresolar-type cool variables that have periods in the range from 0.09to 0.22 d (the two dashed red lines). There are many δ Scuti starswhose pulsating periods are in the period range. It is possible thatsome of them belong to UCVs and they need to be reclassified.
5 DISCUSSIONS AND CONCLUSIONS
In the past 20 years, the number of δ Scuti variable stars is enor-mously increasing. In addition to the immense effort developed by
0.00 0.05 0.10 0.15 0.20 0.25 0.30 0.35
-1.2
-0.9
-0.6
-0.3
0.0
0.3
0.6
[Fe/
H]
Period (days)
Figure 11. The relation between the pulsating period and the metallicity[Fe/H] for short-period δ Scuti variable stars. Symbols are the same as thosein Fig. 10. It is shown that there is a linear correlation between the pulsatingperiod and the metallicity.
several photometric surveys on the ground, several space missionssuch as MOST (Walker et al. 2003), CoRoT (Baglin et al. 2006)and Kepler (Borucki et al. 2010) were carried out that led to thediscovery of a lot of new variables and provide high-precision pho-tometry. However, spectroscopic information for those Scuti starsare lack. Among 3689 δ Scuti variables listed in VSX catalogue,766 of them were observed in LAMOST spectral survey from 2011October 24 to 2017 June 16. We catalogue those δ Scuti stars andtheir spectral types are given. Stellar atmospheric parameters for525 ones are presented. By analysing 32 δ Scuti variables observedfour times or more, we show that the standard errors of the effectivetemperatures, the gravitational acceleration and the metallicity areusually lower than 100 K, 0.1 dex and 0.08 dex, respectively. Theatmospheric parameters for 352 stars were determined by Frascaet al. (2016) who mainly used high-resolution optical spectra col-lected from the literature. To check the LAMOST data (DR4 andthe first three quarters of DR5) released recently, their LASP dataare compared with those derived by Frasca et al. (2016). It is shownin Fig. 2 that there are very good agreements for the four stellaratmospheric parameters. The determined standard deviations are135 K for T , 0.21 dex for logg, 0.14 dex for [Fe/H], and 11 km/s
MNRAS 000, 1–15 (2017)
12
0.00 0.05 0.10 0.15 0.20 0.25 0.30
0.0
0.1
0.2
0.3
0.4
0.5
0.6
0.7
0.8
0.9
P (days)
Chang et al. (2013) LAMOST_Normal LAMOST_131
Figure 12. The relation between the period and the photometric amplitude(A) for NDSTs and UCVs. Those V-band photometric amplitudes werefrom Chang et al. (2013). Blue dots refer of NDSTs, while green ones toUCVs. For comparison, the other targets are also shown as magenta dots.
8500 8000 7500 7000 6500 6000 5500 50006
5
4
3
2
1
0
-1
-2
MGaia
T (K)
Figure 13. The H −R diagram for δ Scuti variable stars observed by bothLAMOST and GAIA. Blue dots refer to NDSTs, while red dots to UCVones. The position of the Sun is platted as the red star. The solid blue lineand the red dashed line represent the blue and red edges of δ Scuti variablesfrom McNamara (2000). The green line stands for zero-age main sequencefrom Kippenhahn et al. (2012).
for Vr, respectively. Meanwhile, the LASP data of the 188 δ Scutistars in the LAMOST-Kepler field are also compared with thosederived by using the ROTFIT code (Frasca et al. 2016). The resultsindicate that stellar atmospheric parameters for those δ Scuti starsderived by LAMOST are reliable.
As shown in Table 5, 50 δ Scuti stars have radial velocity dif-ferences larger than 15 km s−1 among 178 δ Scuti stars that wereobserved two times or more by LAMOST. They may be candidatesof binary δ Scuti systems. Moreover, the radial velocities of someδ Scuti variables are very high. Table 6 shows that 38 δ Scuti vari-ables have radial velocities higher than Vr = 70 km s−1. They may
9000 8500 8000 7500 7000 6500 6000 5500 5000 45004.8
4.6
4.4
4.2
4.0
3.8
3.6
3.4
3.2
3.0
2.8
II III
Log
(g)
T (K)
III
IV
V
ZAMS
Figure 14. The log g− T diagram for δ Scuti variable stars observed byLAMOST. Symbols are the same as those in Fig 12. The blue and red linesrepresent the blue and red edges of δ Scuti instability trip from Rodríguez& Breger (2001). The green lines stand for the luminosity classes rangebetween II and V that are from Straizys & Kuriliene (1981), while the zero-age main-sequence line is from Cox (2000).
be also the members of binary or multiple systems. Some of thoseδ Scuti systems may be eclipsing binaries with high orbital incli-nations. If they are real binary systems, the change of the relativedistance of the δ Scuti variables from the Sun can result in the ob-served cyclic change in the O−C (the Observed−Computed max-ima times) diagram when the δ Scuti stars orbit the barycenter ofthe binary system. Therefore, they could be confirmed by monitor-ing their maxima through the analyses of the light-travel time effect(e.g., Li et al. 2010, 2013; Qian et al. 2015).
By analysing stellar atmospheric parameters of δ Scuti pulsat-ing stars derived by LAMOST, we show that there is a group of 131UCVs with period in the range from 0.09 to 0.22 d. The UCVs aresolar-type stars with temperature lower than 6700 K. It is found thatthere are two peaks on the distributions of the period, the effectivetemperature, the gravitational acceleration, and the the metallicity.One is the main peak, while the other is a small one. We show thatthe small peaks in those distributions are mainly caused by the ex-istence of this group of variable stars. Those UCVs are more metalpoor stars and have higher gravitational accelerations than those ofNDSTs.
Among the 525 δ Scuti pulsating stars whose stellar atmo-spheric parameters were determined by LAMOST, 297 were alsoobserved by Gaia (Prusti et al. 2016) including 262 NDSTs and35 UCVs. Their parallaxes and apparent magnitudes were given inGaia Data Release 1 (Brown et al. 2016). The H-R diagram of theδ Scuti stars observed by both LAMOST and Gaia is plotted inFig. 13 where the effective temperature are from LAMOST, whilethe photometric absolute magnitudes are determined by using Gaia
data. The the blue and red edges for δ Scuti stars are from Mc-Namara (2000). The green line in the figure represents the zero-age main sequence from Kippenhahn et al. 2012. As shown inthe figure, apart from three targets, KIC 9700679 (P = 3.81679 d),TAOS 59.00115 (P = 0.038706 d), and BD + 19◦572 (without pe-riod), the rest NDSTs locate inside the classical Cepheid instability
MNRAS 000, 1–15 (2017)
13
strip, while the UCVs are far beyond the red edge of instabilitystrip. It is shown that those UCVs are more evolved than the Sun.
The relations between the gravitational acceleration (logg)and the effective temperature (T) for all variable stars observedby LAMOST is shown in Fig. 14 where blue dots refer to ND-STs, while red dots to UCVs. The position of the Sun is plot-ted as the red star. The blue and red lines in the figure stand forthe borders of δ Scuti pulsating stars. Those green lines shownrepresent stellar luminosity classes range between II and V thatare from Straizys & Kuriliene (1981), while the zero-age main-sequence line is from Cox (2000). As that shown in the H-R di-agram, it is found that all of the UCVs are beyond the red edgeof δ Scuti instability trip. Most of them are evolved from zero-age main-sequence stars with luminosity classes range betweenIV and V. One UCV, KIC 8747415, may be giant or sub-giantwith logg = 3.097. There are several targets, e.g., KIC 9700679(P = 3.81679 d), KIC 5446068 (P = 3.48432 d), BOKS-24178 (P =0.7 d), ASAS J070907+2656.7 (P = 0.043322 d), TAOS 59.00115(P = 0.038706 d), and BD + 19◦572 (without period), are beyondthe red edge of δ Scuti stars with temperatures below 6700 K. Theirperiods are not in the range between 0.09 and 0.22 days. Althoughthey were classified as NDSTs, their physical properties are specialand need to be investigated in the future. As shown in Figs 13 and14, there is a gap between zero-age main sequence and the positionof NDSTs in the H-R diagram and in the logg− T diagram. Thegaps increase with growing effective temperature (e.g., Balona &Dziembowski 2011).
Those UCVs should be excluded when we investigate thephysical properties of NDSTs because they are quite different fromthe others. It is found that there is a good relation between the ef-fective temperature (T ) and the pulsating period (P) for NDSTs. Itshows that the temperature is rapidly decreasing when the period isincreasing. This relation reveals that the hotter δ Scuti stars tend tobe near the main sequence while cooler variables are more evolved(e.g., Rodríguez et al. 2000). A well relation between the gravita-tional acceleration and the period is discovered for short-period δScuti stars with period shorter than 0.3 d (solid red line in Fig. 10).The gravitational acceleration is decreasing as the period increas-ing. This relation is a direct observational evidence for the theoret-ically basic relation in equation (3) for pulsating stars. Moreover,the metallicity is detected to be weakly correlated with the period asthat found for SX Phe-type pulsating stars in the globular clusters(e.g., McNamara 1997).
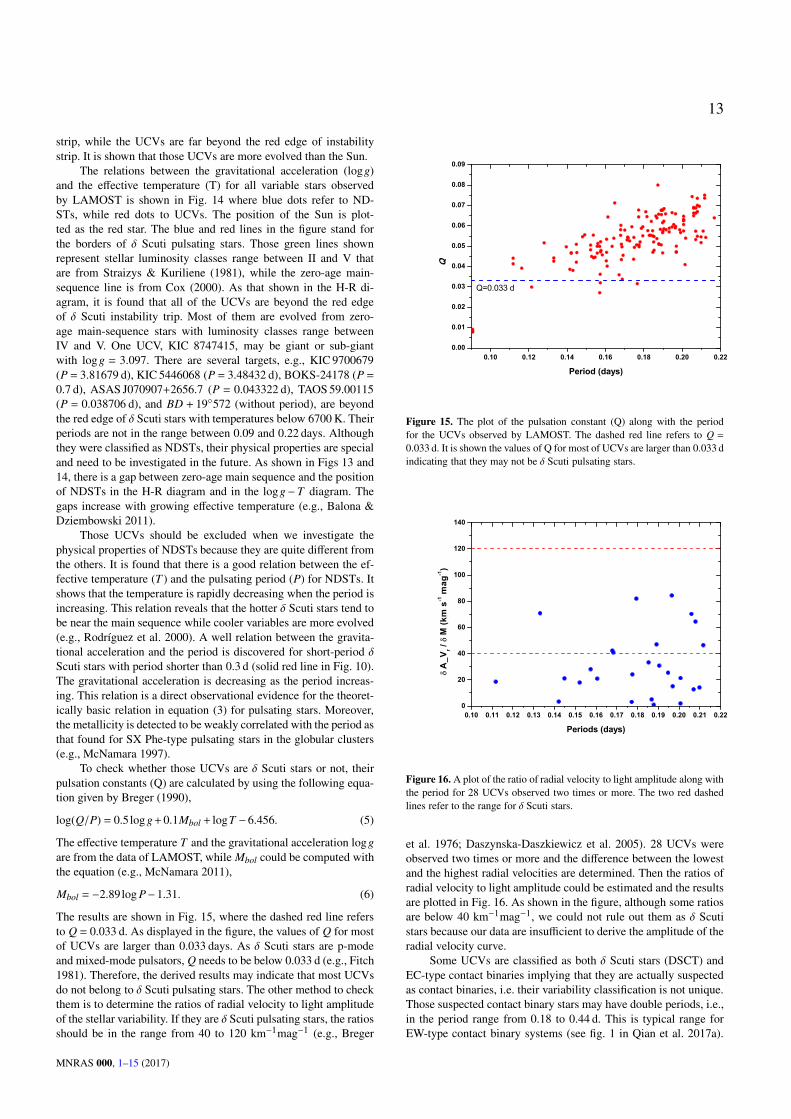
To check whether those UCVs are δ Scuti stars or not, theirpulsation constants (Q) are calculated by using the following equa-tion given by Breger (1990),
log(Q/P) = 0.5log g+0.1Mbol + logT −6.456. (5)
The effective temperature T and the gravitational acceleration logg
are from the data of LAMOST, while Mbol could be computed withthe equation (e.g., McNamara 2011),
Mbol = −2.89log P−1.31. (6)
The results are shown in Fig. 15, where the dashed red line refersto Q = 0.033 d. As displayed in the figure, the values of Q for mostof UCVs are larger than 0.033 days. As δ Scuti stars are p-modeand mixed-mode pulsators, Q needs to be below 0.033 d (e.g., Fitch1981). Therefore, the derived results may indicate that most UCVsdo not belong to δ Scuti pulsating stars. The other method to checkthem is to determine the ratios of radial velocity to light amplitudeof the stellar variability. If they are δ Scuti pulsating stars, the ratiosshould be in the range from 40 to 120 km−1mag−1 (e.g., Breger
0.10 0.12 0.14 0.16 0.18 0.20 0.220.00
0.01
0.02
0.03
0.04
0.05
0.06
0.07
0.08
0.09
Q
Period (days)
Q=0.033 d
Figure 15. The plot of the pulsation constant (Q) along with the periodfor the UCVs observed by LAMOST. The dashed red line refers to Q =
0.033 d. It is shown the values of Q for most of UCVs are larger than 0.033 dindicating that they may not be δ Scuti pulsating stars.
0.10 0.11 0.12 0.13 0.14 0.15 0.16 0.17 0.18 0.19 0.20 0.21 0.220
20
40
60
80
100
120
140
A_V
r / M
(km
s-1
mag
-1)
Periods (days)
Figure 16. A plot of the ratio of radial velocity to light amplitude along withthe period for 28 UCVs observed two times or more. The two red dashedlines refer to the range for δ Scuti stars.
et al. 1976; Daszynska-Daszkiewicz et al. 2005). 28 UCVs wereobserved two times or more and the difference between the lowestand the highest radial velocities are determined. Then the ratios ofradial velocity to light amplitude could be estimated and the resultsare plotted in Fig. 16. As shown in the figure, although some ratiosare below 40 km−1mag−1, we could not rule out them as δ Scutistars because our data are insufficient to derive the amplitude of theradial velocity curve.
Some UCVs are classified as both δ Scuti stars (DSCT) andEC-type contact binaries implying that they are actually suspectedas contact binaries, i.e. their variability classification is not unique.Those suspected contact binary stars may have double periods, i.e.,in the period range from 0.18 to 0.44 d. This is typical range forEW-type contact binary systems (see fig. 1 in Qian et al. 2017a).
MNRAS 000, 1–15 (2017)
14
Those binary stars are similar to contact systems investigated byQian et al. (2007, 2013, 2014). Moreover, as listed in Table 7,several UCVs show large radial velocity scatters indicating thatthey may be close binary stars. In this way, the derived effectivetemperatures for those sample stars are very useful during solvingtheir light curves. The other atmospheric parameters (e.g., logg and[Fe/H]) will provide us valuable information to understand theirformation and evolutionary state. Our results show that about 25%of the known δ Scuti pulsating stars may be misclassified. Theymay be close binary stars rather than δ Scuti stars. As shown inFig. 1, about 1800 objects listed in VSX are classified as δ Scutipulsating stars in the period range from 0.09 to 0.22 d. Some ofthem may need to be reclassified.
The blue edge of the instability strip for δ Scuti stars is theoret-ically well constrained (e.g., Pamyatnykh 2000). However, the rededge is rather complicated and has a large range of possibilities forthe slope and shape (e.g., Chang et al. 2013). The investigation ofsome authors (e.g., Houdek et al. 1999) indicated that oscillationsin solar-like stars are intrinsically damped and stochastically drivenby convection, while the calculations by Cheng & Xiong (1997)using the theory of Xiong (1989) predicted over stable solar oscil-lations. If some UCVs are confirmed as pulsating stars, they maybe a new-type pulsator. Their observations and investigations willshed light on theoretical instability domains and on the theories ofinteracting between the pulsation and the convection of solar-typestars. New observations and detailed investigations on UCVs aretimely and required urgently in the near future.
ACKNOWLEDGEMENTS
This work is partly supported by National Natural ScienceFoundation of China (No. 11325315). Guoshoujing Telescope(the Large Sky Area Multi-Object Fiber Spectroscopic TelescopeLAMOST) is a National Major Scientific Project built by theChinese Academy of Sciences. Funding for the project has beenprovided by the National Development and Reform Commission.LAMOST is operated and managed by the National AstronomicalObservatories, Chinese Academy of Sciences. Spectroscopicobservations used in the paper were obtained with LAMOSTfrom 2011 October 24 to 2016 November 30. This work hasmade use of data from the European Space Agency (ESA) mis-sion Gaia (https://www.cosmos.esa.int/gaia), processedby the Gaia Data Processing and Analysis Consortium (DPAC;https://www.cosmos.esa.int/web/gaia/dpac/consortium).Funding for the DPAC has been provided by national institutions,in particular the institutions participating in the Gaia MultilateralAgreement.
REFERENCES
Baglin, A., Auvergne, M., Barge, P., et al. 2006, The CoRoT Mission Pre-Launch Status - Stellar Seismology and Planet Finding, 1306, 33
Balona, L. A., & Dziembowski, W. A. 2011, MNRAS, 417, 591Borucki, W. J., Koch, D., Basri, G., et al. 2010, Science, 327, 977Breger, M. 1979, PASP, 91, 5Breger, M. 1990, Delta Scuti Star Newsletter, 2, 13Breger, M. 2000, Delta Scuti and Related Stars, 210, 3Breger, M., Hutchins, J., & Kuhi, L. V. 1976, ApJ, 210, 163Breger, M., Lenz, P., Antoci, V., et al. 2005, A&A, 435, 955Brown, A. G. A., Vallenari, A., et al. 2016, A&A, 595, A2Chang, S.-W., Protopapas, P., Kim, D.-W., & Byun, Y.-I. 2013, AJ, 145, 132
Cheng, Q. L., & Xiong, D. R. 1997, A&A, 319, 981Cox, A. N. 2000, Allen’s Astrophysical Quantities, 4th ed. (New York:
Springer), P.381Cui, X.-Q., Zhao, Y.-H., Chu, Y.-Q., et al. 2012, Research in Astronomy
and Astrophysics, 12, 1197Daszynska-Daszkiewicz, J., Dziembowski, W. A., Pamyatnykh, A. A., et al.
2005, A&A, 438, 653Duquennoy, A., & Mayor, M. 1991, A&A, 248, 485Fitch, W. S. 1981, ApJ, 249, 218Prusti, T., de Bruijne, J. H. J., et al. 2016, A&A, 595, A1Gao, H., Zhang, H.-W., Xiang, M.-S., et al. 2015, Research in Astronomy
and Astrophysics, 15, 2204Gautschy, A., & Saio, H. 1995, ARA&A, 33, 75Houdek, G., Balmforth, N. J., Christensen-Dalsgaard, J., & Gough, D. O.
1999, A&A, 351, 582Gray, R. O., Corbally, C. J., De Cat, P., et al. 2016, AJ, 151, 13Kahraman Aliçavus, F., Soydugan, E., Smalley, B., & Kubát, J. 2017, MN-
RAS, 470, 915Frasca, A., Alcalá, J. M., Covino, E., et al. 2003, A&A, 405, 149Frasca, A., Guillout, P., Marilli, E., et al. 2006, A&A, 454, 301Frasca, A., Molenda-Zakowicz, J., De Cat, P., et al. 2016, A&A, 594, A39Kippenhahn, R., Weigert, A., & Weiss, A. 2012, Stellar Structure and Evo-
lution: , Astronomy and Astrophysics Library. ISBN 978-3-642-30255-8. Springer-Verlag Berlin Heidelberg
Koleva, M., Prugniel, P., Bouchard, A., & Wu, Y. 2009, A&A, 501, 1269Lopez de Coca, P., Rolland, A., Rodriguez, E., & Garrido, R. 1990, A&AS,
83, 51Li, L.-J., Qian, S.-B., & Xiang, F.-Y. 2010, PASJ, 62, 987Li, L.-J., & Qian, S.-B. 2013, PASJ, 65, 116Liakos, A., & Niarchos, P. 2017, MNRAS, 465, 1181Liakos, A., Niarchos, P., Soydugan, E., & Zasche, P. 2012, MNRAS, 422,
1250Luo, A.-L., Zhao, Y.-H., Zhao, G., et al. 2015, Research in Astronomy and
Astrophysics, 15, 1095McNamara, D. H. 1995, AJ, 109, 1751McNamara, D. 1997, PASP, 109, 1221McNamara, D. H. 2000, Delta Scuti and Related Stars, 210, 373McNamara, D. H. 2011, AJ, 142, 110Mkrtichian, D. E., Kusakin, A. V., Gamarova, A. Y., & Nazarenko, V. 2002,
IAU Colloq. 185: Radial and Nonradial Pulsationsn as Probes of StellarPhysics, 259, 96
Mkrtichian, D. E., Nazarenko, V., Gamarova, A. Y., et al. 2003, Interplayof Periodic, Cyclic and Stochastic Variability in Selected Areas of theH-R Diagram, 292, 113
Palaversa, L., Ivezic, Ž., Eyer, L., et al. 2013, AJ, 146, 101Pamyatnykh, A. A. 2000, Delta Scuti and Related Stars, 210, 215Pojmanski, G. 1997, Acta Astron., 47, 467Pojmanski, G., Pilecki, B., & Szczygiel, D. 2005, Acta Astron., 55, 275Prugniel, P., & Soubiran, C. 2001, A&A, 369, 1048Prugniel, P., Soubiran, C., Koleva, M., & Le Borgne, D., 2007, arXiv:astro-
ph/0703658Qian, S.-B., He, J.-J., Zhang, J., et al. 2017a, Research in Astronomy and
Astrophysics, 17, 87Qian, S.-B., Zhang, J., He, J.-J., Zhu, L.-Y., Zhao, E.-G., Shi, X.-D., Zhou,
X., and Han, Z.-T., 2017b, ApJS (submitted)Qian, S.-B., Li, L.-J., Wang, S.-M., et al. 2015, AJ, 149, 4Qian, S.-B., Liu, N.-P., Li, K., et al. 2013, ApJS, 209, 13Qian, S.-B., Wang, J.-J., Zhu, L.-Y., et al. 2014, ApJS, 212, 4Qian, S.-B., Yuan, J.-Z., Soonthornthum, B., et al. 2007, ApJ, 671, 811Ren, A., Fu, J., De Cat, P., et al. 2016, ApJS, 225, 28Rodríguez, E., & Breger, M. 2001, A&A, 366, 178Rodríguez, E., López-González, M. J., & López de Coca, P. 2000, A&AS,
144, 469Rodríguez, E., & López-González, M. J. 2000, A&A, 359, 597Samus’, N. N., Kazarovets, E. V., Durlevich, O. V., Kireeva, N. N., & Pas-
tukhova, E. N. 2017, Astronomy Reports, 61, 80Soydugan, E., Ibanoglu, C., Soydugan, F., Akan, M. C., & Demircan, O.
2006, MNRAS, 366, 1289
MNRAS 000, 1–15 (2017)
15
Straizys, V., & Kuriliene, G. 1981, Ap&SS, 80, 353Szatmary, K. 1990, Journal of the American Association of Variable Star
Observers (JAAVSO), 19, 52Szczygieł, D. M., & Fabrycky, D. C. 2007, MNRAS, 377, 1263Walker, G., Matthews, J., Kuschnig, R., et al. 2003, PASP, 115, 1023Wang, S.-G., Su, D.-Q., Chu, Y.-Q., Cui, X., & Wang, Y.-N. 1996, Appl.
Opt., 35, 5155Watson, C. L., Henden, A. A., & Price, A. 2006, Society for Astronomical
Sciences Annual Symposium, 25, 47Wozniak, P. R., Vestrand, W. T., Akerlof, C. W., et al. 2004, AJ, 127, 2436Wu, Y., Du, B., Luo, A., Zhao, Y., & Yuan, H. 2014, Statistical Challenges
in 21st Century Cosmology, 306, 340Wu, Y., Luo, A.-L., Li, H.-N., et al. 2011b, RAA, 11, 924Wu, Y., Singh, H. P., Prugniel, P., Gupta, R., & Koleva, M. 2011a, A&A,
525, A71Yang, S., & Walker, G. A. H. 1986, PASP, 98, 862Uytterhoeven, K., Moya, A., Grigahcène, A., et al. 2011, A&A, 534, A125Xiong, D.-R. 1989, A&A, 209, 126Xiong, D. R., & Deng, L. 2001, MNRAS, 324, 243Zhao, G., Zhao, Y.-H., Chu, Y.-Q., Jing, Y.-P., & Deng, L.-C. 2012, Re-
search in Astronomy and Astrophysics, 12, 723
This paper has been typeset from a TEX/LATEX file prepared by the author.
MNRAS 000, 1–15 (2017)