Investigations of Energy Interfaces and Interphases With...
43
Investigations of Energy Interfaces and Interphases With Spatially - resolved Tools Keith J. Stevenson Skolkovo Institute of Science and Technology September 17, 2017
Transcript of Investigations of Energy Interfaces and Interphases With...

Investigations of Energy Interfaces and Interphases
With Spatially-resolved Tools
Keith J. Stevenson
Skolkovo Institute of Science and Technology
September 17, 2017

eVoc < μA -μC < Eg
Challenges for Energy Storage
Energy Density
Power Density
Stability
Electrolytes
Safety
Cost
Energy = Capacity (Q) x Voltage (V) How FAR on one charge
Power = Current (A) x Voltage (V) How FAST on one charge
Li3V2(PO4)3
Goodenough and Kim Chem. Mater. 2010, 22 (3), 587.

Challenges for Energy Storage
SEI layer formation at interface.SEI is both beneficial and detrimental
Surface reactivity changes dramatically withComposition, particle size, potential
Complex amorphous mixtures form:
Active and/or passive towards e- and Li+
Goodenough and Kim Chem. Mater. 2010, 22 (3), 587.
Inorganics
LiPF6(sol.) LiF(insol.) + PF5(gas)
Δ
-
?
Organics

Insertion/intercalation reactions
MOn + x Li+ + x e– LixMOn
Ex: Co4+O2 + x Li+ + x e– LixCo4+1-xCo3+
xO2
Conversion/displacement reactions
M2n+On + 2n Li+ + 2n e– M0 + n Li2O
Ex: Co2+O + 2 Li+ + 2 e– Co0 + Li2O
LiCoO2CoO2
CoO
Co
CoOSeveral Factors Influence Mechanistic Pathways
Morphology, Shape, Size, Defect chemistry, Phase Stability, Crystallinity
Charge separation and transfer processes not fully understood!
Basic Charge Storage Mechanisms
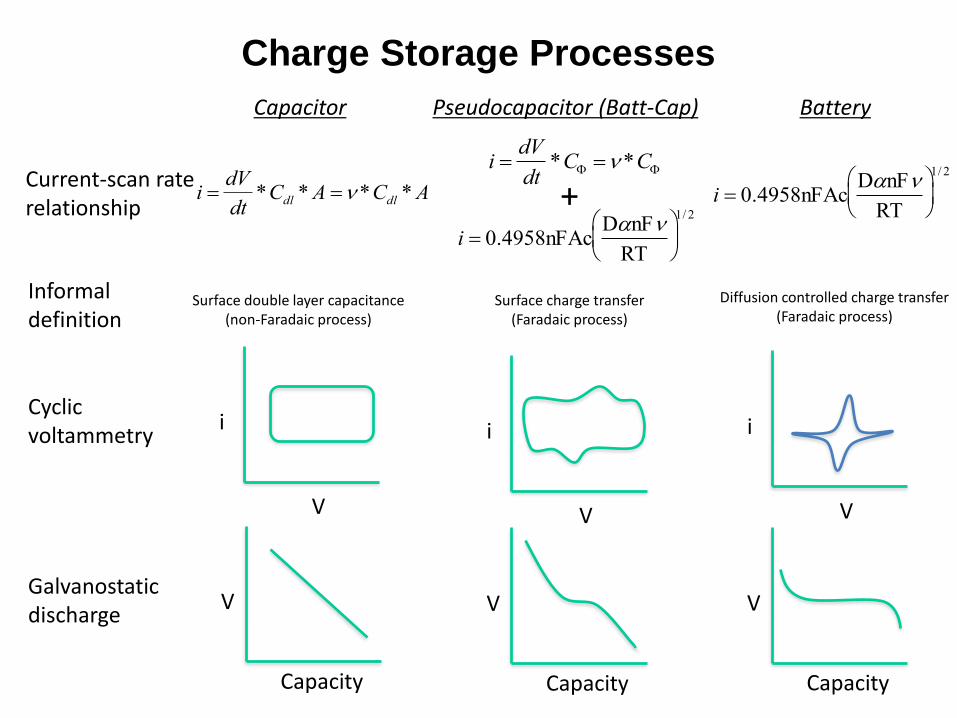
Charge Storage Processes
Capacitor Pseudocapacitor (Batt-Cap) Battery
Galvanostaticdischarge
Cyclic voltammetry
Current-scan rate relationship
i 0.4958nFAcDnF
RT
1/ 2
i dV
dt*C *C
i 0.4958nFAcDnF
RT
1/ 2
V
Capacity
V
Capacity
V
Capacity
i
V
i
V
i
V
+
i dV
dt*Cdl *A *Cdl *A
Informaldefinition
Diffusion controlled charge transfer (Faradaic process)
Surface charge transfer (Faradaic process)
Surface double layer capacitance(non-Faradaic process)

Typical Electrode Materials
Li(Co1/3Ni1/3Mn1/3)O2 Particles1
LiCoO2/Li(Co1/3Ni1/3Mn1/3)O2
Composite Electrode2
Silicon Nanowires4
LiCoO2
Nanotubes5
Li(Ni0.8Co0.1Mn0.1)O2
Nanoparticles3
Chemically Complex Geometrically Complex
1. Yoshizawa, H.; Ohzuku, T. J. Power Sources 2007, 174, 813.
2. Liu, Z.; et al. J. Power Sources 2013, 227, 267.3. Kim, Y. ACS Appl. Mater. Interfaces 2012, 4, 2329.
4. Song, T.; Hu, L.; Paik, U. J. Phys. Chem. Lett. 2014, 5, 720.
5. Cheng, F.; Tao, Z.; Liang, J.; Chen, J. Chem. Mater. 2008,
20, 667.

Materials Challenges In Characterization
0.1 nm 1 nm 100 nm 0.1 mm 1 mm 10 mm 100 mm 1 mm 10 mm
SPM (STM/AFM/KPFM/SECM)
ToF-SIMs
TEM/SEM
m-UV-Vis
XPS
m-Raman
XRD
Analytical Spot Size
m-FTIR
UV-Vis
FTIR
Raman
h
Homogeneous
h
Heterogeneous
Spectroscopic Techniques Limitations and
Biases
Ordered Materials
Homogeneous
Materials
Ensemble Averaged
Ex situ Environment
Slow Data Acquisition
Modern Advantages
Localized
Interrogation
2D & 3D Mapping
In situ Environment
Fast Data Acquisition
Light Microscopy
Imaging Techniques
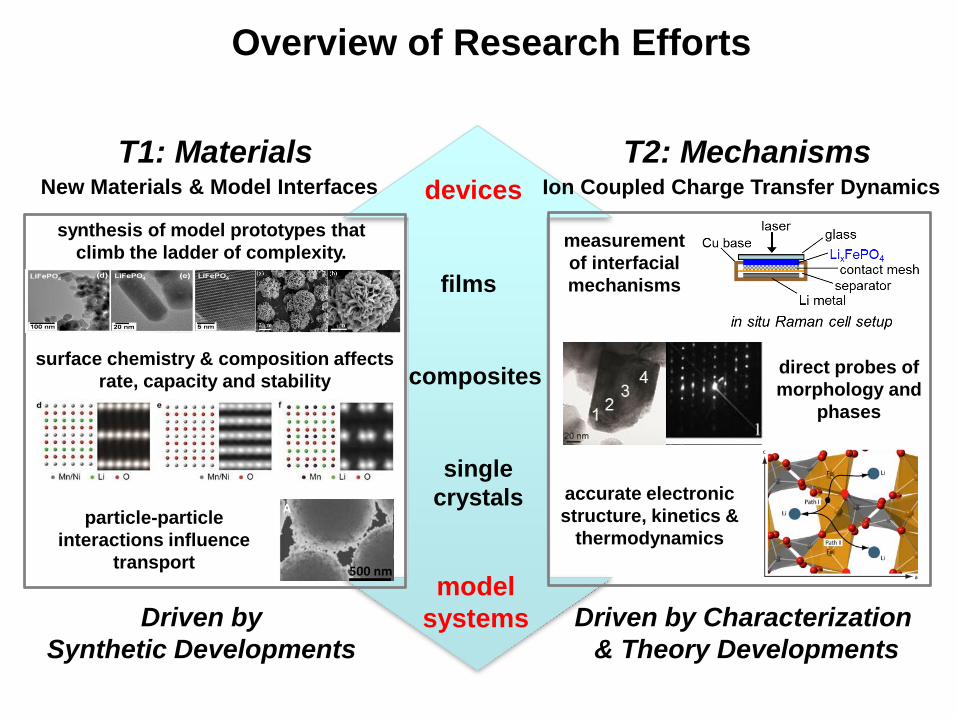
T1: Materials T2: MechanismsNew Materials & Model Interfaces Ion Coupled Charge Transfer Dynamics
composites
single
crystals
films
devices
model
systems
synthesis of model prototypes that
climb the ladder of complexity.
surface chemistry & composition affects
rate, capacity and stability
particle-particle
interactions influence
transport
direct probes of
morphology and
phases
measurement
of interfacial
mechanisms
accurate electronic
structure, kinetics &
thermodynamics
Overview of Research Efforts
Driven by
Synthetic Developments
Driven by Characterization
& Theory Developments

Studies allow us to understand:
• kinetics and energetics of how size,
morphology, and configuration influence Li+-
coupled charge transfer, volume
expansion/contraction processes, and
phase formation mechanisms
• which factors govern charge transfer rates
within and across model nanostructures
and interfaces
• theoretical principles underlying all of the
aboveAbove: In situ spectroelectrochemical Raman
studies Li+ insertion/deinsertion in olivines.
LiMPO4 Size & Composition Library LiMPO4 Interfaces
High Resolution Studies of Model Materials
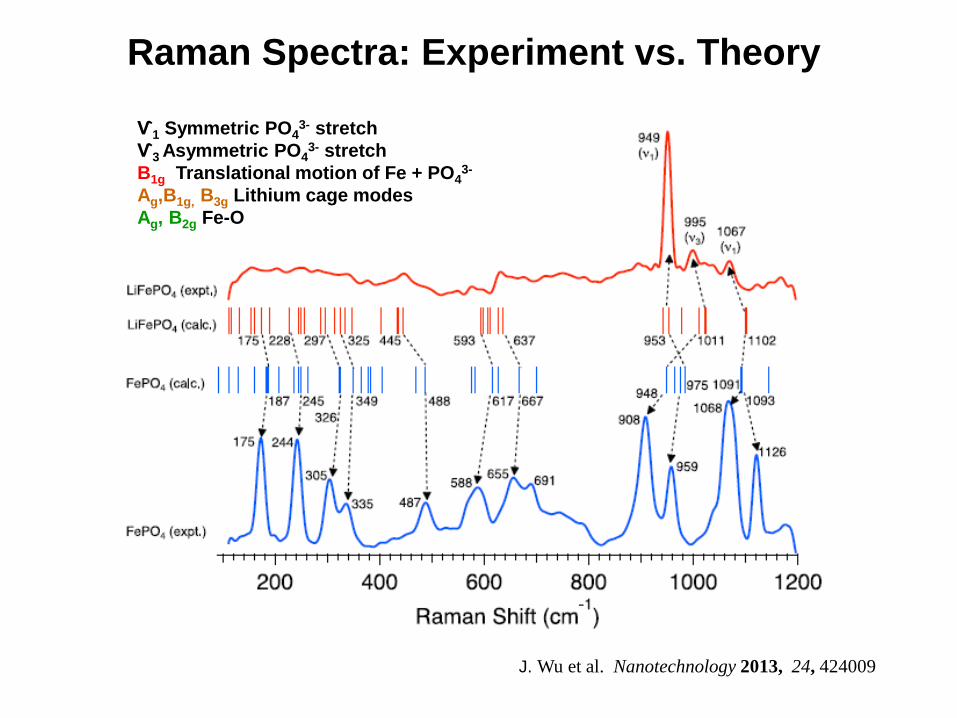
J. Wu et al. Nanotechnology 2013, 24, 424009
Raman Spectra: Experiment vs. Theory
Ѵ1 Symmetric PO43- stretch
Ѵ3 Asymmetric PO43- stretch
B1g Translational motion of Fe + PO43-
Ag,B1g, B3g Lithium cage modes
Ag, B2g Fe-O

In Situ Raman of Lithium Insertion
200 400 600 800 1000 1200
0
5000
10000
15000
FePO4
LiFePO4
charging
7654321
Charging of small LiFePO4
Ag(ν3)Ag(ν1)
External modes
electrolyteRaman Shift (cm-1)
Inte
ns
ity (
arb
. u
nit
s)
Ag(3)Ag(1)
J. Wu et al. Nanotechnology 2013, 24, 424009

In Situ Raman of Self-Discharge of FePO4
0 2 4 6 8 10
3.4
3.6
3.8
4.0
4.2
4.4
E (
V v
s L
i/L
i+)
time (hr)
Bulk
Flower
Large
Small
Sample Self-Discharge Time
Small (30 nm W 100 nm L) 2 hr
Large (230 W nm 300 nm L) 14 hr
Flower (3 mM porous) 5 hr
Bulk LFP > 1 mM > 15 hr
J. Wu et al. Nanotechnology 2013, 24, 424009
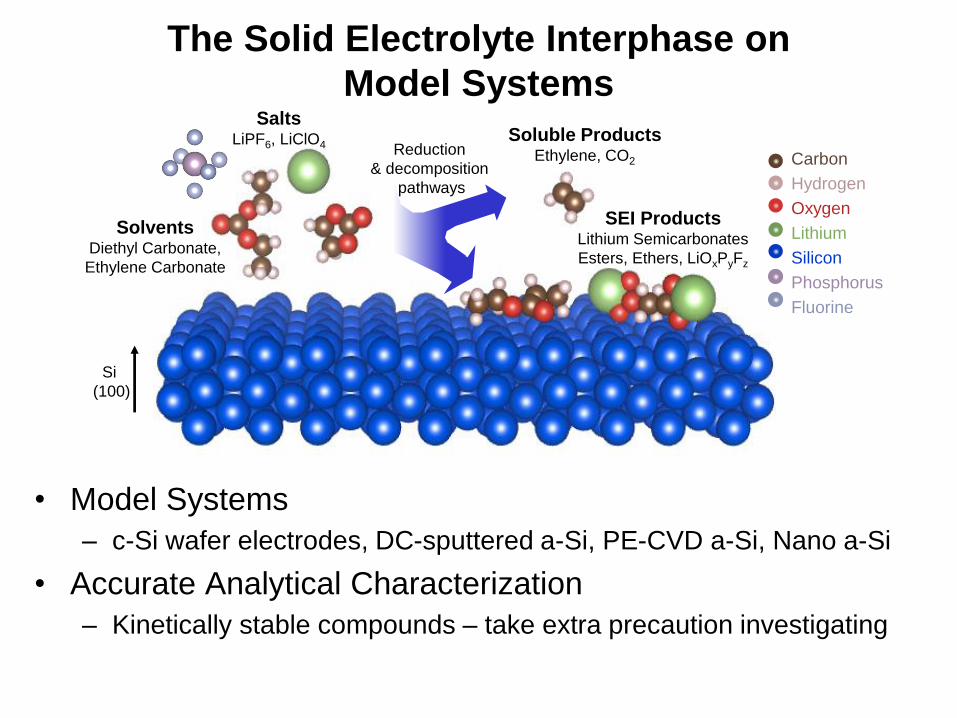
The Solid Electrolyte Interphase on
Model Systems
• Model Systems
– c-Si wafer electrodes, DC-sputtered a-Si, PE-CVD a-Si, Nano a-Si
• Accurate Analytical Characterization
– Kinetically stable compounds – take extra precaution investigating
SEI ProductsLithium Semicarbonates
Esters, Ethers, LiOxPyFz
Soluble ProductsEthylene, CO2
Reduction
& decomposition
pathways
Carbon
Hydrogen
Oxygen
Lithium
Silicon
Phosphorus
Fluorine
Si
(100)
SaltsLiPF6, LiClO4
Solvents Diethyl Carbonate,
Ethylene Carbonate
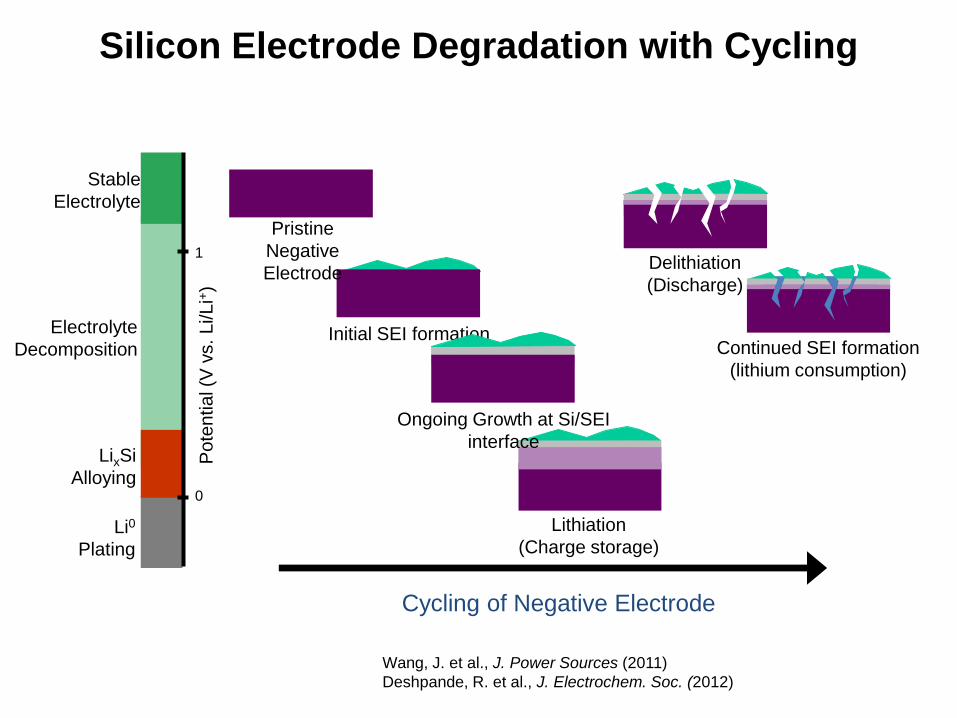
Silicon Electrode Degradation with Cycling
0
Stable
Electrolyte
Electrolyte
Decomposition
LixSi
Alloying
Li0
Plating
Po
ten
tia
l (V
vs.
Li/L
i+)
1
Cycling of Negative Electrode
Initial SEI formation
Lithiation
(Charge storage)
Delithiation
(Discharge)
Continued SEI formation
(lithium consumption)
Pristine
Negative
Electrode
Ongoing Growth at Si/SEI
interface
Wang, J. et al., J. Power Sources (2011)
Deshpande, R. et al., J. Electrochem. Soc. (2012)
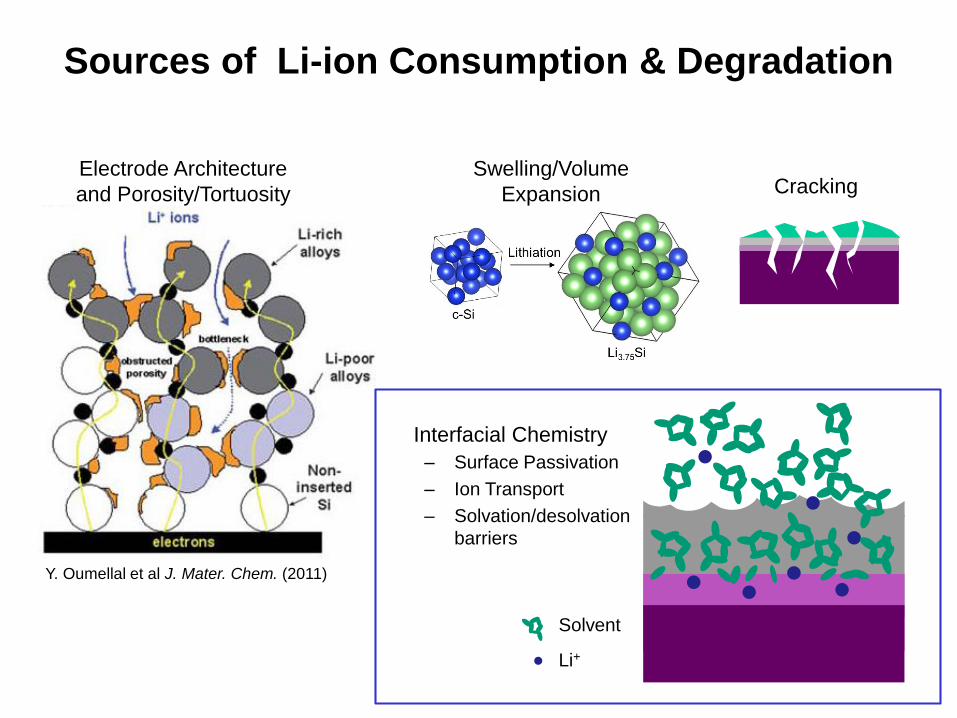
Sources of Li-ion Consumption & Degradation
Y. Oumellal et al J. Mater. Chem. (2011)
CrackingSwelling/Volume
Expansion
Electrode Architecture
and Porosity/Tortuosity
Solvent
Li+
– Surface Passivation
– Ion Transport
– Solvation/desolvation
barriers
Interfacial Chemistry

SEI Formation Reaction Mechanisms on Si (100)
OR
OLiO
O
R
+ Li+
O
O
R
Li
14
OR'
O
+ R+
15
OR'
O
R
OO
OLi
OO
O+ Li+ + e-
+ Li+ O
Li
OLi
O
O
O
OLi+ e-
OO
OLi+
OO
OLi+ O
O
OLi
LiO O
O
O OLi
O
O
OLi
O
O O
OLi + Li+
LiO O
OLi
O
OLi
O
1
2 3
4 5
O O
O + Li+ + e-
O O
O Li
O OLiO+
O O
O + Li+ + e-
O O
O Li
O O
OLi+
O O
O + Li+ + e-
O O
O Li
O O
OLi+
6
7
8
OO
OLi
OO
O+ Li+ + e-
+ Li+ O
Li
OLi
O
O
O
OLi+ e-
OO
OLi+
OO
OLi+ O
O
OLi
LiO O
O
O OLi
O
O
OLi
O
O O
OLi + Li+
LiO O
OLi
O
OLi
O
1
2 3
4 5
OO
OLi
OO
O+ Li+ + e-
+ Li+ O
Li
OLi
O
O
O
OLi+ e-
OO
OLi+
OO
OLi+ O
O
OLi
LiO O
O
O OLi
O
O
OLi
O
O O
OLi + Li+
LiO O
OLi
O
OLi
O
1
2 3
4 5
OO
OLi
OO
O+ Li+ + e-
+ Li+ O
Li
OLi
O
O
O
OLi+ e-
OO
OLi+
OO
OLi+ O
O
OLi
LiO O
O
O OLi
O
O
OLi
O
O O
OLi + Li+
LiO O
OLi
O
OLi
O
1
2 3
4 5
Carbonate Products
Dominant pathways in CV and LSV
Dominant pathways in CA
OR
OLiO
O
R
+ Li+
O
O
R
Li
14
OR'
O
+ R+
15
OR'
O
R
+ Li+ + e-Li
OR
O+R
O O
OLi
RO O
OLi
Li2O
9
Li
OR'
O
+R'O O
OLi
R'O O
OLi
11
+ Li+R-
R
RLi2O
+LiR'
O O
O
12
+ Li+R-R''
R'O O
OR''
R
R''OLi
OR'
O
R
+LiR
O O
O
10
+ Li+ +e-R'
RO O
OR'
R'OLiO
RO
+ Li+ + e-Li
OR
O+R
O O
OLi
RO O
OLi
Li2O
9
Li
OR'
O
+R'O O
OLi
R'O O
OLi
11
+ Li+R-
R
RLi2O
+LiR'
O O
O
12
+ Li+R-R''
R'O O
OR''
R
R''OLi
OR'
O
R
+LiR
O O
O
10
+ Li+ +e-R'
RO O
OR'
R'OLiO
RO
Ester & Ether Products
Composition by Functionality
Atomic Percentage
Schroder et al. J. Phys. Chem. C., 2012, 116, 19737.

Time of Flight Secondary Ion Mass Spectrometry
(TOF-SIMS)
TOF-SIMS
● Surface Spectroscopy- elemental and molecular
- ppm sensitivity
- < 1 nm surface sensitivity
- > 10000 mass resolution
● Surface Imaging- lateral resolution < 100 nm
- parallel mass detection
● Depth Profiling- depth resolution < 1 nm
- thin layers 1 nm to > 10 nm
● 3D Analysis- parallel mass detection
- high lateral resolution
- high depth resolution
TOF.SIMS5, ION-TOF GmbH
The TOF-SIMS Principle

TOF-SIMS Depth Profiling
Bilayer interface consists of mixing
Interface depth profile adds corrugation and sputtering effects
ACS Nano 7 (10), 9268 (2013)

Mixing-Roughness-Information (MRI) Model
Real Interface = Mixing (Fabrication)
=
(ΔzDRF)2 = (Δzmix)2 + (Δzcorr)
2 + (Δzinf)2
=
(ΔzDRF)2+(Δzreal)2=(Δzmeas)
2
TOF-SIMS Depth Profiling
Surf. Interface Anal. 27, 825–834 (1999)

According to the MRI model the measured depth profile contains:
Information = secondary ion depth of origin
Si/SiO2/Cr(10nm)/Au(20nm)/Ag(20nm) sputtered with Bi3+ (30 kV) and Cs+ (250 V)
TOF-SIMS Depth Profiling
Thin Solid Films 250, 56 (1994)

TOF-SIMS Depth Profiling
Analysis Craters
SEI
Si Wafer
Sputter Crater (500 μm)
Bi+/Bi32+
Analysis
Crater
200-50 μm
Depth Profile
300 μm
Pre- and Post-Sputtering
Sputt
ering T
ime /
Depth
Organics
Inorganics
Wafer
1.0
0.5
0.0
Norm
aliz
ed
Sig
nal
6420-2-4-6Depth (nm)
H_ C2H
_ LiF2
_ PO
_ LiO
_ Si2
_
Schroder et al., ACS Appl. Mater. Inter. (2014)

Depth Profiling and SEI Structure Si
Etched vs. Oxide
LixO / LiOH
LiF
LixSiyO
Conclusions about SiOx effects on SEI
Lithiated vs. Delithiated
LixO / LiOHLiF
Schroder et al., ACS Appl. Mater. Inter. (2014)

Schroder et al., Chem. Mater.2015, 27, 5531.
(CF2)n + O2 → CO2 + 2F–
SiOX + XF– → SiFX + X/2O2
Etching Reaction
LiF formation
SEI on a-Si with FEC Co-Solvent
100
95
90
85
80
Co
ulo
mb
ic E
ffic
ien
cy
10080604020
Cycle Index
EC/DEC EC/DEC/FEC
4000
3000
2000
1000
0
Sp
ec
ific
Ca
pac
ity
(m
Ah
g-1)
10080604020
Cycle Index
Lithiation DelithiationEC/DECEC/DEC/FEC
(a)
(b)

XPS and TOF-SIMs of a-Si Thin Films with FEC
Schroder et al., Chem. Mater.2015, 27, 5531.

Kinetic Stability Theory of SEI Structure
Peled E., Golodnitsky D. and Ardel G., J. Electrochem. Soc. (1997)
Besenland et al., J. Power Sources (1995)
Aurbach et al. J. Electrochem. Soc. (1994)
Lithium-Ion Batteries: Solid-Electrolyte Interphase 6
is a more porous, or structurally open layer, that suppresses the mass transport
of ions in the electrolyte filling its pores. According to this model, the SEI is
made up of ordered or disordered crystals, which are thermodynamically stable
with respect to lithium.
Figure 1 Schematic presentation of Polyhetero Microphase SEI. Reproduced from [8] by
permission of The Electrochemical Society, Inc.
Later Thevenin and Müller 23
suggested several modifications to the SEI
model: (1) the polymer-electrolyte interphase (PEI) model in which the lithium
in PC electrolyte is covered with a PEI composed of a mixture of Li2CO
3,
P(PO)x and LiClO
4; P(PO)
x is polypropylene oxide, formed by reduction-induced
polymerization of PC; (2) the solid-polymer-layer (SPL) model, where the
surface layer is assumed to consist of solid compounds dispersed in the polymer
electrolyte; (3) the compact-stratified layer (CSL) — in this model the surface
layer is assumed to be made of two sublayers. The first layer on the electrode
surface is the SEI, while the second layer is either SEI or PEI. The first two
High keLow ke
Structure and Composition of SEI
determined by rate:
What about surface?
F(e- )>?
ESEI
0
Desolvation?
SiLixSi
SEIElectrolyte
e- + S productke

Summary SEI on Anodes
Interfacial layers form on anodes due to both spontaneous and
electrochemically driven decomposition processes
SEI on anodes is heavily influenced by solvent, carbon, LiF formation, HF and
LiOx and LiOH
SEI composition on Si influenced by potential, surface chemistry and
environmental exposure
SEI is porous that allows transport of solvated Li ions
SEI is dynamic and has graded composition of Inorganics & Organics
SEI is thick on non-oxide covered anode surfaces
SEI is thick with FEC cosolvent, enriched with LiF on outer surface
Quasireversible shuttle mechanism between LiF and Li2O increase CE
SiOX + xF– → SiFX + (x/2)O2
2LiF(s) 2Li+(sol) + F2 (sol) + 2e-
2Li2O(s) 4Li+(sol) + O2 (sol) + 4e-
SEI library needed to understand parameter space
SLi2O= SPK
43 =
[O]([Li]Li2O+ [Li]LiF )2
43

charge
discharge
Li3V2(PO4)3V2(PO4)3
V4.5+2(PO4)3 + 3 Li+ + 3 e- Li3V
3+2(PO4)3
Gravimetric Capacity: 197 mAh/g
New High Capacity Li3V2(PO4)3

0 20 40 60 80 100 120 140 160 1802.5
3.0
3.5
4.0
4.5
5.0
x = 3
x = 2.5
x = 2
x = 0x = 1
x = 2
x = 2.5
E (
V v
s. L
i/L
i+)
Capacity (mAh/g)
LixV
2(PO
4)3
x = 3
discharge
C/20 rate (1C = full charge over 1 hr)
3.0-4.8 V vs. Li/Li+
Li3V+3
2(PO4)3 3 Li+ + 3 e- + V+4.52(PO4)3
charge
Electrochemistry of Li3V2(PO4)3

29
Severe Capacity Fade of Li3V2(PO4)3
0 20 40 60 80 100 120 140 160 1802.5
3.0
3.5
4.0
4.5
5.03.0- 4.8 V vs. Li/Li
+
1
10
20
30
40
E (
V v
s. L
i/L
i+)
Capacity (mAh/g)
• Sloping of voltage plateaus
• Increasing overpotential with cycle number
• Rapid drop in capacity with cycle
number
• Initial low coulombic efficiency
indicative of the formation of
passivation film
• (Coulombic efficiency) qc=Qd/Qc
0 5 10 15 20 25 30 35 4060
80
100
120
140
160
180
80
85
90
95
100
105
Cycle Number
% C
oulo
mbic
Eff
icie
ncy
Char
ge
Cap
acit
y (
mA
h/g
)
3.0-4.8 V vs. Li/Li+

SEI Compositions (Cycled to 4.8 V)
1 cycle
5 cycles
10 cycles
50 cycles
0 20 40 60 80 100
C-C RCO ROCO RCO 3 RCF
2 RCF3 LiF Li-X
Atomic Percentage
Li3V2(PO4)3 Composite

540 535 530 525
O 1s
Inte
nsi
ty
Binding Energy (eV)
C=OC-O
140 135 130
Li xPF y
Li xPO y
F z
P 2p
Inte
nsi
ty
Binding Energy (eV)
60 59 58 57 56 55 54 53 52 51 50
Li 1s
Inte
nsi
ty
Binding Energy (eV)
Li xPO y
F z
Li xPF y
695 690 685 680
F 1s
Inte
nsi
ty
Binding Energy (eV)
CF 2
LiF
Li xPF y
Super P Carbon
295 290 285 280
RCF 2
C 1s
Inte
nsi
ty
Binding Energy (eV)
C=OC-O C-CCF 2
Electrochemical SEI formation on CarbonOne Cycle (3-4.8 V vs Li/Li+)

Spontaneous SEI formation on Carbon
300 295 290 285 280
RCF 2
C 1s
Inte
nsi
ty
Binding Energy (eV)
C-CC-OC=O
CF 2C-C
700 695 690 685
LiFLi xPF y
Li xPO y
F z
RCF 2CF 2
F 1s
Inte
nsi
ty
Binding Energy (eV)
545 540 535 530
O 1s
Inte
nsi
ty
Binding Energy (eV)
C=OC-O
70 65 60 55
Li 1s
Inte
nsi
ty
Binding Energy (eV)
Li xPO y
F z
LiFLi xP y
F z
Super P Carbon soaked in electrolyte

Spill-over Mechanism for SEI formation
on NMC Cathodes
Dynamic behavior of cathode interphases
driven by conductive carbon. The cathode-
electrolyte interphase, initially formed on
carbon with no electrochemical bias applied,
readily passivates the cathode particles
through mutual exchange of surface species

SEI on cathode: alkoxides, ethers, esters, lithium carboxylates,
carbonate, difluoroalkanes, alkyl lithium, lithium salts (at both 4.2 &
4.8 V vs. Li/Li+)
Difficult to interpret whether the SEI’s chemical composition is
evolving (quantitatively) with increasing cycle number
Carbon additive is responsible for SEI formed spontaneously and
electrochemically on composite LVP cathodes
O in PO4 has a lower basicity or nucleophilicity as compared to
LixMOy cathodes and do not form SEI spontaneously as has been
proposed for lithium metal oxides
LiyMOx + ROCO2R’ → Liy-1MOxR + R’OCO2Li
Summary SEI on LVP Composite Electrodes

Superconcentrated Electrolytes
• high ionic conductivity
• protects Al current collector
• non-viscous
• forms stable SEI due to EC
What do concentrated electrolytes offer?
• higher oxidative/reductive stability
• lower vapor pressure
• thermal stability
• good SEI without EC (?)
• low flammability
• fast electrode reactions (?)
Highly concentrated electrolyte: anything more concentrated than
standard electrolyte: 1 M LiPF6 in EC/DMC (DEC, EMC)
• lower ionic conductivity
• higher viscosity
• high cost
Disadvantages
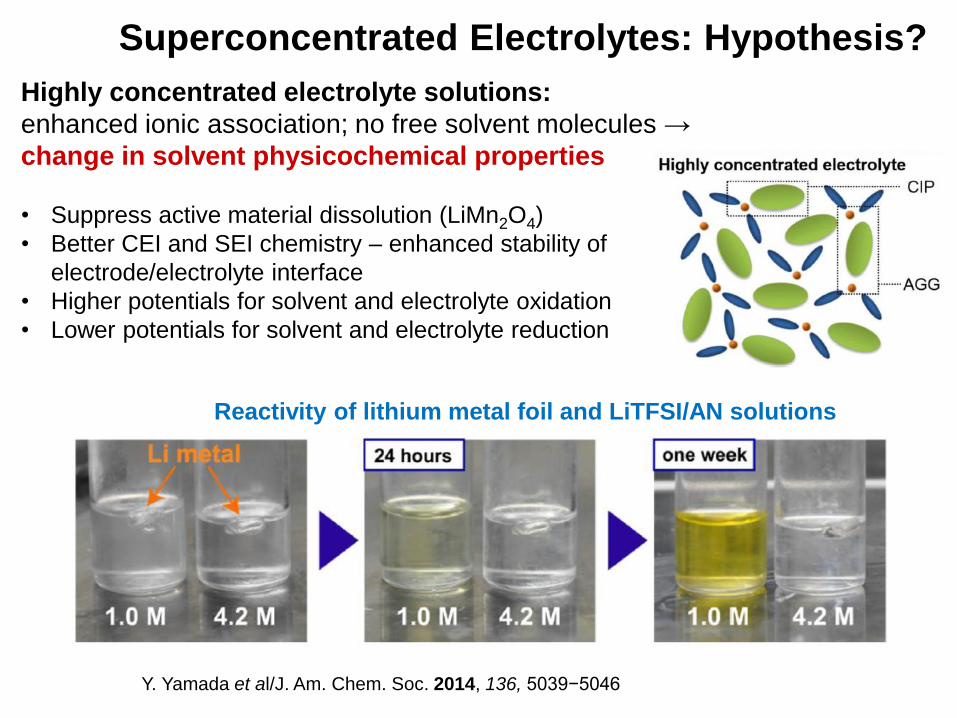
Superconcentrated Electrolytes: Hypothesis?
Highly concentrated electrolyte solutions:
enhanced ionic association; no free solvent molecules →
change in solvent physicochemical properties
• Suppress active material dissolution (LiMn2O4)
• Better CEI and SEI chemistry – enhanced stability of
electrode/electrolyte interface
• Higher potentials for solvent and electrolyte oxidation
• Lower potentials for solvent and electrolyte reduction
Y. Yamada et al/J. Am. Chem. Soc. 2014, 136, 5039−5046
Reactivity of lithium metal foil and LiTFSI/AN solutions

Cyclic Voltammetry to measure ks and Dapp
Simple Butler-Volmer formalism
0.0 0.1 0.2 0.3 0.4 0.5 0.6
3.9
4.0
4.1
4.2
4.3
E, V
x in Li1-x
CoO2
3.5 3.6 3.7 3.8 3.9 4.0 4.1 4.2-600
-300
0
300
600
900
I/mA
E/V
LiCoO2
0.0 0.5 1.0 1.5 2.0 2.5 3.0 3.5 4.0 4.5 5.0
0
20
40
60
80
100
120
140
160
180
Model: LogNormal
y0 0 ±0
xc 1.00048 ±0.05301
w 0.4795 ±0.0478
A 170.02262 ±14.63953
Co
un
t
d, mm
non-Frumkin
isotherm
3.6 3.8 4.0 4.2 4.4
-2000
-1500
-1000
-500
0
500
1000
1500
2000
I/mA
E/V
LiMn2O
4
0.0 0.2 0.4 0.6 0.8 1.0
3.8
3.9
4.0
4.1
4.2
4.3
E, V
x in Li1-x
Mn2O
4
single value of Deff
and apparent ks
Frumkin-type
isotherm
V. Nikitina et al MSU
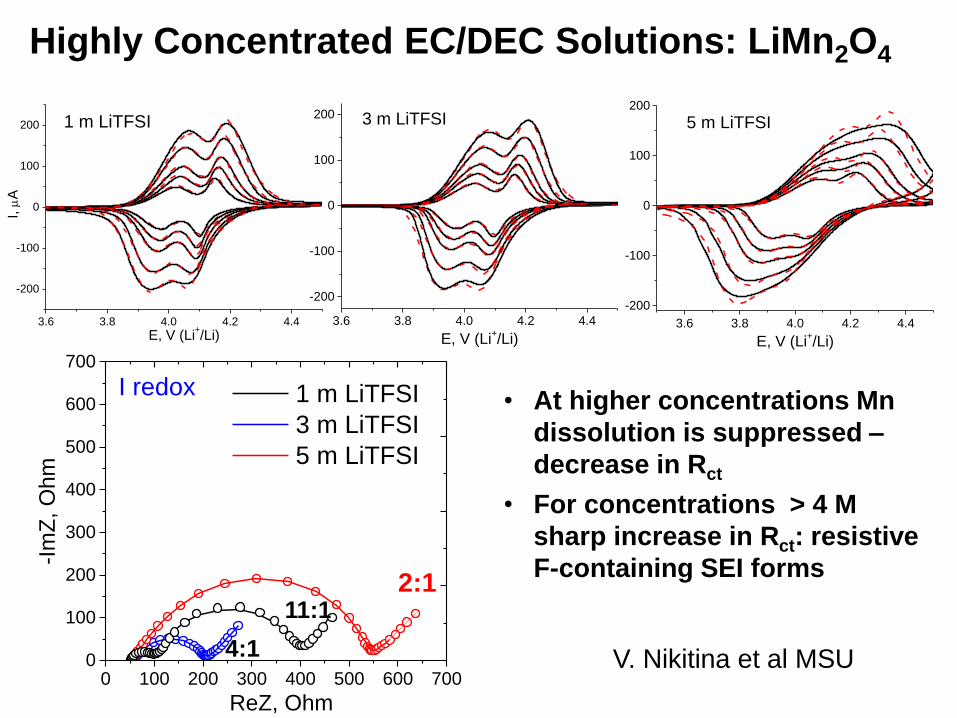
Highly Concentrated EC/DEC Solutions: LiMn2O4
3.6 3.8 4.0 4.2 4.4
-200
-100
0
100
200
I, m
A
E, V (Li+/Li)
1 m LiTFSI
3.6 3.8 4.0 4.2 4.4
-200
-100
0
100
200
E, V (Li+/Li)
3 m LiTFSI
3.6 3.8 4.0 4.2 4.4
-200
-100
0
100
200
E, V (Li+/Li)
5 m LiTFSI
0 100 200 300 400 500 600 7000
100
200
300
400
500
600
700
-Im
Z,
Oh
m
ReZ, Ohm
1 m LiTFSI
3 m LiTFSI
5 m LiTFSI
I redox
2:111:1
4:1
• At higher concentrations Mn
dissolution is suppressed –
decrease in Rct
• For concentrations > 4 M
sharp increase in Rct: resistive
F-containing SEI forms
V. Nikitina et al MSU

1 2 3 4 5
1x10⁻⁸
2x10⁻⁸
3x10⁻⁸
4x10⁻⁸
5x10⁻⁸
6x10⁻⁸
7x10⁻⁸
Deff , c
m2/sk
s, cm
/s
m, mol/kg
ks I redox
ks II redox
LMO EC/DEC
2x10-12
4x10-12
6x10-12
8x10-12
1x10-11
Deff
I
Deff
II
1 2 3 4 5100
200
300
400
500
600
RC
EI +
Rct
m, mol/kg
I redox
II redox
LMO EC/DEC
0 100 200 300 400 500 600 7000
100
200
300
400
500
600
700
-Im
Z, O
hm
ReZ, Ohm
RCEIRct
• From 1 M to 3 M:
slight increase in ks and D
• From 3 M to 5 M:
drop in ks and D (0.5 order of
magnitude)
• Impossible to separate RCEI
and Rct unambiguously
39V. Nikitina et al MSU

LiTFSI in EC/DEC
Free EC
Free EC disappears with the increase in salt concentration

Cycling Stability and Rate Capability
3.8 4.0 4.2 4.4-0.3
-0.2
-0.1
0.0
0.1
0.2
0.3
cycles 24-25
cycles 13-14
I, m
A
E, V
1 M LiTFSIcycles 1-4
3.8 4.0 4.2 4.4
-0.20
-0.15
-0.10
-0.05
0.00
0.05
0.10
0.15
0.20
I, m
A
E, V
3 m LiTFSIcycles 1-4
cycles 13-14
cycles 24-25
0 20 40 60 80 100 120 140
3.0
3.3
3.6
3.9
4.2
4.5
E, V
C, mAh/g
C/5
1C
2C
5C
3 m LiTFSI
0 20 40 60 80 100 120 140
3.0
3.5
4.0
4.5
2C
E, V
C, mAh/g
C/5
1C
5 m LiTFSI
41

Overall SummaryNew materials require development of advanced tools for study
Ex and in situ spectroelectrochemical studies
Specialized Transfer Capsule for “Anoxic” Surface Analysis
Raman is an excellent technique for characterizing energy storage materials,
composites and surface chemistry
Enables assessment of phase purity & compositions
Enables study of Li+ charge transfer reactivity at interfaces and
elucidation of charge storage mechanisms
Nano-sized architechures show promise as advanced energy storage materials
Yet are not thermodynamically stable and have reactive surface chemistry
Can achieve high capacities with enhanced kinetics (rate capability)
Interfacial layers form on both cathodes and anodes due to both spontaneous
and electrochemically driven decomposition processes
V and Mn based cathodes are reactive to solvent and HF and form dynamic
SEI layers
SEI composition on Si influenced by potential, surface chemistry and
environmental exposure
SEI library needed to understand parameter space
Center for Electrochemical Energy
Контактная информация:Сколковский институт науки и технологий
Ул. Нобеля, д. 3,Москва, Россия, 143026
E-mail: [email protected] Page: http://faculty.skoltech.ru/Faculty/Keith-Stevenson
http://crei/skoltech/cee
Кейт Дж. Стевенсон,
профессор & директор