Influence of Carbon Additions on the Dynamic ... · Influence of Carbon Additions on the Dynamic...
6
Materials Transactions, Vol. 43, No. 2 (2002) pp. 135 to 140 Special Issue on Ultra-High Purity Metals (II) c 2002 The Japan Institute of Metals Influence of Carbon Additions on the Dynamic Recrystallization of High Purity α-Iron Christophe Desrayaud, S´ everine Girard, Jean Le Coze and Frank Montheillet Ecole Nationale Sup´ erieure des Mines de Saint-Etienne, Centre SMS, URA CNRS 1884, 158 cours Fauriel, 42023 Saint-Etienne Cedex 2, France The influence of carbon content on the dynamic recrystallization mode of α-Iron containing various amounts of carbon, ranging from 5 to 200ppm, was investigated. Uniaxial compression tests were carried out, followed by metallographic analyses by optical microscopy. All the alloys exhibit discontinuous dynamic recrystallization. Furthermore, the values of the apparent activation energies of deformation, as well as the steady state average grain sizes show that they are very sensitive to carbon additions in the range of high purities, i.e. 0–50 ppm. An interpretation of this effect is proposed on the basis of grain boundary solute segregation. (Received July 25, 2001; Accepted November 30, 2001) Keywords: iron, high purity, dynamic recrystallization, segregation, hot compression 1. Introduction Continuous dynamic recrystallization (CDRX) is well known to occur in low carbon steels during hot deformation. 1) However, Glover and Sellars 2) and Tsuji et al. 3) have shown in previous works that a transition may occur from continu- ous to discontinuous dynamic recrystallization (DDRX) when the material purity is increased. Indeed, the occurrence of discontinuous or continuous dynamic recrystallization, which was discussed in 4) by Gourdet and Montheillet, depends on an equilibrium between subgrain misorientation rate and grain boundary mobility, which is strongly affected by the material purity. Such a transition has also been observed on aluminium by Tanaka et al. 5) when decreasing the silicon and iron con- tents of the metal under 10 ppm. On the basis of the preparation of high purity iron doped with controlled amounts of addition element, this work aims at investigating the influence of carbon content (5–200 ppm) on the dynamic recrystallization mode of α-Iron. A new ap- proach of the transition observed by Glover and Sellars and, furthermore, a complete rheological investigation of these materials was carried out using hot compression tests. The deformation conditions were specified to range within the α domain of iron. 2. Experimental Procedure 2.1 Preparation of high purity iron grades with con- trolled carbon contents (5–200 ppm) Commercial electrolytic iron was purified by induction melting: carbon and oxygen were eliminated by reaction with gaseous atmosphere (argon and hydrogen). Melting was per- formed in boat shaped crucibles, made out of silver tubes cooled by internal water flow. The solubility of Ag in Fe be- ing virtually zero whatever the temperature, no pollution was observed. This remelting technique is described by Le Coze et al. 6) After iron purification, the required carbon amount was introduced in the ingot by induction melting. Final car- bon contents are reported in Table 1. Although the Fe–200 graded iron is beyond the limit of the α domain, the very low Table 1 Carbon contents of the various Fe–C grades investigated (mass ppm). Grade Fe Fe–50 Fe–100 Fe–200 Expected 0 50 100 200 Measured <0.5 45 96 220 % of non α phase 0 0 0 0.7 percentage of non α phase (also reported in Table 1) can be considered as negligible in the present study. The ingots were hot forged to 20 mm diameter in the range and cold swagged to 9 mm diameter bars. Samples of 8 mm in diameter and 12 mm in height were then machined for hot compression testing. 2.2 Hot compression device The servo-hydraulic machine enables hot compression from 273 to 1473 K with controlled strain rate from 10 −3 to 10 s −1 . An infrared radiation furnace was mounted on this device, ensuring an homogeneity of 2 Kelvins along the sam- ple height. Argon was used to protect samples and tools from oxidation and prevent them from pollution. Particular atten- tion was paid to the lubrication of the specimens, because the tribological properties of high purity iron are very bad and may lead to sticking phenomena, and very large friction cor- rections. The lubrication procedure was as follows: polishing before each test and deposition of a boron nitride layer (spray) on the sample and the tools. The heating stage was operated with 3 thermal ramps: 105 K/min up to T 1 = (T testing −100 K), 50 K/min up to T 2 = (T testing − 50 K), 10 K/min up to T testing , a 10 min holding time was then applied. This thermal scheme prevents overshooting phenomena especially when reaching the testing temperature. However static recrystallization is enabled during this heating stage and strongly depends on the testing temperature. Thus a growth of the initial grain size (just before straining) may be expected when the testing tem- perature increases. Such variation of the initial grain size was observed and will be discussed below. A servo-control system provides constant compression
Transcript of Influence of Carbon Additions on the Dynamic ... · Influence of Carbon Additions on the Dynamic...
Materials Transactions, Vol. 43, No. 2 (2002) pp. 135 to 140Special Issue on Ultra-High Purity Metals (II)c©2002 The Japan Institute of Metals
Influence of Carbon Additions on the Dynamic Recrystallizationof High Purity α-Iron
Christophe Desrayaud, Severine Girard, Jean Le Coze and Frank Montheillet
Ecole Nationale Superieure des Mines de Saint-Etienne, Centre SMS, URA CNRS 1884,158 cours Fauriel, 42023 Saint-Etienne Cedex 2, France
The influence of carbon content on the dynamic recrystallization mode ofα-Iron containing various amounts of carbon, ranging from 5to 200 ppm, was investigated. Uniaxial compression tests were carried out, followed by metallographic analyses by optical microscopy. Allthe alloys exhibit discontinuous dynamic recrystallization. Furthermore, the values of the apparent activation energies of deformation, as wellas the steady state average grain sizes show that they are very sensitive to carbon additions in the range of high purities,i.e. 0–50 ppm. Aninterpretation of this effect is proposed on the basis of grain boundary solute segregation.
(Received July 25, 2001; Accepted November 30, 2001)
Keywords: iron, high purity, dynamic recrystallization, segregation, hot compression
1. Introduction
Continuous dynamic recrystallization (CDRX) is wellknown to occur in low carbon steels during hot deformation.1)
However, Glover and Sellars2) and Tsujiet al.3) have shownin previous works that a transition may occur from continu-ous to discontinuous dynamic recrystallization (DDRX) whenthe material purity is increased. Indeed, the occurrence ofdiscontinuous or continuous dynamic recrystallization, whichwas discussed in4) by Gourdet and Montheillet, depends on anequilibrium between subgrain misorientation rate and grainboundary mobility, which is strongly affected by the materialpurity. Such a transition has also been observed on aluminiumby Tanakaet al.5) when decreasing the silicon and iron con-tents of the metal under 10 ppm.
On the basis of the preparation of high purity iron dopedwith controlled amounts of addition element, this work aimsat investigating the influence of carbon content (5–200 ppm)on the dynamic recrystallization mode ofα-Iron. A new ap-proach of the transition observed by Glover and Sellars and,furthermore, a complete rheological investigation of thesematerials was carried out using hot compression tests. Thedeformation conditions were specified to range within theα
domain of iron.
2. Experimental Procedure
2.1 Preparation of high purity iron grades with con-trolled carbon contents (5–200 ppm)
Commercial electrolytic iron was purified by inductionmelting: carbon and oxygen were eliminated by reaction withgaseous atmosphere (argon and hydrogen). Melting was per-formed in boat shaped crucibles, made out of silver tubescooled by internal water flow. The solubility of Ag in Fe be-ing virtually zero whatever the temperature, no pollution wasobserved. This remelting technique is described by Le Cozeet al.6) After iron purification, the required carbon amountwas introduced in the ingot by induction melting. Final car-bon contents are reported in Table 1. Although the Fe–200graded iron is beyond the limit of theα domain, the very low
Table 1 Carbon contents of the various Fe–C grades investigated (massppm).
Grade Fe Fe–50 Fe–100 Fe–200
Expected 0 50 100 200
Measured <0.5 45 96 220
% of nonα phase 0 0 0 0.7
percentage of nonα phase (also reported in Table 1) can beconsidered as negligible in the present study.
The ingots were hot forged to 20 mm diameter in the rangeand cold swagged to 9 mm diameter bars. Samples of 8 mmin diameter and 12 mm in height were then machined for hotcompression testing.
2.2 Hot compression deviceThe servo-hydraulic machine enables hot compression
from 273 to 1473 K with controlled strain rate from 10−3 to10 s−1. An infrared radiation furnace was mounted on thisdevice, ensuring an homogeneity of 2 Kelvins along the sam-ple height. Argon was used to protect samples and tools fromoxidation and prevent them from pollution. Particular atten-tion was paid to the lubrication of the specimens, because thetribological properties of high purity iron are very bad andmay lead to sticking phenomena, and very large friction cor-rections. The lubrication procedure was as follows: polishingbefore each test and deposition of a boron nitride layer (spray)on the sample and the tools. The heating stage was operatedwith 3 thermal ramps: 105 K/min up toT1 = (Ttesting−100 K),50 K/min up toT2 = (Ttesting− 50 K), 10 K/min up toTtesting,a 10 min holding time was then applied. This thermal schemeprevents overshooting phenomena especially when reachingthe testing temperature. However static recrystallization isenabled during this heating stage and strongly depends on thetesting temperature. Thus a growth of the initial grain size(just before straining) may be expected when the testing tem-perature increases. Such variation of the initial grain size wasobserved and will be discussed below.
A servo-control system provides constant compression
136 C. Desrayaud, S. Girard, J. L. Coze and F. Montheillet
strain rates by means of an exponential displacement signaltailored according to the initial height, the specified strain andthe strain rate. Such a displacement control is required for theinterpretation of the stress-strain curves, especially for deriv-ing the rheological parameters such as the apparent activationenergy, strain rate sensitivity and Zener-Hollomon parame-ter. After straining, the sample was quenched within about1 second, which prevents from microstructure evolutions, inparticular from static recrystallization. In the present investi-gation, microstructure observations are made easy by the factthat no thermodynamic transformation occurs in the quench-ing range (i.e. from 1073 to 293 K).
2.3 Stress strain-curvesStress-strain curves were obtained from load and displace-
ment measurements recorded during the tests. The ratio of thecompression load to the instantaneous section first providesthe apparent stress. Tribological effects are then discarded byan estimation of the friction power during the test, accordingto the Tresca friction model.7) Since the influence of frictionon the flow stress is limited in the investigated strain range,a Tresca coefficientm = 0.15 was applied for all the stress-strain curves displayed in this paper.
2.4 Microstructural investigationsAfter quenching the samples were cut, coated with resin,
mechanically polished, and etched with 3% Nital solution.Microstructures were observed using polarized light opticalmetallography.
2.5 Testing conditionsTemperatures were specified within the single phaseα do-
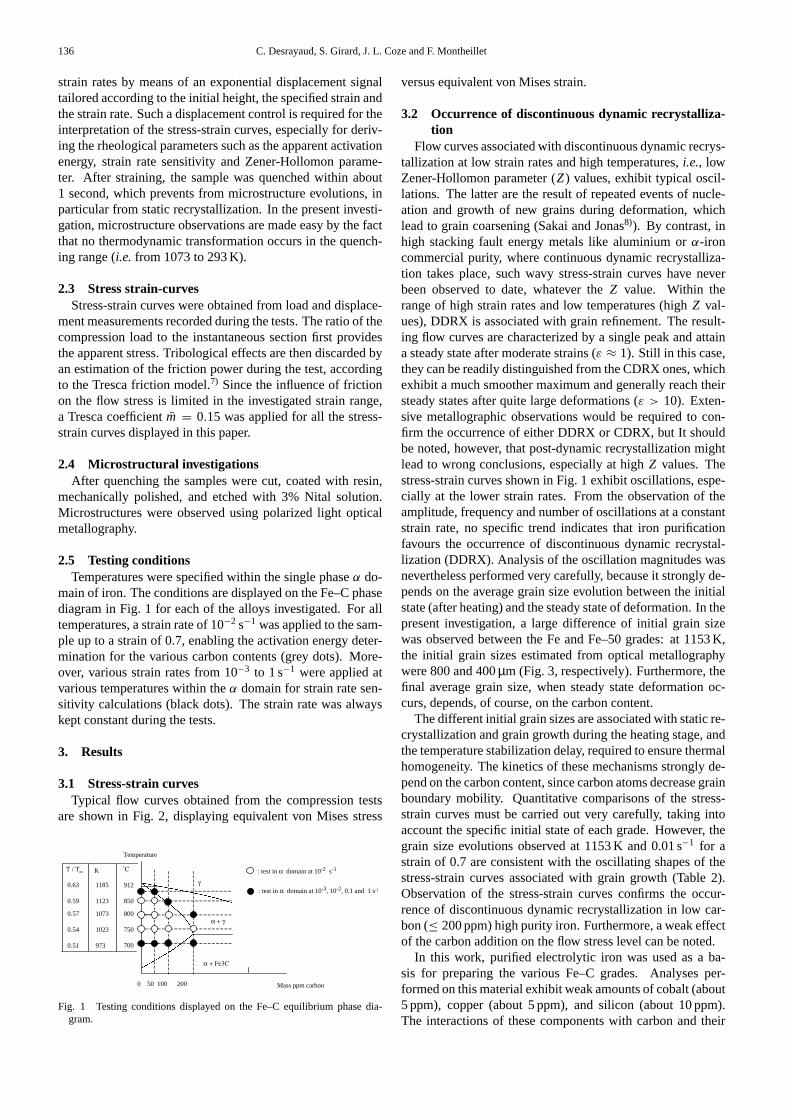
main of iron. The conditions are displayed on the Fe–C phasediagram in Fig. 1 for each of the alloys investigated. For alltemperatures, a strain rate of 10−2 s−1 was applied to the sam-ple up to a strain of 0.7, enabling the activation energy deter-mination for the various carbon contents (grey dots). More-over, various strain rates from 10−3 to 1 s−1 were applied atvarious temperatures within theα domain for strain rate sen-sitivity calculations (black dots). The strain rate was alwayskept constant during the tests.
3. Results
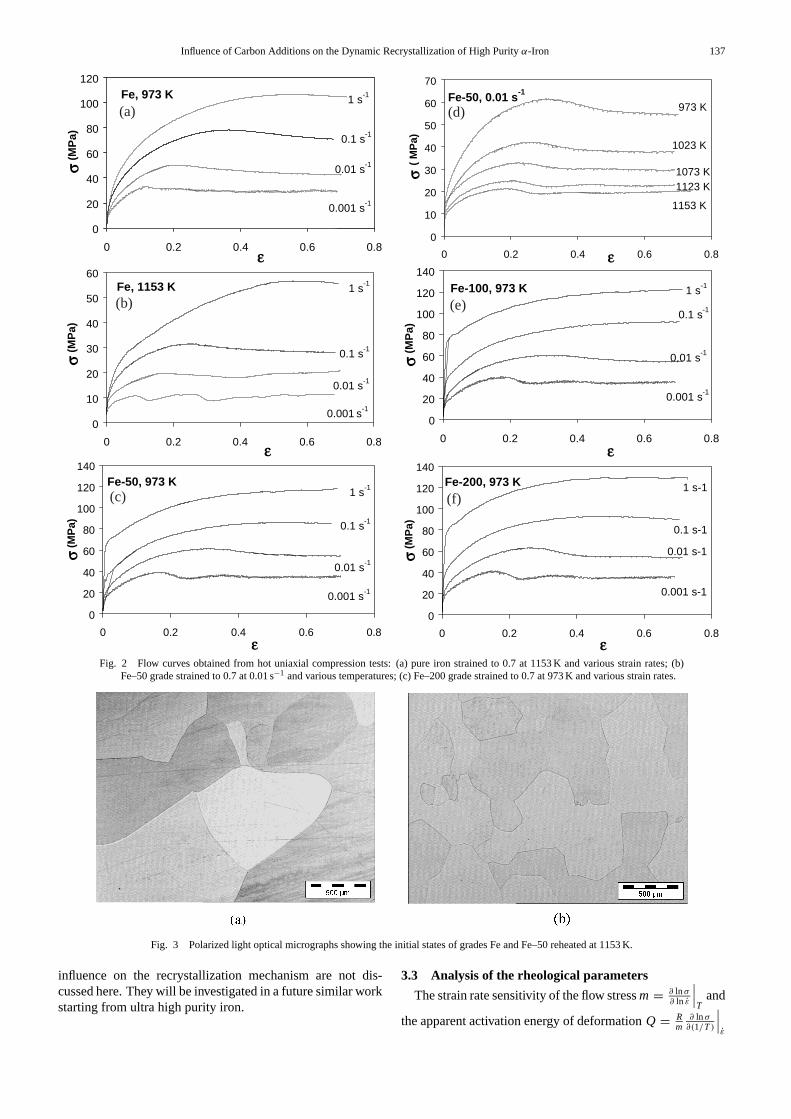
3.1 Stress-strain curvesTypical flow curves obtained from the compression tests
are shown in Fig. 2, displaying equivalent von Mises stress
850
700
800
750
912
Temperature
Mass ppm carbon0 50 100 200
1123
973
1073
1023
1185
K
0.59
0.51
0.57
0.54
0.63
T / Tm : test in domain at 10-2 s-1
: test in domain at 10-3, 10-2, 0.1 and 1 s-1
Fig. 1 Testing conditions displayed on the Fe–C equilibrium phase dia-gram.
versus equivalent von Mises strain.
3.2 Occurrence of discontinuous dynamic recrystalliza-tion
Flow curves associated with discontinuous dynamic recrys-tallization at low strain rates and high temperatures, i.e., lowZener-Hollomon parameter (Z ) values, exhibit typical oscil-lations. The latter are the result of repeated events of nucle-ation and growth of new grains during deformation, whichlead to grain coarsening (Sakai and Jonas8)). By contrast, inhigh stacking fault energy metals like aluminium or α-ironcommercial purity, where continuous dynamic recrystalliza-tion takes place, such wavy stress-strain curves have neverbeen observed to date, whatever the Z value. Within therange of high strain rates and low temperatures (high Z val-ues), DDRX is associated with grain refinement. The result-ing flow curves are characterized by a single peak and attaina steady state after moderate strains (ε ≈ 1). Still in this case,they can be readily distinguished from the CDRX ones, whichexhibit a much smoother maximum and generally reach theirsteady states after quite large deformations (ε > 10). Exten-sive metallographic observations would be required to con-firm the occurrence of either DDRX or CDRX, but It shouldbe noted, however, that post-dynamic recrystallization mightlead to wrong conclusions, especially at high Z values. Thestress-strain curves shown in Fig. 1 exhibit oscillations, espe-cially at the lower strain rates. From the observation of theamplitude, frequency and number of oscillations at a constantstrain rate, no specific trend indicates that iron purificationfavours the occurrence of discontinuous dynamic recrystal-lization (DDRX). Analysis of the oscillation magnitudes wasnevertheless performed very carefully, because it strongly de-pends on the average grain size evolution between the initialstate (after heating) and the steady state of deformation. In thepresent investigation, a large difference of initial grain sizewas observed between the Fe and Fe–50 grades: at 1153 K,the initial grain sizes estimated from optical metallographywere 800 and 400 µm (Fig. 3, respectively). Furthermore, thefinal average grain size, when steady state deformation oc-curs, depends, of course, on the carbon content.
The different initial grain sizes are associated with static re-crystallization and grain growth during the heating stage, andthe temperature stabilization delay, required to ensure thermalhomogeneity. The kinetics of these mechanisms strongly de-pend on the carbon content, since carbon atoms decrease grainboundary mobility. Quantitative comparisons of the stress-strain curves must be carried out very carefully, taking intoaccount the specific initial state of each grade. However, thegrain size evolutions observed at 1153 K and 0.01 s−1 for astrain of 0.7 are consistent with the oscillating shapes of thestress-strain curves associated with grain growth (Table 2).Observation of the stress-strain curves confirms the occur-rence of discontinuous dynamic recrystallization in low car-bon (≤ 200 ppm) high purity iron. Furthermore, a weak effectof the carbon addition on the flow stress level can be noted.
In this work, purified electrolytic iron was used as a ba-sis for preparing the various Fe–C grades. Analyses per-formed on this material exhibit weak amounts of cobalt (about5 ppm), copper (about 5 ppm), and silicon (about 10 ppm).The interactions of these components with carbon and their
Influence of Carbon Additions on the Dynamic Recrystallization of High Purity α-Iron 137
Fe, 973 K
0
20
40
60
80
100
120
0 0.2 0.4 0.6 0.8
(M
Pa)
0.001 s-1
0.01 s-1
0.1 s-1
1 s-1
(a)Fe-50, 0.01 s-1
0
10
20
30
40
50
60
70
0 0.2 0.4 0.6 0.8
( M
Pa)
973 K
1073 K1123 K
1023 K
1153 K
(d)
Fe, 1153 K
0
10
20
30
40
50
60
0 0.2 0.4 0.6 0.8
(M
Pa)
0.001 s-1
0.1 s-1
1 s-1
0.01 s-1
(b)Fe-100, 973 K
0
20
40
60
80
100
120
140
0 0.2 0.4 0.6 0.8
(M
Pa)
0.001 s-1
1 s-1
0.1 s-1
0.01 s-1
(e)
Fe-50, 973 K
0
20
40
60
80
100
120
140
0 0.2 0.4 0.6 0.8
(M
Pa)
1 s-1
0.1 s-1
0.001 s-1
0.01 s-1
(c)Fe-200, 973 K
0
20
40
60
80
100
120
140
0 0.2 0.4 0.6 0.8
(M
Pa)
1 s-1
0.001 s-1
0.01 s-1
0.1 s-1
(f)
Fig. 2 Flow curves obtained from hot uniaxial compression tests: (a) pure iron strained to 0.7 at 1153 K and various strain rates; (b)Fe–50 grade strained to 0.7 at 0.01 s−1 and various temperatures; (c) Fe–200 grade strained to 0.7 at 973 K and various strain rates.
Fig. 3 Polarized light optical micrographs showing the initial states of grades Fe and Fe–50 reheated at 1153 K.
influence on the recrystallization mechanism are not dis-cussed here. They will be investigated in a future similar workstarting from ultra high purity iron.
3.3 Analysis of the rheological parameters
The strain rate sensitivity of the flow stress m = ∂ ln σ∂ ln ε
∣∣∣T
and
the apparent activation energy of deformation Q = Rm
∂ ln σ∂(1/T )
∣∣∣ε
138 C. Desrayaud, S. Girard, J. L. Coze and F. Montheillet
Table 2 Grain size evolution during straining of the two grades Fe andFe–50 at 1153 K and 0.01 s−1 for a strain of 0.7.
Grade Fe Fe–50
Initial estimated 800 400
average grain size (µm)
Final (steady state) estimated 1200 600
average grain size (µm)
Table 3 Rheological parameters m and Q of the various Fe–C grades, de-termined at ε = 0.1 and ε = 0.6 and various temperatures.
were determined from the above flow curves for each irongrade, and are reported in Table 3. Calculations were madefrom stress values associated with two different strain levels:
–At ε = 0.1, where recrystallization (whatever its type)is not yet operating, hardening and dynamic recovery are theonly mechanisms that take place. At this low strain level,results must be considered very carefully, because of the in-fluence of the material state just before straining (grain size).As described in the second part of this section, the specimensare subject to static recrystallization and grain growth dur-ing the 10 min of thermal homogenization. It is likely that thehigher the deformation temperature, the larger the initial aver-age grain size will be. Considering that static recrystallizationand grain growth kinetics strongly depend on the carbon con-tent, variations of the initial grain size may be expected forthe various grades.
–At ε = 0.6, the deformation steady state is supposed tobe reached. This assumption may be discussed for the high-est strain rate, where some evolution of the stress after thisstrain level can still be observed. Nevertheless, the reportedstress values in this case will be considered to be close tothe true steady state values, considering the fairly low slopeof the stress-strain curve. Since the flow stress depends onlyon the deformation strain rate and temperature provided thatthe steady state is reached, the above considerations make thevalues of m and Q at this strain level (0.6) independent of theinitial state of the material.
Results obtained for the strain rate sensitivity m are consis-tent with the literature: they exhibit in all cases an increaseof m with temperature, in agreement with the classical vis-cous behaviour predominance at high temperatures. Further-more, Table 3 shows that m is significantly higher at largestrains, which might be related to the occurrence of discon-tinuous DRX. The apparent activation energy of the base Fegrade may be compared with the activation energy of self-diffusion Q = 280 kJ/mol, in α-Fe determined by Seeger.9)
As the carbon content increases, the activation energy raisesfrom 207 kJ/mol for Fe up to 260 kJ/mol. The value reported
Influence of carbon content on flow Stress,
0.01s-1, 973 K.
40
45
50
55
60
65
0 50 100 150 200 250carbon content, C / ppm
MP
a
0.6
0.1
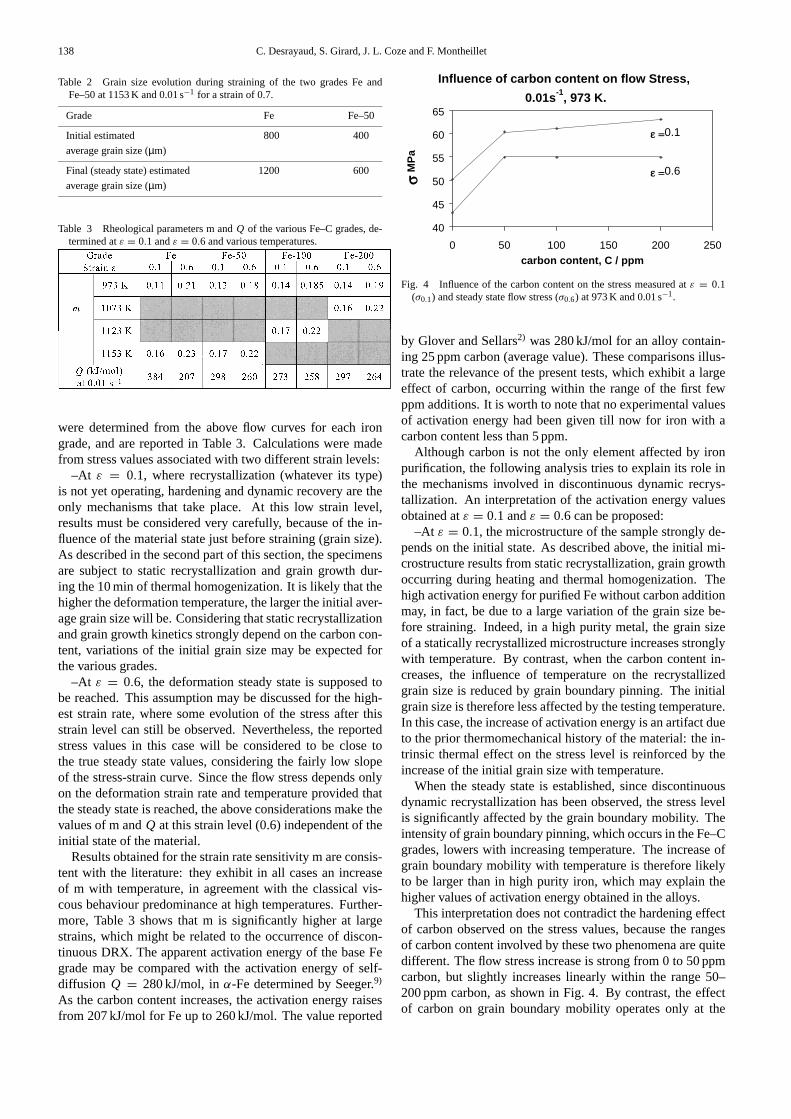
Fig. 4 Influence of the carbon content on the stress measured at ε = 0.1(σ0.1) and steady state flow stress (σ0.6) at 973 K and 0.01 s−1.
by Glover and Sellars2) was 280 kJ/mol for an alloy contain-ing 25 ppm carbon (average value). These comparisons illus-trate the relevance of the present tests, which exhibit a largeeffect of carbon, occurring within the range of the first fewppm additions. It is worth to note that no experimental valuesof activation energy had been given till now for iron with acarbon content less than 5 ppm.
Although carbon is not the only element affected by ironpurification, the following analysis tries to explain its role inthe mechanisms involved in discontinuous dynamic recrys-tallization. An interpretation of the activation energy valuesobtained at ε = 0.1 and ε = 0.6 can be proposed:
–At ε = 0.1, the microstructure of the sample strongly de-pends on the initial state. As described above, the initial mi-crostructure results from static recrystallization, grain growthoccurring during heating and thermal homogenization. Thehigh activation energy for purified Fe without carbon additionmay, in fact, be due to a large variation of the grain size be-fore straining. Indeed, in a high purity metal, the grain sizeof a statically recrystallized microstructure increases stronglywith temperature. By contrast, when the carbon content in-creases, the influence of temperature on the recrystallizedgrain size is reduced by grain boundary pinning. The initialgrain size is therefore less affected by the testing temperature.In this case, the increase of activation energy is an artifact dueto the prior thermomechanical history of the material: the in-trinsic thermal effect on the stress level is reinforced by theincrease of the initial grain size with temperature.
When the steady state is established, since discontinuousdynamic recrystallization has been observed, the stress levelis significantly affected by the grain boundary mobility. Theintensity of grain boundary pinning, which occurs in the Fe–Cgrades, lowers with increasing temperature. The increase ofgrain boundary mobility with temperature is therefore likelyto be larger than in high purity iron, which may explain thehigher values of activation energy obtained in the alloys.
This interpretation does not contradict the hardening effectof carbon observed on the stress values, because the rangesof carbon content involved by these two phenomena are quitedifferent. The flow stress increase is strong from 0 to 50 ppmcarbon, but slightly increases linearly within the range 50–200 ppm carbon, as shown in Fig. 4. By contrast, the effectof carbon on grain boundary mobility operates only at the
Influence of Carbon Additions on the Dynamic Recrystallization of High Purity α-Iron 139
10
100
1000
10 15 20 25 30 35
Ln Z
(M
Pa)
. Fe
Fe - 50
Fe - 100
Fe - 200
Fig. 5 Dependence of the steady state flow stress (ε = 0.6) of the variousgrade samples on the Zener-Hollomon parameter Z .
very low carbon contents, since no variation of the activationenergy is observed between the Fe–50, Fe–100, and Fe–200grades (Table 3). A simple interpretation of this effect canbe proposed by assuming that the saturation level of a grainboundary is attained when carbon interstitials are present inone out of N lattice cells. A rough estimation of the numberof carbon atoms per unit volume is then given by 3/(Nda2),where D is the average grain size and a the lattice parame-ter. Since the number of iron atoms per unit volume is 2/a3,the ratio of the number of carbon atoms to the number of ironatoms is 3a/(2 ND). Taking into account the atomic masses ofthe two species, this yields 36a/(112 ND) for the mass con-centration of carbon. Using a = 0.3 nm, D = 10 µm, andassuming that N ranges from 1 to 10, a critical carbon con-centration from 10 to 1 ppm is obtained. This shows that car-bon solutes are likely to saturate grain boundaries for volumeconcentrations far less than 50 ppm, which explains that grainboundary mobility and therefore the apparent activation en-ergy remain unchanged at higher carbon concentrations.
Figure 5 shows the dependence of the steady state flowstress measured at ε = 0.7 on the Zener-Hollomon param-eter Z . The three grades Fe–50, Fe–100, and Fe–200 obvi-ously behave similarly, whereas the flow stress of pure ironis significantly larger for a given value of Z . This does notmean that the flow stress of pure Fe is intrinsically larger thanfor the Fe–C grades, but merely reflects the larger apparentactivation energy of the latter at large strains (see Table 3):for a given set of strain rate and temperature, Z is lower forpure iron than for the alloys, which shifts the associated linetowards the left in the diagram of Fig. 4.
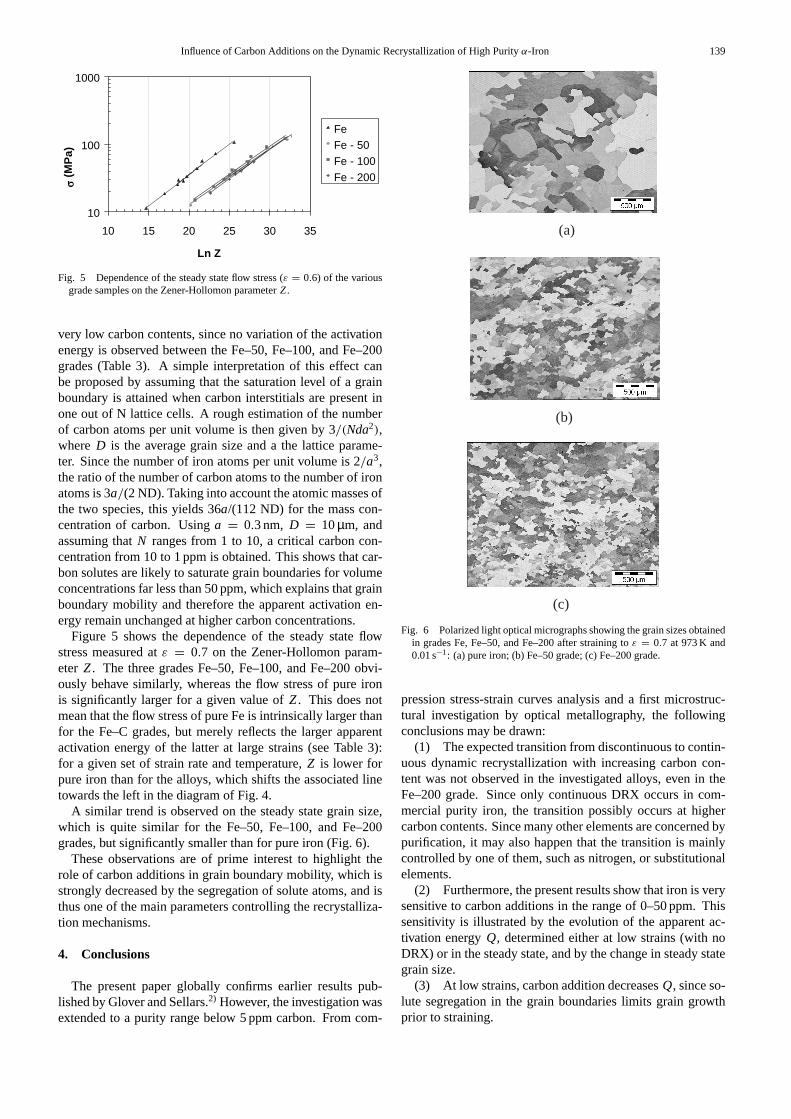
A similar trend is observed on the steady state grain size,which is quite similar for the Fe–50, Fe–100, and Fe–200grades, but significantly smaller than for pure iron (Fig. 6).
These observations are of prime interest to highlight therole of carbon additions in grain boundary mobility, which isstrongly decreased by the segregation of solute atoms, and isthus one of the main parameters controlling the recrystalliza-tion mechanisms.
4. Conclusions
The present paper globally confirms earlier results pub-lished by Glover and Sellars.2) However, the investigation wasextended to a purity range below 5 ppm carbon. From com-
(a)
(b)
(c)
Fig. 6 Polarized light optical micrographs showing the grain sizes obtainedin grades Fe, Fe–50, and Fe–200 after straining to ε = 0.7 at 973 K and0.01 s−1: (a) pure iron; (b) Fe–50 grade; (c) Fe–200 grade.
pression stress-strain curves analysis and a first microstruc-tural investigation by optical metallography, the followingconclusions may be drawn:
(1) The expected transition from discontinuous to contin-uous dynamic recrystallization with increasing carbon con-tent was not observed in the investigated alloys, even in theFe–200 grade. Since only continuous DRX occurs in com-mercial purity iron, the transition possibly occurs at highercarbon contents. Since many other elements are concerned bypurification, it may also happen that the transition is mainlycontrolled by one of them, such as nitrogen, or substitutionalelements.
(2) Furthermore, the present results show that iron is verysensitive to carbon additions in the range of 0–50 ppm. Thissensitivity is illustrated by the evolution of the apparent ac-tivation energy Q, determined either at low strains (with noDRX) or in the steady state, and by the change in steady stategrain size.
(3) At low strains, carbon addition decreases Q, since so-lute segregation in the grain boundaries limits grain growthprior to straining.

140 C. Desrayaud, S. Girard, J. L. Coze and F. Montheillet
(4) By contrast at large strains under steady state flow,carbon addition increases Q, since the interaction of solutesand moving grain boundaries becomes weaker with increas-ing temperature. Therefore the pinning effect of carbon hasopposite effects at low and large strains.
More generally, this work points out the importance of con-trolling the material purity even in the range of a few ppm,where many evolutions in the material behaviour and mi-crostructure may occur.
REFERENCES
1) J.-P. A. Immarigeon and J. J. Jonas: Acta. Metall. 19 (1971) 1053–1061.
2) G. Glover and C. M. Sellars: Metall. Trans. 4 (1973) 765–775.3) N. Tsuji, Y. Saito and T. Maki: Proceedings of the fourth International
Conference on Recrystallization and Related Phenomena, J. Jap. Inst.Metals (1999) pp. 253–258.
4) S. Gourdet and F. Montheillet: Mater. Sci. Eng. A283 (2000) 274–288.5) K. Tanaka, K. Ito, H. Yamagata and M. Otsuka: J. Japan Inst. Metals 63
(1999) 859–865.6) J. Le Coze, R. Tardy, A. Kobylanski and M. Biscondi: Proceedings First
International Conference on Ultra High Purity Base Metals (UHPM-94), Kitakyushu-City, Japan (1994) pp. 371–389.
7) B. Avitzur: Metal Forming: Processes and Analysis, (McGraw-Hill,1968).
8) T. Sakai and J. J. Jonas: Acta. Metall. 32 (1984) 189–209.9) A. Seeger: Phys. Status. Solidi. 167 (1997) 275–287.