INTERIM CONDENSED FINANCIAL STATEMENTS
47
MOTOR OIL (HELLAS) CORINTH REFINERIES SA G.E.MI. 272801000 (Ex Prefecture of Attica Registration Nr 1482/06/Β/86/26) Headquarters: Irodou Attikou 12 Α , 151 24 Maroussi Attica INTERIM CONDENSED FINANCIAL STATEMENTS IN ACCORDANCE WITH INTERNATIONAL FINANCIAL REPORTING STANDARDS THAT HAVE BEEN ADOPTED BY THE EUROPEAN UNION FOR THE PERIOD 1 JANUARY – 31 MARCH 2021 FOR THE GROUP AND THE COMPANY “MOTOR OIL (HELLAS) CORINTH REFINERIES S.A.”
Transcript of INTERIM CONDENSED FINANCIAL STATEMENTS
MOTOR OIL (HELLAS) CORINTH REFINERIES SA G.E.MI. 272801000
(Ex Prefecture of Attica Registration Nr 1482/06/Β/86/26)
Headquarters: Irodou Attikou 12Α, 151 24 Maroussi Attica
INTERIM
CONDENSED
FINANCIAL
STATEMENTS
IN ACCORDANCE WITH INTERNATIONAL FINANCIAL REPORTING STANDARDS
THAT HAVE BEEN ADOPTED BY THE EUROPEAN UNION
FOR THE PERIOD 1 JANUARY – 31 MARCH 2021
FOR THE GROUP AND THE COMPANY
“MOTOR OIL (HELLAS) CORINTH REFINERIES S.A.”
Interim Condensed Financial Statements
for the period 1/1-31/3/2021
Page 2 of 46
C O N T E N T S Condensed Statement of Profit or Loss and other Comprehensive Income for the period ended 31st March
2021 .............................................................................................................................................................................. 4
Condensed Statement of Financial Position as at 31st March 2021 ...................................................................... 6
Condensed Statement of Changes in Equity for the period ended 31st March 2021 ........................................ 7
Condensed Statement of Cash Flows for the period ended 31st March 2021..................................................... 8
Notes to the Financial Statements ............................................................................................................................ 9
1. General Information ........................................................................................................................................... 9
2. Basis of Financial Statements Preparation & Adoption of New and Revised International Financial
Reporting Standards (IFRSs) ....................................................................................................................................... 9
3. Operating Segments ........................................................................................................................................ 11
4. Revenue ............................................................................................................................................................. 15
5. Finance Income ............................................................................................................................................... 16
6. Inventories ......................................................................................................................................................... 16
7. Finance Costs .................................................................................................................................................... 17
8. Income Tax Expenses ...................................................................................................................................... 17
9. Earnings/(Losses) per Share ............................................................................................................................ 18
10. Dividends .......................................................................................................................................................... 18
11. Goodwill ........................................................................................................................................................... 19
12. Other Intangible Assets ................................................................................................................................... 20
13. Property, Plant and Equipment ...................................................................................................................... 21
14. Investments in Subsidiaries and Associates ................................................................................................ 23
15. Other Financial Assets .................................................................................................................................... 28
16. Borrowings ....................................................................................................................................................... 28
17. Fair Value of Financial Instruments ............................................................................................................... 33
18. Leases ............................................................................................................................................................... 35
19. Share Capital ................................................................................................................................................... 36
20. Reserves ........................................................................................................................................................... 37
21. Retained Earnings ........................................................................................................................................... 38
22. Establishment/Acquisition of Subsidiaries/Associates ............................................................................... 39
23. Contingent Liabilities/Commitments ............................................................................................................ 39
24. Related Party Transactions ............................................................................................................................. 41
25. Management of Financial Risks .................................................................................................................... 42
26. Events after the Reporting Period .................................................................................................................. 46
The financial statements of the Group and the Company, set out on pages 1 to 46, were approved at the
Board of Directors’ Meeting dated June 14th, 2021.
Interim Condensed Financial Statements
for the period 1/1-31/3/2021
Page 3 of 46
THE CHAIRMAN OF THE BOARD
OF DIRECTORS
THE DEPUTY MANAGING
DIRECTOR AND CHIEF
FINANCIAL OFFICER
THE CHIEF ACCOUNTANT
VARDIS J. VARDINOYANNIS PETROS T. TZANNETAKIS
THEODOROS N. PORFIRIS
Interim Condensed Financial Statements
for the period 1/1-31/03/2021
The notes on pages 9 - 46 are an integral part of these interim condensed Financial Statements of the
Company and the Group.
Page 4 of 46
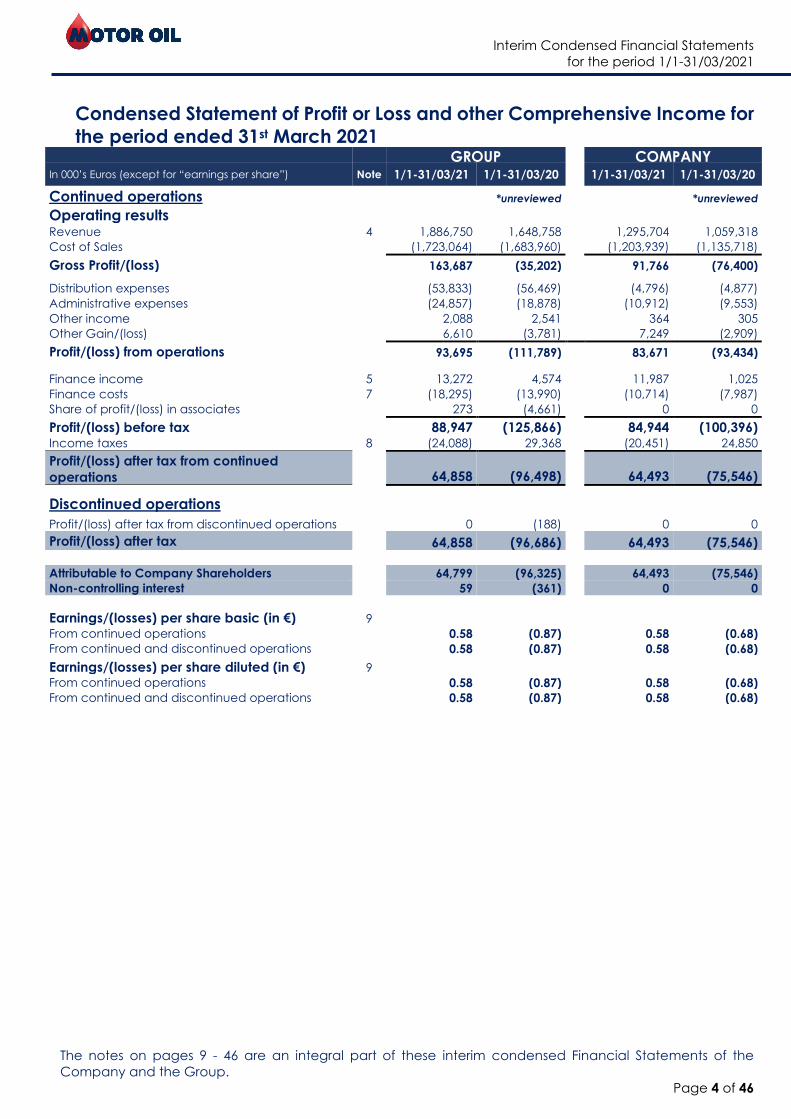
Condensed Statement of Profit or Loss and other Comprehensive Income for
the period ended 31st March 2021 GROUP COMPANY In 000’s Euros (except for “earnings per share”) Note 1/1-31/03/21 1/1-31/03/20 1/1-31/03/21 1/1-31/03/20
Continued operations *unreviewed *unreviewed
Operating results
Revenue 4 1,886,750 1,648,758 1,295,704 1,059,318
Cost of Sales (1,723,064) (1,683,960) (1,203,939) (1,135,718)
Gross Profit/(loss) 163,687 (35,202) 91,766 (76,400)
Distribution expenses (53,833) (56,469) (4,796) (4,877)
Administrative expenses (24,857) (18,878) (10,912) (9,553)
Other income 2,088 2,541 364 305
Other Gain/(loss) 6,610 (3,781) 7,249 (2,909)
Profit/(loss) from operations 93,695 (111,789) 83,671 (93,434)
Finance income 5 13,272 4,574 11,987 1,025
Finance costs 7 (18,295) (13,990) (10,714) (7,987)
Share of profit/(loss) in associates 273 (4,661) 0 0
Profit/(loss) before tax 88,947 (125,866) 84,944 (100,396) Income taxes 8 (24,088) 29,368 (20,451) 24,850
Profit/(loss) after tax from continued
operations 64,858 (96,498) 64,493 (75,546)
Discontinued operations
Profit/(loss) after tax from discontinued operations 0 (188) 0 0
Profit/(loss) after tax 64,858 (96,686) 64,493 (75,546)
Attributable to Company Shareholders 64,799 (96,325) 64,493 (75,546)
Non-controlling interest 59 (361) 0 0
Earnings/(losses) per share basic (in €) 9
From continued operations 0.58 (0.87) 0.58 (0.68)
From continued and discontinued operations 0.58 (0.87) 0.58 (0.68)
Earnings/(losses) per share diluted (in €) 9
From continued operations 0.58 (0.87) 0.58 (0.68)
From continued and discontinued operations 0.58 (0.87) 0.58 (0.68)
Interim Condensed Financial Statements
for the period 1/1-31/03/2021
The notes on pages 9 - 46 are an integral part of these interim condensed Financial Statements of the
Company and the Group.
Page 5 of 46
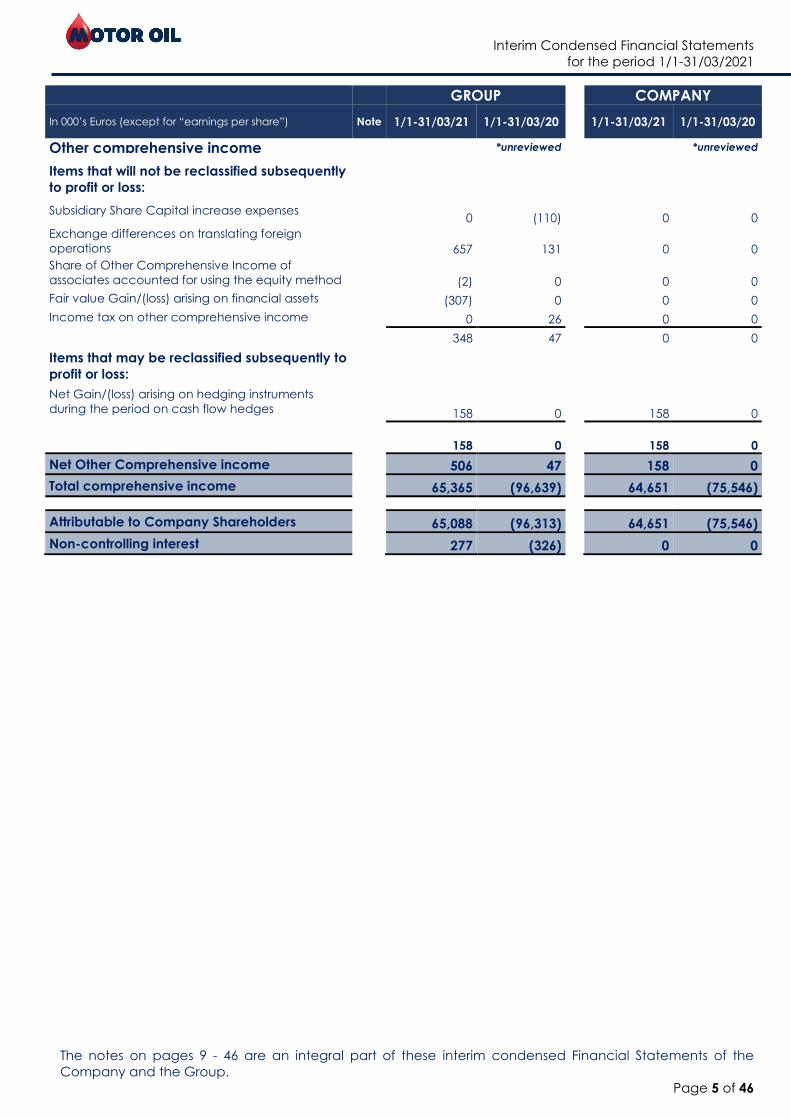
GROUP COMPANY
In 000’s Euros (except for “earnings per share”) Note 1/1-31/03/21 1/1-31/03/20 1/1-31/03/21 1/1-31/03/20
Other comprehensive income *unreviewed *unreviewed
Items that will not be reclassified subsequently
to profit or loss:
Subsidiary Share Capital increase expenses 0 (110) 0 0
Exchange differences on translating foreign
operations 657 131 0 0
Share of Other Comprehensive Income of
associates accounted for using the equity method (2) 0 0 0
Fair value Gain/(loss) arising on financial assets (307) 0 0 0
Income tax on other comprehensive income 0 26 0 0
348 47 0 0
Items that may be reclassified subsequently to
profit or loss:
Net Gain/(loss) arising on hedging instruments
during the period on cash flow hedges 158 0 158 0
158 0 158 0
Net Other Comprehensive income 506 47 158 0
Total comprehensive income 65,365 (96,639) 64,651 (75,546)
Attributable to Company Shareholders 65,088 (96,313) 64,651 (75,546)
Non-controlling interest 277 (326) 0 0
Interim Condensed Financial Statements
for the period 1/1-31/03/2021
The notes on pages 9 - 46 are an integral part of these interim condensed Financial Statements of the
Company and the Group.
Page 6 of 46
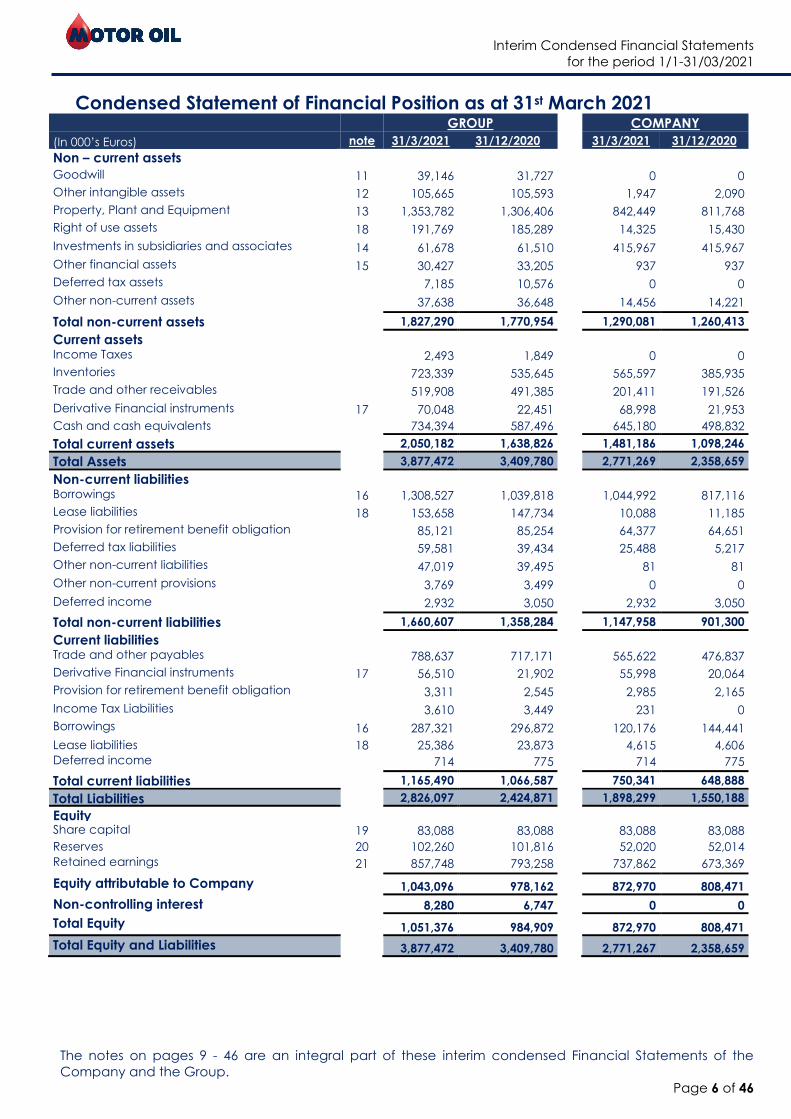
Condensed Statement of Financial Position as at 31st March 2021 GROUP COMPANY
(In 000’s Euros) note 31/3/2021 31/12/2020 31/3/2021 31/12/2020
Non – current assets
Goodwill 11 39,146 31,727 0 0
Other intangible assets 12 105,665 105,593 1,947 2,090
Property, Plant and Equipment 13 1,353,782 1,306,406 842,449 811,768
Right of use assets 18 191,769 185,289 14,325 15,430
Investments in subsidiaries and associates 14 61,678 61,510 415,967 415,967
Other financial assets 15 30,427 33,205 937 937
Deferred tax assets 7,185 10,576 0 0
Other non-current assets 37,638 36,648 14,456 14,221
Total non-current assets 1,827,290 1,770,954 1,290,081 1,260,413
Current assets
Income Taxes 2,493 1,849 0 0
Inventories 723,339 535,645 565,597 385,935
Trade and other receivables 519,908 491,385 201,411 191,526
Derivative Financial instruments 17 70,048 22,451 68,998 21,953
Cash and cash equivalents 734,394 587,496 645,180 498,832
Total current assets 2,050,182 1,638,826 1,481,186 1,098,246
Total Assets 3,877,472 3,409,780 2,771,269 2,358,659
Non-current liabilities
Borrowings 16 1,308,527 1,039,818 1,044,992 817,116
Lease liabilities 18 153,658 147,734 10,088 11,185
Provision for retirement benefit obligation 85,121 85,254 64,377 64,651
Deferred tax liabilities 59,581 39,434 25,488 5,217
Other non-current liabilities 47,019 39,495 81 81
Other non-current provisions 3,769 3,499 0 0
Deferred income 2,932 3,050 2,932 3,050
Total non-current liabilities 1,660,607 1,358,284 1,147,958 901,300
Current liabilities
Trade and other payables 788,637 717,171 565,622 476,837
Derivative Financial instruments 17 56,510 21,902 55,998 20,064
Provision for retirement benefit obligation 3,311 2,545 2,985 2,165
Income Tax Liabilities 3,610 3,449 231 0
Borrowings 16 287,321 296,872 120,176 144,441
Lease liabilities 18 25,386 23,873 4,615 4,606
Deferred income 714 775 714 775
Total current liabilities 1,165,490 1,066,587 750,341 648,888
Total Liabilities 2,826,097 2,424,871 1,898,299 1,550,188
Equity
Share capital 19 83,088 83,088 83,088 83,088
Reserves 20 102,260 101,816 52,020 52,014
Retained earnings 21 857,748 793,258 737,862 673,369
Equity attributable to Company
Shareholders 1,043,096 978,162 872,970 808,471
Non-controlling interest 8,280 6,747 0 0
Total Equity 1,051,376 984,909 872,970 808,471
Total Equity and Liabilities 3,877,472 3,409,780 2,771,267 2,358,659
Interim Condensed Financial Statements
for the period 1/1-31/03/2021
The notes on pages 9 - 46 are an integral part of these interim condensed Financial Statements of the
Company and the Group.
Page 7 of 46
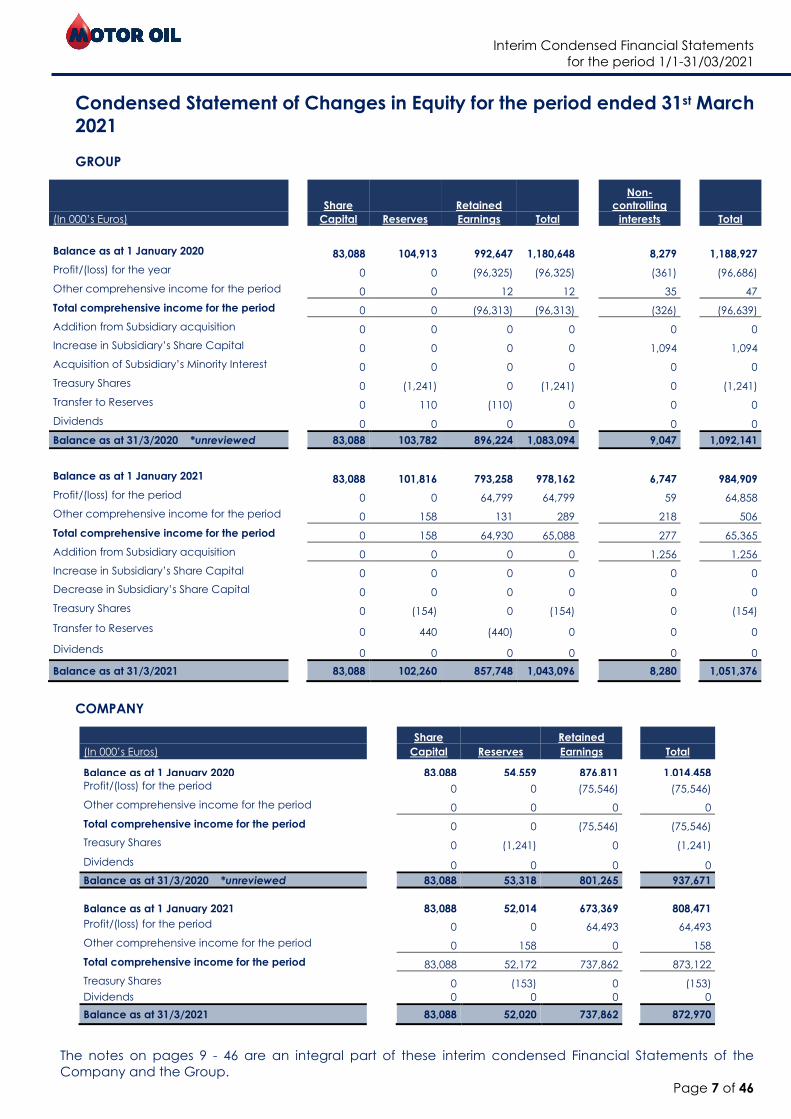
Condensed Statement of Changes in Equity for the period ended 31st March
2021
GROUP
Share Retained
Non-
controlling
(In 000’s Euros) Capital Reserves Earnings Total interests Total
Balance as at 1 January 2020 83,088 104,913 992,647 1,180,648
8,279
1,188,927
Profit/(loss) for the year 0 0 (96,325) (96,325) (361) (96,686)
Other comprehensive income for the period 0 0 12 12 35 47
Total comprehensive income for the period 0 0 (96,313) (96,313) (326) (96,639)
Addition from Subsidiary acquisition 0 0 0 0 0 0
Increase in Subsidiary’s Share Capital 0 0 0 0 1,094 1,094
Acquisition of Subsidiary’s Minority Interest 0 0 0 0 0 0
Treasury Shares 0 (1,241) 0 (1,241) 0 (1,241)
Transfer to Reserves 0 110 (110) 0 0 0
Dividends 0 0 0 0 0 0
Balance as at 31/3/2020 *unreviewed 83,088 103,782 896,224 1,083,094 9,047 1,092,141
Balance as at 1 January 2021 83,088 101,816 793,258 978,162 6,747 984,909
Profit/(loss) for the period 0 0 64,799 64,799 59 64,858
Other comprehensive income for the period 0 158 131 289 218 506
Total comprehensive income for the period 0 158 64,930 65,088 277 65,365
Addition from Subsidiary acquisition 0 0 0 0 1,256 1,256
Increase in Subsidiary’s Share Capital 0 0 0 0 0 0
Decrease in Subsidiary’s Share Capital 0 0 0 0 0 0
Treasury Shares 0 (154) 0 (154) 0 (154)
Transfer to Reserves 0 440 (440) 0 0 0
Dividends 0 0 0 0 0 0
Balance as at 31/3/2021 83,088 102,260 857,748 1,043,096 8,280 1,051,376
COMPANY
Share Retained
(In 000’s Euros) Capital Reserves Earnings Total
Balance as at 1 January 2020 83,088 54,559 876,811 1,014,458
Profit/(loss) for the period 0 0 (75,546) (75,546)
Other comprehensive income for the period 0 0 0 0
Total comprehensive income for the period 0 0 (75,546) (75,546)
Treasury Shares 0 (1,241) 0 (1,241)
Dividends 0 0 0 0
Balance as at 31/3/2020 *unreviewed 83,088 53,318 801,265 937,671
Balance as at 1 January 2021 83,088 52,014 673,369 808,471
Profit/(loss) for the period 0 0 64,493 64,493
Other comprehensive income for the period 0 158 0 158
Total comprehensive income for the period 83,088 52,172 737,862 873,122
Treasury Shares 0 (153) 0 (153)
Dividends 0 0 0 0
Balance as at 31/3/2021 83,088 52,020 737,862 872,970
Interim Condensed Financial Statements
for the period 1/1-31/03/2021
The notes on pages 9 - 46 are an integral part of these interim condensed Financial Statements of the
Company and the Group.
Page 8 of 46
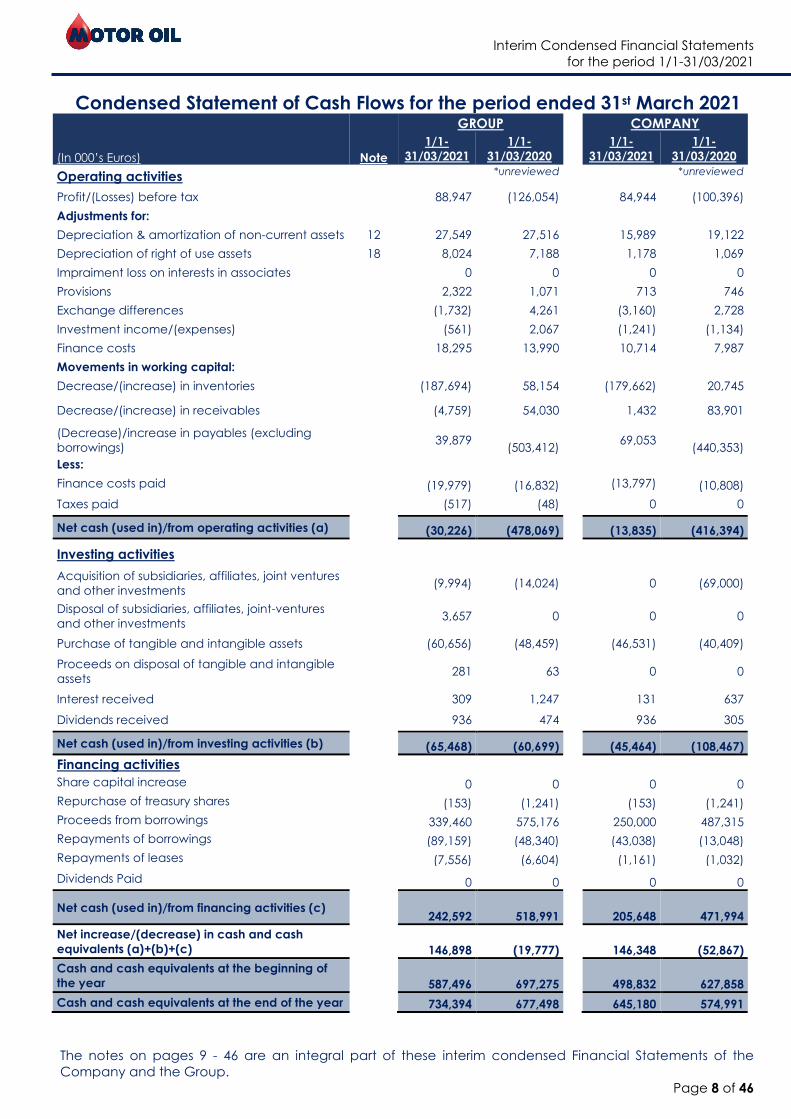
Condensed Statement of Cash Flows for the period ended 31st March 2021 GROUP COMPANY
(In 000’s Euros) Note
1/1-
31/03/2021
1/1-
31/03/2020
1/1-
31/03/2021
1/1-
31/03/2020
Operating activities *unreviewed *unreviewed
Profit/(Losses) before tax 88,947 (126,054) 84,944 (100,396)
Adjustments for:
Depreciation & amortization of non-current assets 12 27,549 27,516 15,989 19,122
Depreciation of right of use assets 18 8,024 7,188 1,178 1,069
Impraiment loss on interests in associates 0 0 0 0
Provisions 2,322 1,071 713 746
Exchange differences (1,732) 4,261 (3,160) 2,728
Investment income/(expenses) (561) 2,067 (1,241) (1,134)
Finance costs 18,295 13,990 10,714 7,987
Movements in working capital:
Decrease/(increase) in inventories (187,694) 58,154 (179,662) 20,745
Decrease/(increase) in receivables
(4,759) 54,030
1,432 83,901
(Decrease)/increase in payables (excluding
borrowings) 39,879
(503,412) 69,053
(440,353)
Less:
Finance costs paid (19,979) (16,832) (13,797) (10,808)
Taxes paid (517) (48) 0 0
Net cash (used in)/from operating activities (a) (30,226) (478,069) (13,835) (416,394)
Investing activities
Acquisition of subsidiaries, affiliates, joint ventures
and other investments (9,994) (14,024)
0 (69,000)
Disposal of subsidiaries, affiliates, joint-ventures
and other investments 3,657 0
0 0
Purchase of tangible and intangible assets (60,656) (48,459) (46,531) (40,409)
Proceeds on disposal of tangible and intangible
assets 281 63
0 0
Interest received 309 1,247 131 637
Dividends received 936 474 936 305
Net cash (used in)/from investing activities (b) (65,468) (60,699) (45,464) (108,467)
Financing activities
Share capital increase 0 0 0 0
Repurchase of treasury shares (153) (1,241) (153) (1,241)
Proceeds from borrowings 339,460 575,176 250,000 487,315
Repayments of borrowings (89,159) (48,340) (43,038) (13,048)
Repayments of leases (7,556) (6,604) (1,161) (1,032)
Dividends Paid 0 0 0 0
Net cash (used in)/from financing activities (c) 242,592 518,991 205,648 471,994
Net increase/(decrease) in cash and cash
equivalents (a)+(b)+(c) 146,898 (19,777) 146,348 (52,867)
Cash and cash equivalents at the beginning of
the year 587,496 697,275 498,832 627,858
Cash and cash equivalents at the end of the year 734,394 677,498 645,180 574,991
Interim Condensed Financial Statements
for the period 1/1-31/03/2021
Page 9 of 46
Notes to the Financial Statements
1. General Information
The parent company of the MOTOR OIL Group (the Group) is the entity under the trade name “Motor Oil
(Hellas) Corinth Refineries S.A.” (the Company), which is registered in Greece as a public company (Societe
Anonyme) according to the provisions of Company Law 2190/1920 (as replaced by Law 4548/2018), with
headquarters in Maroussi of Attica, 12Α Irodou Attikou street, 151 24. The Group operates in the oil sector
with its main activities being oil refining and oil products trading.
Major shareholders of the Company are “Petroventure Holdings Limited” holding 40% and “Doson
Investments Company” holding 5.6%.
These financial statements are presented in Euro because that is the currency of the primary economic
environment in which the Group operates. Amounts in these financial statements are expressed in € 000’s
unless otherwise indicated. Any difference up to € 1,000 is due to rounding.
As at 31 March 2021 the number of employees, for the Group and the Company, was 2,891 and 1,329
respectively (31/03/2021: Group: 2,321 persons, Company: 1,286 persons).
2. Basis of Financial Statements Preparation & Adoption of New and Revised
International Financial Reporting Standards (IFRSs)
2.1. Basis of preparation
The interim condensed financial statements for the period ended 31 March 2021 have been prepared in
accordance with International Accounting Standard (IAS) 34, ‘Interim financial reporting’ and as such do
not include all the information and disclosures required in the annual financial statements. In this context,
these interim condensed financial statements should be read in conjunction with the Group’s annual
financial statements for the year ended 31 December 2020.
The accounting policies adopted in the preparation of these interim condensed financial statements are
consistent with those followed in the preparation of the Group’s annual financial statements for the year
ended 31 December 2019, except for the accounting treatment of financial instruments used for hedging
purposes. This is the first year of adopting hedge accounting according to IFRS 9. The Group designates
certain derivatives as hedging instruments in respect of foreign exchange and commodity price risk in fair
value hedges and cash flow hedges.
The preparation of the financial statements presumes that various estimations and assumptions are made
by the Group’s management which possibly affect the carrying values of assets and liabilities and the
required disclosures for contingent assets and liabilities as well as the amounts of income and expenses
recognized. Considering the impact of covid-19 pandemic for the Company, the Group and the economy
in general, the Group’s Management reviewed these estimations and concluded that no revision of the
accounting policies is required.
New standards, amendments of existing standards and interpretations have been issued, which are
obligatory for accounting periods beginning during the present fiscal year or at a future time and have an
impact in the Group’s financial data. The Group’s appraisal regarding the effects from adopting new
standards, amendment to existing standards and interpretations are disclosed in note 2.2
Interim Condensed Financial Statements
for the period 1/1-31/03/2021
Page 10 of 46
2.2. New standards, interpretations and amendments
New standards, amendments to existing standards and interpretations have been issued, which are
effective for accounting periods starting on or after January 1st, 2021. Those which are expected to have
an impact on the Group are listed in the following paragraphs.
2.2.1. Standards, Amendments and Interpretations mandatory for Fiscal Year 2021
IAS 39, IFRS 4, IFRS 7, IFRS 9 and IFRS 16 “Interest Rate Benchmark Reform — Phase 2”
Amendments address issues that might affect financial reporting after the reform of an interest rate
benchmark, including its replacement with alternative benchmark rates, making the accounting
treatment easier. Τhose amendments are also introduce additional disclosures, facilitating users’
understanding of financial statements. Amendments are effective for annual periods beginning on or after
1 January 2021 and have no significant impact on the financial position and / or the financial performance
of the Group and the Company.
2.2.2. Standards, amendments and Interpretations effective for periods beginning on or after January 1st,
2021
IFRS 3: “Reference to the Conceptual Framework”
The amendments update an outdated reference to the Conceptual Framework in IFRS 3 and introduce
an exception to the recognition principle in order to determine what constitutes an asset or a liability in a
business combination.
The amendments are effective for annual reporting periods beginning on or after 1 January 2022.
IAS 16: “Proceeds before Intended Use”
The amendments prohibit a company from deducting from the cost of property, plant and equipment
amounts received from selling items produced while the company is preparing the asset for its intended
use. Instead, a company will recognize such sales proceeds and related cost in profit or loss.
The amendments are effective for annual reporting periods beginning on or after 1 January 2022.
IAS 37: “Onerous Contracts — Cost of Fulfilling a Contract”
The amendments specify which costs a company must include when assessing whether a contract will be
loss-making. Specifically, the amendments require that the cost of fulfilling a contract should include both
the incremental costs of fulfilling that contract along with an allocation of other costs that relate directly
to fulfilling contracts.
The amendments are effective for annual reporting periods beginning on or after 1 January 2022.
IAS 1: “Classification of Liabilities as Current or Non-current”
The amendments aim to provide guidance for the consistent application of IAS 1 requirements regarding
the classification of debt and other liabilities with an uncertain settlement date, as current or non-current
in the statement of financial position.
The amendments are effective for annual reporting periods beginning on or after 1 January 2023.
Interim Condensed Financial Statements
for the period 1/1-31/03/2021
Page 11 of 46
IAS 8: ”Accounting Policies, Changes in Accounting Estimates and Errors – Definition of Accounting
Estimates
The amendments introduce a new definition of accounting estimates as “monetary amounts in financial
statements that are subject to measurement uncertainty”. There is also a clarification of the term “change
in accounting estimates” to facilitate distinction from “change in accounting policies” and “the correction
of errors”.
The amendments are effective for annual periods beginning on or after 1 January 2023.
All amendments mentioned in this section have not yet been endorsed by the European Union.
3. Operating Segments
The Group is mainly operating in Greece, given that most Group Companies included in the consolidation
are based in Greece, whilst those operating abroad are few with limited operations for the time being.
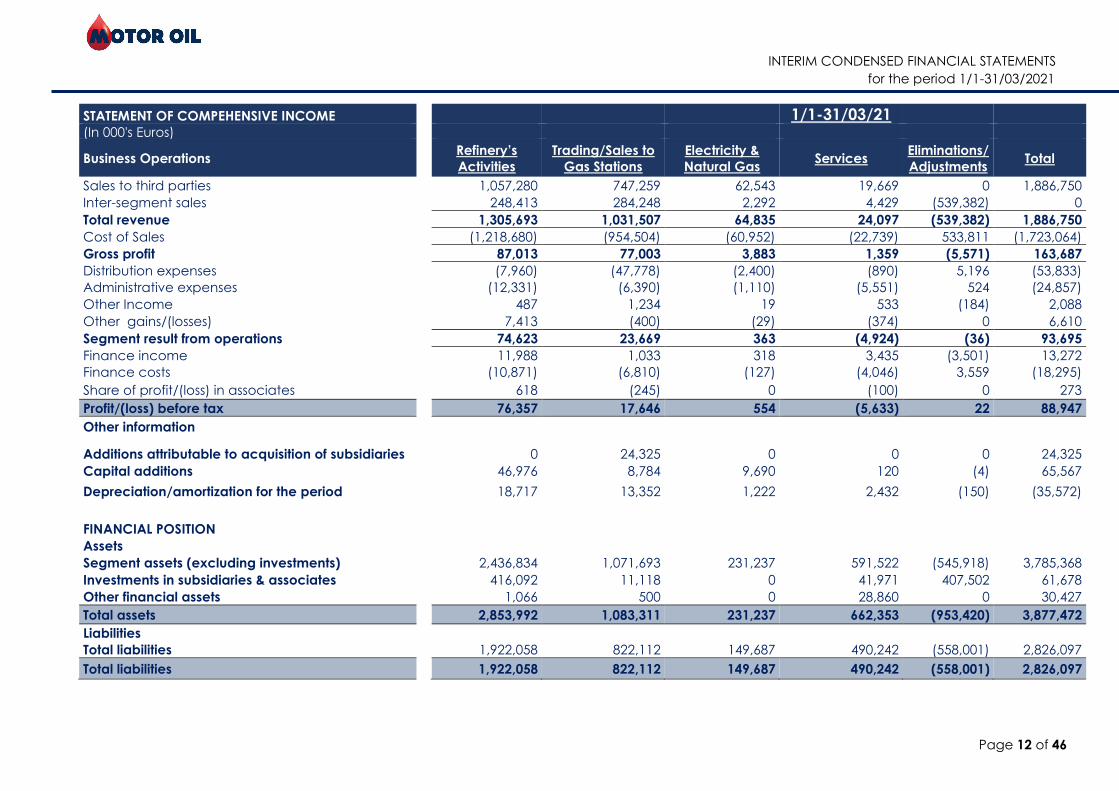
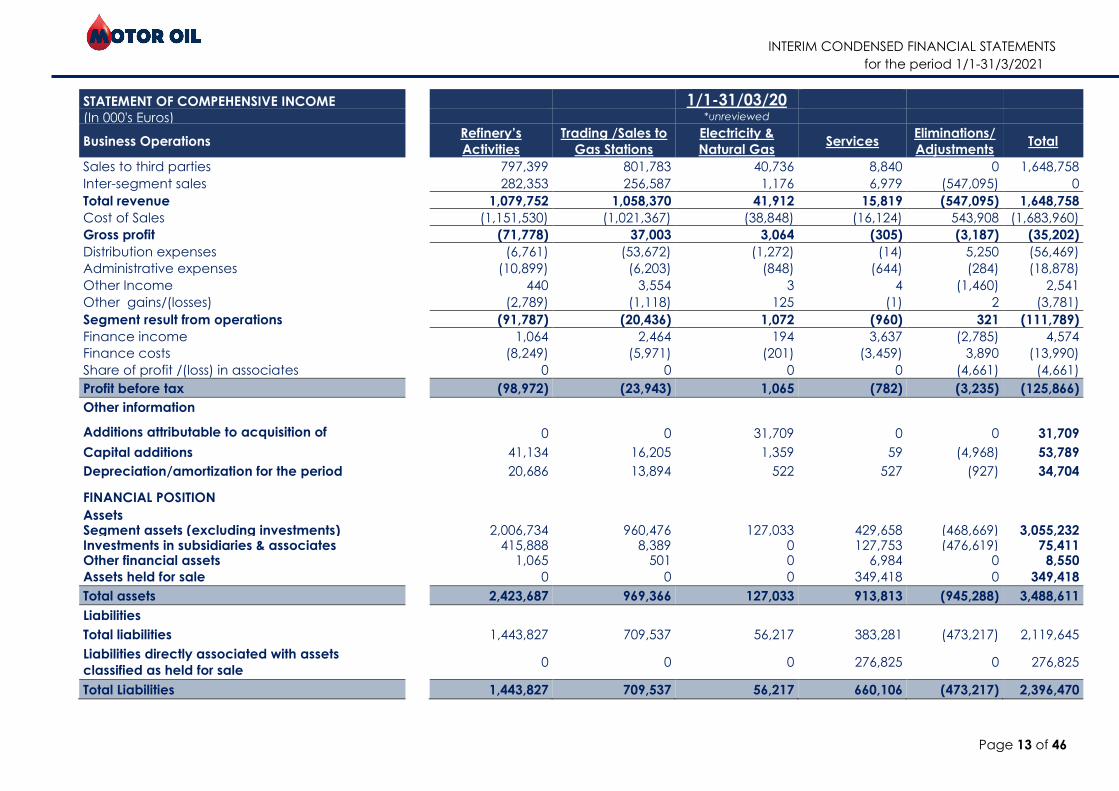
All operational segments fall under one of four distinct activity categories: Refinery’s Activities, Sales to/from
Gas Stations, Electricity & Natural Gas and Services.
Segment information is presented in the following table:
INTERIM CONDENSED FINANCIAL STATEMENTS
for the period 1/1-31/03/2021
Page 12 of 46
STATEMENT OF COMPEHENSIVE INCOME 1/1-31/03/21
(In 000's Euros)
Business Operations Refinery’s
Activities
Trading/Sales to
Gas Stations
Electricity &
Natural Gas Services
Eliminations/
Adjustments Total
Sales to third parties 1,057,280 747,259 62,543 19,669 0 1,886,750
Inter-segment sales 248,413 284,248 2,292 4,429 (539,382) 0
Total revenue 1,305,693 1,031,507 64,835 24,097 (539,382) 1,886,750
Cost of Sales (1,218,680) (954,504) (60,952) (22,739) 533,811 (1,723,064)
Gross profit 87,013 77,003 3,883 1,359 (5,571) 163,687
Distribution expenses (7,960) (47,778) (2,400) (890) 5,196 (53,833)
Administrative expenses (12,331) (6,390) (1,110) (5,551) 524 (24,857)
Other Income 487 1,234 19 533 (184) 2,088
Other gains/(losses) 7,413 (400) (29) (374) 0 6,610
Segment result from operations 74,623 23,669 363 (4,924) (36) 93,695
Finance income 11,988 1,033 318 3,435 (3,501) 13,272
Finance costs (10,871) (6,810) (127) (4,046) 3,559 (18,295)
Share of profit/(loss) in associates 618 (245) 0 (100) 0 273
Profit/(loss) before tax 76,357 17,646 554 (5,633) 22 88,947
Other information
Additions attributable to acquisition of subsidiaries 0 24,325 0 0 0 24,325
Capital additions 46,976 8,784 9,690 120 (4) 65,567
Depreciation/amortization for the period 18,717 13,352 1,222 2,432 (150) (35,572)
FINANCIAL POSITION
Assets
Segment assets (excluding investments) 2,436,834 1,071,693 231,237 591,522 (545,918) 3,785,368
Investments in subsidiaries & associates 416,092 11,118 0 41,971 407,502 61,678
Other financial assets 1,066 500 0 28,860 0 30,427
Total assets 2,853,992 1,083,311 231,237 662,353 (953,420) 3,877,472
Liabilities
Total liabilities 1,922,058 822,112 149,687 490,242 (558,001) 2,826,097
Total liabilities 1,922,058 822,112 149,687 490,242 (558,001) 2,826,097
INTERIM CONDENSED FINANCIAL STATEMENTS
for the period 1/1-31/3/2021
Page 13 of 46
STATEMENT OF COMPEHENSIVE INCOME 1/1-31/03/20
(In 000's Euros) *unreviewed
Business Operations
Refinery’s
Activities
Trading /Sales to
Gas Stations
Electricity &
Natural Gas Services
Eliminations/
Adjustments Total
Sales to third parties 797,399 801,783 40,736 8,840 0 1,648,758
Inter-segment sales 282,353 256,587 1,176 6,979 (547,095) 0
Total revenue 1,079,752 1,058,370 41,912 15,819 (547,095) 1,648,758
Cost of Sales (1,151,530) (1,021,367) (38,848) (16,124) 543,908 (1,683,960)
Gross profit (71,778) 37,003 3,064 (305) (3,187) (35,202)
Distribution expenses (6,761) (53,672) (1,272) (14) 5,250 (56,469)
Administrative expenses (10,899) (6,203) (848) (644) (284) (18,878)
Other Income 440 3,554 3 4 (1,460) 2,541
Other gains/(losses) (2,789) (1,118) 125 (1) 2 (3,781)
Segment result from operations (91,787) (20,436) 1,072 (960) 321 (111,789)
Finance income 1,064 2,464 194 3,637 (2,785) 4,574
Finance costs (8,249) (5,971) (201) (3,459) 3,890 (13,990)
Share of profit /(loss) in associates 0 0 0 0 (4,661) (4,661)
Profit before tax (98,972) (23,943) 1,065 (782) (3,235) (125,866)
Other information
Additions attributable to acquisition of
subsidiaries 0 0 31,709 0 0 31,709
Capital additions 41,134 16,205 1,359 59 (4,968) 53,789
Depreciation/amortization for the period 20,686 13,894 522 527 (927) 34,704
FINANCIAL POSITION
Assets Segment assets (excluding investments) 2,006,734 960,476 127,033 429,658 (468,669) 3,055,232 Investments in subsidiaries & associates 415,888 8,389 0 127,753 (476,619) 75,411 Other financial assets 1,065 501 0 6,984 0 8,550
Assets held for sale 0 0 0 349,418 0 349,418
Total assets 2,423,687 969,366 127,033 913,813 (945,288) 3,488,611
Liabilities
Total liabilities 1,443,827 709,537 56,217 383,281 (473,217) 2,119,645
Liabilities directly associated with assets
classified as held for sale 0 0 0 276,825 0 276,825
Total Liabilities 1,443,827 709,537 56,217 660,106 (473,217) 2,396,470
INTERIM CONDENSED FINANCIAL STATEMENTS
for the period 1/1-31/3/2021
Page 14 of 46
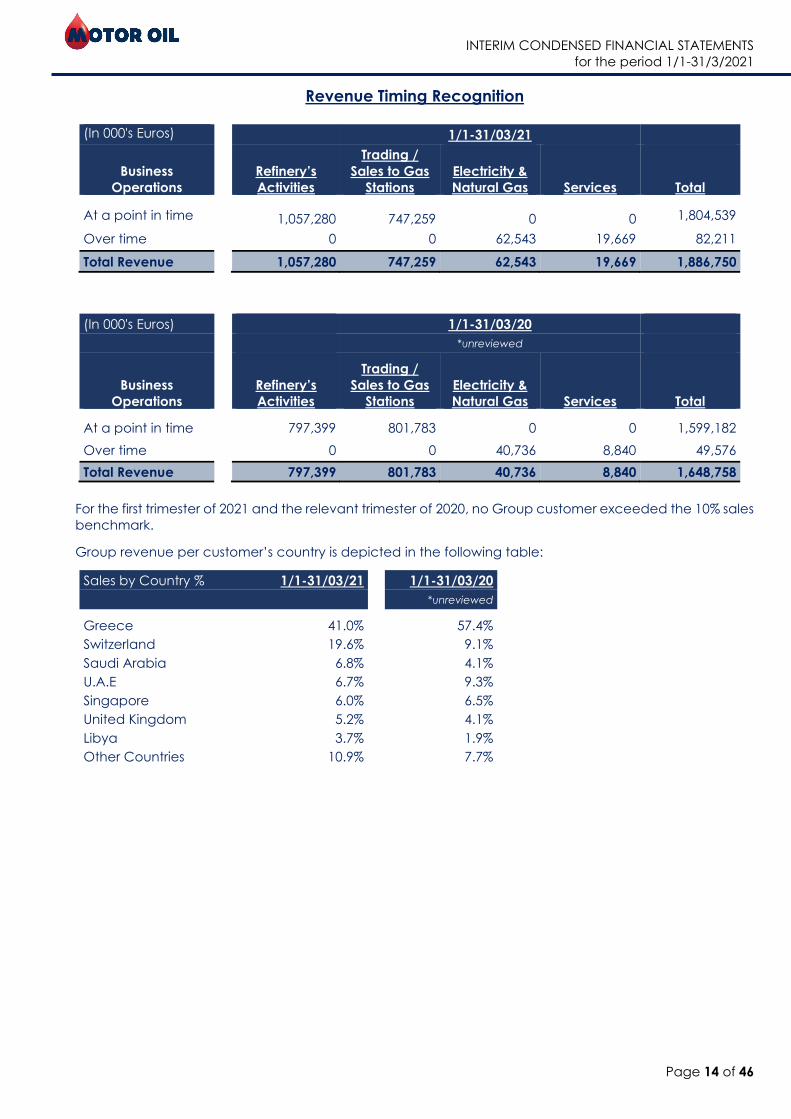
Revenue Timing Recognition
(In 000's Euros) 1/1-31/03/21
Business
Operations
Refinery’s
Activities
Trading /
Sales to Gas
Stations
Electricity &
Natural Gas Services Total
At a point in time 1,057,280 747,259 0 0 1,804,539
Over time 0 0 62,543 19,669 82,211
Total Revenue 1,057,280 747,259 62,543 19,669 1,886,750
(In 000's Euros) 1/1-31/03/20 *unreviewed
Business
Operations
Refinery’s
Activities
Trading /
Sales to Gas
Stations
Electricity &
Natural Gas Services Total
At a point in time 797,399 801,783 0 0 1,599,182
Over time 0 0 40,736 8,840 49,576
Total Revenue 797,399 801,783 40,736 8,840 1,648,758
For the first trimester of 2021 and the relevant trimester of 2020, no Group customer exceeded the 10% sales
benchmark.
Group revenue per customer’s country is depicted in the following table:
Sales by Country % 1/1-31/03/21 1/1-31/03/20
*unreviewed
Greece 41.0% 57.4%
Switzerland 19.6% 9.1%
Saudi Arabia 6.8% 4.1%
U.A.E 6.7% 9.3%
Singapore 6.0% 6.5%
United Kingdom 5.2% 4.1%
Libya 3.7% 1.9%
Other Countries 10.9% 7.7%
Interim Condensed Financial Statements
for the period 1/1-31/03/2021
Page 15 of 46
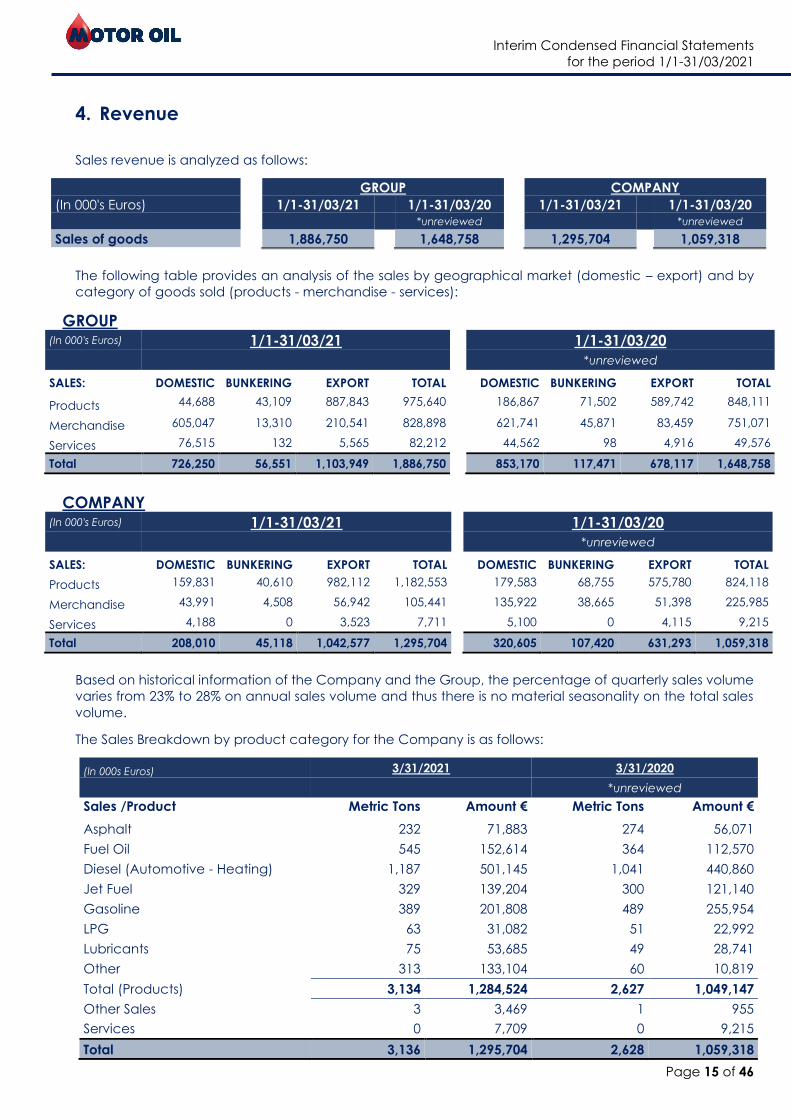
4. Revenue
Sales revenue is analyzed as follows:
GROUP COMPANY
(In 000's Euros) 1/1-31/03/21 1/1-31/03/20 1/1-31/03/21 1/1-31/03/20
*unreviewed *unreviewed
Sales of goods 1,886,750 1,648,758 1,295,704 1,059,318
The following table provides an analysis of the sales by geographical market (domestic – export) and by
category of goods sold (products - merchandise - services):
GROUP (In 000's Euros) 1/1-31/03/21 1/1-31/03/20
*unreviewed
SALES: DOMESTIC BUNKERING EXPORT TOTAL DOMESTIC BUNKERING EXPORT TOTAL
Products 44,688 43,109 887,843 975,640 186,867 71,502 589,742 848,111
Merchandise 605,047 13,310 210,541 828,898 621,741 45,871 83,459 751,071
Services 76,515 132 5,565 82,212 44,562 98 4,916 49,576
Total 726,250 56,551 1,103,949 1,886,750 853,170 117,471 678,117 1,648,758
COMPANY (In 000's Euros) 1/1-31/03/21 1/1-31/03/20
*unreviewed
SALES: DOMESTIC BUNKERING EXPORT TOTAL DOMESTIC BUNKERING EXPORT TOTAL
Products 159,831 40,610 982,112 1,182,553 179,583 68,755 575,780 824,118
Merchandise 43,991 4,508 56,942 105,441 135,922 38,665 51,398 225,985
Services 4,188 0 3,523 7,711 5,100 0 4,115 9,215
Total 208,010 45,118 1,042,577 1,295,704 320,605 107,420 631,293 1,059,318
Based on historical information of the Company and the Group, the percentage of quarterly sales volume
varies from 23% to 28% on annual sales volume and thus there is no material seasonality on the total sales
volume.
The Sales Breakdown by product category for the Company is as follows:
(In 000s Euros) 3/31/2021 3/31/2020
*unreviewed
Sales /Product Metric Tons Amount € Metric Tons Amount € Asphalt 232 71,883 274 56,071
Fuel Oil 545 152,614 364 112,570
Diesel (Automotive - Heating) 1,187 501,145 1,041 440,860
Jet Fuel 329 139,204 300 121,140
Gasoline 389 201,808 489 255,954
LPG 63 31,082 51 22,992
Lubricants 75 53,685 49 28,741
Other 313 133,104 60 10,819
Total (Products) 3,134 1,284,524 2,627 1,049,147
Other Sales 3 3,469 1 955
Services 0 7,709 0 9,215
Total 3,136 1,295,704 2,628 1,059,318
Interim Condensed Financial Statements
for the period 1/1-31/03/2021
Page 16 of 46
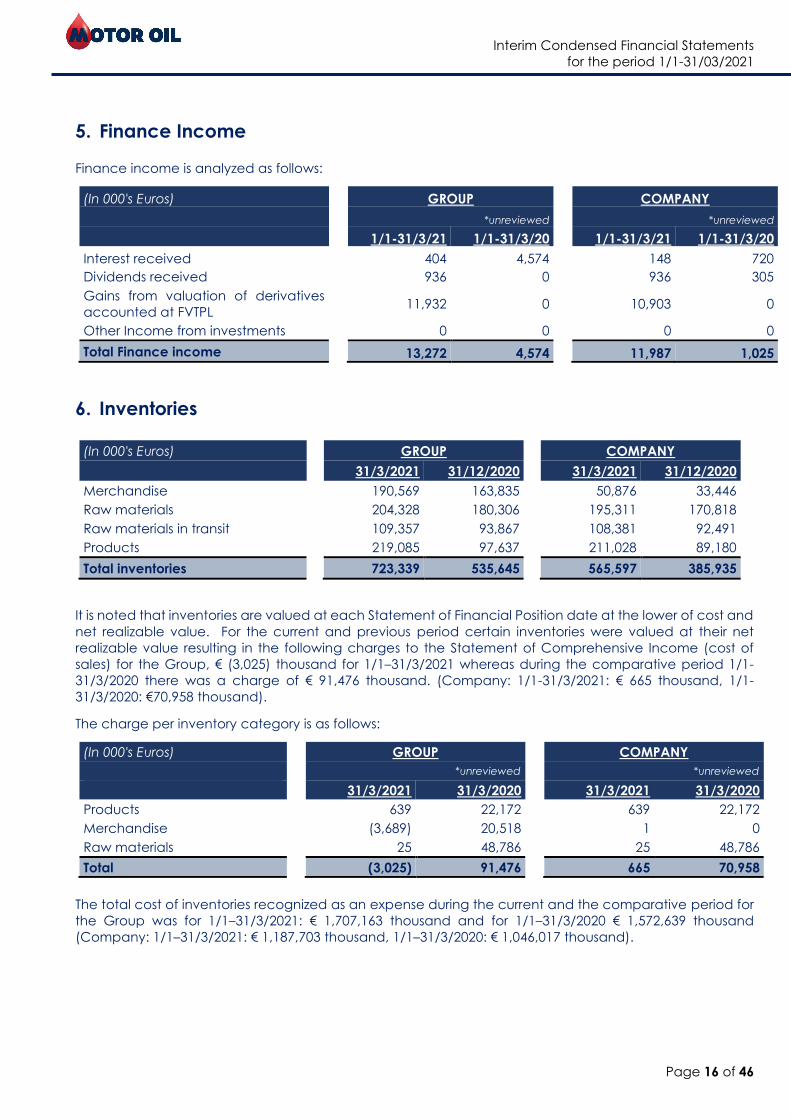
5. Finance Income
Finance income is analyzed as follows:
(In 000's Euros) GROUP COMPANY
*unreviewed *unreviewed
1/1-31/3/21 1/1-31/3/20 1/1-31/3/21 1/1-31/3/20
Interest received 404 4,574 148 720
Dividends received 936 0 936 305
Gains from valuation of derivatives
accounted at FVTPL 11,932 0 10,903 0
Other Income from investments 0 0 0 0
Total Finance income 13,272 4,574 11,987 1,025
6. Inventories
(In 000's Euros) GROUP COMPANY
31/3/2021 31/12/2020 31/3/2021 31/12/2020
Merchandise 190,569 163,835 50,876 33,446
Raw materials 204,328 180,306 195,311 170,818
Raw materials in transit 109,357 93,867 108,381 92,491
Products 219,085 97,637 211,028 89,180
Total inventories 723,339 535,645 565,597 385,935
It is noted that inventories are valued at each Statement of Financial Position date at the lower of cost and
net realizable value. For the current and previous period certain inventories were valued at their net
realizable value resulting in the following charges to the Statement of Comprehensive Income (cost of
sales) for the Group, € (3,025) thousand for 1/1–31/3/2021 whereas during the comparative period 1/1-
31/3/2020 there was a charge of € 91,476 thousand. (Company: 1/1-31/3/2021: € 665 thousand, 1/1-
31/3/2020: €70,958 thousand).
The charge per inventory category is as follows:
(In 000's Euros) GROUP COMPANY
*unreviewed *unreviewed
31/3/2021 31/3/2020 31/3/2021 31/3/2020
Products 639 22,172 639 22,172
Merchandise (3,689) 20,518 1 0
Raw materials 25 48,786 25 48,786
Total (3,025) 91,476 665 70,958
The total cost of inventories recognized as an expense during the current and the comparative period for
the Group was for 1/1–31/3/2021: € 1,707,163 thousand and for 1/1–31/3/2020 € 1,572,639 thousand
(Company: 1/1–31/3/2021: € 1,187,703 thousand, 1/1–31/3/2020: € 1,046,017 thousand).
Interim Condensed Financial Statements
for the period 1/1-31/03/2021
Page 17 of 46
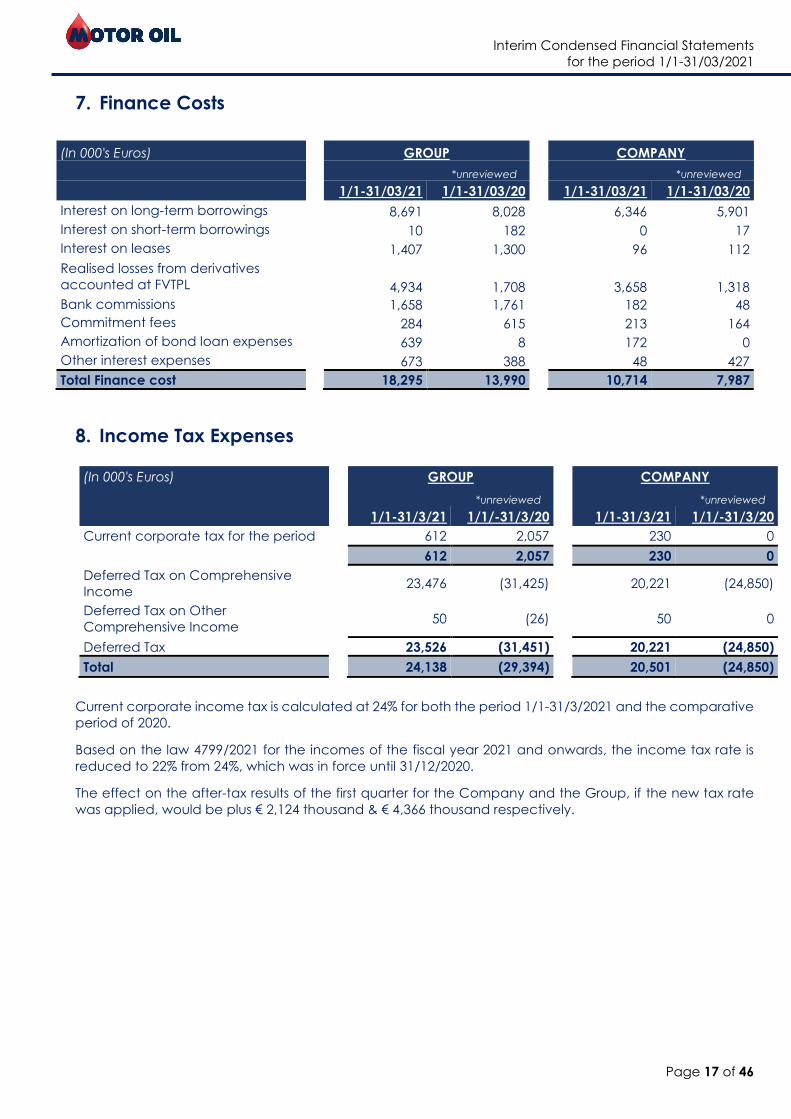
7. Finance Costs
(In 000's Euros) GROUP COMPANY
*unreviewed *unreviewed
1/1-31/03/21 1/1-31/03/20 1/1-31/03/21 1/1-31/03/20
Interest on long-term borrowings 8,691 8,028 6,346 5,901
Interest on short-term borrowings 10 182 0 17
Interest on leases 1,407 1,300 96 112
Realised losses from derivatives
accounted at FVTPL
4,934 1,708 3,658 1,318
Bank commissions 1,658 1,761 182 48
Commitment fees 284 615 213 164
Amortization of bond loan expenses 639 8 172 0
Other interest expenses 673 388 48 427
Total Finance cost 18,295 13,990 10,714 7,987
8. Income Tax Expenses
(In 000's Euros) GROUP COMPANY
*unreviewed *unreviewed
1/1-31/3/21 1/1/-31/3/20 1/1-31/3/21 1/1/-31/3/20
Current corporate tax for the period 612 2,057 230 0
612 2,057 230 0
Deferred Tax on Comprehensive
Income 23,476 (31,425) 20,221 (24,850)
Deferred Tax on Other
Comprehensive Income 50 (26) 50 0
Deferred Tax 23,526 (31,451) 20,221 (24,850)
Total 24,138 (29,394) 20,501 (24,850)
Current corporate income tax is calculated at 24% for both the period 1/1-31/3/2021 and the comparative
period of 2020.
Based on the law 4799/2021 for the incomes of the fiscal year 2021 and onwards, the income tax rate is
reduced to 22% from 24%, which was in force until 31/12/2020.
The effect on the after-tax results of the first quarter for the Company and the Group, if the new tax rate
was applied, would be plus € 2,124 thousand & € 4,366 thousand respectively.
Interim Condensed Financial Statements
for the period 1/1-31/03/2021
Page 18 of 46
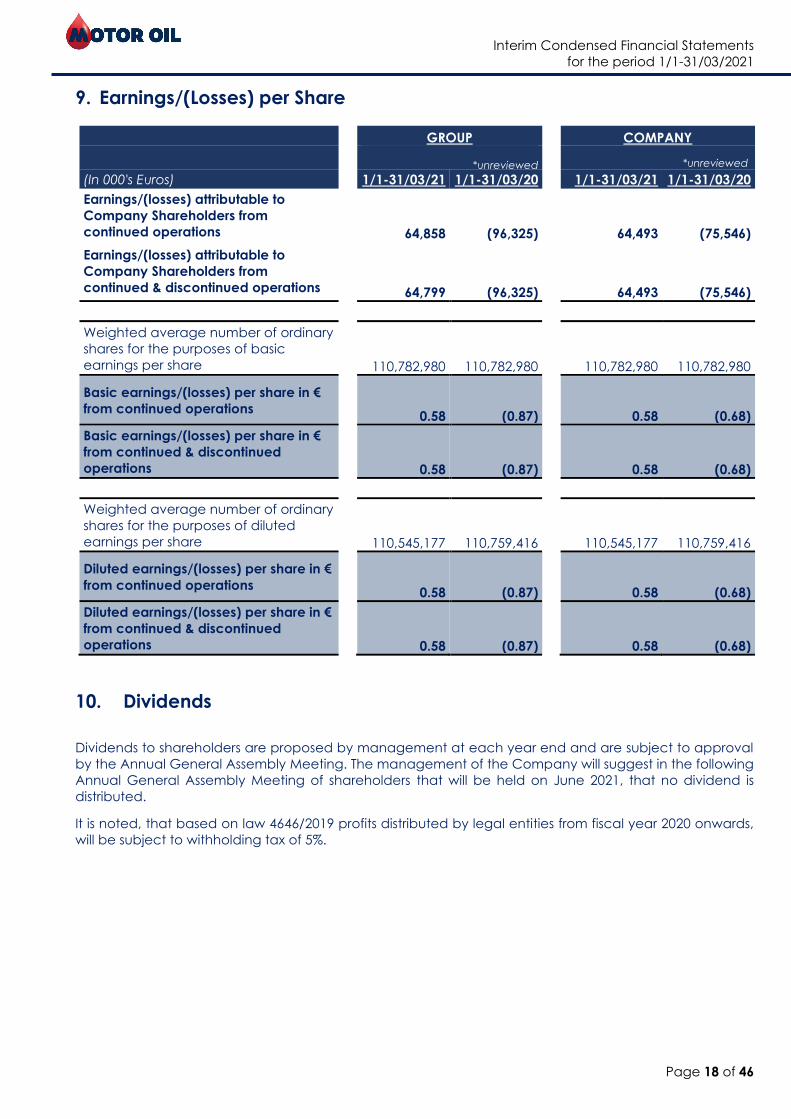
9. Earnings/(Losses) per Share
GROUP COMPANY
*unreviewed *unreviewed
(In 000's Euros) 1/1-31/03/21 1/1-31/03/20 1/1-31/03/21 1/1-31/03/20
Earnings/(losses) attributable to
Company Shareholders from
continued operations 64,858 (96,325) 64,493 (75,546)
Earnings/(losses) attributable to
Company Shareholders from
continued & discontinued operations 64,799 (96,325) 64,493 (75,546)
Weighted average number of ordinary
shares for the purposes of basic
earnings per share 110,782,980 110,782,980 110,782,980 110,782,980
Basic earnings/(losses) per share in €
from continued operations 0.58 (0.87) 0.58 (0.68)
Basic earnings/(losses) per share in €
from continued & discontinued
operations 0.58 (0.87) 0.58 (0.68)
Weighted average number of ordinary
shares for the purposes of diluted
earnings per share 110,545,177 110,759,416 110,545,177 110,759,416
Diluted earnings/(losses) per share in €
from continued operations 0.58 (0.87) 0.58 (0.68)
Diluted earnings/(losses) per share in €
from continued & discontinued
operations 0.58 (0.87) 0.58 (0.68)
10. Dividends
Dividends to shareholders are proposed by management at each year end and are subject to approval
by the Annual General Assembly Meeting. The management of the Company will suggest in the following
Annual General Assembly Meeting of shareholders that will be held on June 2021, that no dividend is
distributed.
It is noted, that based on law 4646/2019 profits distributed by legal entities from fiscal year 2020 onwards,
will be subject to withholding tax of 5%.
Interim Condensed Financial Statements
for the period 1/1-31/03/2021
Page 19 of 46
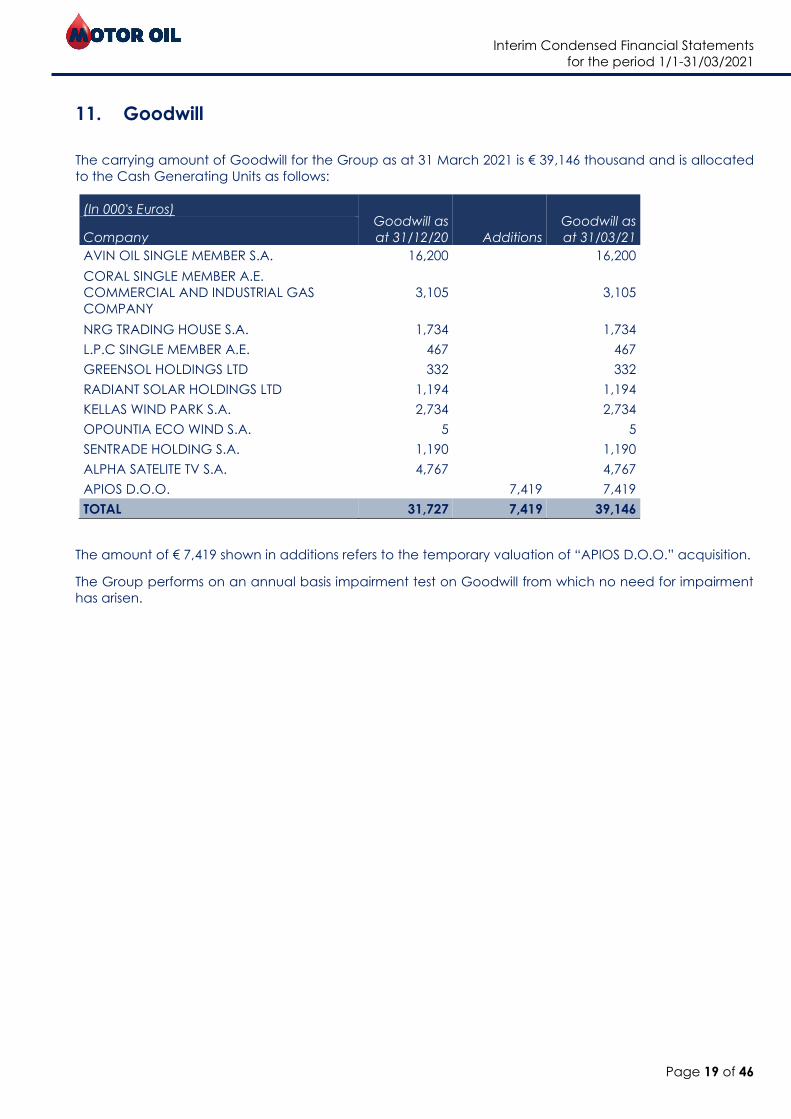
11. Goodwill
The carrying amount of Goodwill for the Group as at 31 March 2021 is € 39,146 thousand and is allocated
to the Cash Generating Units as follows:
(In 000's Euros) Goodwill as
at 31/12/20 Additions
Goodwill as
at 31/03/21 Company
AVIN OIL SINGLE MEMBER S.A. 16,200 16,200
CORAL SINGLE MEMBER A.E.
COMMERCIAL AND INDUSTRIAL GAS
COMPANY
3,105 3,105
NRG TRADING HOUSE S.A. 1,734 1,734
L.P.C SINGLE MEMBER Α.Ε. 467 467
GREENSOL HOLDINGS LTD 332 332
RADIANT SOLAR HOLDINGS LTD 1,194 1,194
KELLAS WIND PARK S.A. 2,734 2,734
OPOUNTIA ECO WIND S.A. 5 5
SENTRADE HOLDING S.A. 1,190 1,190
ALPHA SATELITE TV S.A. 4,767 4,767
APIOS D.O.O. 7,419 7,419
TOTAL 31,727 7,419 39,146
The amount of € 7,419 shown in additions refers to the temporary valuation of “APIOS D.O.O.” acquisition.
The Group performs on an annual basis impairment test on Goodwill from which no need for impairment
has arisen.
Interim Condensed Financial Statements
for the period 1/1-31/03/2021
Page 20 of 46
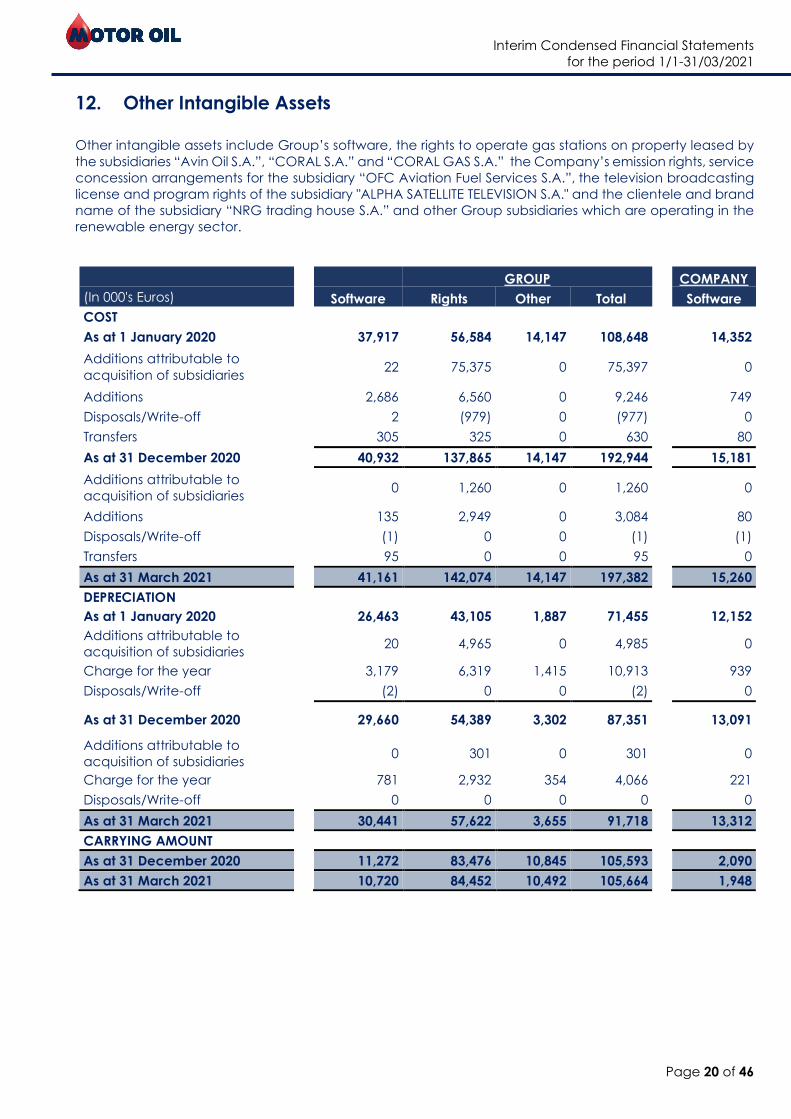
12. Other Intangible Assets
Other intangible assets include Group’s software, the rights to operate gas stations on property leased by
the subsidiaries “Avin Oil S.A.”, “CORAL S.A.” and “CORAL GAS S.A.” the Company’s emission rights, service
concession arrangements for the subsidiary “OFC Aviation Fuel Services S.A.”, the television broadcasting
license and program rights of the subsidiary "ALPHA SATELLITE TELEVISION S.A." and the clientele and brand
name of the subsidiary “NRG trading house S.A.” and other Group subsidiaries which are operating in the
renewable energy sector.
GROUP COMPANY
(In 000's Euros) Software Rights Other Total Software
COST
As at 1 January 2020 37,917 56,584 14,147 108,648 14,352
Additions attributable to
acquisition of subsidiaries 22 75,375 0 75,397 0
Additions 2,686 6,560 0 9,246 749
Disposals/Write-off 2 (979) 0 (977) 0
Transfers 305 325 0 630 80
As at 31 December 2020 40,932 137,865 14,147 192,944 15,181
Additions attributable to
acquisition of subsidiaries 0 1,260 0 1,260 0
Additions 135 2,949 0 3,084 80
Disposals/Write-off (1) 0 0 (1) (1)
Transfers 95 0 0 95 0
As at 31 March 2021 41,161 142,074 14,147 197,382 15,260
DEPRECIATION
As at 1 January 2020 26,463 43,105 1,887 71,455 12,152
Additions attributable to
acquisition of subsidiaries 20 4,965 0 4,985 0
Charge for the year 3,179 6,319 1,415 10,913 939
Disposals/Write-off (2) 0 0 (2) 0
As at 31 December 2020 29,660 54,389 3,302 87,351 13,091
Additions attributable to
acquisition of subsidiaries 0 301 0 301 0
Charge for the year 781 2,932 354 4,066 221
Disposals/Write-off 0 0 0 0 0
As at 31 March 2021 30,441 57,622 3,655 91,718 13,312
CARRYING AMOUNT
As at 31 December 2020 11,272 83,476 10,845 105,593 2,090
As at 31 March 2021 10,720 84,452 10,492 105,664 1,948
Interim Condensed Financial Statements
for the period 1/1-31/03/2021
Page 21 of 46
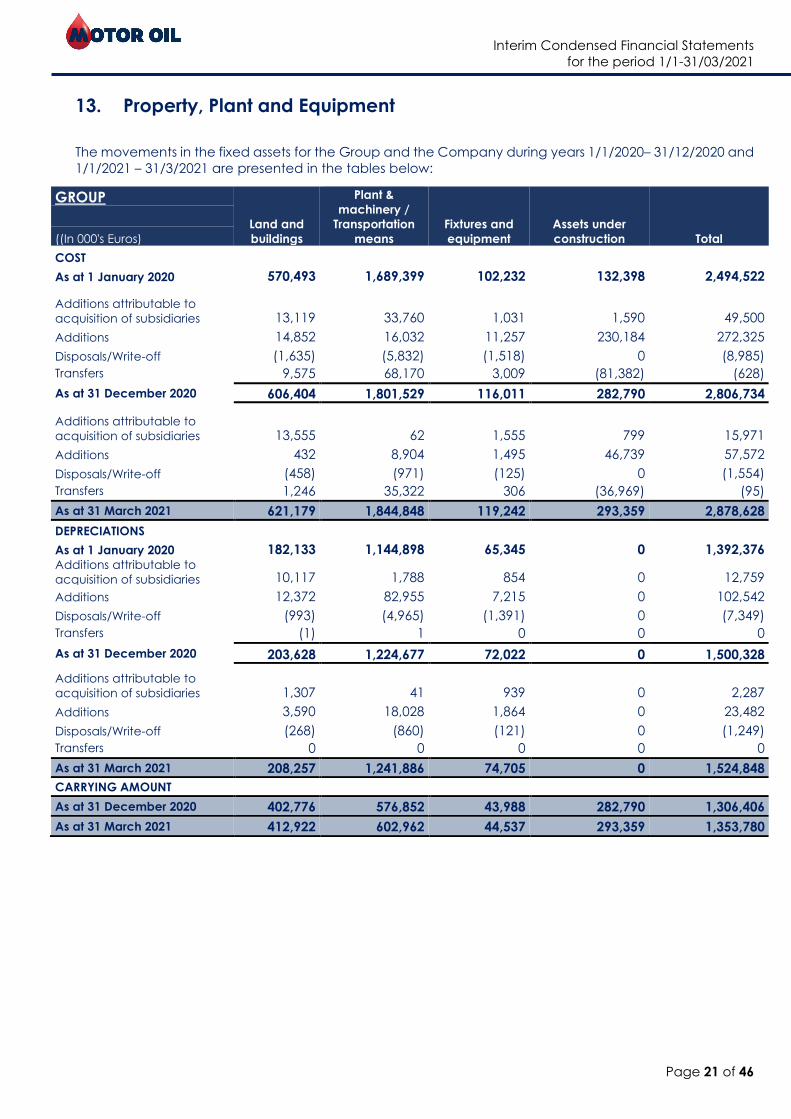
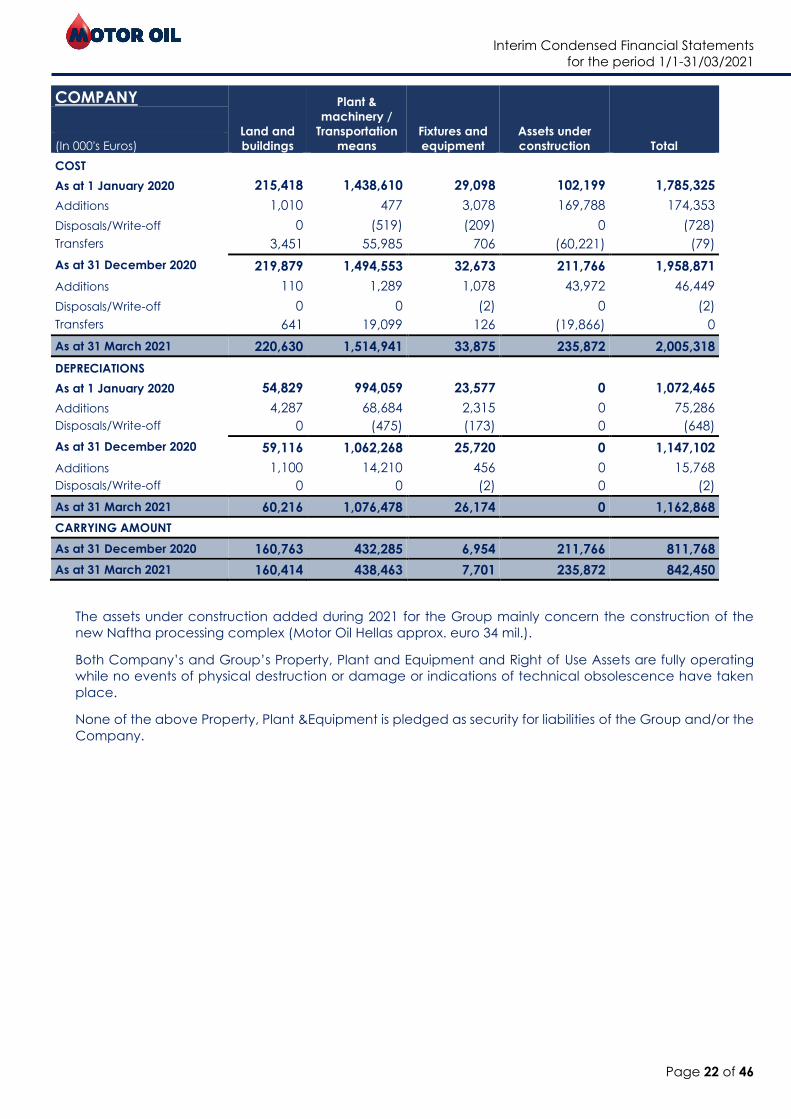
13. Property, Plant and Equipment
The movements in the fixed assets for the Group and the Company during years 1/1/2020– 31/12/2020 and
1/1/2021 – 31/3/2021 are presented in the tables below:
GROUP
Land and
buildings
Plant &
machinery /
Transportation
means
Fixtures and
equipment
Assets under
construction Total
((In 000's Euros)
COST
As at 1 January 2020 570,493 1,689,399 102,232 132,398 2,494,522
Additions attributable to
acquisition of subsidiaries 13,119 33,760 1,031 1,590 49,500
Additions 14,852 16,032 11,257 230,184 272,325
Disposals/Write-off (1,635) (5,832) (1,518) 0 (8,985)
Transfers 9,575 68,170 3,009 (81,382) (628)
As at 31 December 2020 606,404 1,801,529 116,011 282,790 2,806,734
Additions attributable to
acquisition of subsidiaries 13,555 62 1,555 799 15,971
Additions 432 8,904 1,495 46,739 57,572
Disposals/Write-off (458) (971) (125) 0 (1,554)
Transfers 1,246 35,322 306 (36,969) (95)
As at 31 March 2021 621,179 1,844,848 119,242 293,359 2,878,628
DEPRECIATIONS
As at 1 January 2020 182,133 1,144,898 65,345 0 1,392,376 Additions attributable to
acquisition of subsidiaries 10,117 1,788 854 0 12,759
Additions 12,372 82,955 7,215 0 102,542
Disposals/Write-off (993) (4,965) (1,391) 0 (7,349)
Transfers (1) 1 0 0 0
As at 31 December 2020 203,628 1,224,677 72,022 0 1,500,328
Additions attributable to
acquisition of subsidiaries 1,307 41 939 0 2,287
Additions 3,590 18,028 1,864 0 23,482
Disposals/Write-off (268) (860) (121) 0 (1,249)
Transfers 0 0 0 0 0
As at 31 March 2021 208,257 1,241,886 74,705 0 1,524,848
CARRYING AMOUNT
As at 31 December 2020 402,776 576,852 43,988 282,790 1,306,406
As at 31 March 2021 412,922 602,962 44,537 293,359 1,353,780
Interim Condensed Financial Statements
for the period 1/1-31/03/2021
Page 22 of 46
COMPANY
Land and
buildings
Plant &
machinery /
Transportation
means
Fixtures and
equipment
Assets under
construction Total
(In 000's Euros)
COST
As at 1 January 2020 215,418 1,438,610 29,098 102,199 1,785,325
Additions 1,010 477 3,078 169,788 174,353
Disposals/Write-off 0 (519) (209) 0 (728)
Transfers 3,451 55,985 706 (60,221) (79)
As at 31 December 2020 219,879 1,494,553 32,673 211,766 1,958,871
Additions 110 1,289 1,078 43,972 46,449
Disposals/Write-off 0 0 (2) 0 (2)
Transfers 641 19,099 126 (19,866) 0
As at 31 March 2021 220,630 1,514,941 33,875 235,872 2,005,318
DEPRECIATIONS
As at 1 January 2020 54,829 994,059 23,577 0 1,072,465
Additions 4,287 68,684 2,315 0 75,286
Disposals/Write-off 0 (475) (173) 0 (648)
As at 31 December 2020 59,116 1,062,268 25,720 0 1,147,102
Additions 1,100 14,210 456 0 15,768
Disposals/Write-off 0 0 (2) 0 (2)
As at 31 March 2021 60,216 1,076,478 26,174 0 1,162,868
CARRYING AMOUNT
As at 31 December 2020 160,763 432,285 6,954 211,766 811,768
As at 31 March 2021 160,414 438,463 7,701 235,872 842,450
The assets under construction added during 2021 for the Group mainly concern the construction of the
new Naftha processing complex (Motor Oil Hellas approx. euro 34 mil.).
Both Company’s and Group’s Property, Plant and Equipment and Right of Use Assets are fully operating
while no events of physical destruction or damage or indications of technical obsolescence have taken
place.
None of the above Property, Plant &Equipment is pledged as security for liabilities of the Group and/or the
Company.
Interim Condensed Financial Statements
for the period 1/1-31/03/2021
Page 23 of 46
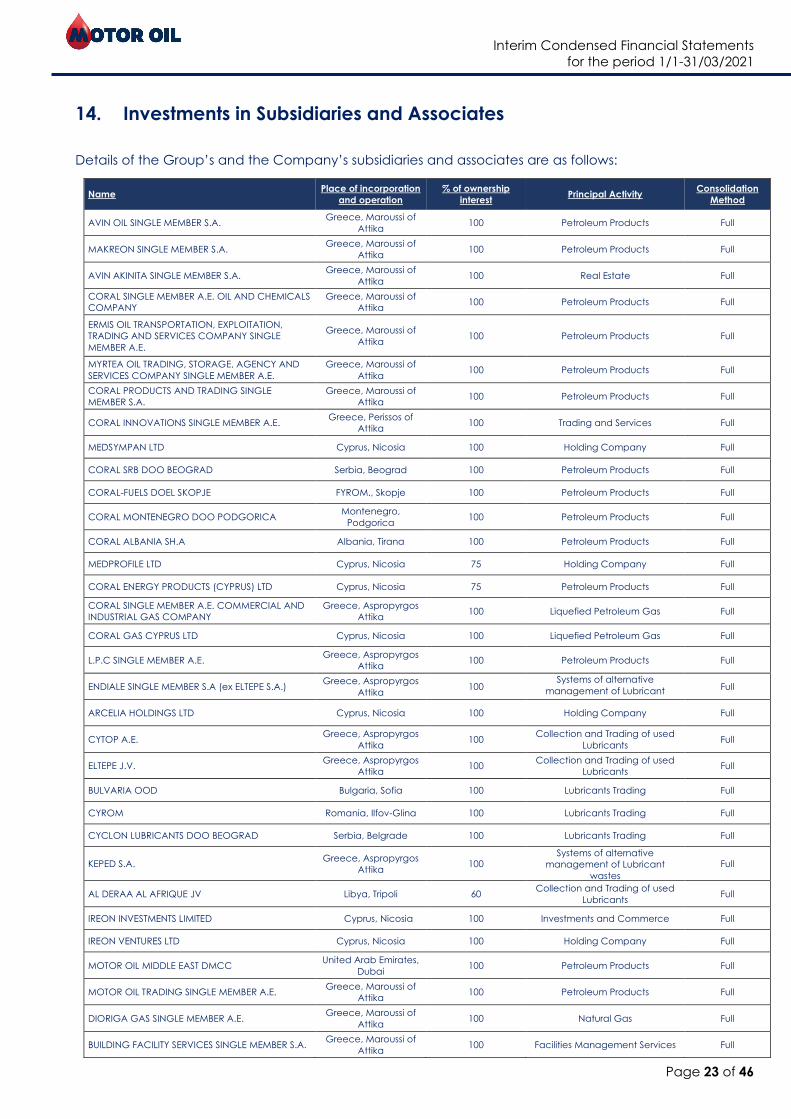
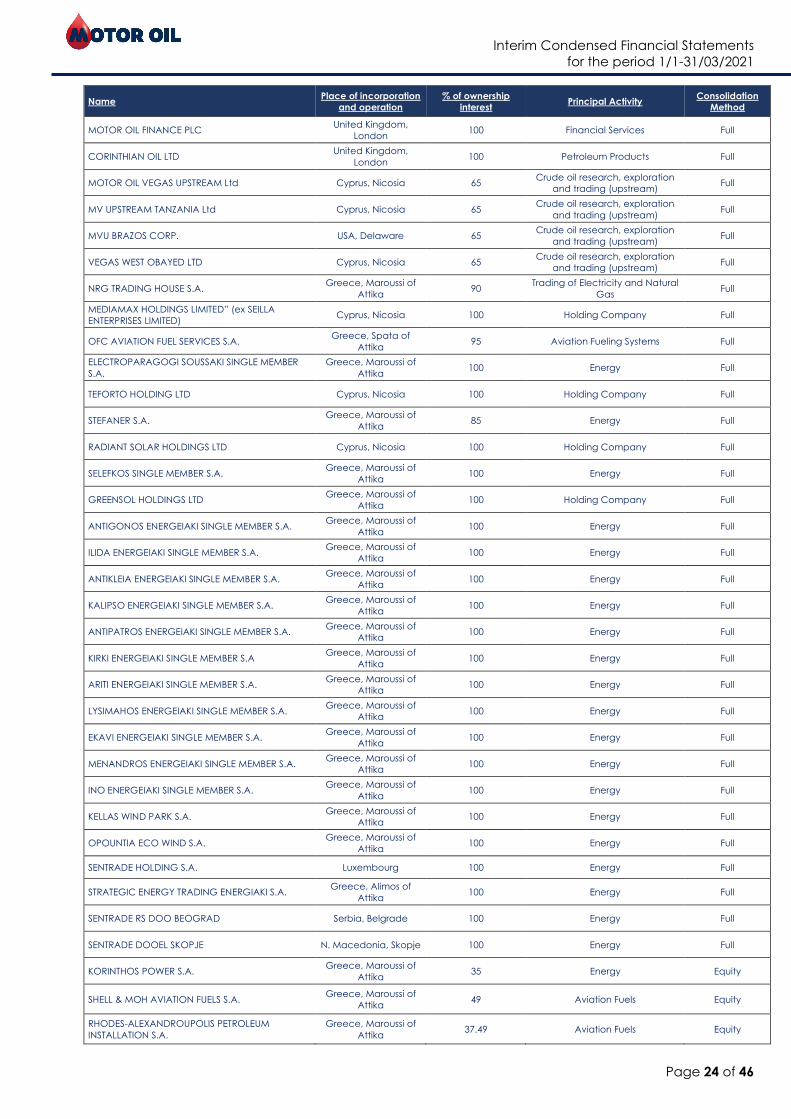
14. Investments in Subsidiaries and Associates
Details of the Group’s and the Company’s subsidiaries and associates are as follows:
Name Place of incorporation
and operation
% of ownership
interest Principal Activity
Consolidation
Method
AVIN OIL SINGLE MEMBER S.A. Greece, Maroussi of
Attika 100 Petroleum Products Full
MAKREON SINGLE MEMBER S.A. Greece, Maroussi of
Attika 100 Petroleum Products Full
ΑVIN AKINITA SINGLE MEMBER S.A. Greece, Maroussi of
Attika 100 Real Estate Full
CORAL SINGLE MEMBER Α.Ε. OIL AND CHEMICALS
COMPANY
Greece, Maroussi of
Attika 100 Petroleum Products Full
ERMIS OIL TRANSPORTATION, EXPLOITATION,
TRADING AND SERVICES COMPANY SINGLE
MEMBER A.E.
Greece, Maroussi of
Attika 100 Petroleum Products Full
MYRTEA OIL TRADING, STORAGE, AGENCY AND
SERVICES COMPANY SINGLE MEMBER A.E.
Greece, Maroussi of
Attika 100 Petroleum Products Full
CORAL PRODUCTS AND TRADING SINGLE
MEMBER S.A.
Greece, Maroussi of
Attika 100 Petroleum Products Full
CORAL INNOVATIONS SINGLE MEMBER Α.Ε. Greece, Perissos of
Attika 100 Trading and Services Full
MEDSYMPAN LTD Cyprus, Nicosia 100 Holding Company Full
CORAL SRB DOO BEOGRAD Serbia, Beograd 100 Petroleum Products Full
CORAL-FUELS DOEL SKOPJE FYROM., Skopje 100 Petroleum Products Full
CORAL MONTENEGRO DOO PODGORICA Montenegro,
Podgorica 100 Petroleum Products Full
CORAL ALBANIA SH.A Albania, Tirana 100 Petroleum Products Full
MEDPROFILE LTD Cyprus, Nicosia 75 Holding Company Full
CORAL ENERGY PRODUCTS (CYPRUS) LTD Cyprus, Nicosia 75 Petroleum Products Full
CORAL SINGLE MEMBER A.E. COMMERCIAL AND
INDUSTRIAL GAS COMPANY
Greece, Aspropyrgos
Attika 100 Liquefied Petroleum Gas Full
CORAL GAS CYPRUS LTD Cyprus, Nicosia 100 Liquefied Petroleum Gas Full
L.P.C SINGLE MEMBER Α.Ε. Greece, Aspropyrgos
Attika 100 Petroleum Products Full
ENDIALE SINGLE MEMBER S.A (ex ELTEPE S.A.) Greece, Aspropyrgos
Attika 100
Systems of alternative
management of Lubricant
wastes
Full
ARCELIA HOLDINGS LTD Cyprus, Nicosia 100 Holding Company Full
CYTOP A.E. Greece, Aspropyrgos
Attika 100
Collection and Trading of used
Lubricants Full
ELTEPE J.V. Greece, Aspropyrgos
Attika 100
Collection and Trading of used
Lubricants Full
BULVARIA OOD Bulgaria, Sofia 100 Lubricants Trading Full
CYROM Romania, Ilfov-Glina 100 Lubricants Trading Full
CYCLON LUBRICANTS DOO BEOGRAD Serbia, Belgrade 100 Lubricants Trading Full
KEPED S.A. Greece, Aspropyrgos
Attika 100
Systems of alternative
management of Lubricant
wastes
Full
AL DERAA AL AFRIQUE JV Libya, Tripoli 60 Collection and Trading of used
Lubricants Full
IREON INVESTMENTS LIMITED Cyprus, Nicosia 100 Investments and Commerce Full
IREON VENTURES LTD Cyprus, Nicosia 100 Holding Company Full
MOTOR OIL MIDDLE EAST DMCC United Arab Emirates,
Dubai 100 Petroleum Products Full
MOTOR OIL TRADING SINGLE MEMBER A.E. Greece, Maroussi of
Attika 100 Petroleum Products Full
DIORIGA GAS SINGLE MEMBER A.E. Greece, Maroussi of
Attika 100 Natural Gas Full
BUILDING FACILITY SERVICES SINGLE MEMBER S.A. Greece, Maroussi of
Attika 100 Facilities Management Services Full
Interim Condensed Financial Statements
for the period 1/1-31/03/2021
Page 24 of 46
Name Place of incorporation
and operation
% of ownership
interest Principal Activity
Consolidation
Method
MOTOR OIL FINANCE PLC United Kingdom,
London 100 Financial Services Full
CORINTHIAN OIL LTD United Kingdom,
London 100 Petroleum Products Full
MOTOR OIL VEGAS UPSTREAM Ltd Cyprus, Nicosia 65 Crude oil research, exploration
and trading (upstream) Full
MV UPSTREAM TANZANIA Ltd Cyprus, Nicosia 65 Crude oil research, exploration
and trading (upstream) Full
MVU BRAZOS CORP. USA, Delaware 65 Crude oil research, exploration
and trading (upstream) Full
VEGAS WEST OBAYED LTD Cyprus, Nicosia 65 Crude oil research, exploration
and trading (upstream) Full
NRG TRADING HOUSE S.A. Greece, Maroussi of
Attika 90
Trading of Electricity and Natural
Gas Full
MEDIAMAX HOLDINGS LIMITED” (ex SEILLA
ENTERPRISES LIMITED) Cyprus, Nicosia 100 Holding Company Full
OFC AVIATION FUEL SERVICES S.A. Greece, Spata of
Attika 95 Aviation Fueling Systems Full
ELECTROPARAGOGI SOUSSAKI SINGLE MEMBER
S.A.
Greece, Maroussi of
Attika 100 Energy Full
TEFORTO HOLDING LTD Cyprus, Nicosia 100 Holding Company Full
STEFANER S.A. Greece, Maroussi of
Attika 85 Energy Full
RADIANT SOLAR HOLDINGS LTD Cyprus, Nicosia 100 Holding Company Full
SELEFKOS SINGLE MEMBER S.A. Greece, Maroussi of
Attika 100 Energy Full
GREENSOL HOLDINGS LTD Greece, Maroussi of
Attika 100 Holding Company Full
ANTIGONOS ENERGEIAKI SINGLE MEMBER S.A. Greece, Maroussi of
Attika 100 Energy Full
ILIDA ENERGEIAKI SINGLE MEMBER S.A. Greece, Maroussi of
Attika 100 Energy Full
ANTIKLEIA ENERGEIAKI SINGLE MEMBER S.A. Greece, Maroussi of
Attika 100 Energy Full
KALIPSO ENERGEIAKI SINGLE MEMBER S.A. Greece, Maroussi of
Attika 100 Energy Full
ANTIPATROS ENERGEIAKI SINGLE MEMBER S.A. Greece, Maroussi of
Attika 100 Energy Full
KIRKI ENERGEIAKI SINGLE MEMBER S.A Greece, Maroussi of
Attika 100 Energy Full
ARITI ENERGEIAKI SINGLE MEMBER S.A. Greece, Maroussi of
Attika 100 Energy Full
LYSIMAHOS ENERGEIAKI SINGLE MEMBER S.A. Greece, Maroussi of
Attika 100 Energy Full
EKAVI ENERGEIAKI SINGLE MEMBER S.A. Greece, Maroussi of
Attika 100 Energy Full
MENANDROS ENERGEIAKI SINGLE MEMBER S.A. Greece, Maroussi of
Attika 100 Energy Full
INO ENERGEIAKI SINGLE MEMBER S.A. Greece, Maroussi of
Attika 100 Energy Full
KELLAS WIND PARK S.A. Greece, Maroussi of
Attika 100 Energy Full
OPOUNTIA ECO WIND S.A. Greece, Maroussi of
Attika 100 Energy Full
SENTRADE HOLDING S.A. Luxembourg 100 Energy Full
STRATEGIC ENERGY TRADING ENERGIAKI S.A. Greece, Alimos of
Attika 100 Energy Full
SENTRADE RS DOO BEOGRAD Serbia, Belgrade 100 Energy Full
SENTRADE DOOEL SKOPJE N. Macedonia, Skopje 100 Energy Full
KORINTHOS POWER S.A. Greece, Maroussi of
Attika 35 Energy Equity
SHELL & MOH AVIATION FUELS S.A. Greece, Maroussi of
Attika 49 Aviation Fuels Equity
RHODES-ALEXANDROUPOLIS PETROLEUM
INSTALLATION S.A.
Greece, Maroussi of
Attika 37.49 Aviation Fuels Equity

Interim Condensed Financial Statements
for the period 1/1-31/03/2021
Page 25 of 46
Name Place of incorporation
and operation
% of ownership
interest Principal Activity
Consolidation
Method
NEVINE HOLDINGS LIMITED* Cyprus, Nicosia 100 Holding Company Full
ALPHA SATELITE TV S.A.* Greece, Pallini Attica 100 TV channel Full
ALPHA RADIO S.A.* Greece, Pallini Attica 99.95 Radio Station Full
APIOS D.O.O Croatia, Zagreb 100 Petroleum Products Full
TALLON COMMODITIES LTD United Kingdom,
London 30
Risk Management and
Commodities Hedging Equity
O.F.C TECHNICAL S.A Greece, Maroussi of
Attika 96.25
Technical consulting for airport
companies Full
TALLON PTE LTD Singapore 30 Risk Management and
Commodities Hedging Equity
WIRED RES S.A. Greece, Maroussi of
Attika 75 Energy Full
*The above entities were consolidated with the equity method, until 31st July 2020.
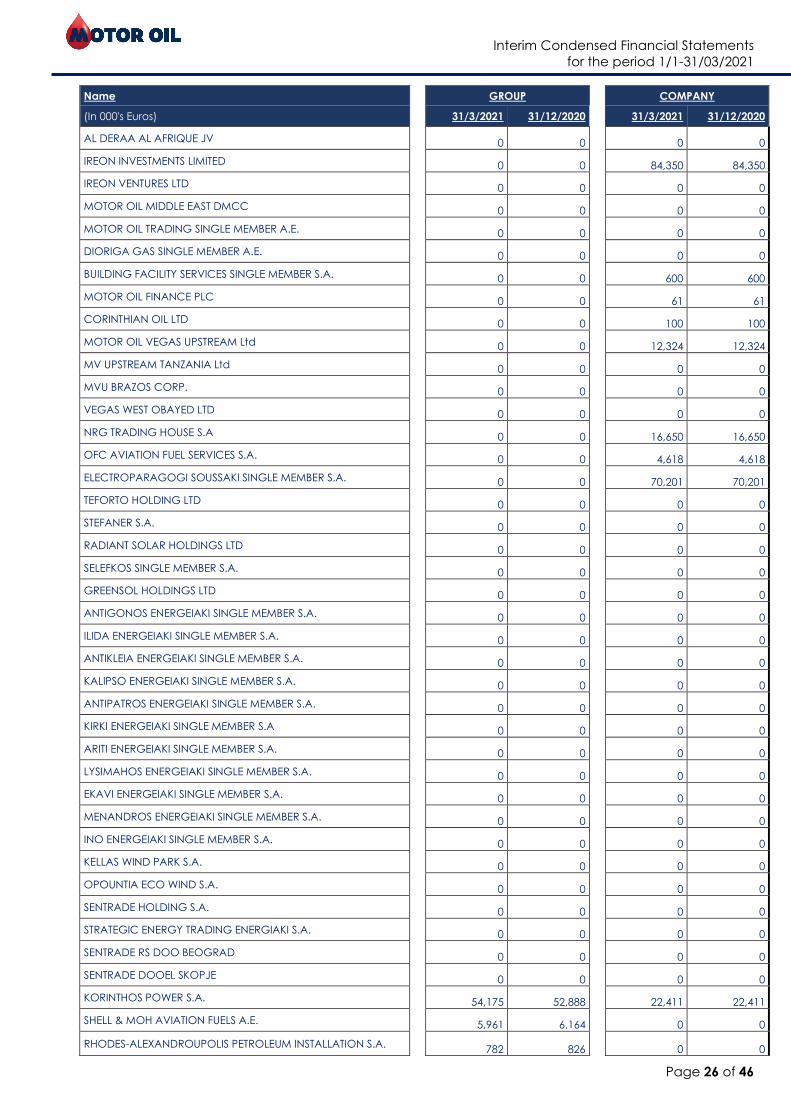
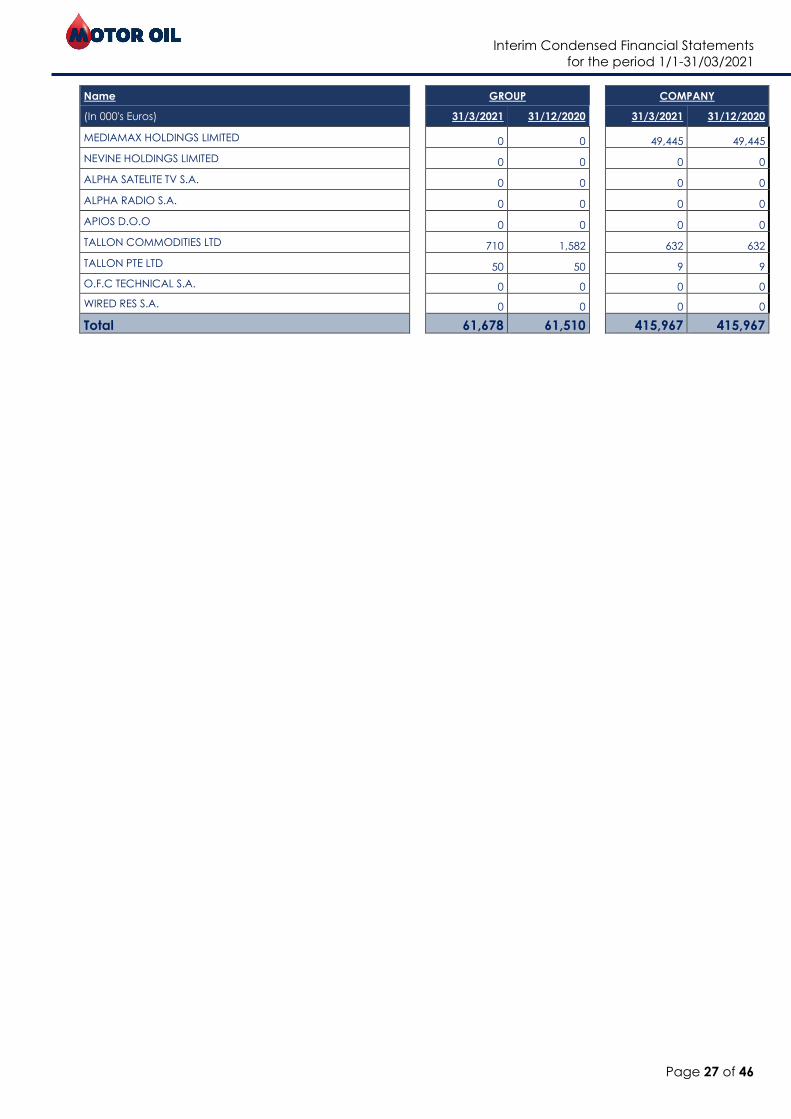
Investments in subsidiaries and associates are as follows:
Name GROUP COMPANY
(In 000's Euros) 31/3/2021 31/12/2020 31/3/2021 31/12/2020
AVIN OIL SINGLE MEMBER S.A. 0 0 53,013 53,013
MAKREON SINGLE MEMBER S.A. 0 0 0 0
AVIN AKINITA SINGLE MEMBER S.A. 0 0 0 0
CORAL SINGLE MEMBER Α.Ε. OIL AND CHEMICALS COMPANY 0 0 63,141 63,141
ERMIS OIL TRANSPORTATION, EXPLOITATION, TRADING AND
SERVICES COMPANY SINGLE MEMBER A.E. 0 0 0 0
MYRTEA OIL TRADING, STORAGE, AGENCY AND SERVICES
COMPANY SINGLE MEMBER A.E. 0 0 0 0
CORAL PRODUCTS AND TRADING SINGLE MEMBER A.E 0 0 0 0
CORAL INNOVATIONS SINGLE MEMBER A.E. 0 0 0 0
MEDSYMPAN LTD 0 0 0 0
CORAL SRB DOO BEOGRAD 0 0 0 0
CORAL-FUELS DOEL SKOPJE 0 0 0 0
CORAL MONTENEGRO DOO PODGORICA 0 0 0 0
CORAL ALBANIA SH.A 0 0 0 0
MEDPROFILE LTD 0 0 0 0
CORAL ENERGY PRODUCTS (CYPRUS) LTD 0 0 0 0
CORAL SINGLE MEMBER A.E. COMMERCIAL AND INDUSTRIAL
GAS COMPANY 0 0 26,585 26,585
CORAL GAS CYPRUS LTD 0 0 0 0
L.P.C. SINGLE MEMBER S.A. 0 0 11,827 11,827
ENDIALE SINGLE MEMBER S.A 0 0 0 0
ARCELIA HOLDINGS LTD 0 0 0 0
CYTOP SINGLE MEMBER A.E. 0 0 0 0
ELTEPE J.V. 0 0 0 0
BULVARIA OOD 0 0 0 0
CYROM 0 0 0 0
CYCLON LUBRICANTS DOO BEOGRAD 0 0 0 0
KEPED S.A. 0 0 0 0
Interim Condensed Financial Statements
for the period 1/1-31/03/2021
Page 26 of 46
Name GROUP COMPANY
(In 000's Euros) 31/3/2021 31/12/2020 31/3/2021 31/12/2020
AL DERAA AL AFRIQUE JV 0 0 0 0
IREON INVESTMENTS LIMITED 0 0 84,350 84,350
IREON VENTURES LTD 0 0 0 0
MOTOR OIL MIDDLE EAST DMCC 0 0 0 0
MOTOR OIL TRADING SINGLE MEMBER A.E. 0 0 0 0
DIORIGA GAS SINGLE MEMBER Α.Ε. 0 0 0 0
BUILDING FACILITY SERVICES SINGLE MEMBER S.A. 0 0 600 600
MOTOR OIL FINANCE PLC 0 0 61 61
CORINTHIAN OIL LTD 0 0 100 100
MOTOR OIL VEGAS UPSTREAM Ltd 0 0 12,324 12,324
MV UPSTREAM TANZANIA Ltd 0 0 0 0
MVU BRAZOS CORP. 0 0 0 0
VEGAS WEST OBAYED LTD 0 0 0 0
NRG TRADING HOUSE S.A 0 0 16,650 16,650
OFC AVIATION FUEL SERVICES S.A. 0 0 4,618 4,618
ELECTROPARAGOGI SOUSSAKI SINGLE MEMBER S.A. 0 0 70,201 70,201
TEFORTO HOLDING LTD 0 0 0 0
STEFANER S.A. 0 0 0 0
RADIANT SOLAR HOLDINGS LTD 0 0 0 0
SELEFKOS SINGLE MEMBER S.A. 0 0 0 0
GREENSOL HOLDINGS LTD 0 0 0 0
ANTIGONOS ENERGEIAKI SINGLE MEMBER S.A. 0 0 0 0
ILIDA ENERGEIAKI SINGLE MEMBER S.A. 0 0 0 0
ANTIKLEIA ENERGEIAKI SINGLE MEMBER S.A. 0 0 0 0
KALIPSO ENERGEIAKI SINGLE MEMBER S.A. 0 0 0 0
ANTIPATROS ENERGEIAKI SINGLE MEMBER S.A. 0 0 0 0
KIRKI ENERGEIAKI SINGLE MEMBER S.A 0 0 0 0
ARITI ENERGEIAKI SINGLE MEMBER S.A. 0 0 0 0
LYSIMAHOS ENERGEIAKI SINGLE MEMBER S.A. 0 0 0 0
EKAVI ENERGEIAKI SINGLE MEMBER S.A. 0 0 0 0
MENANDROS ENERGEIAKI SINGLE MEMBER S.A. 0 0 0 0
INO ENERGEIAKI SINGLE MEMBER S.A. 0 0 0 0
KELLAS WIND PARK S.A. 0 0 0 0
OPOUNTIA ECO WIND S.A. 0 0 0 0
SENTRADE HOLDING S.A. 0 0 0 0
STRATEGIC ENERGY TRADING ENERGIAKI S.A. 0 0 0 0
SENTRADE RS DOO BEOGRAD 0 0 0 0
SENTRADE DOOEL SKOPJE 0 0 0 0
KORINTHOS POWER S.A. 54,175 52,888 22,411 22,411
SHELL & MOH AVIATION FUELS A.E. 5,961 6,164 0 0
RHODES-ALEXANDROUPOLIS PETROLEUM INSTALLATION S.A. 782 826 0 0
Interim Condensed Financial Statements
for the period 1/1-31/03/2021
Page 27 of 46
Name GROUP COMPANY
(In 000's Euros) 31/3/2021 31/12/2020 31/3/2021 31/12/2020
MEDIAMAX HOLDINGS LIMITED 0 0 49,445 49,445
NEVINE HOLDINGS LIMITED 0 0 0 0
ALPHA SATELITE TV S.A. 0 0 0 0
ALPHA RADIO S.A. 0 0 0 0
APIOS D.O.O 0 0 0 0
TALLON COMMODITIES LTD 710 1,582 632 632
TALLON PTE LTD 50 50 9 9
O.F.C TECHNICAL S.A. 0 0 0 0
WIRED RES S.A. 0 0 0 0
Total 61,678 61,510 415,967 415,967
Interim Condensed Financial Statements
for the period 1/1-31/03/2021
Page 28 of 46
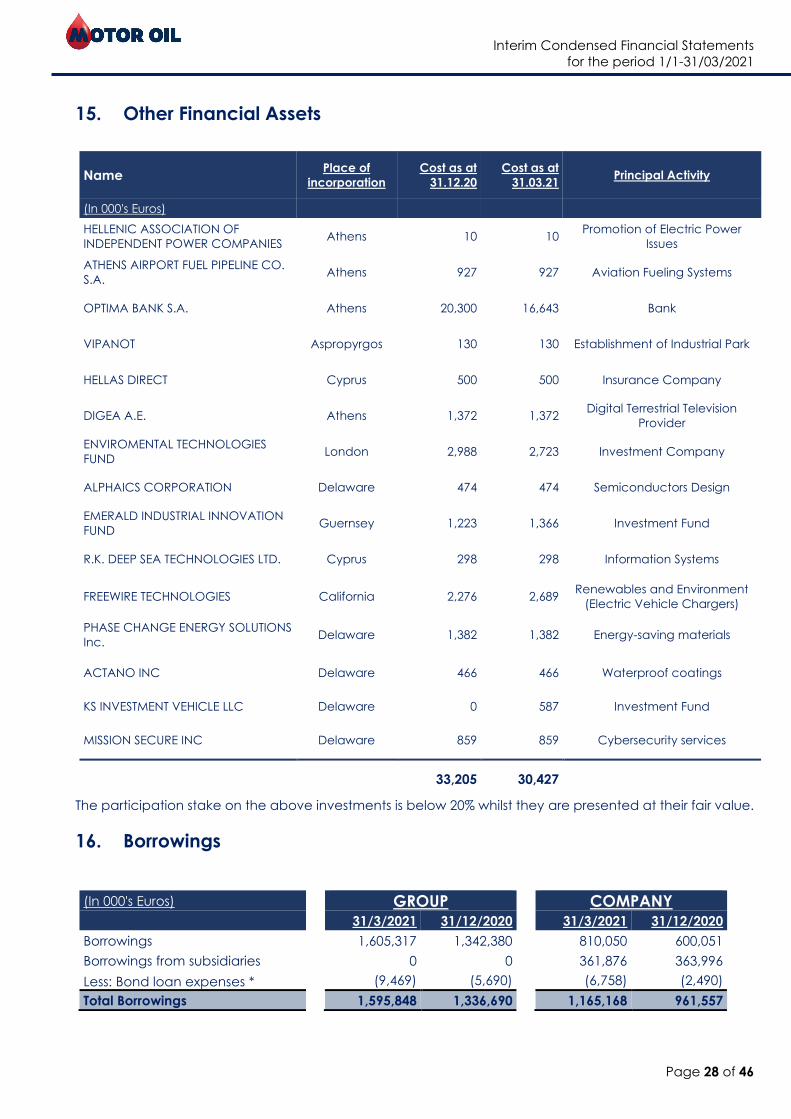
15. Other Financial Assets
Name Place of
incorporation
Cost as at
31.12.20
Cost as at
31.03.21 Principal Activity
(In 000's Euros)
HELLENIC ASSOCIATION OF
INDEPENDENT POWER COMPANIES Athens 10 10
Promotion of Electric Power
Issues
ATHENS AIRPORT FUEL PIPELINE CO.
S.A. Athens 927 927 Aviation Fueling Systems
OPTIMA BANK S.A. Athens 20,300 16,643 Bank
VIPANOT Aspropyrgos 130 130 Establishment of Industrial Park
HELLAS DIRECT Cyprus 500 500 Insurance Company
DIGEA A.E. Athens 1,372 1,372 Digital Terrestrial Television
Provider
ENVIROMENTAL TECHNOLOGIES
FUND London 2,988 2,723 Investment Company
ALPHAICS CORPORATION Delaware 474 474 Semiconductors Design
EMERALD INDUSTRIAL INNOVATION
FUND Guernsey 1,223 1,366 Investment Fund
R.K. DEEP SEA TECHNOLOGIES LTD. Cyprus 298 298 Information Systems
FREEWIRE TECHNOLOGIES California 2,276 2,689 Renewables and Environment
(Electric Vehicle Chargers)
PHASE CHANGE ENERGY SOLUTIONS
Inc. Delaware 1,382 1,382 Energy-saving materials
ACTANO INC Delaware 466 466 Waterproof coatings
KS INVESTMENT VEHICLE LLC Delaware 0 587 Investment Fund
MISSION SECURE INC Delaware 859 859 Cybersecurity services
33,205 30,427
The participation stake on the above investments is below 20% whilst they are presented at their fair value.
16. Borrowings
(In 000's Euros) GROUP COMPANY 31/3/2021 31/12/2020 31/3/2021 31/12/2020
Borrowings 1,605,317 1,342,380 810,050 600,051
Borrowings from subsidiaries 0 0 361,876 363,996
Less: Bond loan expenses * (9,469) (5,690) (6,758) (2,490)
Total Borrowings 1,595,848 1,336,690 1,165,168 961,557
Interim Condensed Financial Statements
for the period 1/1-31/03/2021
Page 29 of 46
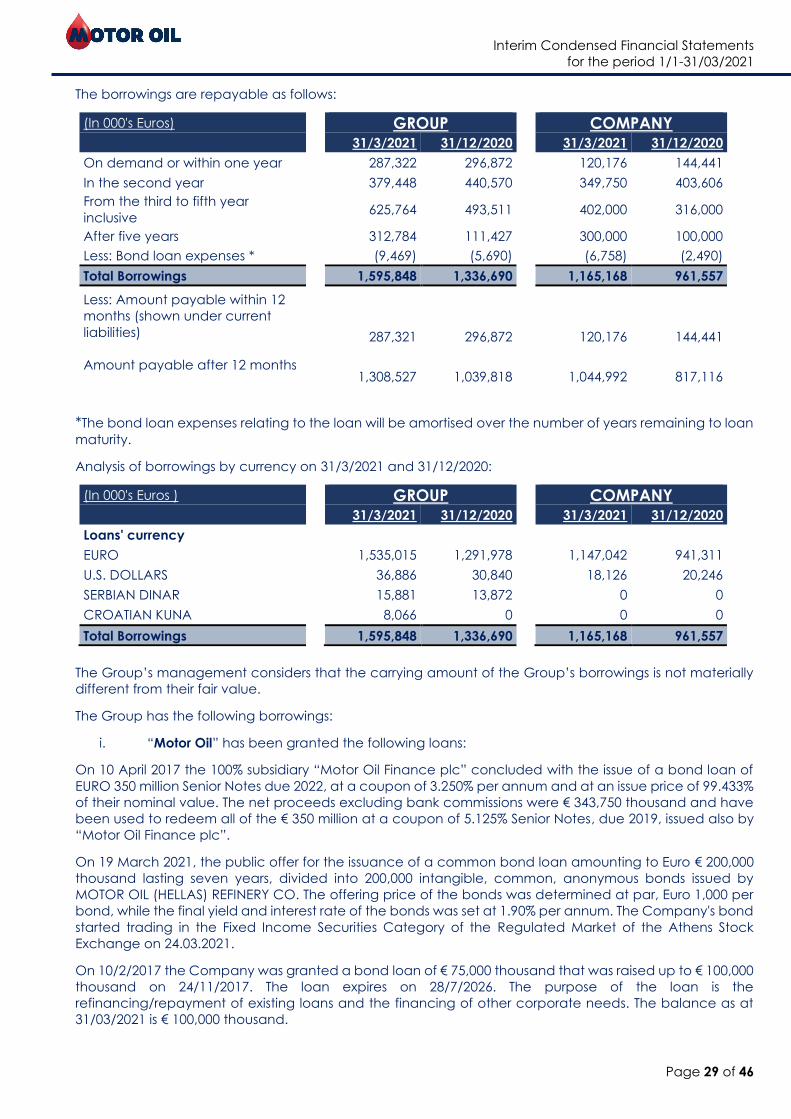
The borrowings are repayable as follows:
(In 000's Euros) GROUP COMPANY
31/3/2021 31/12/2020 31/3/2021 31/12/2020
On demand or within one year 287,322 296,872 120,176 144,441
In the second year 379,448 440,570 349,750 403,606
From the third to fifth year
inclusive 625,764 493,511 402,000 316,000
After five years 312,784 111,427 300,000 100,000
Less: Bond loan expenses * (9,469) (5,690) (6,758) (2,490)
Total Borrowings 1,595,848 1,336,690 1,165,168 961,557
Less: Amount payable within 12
months (shown under current
liabilities)
287,321 296,872 120,176 144,441
Amount payable after 12 months 1,308,527 1,039,818 1,044,992 817,116
*The bond loan expenses relating to the loan will be amortised over the number of years remaining to loan
maturity.
Analysis of borrowings by currency on 31/3/2021 and 31/12/2020:
(In 000's Euros ) GROUP COMPANY
31/3/2021 31/12/2020 31/3/2021 31/12/2020
Loans' currency
EURO 1,535,015 1,291,978 1,147,042 941,311
U.S. DOLLARS 36,886 30,840 18,126 20,246
SERBIAN DINAR 15,881 13,872 0 0
CROATIAN KUNA 8,066 0 0 0
Total Borrowings 1,595,848 1,336,690 1,165,168 961,557
The Group’s management considers that the carrying amount of the Group’s borrowings is not materially
different from their fair value.
The Group has the following borrowings:
i. “Motor Oil” has been granted the following loans:
On 10 April 2017 the 100% subsidiary “Motor Oil Finance plc” concluded with the issue of a bond loan of
EURO 350 million Senior Notes due 2022, at a coupon of 3.250% per annum and at an issue price of 99.433%
of their nominal value. The net proceeds excluding bank commissions were € 343,750 thousand and have
been used to redeem all of the € 350 million at a coupon of 5.125% Senior Notes, due 2019, issued also by
“Motor Oil Finance plc”.
On 19 March 2021, the public offer for the issuance of a common bond loan amounting to Euro € 200,000
thousand lasting seven years, divided into 200,000 intangible, common, anonymous bonds issued by
MOTOR OIL (HELLAS) REFINERY CO. The offering price of the bonds was determined at par, Euro 1,000 per
bond, while the final yield and interest rate of the bonds was set at 1.90% per annum. The Company's bond
started trading in the Fixed Income Securities Category of the Regulated Market of the Athens Stock
Exchange on 24.03.2021.
On 10/2/2017 the Company was granted a bond loan of € 75,000 thousand that was raised up to € 100,000
thousand on 24/11/2017. The loan expires on 28/7/2026. The purpose of the loan is the
refinancing/repayment of existing loans and the financing of other corporate needs. The balance as at
31/03/2021 is € 100,000 thousand.
Interim Condensed Financial Statements
for the period 1/1-31/03/2021
Page 30 of 46
On 16/5/2018 the Company, through the 100% subsidiary “Motor Oil Finance plc”, was granted a bond
loan of $ 41,906 thousand. The settlement of this loan is in semi-annual instalments commencing on
28/3/2019 and up to 29/3/2022 with the extension option for 1 year. The balance as at 31/03/2021 is $ 21,252
thousand.
On 19/3/19 the Company was granted a bond loan of € 5,000 thousand which was further raised up to €
100.000 on March 2020. The purpose of the loan is the refinancing/repayment of existing loans. The loan
expires on 24/12/2021, with an extension option of 1+1+1 year. The balance as at 31/03/2021 is € 100,000
thousand.
On February 2021 the Company was granted a bond loan of € 200,000 thousand. The purpose of the loan
is the refinancing/repayment of existing loans. The loan expires on 4/2/2024. The balance as at 31/03/2021
is € 40,000 thousand.
On March 2020, a bond loan of € 140.000 thousand was granted. The purpose of this loan agreement is the
financing of general corporate needs. The loan expires on 12/7/2022. The balance as at 31/03/2021 is €
40,000 thousand.
On June 2020, a bond loan of € 100.000 thousand was granted. The purpose of this loan agreement is the
financing of general corporate needs. The loan expires on 19/6/2023. The balance as at 31/03/2021 is €
100,000 thousand.
On June 2020, a bond loan of € 150.000 thousand was granted. The purpose of this loan agreement is the
refinancing/repayment of existing loans and the financing of general corporate needs. The loan expires
on 9/6/2023. The balance as at 31/03/2021 is € 150,000 thousand.
On 27/11/2020, a bond loan of € 50.000 thousand was granted. The purpose of this loan agreement is to
cover the corporate needs in working capital due to the covid-19 pandemics. The loan expires on
27/11/2023. The balance as at 31/03/2021 is € 50,000 thousand.
On 28/12/2020, a bond loan of € 20.000 thousand was granted. The purpose of this loan agreement is to
cover working capital, due to the corporate’s increased liquidity needs, because of covid-19 pandemic.
The loan expires on 15/9/2025. The balance as at 31/03/2021 is € 20,000 thousand.
On 31/3/2021, a bond loan of € 10.000 thousand was granted. The purpose of this loan agreement is to
cover working capital, due to the corporate’s increased liquidity needs, because of covid-19 pandemic.
The loan expires on 15/9/2025. The balance as at 31/03/2021 is € 10,000 thousand.
The total short-term loans, (including short-term portion of long-term loans), with duration up to one-year
amount to € 144,441 thousand.
ii. “Avin Oil S.A.” was granted a bond loan of € 80,000 thousand on 24/11/2019 out of which € 77,000
thousand has been raised. The purpose of the loan is the refinancing/repayment of existing loans. The
duration of the loan is 5 years and its settlement is in semi-annual instalments commencing on 25/5/2020
and up to 24/11/2024. The balance as at 31/03/2021 is € 71,000 thousand.
On 05/10/2020 Avin Oil S.A. was granted a bond loan of € 15,000 thousand, out of which € 15,000 thousand
has been raised. The duration of the loan is 5 years and its settlement is in semi-annual instalments
commencing on 30/06/2021 and up to 30/06/2025. The balance as at 31.03.2021 is € 15,000 thousand.
On 05/03/2021 Avin Oil S.A. was granted a bond loan of € 17,500 thousand, out of which € 17,500 thousand
has been raised. The duration of the loan is 3 years with two-year extension option.
Total short-term loans, (including short-term portion of long-term loans) with duration up to one year,
amount to € 30,326 thousand.
iii. “Coral A.E.” on 9/5/2018 concluded with the issue of a bond loan of € 90.000 thousand at a coupon
of 3% per annum, which is traded in Athens Stock Exchange. Purpose of this loan is the refinancing of
existing loans. The loan is due on 11/5/2023.
On 21/12/2018 Coral A.E. was granted a bond loan of € 20,000 thousand with an expiration date of
21/12/2021. The purpose of the loan is the refinancing/repayment of existing loans. The balance as at
31/03/2021 is € 20,000 thousand.
Interim Condensed Financial Statements
for the period 1/1-31/03/2021
Page 31 of 46
On 27/8/2019 Coral A.E. was granted a bond loan of € 44,000 thousand with an expiration date of
27/8/2021. The purpose of the loan is the refinancing/repayment of existing loans and the financing of
other corporate needs. The balance as at 31/03/2021 is € 22,000 thousand, same as the amount raised.
On 20/5/2020 Coral A.E. was granted a bond loan of € 15,000 thousand with an expiration date of
20/5/2024. The purpose of the loan is the financing of various business needs. The balance as at 31/12/2020
is € 15,000 thousand, same as the amount raised.
On 05/12/2018 Coral A.E. was granted a bond loan of € 25,000 thousand with an expiration date of
05/12/2021. The purpose of the loan is the refinancing/repayment of existing loans. The balance as at
31/03/2021 is € 16,000 thousand, same as the amount raised.
On 16/09/2020 Coral A.E. was granted a bond loan of € 25,000 thousand with an expiration date of
05/09/2023. The purpose of the loan is the financing of various business needs. The balance as at 31/03/2021
is € 11,000 thousand, same as the amount raised.
Furthermore, Coral A.E has received short – term borrowings of € 7,240 thousand from overdraft accounts.
Total short-term loans, (including short-term portion of long-term loans) with duration up to one-year
amount to € 65,240 thousand.
iv. “L.P.C. S.A.” was granted a bond loan of € 18,000 thousand on 21/5/2019, with an expiration date
of 21/5/2022 and a two-year extension option. The purpose of the loan is the refinancing/repayment of
existing loans. Its settlement is in semi-annual instalments commencing on 21/11/2019. The balance as at
31/03/2021 is € 4,722 thousand.
Total short-term loans (including short-term portion of long-term loans) with duration up to one year, amount
to € 1,500 thousand.
v. “CORAL GAS” on 7/11/2018 was granted a bond loan of up to € 8,000 thousand, with an expiration
date of 7/11/2021. The purpose of the loan is the refinancing/repayment of existing loans and the financing
of other corporate needs. The balance as at 31/03/2021 is € 5,000, which has become short-term in its
entirety.
vi. “STEFANER” on 16/12/2020 was granted a bond loan of up to € 14,640 thousand (Series A € 12,300,
Series b € 1,740, Series C € 600 with expiration dates as following: (Series A 30/06/2032, Series b 32/12/2022,
Series C 12 months after the first issuance of the bond. The purpose of the loan is the construction of three
wind farms with a total capacity of 9.4 MW. The balance of the bonds issued on 31/03/2021 was € 12,500
thousand (Series A € 11,100, Series B € 1,400, Series C € 0).
Interim Condensed Financial Statements
for the period 1/1-31/03/2021
Page 32 of 46
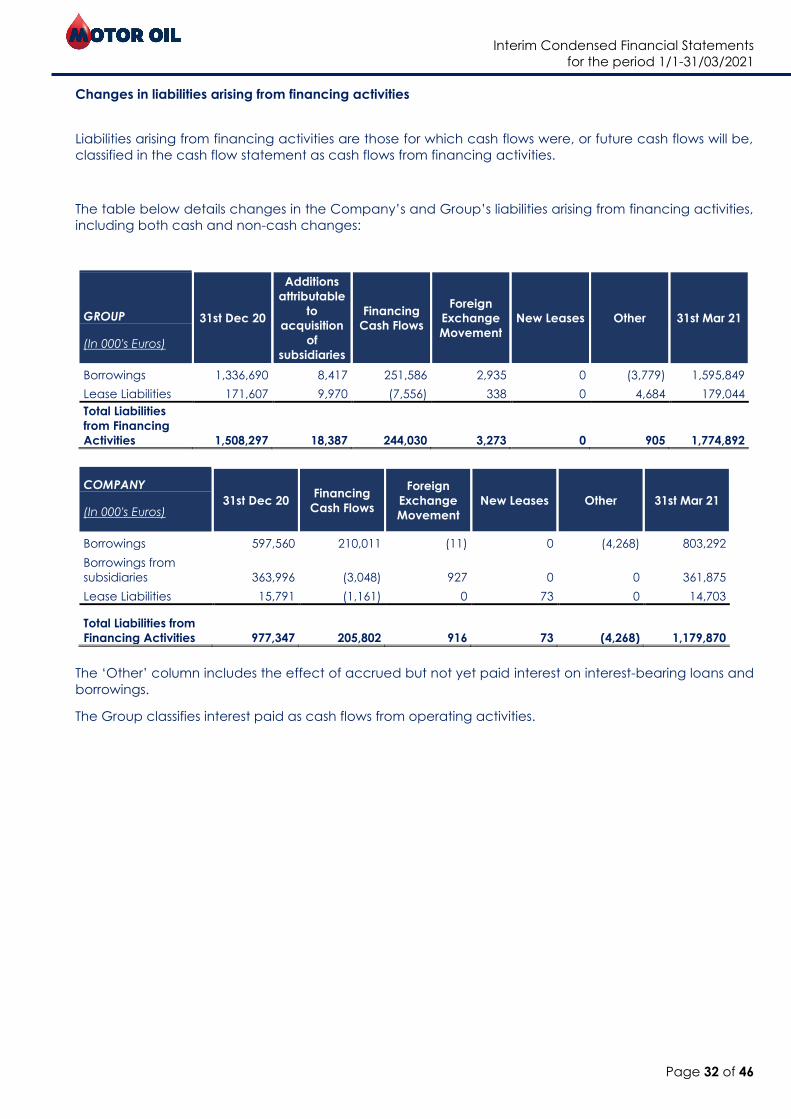
Changes in liabilities arising from financing activities
Liabilities arising from financing activities are those for which cash flows were, or future cash flows will be,
classified in the cash flow statement as cash flows from financing activities.
The table below details changes in the Company’s and Group’s liabilities arising from financing activities,
including both cash and non-cash changes:
GROUP 31st Dec 20
Additions
attributable
to
acquisition
of
subsidiaries
Financing
Cash Flows
Foreign
Exchange
Movement
New Leases Other 31st Mar 21
(In 000's Euros)
Borrowings 1,336,690 8,417 251,586 2,935 0 (3,779) 1,595,849
Lease Liabilities 171,607 9,970 (7,556) 338 0 4,684 179,044
Total Liabilities
from Financing
Activities 1,508,297 18,387 244,030 3,273 0 905 1,774,892
COMPANY
31st Dec 20 Financing
Cash Flows
Foreign
Exchange
Movement
New Leases Other 31st Mar 21 (In 000's Euros)
Borrowings 597,560 210,011 (11) 0 (4,268) 803,292
Borrowings from
subsidiaries 363,996 (3,048) 927 0 0 361,875
Lease Liabilities 15,791 (1,161) 0 73 0 14,703
Total Liabilities from
Financing Activities 977,347 205,802 916 73 (4,268) 1,179,870
The ‘Other’ column includes the effect of accrued but not yet paid interest on interest-bearing loans and
borrowings.
The Group classifies interest paid as cash flows from operating activities.
Interim Condensed Financial Statements
for the period 1/1-31/03/2021
Page 33 of 46
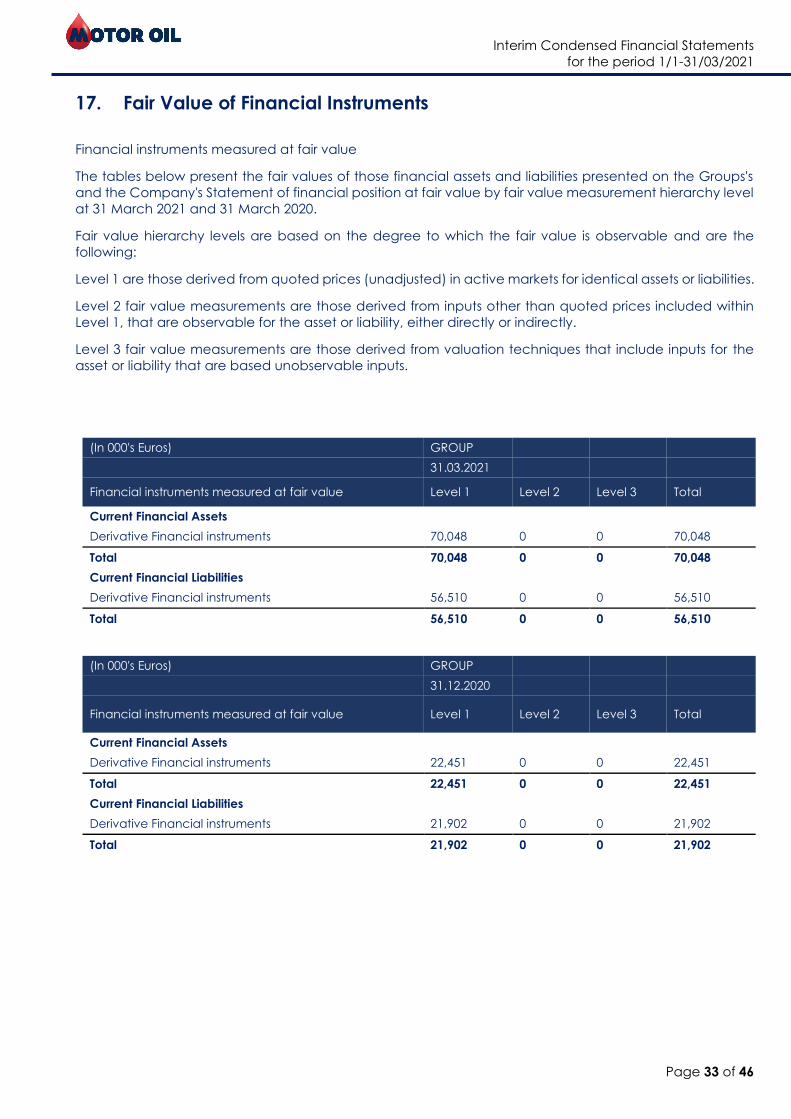
17. Fair Value of Financial Instruments
Financial instruments measured at fair value
The tables below present the fair values of those financial assets and liabilities presented on the Groups's
and the Company's Statement of financial position at fair value by fair value measurement hierarchy level
at 31 March 2021 and 31 March 2020.
Fair value hierarchy levels are based on the degree to which the fair value is observable and are the
following:
Level 1 are those derived from quoted prices (unadjusted) in active markets for identical assets or liabilities.
Level 2 fair value measurements are those derived from inputs other than quoted prices included within
Level 1, that are observable for the asset or liability, either directly or indirectly.
Level 3 fair value measurements are those derived from valuation techniques that include inputs for the
asset or liability that are based unobservable inputs.
(In 000's Euros) GROUP
31.03.2021
Financial instruments measured at fair value Level 1 Level 2 Level 3 Total
Current Financial Assets
Derivative Financial instruments 70,048 0 0 70,048
Total 70,048 0 0 70,048
Current Financial Liabilities
Derivative Financial instruments 56,510 0 0 56,510
Total 56,510 0 0 56,510
(In 000's Euros) GROUP
31.12.2020
Financial instruments measured at fair value Level 1 Level 2 Level 3 Total
Current Financial Assets
Derivative Financial instruments 22,451 0 0 22,451
Total 22,451 0 0 22,451
Current Financial Liabilities
Derivative Financial instruments 21,902 0 0 21,902
Total 21,902 0 0 21,902
Interim Condensed Financial Statements
for the period 1/1-31/03/2021
Page 34 of 46
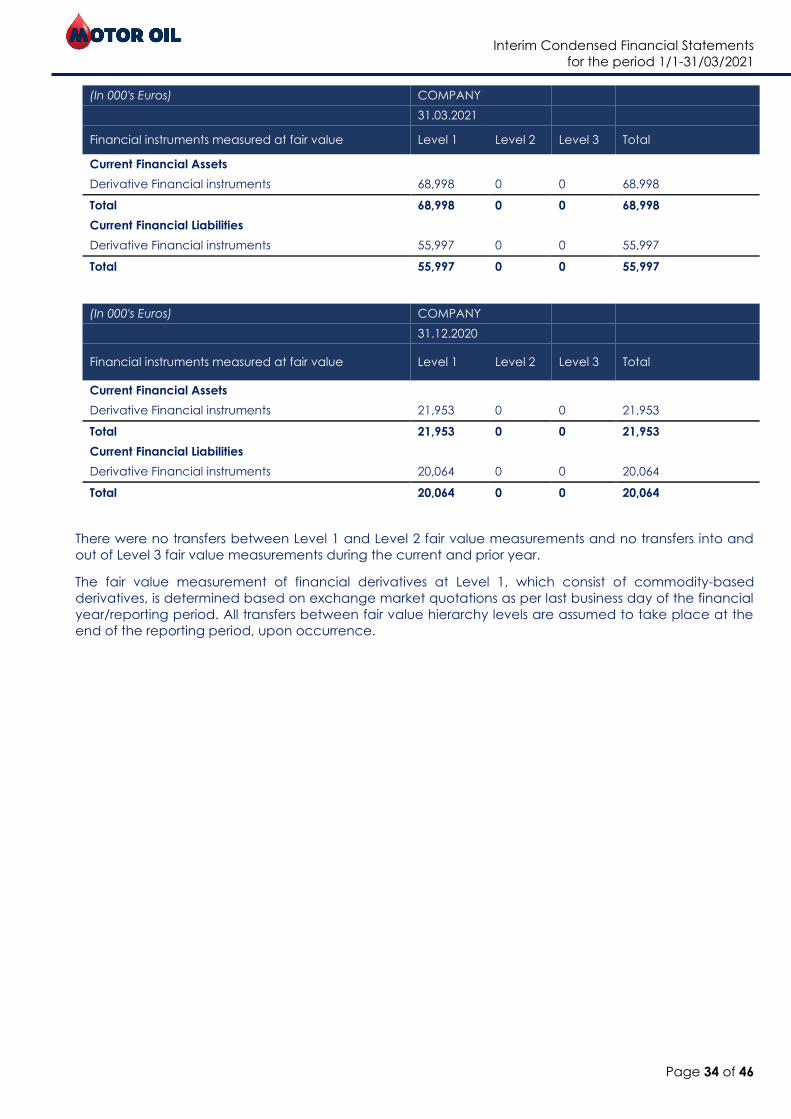
(In 000's Euros) COMPANY
31.03.2021
Financial instruments measured at fair value Level 1 Level 2 Level 3 Total
Current Financial Assets
Derivative Financial instruments 68,998 0 0 68,998
Total 68,998 0 0 68,998
Current Financial Liabilities
Derivative Financial instruments 55,997 0 0 55,997
Total 55,997 0 0 55,997
(In 000's Euros) COMPANY
31.12.2020
Financial instruments measured at fair value Level 1 Level 2 Level 3 Total
Current Financial Assets
Derivative Financial instruments 21,953 0 0 21,953
Total 21,953 0 0 21,953
Current Financial Liabilities
Derivative Financial instruments 20,064 0 0 20,064
Total 20,064 0 0 20,064
There were no transfers between Level 1 and Level 2 fair value measurements and no transfers into and
out of Level 3 fair value measurements during the current and prior year.
The fair value measurement of financial derivatives at Level 1, which consist of commodity-based
derivatives, is determined based on exchange market quotations as per last business day of the financial
year/reporting period. All transfers between fair value hierarchy levels are assumed to take place at the
end of the reporting period, upon occurrence.
Interim Condensed Financial Statements
for the period 1/1-31/03/2021
Page 35 of 46
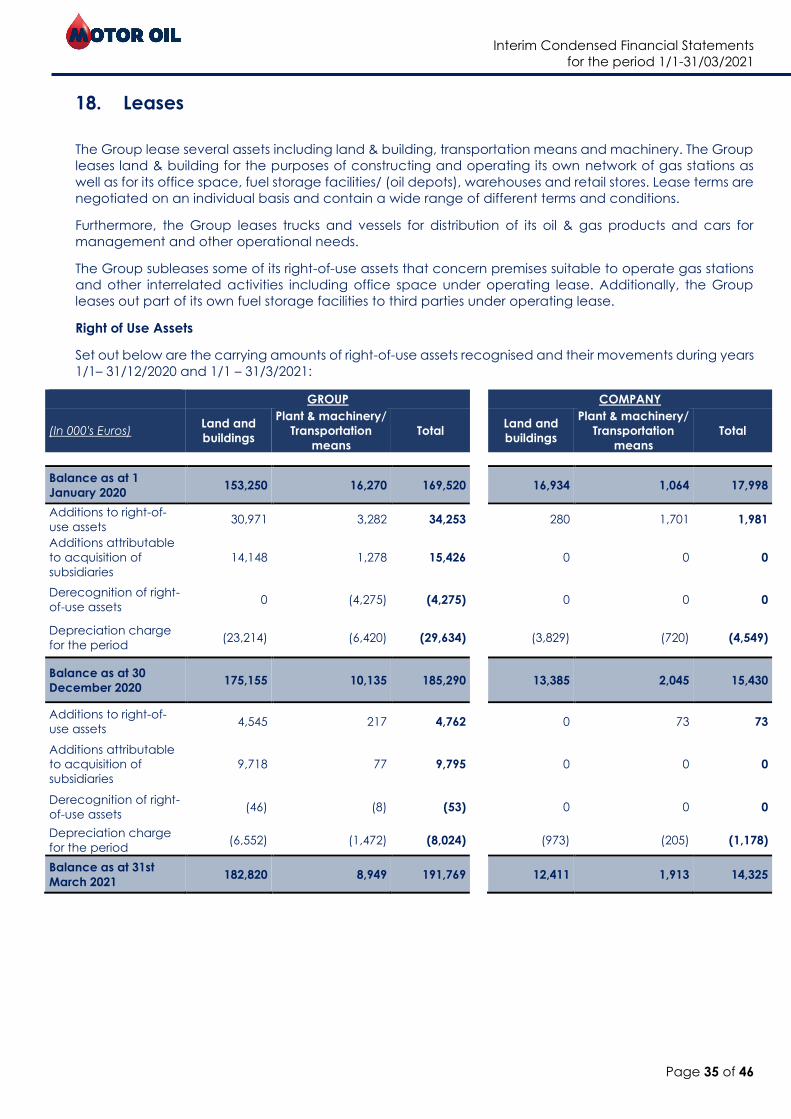
18. Leases
The Group lease several assets including land & building, transportation means and machinery. The Group
leases land & building for the purposes of constructing and operating its own network of gas stations as
well as for its office space, fuel storage facilities/ (oil depots), warehouses and retail stores. Lease terms are
negotiated on an individual basis and contain a wide range of different terms and conditions.
Furthermore, the Group leases trucks and vessels for distribution of its oil & gas products and cars for
management and other operational needs.
The Group subleases some of its right-of-use assets that concern premises suitable to operate gas stations
and other interrelated activities including office space under operating lease. Additionally, the Group
leases out part of its own fuel storage facilities to third parties under operating lease.
Right of Use Assets
Set out below are the carrying amounts of right-of-use assets recognised and their movements during years
1/1– 31/12/2020 and 1/1 – 31/3/2021:
GROUP COMPANY
(In 000's Euros) Land and
buildings
Plant & machinery/
Transportation
means
Total
Land and
buildings
Plant & machinery/
Transportation
means
Total
Balance as at 1
January 2020 153,250 16,270 169,520
16,934 1,064 17,998
Additions to right-of-
use assets 30,971 3,282 34,253 280 1,701 1,981
Additions attributable
to acquisition of
subsidiaries
14,148 1,278 15,426
0 0 0
Derecognition of right-
of-use assets 0 (4,275) (4,275)
0 0 0
Depreciation charge
for the period (23,214) (6,420) (29,634)
(3,829) (720) (4,549)
Balance as at 30
December 2020 175,155 10,135 185,290
13,385 2,045 15,430
Additions to right-of-
use assets 4,545 217 4,762
0 73 73
Additions attributable
to acquisition of
subsidiaries
9,718 77 9,795
0 0 0
Derecognition of right-
of-use assets (46) (8) (53)
0 0 0
Depreciation charge
for the period (6,552) (1,472) (8,024) (973) (205) (1,178)
Balance as at 31st
March 2021 182,820 8,949 191,769
12,411 1,913 14,325
Interim Condensed Financial Statements
for the period 1/1-31/03/2021
Page 36 of 46
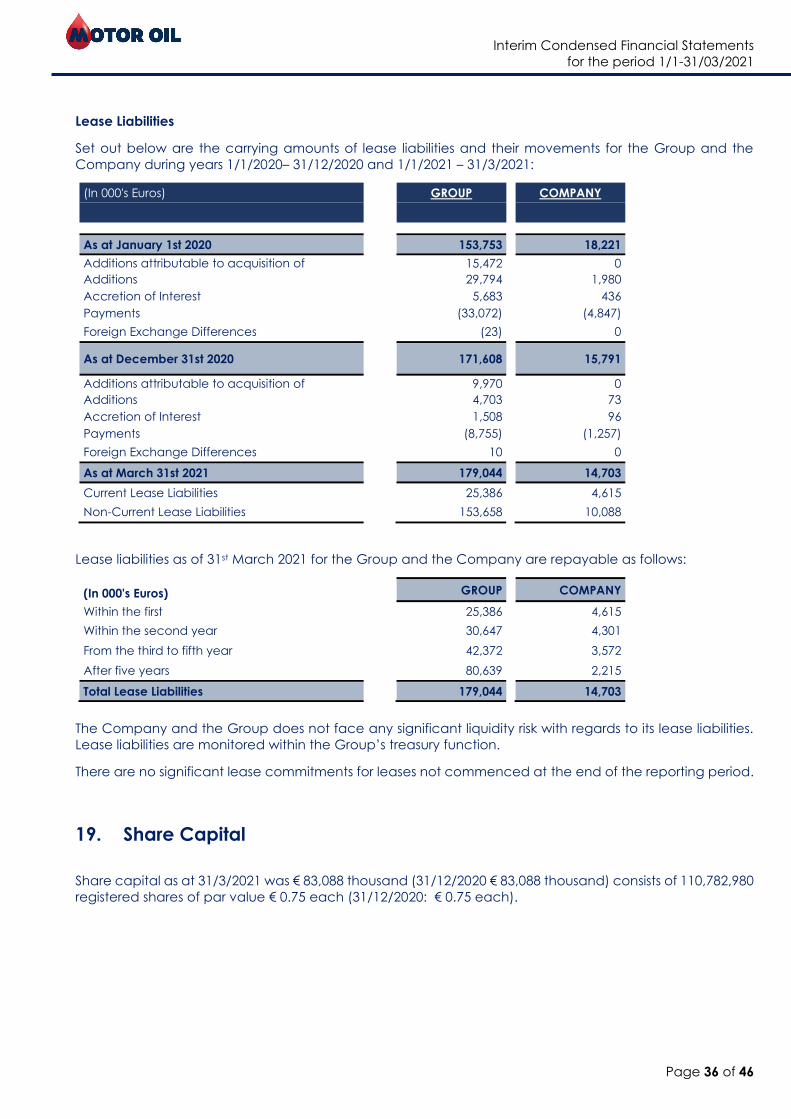
Lease Liabilities
Set out below are the carrying amounts of lease liabilities and their movements for the Group and the
Company during years 1/1/2020– 31/12/2020 and 1/1/2021 – 31/3/2021:
(In 000's Euros) GROUP COMPANY
As at January 1st 2020 153,753 18,221
Additions attributable to acquisition of
subsidiaries
15,472 0
Additions 29,794 1,980
Accretion of Interest 5,683 436
Payments (33,072) (4,847)
Foreign Exchange Differences (23) 0
As at December 31st 2020 171,608 15,791
Additions attributable to acquisition of
subsidiaries
9,970 0
Additions 4,703 73
Accretion of Interest 1,508 96
Payments (8,755) (1,257)
Foreign Exchange Differences 10 0
As at March 31st 2021 179,044 14,703
Current Lease Liabilities 25,386 4,615
Non-Current Lease Liabilities 153,658 10,088
Lease liabilities as of 31st March 2021 for the Group and the Company are repayable as follows:
(In 000's Euros) GROUP COMPANY
Within the first 25,386 4,615
Within the second year 30,647 4,301
From the third to fifth year 42,372 3,572
After five years 80,639 2,215
Total Lease Liabilities 179,044 14,703
The Company and the Group does not face any significant liquidity risk with regards to its lease liabilities.
Lease liabilities are monitored within the Group’s treasury function.
There are no significant lease commitments for leases not commenced at the end of the reporting period.
19. Share Capital
Share capital as at 31/3/2021 was € 83,088 thousand (31/12/2020 € 83,088 thousand) consists of 110,782,980
registered shares of par value € 0.75 each (31/12/2020: € 0.75 each).
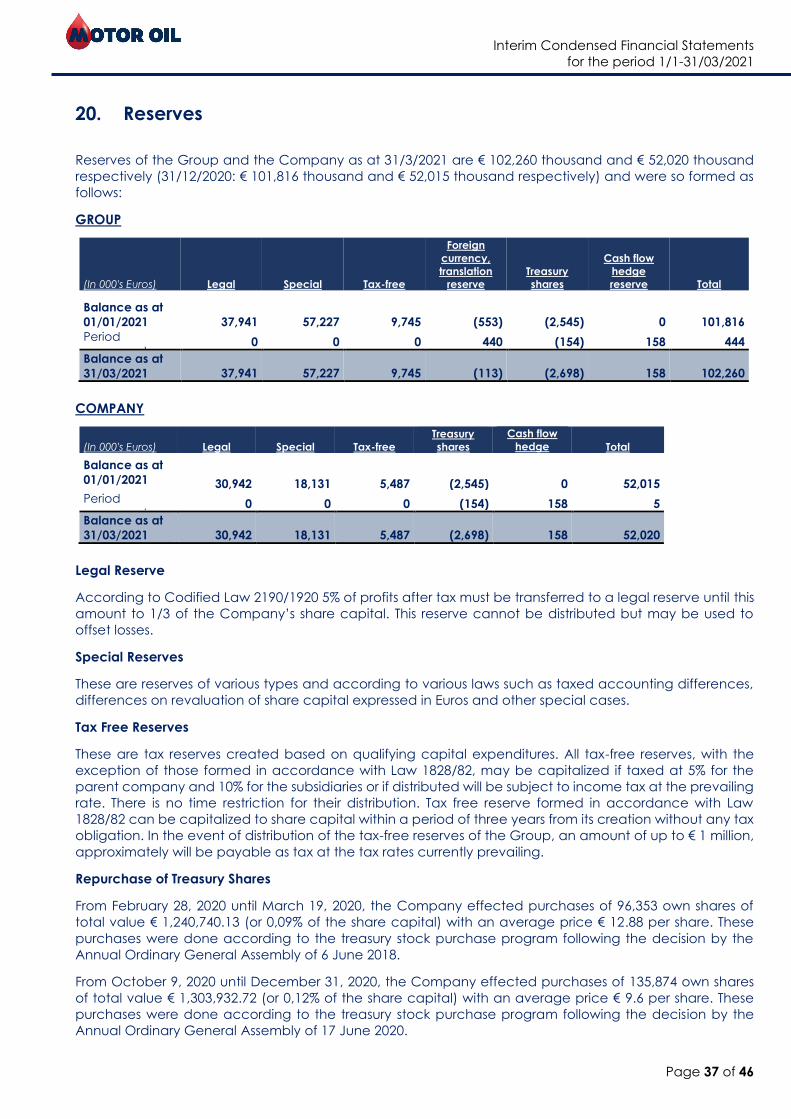
Interim Condensed Financial Statements
for the period 1/1-31/03/2021
Page 37 of 46
20. Reserves
Reserves of the Group and the Company as at 31/3/2021 are € 102,260 thousand and € 52,020 thousand
respectively (31/12/2020: € 101,816 thousand and € 52,015 thousand respectively) and were so formed as
follows:
GROUP
(In 000's Euros) Legal Special Tax-free
Foreign
currency,
translation
reserve
Treasury
shares
Cash flow
hedge
reserve Total
Balance as at
01/01/2021 37,941 57,227 9,745 (553) (2,545) 0 101,816
Period
movement 0 0 0 440 (154) 158 444
Balance as at
31/03/2021 37,941 57,227 9,745 (113) (2,698) 158 102,260
COMPANY
(In 000's Euros) Legal Special Tax-free
Treasury
shares
Cash flow
hedge
reserve Total
Balance as at
01/01/2021 30,942 18,131 5,487 (2,545) 0 52,015
Period
movement 0 0 0 (154) 158 5
Balance as at
31/03/2021 30,942 18,131 5,487 (2,698) 158 52,020
Legal Reserve
According to Codified Law 2190/1920 5% of profits after tax must be transferred to a legal reserve until this
amount to 1/3 of the Company’s share capital. This reserve cannot be distributed but may be used to
offset losses.
Special Reserves
These are reserves of various types and according to various laws such as taxed accounting differences,
differences on revaluation of share capital expressed in Euros and other special cases.
Tax Free Reserves
These are tax reserves created based on qualifying capital expenditures. All tax-free reserves, with the
exception of those formed in accordance with Law 1828/82, may be capitalized if taxed at 5% for the
parent company and 10% for the subsidiaries or if distributed will be subject to income tax at the prevailing
rate. There is no time restriction for their distribution. Tax free reserve formed in accordance with Law
1828/82 can be capitalized to share capital within a period of three years from its creation without any tax
obligation. In the event of distribution of the tax-free reserves of the Group, an amount of up to € 1 million,
approximately will be payable as tax at the tax rates currently prevailing.
Repurchase of Treasury Shares
From February 28, 2020 until March 19, 2020, the Company effected purchases of 96,353 own shares of
total value € 1,240,740.13 (or 0,09% of the share capital) with an average price € 12.88 per share. These
purchases were done according to the treasury stock purchase program following the decision by the
Annual Ordinary General Assembly of 6 June 2018.
From October 9, 2020 until December 31, 2020, the Company effected purchases of 135,874 own shares
of total value € 1,303,932.72 (or 0,12% of the share capital) with an average price € 9.6 per share. These
purchases were done according to the treasury stock purchase program following the decision by the
Annual Ordinary General Assembly of 17 June 2020.
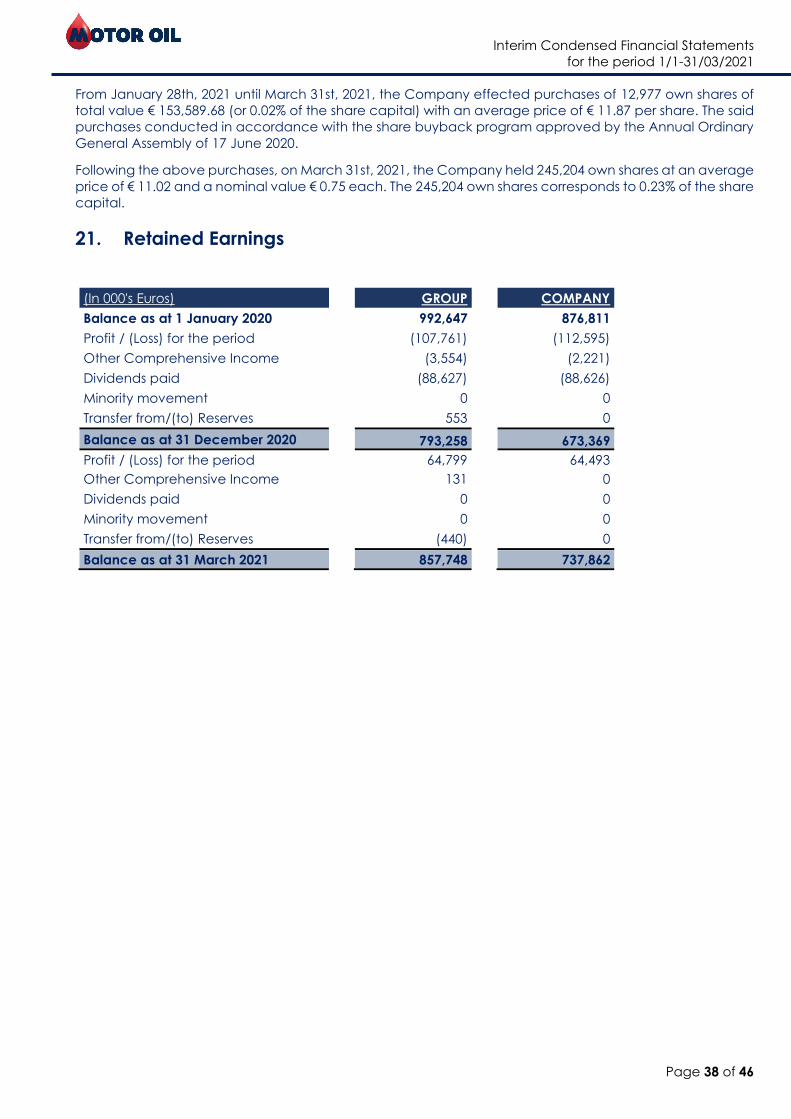
Interim Condensed Financial Statements
for the period 1/1-31/03/2021
Page 38 of 46
From January 28th, 2021 until March 31st, 2021, the Company effected purchases of 12,977 own shares of
total value € 153,589.68 (or 0.02% of the share capital) with an average price of € 11.87 per share. The said
purchases conducted in accordance with the share buyback program approved by the Annual Ordinary
General Assembly of 17 June 2020.
Following the above purchases, on March 31st, 2021, the Company held 245,204 own shares at an average
price of € 11.02 and a nominal value € 0.75 each. The 245,204 own shares corresponds to 0.23% of the share
capital.
21. Retained Earnings
(In 000's Euros) GROUP COMPANY
Balance as at 1 January 2020 992,647 876,811
Profit / (Loss) for the period (107,761) (112,595)
Other Comprehensive Income (3,554) (2,221)
Dividends paid (88,627) (88,626)
Minority movement 0 0
Transfer from/(to) Reserves 553 0
Balance as at 31 December 2020 793,258 673,369
Profit / (Loss) for the period 64,799 64,493
Other Comprehensive Income 131 0
Dividends paid 0 0
Minority movement 0 0
Transfer from/(to) Reserves (440) 0
Balance as at 31 March 2021 857,748 737,862
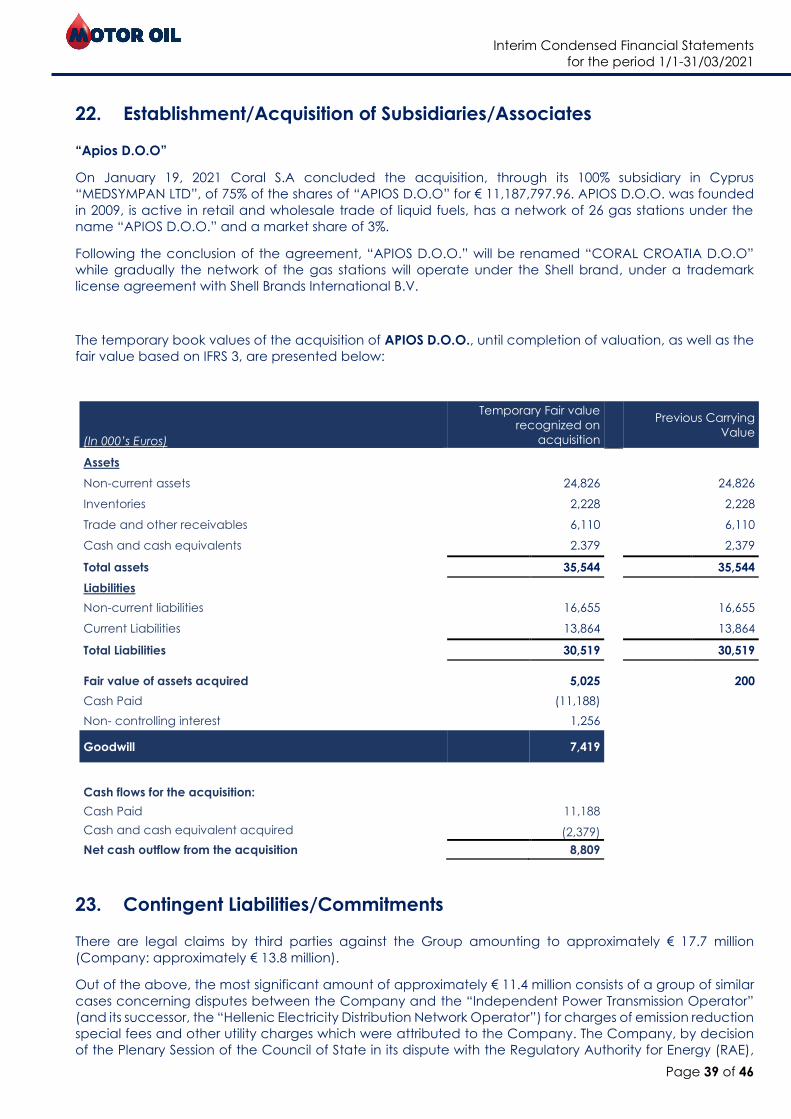
Interim Condensed Financial Statements
for the period 1/1-31/03/2021
Page 39 of 46
22. Establishment/Acquisition of Subsidiaries/Associates
“Apios D.O.O”
On January 19, 2021 Coral S.A concluded the acquisition, through its 100% subsidiary in Cyprus
“MEDSYMPAN LTD”, of 75% of the shares of “APIOS D.O.O” for € 11,187,797.96. APIOS D.O.O. was founded
in 2009, is active in retail and wholesale trade of liquid fuels, has a network of 26 gas stations under the
name “APIOS D.O.O.” and a market share of 3%.
Following the conclusion of the agreement, “APIOS D.O.O.” will be renamed “CORAL CROATIA D.O.O”
while gradually the network of the gas stations will operate under the Shell brand, under a trademark
license agreement with Shell Brands International B.V.
The temporary book values of the acquisition of APIOS D.O.O., until completion of valuation, as well as the
fair value based on IFRS 3, are presented below:
(In 000’s Euros)
Temporary Fair value
recognized on
acquisition
Previous Carrying
Value
Assets
Non-current assets 24,826 24,826
Inventories 2,228 2,228
Trade and other receivables 6,110 6,110
Cash and cash equivalents 2.379 2,379
Total assets 35,544 35,544
Liabilities
Non-current liabilities 16,655 16,655
Current Liabilities 13,864 13,864
Total Liabilities 30,519 30,519
Fair value of assets acquired 5,025 200
Cash Paid (11,188)
Non- controlling interest 1,256
Goodwill 7,419
Cash flows for the acquisition: Cash Paid 11,188 Cash and cash equivalent acquired (2,379)
Net cash outflow from the acquisition 8,809
23. Contingent Liabilities/Commitments
There are legal claims by third parties against the Group amounting to approximately € 17.7 million
(Company: approximately € 13.8 million).
Out of the above, the most significant amount of approximately € 11.4 million consists of a group of similar
cases concerning disputes between the Company and the “Independent Power Transmission Operator”
(and its successor, the “Hellenic Electricity Distribution Network Operator”) for charges of emission reduction
special fees and other utility charges which were attributed to the Company. The Company, by decision
of the Plenary Session of the Council of State in its dispute with the Regulatory Authority for Energy (RAE),
Interim Condensed Financial Statements
for the period 1/1-31/03/2021
Page 40 of 46
has been recognized as a self-generator of High Efficiency Electricity-Heat Cogeneration, with the right to
be exempted from charges of emission reduction special fees .
There are also legal claims of the Group against third parties amounting to approximately € 20.1 million
(Company: approximately € 0.1 million). No provision has been made as all above cases concern legal
claims where the final outcome cannot be currently estimated.
The Company and, consequently, the Group in order to complete its investments and its construction
commitments, has entered relevant contracts and purchase orders with construction companies, the non-
executed part of which, as at 31/03/2021, amounts to approximately € 8.1 million.
The Group companies have entered into contracts to purchase and sell crude oil and fuels, at current
prices in line with the international market effective prices at the time the transaction takes place.
The total amount of letters of guarantee given as security for Group companies’ liabilities as at 31/03/2021,
amounted to € 463.936 thousand. The respective amount as at 31/12/2020 was € 322,210 thousand.
The total amount of letters of guarantee given as security for the Company’s liabilities as at 31/03/2021,
amounted to € 388,733 thousand. The respective amount as at 31/12/2020 was € 183,694 thousand.
Companies with Un-audited Fiscal Years
The tax authorities have not performed a tax audit on “CYTOP SA” & “KEPED SA” for the fiscal year 2014
and for “CORAL PRODUCTS & TRADING” for fiscal years 2018 to 2020, thus the tax liabilities for those
companies have not yet finalized. At a future tax audit it is probable for the tax authorities to impose
additional tax which cannot be accurately estimated at this point of time. The Group however estimates
that this will not have a material impact on its financial position.
The tax audit for fiscal years 2009 and 2010 for CORAL GAS AEBEY has been completed based on
temporary tax audit reports and there are no material additional taxes expected for those years upon the
finalization of the tax audits.
There is an on-going tax audit by the tax authorities for NRG TRADING HOUSE S.A. for fiscal year 2017, for
MOTOR OIL for fiscal year 2016 and for AVIN OIL for the fiscal years 2015, 2017 and 2018. However it is not
expected that material liabilities will arise from these tax audits.
For the fiscal years from 2015 to 2019 MOH group companies that were obliged for a tax compliance audit
by the statutory auditors, have been audited by the appointed statutory auditors in accordance with art.
82 of L 2238/1994 and art. 65A of L4174/13 and have issued the relevant Tax Compliance Certificates. In
any case and according to Circ.1006/05.01.2016 these companies for which a Tax Compliance Certificate
has been issued are not excluded from a further tax audit by the relevant tax authorities. Therefore, the tax
authorities may perform a tax audit as well. However, the group’s management believes that the outcome
of such future audits, should these be performed, will not have a material impact on the financial position
of the Group or the Company.
Up to the date of approval of these financial statements, the group companies’ tax audit, by the statutory
auditors, for the fiscal year 2020 is in progress. However it is not expected that material liabilities will arise
from this tax audit.
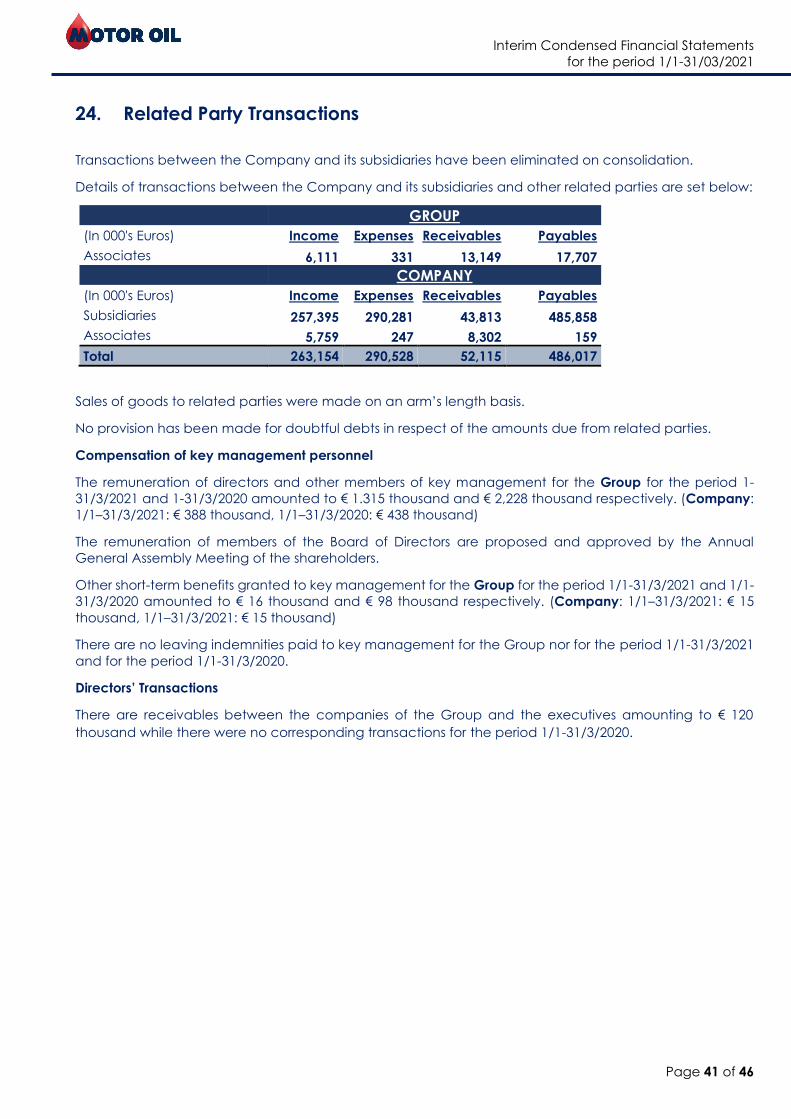
Interim Condensed Financial Statements
for the period 1/1-31/03/2021
Page 41 of 46
24. Related Party Transactions
Transactions between the Company and its subsidiaries have been eliminated on consolidation.
Details of transactions between the Company and its subsidiaries and other related parties are set below:
GROUP
(In 000's Euros) Income Expenses Receivables Payables
Associates 6,111 331 13,149 17,707
COMPANY
(In 000's Euros) Income Expenses Receivables Payables
Subsidiaries 257,395 290,281 43,813 485,858
Associates 5,759 247 8,302 159
Total 263,154 290,528 52,115 486,017
Sales of goods to related parties were made on an arm’s length basis.
No provision has been made for doubtful debts in respect of the amounts due from related parties.
Compensation of key management personnel
The remuneration of directors and other members of key management for the Group for the period 1-
31/3/2021 and 1-31/3/2020 amounted to € 1.315 thousand and € 2,228 thousand respectively. (Company:
1/1–31/3/2021: € 388 thousand, 1/1–31/3/2020: € 438 thousand)
The remuneration of members of the Board of Directors are proposed and approved by the Annual
General Assembly Meeting of the shareholders.
Other short-term benefits granted to key management for the Group for the period 1/1-31/3/2021 and 1/1-
31/3/2020 amounted to € 16 thousand and € 98 thousand respectively. (Company: 1/1–31/3/2021: € 15
thousand, 1/1–31/3/2021: € 15 thousand)
There are no leaving indemnities paid to key management for the Group nor for the period 1/1-31/3/2021
and for the period 1/1-31/3/2020.
Directors’ Transactions
There are receivables between the companies of the Group and the executives amounting to € 120
thousand while there were no corresponding transactions for the period 1/1-31/3/2020.
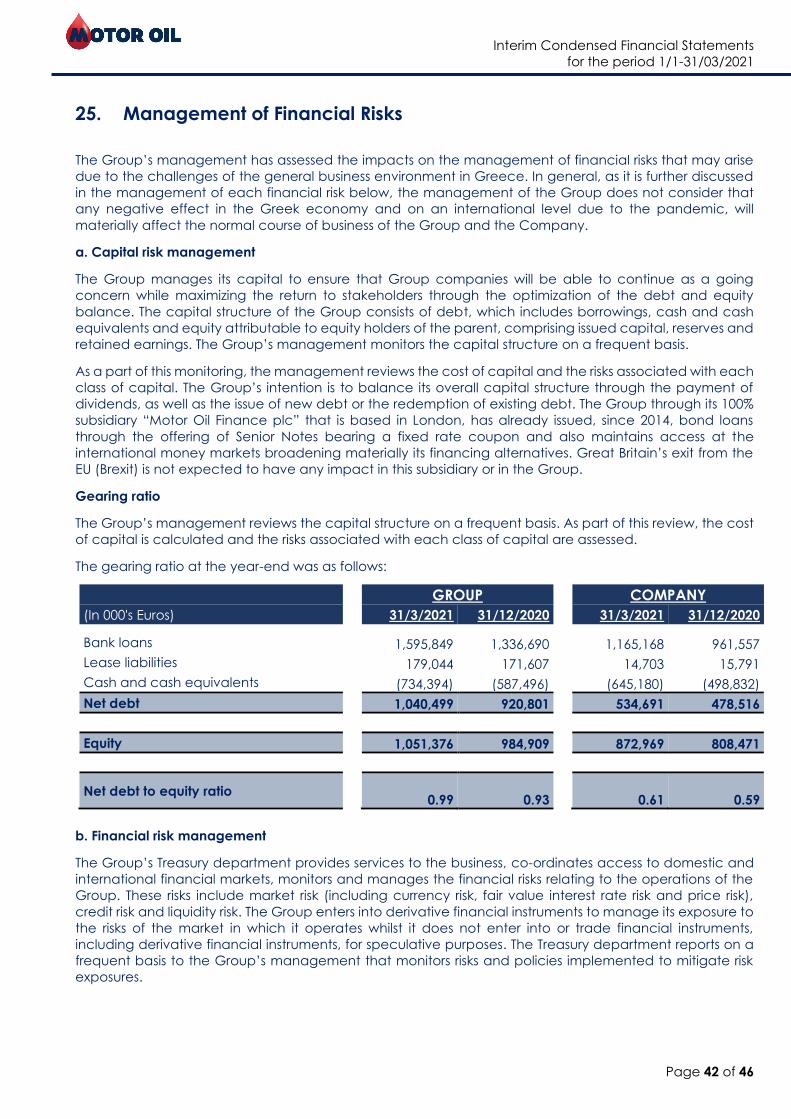
Interim Condensed Financial Statements
for the period 1/1-31/03/2021
Page 42 of 46
25. Management of Financial Risks
The Group’s management has assessed the impacts on the management of financial risks that may arise
due to the challenges of the general business environment in Greece. In general, as it is further discussed
in the management of each financial risk below, the management of the Group does not consider that
any negative effect in the Greek economy and on an international level due to the pandemic, will
materially affect the normal course of business of the Group and the Company.
a. Capital risk management
The Group manages its capital to ensure that Group companies will be able to continue as a going
concern while maximizing the return to stakeholders through the optimization of the debt and equity
balance. The capital structure of the Group consists of debt, which includes borrowings, cash and cash
equivalents and equity attributable to equity holders of the parent, comprising issued capital, reserves and
retained earnings. The Group’s management monitors the capital structure on a frequent basis.
As a part of this monitoring, the management reviews the cost of capital and the risks associated with each
class of capital. The Group’s intention is to balance its overall capital structure through the payment of
dividends, as well as the issue of new debt or the redemption of existing debt. The Group through its 100%
subsidiary “Motor Oil Finance plc” that is based in London, has already issued, since 2014, bond loans
through the offering of Senior Notes bearing a fixed rate coupon and also maintains access at the
international money markets broadening materially its financing alternatives. Great Britain’s exit from the
EU (Brexit) is not expected to have any impact in this subsidiary or in the Group.
Gearing ratio
The Group’s management reviews the capital structure on a frequent basis. As part of this review, the cost
of capital is calculated and the risks associated with each class of capital are assessed.
The gearing ratio at the year-end was as follows:
GROUP COMPANY
(In 000's Euros) 31/3/2021 31/12/2020 31/3/2021 31/12/2020
Bank loans 1,595,849 1,336,690 1,165,168 961,557
Lease liabilities 179,044 171,607 14,703 15,791
Cash and cash equivalents (734,394) (587,496) (645,180) (498,832)
Net debt 1,040,499 920,801 534,691 478,516
Equity 1,051,376 984,909 872,969 808,471
Net debt to equity ratio 0.99 0.93 0.61 0.59
b. Financial risk management
The Group’s Treasury department provides services to the business, co-ordinates access to domestic and
international financial markets, monitors and manages the financial risks relating to the operations of the
Group. These risks include market risk (including currency risk, fair value interest rate risk and price risk),
credit risk and liquidity risk. The Group enters into derivative financial instruments to manage its exposure to
the risks of the market in which it operates whilst it does not enter into or trade financial instruments,
including derivative financial instruments, for speculative purposes. The Treasury department reports on a
frequent basis to the Group’s management that monitors risks and policies implemented to mitigate risk
exposures.
Interim Condensed Financial Statements
for the period 1/1-31/03/2021
Page 43 of 46
c. Market risk
Due to the nature of its activities, the Group is exposed primarily to the financial risks of changes in foreign
currency exchange rates (see (d) below), interest rates (see (e) below) and to the volatility of oil prices
mainly due to the obligation to maintain certain level of inventories. The Company, in order to avoid
significant fluctuations in the inventories valuation is trying, as a policy, to keep the inventories at the lowest
possible levels. Furthermore, any change in the pertaining refinery margin, denominated in USD, affects the
Company’s gross margin. There has been no change to the Group’s exposure to market risks or the manner
in which it manages and measures these risks. Considering the conditions in the oil refining and trading
sector, as well as the negative economic environment in general, we consider the course of the Group
and the Company as satisfactory. The Group also through its subsidiaries in the Middle East, Great Britain,
Cyprus and the Balkans, aims to exploit its endeavors at international level and to further strengthen its
already solid exporting orientation.
COVID-19
With regard to the covid-19 pandemic outbreak and the subsequent measures adopted as a means to
prevent its spread, which resulted in the creation of a negative economic and social climate, both at
international and domestic level, and the consequent significant impact on the internationalized sector of
oil refining and trading of petroleum products since the beginning of the year 2020, the management of
the Company is knowledgeable that the sector of oil refining and trading of petroleum products, by
definition internationalized, belongs to those entrepreneurial categories notably impacted by the world
economy slowdown as a result of the spread of the coronavirus.
It is noted that the Company sales consistently exceed the annual production capacity of its Refinery by
a significant percent and at the same time the Company delivers refining margins at the top end of the
sector. Nevertheless, the reduction of the sales volume due to the lower demand, combined with the
tightening of benchmark refining margins and above all the sharp drop of crude and petroleum product
prices had a negative impact . It must also be noted that as of today the Company has taken all necessary
measures, as analyzed next, to secure the uninterrupted supply of its Refinery with crude and feedstocks
as well as its usual production operability, while no disruptions are expected in the foreseeable future. At
the same time all the retail fuel outlets and other business segments of the Group remain fully operational.
The management of the Company and the Group constantly monitors and carefully evaluates the
circumstances and the probable implications to the operations of the Group taking initiatives believed to
tackle in the best possible manner the impact due to the pandemic.
More specifically, the management of the Company has secured additional credit of approximately Euro
370 million, since 2020, regarded as adequate for the uninterrupted continuation of its operations and the
completion of the programmed capital expenditure projects.
Moreover since 2020 and until now, the Company and all major Greek based subsidiaries of the Group
utilized the new fiscal and tax policies and regulations of the state regarding non-payment of the tax
advance thus securing additional liquidity etc. Furthermore, the subsidiaries of the Group which rent retail
fuel outlets, utilized the relevant clause regarding the reduction of rental rates due to the covid-19.
It is also noted that since the early stages of witnessing the coronavirus incidents in the domestic front, the
Group set out emergency plans in order to secure the continuation of its core business and the
uninterrupted provision of its services.
Based on the above, the Group took all the necessary measures for the protection of the health of all its
employees to avoid the coronavirus being spread in its premises.
Specifically:
- New procedures were established and guidelines were provided to the personnel, aiming in particular to
minimize immediate contact, while the body temperature of each employee is taken and checks of mask
application is performed on a daily basis to all the staff of the company premises and the working areas in
general.
- Within the context of remote working arrangements, the employees are encouraged and advised to
work from home utilizing the capabilities provided by the IT systems and software applications. At the same
time, the appropriate procedures for the availability of the key personnel of the Company and the Group
are applied.
Interim Condensed Financial Statements
for the period 1/1-31/03/2021
Page 44 of 46
-Guidelines were provided and written procedures issued to the personnel aiming to limit the business
trips and physical participation to meetings and the utilization of means such as mobile phone devices,
teleconferencing practices, electronic correspondence and communication were promoted.
- The personnel is supplied on a daily basis with protection equipment (protective masks) as well as
disinfectants.
- Hygiene and sterilization procedures are applied to all working premises.
- All employees are subjected to virus detection tests while sampling tests are preformed regularly.
- The Group donated equipment of Euro 1.2 million to Intensive Care Units in order to support the National
Health System. Further to this the Group spent for the health and safety of its personnel Euro 2.6 million for
the protection from covid-19.
- A vaccination program for all personnel has been activated for the influenza virus
The Group adjusts all the procedures mentioned above on a continuous basis monitoring the constantly
changing pandemic circumstances.
The Company considers that the gradual restoration of the normal conditions in the country and on a
worldwide level, combined with the political, fiscal and tax relieving actions taken by the EU and Greece
have already significantly restored the previous year’s negative financial results which in the first trimester
of 2021 turned into profit for the Company and the Group.
d. Foreign currency risk
Due to the use of the international Platt’s prices in USD for oil purchases/sales, exposures to exchange rate
fluctuations may arise for the Company’s profit margins. The Company minimises foreign currency risks
through physical hedging, mostly by monitoring assets and liabilities in foreign currencies.
As of March 31, 2021, the Group had Assets in foreign currency of 523.9 million USD and Liabilities of 506.1
million USD.
Given an average USD/Euro fluctuation rate of 5%, the potential Gain/Loss as a result of the Group’s
exposure to Foreign Currency is not exceeding the amount of € 0.76 million.
e. Interest rate risk
The Group has access to various major domestic and international financial markets and manages to have
borrowings with competitive interest rates and terms. Hence, the operating expenses and cash flows from
financing activities are not materially affected by interest rate fluctuations.
f. Credit risk
The Group’s credit risk is primarily attributable to its trade and other receivables.
The Group’s trade receivables are characterized by a high degree of concentration, due to a limited
number of customers comprising the clientele of the parent Company. Most of the customers are
international well-known oil companies. Consequently, the credit risk is limited to a great extent. The Group
companies have signed contracts with their clients, based on the course of the international oil prices. In
addition, the Group, as a policy, obtains letters of guarantee from its clients in order to secure its
receivables, which as at 31/03/2021 amounted to Euro 8.2 million. As far as receivables of the subsidiary
sub groups “AVIN OIL S.A.”, “CORAL A.E.” and “L.P.C. S.A.” and the subsidiaries “CORAL GAS A.E.B.E.Y.”
and “NRG TRADING HOUSE S.A.” are concerned, these are spread in a wide range of customers and
consequently there is no material concentration and the credit risk is limited. The Group manages its
domestic credit policy in a way to limit accordingly the credit days granted in the local market, in order to
minimise any probable domestic credit risk.
g. Liquidity risk
Liquidity risk is managed through the proper combination of cash and cash equivalents and available
bank loan facilities. In order to address such risks, the Group’s management monitors the balance of cash
and cash equivalents and ensures available bank loans facilities, maintaining also increased cash
balances. Moreover, the major part of the Group’s borrowings is long term borrowings which facilitates
liquidity management.
Interim Condensed Financial Statements
for the period 1/1-31/03/2021
Page 45 of 46
As at today the Company has available total credit facilities of approximately € 1.59 billion and total
available bank Letter of Credit facilities up to approximately $ 923 million.
Going Concern
Despite the adverse market conditions since 2020, due to covid-19 and the lack of stability in the current
period,the Group’s management considers that the Company and the Group have adequate resources
that ensure the smooth continuance of the business of the Company and the Group as a “Going Concern”
in the foreseeable future. Namely:
• Market conditions become more favorable while refinery margins and sale volumes show an
increasing trend
• 2021 Q1 for the Group and the Company is profitable
• The Group and the Company have secured since 2020 additional credit lines with low interest
rates
• The market capitalization of the Company in ATHEX remains almost double its net equity value
• Tangible fixed assets and the right of use assets at the refinery as well as at the commercial
subsidiaries are in full operation while the refinery operated and continues to operate at full
capacity
• The capital expenditure program of the Group and the Company is developing according to
plan
Interim Condensed Financial Statements
for the period 1/1-31/03/2021
Page 46 of 46
26. Events after the Reporting Period
Within April 2021 “MOTOR OIL (HELLAS) S.A.” acquired the rest 10% minority share in the subsidiary “NRG
TRADING HOUSE ΕΝΕΡΓΕΙΑΚΗ S.Α.” for € 1,850,000 and now has 100% control in “NRG TRADING HOUSE
ΕΝΕΡΓΕΙΑΚΗ Α.Ε.”
Within May 2021 also, we concluded with the acquisition by the 100% subsidiary “TEFORTO HOLDINGS
LIMITED” of the aggregate share capital of six companies in possession of a portfolio of twelve wind parks
out of which eleven for an aggregate 220 MW capacity in full operation and one for 20 MW capacity
under construction. The said six companies are also in possession of a portfolio of licenses to be developed
for an aggregate capacity of 650 MW. The cash consideration for this transaction was € 117.1 million.
On 31 May 2021 “MOTOR OIL (HELLAS) S.A.” sold the 96,353 own shares it had acquired, in the context of
the share buyback program pursuant to the decision of the Annual Ordinary General Assembly dated 6
June 2018 at an average selling price per share 13.50 Euro.
Also, within June 2021 “MOTOR OIL (HELLAS) S.A.” in cooperation with “GEK TERNA” announced their joint
development (50%/50%), construction, and operation of a new modern Combined Cycle Gas Turbine
(CCGT) power plant fueled with natural gas of 877 MW capacity located in the industrial area of Komotini.
The project is estimated at EUR 375 million.
Besides the above, there are no events that could have a material impact on the Group’s and Company’s
financial structure or operations that have occurred since 1/4/2021 up to the date of issue of these financial
statements.
This document has been prepared by Deloitte Certified Public Accountants Societe Anonyme.
Deloitte Certified Public Accountants Societe Anonyme, a Greek company, registered in Greece with registered number 0001223601000 and its registered office at
Marousi, Attica, 3a Fragkokklisias & Granikou str., 151 25, is one of the Deloitte Central Mediterranean S.r.l. (“DCM”) countries. DCM, a company limited by guarantee
registered in Italy with registered number 09599600963 and its registered office at Via Tortona no. 25, 20144, Milan, Italy is one of the Deloitte NSE LLP geographies.
Deloitte NSE LLP is a UK limited liability partnership and member firm of DTTL, a UK private company limited by guarantee.
DTTL and each of its member firms are legally separate and independent entities. DTTL, Deloitte NSE LLP and Deloitte Central Mediterranean S.r.l. do not provide services
to clients. Please see www.deloitte.com/about to learn more about our global network of member firms.
TRUE TRANSLATION FROM THE ORIGINAL IN GREEK
Independent Auditor’s Review Report
To the Shareholders of the Company MOTOR OIL (HELLAS) CORINTH REFINERIES S.A.
Report on Review of Interim Financial Information
Introduction
We have reviewed the accompanying condensed separate and consolidated statement of financial position of the Company MOTOR OIL (HELLAS) CORINTH REFINERIES S.A. as of March 31, 2021 and the related condensed separate and consolidated statements of profit or loss and other comprehensive income, changes in equity and cash flows for the three-month period then ended, and the selective explanatory notes that comprise the interim financial information.
Management is responsible for the preparation and fair presentation of this interim condensed financial information in accordance with International Financial Reporting Standards as adopted by the European Union and applied to interim financial reporting (“IAS 34”). Our responsibility is to express a conclusion on this interim condensed financial information based on our review.
Scope of Review We conducted our review in accordance with the International Standard on Review Engagements 2410, “Review of Interim Financial Information performed by the Independent Auditor of the Entity”. A review of interim financial information consists of making inquiries, primarily of persons responsible for financial and accounting matters, and applying analytical and other review procedures. A review is substantially less in scope than an audit conducted in accordance with International Standards on Auditing as they have been transposed in Greek Legislation and consequently does not enable us to obtain assurance that we would become aware of all significant matters that might be identified in an audit. Accordingly we do not express an audit opinion.
Conclusion Based on our review, nothing has come to our attention that causes us to believe that the accompanying interim condensed financial information is not prepared, in all material respects, in accordance with IAS 34.
Athens, June 15, 2021
The Certified Public Accountant
Tilemachos Ch. Georgopoulos Reg. No. SOEL: 19271 Deloitte Certified Public Accountants S.A. 3a Fragkokklisias & Granikou str., 151 25 Marousi Reg. No. SOEL: E 120
Deloitte Certified Public Accountants S.A. 3a Fragkokklisias & Granikou str. Marousi Athens GR 151-25 Greece Tel: +30 210 6781 100 www.deloitte.gr