initiating cells NIH Public Access 1 Siyuan Zheng Jun...
21
A high Notch pathway activation predicts response to γ secretase inhibitors in proneural subtype of glioma tumor initiating cells Norihiko Saito 1 , Jun Fu 1 , Siyuan Zheng 2 , Jun Yao 1 , Shuzhen Wang 1 , Diane D. Liu 3 , Ying Yuan 3 , Erik P. Sulman 4 , Frederick F. Lang 5 , Howard Colman 1,6 , Roel G. Verhaak 2 , W. K. Alfred Yung 1 , and Dimpy Koul 1 1 Brain Tumor Center, Department of Neuro-Oncology, The University of Texas MD Anderson Cancer Center, Houston, Texas, USA 2 Department of Bioinformatics and Computational Biology, The University of Texas MD Anderson Cancer Center, Houston, Texas, USA 3 Department of Biostatistics, The University of Texas MD Anderson Cancer Center, Houston, Texas, USA 4 Department of Radiation Oncology, The University of Texas MD Anderson Cancer Center, Houston, Texas, USA 5 Department of Neurosurgery, The University of Texas MD Anderson Cancer Center, Houston, Texas, USA Abstract Genomic, transcriptional, and proteomic analyses of brain tumors reveal subtypes that differ in pathway activity, progression, and response to therapy. However, a number of small molecule inhibitors under development vary in strength of subset and pathway-specificity, with molecularly targeted experimental agents tending toward stronger specificity. The Notch signaling pathway is an evolutionarily conserved pathway that plays an important role in multiple cellular and developmental processes. We investigated the effects of Notch pathway inhibition in glioma tumor initiating cell (GIC, hereafter GIC) populations using γ secretase inhibitors. Drug cytotoxicity testing of 16 GICs showed differential growth responses to the inhibitors, stratifying GICs into responders and non-responders. Responder GICs had an enriched proneural gene signature in comparison to non-responders. Also gene set enrichment analysis revealed 17 genes set representing active Notch signaling components NOTCH1, NOTCH3, HES1, MAML1, DLL-3, JAG2 etc., enriched in responder group. Analysis of TCGA expression data set identified a group (43.9%) of tumors with proneural signature showing high Notch pathway activation suggesting γ- secretase inhibitors might be of potential value to treat that particular group of proneural GBM. Inhibition of Notch pathway by γ-secretase inhibitor treatment attenuated proliferation and self- renewal of responder GICs and induces both neuronal and astrocytic differentiation. In vivo evaluation demonstrated prolongation of median survival in an intracranial mouse model. Our results suggest that proneural GBM characterized by high Notch pathway activation may exhibit greater sensitivity to γ-secretase inhibitor treatment, holding a promise to improve the efficiency of current glioma therapy. Requests for reprints: Dimpy Koul, Department of Neuro-Oncology, Unit 1001, The University of Texas MD Anderson Cancer Center, 1515 Holcombe Blvd., Houston, TX 77030. Tel: 713-834-6202; Fax: 713-794-4999; [email protected]. 6 Current address: Department of Neuro-Oncology, University of Utah Huntsman Cancer Center, Salt Lake City, UT, USA. NIH Public Access Author Manuscript Stem Cells. Author manuscript; available in PMC 2015 January 01. Published in final edited form as: Stem Cells. 2014 January ; 32(1): 301–312. doi:10.1002/stem.1528. NIH-PA Author Manuscript NIH-PA Author Manuscript NIH-PA Author Manuscript
Transcript of initiating cells NIH Public Access 1 Siyuan Zheng Jun...
A high Notch pathway activation predicts response to γsecretase inhibitors in proneural subtype of glioma tumorinitiating cells
Norihiko Saito1, Jun Fu1, Siyuan Zheng2, Jun Yao1, Shuzhen Wang1, Diane D. Liu3, YingYuan3, Erik P. Sulman4, Frederick F. Lang5, Howard Colman1,6, Roel G. Verhaak2, W. K.Alfred Yung1, and Dimpy Koul11Brain Tumor Center, Department of Neuro-Oncology, The University of Texas MD AndersonCancer Center, Houston, Texas, USA2Department of Bioinformatics and Computational Biology, The University of Texas MD AndersonCancer Center, Houston, Texas, USA3Department of Biostatistics, The University of Texas MD Anderson Cancer Center, Houston,Texas, USA4Department of Radiation Oncology, The University of Texas MD Anderson Cancer Center,Houston, Texas, USA5Department of Neurosurgery, The University of Texas MD Anderson Cancer Center, Houston,Texas, USA
AbstractGenomic, transcriptional, and proteomic analyses of brain tumors reveal subtypes that differ inpathway activity, progression, and response to therapy. However, a number of small moleculeinhibitors under development vary in strength of subset and pathway-specificity, with molecularlytargeted experimental agents tending toward stronger specificity. The Notch signaling pathway isan evolutionarily conserved pathway that plays an important role in multiple cellular anddevelopmental processes. We investigated the effects of Notch pathway inhibition in glioma tumorinitiating cell (GIC, hereafter GIC) populations using γ secretase inhibitors. Drug cytotoxicitytesting of 16 GICs showed differential growth responses to the inhibitors, stratifying GICs intoresponders and non-responders. Responder GICs had an enriched proneural gene signature incomparison to non-responders. Also gene set enrichment analysis revealed 17 genes setrepresenting active Notch signaling components NOTCH1, NOTCH3, HES1, MAML1, DLL-3,JAG2 etc., enriched in responder group. Analysis of TCGA expression data set identified a group(43.9%) of tumors with proneural signature showing high Notch pathway activation suggesting γ-secretase inhibitors might be of potential value to treat that particular group of proneural GBM.Inhibition of Notch pathway by γ-secretase inhibitor treatment attenuated proliferation and self-renewal of responder GICs and induces both neuronal and astrocytic differentiation. In vivoevaluation demonstrated prolongation of median survival in an intracranial mouse model. Ourresults suggest that proneural GBM characterized by high Notch pathway activation may exhibitgreater sensitivity to γ-secretase inhibitor treatment, holding a promise to improve the efficiencyof current glioma therapy.
Requests for reprints: Dimpy Koul, Department of Neuro-Oncology, Unit 1001, The University of Texas MD Anderson CancerCenter, 1515 Holcombe Blvd., Houston, TX 77030. Tel: 713-834-6202; Fax: 713-794-4999; [email protected] address: Department of Neuro-Oncology, University of Utah Huntsman Cancer Center, Salt Lake City, UT, USA.
NIH Public AccessAuthor ManuscriptStem Cells. Author manuscript; available in PMC 2015 January 01.
Published in final edited form as:Stem Cells. 2014 January ; 32(1): 301–312. doi:10.1002/stem.1528.
NIH
-PA Author Manuscript
NIH
-PA Author Manuscript
NIH
-PA Author Manuscript
KeywordsNotch activation; proneural genes; γ secretase inhibitors; Glioma
IntroductionGlioblastoma (GBM) is the most intractable cerebral tumor; it progresses rapidly,demonstrating high resistance to both radiotherapy and most chemotherapeutic agents (1–3).Traditional genomic studies of GBMs have revealed common alterations in canonical centralsignaling pathways (4–8). Initial attempts at gene expression profiling have demonstratedthe heterogeneous nature of glial tumors that were previously thought to represent a singletumor type. Analysis of large-scale genomic data sets has started to yield results fordiscriminating subgroups of patients with GBM who seem to respond differently tochemotherapeutic agents (9–11). As new-generation drugs are developed that target specificprotein targets, personalized treatment for brain cancer may ultimately move beyond a geneexpression-based molecular classification model towards the identification of small subsetsof patients who are likely to respond to a particular agent.
Recent studies suggest that glioma tumor-initiating cell (GIC) have the capacity torepopulate tumors (12–14) and mediate radio- and chemo resistance (15, 16). However, themechanism by which GICs maintain their immature stem-like state or, alternatively, becomecommitted to differentiation is poorly understood (13, 14). The Cancer Genome Atlas(TCGA) Network described genomic abnormalities and gene expression-based molecularsubtypes of GBM that showed a strong relationship between subtypes, genomic alterations,and different neural lineages (17). Future studies are required to elucidate the intricaterelationship between tumor subtypes and treatment response. We have thus embarked on acomprehensive effort to detect expression signatures that are associated with response totherapy, and these signatures may allow prospective selection of patients with a highlikelihood of response to therapy.
The Notch signaling pathway is an evolutionarily conserved pathway that plays an importantrole in multiple cellular and developmental processes, including cell fate decision,differentiation, proliferation, survival, angiogenesis, and migration (18–20). The Notchprotein comprises both extracellular and intracellular regions. The extracellular region of theNotch receptor contains epidermal growth factor-like repeats essential for ligand bindingand three copies of the juxta membrane repeats motif, known as the Lin-12 Notch repeats.Four Notch receptors (Notch1-4) and five ligands (Jagged1, Jagged2, and Delta-like 1, 3,and 4) have been identified in mammals. When the Notch receptor is triggered by the ligand,it promotes two proteolytic cleavage events at the Notch receptor. The first proteolytic stepis carried out by ADAM17 at site S2 in the extracellular region. The cleaved extracellularsubunit of the receptor is trans-endocytosed by the neighboring ligand-expressed cells.Binding of extracellular ligand to Notch also induces the second proteolytic cleavage eventat the transmembrane region by a γ-secretase at site S3. This cleavage can release the Notchintracellular domain (NICD) (18, 19).
Recent studies indicate that the Notch signaling pathway regulates neural stem cells (21,22)and several cancer cells with high Notch activity (23–25). Among central nervous systemtumors, Notch signaling components have been found to be deregulated in meningiomas(26), and Notch activity has been observed to be critical in medulloblastomas (27). Inglioma cells and GICs, the Notch signaling pathway plays an important role in proliferation,stem cell maintenance, cell differentiation and tumorigenesis (28–34). γ-Secretase inhibitorrepressed the growth of several cancer cell types, such as breast cancer (25), leukemia (24),
Saito et al. Page 2
Stem Cells. Author manuscript; available in PMC 2015 January 01.
NIH
-PA Author Manuscript
NIH
-PA Author Manuscript
NIH
-PA Author Manuscript
and glioma (33, 34). Therefore, the pharmacological inhibition of Notch signaling pathwayhas potential as a therapy for cancer.
In this study, we investigated the effects of Notch pathway inhibition on GIC growth usingcommercially available inhibitors of γ-secretase (DAPT, BMS-708163 and RO4929097).The cells responses to the γ-secretase inhibitor treatment divided GICs into groups ofresponders and non-responders based on their 50% growth inhibitory concentration(IC50)profiles. Furthermore, the GICs’ response to γ-secretase inhibitors was associated with theirNotch signaling activity. γ-Secretase inhibitors impaired stem cell maintenance and inducedneuronal and astrocytic differentiation. Notch-1 inhibition accounts for part of the γ-secretase inhibitors activity. Notch inhibition by short hairpin RNA (shRNA) knockdowninduced only neuronal differentiation, whereas γ-secretase inhibitors induced both neuronaland astrocytic differentiation. Thus, we have here identified a responder signature for agroup of GICs that can be targeted by Notch inhibitors, and this may allow the selection ofpatients with a high likelihood of responding to this therapy.
Materials and MethodsCell lines and reagents
The GIC cell lines were established by isolating neurosphere-forming cells from surgicalspecimens of human GBM using a method described previously (35). The study wasapproved by the Institutional Review Board of MD Anderson Cancer Center, and informedconsent was obtained from all subjects. These GICs were cultured as GBM neurospheres inDMEM/F12 medium containing B27 supplement (Invitrogen) and basic fibroblast growthfactor and epidermal growth factor (20 ng/ml each). The γ secretase inhibitors N-[N-(3,5-difluorophenacetyl)-1-alanyl]-S-phenylglycine t-butyl ester (DAPT), BMS-708163 andRO4929097 were purchased from Selleck Chemicals (Houston, TX). For in vitro use, all theinhibitors were dissolved in dimethyl sulfoxide (DMSO; Sigma-Aldrich, St. Louis, MO) to aconcentration of 10 mmol/L, stored at −20°C, and further diluted to an appropriate finalconcentration in DMEM/F12 medium at the time of use. For in vivo studies, RO4929097was formulated as a suspension in 1.0% carboxymethyl cellulose with 0.2% Tween 80 fororal administration.
Cell proliferation assayBriefly, cells were treated in triplicate for 72 hours with seven doses each of DAPT,BMS-708163 and RO4929097. Cell proliferation was estimated using the CellTiter-Blue(Promega, Madison, WI) viability assay. The IC50 value was calculated as the mean drugconcentration required for inhibiting cell proliferation by 50% compared with vehicle-treated controls.
Gene arrays, bioinformaticsGICs were divided into responder and non-responder groups by their responses to γsecretase inhibitor treatments. To identify differentially expressed pathways betweenresponder and non-responder cell lines, we performed gene set enrichment analysis (GSEA)(36) using canonical pathways from the Kyoto Encyclopedia of Genes and Genomes (37)(downloaded from MSigDB, http://www.broadinstitute.org/gsea/msigdb/index.jsp). Coreenrichment genes were used as 17 gene signatures to represent the Notch pathway.
Affymetrix HGU133A CEL files of 533 TCGA GBM samples were downloaded fromTCGA data portal and preprocessed using the Aroma (http://www.aroma-project.org/package version v2.8.0)(38). Applying single sample GSEA (ssGSEA)(39), we classifiedthe GBMs into proneural, neural, classical and mesenchymal subtypes (17). To illustrate the
Saito et al. Page 3
Stem Cells. Author manuscript; available in PMC 2015 January 01.
NIH
-PA Author Manuscript
NIH
-PA Author Manuscript
NIH
-PA Author Manuscript
expression pattern of the Notch pathway in cell lines and clinical samples, we projected the17-gene signature to the cell line gene expression data set and TCGA data set.
Western blot analysisCells were harvested in lysis solution as previously described (40) and subjected to Westernblotting. Membranes were probed with the following primary antibodies: Anti-Notch-1,anti-Cleaved Notch-1 (all from Cell Signaling, Boston, MA), anti-Hes-1, anti-Hes-5 (allfrom Millipore), and anti-Hes-3 (Sigma-Aldrich). Anti-β-actin antibody was purchased fromSigma and used as loading control.
Neurosphere formation assayFor the primary neurosphere formation assay, GICs were seeded in 96-well plates (100 cells/well) and were incubated with various concentrations of γ-secretase inhibitors (DAPT 10μM, BMS-708163 2 μM and RO4929097 2 μM) for 7 days. For the secondary neurosphereformation assay, primary neurospheres were dissociated into single cells and 50 such cellswere in each well of 96-well plates in the absence of inhibitors. After 7 days, totalneurosphere numbers were counted under a dissection microscope using 4×4 objectivemagnification.
Cell Growth AssayGICs were seeded in 6-well plates (1×10⁵ cells/well). Cell numbers were counted using ahemocytometer and cell were counted every day for 7 days. Experiment was repeated threetimes and the average value was reported.
Indirect immunofluorescenceImmunofluorescence staining was performed as described previously (41). Cells wereseeded at a concentration of 2 × 10⁵ cells/well in 6-well plates with polylysine-coatedcoverslips inside and left for 24 hours in the incubator. The following day, cells were treatedwith the indicated dose of γ-secretase inhibitors (DAPT, BMS-708163 and RO4929097) for5 days, media were aspirated, and the cells were washed with phosphate-buffered saline(PBS) once, before being fixed with 4% formaldehyde in PBS for 20 minutes. After anotherPBS wash, the cells were permeabilized with 0.1% Triton X-100 in PBS for 5 minutes andthen blocked with 5% goat serum in PBS (containing 0.1% Tween 20) for 1 hour. Cells werethen incubated with primary antibodies (Anti-Nestin and anti-GFAP from Cell Signaling,anti-CNPase from Millipore, and anti-TuJ-1 from Sigma-Aldrich) overnight at 4°C. After 2washes with PBS (containing 0.1% Tween 20), the cells were incubated with the indicatedfluorescently labeled secondary antibody in the dark at room temperature for 1 hour. Thecells were counterstained with Vecta shield sealant containing 4,6-diamidino-2-phenylindole(DAPI) (Vector Laboratories, California, USA) and examined under a confocal laser-scanning microscope (Carl Zeiss Microscopy). Pictures were scanned with a DFC340FXcamera. The percentage of positively stained cells in each section was determined at amagnification of 400 by counting 500 cells in a randomly selected field.
Knockdown of Notch-1 by lentiviral shRNALentiviral vector encoding shRNA for Notch-1 was purchased from Genecopoiea Inc.(Rockville, MD). The lentiviral vector pLKO.1-mediated expression of shRNA for targetinghuman Notch-1 was performed according to the manufacturer’s instructions. Briefly,lentiviral particles expressing targeting or control scramble shRNA were produced inHEK293FT cells with the mixed set of packing plasmids, and the viruses were concentratedand titered as previously described (42). GSC35 cells were infected with the Notch-1shRNA. Produced lentiviruses were concentrated using the Centricon Plus-20 centrifugal
Saito et al. Page 4
Stem Cells. Author manuscript; available in PMC 2015 January 01.
NIH
-PA Author Manuscript
NIH
-PA Author Manuscript
NIH
-PA Author Manuscript
filter device (Millipore). To ensure the same number of lentiviral particles were used in eachexperiment, produced lentiviral stock was titered and stored at −80°C. For in vitro infectionof GICs with the lentivirus, we disaggregated cultured tumorspheres prior to infection inorder to increase the infection efficiency and uniformity. To infect target cells bylentiviruses, we exposed GSC35 24 hours. Cells were washed and then cultured with regularcomplete medium for 2 additional days in the presence of 2.5 μg/μl puromycin. Finally, thecells were washed and analyzed for protein expression by Western blotting.
RNA extraction and reverse transcription polymerase chain reaction (RT-PCR)Total RNA was extracted from GICs with the RNeasy Mini kit (Qiagen, Valencia, CA),according to the manufacturer’s instructions. RT-PCR was performed with SuperScript IIIOne-Step RT-PCR System with Platinum Taq DNA Polymerase (Invitrogen, Grand Island,NY), according to the manufacturer’s instructions.
Animal studiesMice were maintained in a pathogen-free environment and used in accordance with the MDAnderson Animal Care and Use Guidelines. We examined the antitumor efficacy ofRO4929097 in intracranial xenografts derived from GSC35. Nude (nu/nu) 6- to 8-week-oldmice (n = 18) were obtained from the MD Anderson breeding facility. In this study, weimplanted 5 × 10⁵ GSC35 cells in DMEM/F12 serum-free media (SFM; 5 μL) intracraniallyinto the caudate nucleus of each mouse using a guide-screw system, as described previously(43) and then randomly divided the mice into 3 groups of 6 mice each. Starting on day 4after the tumor cells were implanted, mice were treated once per day by oral gavage with 10or 20 mg/kg RO4929097 in 1.0% carboxymethyl cellulose with 0.2% Tween 80 or 1.0%carboxymethyl cellulose with 0.2% Tween 80 alone (control) on a 5-days-on, 2-days-offschedule for 4 weeks. Mice were monitored daily and euthanized when they becamemoribund. Then, the whole brain was extracted for rapid freezing in liquid nitrogen andstorage at −80°C. At necropsy, all organs were analyzed grossly and microscopically toassess tolerability at the tested doses.
Immunohistochemical stainingSections (5 μm thick) of formalin-fixed, paraffin-embedded whole brain from controlvehicle- and RO4929097–treated animal specimens were stained with anti-Notch-1, anti-NICD, anti-Nestin, anti-Ki-67 (all from Cell Signaling), anti-Hes-1 (Millipore), and anti-TuJ1 (Sigma-Aldrich). The sections were visualized by using a diaminobenzidine substratekit. The slides were examined under a bright-field microscope.
Statistical analysisStatistical analysis was performed using the Student’s unpaired t–test. Results are presentedas the mean of at least three independent experiments. Survival analysis was performedusing the log-rank analysis module in SPSS 10.0 (SPSS Inc.). Differences were consideredsignificant at p<0.05 for all comparisons.
ResultsGICs exhibit differential sensitivities to γ secretase inhibitors
We quantified the sensitivity in a panel of 16 cell-lines to γ secretase inhibitors bymeasuring the concentration needed for each compound to inhibit proliferation by 50%(designated the IC50, the half maximal inhibitory concentration) after 72 hours of continuousexposure. Γ secretase inhibitors effectively showed dose-dependent growth inhibition ofGICs (Fig. 1A). Representative waterfall plots showing responses to the γ secretase
Saito et al. Page 5
Stem Cells. Author manuscript; available in PMC 2015 January 01.
NIH
-PA Author Manuscript
NIH
-PA Author Manuscript
NIH
-PA Author Manuscript
inhibitors are shown in Figure 1B; they reveal groups of cells showing differential responsesto γ secretase inhibitors, dividing the GICs into a responder group and a non-respondergroup. Responder group was defined by the cell lines showing an IC50 values rangingbetween 5–15 μmol/L for DAPT and 0.5–2 μmol/L for BMS-708163 and RO4929097. GICsshowing IC50 values above 5–15 μmol/L for DAPT and 0.5–2 μmol/L for BMS-708163 andRO4929097 were considered as non-responders.
We studied the proliferative potential and in-vitro tumorogenicity of responder (GSC13 andGSC35) and non-responder (GSC2 and GSC20) GICs. All the responder cell lines and non-responder cell lines showed similar exponential growth pattern during 7 days of growthcurve with GSC35 a responder cell line with slightly slower growth rate (Supplemental Fig.S1). In an in-vitro tumorigenicity assay as assessed by the ability to form primaryneurospheres, all 4 GICS (responder: GSC 35 and GSC13 and non-responder: GSC2 andGSC20) showed similar neurosphere formation ability showing that the GICs hadtumorigenic potential in-vitro(Supplemental Fig. S2). The in-vivo biological behaviors oftwo groups were studied by injecting cells orthotopically into mouse brain and GICs fromtwo groups (responder: GSC 35 and GSC13 and non-responder GSC2 and GSC20) formedtumors in mice clearly showing that both responders and non-responders are tumorigenic.We also show that in-vivo tumors from responder GICs exhibit proneural characterstics asshown by OLIG2 and Nestin positive staining where as non-responder GICs tumors showmesenchymal marker YKL-40 (Supplementary figure S2).
γ Secretase inhibitor responder GICs are enriched in proneural signatureWe compared the expression profile of responders and non-responders GICs and appliedTCGA subtype gene cluster on gene expression data (Affymetrix U133A2) from 14 GIC celllines (Fig. 2A). Expression data analysis identified several genes highly expressed in theresponder group and divided 14 GICs into two major groups TCGA gene signature. Theresponder cell lines strongly associated with response to γ secretase inhibitors included thesubtype with a proneural background, showing enrichment of proneural TCGA signature,including OLIG2, SOX2, and ERB3 (Fig. 2A). Rest of the cell lines showed low expressionof proneural gene signature and were designated as non-responders. It is important to notethat some of the non-responder cell lines (GSC23) although showing proneural geneexpression of Olig2 and Sox2 (Fig 2B) but did not show Notch pathway activation andresponse to γ-secretase inhibitors were classified as non-responders. The non-respondergroup in contrast shows expression of CD44, TGFβ1 and FGF13 factors essential formaintenance of non-responders (Supplemental Fig. S3). RT-PCR data validated some of theproneural genes present in responder GICs (Fig. 2B).
Identification of subtype pathway markers in cell-line clusteringTo identify differentially expressed pathways between responder and non-responder celllines, we performed GSEA using canonical pathways from Kyoto Encyclopedia of Genesand Genomes (Kanehisa et al., 2012). Notch pathway was significantly up regulated inresponder (p<0.05) group(Fig. 2C). Of the 38 genes in the Notch pathway, 17 were “coreenrichment” genes that were adopted as a gene signature to represent this pathway (Fig. 2D).Core genes were the most deregulated genes and the major contributors to the enrichmentscore. Here, these genes included NOTCH1, NOTCH3, HES1, MAML1, DLL-3 and JAG2,among others (44, 45). RT-PCR data validated expression of the Notch pathway genesNotch-1, Notch-3, Hes1, Hes3 and Hes5 in the responder GICs (Fig. 2E).
Saito et al. Page 6
Stem Cells. Author manuscript; available in PMC 2015 January 01.
NIH
-PA Author Manuscript
NIH
-PA Author Manuscript
NIH
-PA Author Manuscript
Analysis of human tumor gene expression profiles identifies proneural subtype as havinghigh Notch pathway activity
To investigate the Notch pathway in clinical samples, we projected the 17 Notch genesignatures onto GBM cohort collected by TCGA (Cancer Genome Atlas Research Network,2008). Affymetrix HGU133A CEL files of 533 TCGA GBM samples were downloadedfrom the data portal and preprocessed using the aroma package (38). Using ssGSEA(39),these samples were classified into proneural, neural, classical and mesenchymal subtypes(17). As anticipated, the proneural subtype highly expresses the proneural gene signature(Supplemental Fig. S3). We compared expression of Notch signatures between the proneuralgroup and the other groups and applied 17 gene signatures identified above as coreenrichment genes. The results show that 43.9% of the proneural GBMs had higher Notchpathway gene expression, suggesting activation of the pathway in a subset of patients(Supplemental Fig. S4).
Notch blockade is pronounced in GICs with high Notch activityIn order to identify any relationship between pathway activation of Notch signaling and thesensitivity of γ secretase inhibitors, we tested expression of genes in the Notch signalingpathway in 16 GICs by Western blot analysis (Fig. 3A). Activated Notch-1 NICD andNotch-1 pathway components, including Hes1, Hes3 and Hes5, were all expressed in theresponder group and either absent or present at very low levels in non-responder GICs,indicating that response may be related to activation of the Notch signaling pathway. Hes1was expressed in 12 GICs, and Hes3 and Hes5 were expressed only in the responder group.It has been reported that Hes1 expression is regulated by genes other than Notch-1, but it isunclear what genes were regulating Hes1 in GICs.
γ Secretase inhibitors show dose- and time-dependent response in GICsNotch receptor triggered by the ligand promotes its cleavage by γ secretase. This cleavagecan release the NICD, and released NICD translocates into the nucleus and binds CBF-1 toactivate Notch targeting genes, such as the Hes genes, to antagonize the activity of proneuralgenes like Mash1, Math, NeuroD, and Neurogenins (18, 19). To examine the effect of γsecretase inhibitors on the fate of GICs, we used GSC35 to study the time- and dose-dependent effects of γ secretase inhibitors on Notch signaling in vitro. As shown in Fig. 3B,DAPT, BMS-708163 and RO4929097 inhibited expression of NICD, Hes1, Hes3 and Hes5in a time- and dose-dependent manner (Fig. 3B and 3C). The decrease in NICD wasfollowed by a decrease in Hes1, Hes3, and Hes5 expression, whereas the expression ofNotch-1 did not change. This result indicates that γ secretase inhibitors inhibit the cleavageevent at the Notch receptor and suppress downstream targets of Notch. Since γ secretaseinhibitors have several sites of action and are not specific inhibitors of Notch, the effect ofNotch inhibition by γ secretase inhibitors does not reflect specific Notch inhibition.
To gain a better understanding of whether Notch receptors are involved in response to γsecretase inhibitors, we determined the effects of knockdown of Notch-1 through lentivirus-mediated expression of shRNA targeting Notch-1. The efficiency of downregulation of thecorresponding Notch receptors and Notch target genes were determined by Western blotanalysis (Fig. 3B). To examine the function of Notch in GICs, we compared inhibition by ©secretase inhibitors with that of shRNA knockdown of Notch-1 (Fig. 3D). shRNAknockdown of Notch-1 in GICs decreased Hes1 and Hes5 protein expression, unliketreatment with γ secretase inhibitors, which decreased Hes1, Hes3 and Hes5 proteinexpression. Several reports have suggested that Hes genes are functionally classified intotwo groups and that not all are regulated by Notch (46). Hes3 is not a downstream target ofNotch-1 in GICs, but it inhibited by © secretase inhibitors.
Saito et al. Page 7
Stem Cells. Author manuscript; available in PMC 2015 January 01.
NIH
-PA Author Manuscript
NIH
-PA Author Manuscript
NIH
-PA Author Manuscript
Notch inhibition attenuates proliferation and decreases self-renewal of GICsRecent data suggest the role of Notch signaling in the maintenance of normal neural stemcells (21, 22), but whether Notch signaling is involved in tumor stem cells is not fully clear.We analyzed the impact of Notch inhibition on GICs by exposing cells to the γ secretaseinhibitors DAPT, BMS-708163 and RO4929097 for 7 days in a neurosphere formationassay. We selected 6 GICs in the responder group (GSC7-10, GSC13, GSC16, GSC34,GSC35 and GSC38), and 2 cell lines in the non-responder group (GSC2 and GSC20). Fig.4A shows that only responder GICs (GSC35) showed decreased neurosphere formationability in the presence of the three γ secretase inhibitors. The size of responder GSC35neurospheres decreased in the presence of the γ secretase inhibitors, whereas inhibitortreatment had no effect on the size of non-responder (GSC20) neurospheres (Fig. 4A). Tostudy the effect of γ secretase inhibitors on GIC proliferation, the primary neurosphereanalysis showed that the number of neurospheres decreased significantly in responder GICs(Fig. 4B). To analyze the impact of Notch inactivation on self-renewal, we performedsecondary neurosphere formation assays. 7 days after continuous DAPT, BMS-708163 andRO4929097 treatment, cells in the neurospheres were dissociated and placed underneurosphere growth conditions. A significant decrease in secondary neurosphere formation(Fig. 4C), by an average of 84%, was observed in responders after DAPT, BMS-708163 andRO4929097 treatment, compared with non-responder controls (n = 3, p<0.001). Thesefindings suggest that inhibiting Notch results in a decrease in the self-renewal potential oftumor cells, as well as their proliferation.
Notch inhibition induces neuronal and astrocytic differentiationTo test the role of Notch signaling in stem cell maintenance, we performed thedifferentiation assay in vitro. GSC35 (in the responder group) and GSC20 (in the non-responder group) were plated on polylysine-coated coverslips overnight before exposing thecells to all the three γ secretase inhibitors individually for 5 days. Immunostaining wasperformed to detect the levels of CNPase (an oligodendrocytic marker), GFAP (an astrocyticmarker), TuJ1 (a neuronal marker), and Nestin (a neural stem cell marker). Results showthat γ secretase inhibitor treatment decreased the expression of Nestin and increased that ofTuJ1 and GFAP in the responder group of GIC: GSC 35 (Fig. 5A), while as there was noeffect on non-responder GIC: GSC20. Responder GICs have the potential to differentiateinto multiple lineages, and γ secretase inhibitors act as triggers of neuronal and astrocyticdifferentiation, suggesting that inhibiting Notch signaling in GICs leads to an increase in thenumber of differentiated cells. However, knockdown of Notch-1 by shRNA decreased theexpression of only Nestin and increased that of TuJ1 (Fig. 5B). Therefore, we conclude thatNotch knockdown induces only neuronal differentiation, whereas γ secretase inhibitorsinduce both neuronal and astrocytic differentiation. The difference between γ secretaseinhibitor treatment and shRNA knockdown of Notch-1 is in the expression level of Hes3.Notch inhibition by γ secretase inhibitors reduced Hes1, Hes3 and Hes5 expression andinduced neuronal and astrocytic differentiation. On the other hand, Notch knockdownreduced Hes1 and Hes5 expression and induced only neuronal differentiation. Thesefindings indicate Hes1, Hes5 and Hes3 expression might exhibit differential effects onneural differentiation in GICs.
RO4929097 improves survival in an orthotropic mouse model of GBMWe assessed the anti-glioma efficacy of RO4929097 in vivo using a GSC35 orthotopicmodel of human gliomaxenografts in immunocompromised mice. The median survivalduration for animals treated with methylcellulose [control] was 85 days (Fig. 6A and 6B).Treatment with 10 mg/kg RO4929097 and 20 mg/kg RO4929097 alone extended thesurvival duration to a median 132 and 185 days, respectively (p= 0.05, log-rank test for both
Saito et al. Page 8
Stem Cells. Author manuscript; available in PMC 2015 January 01.
NIH
-PA Author Manuscript
NIH
-PA Author Manuscript
NIH
-PA Author Manuscript
experiments). The results show the potential therapeutic efficacy of RO4929097 for thetreatment of human gliomas. The orthotopic tumors after RO4929097 treatment for 4 weekswere analyzed for biological effects. The levels of Notch pathway proteins NICD and Hes1were lower in RO4929097-treated GSC35 tumors than in untreated tumors, suggestingRO4929097 suppressed Notch pathway activities in vivo. In addition, the treated tumorsshowed decreased Ki-67 positivity (Fig. 6C) indicating that RO4929097 suppressedproliferation in the responder GIC tumors. Furthermore, tumors showed increased TuJ1 anddecreased stem cell marker Nestin positivity after RO4929097 treatment.
DiscussionThe Notch signaling pathway involved in cell fate decisions during normal development(18–20)and in the genesis of several cancers (23–25) has been implicated both in themaintenance of neural progenitors and in the generation of glia during development of thebrain (21, 22). In gliomas, Notch seems to confer radio-resistance to cancer stem cells(32),and inhibition of Notch signaling through γ secretase inhibitors(33) or Delta-4 monoclonalantibody (48) decreased the numbers of CSC and/or their tumorigenicity in some preclinicalmodels, suggesting that therapeutic regimens including Notch inhibitors may be used in theclinic to target CSC and reverse or prevent chemo- or radio-resistance. We have shown thatγ secretase inhibitor treatment, suppresses the oncogenic properties of a subgroup of GICswith high Notch pathway activation. Our results indicate that responder group had a genesignature enriched in proneural genes, suggesting γ secretase inhibitors might be of potentialvalue to treat proneural glioma. Furthermore, we show that γ secretase inhibitor treatmentdecreases cell proliferation, self-renewal and induces differentiation accompanied withincreases in animal survival in the γ secretase inhibitor sensitive responder group.
In recent years, a distinct cellular hierarchy has been identified in several hematopoietic andsolid tumors, and efforts to personalize the treatment of solid tumors, including braintumors, are aimed at identifying subsets of patients most likely to benefit from treatment andavoiding treatment-associated morbidity and mortality in patients who are unlikely torespond. Dysregulated Notch activity in human brain tumors was reported by several studies(28–31, 47). However, few studies have investigated the functional relevance of Notch inthis tumor type and it is still not clear if and how Notch signaling affects gliomatumorigenesis and maintenance.
In the context of personalized medicine, for the best use of Notch inhibitors and other CSC-targeted agents, various factors need to be determined: 1) which cancers and specific cancersubtypes contain Notch-dependent CSC; (2) what role specific components of Notchsignaling play in these CSC; and 3) how can one measure Notch activity in CSC fromindividual patients. The selection of cancer patients who would benefit from treatment withmolecular inhibitors is one of the biggest challenges. TCGA Network described genomicabnormalities and gene expression-based molecular subtypes of GBM with strongrelationships between subtypes and genomic alterations. Establishing the associationbetween drug responses and GBM molecular subclasses may help to identify potentialcohorts of patients for targeted therapy. The potential clinical utility of these findings issupported by concordance of in vitro-derived molecular predictors of response to therapeuticcompounds and clinical results. In the current study, we used neurospheres derived fromhuman GBM specimens (GICs) to examine the effects of Notch pathway blockade. Notchpathway blockade by three structurally distinct γ-secretase inhibitors slowed tumor growthin a subset of GICs with high Notch pathway activation. This subset of GICs was identifiedwith gene set enrichment analysis matching that of the characteristic proneural GBM thatpredicted response to Notch inhibition. However the clinical application is hindered bycomplexities arising from intratumoral heterogeneity. Our study showed that only 43.9% of
Saito et al. Page 9
Stem Cells. Author manuscript; available in PMC 2015 January 01.
NIH
-PA Author Manuscript
NIH
-PA Author Manuscript
NIH
-PA Author Manuscript
the TCGA proneural tumors were identified as strong Notch pathway expressers afterapplying the 17-gene Notch signature to the proneural TCGA data set (Supplemental FigureS4). It is therefore important to note that only about 50% of proneural GBMs were identifiedhaving the Notch pathway signature and most likely rest 50% of the proneural GBMs haveother gene or pathway signatures. Further analysis defining the signatures should aid morespecific therapeutic targeting. It is important to note that the frequency of functionallydefined CSCs, can vary dramatically among different patients. Moreover, differentsubpopulations within the tumor possess stem cell properties, which may be isolated using avariety of cell surface markers. It is becoming evident that for the development of newtherapeutic strategies it is essential to consider the heterogeneity of brain tumors like GMBsas well as different subtypes. Probably, a unique marker is not enough to identify andcharacterize tumor-initiating population within the tumor bulk. Moreover, during gliomaprogression stem cells may be generated via accumulation of more mutations in the cellsinitially manifesting glioma features. Tumor heterogeneity may represent inherent instabilityin gene expression markers that confers undifferentiated cell character as opposed to stage inthe stem cell lineage defining patterns of gene expression.
Additionally, we showed that Notch signaling components are expressed in human GBM-derived neurospheres. These findings are consistent with those from other previous reports(28–31), showing Notch signaling components were expressed in different brain tumors andplayed important roles in their pathogenesis. Recently, Verhaak et al. reported that Notchsignaling was highly expressed in the classic subtype of GBM (17). We further showed thatγ secretase inhibitors inhibited Notch signaling and differentially inhibited GBM cellgrowth. The difference of growth inhibition could be due to the different cellular context andheterogeneous genetic background of these GBM cell lines. Blocking the Notch pathwaysuppressed the GICs’ tumorigenic features such as cell viability, self-renewal anddifferentiation.
These data suggest that Notch inhibition would be effective in targeting the bulk of thetumor as well as eventually minimizing recurrence by inhibiting the proliferation anddifferentiation of cancer stem cells. Results of this study are therefore anticipated to helpidentify potential GBM patient cohorts who would gain the most from Notch inhibition.Additional work remains before the signatures reported in this study can be used to selectpatients for clinical trials. Such future work would include the development of robust andreliable molecular assays that can be applied to clinical samples, establishment of predictivealgorithms with decision-making thresholds optimized for clinical use, and validation ofpredictive power in multiple independent studies.
Supplementary MaterialRefer to Web version on PubMed Central for supplementary material.
AcknowledgmentsWe thank Verlene Henry and Lindsay Holmes for performing the animal studies. We thank Kathryn Carnes(Department of Scientific Publications, The University of Texas MD Anderson Cancer Center) for editing themanuscript. This study was supported by grants from the National Cancer Institute (CA56041 and CA127001 toW.K.A.Y) and Cancer Center Support Grant (CA16672).
References1. Chang SM, Theodosopoulos P, Lamborn K, et al. Temozolomide in the treatment of recurrent
malignant glioma. Cancer. 2004; 100:605–611. [PubMed: 14745879]
Saito et al. Page 10
Stem Cells. Author manuscript; available in PMC 2015 January 01.
NIH
-PA Author Manuscript
NIH
-PA Author Manuscript
NIH
-PA Author Manuscript
2. Wen PY, Kesari S. Malignant gliomas in adults. N Engl J Med. 2008; 359:492–507. [PubMed:18669428]
3. Stupp R, Mason WP, van den Bent MJ, et al. Radiotherapy plus concomitant and adjuvanttemozolomide for glioblastoma. N Engl J Med. 2005; 352:987–996. [PubMed: 15758009]
4. Purow B, Schiff D. Advances in the genetics of glioblastoma: are we reaching critical mass? NatRev Neurol. 2009; 5:419–426. [PubMed: 19597514]
5. Goodwin CR, Laterra J. Neuro-oncology: unmasking the multiforme in glioblastoma. Nat RevNeurol. 2010; 6:304–305. [PubMed: 20531430]
6. MacDonald TJ, Brown KM, LaFleur B, et al. Expression profiling of medulloblastoma PDGFRAand the AS/MAPK pathway. Nat Genet. 2001; 29:143–152. [PubMed: 11544480]
7. Nagarajan RP, Costello JF. Molecular epigenetics and genetics in neuro-oncology.Neurotherapeutics. 2009; 6:436–446. [PubMed: 19560734]
8. Robinson JP, VanBrocklin MW, Guilbeault AR, et al. Activated BRAF induces gliomas in micewhen combined with Ink4a/Arf loss or Akt activation. Oncogene. 2010; 29:335–344. [PubMed:19855433]
9. Mladkova N, Chakravarti A. Molecular profiling in glioblastoma: prelude to personalized treatment.Curr Oncol Rep. 2009; 11:53–61. [PubMed: 19080742]
10. Colman H, Zhang L, Sulman EP, et al. A multigene predictor of outcome in glioblastoma. NeuroOncol. 2010; 12:49–57. [PubMed: 20150367]
11. Schadt EE, Friend SH, Shaywitz DA. A network view of disease and compound screening. NatRev Drug Discov. 2009; 8:286–295. [PubMed: 19337271]
12. Singh SK, Hawkins C, Clarke ID, et al. Identification of human brain tumour initiating cells.Nature. 2004; 432:396–401. [PubMed: 15549107]
13. Kondo T, Setoguchi T, Taga T. Persistence of a small subpopulation of cancer stem-like cells inthe C6 glioma cell line. Proc Natl Acad Sci U S A. 2004; 101:781–786. [PubMed: 14711994]
14. Ikushima H, Todo T, Ino Y, et al. Glioma-initiating cells retain their tumorigenicity throughintegration of the Sox axis and Oct4 protein. J Biol Chem. 2010; 286:41434–41441. [PubMed:21987575]
15. Bao S, Wu Q, McLendon RE, et al. Glioma stem cells promote radioresistance by preferentialactivation of the DNA damage response. Nature. 2006; 444:756–760. [PubMed: 17051156]
16. Liu G, Yuan X, Zeng Z, et al. Analysis of gene expression and chemoresistance of CD133+ cancerstem cells in glioblastoma. Mol Cancer. 2006; 5:67. [PubMed: 17140455]
17. Verhaak RG, Hoadley KA, Purdom E, et al. Integrated genomic analysis identifies clinicallyrelevant subtypes of glioblastoma characterized by abnormalities in PDGFRA, IDH1, EGFR, andNF1. Cancer Cell. 2010; 17:98–110. [PubMed: 20129251]
18. Kopan R, Ilagan MX. The canonical Notch signaling pathway: unfolding the activationmechanism. Cell. 2009; 137:216–233. [PubMed: 19379690]
19. Fortini ME. Notch signaling: the core pathway and its posttranslational regulation. Dev Cell. 2009;16:633–647. [PubMed: 19460341]
20. Kageyama R, Ohtsuka T. The Notch-Hes pathway in mammalian neural development. Cell Res.1999; 9:179–188. [PubMed: 10520600]
21. Kageyama R, Ohtsuka T, Hatakeyama J, et al. Roles of bHLH genes in neural stem celldifferentiation. Exp Cell Res. 2005; 306:343–348. [PubMed: 15925590]
22. Hatakeyama J, Sakamoto S, Kageyama R. Hes1 and Hes5 regulate the development of the cranialand spinal nerve systems. Dev Neurosci. 2006; 28:92–101. [PubMed: 16508307]
23. Reedijk M, Odorcic S, Zhang H, et al. Activation of Notch signaling in human colonadenocarcinoma. Int J Oncol. 2008; 33:1223–1229. [PubMed: 19020755]
24. Liu S, Breit S, Danckwardt S, et al. Downregulation of Notch signaling by gamma-secretaseinhibition can abrogate chemotherapy-induced apoptosis in T-ALL cell lines. Ann Hematol. 2009;88:613–621. [PubMed: 19057901]
25. Watters JW, Cheng C, Majumder PK, et al. De novo discovery of a gamma-secretase inhibitorresponse signature using a novel in vivo breast tumor model. Cancer Res. 2009; 69:8949–8957.[PubMed: 19903844]
Saito et al. Page 11
Stem Cells. Author manuscript; available in PMC 2015 January 01.
NIH
-PA Author Manuscript
NIH
-PA Author Manuscript
NIH
-PA Author Manuscript
26. Cuevas IC, Slocum AL, Jun P, et al. Meningioma transcript profiles reveal deregulated Notchsignaling pathway. Cancer Res. 2005; 65:5070–5075. [PubMed: 15958550]
27. Yokota N, Mainprize TG, Taylor MD, et al. Identification of differentially expressed anddevelopmentally regulated genes in medulloblastoma using suppression subtraction hybridization.Oncogene. 2004; 23:3444–3453. [PubMed: 15064731]
28. Kanamori M, Kawaguchi T, Nigro JM, et al. Contribution of Notch signaling activation to humanglioblastoma multiforme. J Neurosurg. 2007; 106:417–27. [PubMed: 17367064]
29. Purow BW, Haque RM, Noel MW, et al. Expression of Notch-1 and its ligands, Delta-like-1 andJagged-1, is critical for glioma cell survival and proliferation. Cancer Res. 2005; 65:2353–63.[PubMed: 15781650]
30. Zhu TS, Costello MA, Talsma CE, et al. Endothelial cells create a stem cell niche in glioblastomaby providing NOTCH ligands that nurture self-renewal of cancer stem-like cells. Cancer Res.2011; 71:6061–6072. [PubMed: 21788346]
31. Jiang X, Xing H, Kim TM, et al. Numb regulates glioma stem cell fate and growth by alteringepidermal growth factor receptor and Skp1-Cullin-F-box ubiquitin ligase activity. Stem Cells.2012; 30:1313–1326. [PubMed: 22553175]
32. Wang J, Wakeman TP, Lathia JD, et al. Notch Promotes Radioresistance of Glioma Stem Cells.Stem Cells. 2010; 28:17–28. [PubMed: 19921751]
33. Fan X, Khaki L, Zhu TS, et al. Notch Pathway Blockade Depletes CD133-Positive GlioblastomaCells and Inhibits Growth of Tumor Neurospheres and Xenografts. Stem Cells. 2010; 28:5–16.[PubMed: 19904829]
34. Gilbert CA, Daou MC, Moser RP, et al. Gamma-secretase inhibitors enhance temozolomidetreatment of human gliomas by inhibiting neurosphere repopulation and xenograft recurrence.Cancer Res. 2010; 70:6870–6879. [PubMed: 20736377]
35. Bhat KP, Salazar KL, Balasubramaniyan V, et al. The transcriptional coactivator TAZ regulatesmesenchymal differentiation in malignant glioma. Genes Dev. 2011; 25:2594–609. [PubMed:22190458]
36. Subramanian A, Tamayo P, Mootha VK, et al. Gene set enrichment analysis: a knowledge-basedapproach for interpreting genome-wide expression profiles. Proc Natl Acad Sci U S A. 2005;102:15545–15550. [PubMed: 16199517]
37. Kanehisa M, Goto S, Sato Y, et al. KEGG for integration and interpretation of large-scalemolecular data sets. Nucleic Acids Res. 2012; 40:D109–114. [PubMed: 22080510]
38. Bengtsson H, Jönsson G, Vallon-Christersson J. Calibration and assessment of channel-specificbiases in microarray data with extended dynamical range. BMC Bioinformatics. 2004; 5:177.[PubMed: 15541170]
39. Barbie DA, Tamayo P, Boehm JS, et al. Systematic RNA interference reveals that oncogenicKRAS-driven cancers require TBK1. Nature. 2009; 462:108–112. [PubMed: 19847166]
40. Koul D, Jasser SA, Lu Y, et al. Motif analysis of the tumor suppressor gene MMAC/PTENidentifies tyrosines critical for tumor suppression and lipid phosphatase activity. Oncogene. 2002;21:2357–2364. [PubMed: 11948419]
41. Liu JL, Sheng X, Hortobagyi ZK, et al. Nuclear PTEN-mediated growth suppression isindependent of Akt down-regulation. Mol Cell Biol. 2005; 25:6211–6224. [PubMed: 15988030]
42. Bao S, Wu Q, Li Z, et al. Targeting cancer stem cells through L1CAM suppresses glioma growth.Cancer Res. 2008; 68:6043–6048. [PubMed: 18676824]
43. Lal S, Lacroix M, Tofilon P, et al. An implantable guide-screw system for brain tumor studies insmall animals. J Neurosurg. 2000; 92:326–333. [PubMed: 10659021]
44. Cooper LA, Gutman DA, Long Q, et al. The proneural molecular signature is enriched inoligodendrogliomas and predicts improved survival among diffuse gliomas. PLoS One. 2010;5:e12548. [PubMed: 20838435]
45. Tso CL, Freije WA, Day A, et al. Distinct transcription profiles of primary and secondaryglioblastoma subgroups. Cancer Res. 2006; 66:159–167. [PubMed: 16397228]
46. Katoh M, Katoh M. Integrative genomic analyses on HES/HEY family: Notch-independent HES1,HES3 transcription in undifferentiated ES cells, and Notch-dependent HES1, HES5, HEY1,
Saito et al. Page 12
Stem Cells. Author manuscript; available in PMC 2015 January 01.
NIH
-PA Author Manuscript
NIH
-PA Author Manuscript
NIH
-PA Author Manuscript
HEY2, HEYL transcription in fetal tissues, adult tissues, or cancer. Int J Oncol. 2007; 31:461–466.[PubMed: 17611704]
47. Fan X, Mikolaenko I, Elhassan I, et al. Notch1 and notch2 have opposite effects on embryonalbrain tumor growth. Cancer Res. 2004; 64:7787–93. [PubMed: 15520184]
48. Hoey T, Yen WC, Axelrod F, et al. DLL4 blockade inhibits tumor growth and reduces tumor-initiating cell frequency. Cell Stem Cell. 2009; 5:168–77. [PubMed: 19664991]
Saito et al. Page 13
Stem Cells. Author manuscript; available in PMC 2015 January 01.
NIH
-PA Author Manuscript
NIH
-PA Author Manuscript
NIH
-PA Author Manuscript
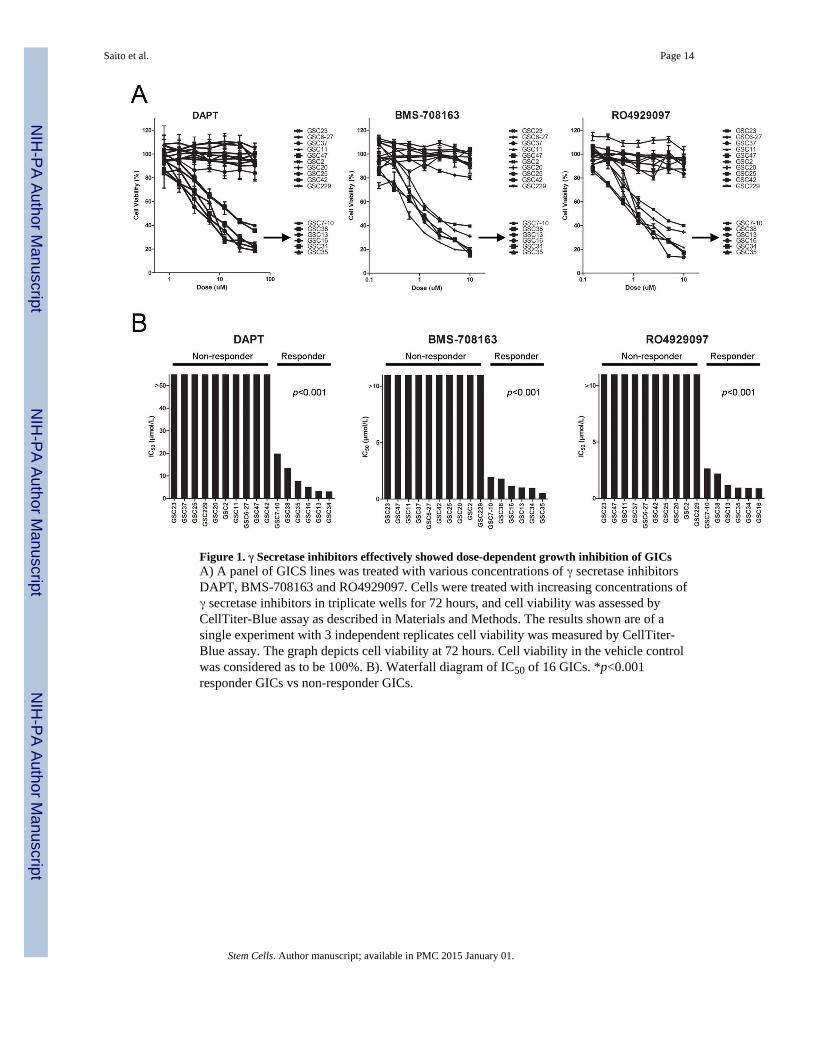
Figure 1. γ Secretase inhibitors effectively showed dose-dependent growth inhibition of GICsA) A panel of GICS lines was treated with various concentrations of γ secretase inhibitorsDAPT, BMS-708163 and RO4929097. Cells were treated with increasing concentrations ofγ secretase inhibitors in triplicate wells for 72 hours, and cell viability was assessed byCellTiter-Blue assay as described in Materials and Methods. The results shown are of asingle experiment with 3 independent replicates cell viability was measured by CellTiter-Blue assay. The graph depicts cell viability at 72 hours. Cell viability in the vehicle controlwas considered as to be 100%. B). Waterfall diagram of IC50 of 16 GICs. *p<0.001responder GICs vs non-responder GICs.
Saito et al. Page 14
Stem Cells. Author manuscript; available in PMC 2015 January 01.
NIH
-PA Author Manuscript
NIH
-PA Author Manuscript
NIH
-PA Author Manuscript
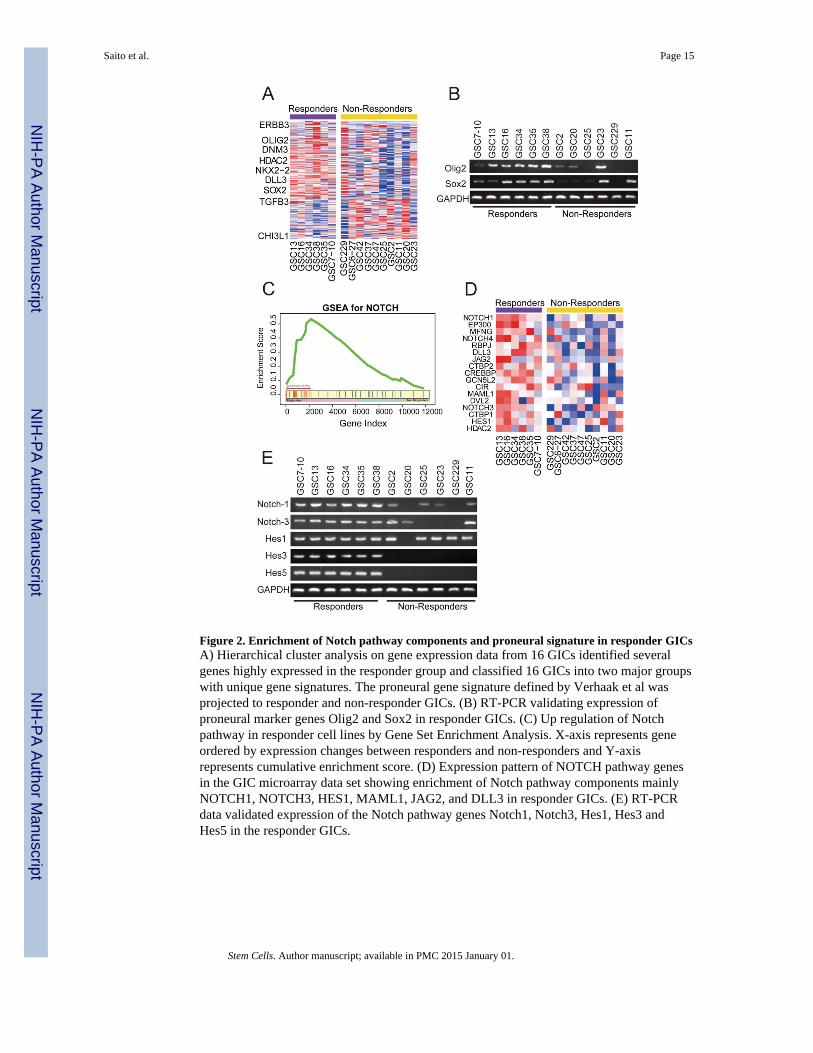
Figure 2. Enrichment of Notch pathway components and proneural signature in responder GICsA) Hierarchical cluster analysis on gene expression data from 16 GICs identified severalgenes highly expressed in the responder group and classified 16 GICs into two major groupswith unique gene signatures. The proneural gene signature defined by Verhaak et al wasprojected to responder and non-responder GICs. (B) RT-PCR validating expression ofproneural marker genes Olig2 and Sox2 in responder GICs. (C) Up regulation of Notchpathway in responder cell lines by Gene Set Enrichment Analysis. X-axis represents geneordered by expression changes between responders and non-responders and Y-axisrepresents cumulative enrichment score. (D) Expression pattern of NOTCH pathway genesin the GIC microarray data set showing enrichment of Notch pathway components mainlyNOTCH1, NOTCH3, HES1, MAML1, JAG2, and DLL3 in responder GICs. (E) RT-PCRdata validated expression of the Notch pathway genes Notch1, Notch3, Hes1, Hes3 andHes5 in the responder GICs.
Saito et al. Page 15
Stem Cells. Author manuscript; available in PMC 2015 January 01.
NIH
-PA Author Manuscript
NIH
-PA Author Manuscript
NIH
-PA Author Manuscript
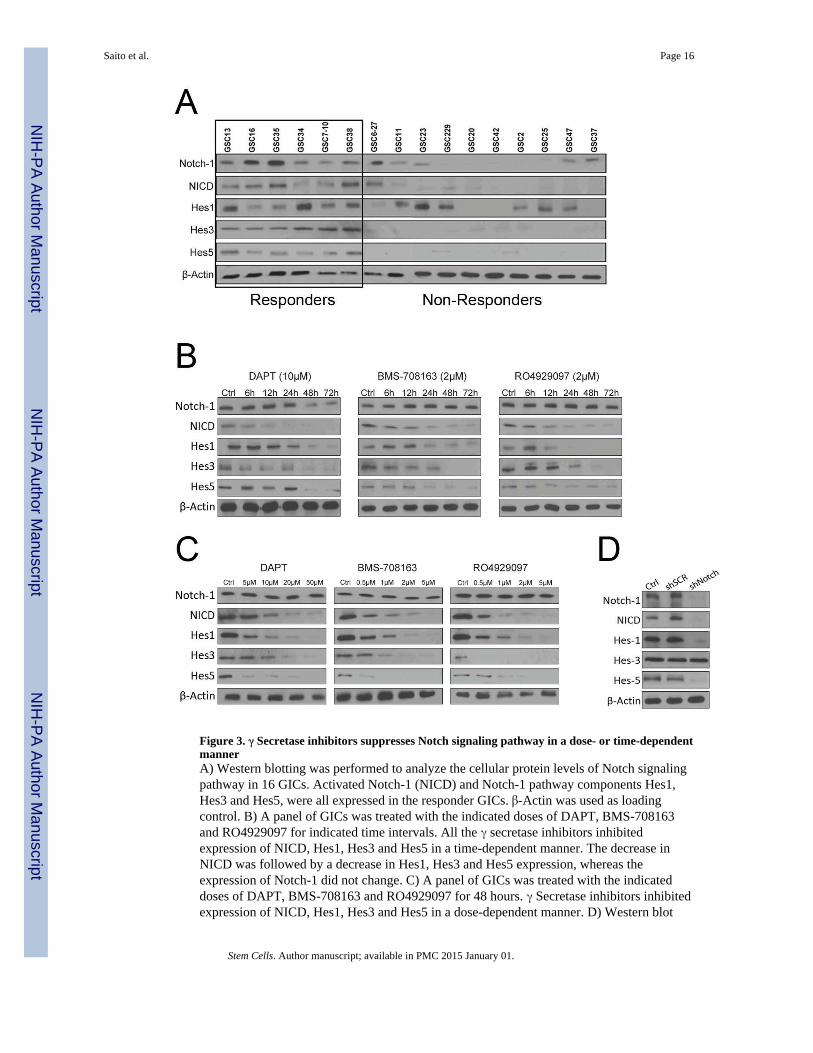
Figure 3. γ Secretase inhibitors suppresses Notch signaling pathway in a dose- or time-dependentmannerA) Western blotting was performed to analyze the cellular protein levels of Notch signalingpathway in 16 GICs. Activated Notch-1 (NICD) and Notch-1 pathway components Hes1,Hes3 and Hes5, were all expressed in the responder GICs. β-Actin was used as loadingcontrol. B) A panel of GICs was treated with the indicated doses of DAPT, BMS-708163and RO4929097 for indicated time intervals. All the γ secretase inhibitors inhibitedexpression of NICD, Hes1, Hes3 and Hes5 in a time-dependent manner. The decrease inNICD was followed by a decrease in Hes1, Hes3 and Hes5 expression, whereas theexpression of Notch-1 did not change. C) A panel of GICs was treated with the indicateddoses of DAPT, BMS-708163 and RO4929097 for 48 hours. γ Secretase inhibitors inhibitedexpression of NICD, Hes1, Hes3 and Hes5 in a dose-dependent manner. D) Western blot
Saito et al. Page 16
Stem Cells. Author manuscript; available in PMC 2015 January 01.
NIH
-PA Author Manuscript
NIH
-PA Author Manuscript
NIH
-PA Author Manuscript
analysis confirmed the knockdown effect of Notch shRNA lentivirus on GSC35. shRNAknockdown of Notch-1 in GICs decreased Hes1 and Hes5 protein expression.
Saito et al. Page 17
Stem Cells. Author manuscript; available in PMC 2015 January 01.
NIH
-PA Author Manuscript
NIH
-PA Author Manuscript
NIH
-PA Author Manuscript
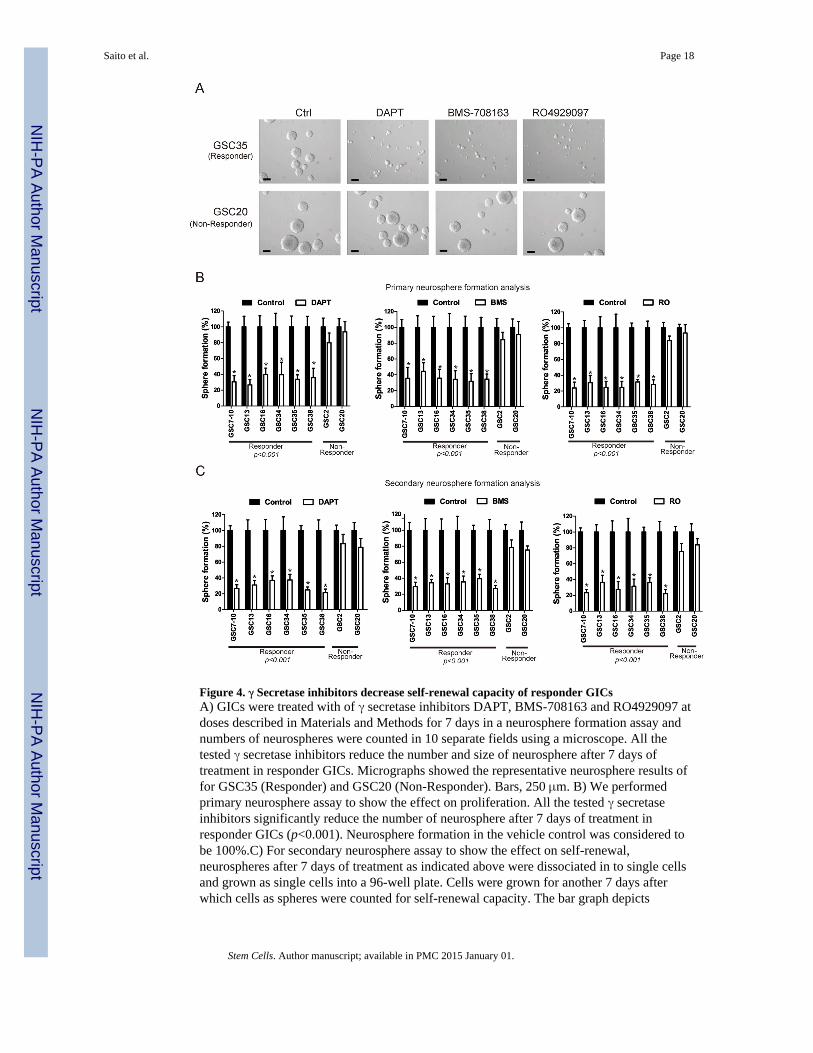
Figure 4. γ Secretase inhibitors decrease self-renewal capacity of responder GICsA) GICs were treated with of γ secretase inhibitors DAPT, BMS-708163 and RO4929097 atdoses described in Materials and Methods for 7 days in a neurosphere formation assay andnumbers of neurospheres were counted in 10 separate fields using a microscope. All thetested γ secretase inhibitors reduce the number and size of neurosphere after 7 days oftreatment in responder GICs. Micrographs showed the representative neurosphere results offor GSC35 (Responder) and GSC20 (Non-Responder). Bars, 250 μm. B) We performedprimary neurosphere assay to show the effect on proliferation. All the tested γ secretaseinhibitors significantly reduce the number of neurosphere after 7 days of treatment inresponder GICs (p<0.001). Neurosphere formation in the vehicle control was considered tobe 100%.C) For secondary neurosphere assay to show the effect on self-renewal,neurospheres after 7 days of treatment as indicated above were dissociated in to single cellsand grown as single cells into a 96-well plate. Cells were grown for another 7 days afterwhich cells as spheres were counted for self-renewal capacity. The bar graph depicts
Saito et al. Page 18
Stem Cells. Author manuscript; available in PMC 2015 January 01.
NIH
-PA Author Manuscript
NIH
-PA Author Manuscript
NIH
-PA Author Manuscript
secondary neurosphere formation after 7 days of replating. Neurosphere formation in thevehicle control was considered as to be 100%.
Saito et al. Page 19
Stem Cells. Author manuscript; available in PMC 2015 January 01.
NIH
-PA Author Manuscript
NIH
-PA Author Manuscript
NIH
-PA Author Manuscript
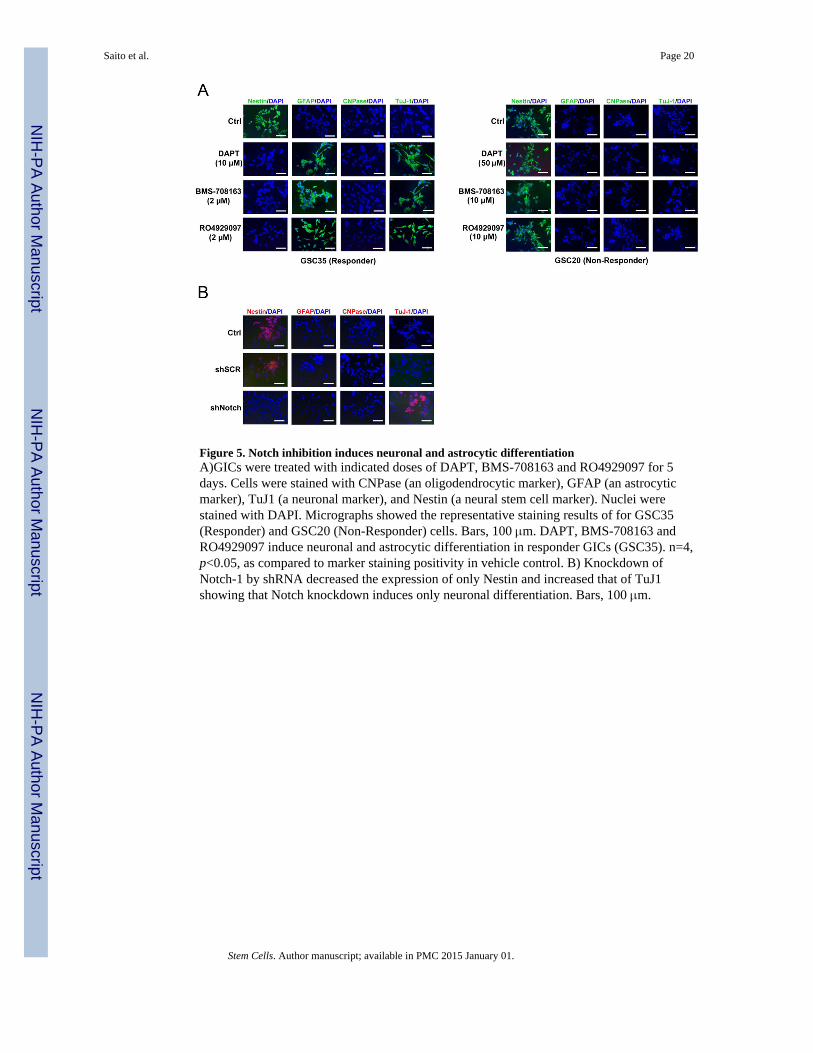
Figure 5. Notch inhibition induces neuronal and astrocytic differentiationA)GICs were treated with indicated doses of DAPT, BMS-708163 and RO4929097 for 5days. Cells were stained with CNPase (an oligodendrocytic marker), GFAP (an astrocyticmarker), TuJ1 (a neuronal marker), and Nestin (a neural stem cell marker). Nuclei werestained with DAPI. Micrographs showed the representative staining results of for GSC35(Responder) and GSC20 (Non-Responder) cells. Bars, 100 μm. DAPT, BMS-708163 andRO4929097 induce neuronal and astrocytic differentiation in responder GICs (GSC35). n=4,p<0.05, as compared to marker staining positivity in vehicle control. B) Knockdown ofNotch-1 by shRNA decreased the expression of only Nestin and increased that of TuJ1showing that Notch knockdown induces only neuronal differentiation. Bars, 100 μm.
Saito et al. Page 20
Stem Cells. Author manuscript; available in PMC 2015 January 01.
NIH
-PA Author Manuscript
NIH
-PA Author Manuscript
NIH
-PA Author Manuscript
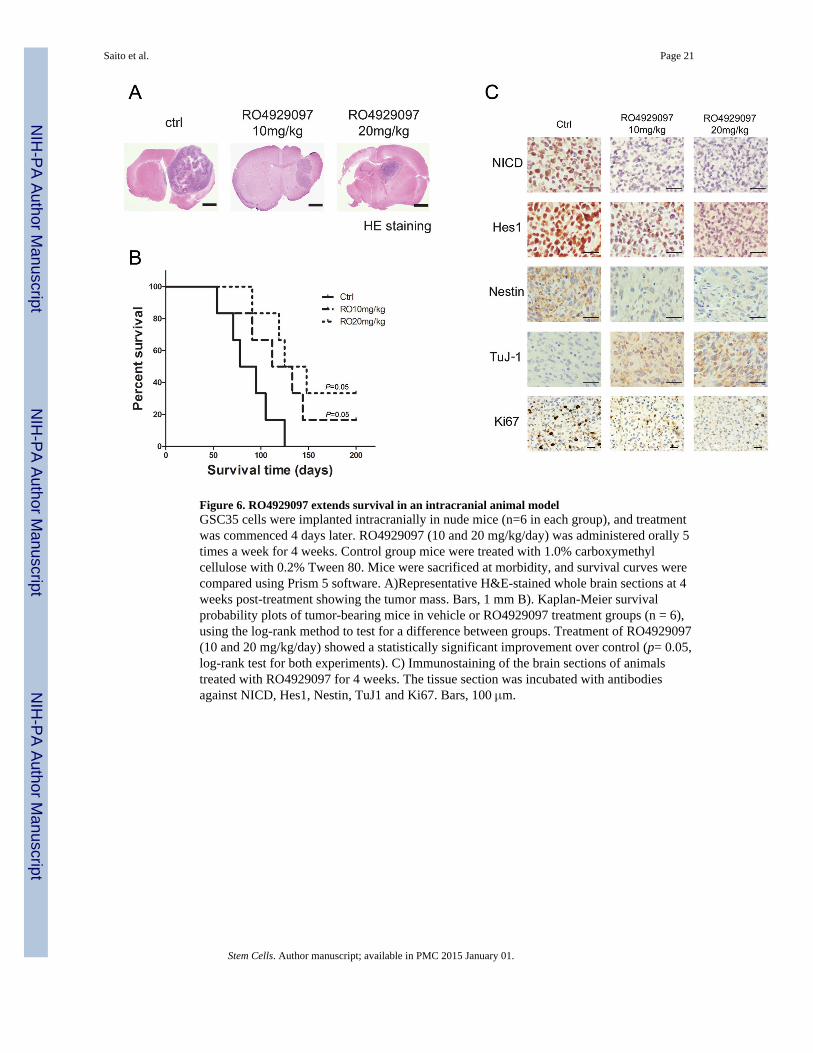
Figure 6. RO4929097 extends survival in an intracranial animal modelGSC35 cells were implanted intracranially in nude mice (n=6 in each group), and treatmentwas commenced 4 days later. RO4929097 (10 and 20 mg/kg/day) was administered orally 5times a week for 4 weeks. Control group mice were treated with 1.0% carboxymethylcellulose with 0.2% Tween 80. Mice were sacrificed at morbidity, and survival curves werecompared using Prism 5 software. A)Representative H&E-stained whole brain sections at 4weeks post-treatment showing the tumor mass. Bars, 1 mm B). Kaplan-Meier survivalprobability plots of tumor-bearing mice in vehicle or RO4929097 treatment groups (n = 6),using the log-rank method to test for a difference between groups. Treatment of RO4929097(10 and 20 mg/kg/day) showed a statistically significant improvement over control (p= 0.05,log-rank test for both experiments). C) Immunostaining of the brain sections of animalstreated with RO4929097 for 4 weeks. The tissue section was incubated with antibodiesagainst NICD, Hes1, Nestin, TuJ1 and Ki67. Bars, 100 μm.
Saito et al. Page 21
Stem Cells. Author manuscript; available in PMC 2015 January 01.
NIH
-PA Author Manuscript
NIH
-PA Author Manuscript
NIH
-PA Author Manuscript