In situ spectroelectrochemistry, electrosynthesis and growth rates of conducting polypyrrole and...
9
In situ spectroelectrochemistry, electrosynthesis and growth rates of conducting polypyrrole and poly N-methylpyrrole on gold and indium tin oxide glass modified by thiolated a-cyclodextrin self-assembled monolayer’s (SAMs) Jalal Arjomandi ⇑ , Sara Eshghi Department of Physical Chemistry, Faculty of Chemistry, Bu Ali Sina University, 65178 Hamedan, Iran article info Article history: Received 13 August 2012 Received in revised form 11 November 2012 Accepted 19 November 2012 Available online 8 December 2012 Keywords: Growth rate In situ spectroelectrochemistry Polypyrrole Poly(N-methylpyrrole) Thiolated a-cyclodextrin abstract Electrochemical synthesis, in situ spectroelectrochemistry and growth rates of conducting polypyrrole (PPy) and poly(N-methylpyrrole) (PNMPy) on bare and modified gold and indium tin oxide (ITO) glass with thiolated a-cyclodextrin (T-a-CD) self-assembled monolayers (SAMs) have been investigated. The films modifiers of functionalized SAMs were characterized by means of CV, in situ UV–visible spectros- copy, in situ conductivity measurement and scanning electron microscopy (SEM). The polymerization reactions are 0.73 and 0.81 orders with respect to the pyrrole and N-methylpyrrole concentrations and 0.61 and 0.64 orders with respect to the amount of PPy and PNMPy. The kinetic results indicate that the polymerization growth rate of PPy is faster than PNMPy. However, the polymerization growth rates of both polymers at the modified electrodes SAMs are slower than that at bare gold electrode. The in situ conductivity of the polymers on bare and modified gold electrodes have been studied. The results indi- cates that the in situ conductivity of polymers on modified gold electrode were lower by around 1–2 orders of magnitude than those of polymers on bare gold electrodes. The in situ UV–visible spectroscopy of polymers on modified ITO/glass with T-a-CD-SAMs indicates a characteristic absorption’s bands. Scan- ning electron microscopic photos reveal that the T-a-CD may act as molecular templates for electrochem- ical polymerization of conducting PPy and PNMPy. Ó 2012 Elsevier B.V. All rights reserved. 1. Introduction PPy and PNMPy are representative of conducting polymers, with widely use in microelectronic devices, practical devices including energy storage devices, electrochemical/chemical sen- sors, and others [1–4]. PPy and PNMPy can be easily synthesized in both aqueous and nonaqueous solutions by applied the poten- tials [5]. Electrochemical properties of the PPy and PNMPy have been studied by a number of investigators [6–12]. Conducting polymers such as polyaniline or PPy were generally grown on plat- inum or gold electrodes by potentiodynamic or potentiostatic methods [13,14]. It has been generally accepted that the first step of the polymerization reactions for PPy or PNMPy involves a cou- pling of the electro generated radical cation of pyrrole or N-meth- ylpyrrole [15]. The coupling is followed by aromatization through deprotonation and subsequent oxidation of the dimer to its radical cation, which couples with radical cations of other monomeric, di- meric, or oligomeric species, resulting in chain lengthening. During the growth reaction, intermediates such as dimer or trimer have been observed [14]. The study of the growth rate as a function of cycle number and monomer concentration is still at a developing stage [13,14]. In situ spectroelectrochemistry and in situ character- ization of some conducting polymers and copolymers have been published recently [15–27]. The in situ technique under applied potential control provides useful information on the characteris- tics, in order to avoid often irreversible changes such as air oxida- tion, contamination and mechanical damage [16]. Furthermore, it is useful to clarify the conductivity characteristics of the polymer under the in situ technique and wet condition due to the fact that the application of the polymers required immersing in electrolyte solutions. Cyclodextrins (CDs) are cyclic oligosaccharides built up from 1,4-glucopyranose units that exhibit a torus-shaped structure with a hydrophobic cavity and a hydrophilic exterior. They can form inclusion complexes only with guest molecules of the proper sizes [28]. This has led to considerable interest in using CDs in the synthesis of conducting polymers. It has been found that CDs bound to the electrode acted as molecular templates to restrict the growth sites of PPy within the b-CDs cavities [29,30]. Molecular templates, which can form an insertion complex with organic monomer molecules, can be obtained by modifying gold electrodes with SAMs of molecules of basket shape having hydrophobic cavi- ties [30]. For example, b-CD-SAMs on gold electrodes have been shown to serve as molecular-size selective sensors for compounds such as p-benzoquinone, 2-methyl-1,4-naphthoquinone, and 1572-6657/$ - see front matter Ó 2012 Elsevier B.V. All rights reserved. http://dx.doi.org/10.1016/j.jelechem.2012.11.036 ⇑ Corresponding author. Tel.: +98 8118282807; fax: +98 8118257407. E-mail address: [email protected] (J. Arjomandi). Journal of Electroanalytical Chemistry 690 (2013) 38–46 Contents lists available at SciVerse ScienceDirect Journal of Electroanalytical Chemistry journal homepage: www.elsevier.com/locate/jelechem
Transcript of In situ spectroelectrochemistry, electrosynthesis and growth rates of conducting polypyrrole and...

Journal of Electroanalytical Chemistry 690 (2013) 38–46
Contents lists available at SciVerse ScienceDirect
Journal of Electroanalytical Chemistry
journal homepage: www.elsevier .com/locate / je lechem
In situ spectroelectrochemistry, electrosynthesis and growth ratesof conducting polypyrrole and poly N-methylpyrrole on gold and indium tinoxide glass modified by thiolated a-cyclodextrin self-assembled monolayer’s (SAMs)
Jalal Arjomandi ⇑, Sara EshghiDepartment of Physical Chemistry, Faculty of Chemistry, Bu Ali Sina University, 65178 Hamedan, Iran
a r t i c l e i n f o
Article history:Received 13 August 2012Received in revised form 11 November 2012Accepted 19 November 2012Available online 8 December 2012
Keywords:Growth rateIn situ spectroelectrochemistryPolypyrrolePoly(N-methylpyrrole)Thiolated a-cyclodextrin
1572-6657/$ - see front matter � 2012 Elsevier B.V. Ahttp://dx.doi.org/10.1016/j.jelechem.2012.11.036
⇑ Corresponding author. Tel.: +98 8118282807; faxE-mail address: [email protected]
a b s t r a c t
Electrochemical synthesis, in situ spectroelectrochemistry and growth rates of conducting polypyrrole(PPy) and poly(N-methylpyrrole) (PNMPy) on bare and modified gold and indium tin oxide (ITO) glasswith thiolated a-cyclodextrin (T-a-CD) self-assembled monolayers (SAMs) have been investigated. Thefilms modifiers of functionalized SAMs were characterized by means of CV, in situ UV–visible spectros-copy, in situ conductivity measurement and scanning electron microscopy (SEM). The polymerizationreactions are 0.73 and 0.81 orders with respect to the pyrrole and N-methylpyrrole concentrations and0.61 and 0.64 orders with respect to the amount of PPy and PNMPy. The kinetic results indicate thatthe polymerization growth rate of PPy is faster than PNMPy. However, the polymerization growth ratesof both polymers at the modified electrodes SAMs are slower than that at bare gold electrode. The in situconductivity of the polymers on bare and modified gold electrodes have been studied. The results indi-cates that the in situ conductivity of polymers on modified gold electrode were lower by around 1–2orders of magnitude than those of polymers on bare gold electrodes. The in situ UV–visible spectroscopyof polymers on modified ITO/glass with T-a-CD-SAMs indicates a characteristic absorption’s bands. Scan-ning electron microscopic photos reveal that the T-a-CD may act as molecular templates for electrochem-ical polymerization of conducting PPy and PNMPy.
� 2012 Elsevier B.V. All rights reserved.
1. Introduction cycle number and monomer concentration is still at a developing
PPy and PNMPy are representative of conducting polymers,with widely use in microelectronic devices, practical devicesincluding energy storage devices, electrochemical/chemical sen-sors, and others [1–4]. PPy and PNMPy can be easily synthesizedin both aqueous and nonaqueous solutions by applied the poten-tials [5]. Electrochemical properties of the PPy and PNMPy havebeen studied by a number of investigators [6–12]. Conductingpolymers such as polyaniline or PPy were generally grown on plat-inum or gold electrodes by potentiodynamic or potentiostaticmethods [13,14]. It has been generally accepted that the first stepof the polymerization reactions for PPy or PNMPy involves a cou-pling of the electro generated radical cation of pyrrole or N-meth-ylpyrrole [15]. The coupling is followed by aromatization throughdeprotonation and subsequent oxidation of the dimer to its radicalcation, which couples with radical cations of other monomeric, di-meric, or oligomeric species, resulting in chain lengthening. Duringthe growth reaction, intermediates such as dimer or trimer havebeen observed [14]. The study of the growth rate as a function of
ll rights reserved.
: +98 8118257407.z.de (J. Arjomandi).
stage [13,14]. In situ spectroelectrochemistry and in situ character-ization of some conducting polymers and copolymers have beenpublished recently [15–27]. The in situ technique under appliedpotential control provides useful information on the characteris-tics, in order to avoid often irreversible changes such as air oxida-tion, contamination and mechanical damage [16]. Furthermore, itis useful to clarify the conductivity characteristics of the polymerunder the in situ technique and wet condition due to the fact thatthe application of the polymers required immersing in electrolytesolutions. Cyclodextrins (CDs) are cyclic oligosaccharides built upfrom 1,4-glucopyranose units that exhibit a torus-shaped structurewith a hydrophobic cavity and a hydrophilic exterior. They canform inclusion complexes only with guest molecules of the propersizes [28]. This has led to considerable interest in using CDs in thesynthesis of conducting polymers. It has been found that CDsbound to the electrode acted as molecular templates to restrictthe growth sites of PPy within the b-CDs cavities [29,30]. Moleculartemplates, which can form an insertion complex with organicmonomer molecules, can be obtained by modifying gold electrodeswith SAMs of molecules of basket shape having hydrophobic cavi-ties [30]. For example, b-CD-SAMs on gold electrodes have beenshown to serve as molecular-size selective sensors for compoundssuch as p-benzoquinone, 2-methyl-1,4-naphthoquinone, and

J. Arjomandi, S. Eshghi / Journal of Electroanalytical Chemistry 690 (2013) 38–46 39
anthraquinone, as the cavities may or may not hold these com-pounds depending on their size [31]. CDs either added to solutionor bound to the electrode surface can cause beneficial changes forstereo selective organic electro synthesis and electro catalytic reac-tions. Electro analytical applications of CDs are based on formationof an inclusion complex, molecular recognition and selective preconcentration of analyte at the electrode. The electrochemicalbehavior of CDs and CD-inclusion complexes was reviewed by sev-eral researchers [32,33]. A lot of review investigations regardingCDs on electro analytical applications of the CD modified electrodesand highly selective sensors and indicators based on CDs [34]. Deriv-atives of CDs with organic sulfur groups have been shown to be ableto chemisorb on a gold surface and form highly organized monolay-ers. These monolayers are suitable for the investigation of relationsbetween the molecular structure and molecular-recognition prop-erties of CDs. The chemical structure of CD derivatives has a great ef-fect on the molecular organization of the monolayers [34]. CD-polymers as modifiers of metal electrodes have been investigatedby researchers. Several reports have focused on the synthesis andpreparation of an inclusion complex of poly(aniline-b-cyclodextrin)[35], poly(bithiophene-hydroxypropyl-b-cyclodextrin) [36], poly(pyrrole-sulfonated b-cyclodextrin), [37–39] and polypyrrole/c-cyclodextrin [40]. The host–guest interaction leads to encapsulationof monomer into the cavity of the oligosaccharides without the for-mation of chemical bonds and without changing their structure. Thedriving forces for the complexation are non-covalent: van der Waalsforces, hydrogen binding, hydrophobic interactions and energeticstabilization based on the transformation from a strained high-energy conformation to an unstrained low-energy form by thedisplacement of water molecules. Conversion of all seven primaries-OH groups of b-CD into -SH groups led to monolayer with substan-tially defect densities due to the lack of favorable lateral interactionsbetween the CD molecules. The growth mechanism of PPy at elec-trode modified with b-CD and kinetic parameter has been studiedpreviously [14,29]. In this report, the polymerization of pyrroleand N-methylpyrrole on the bare and modified gold electrode withT-a-CD-SAMs and the kinetic parameter has been compared andstudied. The cavity diameters of a-CD and b-CD are about 4.7–5.3[41] and 6.6–7.8 Å [42,43], respectively. The cavity of a-CD is smallerthan b-CD or c-CD. However; a-CD has a suitable cavity diameterwhich is perhaps enough to serve as an anchoring site for pyrroleand N-methylpyrrole monomers. We used thiolated a-cyclodextrincovered electrodes for performing molecular-size selective electro-chemistry. The cavities created by thiolated a-cyclodextrin adsorbedon gold or ITO/glass act as either an array of ultramicroelectrdes oranchoring sites depending on properties of molecules examined. Thein situ spectroelectrochemistry of PPy and PNMPy and growth ratesas a function of cycle number of pyrrole and N-methylpyrrole con-centrations were compared and studied.
2. Experimental
Pyrrole (Py) (Aldrich, 99%) and N-methylpyrrole (NMPy) (Aldrich,99%)) were distilled under vacuum, respectively. Cyclodextrin,hexadecanethiol (Aldrich), ferrocene (Aldrich) were used as re-ceived. The a-CD was thiolated according to the procedure pub-lished in the literature [30]. From that literature, the synthesisconsisted of two steps. The first was the preparation of per-6-iodo-a-CD, which was confirmed by 13C NMR signals (10.2 (C-6), 70.7(C-2), 71.5 (C-3), 72.2 (C-5), 86.1 (C-4), 101.2 (C-1)) and thenT-a-CD signals (26.1 (C-6), 72.0 (C-2, C-3), 72.8 (C-5), 84.7 (C-4),101.7 (C-1)). The CD3SOCD3 (Aldrich) used as a solvent. The 13CNMR results are in good agreement with the work elsewhere[31]. NMR spectra were recorded with a JEOL FX90Q FT-NMRspectrometer. An electrochemical cell with three- electrode config-
uration was used for electrochemical experiments. Polymers weregrown in an acetonitrile (Merck) solution containing 2% water,0.05, 0.10, 0.15, 0.20 and 0.25 M monomers (Py and NMPy) and0.1 M LiClO4 used as electrolyte (Heraeus, Germany) potentiody-namically by scanning the potential between different range foreach polymers using SAMA potentiostat–galvanostat. Gold elec-trode (area 0.024 cm2) were polished successively with 0.30 and0.05 lm alumina slurry (Fischer) and cleaned by dipping in piranhasolution prepared by mixing 70% concentrated sulfuric acid and 30%hydrogen peroxide by volume. Modified gold electrodes were pre-pared for electrochemical polymers growths. The electrodes withT-a-CD-SAMs with defect sites sealed with hexadecanethiol werethen washed with water and methanol thoroughly to remove resid-ual thiol and ferrocene molecules [29]. For UV–visible spectroscopyan ITO coated glass sheet (Praezisions Glas & Optik, Germany,R = 20 ± 5 ohm cm�2) was modified and used as a working electrode.The modified ITO/glass was prepared by dipping the ITO in a solutioncontaining 1.0 mM T-a-CD in a mixed solvent (3 dimethylsulfoxide:2 water by volume) for about 48 h. The ITO with the T-a-CD-SAMwas then washed thoroughly with water to remove any unbounda-CD molecules and then dipped in a solution containing 1.0 mMhexadecanethiol and 1.0 mM ferrocene in a mixed solvent of ethanoland water 1:1 by volume. The theoretically calculated values for thecoverage of a flat surface for the T-a-CD-SAMs on gold and ITO/glasswere approximately 6.9 � 1012 and 5.3 � 1012 molecules per cm2 ofa-CD molecules adsorbed on gold and ITO surface, respectively [31].For in situ resistivity measurements, a band-gap gold setup de-scribed elsewhere [44] (from AZAR electrode) was used as workingelectrodes. The two strips of the band gap electrode can be easilybridged through the deposition of conducting polymers as the sepa-ration between them is only a few micrometers. The surface area ofboth strips is very small. Therefore, due to the brittle nature of theelectrochemically synthesized conducting polymers, one cannot de-posit thick films. Otherwise the films will not be uniform; somethingwhich can considerably affect the experimental results [45]. Theinstrument for conductivity measurement was made by Sama Re-search Center. UV–visible-spectra were recorded with the polymersfilms deposited on an modified optically transparent ITO/glass elec-trode in the supporting electrolyte solution (acetonitrile + 0.1 MLiClO4) in a standard 10 mm cuvette using a UV–visible spectropho-tometer Perkin Elmer, 55 OSD. A cuvette with the same solution andan uncoated ITO/glass was placed in the reference beam. Spectrawere recorded at increasingly positive electrode potentials; in afew cases, spectra were recorded in the negative-going potentialdirection in order to test reversibility. The sample morphology hasbeen studied using a scanning electron microscopy (Philips SEMmodel XL30) accompanied with a sputter coater BAL-TEC, modelSCD050. Scanning electron microscope with secondary electrondetector (SE) is used to observe the surface of detector precisely.All experiments were performed at room temperature with nitro-gen-purged solutions.
3. Results and discussion
3.1. Cyclic voltammetry and kinetic measurements
Fig. 1a shows cyclic voltammograms (CVs) recorded at the goldelectrodes in 0.1 M HClO4 at dE/dt = 50 mV s�1. The current peaksassociated with the oxidation and reduction of the gold can be seenclearly. The CVs was repeated for 20 cycles in order to clean thegold of any surface impurities before deposition of the T-a-CD.Shown in Fig. 1b are representative CVs of T-a-CD-SAM in support-ing electrolyte solution (CH3CN + 0.1 M LiClO4) containing 2%water. T-a-CD-SAMs are present on the electrode surface andohmic slope was observed. The chemical integrity of the T-a-CD-SAMs is not affected within the potential range – 0.50 < EAg/
0.0 0.4 0.8 1.2 1.6 2.0
-10
-8
-6
-4
-2
0
2
4
-0.8 -0.4 0.0 0.4 0.8 1.2-0.15
-0.10
-0.05
0.00
0.05
0.10
0.15
0.20(b)
50th
10th20th
2nd1st cycle
I /m
A
(a)
I /m
A
EAg/AgCl / V EAg/AgCl / V
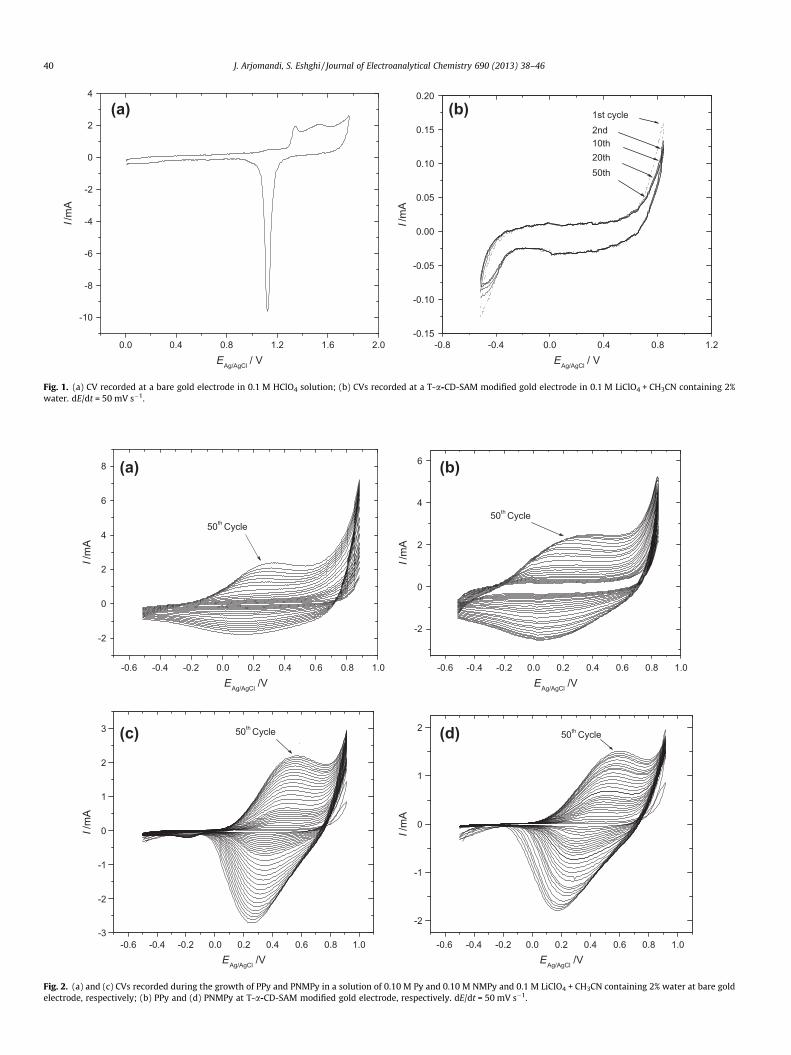
Fig. 1. (a) CV recorded at a bare gold electrode in 0.1 M HClO4 solution; (b) CVs recorded at a T-a-CD-SAM modified gold electrode in 0.1 M LiClO4 + CH3CN containing 2%water. dE/dt = 50 mV s�1.
-0.6 -0.4 -0.2 0.0 0.2 0.4 0.6 0.8 1.0
-2
0
2
4
6
8
-0.6 -0.4 -0.2 0.0 0.2 0.4 0.6 0.8 1.0
-2
0
2
4
6 (b)
I /m
A
-2
-1
0
1
2 (d)
I /m
A
-0.6 -0.4 -0.2 0.0 0.2 0.4 0.6 0.8 1.0-0.6 -0.4 -0.2 0.0 0.2 0.4 0.6 0.8 1.0-3
-2
-1
0
1
2
3 (c)
I /m
A
(a)
50th Cycle
50th Cycle50th Cycle
50th Cycle
I /m
A
EAg/AgCl /V EAg/AgCl /V
EAg/AgCl /VEAg/AgCl /V
Fig. 2. (a) and (c) CVs recorded during the growth of PPy and PNMPy in a solution of 0.10 M Py and 0.10 M NMPy and 0.1 M LiClO4 + CH3CN containing 2% water at bare goldelectrode, respectively; (b) PPy and (d) PNMPy at T-a-CD-SAM modified gold electrode, respectively. dE/dt = 50 mV s�1.
40 J. Arjomandi, S. Eshghi / Journal of Electroanalytical Chemistry 690 (2013) 38–46
0 10 20 30 40 50 60
0
2
4
6
8
10
12
0 3010 20 40 50 60
1
2
3
(d) 0.25 M
0.20 M
0.15 M0.10 M0.05 M
Cat
hodi
c C
harg
e, m
C
Cycle Number, (CN)0 10 20 30 40 50 60
0
1
2
3
4
0.25 M
0.20 M
0.15 M0.10 M
0.05 M
(c)
Cat
hodi
c C
harg
e, m
C
Cycle Number, (CN)
0 3010 20 40 50 60
0
2
4
6
8 (b) 0.25 M
0.20 M
0.15 M
0.10 M
0.05 M
Cat
hodi
c C
harg
e, m
C
Cycle number, (CN)
(a)C
atho
dic
Cha
rge,
mC
0.25 M
0.20 M
0.10 M
0.15 M
0.05 M
Cycle Number, (CN)
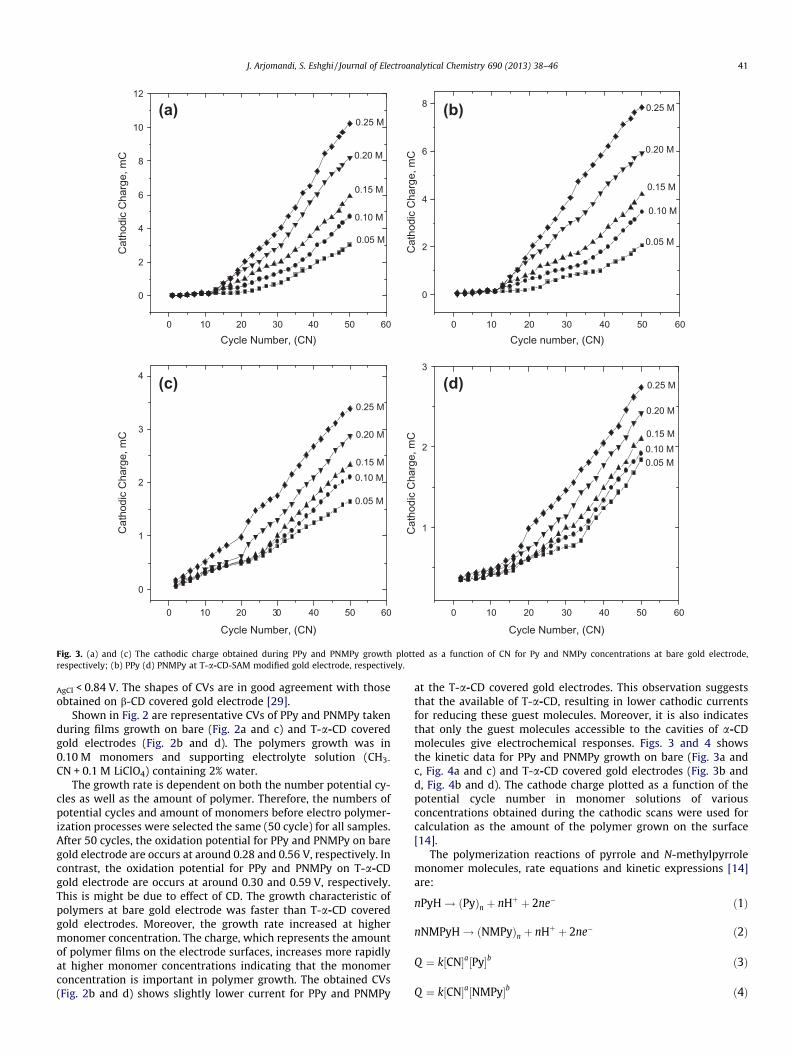
Fig. 3. (a) and (c) The cathodic charge obtained during PPy and PNMPy growth plotted as a function of CN for Py and NMPy concentrations at bare gold electrode,respectively; (b) PPy (d) PNMPy at T-a-CD-SAM modified gold electrode, respectively.
J. Arjomandi, S. Eshghi / Journal of Electroanalytical Chemistry 690 (2013) 38–46 41
AgCl < 0.84 V. The shapes of CVs are in good agreement with thoseobtained on b-CD covered gold electrode [29].
Shown in Fig. 2 are representative CVs of PPy and PNMPy takenduring films growth on bare (Fig. 2a and c) and T-a-CD coveredgold electrodes (Fig. 2b and d). The polymers growth was in0.10 M monomers and supporting electrolyte solution (CH3-
CN + 0.1 M LiClO4) containing 2% water.The growth rate is dependent on both the number potential cy-
cles as well as the amount of polymer. Therefore, the numbers ofpotential cycles and amount of monomers before electro polymer-ization processes were selected the same (50 cycle) for all samples.After 50 cycles, the oxidation potential for PPy and PNMPy on baregold electrode are occurs at around 0.28 and 0.56 V, respectively. Incontrast, the oxidation potential for PPy and PNMPy on T-a-CDgold electrode are occurs at around 0.30 and 0.59 V, respectively.This is might be due to effect of CD. The growth characteristic ofpolymers at bare gold electrode was faster than T-a-CD coveredgold electrodes. Moreover, the growth rate increased at highermonomer concentration. The charge, which represents the amountof polymer films on the electrode surfaces, increases more rapidlyat higher monomer concentrations indicating that the monomerconcentration is important in polymer growth. The obtained CVs(Fig. 2b and d) shows slightly lower current for PPy and PNMPy
at the T-a-CD covered gold electrodes. This observation suggeststhat the available of T-a-CD, resulting in lower cathodic currentsfor reducing these guest molecules. Moreover, it is also indicatesthat only the guest molecules accessible to the cavities of a-CDmolecules give electrochemical responses. Figs. 3 and 4 showsthe kinetic data for PPy and PNMPy growth on bare (Fig. 3a andc, Fig. 4a and c) and T-a-CD covered gold electrodes (Fig. 3b andd, Fig. 4b and d). The cathode charge plotted as a function of thepotential cycle number in monomer solutions of variousconcentrations obtained during the cathodic scans were used forcalculation as the amount of the polymer grown on the surface[14].
The polymerization reactions of pyrrole and N-methylpyrrolemonomer molecules, rate equations and kinetic expressions [14]are:
nPyH! ðPyÞn þ nHþ þ 2ne� ð1Þ
nNMPyH! ðNMPyÞn þ nHþ þ 2ne� ð2Þ
Q ¼ k½CN�a½Py�b ð3Þ
Q ¼ k½CN�a½NMPy�b ð4Þ
0 30 40
0
100
200
300
400
500
0 50 60
0
100
200
300
400 (d) 0.25 M
0.10 M
0.20 M
0.15 M
0.05 MdQ/d
[CN
]
Cycle Number (CN)0 10 20
10 20 50 60
30 40 50 60
0
100
200
300
400
500
0.05 M
0.10 M
0.25 M
0.20 M
0.15 M
(c)
dQ/d
[CN
]
Cycle Number (CN)
0 10
10 20 30 40
20 30 40 50 60
0
100
200
300
400
(b) 0.25 M
0.20 M
0.15 M
0.10 M
0.05 M
dQ/d
[CN
]
Cycle Number (CN)
(a) 0.25 M
0.20 M
0.15 M
0.10 M
0.05 M
dQ/d
[CN
]
Cycle Number (CN)
Fig. 4. (a–d) The dQ/d[CN] obtained for the data shown in Fig. 3a–d respectively.
Table 1Kinetic parameters calculated from Figs. 3 and 4.
Electrodes Reaction orders Reaction orders during the first 20 cycles
a b a b a0 b0
PPy at bare gold 2.43 ± 0.04 0.85 ± 0.02 0.32 ± 0.05 0.61 ± 0.01 0.46 0.60PNMPy at bare gold 2.31 ± 0.01 0.79 ± 0.04 0.28 ± 0.01 0.64 ± 0.03 0.41 0.55PPy at T-a-CD covered gold 2.23 ± 0.01 1.72 ± 0.05 0.62 ± 0.02 0.55 ± 0.04 0.49 0.35PNMPy at T-a-CD covered gold 2.07 ± 0.04 1.60 ± 0.02 0.57 ± 0.05 0.59 ± 0.01 0.41 0.30
42 J. Arjomandi, S. Eshghi / Journal of Electroanalytical Chemistry 690 (2013) 38–46
dQ=dðCNÞ ¼ akð1=aÞ½PyH�ðb=aÞ½Q �ða�1=aÞ ¼ k0½PyH�a0½Q �b
0ð5Þ
dQ=dðCNÞ ¼ akð1=aÞ½NMPyH�ðb=aÞ½Q �ða�1=aÞ ¼ k0½NMPyH�a0½Q �b
0ð6Þ
where Q is the amount of polymers formed and CN is the number ofthe potentiodynamic cycling for polymer growth. With using therate equations (Eqs. (3) and (4)) and kinetic expression (Eqs. (5)and (6)), the kinetic parameters obtained and listed in Table 1.
From those equations and plots in Figs. 3 and 4, the polymeriza-tion reactions are 0.73 and 0.81 orders with respect to the pyrroleand N-methylpyrrole concentrations and 0.61 and 0.64 orders withrespect to the amount of PPy and PNMPy at the bare gold electrode,respectively. The growth order is around 0.55 and 0.59 orders withrespect to the amount of PPy and PNMPy at the T-a-CD covered
gold electrodes. From Table 1, it can be seen that the growth rateis dependent on monomer concentration and amount of polymer.The growth order for both monomer concentrations is about 1/3and about 2/3 for polymers at bare gold electrodes. The result forpyrrole and PPy are in good agreement with other work [29]. How-ever, the growth order for N-methylpyrrole and PNMPy at baregold electrode is lower. Reaction orders of 1/3 for both polymerswith respect to the amount of polymers suggest that the polymergrows in one dimension [29]. The growth order for both polymers(about 1/3) appears to grow in one dimension or close to it at T-a-CD covered gold electrodes. The growth rate of PNMPy comparingwith PPy film is slightly lower at bare and T-a-CD covered goldelectrode surfaces. This is maybe due to the higher oxidation po-tential or slightly lower currents for PNMPy. As can be seen from
0
1
2
3
4
5
5.0
5.5
6.0
6.5(d)
log
R (O
hm)
4.0
4.5
5.0
5.5
6.0
6.5 (c)
log
R (O
hm)
200-600 -400 -200 0 200 400 600 800 1000
-600 -400 -200 0 200 400 600 800 1000-600 -400 -200 0 200 400 600 800 1000
-600 -400 -200 0 400 600 800 10001
2
3
4
5
6 (b)
log
R (O
hm)
(a)lo
g R
(Ohm
)
EAg/AgCl / mV EAg/AgCl / mV
EAg/AgCl / mVEAg/AgCl / mV
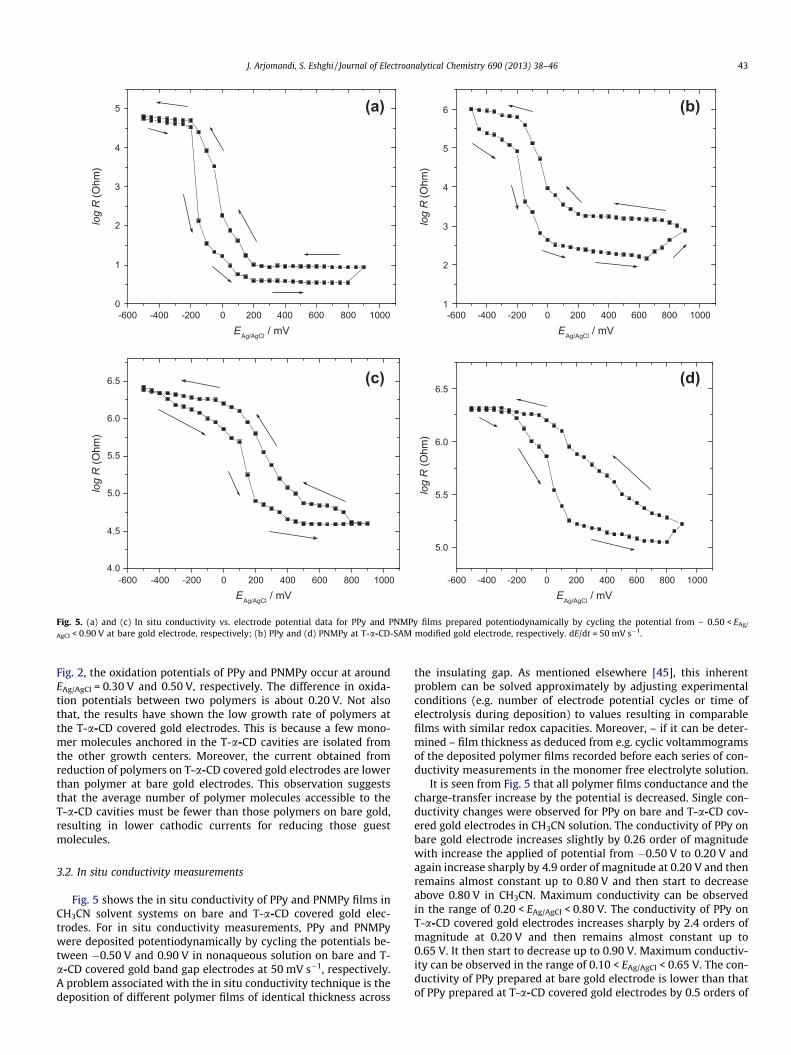
Fig. 5. (a) and (c) In situ conductivity vs. electrode potential data for PPy and PNMPy films prepared potentiodynamically by cycling the potential from – 0.50 < EAg/
AgCl < 0.90 V at bare gold electrode, respectively; (b) PPy and (d) PNMPy at T-a-CD-SAM modified gold electrode, respectively. dE/dt = 50 mV s�1.
J. Arjomandi, S. Eshghi / Journal of Electroanalytical Chemistry 690 (2013) 38–46 43
Fig. 2, the oxidation potentials of PPy and PNMPy occur at aroundEAg/AgCl = 0.30 V and 0.50 V, respectively. The difference in oxida-tion potentials between two polymers is about 0.20 V. Not alsothat, the results have shown the low growth rate of polymers atthe T-a-CD covered gold electrodes. This is because a few mono-mer molecules anchored in the T-a-CD cavities are isolated fromthe other growth centers. Moreover, the current obtained fromreduction of polymers on T-a-CD covered gold electrodes are lowerthan polymer at bare gold electrodes. This observation suggeststhat the average number of polymer molecules accessible to theT-a-CD cavities must be fewer than those polymers on bare gold,resulting in lower cathodic currents for reducing those guestmolecules.
3.2. In situ conductivity measurements
Fig. 5 shows the in situ conductivity of PPy and PNMPy films inCH3CN solvent systems on bare and T-a-CD covered gold elec-trodes. For in situ conductivity measurements, PPy and PNMPywere deposited potentiodynamically by cycling the potentials be-tween �0.50 V and 0.90 V in nonaqueous solution on bare and T-a-CD covered gold band gap electrodes at 50 mV s�1, respectively.A problem associated with the in situ conductivity technique is thedeposition of different polymer films of identical thickness across
the insulating gap. As mentioned elsewhere [45], this inherentproblem can be solved approximately by adjusting experimentalconditions (e.g. number of electrode potential cycles or time ofelectrolysis during deposition) to values resulting in comparablefilms with similar redox capacities. Moreover, – if it can be deter-mined – film thickness as deduced from e.g. cyclic voltammogramsof the deposited polymer films recorded before each series of con-ductivity measurements in the monomer free electrolyte solution.
It is seen from Fig. 5 that all polymer films conductance and thecharge-transfer increase by the potential is decreased. Single con-ductivity changes were observed for PPy on bare and T-a-CD cov-ered gold electrodes in CH3CN solution. The conductivity of PPy onbare gold electrode increases slightly by 0.26 order of magnitudewith increase the applied of potential from �0.50 V to 0.20 V andagain increase sharply by 4.9 order of magnitude at 0.20 V and thenremains almost constant up to 0.80 V and then start to decreaseabove 0.80 V in CH3CN. Maximum conductivity can be observedin the range of 0.20 < EAg/AgCl < 0.80 V. The conductivity of PPy onT-a-CD covered gold electrodes increases sharply by 2.4 orders ofmagnitude at 0.20 V and then remains almost constant up to0.65 V. It then start to decrease up to 0.90 V. Maximum conductiv-ity can be observed in the range of 0.10 < EAg/AgCl < 0.65 V. The con-ductivity of PPy prepared at bare gold electrode is lower than thatof PPy prepared at T-a-CD covered gold electrodes by 0.5 orders of

300 400 500 600 700 800 900 1000
0.2
0.3
0.4
0.5
600
0.2
0.4
0.6
0.8
1.0
0.9 V
-0.5 V
0.9 V
- 0.5
cB
A(d)
Abso
rban
ce /
-
Wavelength / nm
300 400 500 600 700 800 900
0.4
0.5
0.6
0.7
0.8
0.9
1.0
(b) C
B
A
0.9 V0.6 V
0.3 V0.5 V0.1 V- 0.1 V
- 0.3 V
- 0.5 V0.9 V
0.6 V0.7 V
0.5 V
0.3 V
0.1 V
- 0.1 V
- 0.3 V- 0.5 V
Abso
rban
ce /
-
(c)
(a)
300 400 500 600 700 800 300 400 500 700 800 900900 1000
0.4
0.6
0.8
1.0
1.2A
B
0.1 V
C
-0.3 V
0.9 V
-0.2 V-0.3 V
-0.1 V0.0 V
0.3 V0.4 V0.5 V0.6 V0.7 V
0.9 V0.8 VAb
sorb
ance
/ -
Wavelength / nm
C
B
A
0.0 V
0.8 V
0.4 V
- 0.4 V0.8 V0.6 V
0.4 V
0.2 V
0.0 V
- 0.2 V
- 0.4 V
Abso
rban
ce /
-
Wavelength / nm Wavelength / nm
Fig. 6. (a) and (c) In situ UV–visible spectra for PPy and PNMPy film in a solution of CH3CN + 0.1 M LiClO4 deposited potentiodynamically with – 0.50 < EAg/AgCl < 0.90 V in asolution of CH3CN + 0.1 M LiClO4 at different electrode potentials at ITO/glass, respectively [24,25]; (b) PPy and (d) PNMPy at T-a-CD-SAM modified ITO/glass, respectively.dE/dt = 50 mV s�1.
44 J. Arjomandi, S. Eshghi / Journal of Electroanalytical Chemistry 690 (2013) 38–46
magnitude. Like PPy, single conductivity changes were observedfor PNMPy on bare and T-a-CD covered gold electrodes in CH3CNsolution. The conductivity of PNMPy on bare gold electrode in-creases by 1.7 order of magnitude from �0.50 V to 0.40 V and thenremains almost constant up to 0.90 V. Maximum conductivity canbe observed in the range of 0.40 < EAg/AgCl < 0.90 V. The conductiv-ity of PNMPy on T-a-CD covered gold electrodes increases byaround 1.28 orders of magnitude with increase the applied of po-tential from �0.50 V to 0.20 V and then remains almost constantup to 0.80 V. It then start to decrease up to 0.90 V. Maximum con-ductivity can be observed in the range of 0.20 < EAg/AgCl < 0.80 V.The conductivity of polymers on T-a-CD covered gold band gapelectrodes is lower than polymer films on bare gold electrodes.This is may be due to polymer treatment at the presence of theT-a-CD. The average number of polymer molecules accessible tothe T-a-CD cavities must be fewer than those polymers on baregold electrode. Conductivity of PNMPy is lower than PPy films
[46,47]. This lower conductivity for PNMPy film compared withPPy film may be due to the lack of planarity or to the increasedchain separation in the polymer resulting from the increased sizeof the methyl group relative to hydrogen [17,18].
3.3. In situ UV–visible spectroscopy
In situ UV–visible spectra of PPy and PNMPy spectra on bareand T-a-CD covered ITO/glass are shown in Fig. 6. In situ UV–visi-ble spectra of PPy and PNMPy on bare ITO/glass were describedpreviously [17,18]. The PPy and PNMPy on T-a-CD covered ITO/glass prepared potentiodynamically by cycling the potentials from�0.50 V to 0.90 V in a nonaqueous solution (CH3CN + 0.1 M LiClO4)on ITO/glass, respectively.
The shapes of in situ spectra for PPy on bare ITO/glass areclearly different from polymers on T-a-CD covered ITO/glass. Thespectra features indicate the effect of T-a-CD in polymer back-

Fig. 7. SEM micrographs of (a) PPy, (b) PNMPy, (c) PPy-CD and (d) PNMPy-CD.
J. Arjomandi, S. Eshghi / Journal of Electroanalytical Chemistry 690 (2013) 38–46 45
bones. During oxidation of PPy films and with increasing the ap-plied potentials on bare ITO/glass (see Fig. 6a), a decreases inabsorbance around k = 360 nm and an increase of the band aroundk = 820 nm are observed. Similarly and during oxidation of PPyfilms on T-a-CD covered ITO/glass, a decrease in absorbancearound k = 380 and an increase in the absorbance aroundk = 860 nm are observed. However, with increasing the appliedpotentials, a shift of maximum absorbance towards shorter wave-lengths were occurs. The broad band between around k = 330 tok = 360 nm in PPy films on T-a-CD covered ITO/glass is narrowedto the sharp band around k = 360 nm in PPy on bare ITO/glass.The width of the absorption feature corresponds to the distributionof conjugation lengths in the polymer; a broad band is associatedwith a broad distribution [48]. On the other hand, a shift of the
maximum absorption about k = 880 nm for PPy on T-a-CD coveredITO/glass towards shorter wavelengths about k = 820 nm for PPyon bare ITO/glass suggested a longer conjugation. The treatmentsof PNMPy films on bare and T-a-CD covered ITO/glass are slightlysimilar. However, the shifts of the band absorptions are observed.During oxidation of PNMPy films and with increasing the appliedpotentials on bare ITO/glass (see Fig. 6c), increases of the band inabsorbance around k = 520 nm and k = 850 nm are observed. Simi-larly and during oxidation of PNMPy films on T-a-CD covered ITO/glass, increases of the band in absorbance around k = 520 nm andk = 850 nm are observed. With increasing the applied potentialup to EAg/AgCl = 0.90 V, a decreases of the band absorbance aroundk = 320 nm and around k = 380 nm are observed for PNMPy on bareand T-a-CD covered ITO/glass, respectively. The observed spectral
46 J. Arjomandi, S. Eshghi / Journal of Electroanalytical Chemistry 690 (2013) 38–46
features were attributed to transitions between three electroniclevels; including valence band, conduction band and polaron orbipolaron bands, respectively. The label A refer to the polymer filmin the reduced state and shows an absorption band aroundk = 350 nm which is attributed to the p–p� transition of the pyrroleor N-methylpyrrole. The label C referring to the fully oxidized blackform polymer film shows a broad absorption with a maximumaround k = 780 to k = 880 nm. Between these limits the film coloris violet due to a third absorption that develops at k = 460 tok = 540 nm (labeled B) [17,48]. This absorption is assigned to thehigh-energy polaron transition [49,50]. The in situ UV–visible re-sults clearly demonstrate that the T-a-CD covered ITO/glass couldnot inhibit the spectroscopic activation treatments of some con-ducting polymers like PPy and PNMPy. However, the affect of T-a-CD were reduced the conductivity of both polymer films.
3.4. Morphological study of polymers
The morphology and scanning electron microscopy (SEM)images of polymer films prepared at bare and T-a-CD-SAMs mod-ified electrodes under the same experimental conditions has beenstudied and shows in Fig. 7.
The PPy and PNMPy films reveal a smooth surface with isolatednodules and large particle aggregations with a cauliflower formgrowing over it (Fig. 7a and c). The shapes of polymer films pre-pared at T-a-CD-SAMs modified electrodes (Fig. 7b and d) are dif-ferent from polymer films prepared at bare electrodes. The picturestaken for polymers at T-a-CD-SAMs modified electrodes had a fullcoverage with a-CD-SAM with its defect sites sealed with hexadec-anethiol before the polymers were grown on it. The polymer be-comes more cross-linked as it grows with small circular particlesaggregated. The size of particles aggregations is smaller than PPyand PNMPy. The image of PPy- T-a-CD (right side of Fig. 7d) mayshow the cyclodextrin covered the polymer growth. Moreover,the images of NMPy-T-a-CD (Fig. 7d) show the polymer at thepresent of cyclodextrin. The SEM results are in good agreementwith those reported previously [29]. The image indicates that thepolymer films prepared at T-a-CD may have more porous struc-tures and shows a relatively less oriented than polymer preparedat bare electrodes.
4. Conclusions
The properties of PPy and PNMPy have been studied by itsgrowth kinetics measurements, cyclic voltammetry, in situ resis-tivity measurements, in situ UV–visible spectroelectrochemistryand SEM technique. The kinetic results indicate that the polymer-ization growth rate of PPy and PNMPy which prepared at bare goldelectrodes are faster than PPy and PNMPy on T-a-CD-SAMs modi-fied electrodes, respectively. However, the kinetic results indicatethat the polymerization growth rate of PPy is faster than PNMPy.In situ resistivity measurements of the obtained polymers indicatethat the films prepared at bare gold electrodes are lower resistancethan the polymer films prepared at T-a-CD-SAMs modified elec-trodes. The results of in situ UV–visible spectroscopy show thatthe characteristic absorptions bands associated with PNMPy andPPy with a considerable shifts with increasing the applied poten-tials. The SEM images indicate that the films prepared at T-a-CD-SAMs modified gold electrodes were different from polymer filmsprepared at bare gold electrodes. Moreover, the polymer films pre-pared at T-a-CD-SAMs modified electrodes grows as single fibersfrom the cyclodextrin cavities and eventually merged with othergrowth centers to give a one or two dimensional structure withnumerous cross links.
Acknowledgments
This work was sponsored by Bu Ali Sina University and wethank Miss. Eng. F. Hosseini (Sama Research Center) for her helpin making required instruments for measuring the in situ resistiv-ity and also thank AZAR electrode for preparing all electrodes.Stimulating discussions with A. Afkhami and his generous dona-tion of a-cyclodextrin is gratefully acknowledged.
References
[1] H. Nalwa, Handbook of Organic Conductive Molecules and Polymers, WileyVCH, Chichester, UK, 1997.
[2] T.A. Skotheim, R.L. Elsenbaumer, J.R. Reynolds (Eds.), Handbook of ConductingPolymers, Marcel Dekker, New York, 1998.
[3] C. Lin, B. Hwang, C. Lee, Methanol sensors based on the conductive polymercomposites from polypyrrole and poly (vinyl alcohol), Mater. Chem. Phys. 55(1998) 139–144.
[4] R. Holze, Handbook of Advanced Electronic and Photonic Materials andDevices, in: H.S. Nalwa (Ed.), Academic Press, San Diego, 2001, p. 209.
[5] W.R. Salaneck, I. Lundström, B.G. Rånby, Conjugated Polymers and RelatedMaterials: The Interconnection of Chemical and Electronic Structure:Proceedings of the Eighty-first Nobel Symposium, Oxford University Press,USA, 1993.
[6] T.V. Vernitskaya, O.N. Efimov, Russ. Chem. Rev. 66 (1997) 443–457.[7] M.I. Redondo, E. Sánchez de la Blanca, M.V. García, M.J. González-Tejera, Prog.
Org. Coat. 65 (2009) 386–391.[8] K. Sasano, K. Nakamura, K. Kaneto, Jpn. J. Appl. Phys. 232 (1993) 863–869.[9] E.M. Genies, A.A. Syed, Synthetic Met. 10 (1984) 21–30.
[10] E. Chaı̄net, M. Billon, Synthetic Met. 99 (1999) 21–26.[11] J. Serra Moreno, S. Panero, B. Scrosati, Electrochem. Acta 53 (2008) 2154–2160.[12] A.S. Sarac, S. Sezgin, M. Ates, C.M. Turhan, E.A. Parlak, B. Irfanoglu, Prog. Org.
Coat. 62 (2008) 331–335.[13] Stillwell, S.M. Park, J. Electrochem. Soc. 135 (1988) 2254.[14] B.S. Kim, W.H. Kim, S.N. Hoier, S.M. Park, Synthetic Met. 69 (1995) 455–458.[15] S. Sadki, P. Schottland, N. Brodie, G. Sabouraud, Chem. Soc. Rev. 29 (2000) 283–
293.[16] M. Nishizawa, T. Sawaguchi, T. Matsue, I. Uchida, Synthetic Met. 45 (1991)
241–248.[17] J. Arjomandi, R. Holze, J. Solid State Electr. 11 (2007) 1093–1100.[18] J. Arjomandi, R. Holze, Synthetic Met. 157 (2007) 1021–1028.[19] J. Arjomandi, R. Holze, Cent. Eur. J. Chem. 6 (2008) 199–207.[20] J. Arjomandi, A.H.A. Shah, S. Bilal, H. Van Hoang, R. Holze, Spectrochim. Acta A
78 (2011) 1–6.[21] J. Arjomandi, S. Safdar, M. Malmir, J. Electrochem. Soc. 159 (2012) E73–E81.[22] A.H.A. Shah, R. Holze, J. Electroanal. Chem. 597 (2006) 95–102.[23] A.H.A. Shah, R. Holze, Synthetic Met. 156 (2006) 566–575.[24] A.H.A. Shah, R. Holze, Electrochim. Acta 52 (2006) 1374–1382.[25] S. Bilal, R. Holze, Electrochim. Acta 52 (2007) 5346–5356.[26] S. Bilal, R. Holze, Electrochim. Acta 52 (2006) 1247–1257.[27] F. Alakhras, R. Holze, Synthetic Met. 157 (2007) 109–119.[28] S. Li, W.C. Purdy, Chem. Rev. 92 (1992) 1457–1470.[29] J.Y. Lee, S.M. Park, J. Electrochem. Soc. 147 (2000) 4189–4195.[30] M.T. Rojas, R. Koeniger, J.F. Stoddart, A.E. Kaifer, J. Am. Chem. Soc. 117 (1995)
336–343.[31] J.Y. Lee, S.M. Park, J. Phys. Chem. B 102 (1998) 9940–9945.[32] P.M. Bersier, J. Bersier, B. Klingert, Electroanalysis 3 (1991) 443–455.[33] D. Osella, A. Carretta, C. Nervi, M. Ravera, R. Gobetto, Organometallics 19
(2000) 2791–2797.[34] A. Ferancova, J. Labuda, J. Anal. Chem. 370 (2001) 1–10.[35] R.V. Belosludov, H. Mizuseki, K. Ichinoseki, Y. Kawazone, Jpn. J. Appl. Phys. 41
(2002) 2739–2741.[36] C. Lagrost, K.I.C. Ching, J.C. Lacroix, S. Aeiyach, M. Jouini, P.C. Lacaze, J. Tanguy,
J. Mater. Chem. 9 (1999) 2351–2358.[37] C. Lagrost, S. Aeiyach, M. Jouini, K. Chane-Ching, Chem. Commun. (1998) 489–
490.[38] K.R. Temsamani, H.B. Mark, W. Kutner, A.M. Stalcup, J. Solid State Electr. 6
(2002) 391–395.[39] N. Izaoumen, D. Bouchta, H. Zejli, M.E. Kaoutit, A.M. Stalcup, K.R. Temsamani,
Talanta 66 (2005) 111–117.[40] N. Izaoumen, D. Bouchta, H. Zejli, M. El Kaoutit, K.R. Temsamani, Anal. Lett. 38
(2005) 1869–1885.[41] K.A. Connors, Chem. Rev. 97 (1997) 1325–1352.[42] D.C. Harris, Quantitative Chemical Chemical Analysis, in: W.H. Freeman (Ed.),
New York, 1995, pp. 660.[43] Y. Maeda, T. Fukuda, H. Yamamoto, H. Kitano, Langmuir 13 (1997) 4187–4189.[44] R. Holze, J. Lippe, Synthetic Met. 38 (1990) 99–105.[45] S. Bilal, R. Holze, J. Electroanal. Chem. 592 (2006) 1–13.[46] C.T. Kou, T.R. Liou, Synthetic Met. 82 (1996) 167–173.[47] K. Hyodo, A. MacDiarmid, Synthetic Met. 11 (1985) 167–176.[48] K. Yakushi, L. Lauchlan, T. Clarke, G. Street, J. Chem. Phys. 79 (1983) 4478–4774.[49] J. Bredas, J. Scott, K. Yakushi, G. Street, Phys. Rev. B 30 (1984) 1023–1025.[50] G. Zotti, G. Schiavon, Synthetic Met. 30 (1989) 151–158.


![CRESST: First results with phonon light technique · CRESST type Detectors Resist ance [m Ω] normal-conducting super-conducting δT δR heat bath thermal link thermometer (W-film)](https://static.fdocument.org/doc/165x107/5ad4b2fb7f8b9aff228c27d0/cresst-first-results-with-phonon-light-type-detectors-resist-ance-m-normal-conducting.jpg)