
Improvement of transport properties and hydrogen permeation of chemically-stable proton-conducting...
12
Improvement of transport properties and hydrogen permeation of chemically- stable proton-conducting oxides based on the system BaZr 1-x-y Y x M y O 3-d { Sonia Escola ´stico, a Mariya Ivanova, b Cecilia Solı ´s, a Stefan Roitsch, c Wilhelm A. Meulenberg b and Jose ´ M. Serra* a Received 7th February 2012, Accepted 18th March 2012 DOI: 10.1039/c2ra20214j The structural and transport properties as well as the chemical stability of a series of proton- conducting oxides based on yttrium-doped barium zirconate were investigated. Specifically, Pr-, Fe- and Mn-doped BaZr 1-x-y Y x M y O 3-d compounds were prepared by solid state reaction. The compound exhibiting the highest total and protonic conductivity at elevated temperatures under reducing atmospheres was BaZr 0.8 Y 0.15 Mn 0.05 O 3-d . Temperature-programmed reduction experiments revealed a particular redox behavior related to the Mn-species under selected conditions. The hydrogen permeation was thoroughly studied as a function of the temperature, hydrogen concentration and the humidification degree in the sweep gas. Moreover, the transient processes induced by alternate step changes in the humidification degree of the sweep gas were analysed. The highest steady hydrogen evolution flow exceeded 0.03 ml min 21 cm 22 (0.9 mm-thick membrane) at 1000 uC for the humidified sweep gas. The stability of BaZr 0.8 Y 0.15 M 0.05 O 3-d under operation-relevant atmospheres (CO 2 -rich reducing atmosphere at high temperature) was tested using different techniques (X-ray diffraction (XRD), Raman, SEM, TEM and TG) and the results showed that this material is stable even when exposed to 115 ppm H 2 S. 1. Introduction Hydrogen permeation membranes based on ceramic proton- conducting oxides 1 may enable hydrogen purification and separation at high temperature, therefore making possible a high degree of integration in different industrial processes. Their implementation in water gas shift reactors in power plants applying fuel gasification schemes, e.g. IGCC, is of special importance. Process intensification due to thermodynamic displacement through in situ hydrogen extraction allows simplification of the process scheme and leads to an increase in the overall process efficiency and sustainability. Additionally, hydrogen separation enables CO 2 sequestration in power plants operating on carbon-based fuels (fossil fuels or biomass-derived fuels). A prerequisite for membrane materials in this application is their stability at high temperatures in reducing and CO 2 -rich environments, along with sufficient hydrogen permeability. Many perovskite oxides, such as the doped BaCeO 3 , SrCeO 3 , SrZrO 3 and BaZrO 3 are reported to have reasonable proton conductivity in hydrogen-rich and humid atmospheres. From these groups, BaCeO 3 -based compounds exhibit the highest conductivity, 2 however they suffer from insufficient chemical stability, especially in CO 2 -containing atmospheres. Exposure to CO 2 leads to material degradation due to the formation of barium carbonate (BaCO 3 ) and cerium oxide (CeO 2 ). 3 Nevertheless, BaZrO 3 -based compounds exhibit reasonable chemical stability but present lower conductivity, compared to the doped BaCeO 3 compounds, due to higher grain boundary transport limitations. 4,5 Moreover, the preparation of mem- branes made of doped BaZrO 3 requires high sintering tempera- tures to achieve appropriate densities or gas tightness, although different approaches have been proposed to circumvent this problem. 5–7 In order to achieve a compromise between proton conductivity and chemical stability, mixed solid solutions of BaCeO 3 and BaZrO 3 were developed, as reported elsewhere. 8,9 In order to be implemented as hydrogen separation mem- branes, these materials ought to present mixed proton–electron conductivity with a stable proton conductivity term and a sufficient electronic conductivity term. The first strategy is to develop composite membranes comprising a mixture of the proton-conducting ceramic and another purely electronic con- ducting material to enhance the electronic conduction. 10 The most promising approach involves a material tailored to boost the mixed conductivity, as reported in ref. 9, where electronic transport may be enhanced by means of intrinsic doping of the materials with multivalent cations. Concretely, BaCeO 3 was a Instituto de Tecnologı ´a Quı ´mica (Universidad Polite ´cnica de Valencia– Consejo Superior de Investigaciones Cientı ´ficas), Av. Naranjos s/n, E- 46022 Valencia, Spain. E-mail: [email protected]; Fax: +34963877809 b Forschungszentrum Ju ¨lich GmbH, Institute of Energy and Climate Research-IEK-1, Leo-Brandt-Str. 1, D-52425 Ju ¨lich, Germany c Ernst Ruska-Centre for Microscopy and Spectroscopy with Electrons, RWTH Aachen University, Ahornstr. 55, 52074 Aachen, Germany { Electronic Supplementary Information (ESI) available. See DOI: 10.1039/c2ra20214j/ RSC Advances Dynamic Article Links Cite this: RSC Advances, 2012, 2, 4932–4943 www.rsc.org/advances PAPER 4932 | RSC Adv., 2012, 2, 4932–4943 This journal is ß The Royal Society of Chemistry 2012 Published on 20 March 2012. Downloaded on 20/06/2014 11:24:33. View Article Online / Journal Homepage / Table of Contents for this issue
Transcript of Improvement of transport properties and hydrogen permeation of chemically-stable proton-conducting...
Improvement of transport properties and hydrogen permeation of chemically-stable proton-conducting oxides based on the system BaZr1-x-yYxMyO3-d{
Sonia Escolastico,a Mariya Ivanova,b Cecilia Solıs,a Stefan Roitsch,c Wilhelm A. Meulenbergb and Jose M.
Serra*a
Received 7th February 2012, Accepted 18th March 2012
DOI: 10.1039/c2ra20214j
The structural and transport properties as well as the chemical stability of a series of proton-
conducting oxides based on yttrium-doped barium zirconate were investigated. Specifically, Pr-, Fe-
and Mn-doped BaZr1-x-yYxMyO3-d compounds were prepared by solid state reaction. The compound
exhibiting the highest total and protonic conductivity at elevated temperatures under reducing
atmospheres was BaZr0.8Y0.15Mn0.05O3-d. Temperature-programmed reduction experiments revealed
a particular redox behavior related to the Mn-species under selected conditions. The hydrogen
permeation was thoroughly studied as a function of the temperature, hydrogen concentration and the
humidification degree in the sweep gas. Moreover, the transient processes induced by alternate step
changes in the humidification degree of the sweep gas were analysed. The highest steady hydrogen
evolution flow exceeded 0.03 ml min21 cm22 (0.9 mm-thick membrane) at 1000 uC for the humidified
sweep gas. The stability of BaZr0.8Y0.15M0.05O3-d under operation-relevant atmospheres (CO2-rich
reducing atmosphere at high temperature) was tested using different techniques (X-ray diffraction
(XRD), Raman, SEM, TEM and TG) and the results showed that this material is stable even when
exposed to 115 ppm H2S.
1. Introduction
Hydrogen permeation membranes based on ceramic proton-
conducting oxides1 may enable hydrogen purification and
separation at high temperature, therefore making possible a
high degree of integration in different industrial processes. Their
implementation in water gas shift reactors in power plants
applying fuel gasification schemes, e.g. IGCC, is of special
importance. Process intensification due to thermodynamic
displacement through in situ hydrogen extraction allows
simplification of the process scheme and leads to an increase in
the overall process efficiency and sustainability. Additionally,
hydrogen separation enables CO2 sequestration in power plants
operating on carbon-based fuels (fossil fuels or biomass-derived
fuels). A prerequisite for membrane materials in this application
is their stability at high temperatures in reducing and CO2-rich
environments, along with sufficient hydrogen permeability.
Many perovskite oxides, such as the doped BaCeO3, SrCeO3,
SrZrO3 and BaZrO3 are reported to have reasonable proton
conductivity in hydrogen-rich and humid atmospheres. From
these groups, BaCeO3-based compounds exhibit the highest
conductivity,2 however they suffer from insufficient chemical
stability, especially in CO2-containing atmospheres. Exposure to
CO2 leads to material degradation due to the formation of
barium carbonate (BaCO3) and cerium oxide (CeO2).3
Nevertheless, BaZrO3-based compounds exhibit reasonable
chemical stability but present lower conductivity, compared to
the doped BaCeO3 compounds, due to higher grain boundary
transport limitations.4,5 Moreover, the preparation of mem-
branes made of doped BaZrO3 requires high sintering tempera-
tures to achieve appropriate densities or gas tightness, although
different approaches have been proposed to circumvent this
problem.5–7 In order to achieve a compromise between proton
conductivity and chemical stability, mixed solid solutions of
BaCeO3 and BaZrO3 were developed, as reported elsewhere.8,9
In order to be implemented as hydrogen separation mem-
branes, these materials ought to present mixed proton–electron
conductivity with a stable proton conductivity term and a
sufficient electronic conductivity term. The first strategy is to
develop composite membranes comprising a mixture of the
proton-conducting ceramic and another purely electronic con-
ducting material to enhance the electronic conduction.10 The
most promising approach involves a material tailored to boost
the mixed conductivity, as reported in ref. 9, where electronic
transport may be enhanced by means of intrinsic doping of the
materials with multivalent cations. Concretely, BaCeO3 was
aInstituto de Tecnologıa Quımica (Universidad Politecnica de Valencia–Consejo Superior de Investigaciones Cientıficas), Av. Naranjos s/n, E-46022 Valencia, Spain. E-mail: [email protected]; Fax: +34963877809bForschungszentrum Julich GmbH, Institute of Energy and ClimateResearch-IEK-1, Leo-Brandt-Str. 1, D-52425 Julich, GermanycErnst Ruska-Centre for Microscopy and Spectroscopy with Electrons,RWTH Aachen University, Ahornstr. 55, 52074 Aachen, Germany{ Electronic Supplementary Information (ESI) available. See DOI:10.1039/c2ra20214j/
RSC Advances Dynamic Article Links
Cite this: RSC Advances, 2012, 2, 4932–4943
www.rsc.org/advances PAPER
4932 | RSC Adv., 2012, 2, 4932–4943 This journal is � The Royal Society of Chemistry 2012
Publ
ishe
d on
20
Mar
ch 2
012.
Dow
nloa
ded
on 2
0/06
/201
4 11
:24:
33.
View Article Online / Journal Homepage / Table of Contents for this issue
doped with Eu and Sm by Wachsman et al., and as a result the
ambipolar conductivity and hydrogen permeation were
improved.11–13 Other important works have explored the doping
of (Ba,Sr)CeO3 with Tb,14 Tm,15 Yb16 and Nd.17 A recent
study18 on thin supported membranes manufactured from Eu-
doped Sr(Zr,Ce)O3 solid solutions, reports peak hydrogen flow
exceeding 0.5 ml min21 cm22 at 900 uC for a 20 mm-thick
membrane. Recently, systematic studies19–21 on barium zirconate
have illustrated the high potential of these materials for practical
application as hydrogen membranes and ceramic proton-
conducting fuel cell components.
In this work, the effect of B-site partial substitution in the
perovskite-structured BaZr0.9Y0.1O3-d material on ionic and
electronic conductivity was studied. As a reference compound,
the state-of-the-art protonic conductor BaZr0.9Y0.1O3-d was
selected due to its high bulk protonic conductivity,22,23 although
the conductivity in polycrystalline samples drops due to the high
grain boundary resistance reported for this material.24–27 Since
hydrogen permeation requires mixed proton–electron conduc-
tivity, the structure and electrical properties of the reference
material were modified by incorporating different cations (Fe,
Mn and Pr) with variable oxidation states on the B-site position
in the perovskite, aiming to improve the electronic conductivity.
Moreover, the incorporation of these elements could also affect
the grain boundary resistance by decreasing it. The present
contribution shows a structural study of these compounds, their
electrical conductivity under operating conditions, their stability
under application-oriented atmospheres and the H2-permeation
of a selected compound.
2. Experimental
2.1. Sample preparation
The solid state reaction method was used for the manufacturing
of the compounds in the series BaZr1-x-yYxMyO3-d studied in this
work. For this purpose, BaCO3, ZrO2, Y2O3 and the corre-
sponding metal oxides were weighed in stoichiometric propor-
tions, thoroughly mixed and ball milled for 10 h. Subsequent
calcination followed at 1400 uC for 32 h, and the resulting
materials were ball milled for 1 day using zirconia balls.
Rectangular bar samples used in the electrochemical study
were prepared from the resulting BaZr1-x-yYxMyO3-d (where
x = 0.1 when y = 0, 0.05 and x = 0.15 when y = 0.05) powders via
uniaxial pressing at 100 MPa. The green geometry of the bars
was 40 6 5 6 4 mm3. The samples were sintered in air at
1700 uC for 30 h, obtaining a density of about 99%, as
determined by the Archimedes method.
For the permeation tests in the present work, disc shaped
samples with a diameter of 15 mm (in the sintered state) were
uniaxially pressed at 72 MPa and sintered at 1700 uC for 30 h in
air. Both disc sides were coated by screen printing with a 20 mm
layer of Pt ink (Mateck, Germany), aiming to improve surface
catalytic behavior. Pt coatings are not connected on the side.
2.2. Characterisation techniques
Structural and microstructural characterization. In order to
control the crystallographic symmetry and phase purity of the
manufactured compounds, XRD analysis was carried out on the
synthesized powders by means of PANalytical CubiX FAST
equipment with monochromatic Cu-Ka radiation (l =
1.5406 A). XRD patterns were recorded in the 2h-diffraction
angle range from 20u to 70u and analyzed using Highscore Philips
software.
The microstructure of the sintered samples was characterized
by means of scanning electron microscope Zeiss Ultra55 and
transmission electron microscope FEI Tecnai F20 (with an
acceleration voltage of 200 kV). TEM lamellas were prepared by
means of a FIB (Focused-Ion Beam, FEI Helios Nanolab 400 s),
with the subsequent thinning performed in a BAL-TEC RES-
120.
Electrochemical tests. Electrical conductivity measurements
were carried out by standard four-point DC technique on
sintered bars. Silver paste and wires were used for contact with
the samples. The constant current was supplied by a program-
mable current source (Keithley 2601), while the voltage drop
across the sample was detected by a multimeter (Keithley 3706).
The voltage was measured with the current in both forward and
reverse directions, in order to eliminate the thermal effects and to
avoid non-ohmic responses. Conductivity measurements were
performed as a function of pO2 in the range 2 6 1025 to 1 atm,
using different concentrations of O2 in Ar from calibrated gas
cylinders (Linde).
Furthermore, the hydration and isotopic effects were studied
in: (1) dry helium and helium saturated with H2O and D2O; (2)
dry oxygen and moist oxygen with H2O and D2O; (3) dry
hydrogen, hydrogen saturated with H2O, dry deuterium and
deuterium saturated with D2O. In all experiments using H2O and
D2O, the saturation was carried out at room temperature.
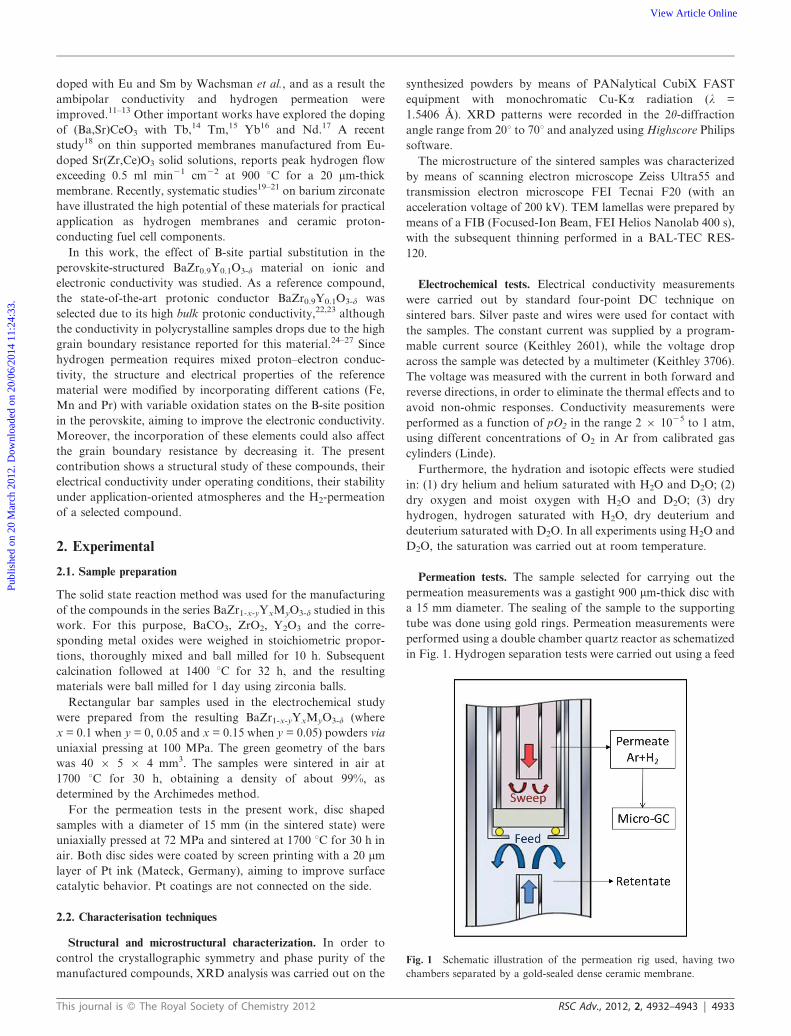
Permeation tests. The sample selected for carrying out the
permeation measurements was a gastight 900 mm-thick disc with
a 15 mm diameter. The sealing of the sample to the supporting
tube was done using gold rings. Permeation measurements were
performed using a double chamber quartz reactor as schematized
in Fig. 1. Hydrogen separation tests were carried out using a feed
Fig. 1 Schematic illustration of the permeation rig used, having two
chambers separated by a gold-sealed dense ceramic membrane.
This journal is � The Royal Society of Chemistry 2012 RSC Adv., 2012, 2, 4932–4943 | 4933
Publ
ishe
d on
20
Mar
ch 2
012.
Dow
nloa
ded
on 2
0/06
/201
4 11
:24:
33.
View Article Online
comprising a mixture of H2 in He (dry or saturated in water at
25 uC) and argon as the sweep gas (permeate side). The flow rates
of all gas feed streams were controlled using mass flow
controllers (MFCs). The flow rates were 100 ml min21 cm22 at
the feed side and 150 ml min21 cm22 at the sweep side. From the
hydrogen content measured on the argon side (permeate side)
and the argon flow rate, the total hydrogen permeation rate was
calculated, assuming the ideal gas law. The permeation fluxes in
ml min21 cm22 were calculated by dividing the permeation rates
by the effective surface area of the membrane. The hydrogen
content in the permeate side was analyzed using a micro-GC
Varian CP-4900 equipped with Molsieve5A, PoraPlot-Q glass
capillary, and CP-Sil modules. Qualitative analysis of water
concentration was done in the PoraPlot-Q channel. Appropriate
sealing was confirmed by measuring the helium tracer concentra-
tion in the permeate stream. An acceptable sealing was achieved
when the helium concentration was lower than 5% of the H2
permeated. Feed humidification was accomplished by saturation
at 20 uC using Milli-Q water. Data reported in the present study
were recorded at a steady state after thirty minutes of stabilization,
and each test has been repeated three times to minimize analysis
error, obtaining an experimental standard deviation of 1024.
Stability tests in CO2 and other acid atmospheres. Chemical
stability of BaZr1-x-yYxMyO3 powders was tested against
reducing atmospheres. Two sets of experimental conditions were
selected:
(1) Treatment in a continuous gas flow of 10% CO2 and 90%
CH4, both dry and humidified (2.5% water) at 700 uC and 800 uCfor 72 h.
(2) Treatment under continuous gas flow composed of
115 ppm H2S, 4.43% CO2, 2.12% CO and 92.09% H2 at
500 uC, 30 bars, for 40 h.
The stability was controlled by XRD analysis before and after
the treatments in order to observe microstructural and/or phase
changes in the materials as a result of this short-term reduction
of environmental exposure.
In addition, thermogravimetric (TG) measurements were
performed on powder samples exposed to dry CO2 (5% in Ar)
flow in the temperature range from 25 uC to 1000 uC with a
heating ramp of 10 K min21. For this purpose a Metler-Toledo
StarE balance was used.
In order to check the in situ changes of the powders, Raman
spectra were gathered using a CCR1000 Linkan Raman stage.
The BaZr1-x-yYxMyO3 powders were heated up to 850 uC in
oxygen, then the atmosphere was changed to 15% CO2 in Ar and
then cooled down to 25 uC without changing the gas environ-
ment. Raman analysis was performed with a Renishaw inVia
Raman spectrometer equipped with a Leica DMLM microscope
and a 514 nm Ar+ ion laser as an excitation source. A 650
objective of 8 mm optical length was used to focus the
depolarized laser beam on a spot of 3 mm in diameter. A CCD
array detector was used for collection of the Raman scattering.
3. Results and discussion
BaZr0.9Y0.1O3-d was doped with Pr, Fe and Mn, aiming to
modify the initial structure and create chemical defects, as well as
to test the electrochemical and transport properties of the parent
compound. Furthermore, in the Mn-doped compound the quantity
of Y was also increased, aiming to improve specifically the protonic
conductivity. For these reasons the selected compositions for this
study were: BaZr0.9Y0.1O3-d, BaZr0.85Y0.1Pr0.05O3-d, BaZr0.85Y0.1Fe0.05O3-d,
BaZr0.85Y0.1Mn0.05O3-d and BaZr0.8Y0.15Mn0.05O3-d.
3.1. Structural and microstructural characterization
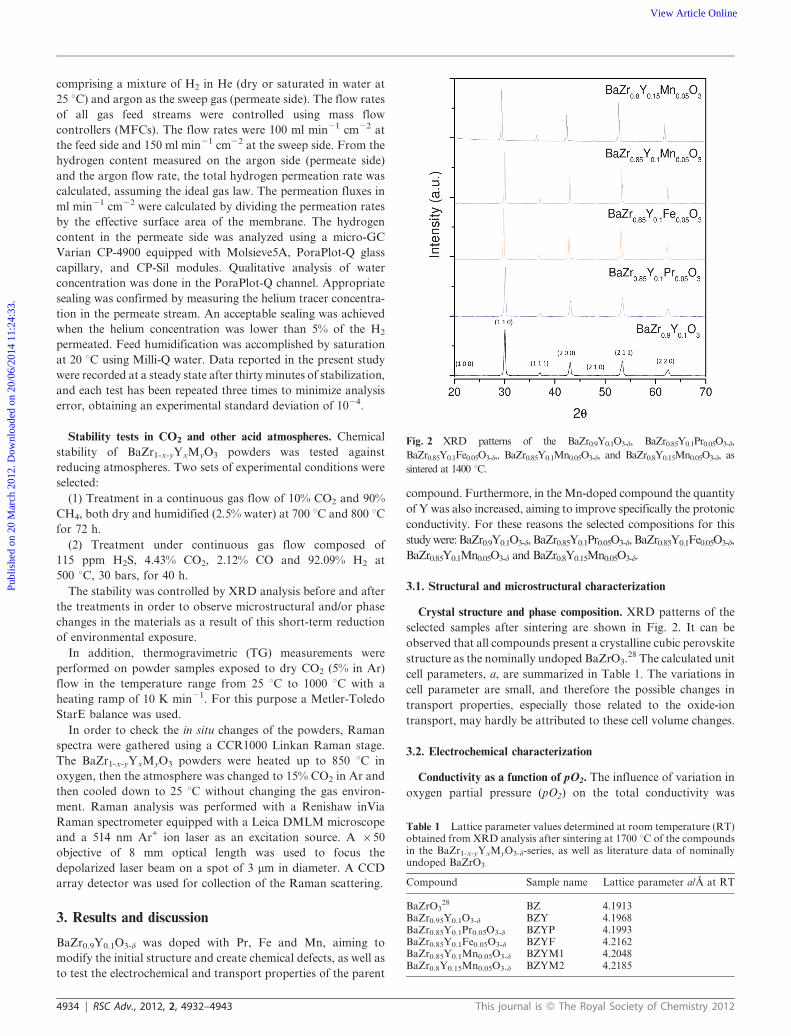
Crystal structure and phase composition. XRD patterns of the
selected samples after sintering are shown in Fig. 2. It can be
observed that all compounds present a crystalline cubic perovskite
structure as the nominally undoped BaZrO3.28 The calculated unit
cell parameters, a, are summarized in Table 1. The variations in
cell parameter are small, and therefore the possible changes in
transport properties, especially those related to the oxide-ion
transport, may hardly be attributed to these cell volume changes.
3.2. Electrochemical characterization
Conductivity as a function of pO2. The influence of variation in
oxygen partial pressure (pO2) on the total conductivity was
Fig. 2 XRD patterns of the BaZr0.9Y0.1O3-d, BaZr0.85Y0.1Pr0.05O3-d,
BaZr0.85Y0.1Fe0.05O3-d,, BaZr0.85Y0.1Mn0.05O3-d, and BaZr0.8Y0.15Mn0.05O3-d, as
sintered at 1400 uC.
Table 1 Lattice parameter values determined at room temperature (RT)obtained from XRD analysis after sintering at 1700 uC of the compoundsin the BaZr1-x-yYxMyO3-d-series, as well as literature data of nominallyundoped BaZrO3
Compound Sample name Lattice parameter a/A at RT
BaZrO328 BZ 4.1913
BaZr0.95Y0.1O3-d BZY 4.1968BaZr0.85Y0.1Pr0.05O3-d BZYP 4.1993BaZr0.85Y0.1Fe0.05O3-d BZYF 4.2162BaZr0.85Y0.1Mn0.05O3-d BZYM1 4.2048BaZr0.8Y0.15Mn0.05O3-d BZYM2 4.2185
4934 | RSC Adv., 2012, 2, 4932–4943 This journal is � The Royal Society of Chemistry 2012
Publ
ishe
d on
20
Mar
ch 2
012.
Dow
nloa
ded
on 2
0/06
/201
4 11
:24:
33.
View Article Online
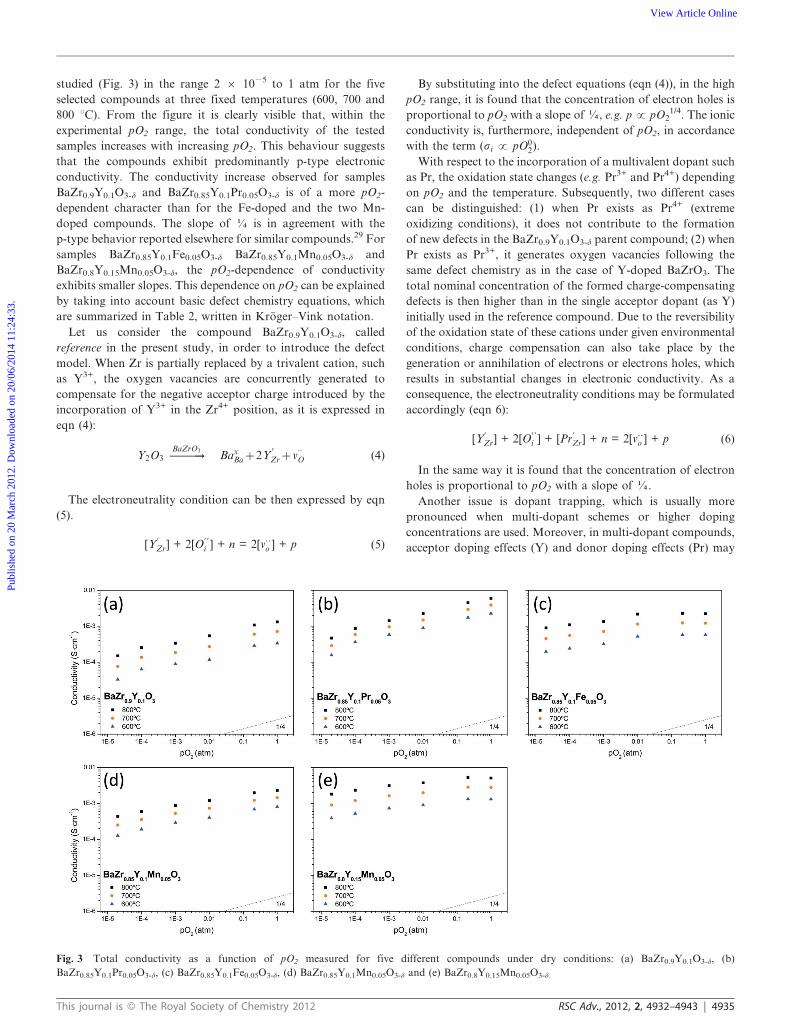
studied (Fig. 3) in the range 2 6 1025 to 1 atm for the five
selected compounds at three fixed temperatures (600, 700 and
800 uC). From the figure it is clearly visible that, within the
experimental pO2 range, the total conductivity of the tested
samples increases with increasing pO2. This behaviour suggests
that the compounds exhibit predominantly p-type electronic
conductivity. The conductivity increase observed for samples
BaZr0.9Y0.1O3-d and BaZr0.85Y0.1Pr0.05O3-d is of a more pO2-
dependent character than for the Fe-doped and the two Mn-
doped compounds. The slope of J is in agreement with the
p-type behavior reported elsewhere for similar compounds.29 For
samples BaZr0.85Y0.1Fe0.05O3-d BaZr0.85Y0.1Mn0.05O3-d and
BaZr0.8Y0.15Mn0.05O3-d, the pO2-dependence of conductivity
exhibits smaller slopes. This dependence on pO2 can be explained
by taking into account basic defect chemistry equations, which
are summarized in Table 2, written in Kroger–Vink notation.
Let us consider the compound BaZr0.9Y0.1O3-d, called
reference in the present study, in order to introduce the defect
model. When Zr is partially replaced by a trivalent cation, such
as Y3+, the oxygen vacancies are concurrently generated to
compensate for the negative acceptor charge introduced by the
incorporation of Y3+ in the Zr4+ position, as it is expressed in
eqn (4):
Y2O3 ?BaZrO3
BaxBaz2Y
0
Zrzv::
O (4)
The electroneutrality condition can be then expressed by eqn
(5).
[Y9Zr] + 2[O99
i ] + n = 2[v??o ] + p (5)
By substituting into the defect equations (eqn (4)), in the high
pO2 range, it is found that the concentration of electron holes is
proportional to pO2 with a slope of J, e.g. p 3 pO21/4. The ionic
conductivity is, furthermore, independent of pO2, in accordance
with the term (si 3 pO02).
With respect to the incorporation of a multivalent dopant such
as Pr, the oxidation state changes (e.g. Pr3+ and Pr4+) depending
on pO2 and the temperature. Subsequently, two different cases
can be distinguished: (1) when Pr exists as Pr4+ (extreme
oxidizing conditions), it does not contribute to the formation
of new defects in the BaZr0.9Y0.1O3-d parent compound; (2) when
Pr exists as Pr3+, it generates oxygen vacancies following the
same defect chemistry as in the case of Y-doped BaZrO3. The
total nominal concentration of the formed charge-compensating
defects is then higher than in the single acceptor dopant (as Y)
initially used in the reference compound. Due to the reversibility
of the oxidation state of these cations under given environmental
conditions, charge compensation can also take place by the
generation or annihilation of electrons or electrons holes, which
results in substantial changes in electronic conductivity. As a
consequence, the electroneutrality conditions may be formulated
accordingly (eqn 6):
[Y9Zr] + 2[O99
i ] + [Pr9Zr] + n = 2[v??
o ] + p (6)
In the same way it is found that the concentration of electron
holes is proportional to pO2 with a slope of J.
Another issue is dopant trapping, which is usually more
pronounced when multi-dopant schemes or higher doping
concentrations are used. Moreover, in multi-dopant compounds,
acceptor doping effects (Y) and donor doping effects (Pr) may
Fig. 3 Total conductivity as a function of pO2 measured for five different compounds under dry conditions: (a) BaZr0.9Y0.1O3-d, (b)
BaZr0.85Y0.1Pr0.05O3-d, (c) BaZr0.85Y0.1Fe0.05O3-d, (d) BaZr0.85Y0.1Mn0.05O3-d and (e) BaZr0.8Y0.15Mn0.05O3-d.
This journal is � The Royal Society of Chemistry 2012 RSC Adv., 2012, 2, 4932–4943 | 4935
Publ
ishe
d on
20
Mar
ch 2
012.
Dow
nloa
ded
on 2
0/06
/201
4 11
:24:
33.
View Article Online
compensate depending on dopant concentration and environ-
mental conditions.
In the case of Fe and Mn cations used as dopants in the
referent BaZr0.9Y0.1O3-d compound, a slightly different defect
chemistry situation can be considered as they can also be in the
+2 oxidation state, along with the previously discussed +3 and
+4 states. In this case, the electroneutrality condition can be
expressed by eqn (7) and eqn (8) for Fe and Mn, respectively.
[Y9Zr] + 2[O99
i ] + [Fe9Zr] + [Fe99
Zr] + n = 2[v??o ] + p (7)
[Y9Zr] + 2[O99
i ] + [Mn9Zr] + 2[Mn99
Zr] + n = 2[v??o ] + p (8)
As has been mentioned above, Fe and Mn doped compounds
exhibit conductivity that is slightly less dependent on the pO2
than those having a slope of J (Fig. 3). This effect can be
ascribed to a transition situation between the two limiting defect
states, the pure p-type electronic regime (with pO21/4 depen-
dency) and the pure ionic regime (independent of pO2).
Conductivity measurements as a function of temperature. A
study of conductivity as a function of temperature was carried
out in dry and humidified atmospheres (2.5% H2O or 2.5%
D2O), in order to determine the hydration and isotopic effects in
oxidizing (O2) and reducing (5% H2–95% He and 5% D2–95%
He) atmospheres.
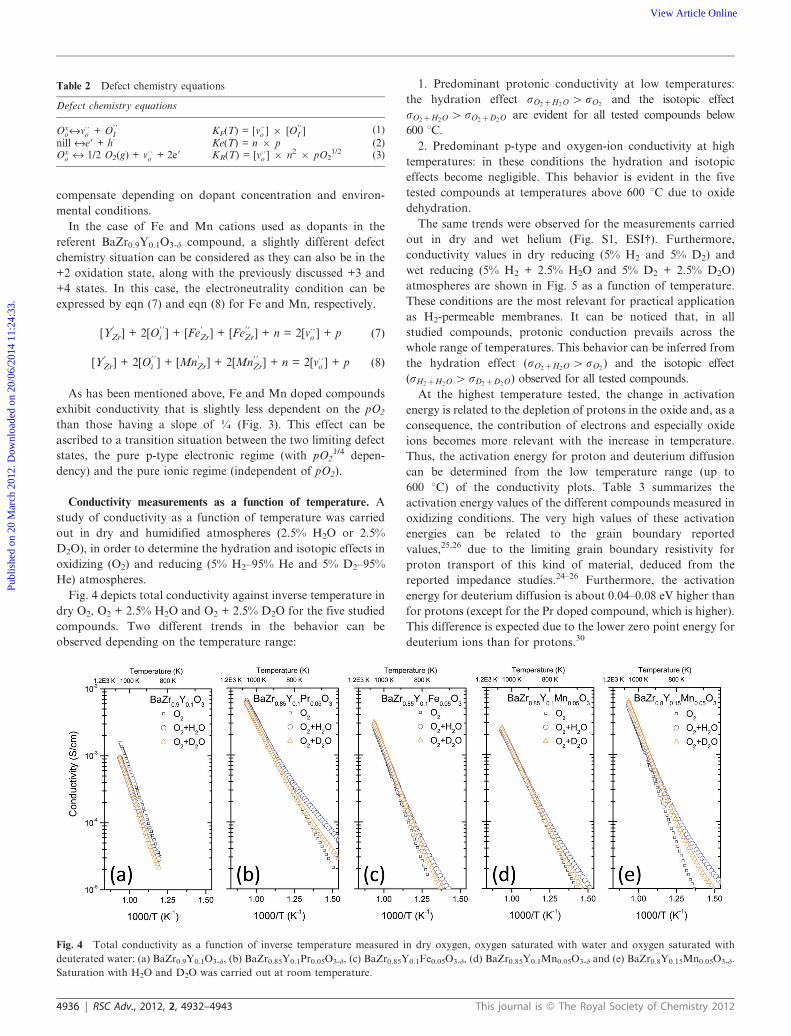
Fig. 4 depicts total conductivity against inverse temperature in
dry O2, O2 + 2.5% H2O and O2 + 2.5% D2O for the five studied
compounds. Two different trends in the behavior can be
observed depending on the temperature range:
1. Predominant protonic conductivity at low temperatures:
the hydration effect sO2zH2O w sO2and the isotopic effect
sO2zH2O w sO2zD2O are evident for all tested compounds below
600 uC.
2. Predominant p-type and oxygen-ion conductivity at high
temperatures: in these conditions the hydration and isotopic
effects become negligible. This behavior is evident in the five
tested compounds at temperatures above 600 uC due to oxide
dehydration.
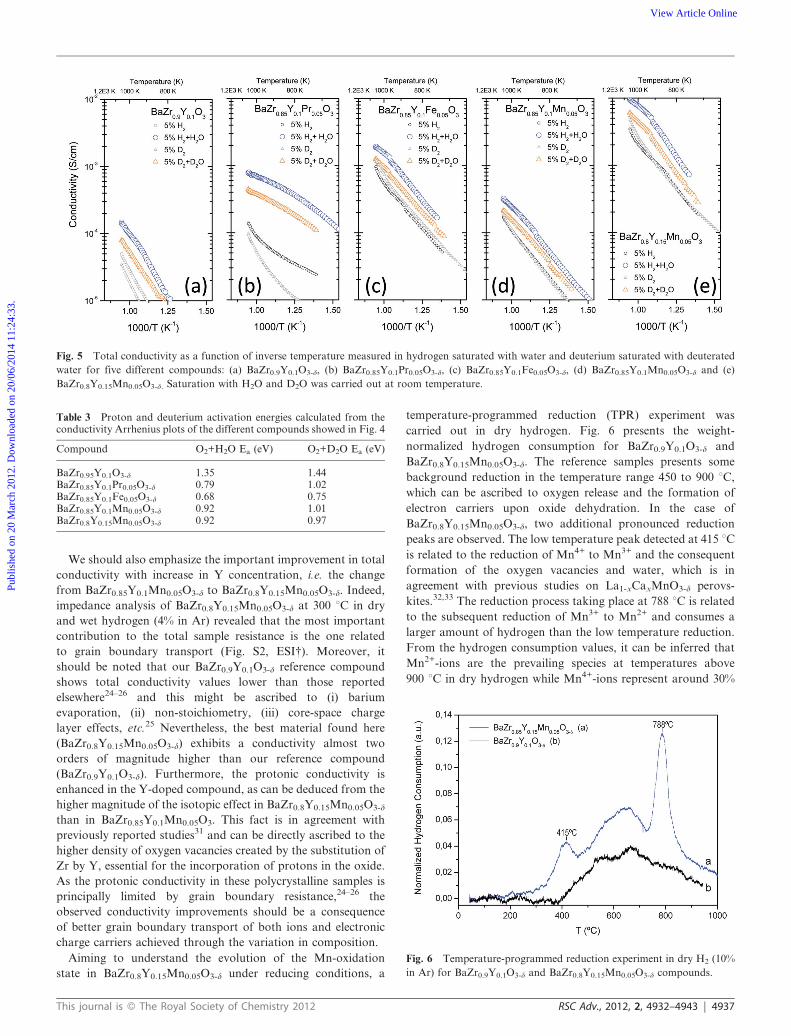
The same trends were observed for the measurements carried
out in dry and wet helium (Fig. S1, ESI{). Furthermore,
conductivity values in dry reducing (5% H2 and 5% D2) and
wet reducing (5% H2 + 2.5% H2O and 5% D2 + 2.5% D2O)
atmospheres are shown in Fig. 5 as a function of temperature.
These conditions are the most relevant for practical application
as H2-permeable membranes. It can be noticed that, in all
studied compounds, protonic conduction prevails across the
whole range of temperatures. This behavior can be inferred from
the hydration effect (sO2zH2O w sO2) and the isotopic effect
(sH2zH2O w sD2zD2O) observed for all tested compounds.
At the highest temperature tested, the change in activation
energy is related to the depletion of protons in the oxide and, as a
consequence, the contribution of electrons and especially oxide
ions becomes more relevant with the increase in temperature.
Thus, the activation energy for proton and deuterium diffusion
can be determined from the low temperature range (up to
600 uC) of the conductivity plots. Table 3 summarizes the
activation energy values of the different compounds measured in
oxidizing conditions. The very high values of these activation
energies can be related to the grain boundary reported
values,25,26 due to the limiting grain boundary resistivity for
proton transport of this kind of material, deduced from the
reported impedance studies.24–26 Furthermore, the activation
energy for deuterium diffusion is about 0.04–0.08 eV higher than
for protons (except for the Pr doped compound, which is higher).
This difference is expected due to the lower zero point energy for
deuterium ions than for protons.30
Fig. 4 Total conductivity as a function of inverse temperature measured in dry oxygen, oxygen saturated with water and oxygen saturated with
deuterated water: (a) BaZr0.9Y0.1O3-d, (b) BaZr0.85Y0.1Pr0.05O3-d, (c) BaZr0.85Y0.1Fe0.05O3-d, (d) BaZr0.85Y0.1Mn0.05O3-d and (e) BaZr0.8Y0.15Mn0.05O3-d.
Saturation with H2O and D2O was carried out at room temperature.
Table 2 Defect chemistry equations
Defect chemistry equations
Oxo«v??
o + O99I KF(T) = [v??
o ] 6 [O99I ] (1)
nill «e9 + h? Ke(T) = n 6 p (2)Ox
o « 1/2 O2(g) + v??o + 2e9 KR(T) = [v??
o ] 6 n2 6 pO21/2 (3)
4936 | RSC Adv., 2012, 2, 4932–4943 This journal is � The Royal Society of Chemistry 2012
Publ
ishe
d on
20
Mar
ch 2
012.
Dow
nloa
ded
on 2
0/06
/201
4 11
:24:
33.
View Article Online
We should also emphasize the important improvement in total
conductivity with increase in Y concentration, i.e. the change
from BaZr0.85Y0.1Mn0.05O3-d to BaZr0.8Y0.15Mn0.05O3-d. Indeed,
impedance analysis of BaZr0.8Y0.15Mn0.05O3-d at 300 uC in dry
and wet hydrogen (4% in Ar) revealed that the most important
contribution to the total sample resistance is the one related
to grain boundary transport (Fig. S2, ESI{). Moreover, it
should be noted that our BaZr0.9Y0.1O3-d reference compound
shows total conductivity values lower than those reported
elsewhere24–26 and this might be ascribed to (i) barium
evaporation, (ii) non-stoichiometry, (iii) core-space charge
layer effects, etc.25 Nevertheless, the best material found here
(BaZr0.8Y0.15Mn0.05O3-d) exhibits a conductivity almost two
orders of magnitude higher than our reference compound
(BaZr0.9Y0.1O3-d). Furthermore, the protonic conductivity is
enhanced in the Y-doped compound, as can be deduced from the
higher magnitude of the isotopic effect in BaZr0.8Y0.15Mn0.05O3-d
than in BaZr0.85Y0.1Mn0.05O3. This fact is in agreement with
previously reported studies31 and can be directly ascribed to the
higher density of oxygen vacancies created by the substitution of
Zr by Y, essential for the incorporation of protons in the oxide.
As the protonic conductivity in these polycrystalline samples is
principally limited by grain boundary resistance,24–26 the
observed conductivity improvements should be a consequence
of better grain boundary transport of both ions and electronic
charge carriers achieved through the variation in composition.
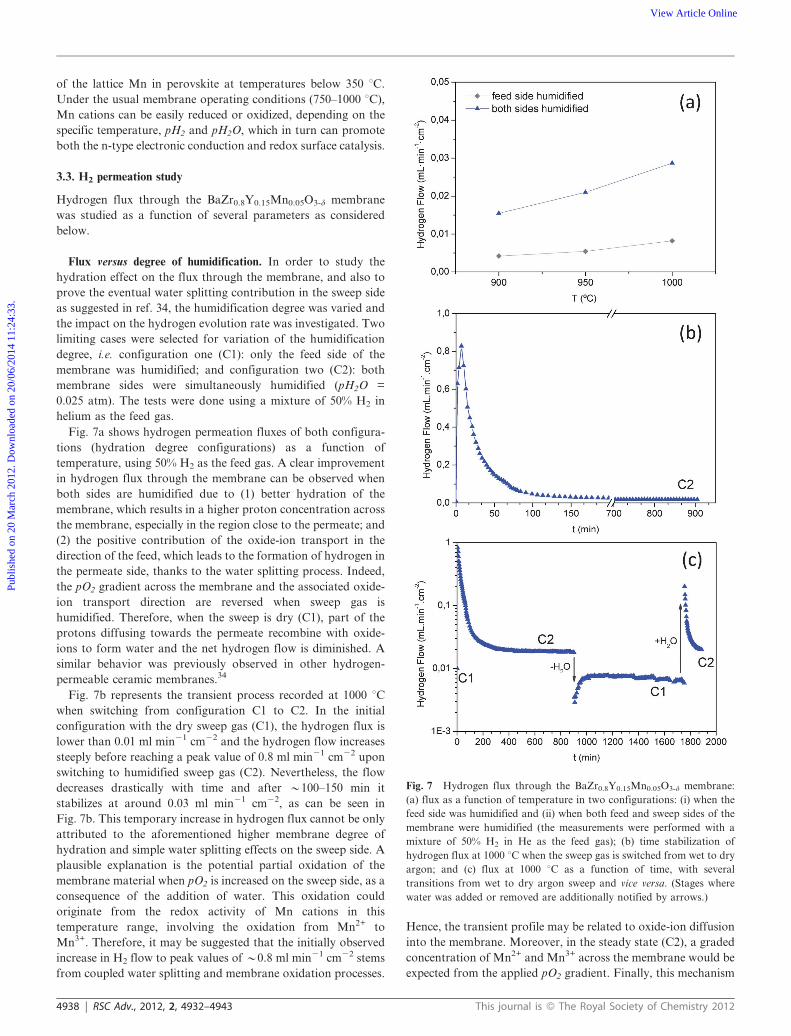
Aiming to understand the evolution of the Mn-oxidation
state in BaZr0.8Y0.15Mn0.05O3-d under reducing conditions, a
temperature-programmed reduction (TPR) experiment was
carried out in dry hydrogen. Fig. 6 presents the weight-
normalized hydrogen consumption for BaZr0.9Y0.1O3-d and
BaZr0.8Y0.15Mn0.05O3-d. The reference samples presents some
background reduction in the temperature range 450 to 900 uC,
which can be ascribed to oxygen release and the formation of
electron carriers upon oxide dehydration. In the case of
BaZr0.8Y0.15Mn0.05O3-d, two additional pronounced reduction
peaks are observed. The low temperature peak detected at 415 uCis related to the reduction of Mn4+ to Mn3+ and the consequent
formation of the oxygen vacancies and water, which is in
agreement with previous studies on La1-xCaxMnO3-d perovs-
kites.32,33 The reduction process taking place at 788 uC is related
to the subsequent reduction of Mn3+ to Mn2+ and consumes a
larger amount of hydrogen than the low temperature reduction.
From the hydrogen consumption values, it can be inferred that
Mn2+-ions are the prevailing species at temperatures above
900 uC in dry hydrogen while Mn4+-ions represent around 30%
Fig. 5 Total conductivity as a function of inverse temperature measured in hydrogen saturated with water and deuterium saturated with deuterated
water for five different compounds: (a) BaZr0.9Y0.1O3-d, (b) BaZr0.85Y0.1Pr0.05O3-d, (c) BaZr0.85Y0.1Fe0.05O3-d, (d) BaZr0.85Y0.1Mn0.05O3-d and (e)
BaZr0.8Y0.15Mn0.05O3-d. Saturation with H2O and D2O was carried out at room temperature.
Table 3 Proton and deuterium activation energies calculated from theconductivity Arrhenius plots of the different compounds showed in Fig. 4
Compound O2+H2O Ea (eV) O2+D2O Ea (eV)
BaZr0.95Y0.1O3-d 1.35 1.44BaZr0.85Y0.1Pr0.05O3-d 0.79 1.02BaZr0.85Y0.1Fe0.05O3-d 0.68 0.75BaZr0.85Y0.1Mn0.05O3-d 0.92 1.01BaZr0.8Y0.15Mn0.05O3-d 0.92 0.97
Fig. 6 Temperature-programmed reduction experiment in dry H2 (10%
in Ar) for BaZr0.9Y0.1O3-d and BaZr0.8Y0.15Mn0.05O3-d compounds.
This journal is � The Royal Society of Chemistry 2012 RSC Adv., 2012, 2, 4932–4943 | 4937
Publ
ishe
d on
20
Mar
ch 2
012.
Dow
nloa
ded
on 2
0/06
/201
4 11
:24:
33.
View Article Online
of the lattice Mn in perovskite at temperatures below 350 uC.
Under the usual membrane operating conditions (750–1000 uC),
Mn cations can be easily reduced or oxidized, depending on the
specific temperature, pH2 and pH2O, which in turn can promote
both the n-type electronic conduction and redox surface catalysis.
3.3. H2 permeation study
Hydrogen flux through the BaZr0.8Y0.15Mn0.05O3-d membrane
was studied as a function of several parameters as considered
below.
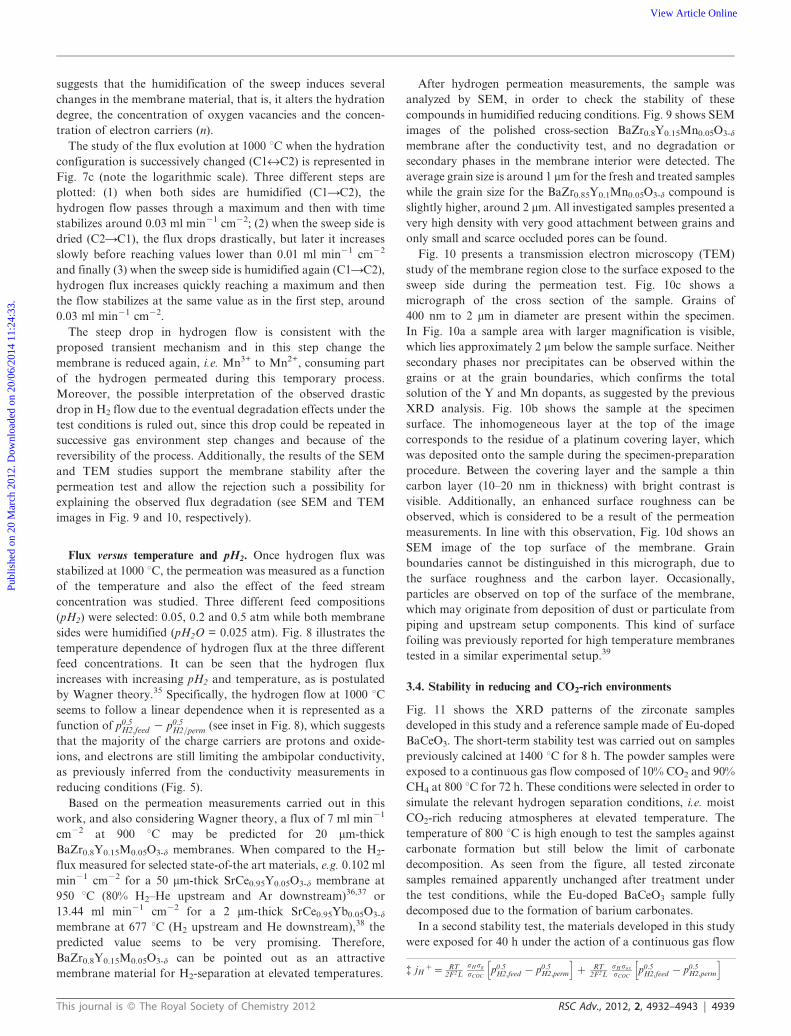
Flux versus degree of humidification. In order to study the
hydration effect on the flux through the membrane, and also to
prove the eventual water splitting contribution in the sweep side
as suggested in ref. 34, the humidification degree was varied and
the impact on the hydrogen evolution rate was investigated. Two
limiting cases were selected for variation of the humidification
degree, i.e. configuration one (C1): only the feed side of the
membrane was humidified; and configuration two (C2): both
membrane sides were simultaneously humidified (pH2O =
0.025 atm). The tests were done using a mixture of 50% H2 in
helium as the feed gas.
Fig. 7a shows hydrogen permeation fluxes of both configura-
tions (hydration degree configurations) as a function of
temperature, using 50% H2 as the feed gas. A clear improvement
in hydrogen flux through the membrane can be observed when
both sides are humidified due to (1) better hydration of the
membrane, which results in a higher proton concentration across
the membrane, especially in the region close to the permeate; and
(2) the positive contribution of the oxide-ion transport in the
direction of the feed, which leads to the formation of hydrogen in
the permeate side, thanks to the water splitting process. Indeed,
the pO2 gradient across the membrane and the associated oxide-
ion transport direction are reversed when sweep gas is
humidified. Therefore, when the sweep is dry (C1), part of the
protons diffusing towards the permeate recombine with oxide-
ions to form water and the net hydrogen flow is diminished. A
similar behavior was previously observed in other hydrogen-
permeable ceramic membranes.34
Fig. 7b represents the transient process recorded at 1000 uCwhen switching from configuration C1 to C2. In the initial
configuration with the dry sweep gas (C1), the hydrogen flux is
lower than 0.01 ml min21 cm22 and the hydrogen flow increases
steeply before reaching a peak value of 0.8 ml min21 cm22 upon
switching to humidified sweep gas (C2). Nevertheless, the flow
decreases drastically with time and after y100–150 min it
stabilizes at around 0.03 ml min21 cm22, as can be seen in
Fig. 7b. This temporary increase in hydrogen flux cannot be only
attributed to the aforementioned higher membrane degree of
hydration and simple water splitting effects on the sweep side. A
plausible explanation is the potential partial oxidation of the
membrane material when pO2 is increased on the sweep side, as a
consequence of the addition of water. This oxidation could
originate from the redox activity of Mn cations in this
temperature range, involving the oxidation from Mn2+ to
Mn3+. Therefore, it may be suggested that the initially observed
increase in H2 flow to peak values of y0.8 ml min21 cm22 stems
from coupled water splitting and membrane oxidation processes.
Hence, the transient profile may be related to oxide-ion diffusion
into the membrane. Moreover, in the steady state (C2), a graded
concentration of Mn2+ and Mn3+ across the membrane would be
expected from the applied pO2 gradient. Finally, this mechanism
Fig. 7 Hydrogen flux through the BaZr0.8Y0.15Mn0.05O3-d membrane:
(a) flux as a function of temperature in two configurations: (i) when the
feed side was humidified and (ii) when both feed and sweep sides of the
membrane were humidified (the measurements were performed with a
mixture of 50% H2 in He as the feed gas); (b) time stabilization of
hydrogen flux at 1000 uC when the sweep gas is switched from wet to dry
argon; and (c) flux at 1000 uC as a function of time, with several
transitions from wet to dry argon sweep and vice versa. (Stages where
water was added or removed are additionally notified by arrows.)
4938 | RSC Adv., 2012, 2, 4932–4943 This journal is � The Royal Society of Chemistry 2012
Publ
ishe
d on
20
Mar
ch 2
012.
Dow
nloa
ded
on 2
0/06
/201
4 11
:24:
33.
View Article Online
suggests that the humidification of the sweep induces several
changes in the membrane material, that is, it alters the hydration
degree, the concentration of oxygen vacancies and the concen-
tration of electron carriers (n).
The study of the flux evolution at 1000 uC when the hydration
configuration is successively changed (C1«C2) is represented in
Fig. 7c (note the logarithmic scale). Three different steps are
plotted: (1) when both sides are humidified (C1AC2), the
hydrogen flow passes through a maximum and then with time
stabilizes around 0.03 ml min21 cm22; (2) when the sweep side is
dried (C2AC1), the flux drops drastically, but later it increases
slowly before reaching values lower than 0.01 ml min21 cm22
and finally (3) when the sweep side is humidified again (C1AC2),
hydrogen flux increases quickly reaching a maximum and then
the flow stabilizes at the same value as in the first step, around
0.03 ml min21 cm22.
The steep drop in hydrogen flow is consistent with the
proposed transient mechanism and in this step change the
membrane is reduced again, i.e. Mn3+ to Mn2+, consuming part
of the hydrogen permeated during this temporary process.
Moreover, the possible interpretation of the observed drastic
drop in H2 flow due to the eventual degradation effects under the
test conditions is ruled out, since this drop could be repeated in
successive gas environment step changes and because of the
reversibility of the process. Additionally, the results of the SEM
and TEM studies support the membrane stability after the
permeation test and allow the rejection such a possibility for
explaining the observed flux degradation (see SEM and TEM
images in Fig. 9 and 10, respectively).
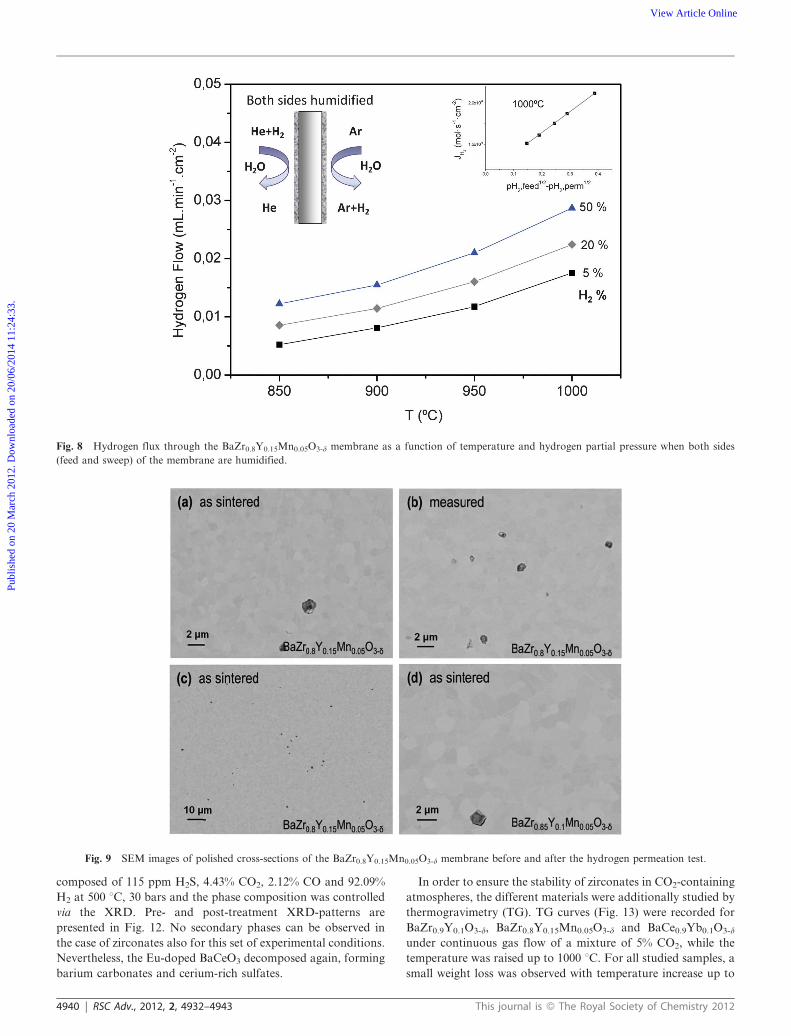
Flux versus temperature and pH2. Once hydrogen flux was
stabilized at 1000 uC, the permeation was measured as a function
of the temperature and also the effect of the feed stream
concentration was studied. Three different feed compositions
(pH2) were selected: 0.05, 0.2 and 0.5 atm while both membrane
sides were humidified (pH2O = 0.025 atm). Fig. 8 illustrates the
temperature dependence of hydrogen flux at the three different
feed concentrations. It can be seen that the hydrogen flux
increases with increasing pH2 and temperature, as is postulated
by Wagner theory.35 Specifically, the hydrogen flow at 1000 uCseems to follow a linear dependence when it is represented as a
function of p0:5H2;feed 2 p0:5
H2=perm (see inset in Fig. 8), which suggests
that the majority of the charge carriers are protons and oxide-
ions, and electrons are still limiting the ambipolar conductivity,
as previously inferred from the conductivity measurements in
reducing conditions (Fig. 5).
Based on the permeation measurements carried out in this
work, and also considering Wagner theory, a flux of 7 ml min21
cm22 at 900 uC may be predicted for 20 mm-thick
BaZr0.8Y0.15M0.05O3-d membranes. When compared to the H2-
flux measured for selected state-of-the art materials, e.g. 0.102 ml
min21 cm22 for a 50 mm-thick SrCe0.95Y0.05O3-d membrane at
950 uC (80% H2–He upstream and Ar downstream)36,37 or
13.44 ml min21 cm22 for a 2 mm-thick SrCe0.95Yb0.05O3-d
membrane at 677 uC (H2 upstream and He downstream),38 the
predicted value seems to be very promising. Therefore,
BaZr0.8Y0.15M0.05O3-d can be pointed out as an attractive
membrane material for H2-separation at elevated temperatures.
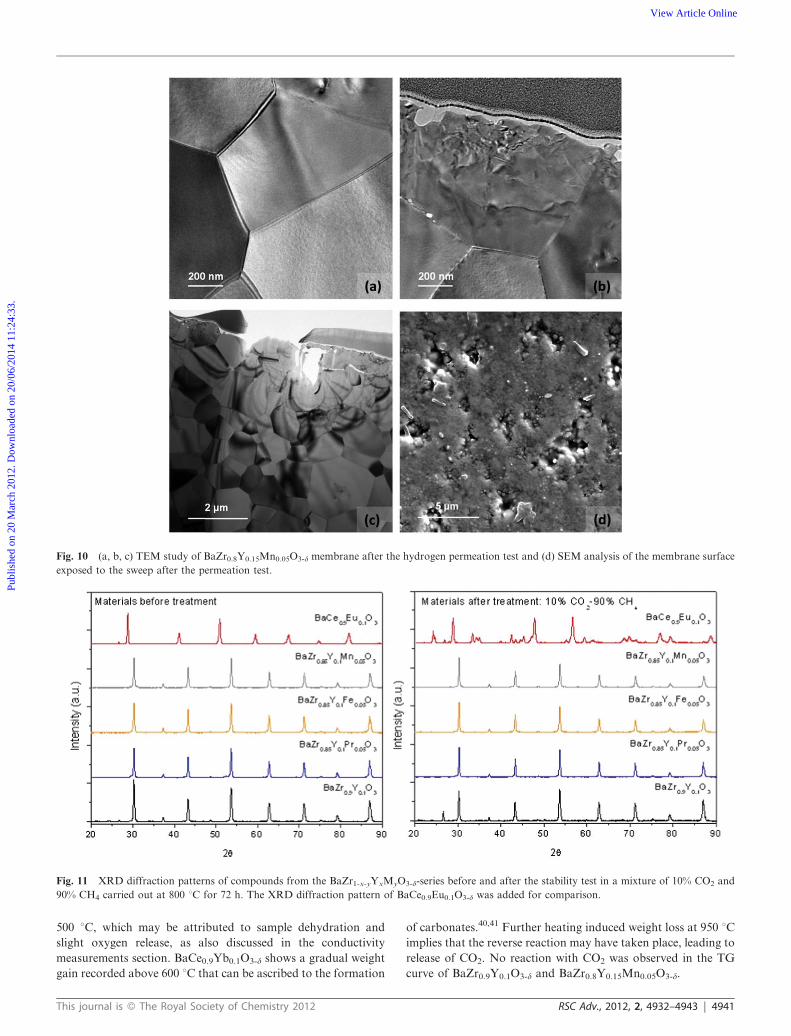
After hydrogen permeation measurements, the sample was
analyzed by SEM, in order to check the stability of these
compounds in humidified reducing conditions. Fig. 9 shows SEM
images of the polished cross-section BaZr0.8Y0.15Mn0.05O3-d
membrane after the conductivity test, and no degradation or
secondary phases in the membrane interior were detected. The
average grain size is around 1 mm for the fresh and treated samples
while the grain size for the BaZr0.85Y0.1Mn0.05O3-d compound is
slightly higher, around 2 mm. All investigated samples presented a
very high density with very good attachment between grains and
only small and scarce occluded pores can be found.
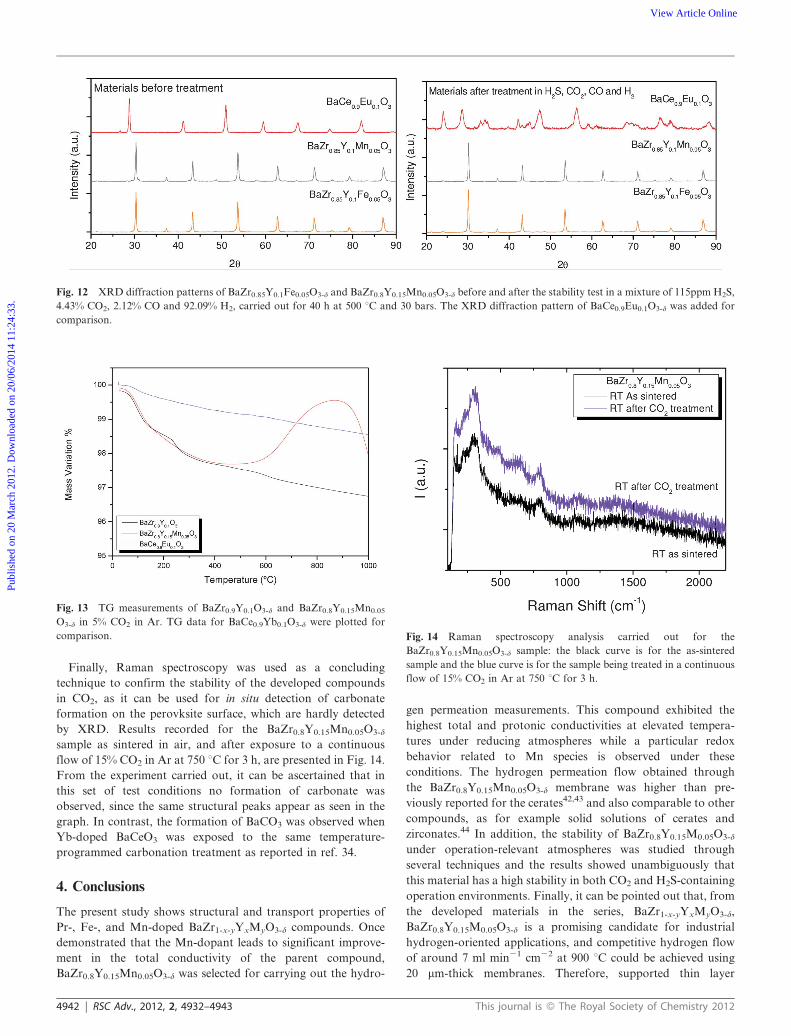
Fig. 10 presents a transmission electron microscopy (TEM)
study of the membrane region close to the surface exposed to the
sweep side during the permeation test. Fig. 10c shows a
micrograph of the cross section of the sample. Grains of
400 nm to 2 mm in diameter are present within the specimen.
In Fig. 10a a sample area with larger magnification is visible,
which lies approximately 2 mm below the sample surface. Neither
secondary phases nor precipitates can be observed within the
grains or at the grain boundaries, which confirms the total
solution of the Y and Mn dopants, as suggested by the previous
XRD analysis. Fig. 10b shows the sample at the specimen
surface. The inhomogeneous layer at the top of the image
corresponds to the residue of a platinum covering layer, which
was deposited onto the sample during the specimen-preparation
procedure. Between the covering layer and the sample a thin
carbon layer (10–20 nm in thickness) with bright contrast is
visible. Additionally, an enhanced surface roughness can be
observed, which is considered to be a result of the permeation
measurements. In line with this observation, Fig. 10d shows an
SEM image of the top surface of the membrane. Grain
boundaries cannot be distinguished in this micrograph, due to
the surface roughness and the carbon layer. Occasionally,
particles are observed on top of the surface of the membrane,
which may originate from deposition of dust or particulate from
piping and upstream setup components. This kind of surface
foiling was previously reported for high temperature membranes
tested in a similar experimental setup.39
3.4. Stability in reducing and CO2-rich environments
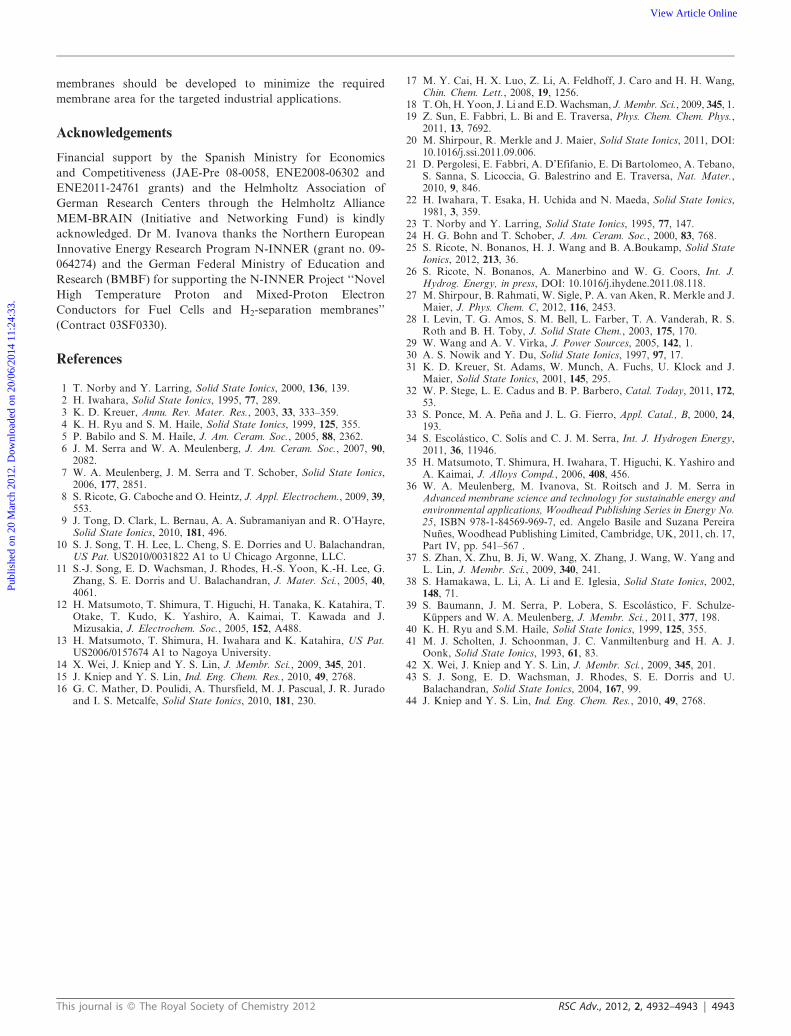
Fig. 11 shows the XRD patterns of the zirconate samples
developed in this study and a reference sample made of Eu-doped
BaCeO3. The short-term stability test was carried out on samples
previously calcined at 1400 uC for 8 h. The powder samples were
exposed to a continuous gas flow composed of 10% CO2 and 90%
CH4 at 800 uC for 72 h. These conditions were selected in order to
simulate the relevant hydrogen separation conditions, i.e. moist
CO2-rich reducing atmospheres at elevated temperature. The
temperature of 800 uC is high enough to test the samples against
carbonate formation but still below the limit of carbonate
decomposition. As seen from the figure, all tested zirconate
samples remained apparently unchanged after treatment under
the test conditions, while the Eu-doped BaCeO3 sample fully
decomposed due to the formation of barium carbonates.
In a second stability test, the materials developed in this study
were exposed for 40 h under the action of a continuous gas flow
{ jHz~ RT
2F2L
sH sg
sCOCp0:5
H2,feed { p0:5H2,perm
h iz RT
2F2LsH sox
sCOCp0:5
H2,feed { p0:5H2,perm
h i
This journal is � The Royal Society of Chemistry 2012 RSC Adv., 2012, 2, 4932–4943 | 4939
Publ
ishe
d on
20
Mar
ch 2
012.
Dow
nloa
ded
on 2
0/06
/201
4 11
:24:
33.
View Article Online
composed of 115 ppm H2S, 4.43% CO2, 2.12% CO and 92.09%
H2 at 500 uC, 30 bars and the phase composition was controlled
via the XRD. Pre- and post-treatment XRD-patterns are
presented in Fig. 12. No secondary phases can be observed in
the case of zirconates also for this set of experimental conditions.
Nevertheless, the Eu-doped BaCeO3 decomposed again, forming
barium carbonates and cerium-rich sulfates.
In order to ensure the stability of zirconates in CO2-containing
atmospheres, the different materials were additionally studied by
thermogravimetry (TG). TG curves (Fig. 13) were recorded for
BaZr0.9Y0.1O3-d, BaZr0.8Y0.15Mn0.05O3-d and BaCe0.9Yb0.1O3-d
under continuous gas flow of a mixture of 5% CO2, while the
temperature was raised up to 1000 uC. For all studied samples, a
small weight loss was observed with temperature increase up to
Fig. 8 Hydrogen flux through the BaZr0.8Y0.15Mn0.05O3-d membrane as a function of temperature and hydrogen partial pressure when both sides
(feed and sweep) of the membrane are humidified.
Fig. 9 SEM images of polished cross-sections of the BaZr0.8Y0.15Mn0.05O3-d membrane before and after the hydrogen permeation test.
4940 | RSC Adv., 2012, 2, 4932–4943 This journal is � The Royal Society of Chemistry 2012
Publ
ishe
d on
20
Mar
ch 2
012.
Dow
nloa
ded
on 2
0/06
/201
4 11
:24:
33.
View Article Online
500 uC, which may be attributed to sample dehydration and
slight oxygen release, as also discussed in the conductivity
measurements section. BaCe0.9Yb0.1O3-d shows a gradual weight
gain recorded above 600 uC that can be ascribed to the formation
of carbonates.40,41 Further heating induced weight loss at 950 uCimplies that the reverse reaction may have taken place, leading to
release of CO2. No reaction with CO2 was observed in the TG
curve of BaZr0.9Y0.1O3-d and BaZr0.8Y0.15Mn0.05O3-d.
Fig. 11 XRD diffraction patterns of compounds from the BaZr1-x-yYxMyO3-d-series before and after the stability test in a mixture of 10% CO2 and
90% CH4 carried out at 800 uC for 72 h. The XRD diffraction pattern of BaCe0.9Eu0.1O3-d was added for comparison.
Fig. 10 (a, b, c) TEM study of BaZr0.8Y0.15Mn0.05O3-d membrane after the hydrogen permeation test and (d) SEM analysis of the membrane surface
exposed to the sweep after the permeation test.
This journal is � The Royal Society of Chemistry 2012 RSC Adv., 2012, 2, 4932–4943 | 4941
Publ
ishe
d on
20
Mar
ch 2
012.
Dow
nloa
ded
on 2
0/06
/201
4 11
:24:
33.
View Article Online
Finally, Raman spectroscopy was used as a concluding
technique to confirm the stability of the developed compounds
in CO2, as it can be used for in situ detection of carbonate
formation on the perovksite surface, which are hardly detected
by XRD. Results recorded for the BaZr0.8Y0.15Mn0.05O3-d
sample as sintered in air, and after exposure to a continuous
flow of 15% CO2 in Ar at 750 uC for 3 h, are presented in Fig. 14.
From the experiment carried out, it can be ascertained that in
this set of test conditions no formation of carbonate was
observed, since the same structural peaks appear as seen in the
graph. In contrast, the formation of BaCO3 was observed when
Yb-doped BaCeO3 was exposed to the same temperature-
programmed carbonation treatment as reported in ref. 34.
4. Conclusions
The present study shows structural and transport properties of
Pr-, Fe-, and Mn-doped BaZr1-x-yYxMyO3-d compounds. Once
demonstrated that the Mn-dopant leads to significant improve-
ment in the total conductivity of the parent compound,
BaZr0.8Y0.15Mn0.05O3-d was selected for carrying out the hydro-
gen permeation measurements. This compound exhibited the
highest total and protonic conductivities at elevated tempera-
tures under reducing atmospheres while a particular redox
behavior related to Mn species is observed under these
conditions. The hydrogen permeation flow obtained through
the BaZr0.8Y0.15Mn0.05O3-d membrane was higher than pre-
viously reported for the cerates42,43 and also comparable to other
compounds, as for example solid solutions of cerates and
zirconates.44 In addition, the stability of BaZr0.8Y0.15M0.05O3-d
under operation-relevant atmospheres was studied through
several techniques and the results showed unambiguously that
this material has a high stability in both CO2 and H2S-containing
operation environments. Finally, it can be pointed out that, from
the developed materials in the series, BaZr1-x-yYxMyO3-d,
BaZr0.8Y0.15M0.05O3-d is a promising candidate for industrial
hydrogen-oriented applications, and competitive hydrogen flow
of around 7 ml min21 cm22 at 900 uC could be achieved using
20 mm-thick membranes. Therefore, supported thin layer
Fig. 12 XRD diffraction patterns of BaZr0.85Y0.1Fe0.05O3-d and BaZr0.8Y0.15Mn0.05O3-d before and after the stability test in a mixture of 115ppm H2S,
4.43% CO2, 2.12% CO and 92.09% H2, carried out for 40 h at 500 uC and 30 bars. The XRD diffraction pattern of BaCe0.9Eu0.1O3-d was added for
comparison.
Fig. 13 TG measurements of BaZr0.9Y0.1O3-d and BaZr0.8Y0.15Mn0.05
O3-d in 5% CO2 in Ar. TG data for BaCe0.9Yb0.1O3-d were plotted for
comparison. Fig. 14 Raman spectroscopy analysis carried out for the
BaZr0.8Y0.15Mn0.05O3-d sample: the black curve is for the as-sintered
sample and the blue curve is for the sample being treated in a continuous
flow of 15% CO2 in Ar at 750 uC for 3 h.
4942 | RSC Adv., 2012, 2, 4932–4943 This journal is � The Royal Society of Chemistry 2012
Publ
ishe
d on
20
Mar
ch 2
012.
Dow
nloa
ded
on 2
0/06
/201
4 11
:24:
33.
View Article Online
membranes should be developed to minimize the required
membrane area for the targeted industrial applications.
Acknowledgements
Financial support by the Spanish Ministry for Economics
and Competitiveness (JAE-Pre 08-0058, ENE2008-06302 and
ENE2011-24761 grants) and the Helmholtz Association of
German Research Centers through the Helmholtz Alliance
MEM-BRAIN (Initiative and Networking Fund) is kindly
acknowledged. Dr M. Ivanova thanks the Northern European
Innovative Energy Research Program N-INNER (grant no. 09-
064274) and the German Federal Ministry of Education and
Research (BMBF) for supporting the N-INNER Project ‘‘Novel
High Temperature Proton and Mixed-Proton Electron
Conductors for Fuel Cells and H2-separation membranes’’
(Contract 03SF0330).
References
1 T. Norby and Y. Larring, Solid State Ionics, 2000, 136, 139.2 H. Iwahara, Solid State Ionics, 1995, 77, 289.3 K. D. Kreuer, Annu. Rev. Mater. Res., 2003, 33, 333–359.4 K. H. Ryu and S. M. Haile, Solid State Ionics, 1999, 125, 355.5 P. Babilo and S. M. Haile, J. Am. Ceram. Soc., 2005, 88, 2362.6 J. M. Serra and W. A. Meulenberg, J. Am. Ceram. Soc., 2007, 90,
2082.7 W. A. Meulenberg, J. M. Serra and T. Schober, Solid State Ionics,
2006, 177, 2851.8 S. Ricote, G. Caboche and O. Heintz, J. Appl. Electrochem., 2009, 39,
553.9 J. Tong, D. Clark, L. Bernau, A. A. Subramaniyan and R. O’Hayre,
Solid State Ionics, 2010, 181, 496.10 S. J. Song, T. H. Lee, L. Cheng, S. E. Dorries and U. Balachandran,
US Pat. US2010/0031822 A1 to U Chicago Argonne, LLC.11 S.-J. Song, E. D. Wachsman, J. Rhodes, H.-S. Yoon, K.-H. Lee, G.
Zhang, S. E. Dorris and U. Balachandran, J. Mater. Sci., 2005, 40,4061.
12 H. Matsumoto, T. Shimura, T. Higuchi, H. Tanaka, K. Katahira, T.Otake, T. Kudo, K. Yashiro, A. Kaimai, T. Kawada and J.Mizusakia, J. Electrochem. Soc., 2005, 152, A488.
13 H. Matsumoto, T. Shimura, H. Iwahara and K. Katahira, US Pat.US2006/0157674 A1 to Nagoya University.
14 X. Wei, J. Kniep and Y. S. Lin, J. Membr. Sci., 2009, 345, 201.15 J. Kniep and Y. S. Lin, Ind. Eng. Chem. Res., 2010, 49, 2768.16 G. C. Mather, D. Poulidi, A. Thursfield, M. J. Pascual, J. R. Jurado
and I. S. Metcalfe, Solid State Ionics, 2010, 181, 230.
17 M. Y. Cai, H. X. Luo, Z. Li, A. Feldhoff, J. Caro and H. H. Wang,Chin. Chem. Lett., 2008, 19, 1256.
18 T. Oh, H. Yoon, J. Li and E.D. Wachsman, J. Membr. Sci., 2009, 345, 1.19 Z. Sun, E. Fabbri, L. Bi and E. Traversa, Phys. Chem. Chem. Phys.,
2011, 13, 7692.20 M. Shirpour, R. Merkle and J. Maier, Solid State Ionics, 2011, DOI:
10.1016/j.ssi.2011.09.006.21 D. Pergolesi, E. Fabbri, A. D’Efifanio, E. Di Bartolomeo, A. Tebano,
S. Sanna, S. Licoccia, G. Balestrino and E. Traversa, Nat. Mater.,2010, 9, 846.
22 H. Iwahara, T. Esaka, H. Uchida and N. Maeda, Solid State Ionics,1981, 3, 359.
23 T. Norby and Y. Larring, Solid State Ionics, 1995, 77, 147.24 H. G. Bohn and T. Schober, J. Am. Ceram. Soc., 2000, 83, 768.25 S. Ricote, N. Bonanos, H. J. Wang and B. A.Boukamp, Solid State
Ionics, 2012, 213, 36.26 S. Ricote, N. Bonanos, A. Manerbino and W. G. Coors, Int. J.
Hydrog. Energy, in press, DOI: 10.1016/j.ihydene.2011.08.118.27 M. Shirpour, B. Rahmati, W. Sigle, P. A. van Aken, R. Merkle and J.
Maier, J. Phys. Chem. C, 2012, 116, 2453.28 I. Levin, T. G. Amos, S. M. Bell, L. Farber, T. A. Vanderah, R. S.
Roth and B. H. Toby, J. Solid State Chem., 2003, 175, 170.29 W. Wang and A. V. Virka, J. Power Sources, 2005, 142, 1.30 A. S. Nowik and Y. Du, Solid State Ionics, 1997, 97, 17.31 K. D. Kreuer, St. Adams, W. Munch, A. Fuchs, U. Klock and J.
Maier, Solid State Ionics, 2001, 145, 295.32 W. P. Stege, L. E. Cadus and B. P. Barbero, Catal. Today, 2011, 172,
53.33 S. Ponce, M. A. Pena and J. L. G. Fierro, Appl. Catal., B, 2000, 24,
193.34 S. Escolastico, C. Solıs and C. J. M. Serra, Int. J. Hydrogen Energy,
2011, 36, 11946.35 H. Matsumoto, T. Shimura, H. Iwahara, T. Higuchi, K. Yashiro and
A. Kaimai, J. Alloys Compd., 2006, 408, 456.36 W. A. Meulenberg, M. Ivanova, St. Roitsch and J. M. Serra in
Advanced membrane science and technology for sustainable energy andenvironmental applications, Woodhead Publishing Series in Energy No.25, ISBN 978-1-84569-969-7, ed. Angelo Basile and Suzana PereiraNunes, Woodhead Publishing Limited, Cambridge, UK, 2011, ch. 17,Part IV, pp. 541–567 .
37 S. Zhan, X. Zhu, B. Ji, W. Wang, X. Zhang, J. Wang, W. Yang andL. Lin, J. Membr. Sci., 2009, 340, 241.
38 S. Hamakawa, L. Li, A. Li and E. Iglesia, Solid State Ionics, 2002,148, 71.
39 S. Baumann, J. M. Serra, P. Lobera, S. Escolastico, F. Schulze-Kuppers and W. A. Meulenberg, J. Membr. Sci., 2011, 377, 198.
40 K. H. Ryu and S.M. Haile, Solid State Ionics, 1999, 125, 355.41 M. J. Scholten, J. Schoonman, J. C. Vanmiltenburg and H. A. J.
Oonk, Solid State Ionics, 1993, 61, 83.42 X. Wei, J. Kniep and Y. S. Lin, J. Membr. Sci., 2009, 345, 201.43 S. J. Song, E. D. Wachsman, J. Rhodes, S. E. Dorris and U.
Balachandran, Solid State Ionics, 2004, 167, 99.44 J. Kniep and Y. S. Lin, Ind. Eng. Chem. Res., 2010, 49, 2768.
This journal is � The Royal Society of Chemistry 2012 RSC Adv., 2012, 2, 4932–4943 | 4943
Publ
ishe
d on
20
Mar
ch 2
012.
Dow
nloa
ded
on 2
0/06
/201
4 11
:24:
33.
View Article Online


![Investigation of perovskite oxide SrFe0. 8Cu0. 1Nb0. 1O3-δ ... · tive fuel cells, especially in solid oxide fuel cells [25e28]. Perovskite oxides have been widely used as both cathode](https://static.fdocument.org/doc/165x107/5ed225ea5e0ec842bd789c96/investigation-of-perovskite-oxide-srfe0-8cu0-1nb0-1o3-tive-fuel-cells.jpg)