Identification of Phenolic Compounds in Colored Rice and ...
11
Chiang Mai J. Sci. 2019; 46(4) : 672-682 http://epg.science.cmu.ac.th/ejournal/ Contributed Paper Identification of Phenolic Compounds in Colored Rice and Their Inhibitory Potential Against α-Amylase Prinya Wongsa [a]*, Jeeranan Chaiwarith [b], Jitnapa Voranitikul [c], Janpen Chaiwongkhajorn [c], Nithiya Rattanapanone [d]* and Rikard Lanberg [e] [a] School of Agro-Industry, Mae Fah Luang University, Chiang Rai 57100 Thailand. [b] Scientific and Technological Instrument Center, Mae Fah Luang University Chiang Rai 57100 Thailand. [c] Sithiporn Associates Co., Ltd. 451-451/1 Bangbumru, Bangplud, Bangkok 10700 Thailand. [d] Faculty of Agro-Industry and Postharvest Research Center, Faculty of Agriculture, Chiang Mai University, Chiang Mai 50100 Thailand. [e] Department of Food Science, Swedish Agricultural University, Almas Alle’5, 75651 Uppsala, Sweden. *Author for correspondence; e-mail: [email protected] and [email protected] Received: 4 September 2018 Revised: 6 November 2018 Accepted: 26 December 2018 ABSTRACT Colored rice varieties (Oryza sativa L.) that are commonly grown and consumed in Thailand were selected for determining and comparing of the contents of phenolic acids and anthocyanins by using an UPLC-ESI-QqQ-MS/MS method with Multiple Reaction Monitoring (MRM) and evaluating their in vitro potential inhibitory against α-amylase. A shorten analysis time performed by UPLC-ESI-QqQ-MS/MS was observed. The total phenolic content of crude extract of colored rice samples ranged from 18.2 to 100.0 mg GAE/100 g dried matter (DM). All of 8 target phenolic compounds were detected in the polyphenol-rich bound fractions of extracts. Ferulic acid was the main phenolic acids in all samples while flavonoids including (+)-catechin were significantly observed in the red rice sample. In addition, cyanidin-3-glucoside was the most predominant anthocyanin in all colored rice samples. The concentration of cyanidin-3-glucoside ranged from 0.1 mg/100 g DM in the red rice sample to 138.8 mg/100 g DM in the black rice sample. The IC 50 value for potential inhibition against α-amylase activity of crude extract of colored rice samples ranged from 2.5 to 14.4 µg/mL. The content of phenolic compounds, total phenolic content and potential inhibition against α-amylase activity in black rice samples were higher than in red and purple rice samples. Keywords: colored rice (Oryza sativa L.), phenolic compounds, anthocyanins, α-amylase inhibition, UPLC 1. INTRODUCTION Rice (Oriya sativa L.) is a staple food in Asian population. According to the recent Food and Agricultural Organization statistics, an approximate 741.5 MT of globally produced paddy rice was reported (FAOSTAT) [1]. Rice provides approximate 19% of a daily supply of calories (545 kcal) for the world population [2]. Although polished or white rice is commonly consumed, colored or pigmented rice including black, red and purple rice gained popularity
Transcript of Identification of Phenolic Compounds in Colored Rice and ...
Chiang Mai J. Sci. 2019; 46(4) : 672-682http://epg.science.cmu.ac.th/ejournal/Contributed Paper
Identification of Phenolic Compounds in Colored Rice and Their Inhibitory Potential Against α-AmylasePrinya Wongsa [a]*, Jeeranan Chaiwarith [b], Jitnapa Voranitikul [c], Janpen Chaiwongkhajorn [c], Nithiya Rattanapanone [d]* and Rikard Lanberg [e][a] School of Agro-Industry, Mae Fah Luang University, Chiang Rai 57100 Thailand.[b] Scientific and Technological Instrument Center, Mae Fah Luang University Chiang Rai 57100 Thailand.[c] Sithiporn Associates Co., Ltd. 451-451/1 Bangbumru, Bangplud, Bangkok 10700 Thailand.[d] Faculty of Agro-Industry and Postharvest Research Center, Faculty of Agriculture, Chiang Mai University,
Chiang Mai 50100 Thailand.[e] Department of Food Science, Swedish Agricultural University, Almas Alle’5, 75651 Uppsala, Sweden.*Author for correspondence; e-mail: [email protected] and [email protected]
Received: 4 September 2018Revised: 6 November 2018
Accepted: 26 December 2018
ABSTRACT Colored rice varieties (Oryza sativa L.) that are commonly grown and consumed in
Thailand were selected for determining and comparing of the contents of phenolic acids and anthocyanins by using an UPLC-ESI-QqQ-MS/MS method with Multiple Reaction Monitoring (MRM) and evaluating their in vitro potential inhibitory against α-amylase. A shorten analysis time performed by UPLC-ESI-QqQ-MS/MS was observed. The total phenolic content of crude extract of colored rice samples ranged from 18.2 to 100.0 mg GAE/100 g dried matter (DM). All of 8 target phenolic compounds were detected in the polyphenol-rich bound fractions of extracts. Ferulic acid was the main phenolic acids in all samples while flavonoids including (+)-catechin were significantly observed in the red rice sample. In addition, cyanidin-3-glucoside was the most predominant anthocyanin in all colored rice samples. The concentration of cyanidin-3-glucoside ranged from 0.1 mg/100 g DM in the red rice sample to 138.8 mg/100 g DM in the black rice sample. The IC50 value for potential inhibition against α-amylase activity of crude extract of colored rice samples ranged from 2.5 to 14.4 µg/mL. The content of phenolic compounds, total phenolic content and potential inhibition against α-amylase activity in black rice samples were higher than in red and purple rice samples.
Keywords: colored rice (Oryza sativa L.), phenolic compounds, anthocyanins, α-amylase inhibition, UPLC
1. INTRODUCTIONRice (Oriya sativa L.) is a staple food in
Asian population. According to the recent Food and Agricultural Organization statistics, an approximate 741.5 MT of globally produced paddy rice was reported (FAOSTAT) [1]. Rice
provides approximate 19% of a daily supply of calories (545 kcal) for the world population [2]. Although polished or white rice is commonly consumed, colored or pigmented rice including black, red and purple rice gained popularity
Chiang Mai J. Sci. 2019; 46(4) 673
among health conscious consumers as functional foods. The name of colored rice imply to the color of kernel which is contributed from anthocyanins in different layers of the pericarp and seed coat [3].
Colored rice is a source of many phenolic compounds, especially phenolic acids and anthocyanins [4-7]. Phenolic compounds are secondary metabolites providing a defensive mechanism in plants against insects, pests, disease and biotic and abiotic stress during plant growth and development. The qualification and quantification of phenolic compounds in plants is carried out in three steps that involve extraction, purification and analysis of the phenolic compounds in the extracts [5]. Several extraction techniques including solvent extraction, supercritical fluid extraction, and subcritical water extraction have been developed for the extraction of the bioactive components from pigmented rice. Solvent extraction is a conventional technique to extract bioactive substances from colored rice, by using organic solvents including acetone, methanol, ethanol and water in certain mixing ratio as extraction solvents. A simple, rapid method for determining total anthocyanin was developed for dark-blue wheat grains. Anthocyanins in wheat were significantly more extractable in ethanol or methanol than in water at different pH levels. A sample-to-solvent ratio of 1:8 at pH 1 and 25°C was used [8]. High Performance Liquid Chromatography (HPLC) coupled with Mass Spectrometry (MS) detection has been increasingly developed and performed for phenolic compounds determination in wine, beer, fruit and vegetables [10]. This analytical method allows a shorter analysis time and increases sensitivity.
Previous studies had shown that two groups of phenolic acids are dominant in rice grain. There are derivates of hydroxybenzoic acids including gallic, protocatechuic, 2,5-dihydroxybenzoic , p-hydroxybenzoic , vanillic , syringic, p-coumaric
acids and derivates of hydroxycinnamic acids including ferulic, sinapic and isoferulic acids. [9] Moreover, black rice contained a wide range of total anthocyanin content, with cyanidin-3-glucoside being the most common anthocyanin (0.0-470 mg/100 g) in most of varieties, whereas peonidin-3-glucoside (0.0-40 mg/100 g) was the second dominant anthocyanins [4].
In addition, phenolic compounds are well recognized as potent bioactive agents including antioxidant, free radical scavenging, anti-tumor, anti-atherosclerosis, and hypoglycemic [11]. Major chronic diseases such as type II diabetes are serious and expensive health-care challenges in both developed and developing countries. At least 171 million people worldwide have diabetes; this figure will be more than double in 2030. Around 3.2 million deaths every year resulted from the diabetic complications [12]. Moreover, this disorder has a significant impact on health, quality of life, life expectancy, and health-care system. Hyperglycemia is a condition that is characterized by a rapid increase in blood glucose levels due to the hydrolysis of starch by pancreatic α-amylase and α-glucosidase and the absorption of glucose in the small intestine [13].
A number of researches indicate that fruit, vegetables and cereal grains can reduce the risk for a wide variety of non-communicable diseases including diabetes and hypertension. Their biological functional effects might be due to their phenolic compounds. Premakumara et al. [14] reported significantly high anti-amylase and anti-glycation activities were observed in the red varieties of rice bran extracts when compared to the white varieties. In addition, their inhibitory potential against amylase was dose dependent [14].
At present, there are limited studies on the relationships between phenolic compounds especially the phenolic acids and anthocyanins of colored rice and their inhibitory potential against the key enzymes related to hyperglycemia.
Chiang Mai J. Sci. 2019; 46(4)674
The objectives of the present study were to determine phenolic compounds in colored rice extracts by using UPLC-ESI-QqQ-MS/MS method with Multiple Reaction Monitoring (MRM) approach and to evaluate their in vitro inhibitory potential against α-amylase.
2. MATERIALS AND METHODS2.1 Samples and Chemicals
Four varieties of Thai colored paddy rice samples (Oryza sativa L.) cv. Hom nil (black rice), Rice berry (new developed Thai black rice), Khao kum (purple rice) and Hom deang (red rice) were purchased from local farmers in Chiang Rai province, Thailand. All rice samples were planted in the same field, similar agronomic conditions and harvested at the same time. Phenolic compound standards of caffeic, ferulic, p-courmaric acids, (+) catechin and qurcetin were purchased from Sigma-Aldrich (St. Louis, MO, US). Authentic standards of anthocyanins including cyanidin-3-glucoside, pelargonidin-3-glucoside and peonidin-3-glucoside were obtained from Sigma-Aldrich (St. Louis, MO, US). HPLC grade methanol, acetonitrile and formic acid were obtained from Sigma-Aldrich (St. Louis, MO, US). Ultrapure water (Milli-Q) was generated with a Millipore system (EMD Millipore Corporation Inc., Bedford, MA, US).
2.2 Samples and Standard Preparation2.2.1 Sample extraction
The extraction of colored rice was carried out according to the method of Sompong et al. [6]. Approximately 50 g of colored paddy rice was dehulled by using a laboratory-scale rice huller (Nathawee Technology Co., Ltd. Bangkok, Thailand). The unpolished rice kernels were ground into fine flour by using a blender Model-optiblend 2000 (Moulinex Thailand Ltd. Bangkok, Thailand). One gram of colored rice powder was then mixed with 9 mL of acidified methanol in 1 M HCl 85% (v/v) for 10 min [8]. Consequently, the mixture was vortexed
for 5 min before filtering through Whatman filter paper No.1. The extract of colored rice was stored in an amber glass jar prior to solid phase extraction.
2.2.2 Solid phase extraction (SPE)The crude extracts of colored rice were
purified by using the method of Grussu et al. [16] with slight modifications. The extracts were applied to C18 solid phase extraction (SPE) units (Strata C18-E, GIGA unit, 10 g capacity (Phenomenex Ltd. Macclesfield, UK). The solid phase cartridge was pre-washed in 0.2% (v/v) formic acid in acetonitrile and then pre-equilibrated in 0.2% (v/v) formic acid in water. The unbound materials, which contained free sugars, organic acids and vitamin C, were collected. The SPE unit was then washed with a unit volume of 0.2% (v/v) aqueous formic acid and then with 2 volumes of ultra-pure water. The polyphenol-rich bound fraction was eluted with a unit volume of 80% (v/v) acetonitrile in water. Both the unbound and polyphenol-rich bound fractions were collected and stored at -20 °C prior to analysis.
2.2.3 Standard and stock solution preparationIndividual stock solutions of caffeic,
p-coumaric, ferulic acids, catechin, quercetin, cyanidin-3-glucoside, pelargonidin-3-glucoside and peonidin-3-glucoside were prepared at concentrations of 1 mg/mL in 80% (v/v) methanol solution. A pool of phenolic compounds and anthocyanins was prepared by separately mixing the individual standard solutions with 0.1% formic acid solution and was used as a working solution.
2.3 UPLC-ESI-QqQ-MS/MS ConditionsUPLC-ESI-QqQ-MS/MS analysis was
performed using a UPLC WatersTM Acquity I-Class (Waters Corporation Inc., Milford, MA, US) coupled with a WatersTM model Xevo TQ-S mass spectrometer (Waters Corporation Inc.,
Chiang Mai J. Sci. 2019; 46(4) 675
Milford, MA, US). Separation was carried out by WatersTM Acquity UPLC HSS T3 column 1.8 μm, 2.1 X 100 mm (Waters Corporation Inc., Milford, MA, US). Column temperature was maintained at 35 °C. The mobile phase consisted of 0.1% formic acid (solvent A) and 0.1% formic acid in acetonitrile (solvent B) and the flow rate was set at 0.4 mL/min. The injection volume was 2.0 µL. A stepwise gradients B (%): initial isocratic at 2.0 % for 1 min, and then linear gradient to 98 % in 5 min, followed by return to the initial condition of 2 % B in 7 min. Therefore, the total operation time was 12 min. The solvents and extracts were previously filtered through a 0.45 µm filter membrane (EMD Millipore Corporation Inc., Bedford,MA, US). Mass spectral data
were obtained in positive or negative mode with a mass range between m/z 0 to m/z 500. The Multiple Reaction Monitoring (MRM) transitions and compound parameters for the target phenolic compounds are shown in Table 1. The MassLynxTM 4.1 (Waters Corporation Inc., Milford, MA, US) software program was used to control the instruments and to acquire and process the data. The qualitative analysis of 8 target phenolic compounds in the extracts was performed. Identification was confirmed by comparing m/z values, retention times and fragmentation patterns with those of references standards. In addition, the concentration of phenolic compounds was quantified using external standard method. The results were expressed as mg/100 g of dried matter (DM).
Table 1. Multiple Reaction Monitoring (MRM) conditions.
No. Chain reaction (m/z)
Ionization modea
Dwell time (s)
Cone voltage (V)
Collision energy
(eV)Tentative compound
1 162.95 > 92.95 ES- 0.021 25.0 27.0 p-Coumaric acid
2 162.95 > 118.96 ES- 0.021 25.0 15.0 p-Coumaric acid
3 181.02 > 145.01 ES+ 0.021 20.0 15.0 Caffeic acid
4 181.02 > 163.03 ES+ 0.021 20.0 10.0 Caffeic acid
5 195.02 > 134.00 ES+ 0.021 25.0 25.0 Ferulic acid
6 195.02 > 145.02 ES+ 0.021 25.0 16.0 Ferulic acid
7 291.10 > 123.02 ES+ 0.021 15.0 30.0 (+)-Catechin
8 291.10 > 139.01 ES+ 0.021 15.0 15.0 (+)-Catechin
9 300.90 > 150.92 ES- 0.021 45.0 20.0 Quercetin
10 300.90 > 178.95 ES- 0.021 45.0 18.0 Quercetin
11 433.10 > 121.00 ES+ 0.021 25.0 55.0 Pelargonidin-3-glucoside
12 433.10 > 271.05 ES+ 0.021 25.0 20.0 Pelargonidin-3-glucoside
13 449.10 > 137.00 ES+ 0.021 30.0 55.0 Cyanidin-3-glucoside
14 449.10 > 287.05 ES+ 0.021 30.0 25.0 Cyanidin-3-glucoside
15 463.10 > 286.03 ES+ 0.021 25.0 42.0 Peonidin-3-glucoside
16 463.10 > 301.08 ES+ 0.021 25.0 20.0 Peonidin-3-glucoside
a ES = Electrospray + Positive mode and – negative mode
Chiang Mai J. Sci. 2019; 46(4)676
2.4 Determination of Total Phenolic ContentThe determination of the total phenolic
content was performed by applying the method of International Standard Organization (ISO) [17] with some modifications. The crude extract of colored rice 1 mL was introduced to a test tube and mixed with 95% ethanol (1 mL) and distilled water (5 mL). A freshly prepared Folin–Ciocalteu reagent (50% v/v; 5 mL) was then added to each sample followed by thorough mixing with a vortex. The reaction was incubated for 5 min at room temperature. After that, 7.5% (w/v) sodium carbonate 4 mL was added, the solution was mixed and incubated for 60 min at room temperature. The absorbance at 725 nm was measured by using a UV-visible spectrophotometer (Biochrom-Libra S22, Cambridge, UK). Gallic acid solution was prepared in distilled water and used as the standard. Total phenolic content was expressed as mg gallic acid equivalent (GAE) per 100 g DM.
2.5 Determination of α-Amylase Inhibition The α-amylase inhibitory activity was
determined according to the method of Ranilla et al. [18] with some modifications. Five hundred microlitres of crude extract of colored rice was mixed with 500 µL of 0.02 M sodium phosphate buffer (pH 6.9 with 0.006 M NaCl) containing α-amylase solution (0.5 mg/mL). After incubation at 25 °C in a water bath for 10 min, 500 µL of 1% (w/v) starch solution in 0.02 M sodium phosphate buffer (pH 6.9 with 0.006 M NaCl) was added. The mixture was reincubated at 25 °C in a water bath for 10 min. The reaction was terminated with 1.0 mL of dinitrosalicyclic acid (DNSA) color reagent. The mixture was then subjected to a boiling water bath for 7 min. Subsequently, 1.0 mL of 18.2 % Sodium tartrate solution was added to each tube before cooling to room temperature. Finally, the mixture was diluted with 10 mL of distilled water. The absorbance was
recorded using a UV-visible spectrophotometer (Biochrom-Libra S22, Cambridge, UK). The mixture contained 500 µL of buffer solution, which was used instead of the extract as the control. The percentage of α-amylase inhibition was calculated using the following equation:
% α-amylase inhibition = [(Ao540 - Ae540)/Ao540] x 100
where Ao540 = absorbance without extract; Ae540 = absorbance with extract
For the amount of phenolic compounds that gave 50% inhibition of amylase (IC50 value), assays were carried out with a range of phenol contents of crude extracts.
2.6 Statistics Results were reported as means ± standard
deviation (n = 3). One-way analysis of variance (ANOVA) was performed and followed by the Duncan’s multiple range test, using SPSS software, version 16 IBM Inc., NY, US). Statistical significance was defied at level of p-value < 0.05.
3. RESULTS AND DISCUSSION3.1 Identification of Phenolic Compounds in Colored Rice Extracts
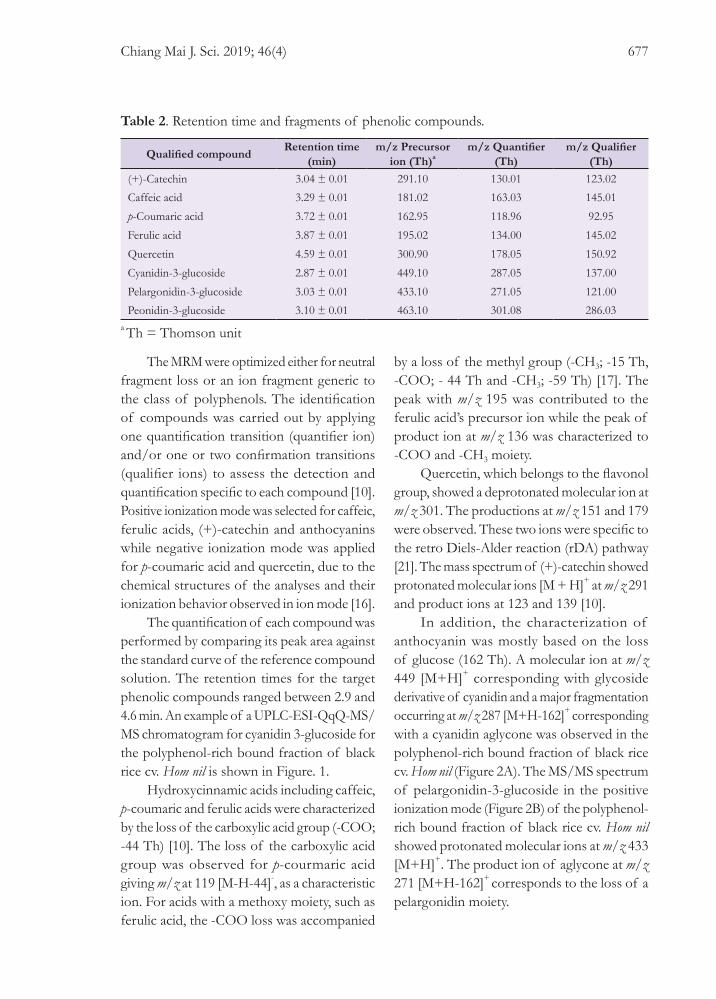
In the present study, eight target phenolic compounds were detected and identified in both the unbound and polyphenol-rich bound fractions of colored rice extracts by using UPLC-ESI-QqQ-MS/MS. A significant reduced operation time (12 min) was observed. However, in a typical HPLC system, phenolic acids including protocatechuic, 4-OH-benzoic, vanillic, caffeic, p-coumaric and ferulic acids in red and black rice varieties were quantified within 60 min [6]. The MRM transition conditions for the ESI source were used for the determination of phenolic compounds. A list of qualified compounds, retention times and fragments are shown in Table 2.
Chiang Mai J. Sci. 2019; 46(4) 677
The MRM were optimized either for neutral fragment loss or an ion fragment generic to the class of polyphenols. The identification of compounds was carried out by applying one quantification transition (quantifier ion) and/or one or two confirmation transitions (qualifier ions) to assess the detection and quantification specific to each compound [10]. Positive ionization mode was selected for caffeic, ferulic acids, (+)-catechin and anthocyanins while negative ionization mode was applied for p-coumaric acid and quercetin, due to the chemical structures of the analyses and their ionization behavior observed in ion mode [16].
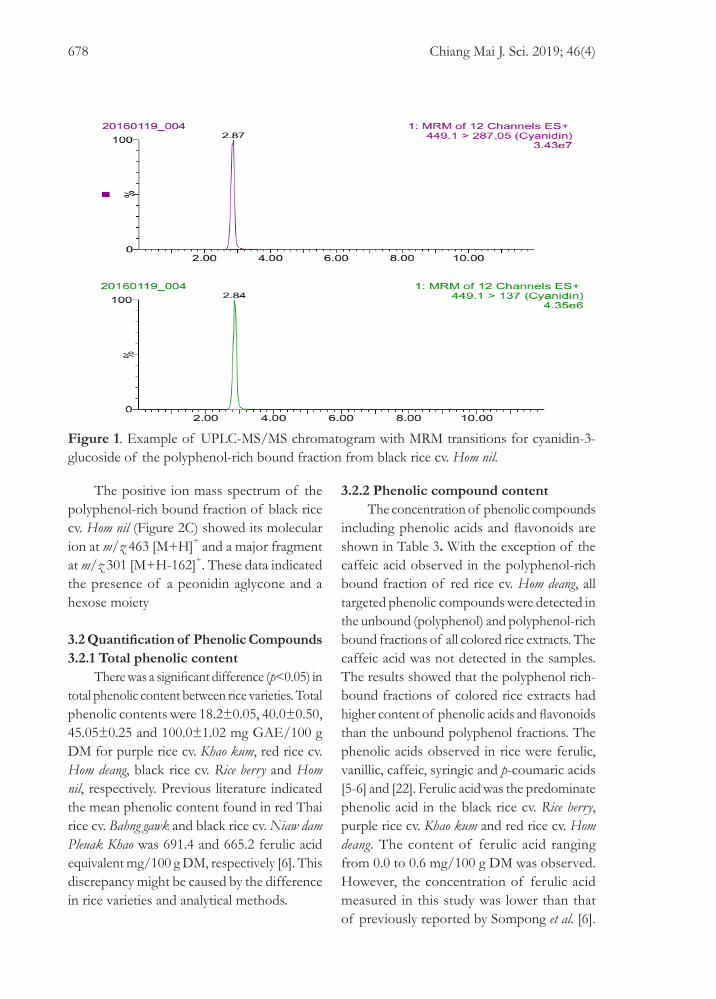
The quantification of each compound was performed by comparing its peak area against the standard curve of the reference compound solution. The retention times for the target phenolic compounds ranged between 2.9 and 4.6 min. An example of a UPLC-ESI-QqQ-MS/MS chromatogram for cyanidin 3-glucoside for the polyphenol-rich bound fraction of black rice cv. Hom nil is shown in Figure. 1.
Hydroxycinnamic acids including caffeic, p-coumaric and ferulic acids were characterized by the loss of the carboxylic acid group (-COO; -44 Th) [10]. The loss of the carboxylic acid group was observed for p-courmaric acid giving m/z at 119 [M-H-44]-, as a characteristic ion. For acids with a methoxy moiety, such as ferulic acid, the -COO loss was accompanied
by a loss of the methyl group (-CH3; -15 Th, -COO; - 44 Th and -CH3; -59 Th) [17]. The peak with m/z 195 was contributed to the ferulic acid’s precursor ion while the peak of product ion at m/z 136 was characterized to -COO and -CH3 moiety.
Quercetin, which belongs to the flavonol group, showed a deprotonated molecular ion at m/z 301. The productions at m/z 151 and 179 were observed. These two ions were specific to the retro Diels-Alder reaction (rDA) pathway [21]. The mass spectrum of (+)-catechin showed protonated molecular ions [M + H]+ at m/z 291 and product ions at 123 and 139 [10].
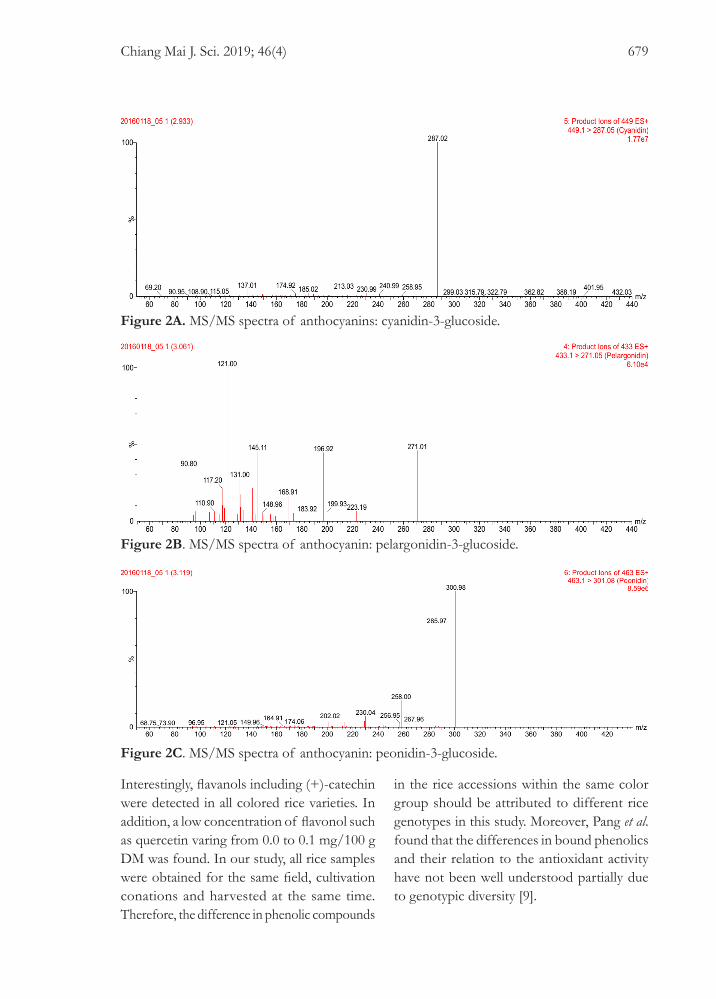
In addition, the characterization of anthocyanin was mostly based on the loss of glucose (162 Th). A molecular ion at m/z 449 [M+H]+ corresponding with glycoside derivative of cyanidin and a major fragmentation occurring at m/z 287 [M+H-162]+ corresponding with a cyanidin aglycone was observed in the polyphenol-rich bound fraction of black rice cv. Hom nil (Figure 2A). The MS/MS spectrum of pelargonidin-3-glucoside in the positive ionization mode (Figure 2B) of the polyphenol-rich bound fraction of black rice cv. Hom nil showed protonated molecular ions at m/z 433 [M+H]+. The product ion of aglycone at m/z 271 [M+H-162]+ corresponds to the loss of a pelargonidin moiety.
Table 2. Retention time and fragments of phenolic compounds.
Qualified compound Retention time (min)
m/z Precursor ion (Th)a
m/z Quantifier (Th)
m/z Qualifier (Th)
(+)-Catechin 3.04 ± 0.01 291.10 130.01 123.02Caffeic acid 3.29 ± 0.01 181.02 163.03 145.01
p-Coumaric acid 3.72 ± 0.01 162.95 118.96 92.95
Ferulic acid 3.87 ± 0.01 195.02 134.00 145.02
Quercetin 4.59 ± 0.01 300.90 178.05 150.92
Cyanidin-3-glucoside 2.87 ± 0.01 449.10 287.05 137.00
Pelargonidin-3-glucoside 3.03 ± 0.01 433.10 271.05 121.00Peonidin-3-glucoside 3.10 ± 0.01 463.10 301.08 286.03
a Th = Thomson unit
Chiang Mai J. Sci. 2019; 46(4)678
Figure 1. Example of UPLC-MS/MS chromatogram with MRM transitions for cyanidin-3-glucoside of the polyphenol-rich bound fraction from black rice cv. Hom nil.
The positive ion mass spectrum of the polyphenol-rich bound fraction of black rice cv. Hom nil (Figure 2C) showed its molecular ion at m/z 463 [M+H]+ and a major fragment at m/z 301 [M+H-162]+. These data indicated the presence of a peonidin aglycone and a hexose moiety
3.2 Quantification of Phenolic Compounds3.2.1 Total phenolic content
There was a significant difference (p<0.05) in total phenolic content between rice varieties. Total phenolic contents were 18.2±0.05, 40.0±0.50, 45.05±0.25 and 100.0±1.02 mg GAE/100 g DM for purple rice cv. Khao kum, red rice cv. Hom deang, black rice cv. Rice berry and Hom nil, respectively. Previous literature indicated the mean phenolic content found in red Thai rice cv. Bahng gawk and black rice cv. Niaw dam Pleuak Khao was 691.4 and 665.2 ferulic acid equivalent mg/100 g DM, respectively [6]. This discrepancy might be caused by the difference in rice varieties and analytical methods.
3.2.2 Phenolic compound contentThe concentration of phenolic compounds
including phenolic acids and flavonoids are shown in Table 3. With the exception of the caffeic acid observed in the polyphenol-rich bound fraction of red rice cv. Hom deang, all targeted phenolic compounds were detected in the unbound (polyphenol) and polyphenol-rich bound fractions of all colored rice extracts. The caffeic acid was not detected in the samples. The results showed that the polyphenol rich-bound fractions of colored rice extracts had higher content of phenolic acids and flavonoids than the unbound polyphenol fractions. The phenolic acids observed in rice were ferulic, vanillic, caffeic, syringic and p-coumaric acids [5-6] and [22]. Ferulic acid was the predominate phenolic acid in the black rice cv. Rice berry, purple rice cv. Khao kum and red rice cv. Hom deang. The content of ferulic acid ranging from 0.0 to 0.6 mg/100 g DM was observed. However, the concentration of ferulic acid measured in this study was lower than that of previously reported by Sompong et al. [6].
Chiang Mai J. Sci. 2019; 46(4) 679
Figure 2A. MS/MS spectra of anthocyanins: cyanidin-3-glucoside.
Figure 2B. MS/MS spectra of anthocyanin: pelargonidin-3-glucoside.
Figure 2C. MS/MS spectra of anthocyanin: peonidin-3-glucoside.
Interestingly, flavanols including (+)-catechin were detected in all colored rice varieties. In addition, a low concentration of flavonol such as quercetin varing from 0.0 to 0.1 mg/100 g DM was found. In our study, all rice samples were obtained for the same field, cultivation conations and harvested at the same time. Therefore, the difference in phenolic compounds
in the rice accessions within the same color group should be attributed to different rice genotypes in this study. Moreover, Pang et al. found that the differences in bound phenolics and their relation to the antioxidant activity have not been well understood partially due to genotypic diversity [9].
Chiang Mai J. Sci. 2019; 46(4)680
Table 3. Content of phenolic compounds in fractions of colored rice.
3.2.3 Anthocyanin content Black colored genotypes are well known
from other colored cereals, for exmaple rice, barley and sorghum [4]. The black color was observed mainly from cyanidin-3-glucoside and peonidin-3-glucoside. They give the kernels of rice a dark purple shade and thus the name black rice is somewhat misleading [14]. Significantly higher concentrations of cyanidin-3-glucoside, pelargonidin-3-glucoside and peonidin-3-glucoside were observed in the polyphenol-rich bound fraction (quercetin). A similar results were observed by Sompong et al. [6] reported that cyanidin-3-glucoside and peonidin-3-glucoside content varied from 19.4 to 137.4 and 11.1 to 12.8 mg/100 g DM in Thai colored rice, respectively [6]. A range of total cyanidin-3-glucoside from 0.1 to 138.8 mg/100 g DM was quantified in the polyphenol-rich bound fraction of colored rice samples. In black rice, anthocyanins accumulate in the outer layers as free forms and cyanidin-3-glucoside and peonidin-3-glucoside have been identified in black rice bran as the main anthocyanin components [9]. In addition, cyanidin-3-glucoside is the dominant anthocyanin that was observed in black rice and purple corn [4].
It should be noted that low concentrations of cyanidin-3-glucoside and peonidin-3-glucoside were found in the red rice sample.
3.3 Inhibitory Potential Against α-AmylasePhenolic antioxidants have been recognized
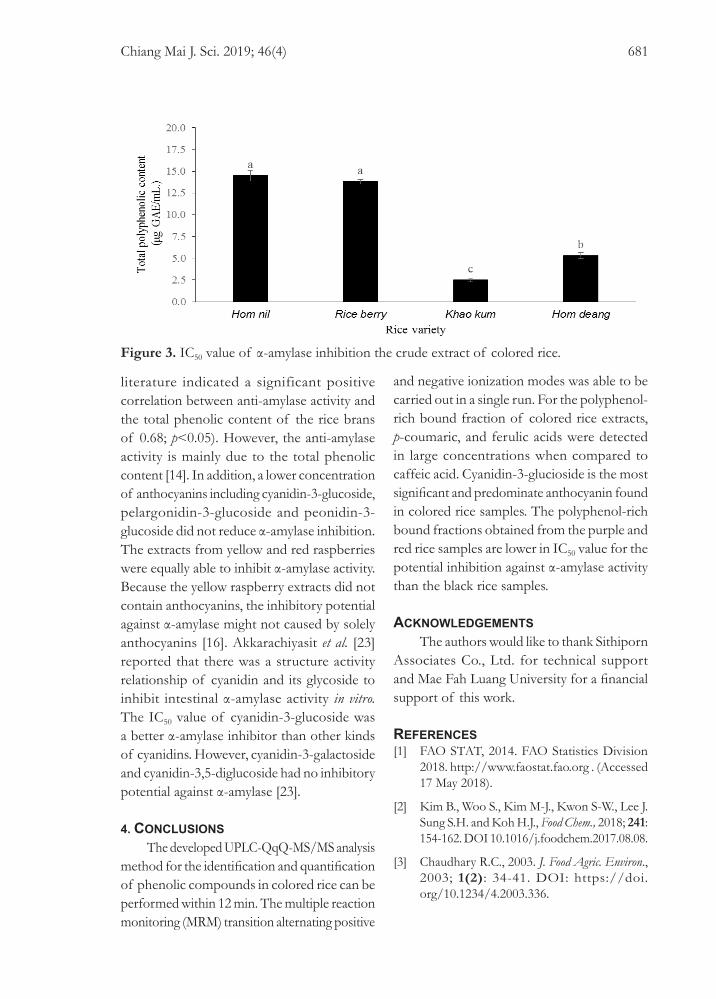
to manage early type 2 diabetes [18]. The amount of phenols required to inhibit 50% (IC50) of the α-amylase activity was used as an indicator to compare their inhibitory potential against α- amylase [16]. A significant difference in the IC50 value (p<0.05) of the crude extract from colored rice against α-amylase activity is shown in Figure 3. The IC50 value of the crude extract of colored rice extracts ranged from 2.50 to 14.4 µg GAE/mL. The anti-amylase activity of crude red rice bran extractable of 2 mg/mL was dose dependent, and their IC50
value ranged from 58.3 to 102.6 µg/mL [14]. The polyphenol-rich bound fraction of black rice cv. Hom nil and Rice berry did not show a significant difference in inhibitory potential against α-amylase activity at IC50 values of 14.4 and 13.8 µg GAE/mL, respectively. However, the crude extract of purple rice cv. Khao kum and red rice cv. Hom deang gave IC50 values of 2.5 and 5.3 µg GAE/mL, respectively. Previous
1 Mean±SD (n=3)nd = not detected
Phenolic compounds (mg/100g)1
Black rice cv. Hom nil Black rice cv. Rice berryPurple rice cv. Khoo
kum Red rice cv. Hom
deangUnbound Bound Unbound Bound Unbound Bound Unbound Bound
(+)-Catechin 0.01±0.00 0.12 ±0.01 nd 0.10±0.01 nd 0.01±0.00 0.20±0.00 0.91±0.08
Caffeic acid nd nd nd nd nd nd nd 0.02±0.00
p-Coumaric acid 0.01±0.00 0.05±0.01 0.01±0.00 0.04±0.00 0.01±0.00 0.02±0.00 0.01±0.00 0.06±0.00
Ferulic acid 0.04±0.00 0.25±0.01 0.05±0.00 0.40±0.03 0.05±0.00 0.24±0.02 0.02±0.00 0.57±0.02
Quercetin 0.03±0.00 0.07±0.03 0.01±0.00 c 0.08±0.00 0.05±0.00 0.10±0.01 0.01±0.00 0.02±0.01
Cyanidin-3-glucoside 5.83±0.48 132.96±3.93 0.31±0.01 47.80±0.44 0.47±0.00 11.75±0.32 0.01±0.00 0.06±0.00
Pelargonidin-3-glucoside
0.01±0.00 0.23±0.01 nd 0.07±0.00 nd 0.03±0.00 nd nd
Peonidin-3-glucoside 1.15±0.00 19.56±0.39 0.09±0.00 6.94±0.26 0.27±0.00b 5.29±0.10 nd 0.01±0.0
Chiang Mai J. Sci. 2019; 46(4) 681
Figure 3. IC50 value of α-amylase inhibition the crude extract of colored rice.
literature indicated a significant positive correlation between anti-amylase activity and the total phenolic content of the rice brans of 0.68; p<0.05). However, the anti-amylase activity is mainly due to the total phenolic content [14]. In addition, a lower concentration of anthocyanins including cyanidin-3-glucoside, pelargonidin-3-glucoside and peonidin-3-glucoside did not reduce α-amylase inhibition. The extracts from yellow and red raspberries were equally able to inhibit α-amylase activity. Because the yellow raspberry extracts did not contain anthocyanins, the inhibitory potential against α-amylase might not caused by solely anthocyanins [16]. Akkarachiyasit et al. [23] reported that there was a structure activity relationship of cyanidin and its glycoside to inhibit intestinal α-amylase activity in vitro. The IC50 value of cyanidin-3-glucoside was a better α-amylase inhibitor than other kinds of cyanidins. However, cyanidin-3-galactoside and cyanidin-3,5-diglucoside had no inhibitory potential against α-amylase [23].
4. CONCLUSIONSThe developed UPLC-QqQ-MS/MS analysis
method for the identification and quantification of phenolic compounds in colored rice can be performed within 12 min. The multiple reaction monitoring (MRM) transition alternating positive
and negative ionization modes was able to be carried out in a single run. For the polyphenol-rich bound fraction of colored rice extracts, p-coumaric, and ferulic acids were detected in large concentrations when compared to caffeic acid. Cyanidin-3-glucioside is the most significant and predominate anthocyanin found in colored rice samples. The polyphenol-rich bound fractions obtained from the purple and red rice samples are lower in IC50 value for the potential inhibition against α-amylase activity than the black rice samples.
ACKNOWLEDGEMENTSThe authors would like to thank Sithiporn
Associates Co., Ltd. for technical support and Mae Fah Luang University for a financial support of this work.
REFERENCES[1] FAO STAT, 2014. FAO Statistics Division
2018. http://www.faostat.fao.org . (Accessed 17 May 2018).
[2] Kim B., Woo S., Kim M-J., Kwon S-W., Lee J. Sung S.H. and Koh H.J., Food Chem., 2018; 241: 154-162. DOI 10.1016/j.foodchem.2017.08.08.
[3] Chaudhary R.C., 2003. J. Food Agric. Environ., 2003; 1(2): 34-41. DOI: https://doi.org/10.1234/4.2003.336.
Chiang Mai J. Sci. 2019; 46(4)682
[4] Abdel-Aal E-S.M., Young J.C. and Rabalski I., J. Agric. Food Chem., 2006; 54: 4696-4704.DOI 10.1021/jf0606609.
[5] Vichapong J., Sookserm M., Srijesdaruk V., Swatsitang P. and Srijaranai S., LWT - Food Sci. Technol., 2010; 43: 1325-1330. DOI 10.1016/j.lwt.2010.05.007.
[6] Sompong R., Siebenhandl-Ehn S., Linsberger-Martin G. and Berghofer E., Food Chem., 2011; 124: 132-140. DOI 10.1016/j.foodchem.2010.05.115.
[7] Pengkumsri N., Chaiyasut C., Saenjum C., Sirilun S., Peerajan S., Suwannalert P., Sirisattha S. and Sivamruthi B.S., Food Sci. Technol.,2015; 35(2): 331-338. DOI 10.1590/1678-457X.6573.
[8] Abdel-Aal E-S.M. and Hucl P. Cereal Chem., 1999;76(3): 350-354 DOI 10.1094/CCHEM.1999.76.3.350.
[9] Pang Y., Ahmed S., Xu Y., Beta T., Zhu Z., Shao Y. and Bao J., Food Chem., 2018; 240: 212-221. DOI 10.1016/j.foodchem.2017.07.095.
[10] Lambert M., Meudee E., Verbaere A., Mazerrolles G., Wirth J., Masson G., Cheynier V. and Sommerer N. Molecules, 2015; 20: 7890-7914. DOI 10.3390/molecules20057890.
[11] Deng G-F., Xu X-R., Zhang Y., Li D., Gan R-Y. and Li H-B., Crit. Rev. Food Sci. Nutr., 2013; 53(3): 296-306. DOI 10.1080/10408398.2010.529624.
[12] World Health Organization, Global strategy on diet, physical activity and health on WHO; Available at : http://www.who.int/dietphysicalactivity/en/.
[13] Krentz A.J. and Bailey C.J., Drug, 2005; 65: 385-411. DOI: 10.2165/00003495-200565030-00005.
[14] Premakumara G.A.S., Abeysekera W.K.S.M., Ratnasooriya W.D., Chandrasekharan N.V. and Bentota A.P., J. Cereal Sci., 2013; 58: 451-456. DOI 10.1016/j.jcs.2013.09.004.
[15] Yuehan P., Sulaiman A., Yanjie X., Trust B., Zhiwei Z., Yafang S. and Jinsong B., Food Chem., 2018; 240: 212-221. DOI 10.1016/j.foodchem.2017.07.095.
[16] Grussu D., Stewart D. and McDougall G.J., J. Agric. Food Chem., 2011; 59: 2324-2331. DOI 10.1021/jf1045359.
[17] ISO., Determination of Substances Characteristic of Green and Black Tea-Part I: Content of Total Polyphenols in Tea—Colorimetric Method using Folin-Ciocalteu Reagent., 2005:14502-1.
[18] Ranilla L.G., Kwon Y. I., Apostolidis E. and Shetty K., Bioresour. Technol., 2010; 101: 4676-4689. DOI 10.1016/j.biortech.2010.01.093.
[19] Jubete L.A., Smyth T.J., Valverde J., Rai D.K. and Ryan C.B., Phytochem. Anal., 2013; 25(2): 141-146. DOI:10.21427/D7JK7P.
[20] Lecce G.D., Martínez-Huélamo M., Tulipani S, Vallverdú-Queralt A. and Lamuela-Raventós R.M., J. Agric. Food Chem., 2013;61(35): 8373-8380. DOI 10.1021/jf401953y.
[21] Sriseadka T., Wongpornchai S. and Rayanakorn M., J. Agric. Food Chem., 2012; 64(47): 11723-11732. DOI 10.1021/jf303204s.
[22] Tian S., Nakamura K., Cui T. and Kayahara H., J. Chromatogr. A., 2005; 1063: 121-128. DOI 10.1016/j.chromaa.2004.11.075.
[23] Akkarachiyasit S., Charoenlertkul P., Yibchok-anun S. and Adisakwattana S., Int. J. Mol. Sci., 2010; 11: 3387-3396. DOI 10.3390/ijms11093387.

![Index [application.wiley-vch.de] · reagents used for 310 ... Fcγ-effector functions 104 engineering 99–102, 101 ... aqueous DNA solutions phenolic extraction of 666 Ardenne, ...](https://static.fdocument.org/doc/165x107/5b80fc3b7f8b9a7b6f8b50ac/index-reagents-used-for-310-fc-effector-functions-104-engineering.jpg)