I - 401 - Computer Science and Engineering | Michigan...
4
A COMPARATIVE ANALYSIS OF TWO DISTANCE MEASURES IN COLOR IMAGE DATABASES Gang Qian, Shamik Sural and Sakti Pramanik Dept. of Computer Science and Engineering, 3115 Engineering Building, Michigan State University, East Lansing, MI 48824, USA. {qiangang, pramanik}@cse.msu.edu, [email protected] ABSTRACT Euclidean distance measure has been used in comparing feature vectors of images, while cosine angle distance measure is used in document retrieval. In this paper, we theoretically analyze these two distance measures based on feature vectors normalized by image size and experiment with them in the context of color image database. We find that the cosine angle distance, in general, works equally well for image databases. We show, for a given query vector, characteristics of feature vectors that will be favored by one measure but not by the other. We compute k-nearest neighbors for query images using both Euclidean and cosine angle distance for a small image database. The experimental data corroborate our theoretical results. 1. INTRODUCTION Vector model is widely used for capturing and storing objects in information retrieval systems. One important issue to consider in using the vector model is the choice of appropriate distance measure that provides the metric for finding similarity between two objects. Several distance measures, such as the L1 metric (Manhattan Distance) and the L2 metric (Euclidean distance), have been proposed to compare the similarity of feature vectors. In content-based image retrieval systems Euclidean distance is commonly used to determine similarities between a pair of images. In document retrieval systems, on the other hand, distance measure based on cosine angle is more commonly used for similarities between two documents [1][2]. Even though both the Euclidean and the cosine angle based distances coincide when the components of the feature vectors are normalized by the norm of the vector, they differ when they are normalized otherwise. In image processing applications components of a feature vector (e.g., color histogram) are usually normalized by the size of the image and as a result, the Euclidean and the cosine angle based distances produce different results. The contribution of this paper is to show when one distance measure performs differently, and when they perform similarly for feature vectors normalized by size. We present a theoretical approach to compare these two distance measures and corroborate the theory with experimental results performed on feature vectors for color images. 2. THE COMPARISON OF TWO DISTANCE MEASURES 2.1. Related work One way of comparing the distance measures is to see their retrieval performance in terms of precision and recall based on a particular image database [3]. Different aspects on how to choose a distance measure have also been studied. One concern in choosing a particular distance measure is the impact of computational overhead on system performance. When feature vectors are large, some distance measures may consume more computing resources than the others. One possible approximation of the Euclidean distance measure is proposed in [4]. On the other hand, it is also important to choose a similarity measure that is consistent with human ideas of similarity. The authors of [5] have proposed a similarity measure based on noise distribution of the image set. 2.2. The retrieval experiment We start our comparison of Euclidean distance and cosine angle distance based on the retrieval results from our image database, which contains 650 photographic color images, derived from the web and IMSI master clips. Our experiment is based on both QBIC feature vectors [6] and color histograms proposed in [7]. For color histograms, we use a new histogram generation technique based on HSV color space where each pixel in an image contributes either its hue or its intensity based on its saturation. I - 401 0-7803-7622-6/02/$17.00 ©2002 IEEE IEEE ICIP 2002
Transcript of I - 401 - Computer Science and Engineering | Michigan...
A COMPARATIVE ANALYSIS OF TWO DISTANCE MEASURES IN COLOR IMAGE DATABASES
Gang Qian, Shamik Sural and Sakti Pramanik
Dept. of Computer Science and Engineering,
3115 Engineering Building, Michigan State University, East Lansing, MI 48824, USA.
{qiangang, pramanik}@cse.msu.edu, [email protected]
ABSTRACT
Euclidean distance measure has been used in comparing feature
vectors of images, while cosine angle distance measure is used in
document retrieval. In this paper, we theoretically analyze
these two distance measures based on feature vectors normalized
by image size and experiment with them in the context of color
image database. We find that the cosine angle distance, in
general, works equally well for image databases. We show, for
a given query vector, characteristics of feature vectors that will
be favored by one measure but not by the other. We compute
k-nearest neighbors for query images using both Euclidean and
cosine angle distance for a small image database. The
experimental data corroborate our theoretical results.
1. INTRODUCTION
Vector model is widely used for capturing and storing objects in
information retrieval systems. One important issue to consider
in using the vector model is the choice of appropriate distance
measure that provides the metric for finding similarity between
two objects. Several distance measures, such as the L1 metric
(Manhattan Distance) and the L2 metric (Euclidean distance),
have been proposed to compare the similarity of feature vectors.
In content-based image retrieval systems Euclidean distance is
commonly used to determine similarities between a pair of
images. In document retrieval systems, on the other hand,
distance measure based on cosine angle is more commonly used
for similarities between two documents [1][2]. Even though
both the Euclidean and the cosine angle based distances coincide
when the components of the feature vectors are normalized by
the norm of the vector, they differ when they are normalized
otherwise. In image processing applications components of a
feature vector (e.g., color histogram) are usually normalized by
the size of the image and as a result, the Euclidean and the cosine
angle based distances produce different results. The contribution
of this paper is to show when one distance measure performs
differently, and when they perform similarly for feature vectors
normalized by size. We present a theoretical approach to
compare these two distance measures and corroborate the
theory with experimental results performed on feature vectors
for color images.
2. THE COMPARISON OF TWO DISTANCE MEASURES
2.1. Related work
One way of comparing the distance measures is to see their
retrieval performance in terms of precision and recall based on
a particular image database [3]. Different aspects on how to
choose a distance measure have also been studied. One
concern in choosing a particular distance measure is the impact
of computational overhead on system performance. When
feature vectors are large, some distance measures may consume
more computing resources than the others. One possible
approximation of the Euclidean distance measure is proposed in
[4]. On the other hand, it is also important to choose a
similarity measure that is consistent with human ideas of
similarity. The authors of [5] have proposed a similarity
measure based on noise distribution of the image set.
2.2. The retrieval experiment
We start our comparison of Euclidean distance and cosine angle
distance based on the retrieval results from our image database,
which contains 650 photographic color images, derived from
the web and IMSI master clips. Our experiment is based on
both QBIC feature vectors [6] and color histograms proposed in
[7]. For color histograms, we use a new histogram generation
technique based on HSV color space where each pixel in an
image contributes either its hue or its intensity based on its
saturation.
I - 4010-7803-7622-6/02/$17.00 ©2002 IEEE IEEE ICIP 2002
Our results show that two distance measures give us different
ordering in the retrieval results. Euclidean distance has better
precision and recall for some query images and angle is better for
some other query images.
In the next subsection, we describe the mathematical model we
have used for analysis. The analysis shows the relationship
between the distance measures and the variance of the
components of the feature vectors (we use the name "variance of
feature vector" or "variance" in the following sections). The
detailed experimental results are presented in section 3.
2.3. The mathematical analysis
The analysis described in this subsection is based on geometrical
properties of feature vectors derived from image hyperspace.
To make feature vectors comparable to each other, each vector is
normalized by its corresponding image size. Assuming there
are n components in a feature vector, the formula
=
=n
ii
1kk VVv (1≤k≤n) gives a normalized feature vector v
for the original vector V. Each normalized vector in the image
database can be regarded as a point on the hyperplane
x1+x2+...+xn = 1 in a vector space which has n dimensions.
There are two special points in the hyperspace. The centroid C
is defined as the point: (1/n, ...,1/n) on the hyperplane, where n is
the number of dimensions and the origin O is the point: (0,...,0).
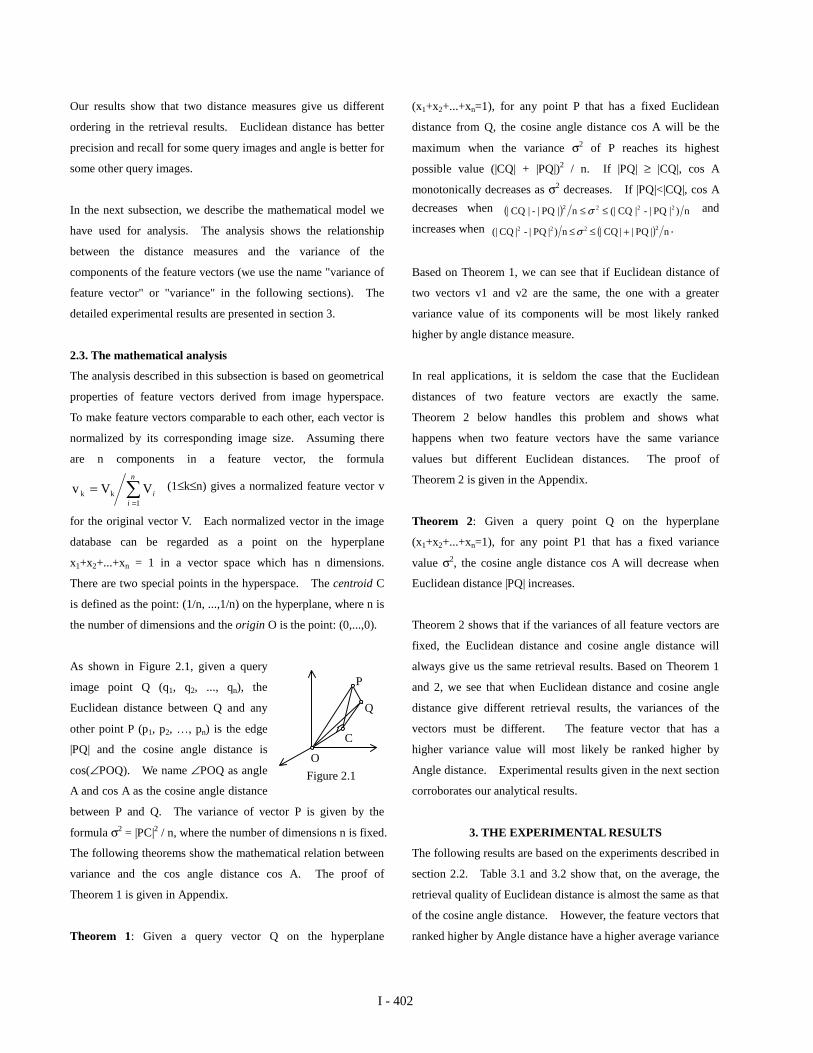
As shown in Figure 2.1, given a query
image point Q (q1, q2, ..., qn), the
Euclidean distance between Q and any
other point P (p1, p2, …, pn) is the edge
|PQ| and the cosine angle distance is
cos(∠POQ). We name ∠POQ as angle
A and cos A as the cosine angle distance
between P and Q. The variance of vector P is given by the
formula σ2 = |PC|2 / n, where the number of dimensions n is fixed.
The following theorems show the mathematical relation between
variance and the cos angle distance cos A. The proof of
Theorem 1 is given in Appendix.
Theorem 1: Given a query vector Q on the hyperplane
(x1+x2+...+xn=1), for any point P that has a fixed Euclidean
distance from Q, the cosine angle distance cos A will be the
maximum when the variance σ2 of P reaches its highest
possible value (|CQ| + |PQ|)2 / n. If |PQ| ≥ |CQ|, cos A
monotonically decreases as σ2 decreases. If |PQ|<|CQ|, cos A
decreases when ( ) n|PQ|-|CQ(|n|PQ|-|CQ| 222 )2 ≤≤ σ and
increases when ( ) n|PQ||CQ|n)|PQ|-|CQ(| 222 2+≤≤σ .
Based on Theorem 1, we can see that if Euclidean distance of
two vectors v1 and v2 are the same, the one with a greater
variance value of its components will be most likely ranked
higher by angle distance measure.
In real applications, it is seldom the case that the Euclidean
distances of two feature vectors are exactly the same.
Theorem 2 below handles this problem and shows what
happens when two feature vectors have the same variance
values but different Euclidean distances. The proof of
Theorem 2 is given in the Appendix.
Theorem 2: Given a query point Q on the hyperplane
(x1+x2+...+xn=1), for any point P1 that has a fixed variance
value σ2, the cosine angle distance cos A will decrease when
Euclidean distance |PQ| increases.
Theorem 2 shows that if the variances of all feature vectors are
fixed, the Euclidean distance and cosine angle distance will
always give us the same retrieval results. Based on Theorem 1
and 2, we see that when Euclidean distance and cosine angle
distance give different retrieval results, the variances of the
vectors must be different. The feature vector that has a
higher variance value will most likely be ranked higher by
Angle distance. Experimental results given in the next section
corroborates our analytical results.
3. THE EXPERIMENTAL RESULTS
The following results are based on the experiments described in
section 2.2. Table 3.1 and 3.2 show that, on the average, the
retrieval quality of Euclidean distance is almost the same as that
of the cosine angle distance. However, the feature vectors that
ranked higher by Angle distance have a higher average variance
Q
C
O
P
Figure 2.1
I - 402
value then those ranked higher by Euclidean distance. Table
3.3 and 3.4 show the average variance values of feature vectors
ranked 1-5, 1-10 and 1-25 in the retrieval results by Euclidean
distance and by cosine angle distance. We see that the average
value of variance is higher for those ranked by cosine angle
distance than those by Euclidean distance, which corroborates
our analytical results.
Table 3.1 Average precision and recall of QBIC feature vector:
Precision RecallDistanceMeasure 5 10 25 5 10 25
Euclidean 0.580 0.430 0.240 0.379 0.547 0.721Cosine 0.560 0.420 0.236 0.366 0.530 0.715
Table 3.2: Average precision and recall of HSV histogram vector:
Precision RecallDistanceMeasure 5 10 25 5 10 25
Euclidean 0.820 0.630 0.336 0.520 0.781 0.983Cosine 0.820 0.640 0.324 0.520 0.785 0.952
Table 3.3 Average variances of QBIC feature vectors:
QBICDistanceMeasure 5 10 25
Euclidean 0.00251 0.00249 0.00233Cosine angle 0.00299 0.00286 0.00294
Table 3.4 Average variances of HSV histogram vectors:
HSVDistanceMeasure 5 10 25
Euclidean 0.00197 0.00188 0.00164Cosine angle 0.00228 0.00229 0.00198
As we mentioned in section 2.2, the actual ranking results of
Euclidean and cosine angle distance for a given query image
are often different. We have proved by Theorem 1 and 2 that
the different retrieval results by Euclidean distance and cosine
angle distance are related to the variances of the components of
the feature vectors. Figure 3.1 and 3.2 illustrates one typical
query result where the first image is the query image. In this
example, the cosine angle distance shows a better retrieval
results than the Euclidean distance.
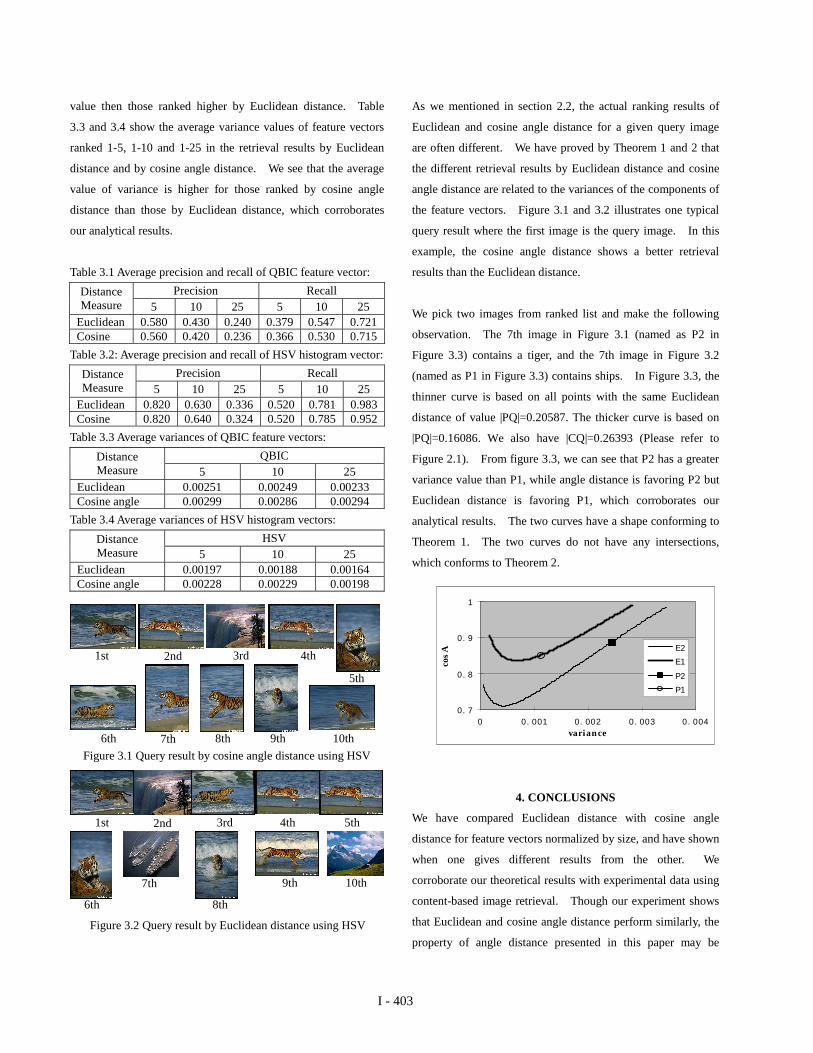
We pick two images from ranked list and make the following
observation. The 7th image in Figure 3.1 (named as P2 in
Figure 3.3) contains a tiger, and the 7th image in Figure 3.2
(named as P1 in Figure 3.3) contains ships. In Figure 3.3, the
thinner curve is based on all points with the same Euclidean
distance of value |PQ|=0.20587. The thicker curve is based on
|PQ|=0.16086. We also have |CQ|=0.26393 (Please refer to
Figure 2.1). From figure 3.3, we can see that P2 has a greater
variance value than P1, while angle distance is favoring P2 but
Euclidean distance is favoring P1, which corroborates our
analytical results. The two curves have a shape conforming to
Theorem 1. The two curves do not have any intersections,
which conforms to Theorem 2.
4. CONCLUSIONS
We have compared Euclidean distance with cosine angle
distance for feature vectors normalized by size, and have shown
when one gives different results from the other. We
corroborate our theoretical results with experimental data using
content-based image retrieval. Though our experiment shows
that Euclidean and cosine angle distance perform similarly, the
property of angle distance presented in this paper may be
Figure 3.1 Query result by cosine angle distance using HSV
1st 2nd 3rd 4th
5th
6th 7th 8th 9th 10th
Figure 3.2 Query result by Euclidean distance using HSV
1st 2nd 3rd 4th 5th
6th
7th
8th
9th 10th
0. 7
0. 8
0. 9
1
0 0. 001 0. 002 0. 003 0. 004varian ce
cos
A E2
E1
P2
P1
I - 403
exploited to achieve better retrieval quality in image databases.
We have also done experiments on the same image database of
650 images with Manhattan (L1) distance measure. Our initial
results show that, though the ranked ordering of images for a
query using Manhattan distance is different from those by
Euclidean and cosine angle, the average precision and recall are
very similar to those of the Euclidean distance and cosine angle
distance. We have seen in our experiment that the precision and
recall of Manhattan distance is always better than those of the
Euclidean distance and cosine angle distance in the first 1-5
results, but always worse in the first 1-25 results.
5. APPENDIX
Property 1: For every point P (p1, p2, …, pn) on the hyperplane
(x1+x2+...+xn=1) other than centroid C, hyperangle ∠OCP = 90°.
Proof. Vector PC is (p1 - 1/n, …, pn - 1/n), and vector OC is (0 -
1/n, ... , 0 - 1/n). We have: cos ∠OCP = (PC•OC)/(|PC|×|OC|)
= ((p1 + p2 + … + pn - 1) × (-1/n)) / (|PC| × |OC|)
We know p1+p2+...+pn=1. So cos∠OCP=0 and ∠OCP=90°.
Theorem 1 Proof. As shown in Figure 2.1, we know that
∠OCP and ∠OCQ are 90° from Property 1. In right ∆COP, We
have:
Based on ∆OPQ, we have the following:
Combing Formula 1, 2 and 3 together, we have:
Since |OC|, |OQ| and |PQ| are fixed, consider |PC| as the
independence variable of the function. We can get the
derivative function formula 5, in which a > 0:
In right ∆COP, We have:
Combing Formula 5 and 6, we have:
Based on the derivative function in Formula 7 and the equation
σ2 = |PC| / n, we can see that if |PQ| ≥ |CQ|, cos A monotonously
decreases as σ2 decreases. If |PQ|<|CQ|, cos A decreases when
( ) n|PQ|-|CQ|n|PQ|-|CQ| 222 )(2 ≤≤σ and increases when
( ) n|PQ||CQ|n|PQ|-|CQ 222 2)(| +≤≤σ .
Since the only two local maximum values of cos A appears at
where σ2 equals (|CQ| - |PQ|)2 / n or (|CQ| + |PQ|)2 / n. It is
clear from Figure 2.1 that cos A at (|CQ| + |PQ|)2 / n will be
greater than cos A at (|CQ| - |PQ|) 2/ n. Thus, the cosine angle
distance cos A will be the maximum when σ2 is (|CQ|+|PQ|)2/n.
Theorem 2 Proof. Since variance of the components of P σ2
is fixed. Using equation σ2 = |PC| / n , we know |PC| is also
fixed. So |PC|, |OC| and |OQ| are all fixed in formula 4. We
can treat |PQ| as the independence variable and get the
following derivative function (a>0):
f'(x) will always be less than zero. It means that when
Euclidean distance |PQ| increases, the cosine angle distance cos
A will decrease.
6. REFERENCES
[1] G. Salton and M. E. Lesk, "Computer Evaluation of
Indexing and Text Processing," Journal of ACM, vol. 15(1), pp.
8-36, 1968.
[2] R. Baeza-Yates and B. Ribeiro-Neto, "Modern Information
Retrieval," ACM Press, pp. 27-28, 1999.
[3] J. Smith, "Integrated Spatial and Feature Image Systems:
Retrieval, Analysis and Compression," Ph.D. Dissertation,
Columbia University, 1997.
[4] J. Hafner, H. Sawhney, et al, "Efficient Color Histogram
Indexing for Quadratic Form Distance Functions," IEEE
Transactions on PAMI, vol. 17, no. 7, pp 729-736, 1995.
[5] N. Sebe, M. Lew and D. Huijsmans, "Toward improved
ranking metrics," IEEE Trans. on PAMI, 22(10), pp. 1132-1143,
2000.
[6] W. Niblack, R. Barber, et al, “The QBIC Project: Querying
images by content using color texture and shape,” Proc. SPIE
Int. Soc. Opt. Eng., in Storage and Retrieval for Image and
Video Databases, vol. 1908, pp. 173-187, 1993.
[7] S. Sural, G. Qian and S. Pramanik, "A histogram with
perceptually smooth color transition for image retrieval,"
Fourth Int. Conf. on Computer Vision, Pattern Recognition and
Image Processing, Durham, 2002 (to appear).
(1) (2)
(3)
(5)
(4)
(6)
(7)
(8)
222 |CO||CP||OP| += 22 |CO|OP||OP| |+=
|OQ|OP|2
|PQ|OQ|OP|POQ)cos(cos(A)
222
|
||
⋅−+=∠=
a
|PQ||OQ||OC||PC|(x)f'
2222 +−+=
22
2222
|OC||PC||OQ|2
|PQ||OQ||OC||PC|cos(A)
+⋅⋅
−++=
222 |OC||OQ||CQ| −=
a
|PQ||CQ||PC|(x)f'
222 +−=
( )a
|OQ|cos|CQ|(x)f'
222 −⋅=
I - 404


![Representation Theory and Orbital Varietiestpietrah/PAPERS/tufts.pdf · 2003-11-21 · Theorem. [Parabolic Induction] If X is hyperbolic, there is a G-equivariant fibration O X →Z](https://static.fdocument.org/doc/165x107/5f7000246467436a7e4da182/representation-theory-and-orbital-tpietrahpaperstuftspdf-2003-11-21-theorem.jpg)