Confidence intervals and hypothesis testing Petter Mostad 2005.10.03.
HypothesesHypothesis test when σ is known
T-distribution
Hypothesis Testing for a Mean
MGMT 230: Introductory Statistics
February 9, 2009
MGMT 230: Introductory Statistics Hypothesis Testing for a Mean
HypothesesHypothesis test when σ is known
T-distribution
Goals of this section 2/ 15
Learn about what it means for statistical results to bestatistically significant.
Learn about how to use statistical results to test hypotheses.
MGMT 230: Introductory Statistics Hypothesis Testing for a Mean
HypothesesHypothesis test when σ is known
T-distributionConstructing hypotheses
Hypothesis Test 3/ 15
A hypothesis is a claim or statement about a property of apopulation.
Example: The population mean for systolic blood pressure is120.
A hypothesis test (or test of significance is a standardprocedure for testing a claim about a property of a population.
Recall the example from last week about birth weights withmothers who use drugs.
Hypothesis: Using drugs during pregnancy leads to an averagebirth weight of 7 pounds (the same as with mothers who donot use drugs).
MGMT 230: Introductory Statistics Hypothesis Testing for a Mean

HypothesesHypothesis test when σ is known
T-distributionConstructing hypotheses
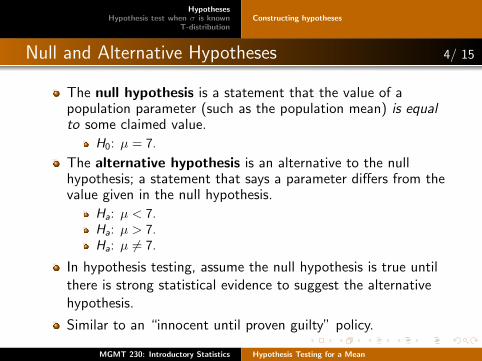
Null and Alternative Hypotheses 4/ 15
The null hypothesis is a statement that the value of apopulation parameter (such as the population mean) is equalto some claimed value.
H0: µ = 7.
The alternative hypothesis is an alternative to the nullhypothesis; a statement that says a parameter differs from thevalue given in the null hypothesis.
Ha: µ < 7.Ha: µ > 7.Ha: µ 6= 7.
In hypothesis testing, assume the null hypothesis is true untilthere is strong statistical evidence to suggest the alternativehypothesis.
Similar to an “innocent until proven guilty” policy.
MGMT 230: Introductory Statistics Hypothesis Testing for a Mean

HypothesesHypothesis test when σ is known
T-distributionConstructing hypotheses
Null and Alternative Hypotheses 4/ 15
The null hypothesis is a statement that the value of apopulation parameter (such as the population mean) is equalto some claimed value.
H0: µ = 7.
The alternative hypothesis is an alternative to the nullhypothesis; a statement that says a parameter differs from thevalue given in the null hypothesis.
Ha: µ < 7.Ha: µ > 7.Ha: µ 6= 7.
In hypothesis testing, assume the null hypothesis is true untilthere is strong statistical evidence to suggest the alternativehypothesis.
Similar to an “innocent until proven guilty” policy.
MGMT 230: Introductory Statistics Hypothesis Testing for a Mean
HypothesesHypothesis test when σ is known
T-distribution
Computing significanceType I and Type II errorsSteps of a hypothesis testP-value method
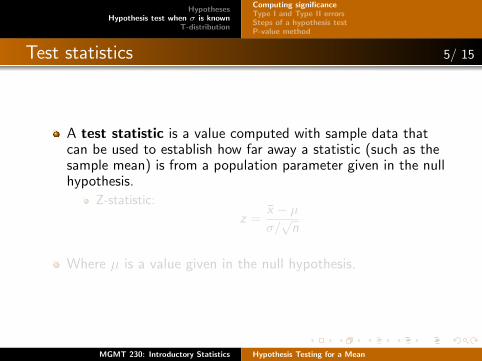
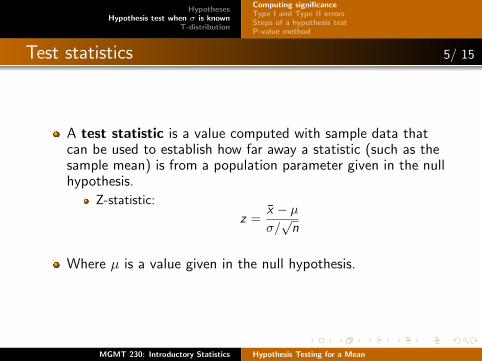
Test statistics 5/ 15
A test statistic is a value computed with sample data thatcan be used to establish how far away a statistic (such as thesample mean) is from a population parameter given in the nullhypothesis.
Z-statistic:
z =x̄ − µσ/√
n
Where µ is a value given in the null hypothesis.
MGMT 230: Introductory Statistics Hypothesis Testing for a Mean

HypothesesHypothesis test when σ is known
T-distribution
Computing significanceType I and Type II errorsSteps of a hypothesis testP-value method
Test statistics 5/ 15
A test statistic is a value computed with sample data thatcan be used to establish how far away a statistic (such as thesample mean) is from a population parameter given in the nullhypothesis.
Z-statistic:
z =x̄ − µσ/√
n
Where µ is a value given in the null hypothesis.
MGMT 230: Introductory Statistics Hypothesis Testing for a Mean
HypothesesHypothesis test when σ is known
T-distribution
Computing significanceType I and Type II errorsSteps of a hypothesis testP-value method
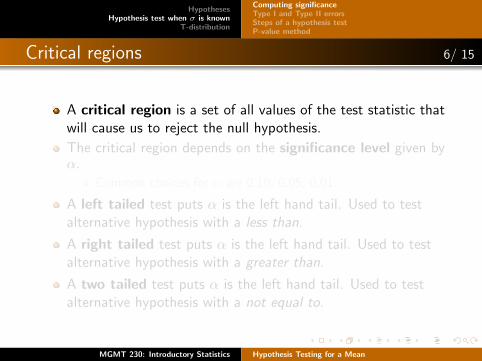
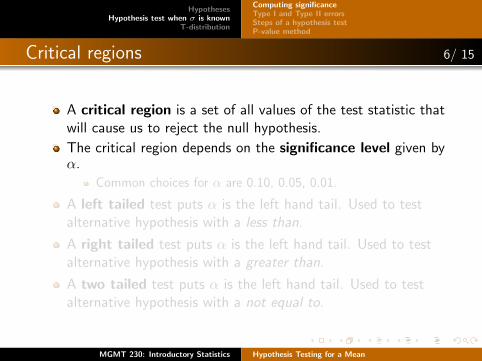
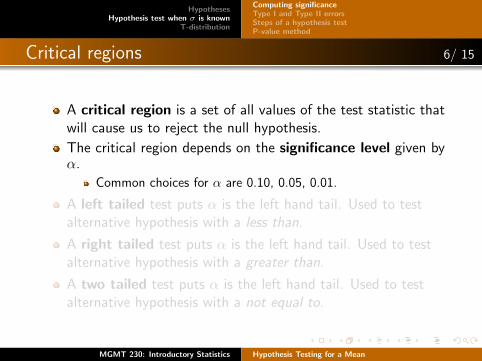
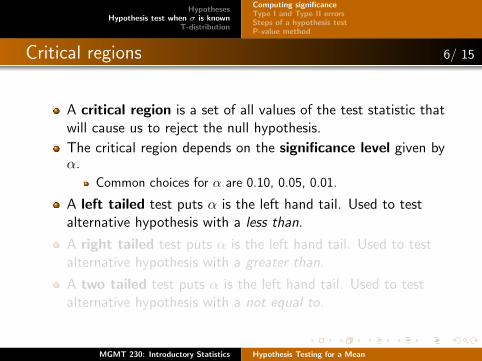
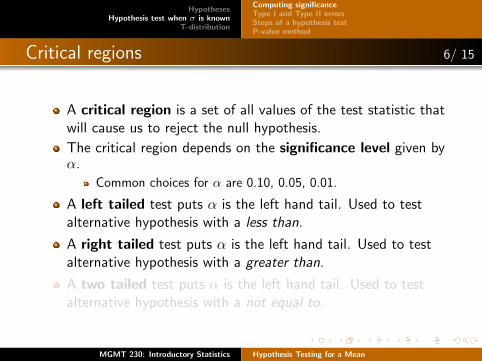
Critical regions 6/ 15
A critical region is a set of all values of the test statistic thatwill cause us to reject the null hypothesis.
The critical region depends on the significance level given byα.
Common choices for α are 0.10, 0.05, 0.01.
A left tailed test puts α is the left hand tail. Used to testalternative hypothesis with a less than.
A right tailed test puts α is the left hand tail. Used to testalternative hypothesis with a greater than.
A two tailed test puts α is the left hand tail. Used to testalternative hypothesis with a not equal to.
MGMT 230: Introductory Statistics Hypothesis Testing for a Mean
HypothesesHypothesis test when σ is known
T-distribution
Computing significanceType I and Type II errorsSteps of a hypothesis testP-value method
Type I and Type II errors 7/ 15
Type I error: mistake of rejecting the null hypothesis when itis actually true. The value α is the probability of a type I error.
Type II error: The mistake of failing to reject the nullhypothesis when it is actually false.
The probability of a type II error is usually given by β.
The power of a test is the probability of not making a type IIerror, given by 1− β.
Power and type II probabilities are kind of complicated tocompute.
MGMT 230: Introductory Statistics Hypothesis Testing for a Mean
HypothesesHypothesis test when σ is known
T-distribution
Computing significanceType I and Type II errorsSteps of a hypothesis testP-value method
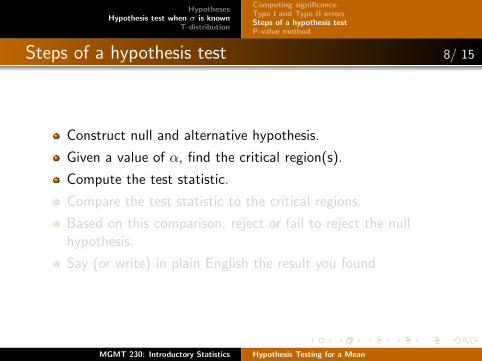
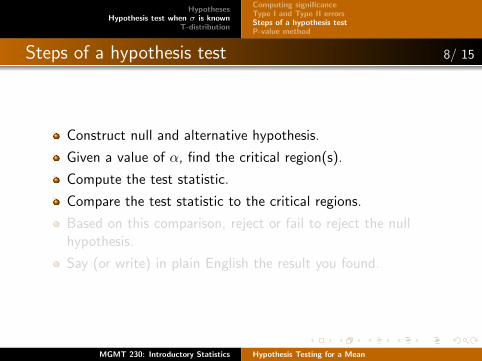
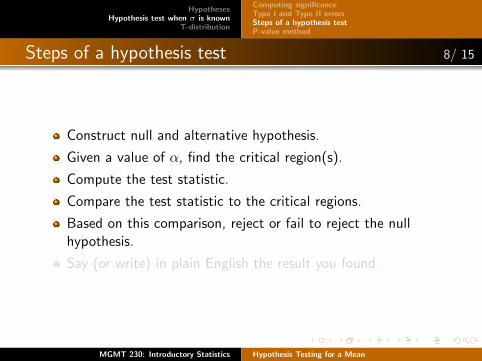
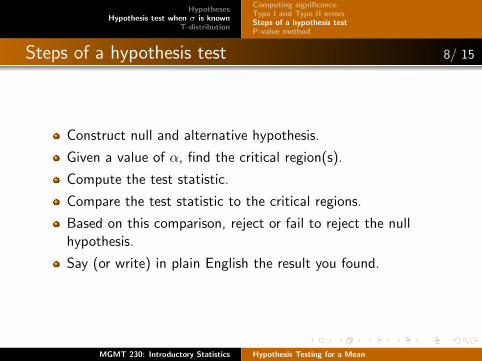
Steps of a hypothesis test 8/ 15
Construct null and alternative hypothesis.
Given a value of α, find the critical region(s).
Compute the test statistic.
Compare the test statistic to the critical regions.
Based on this comparison, reject or fail to reject the nullhypothesis.
Say (or write) in plain English the result you found.
MGMT 230: Introductory Statistics Hypothesis Testing for a Mean
HypothesesHypothesis test when σ is known
T-distribution
Computing significanceType I and Type II errorsSteps of a hypothesis testP-value method
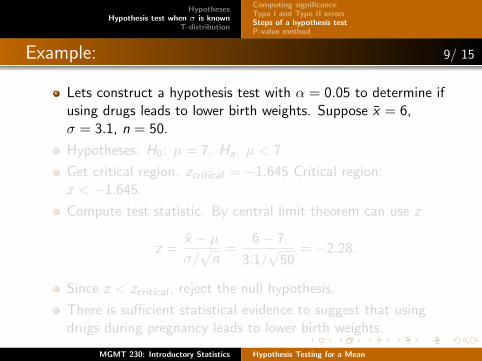
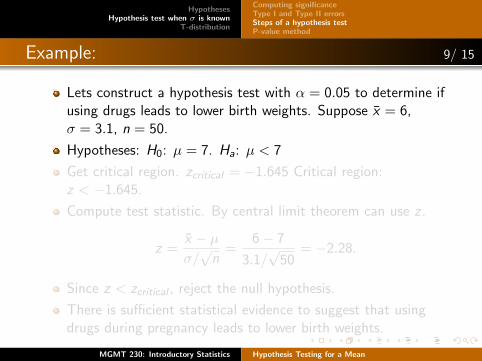
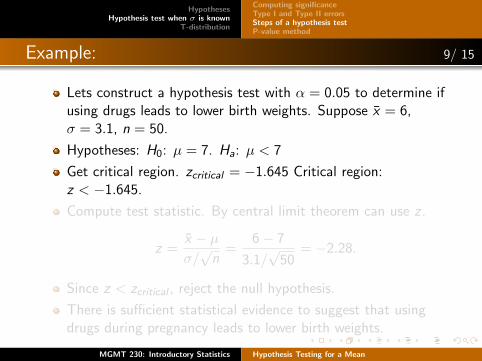
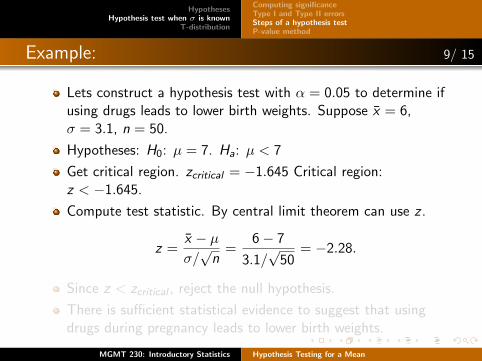
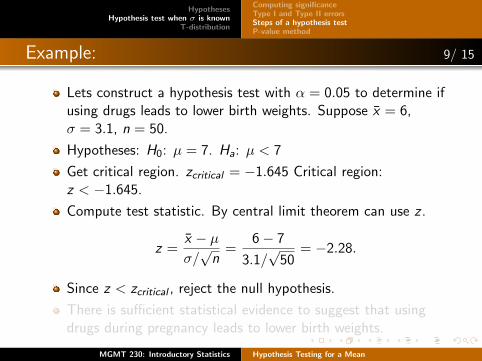
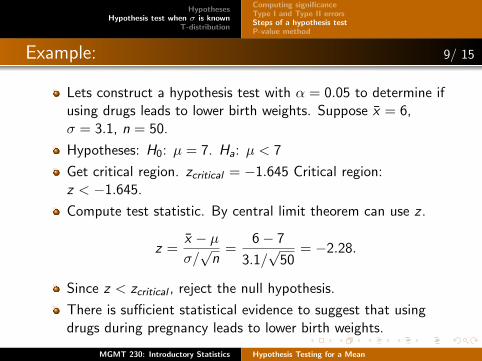
Example: 9/ 15
Lets construct a hypothesis test with α = 0.05 to determine ifusing drugs leads to lower birth weights. Suppose x̄ = 6,σ = 3.1, n = 50.
Hypotheses: H0: µ = 7. Ha: µ < 7
Get critical region. zcritical = −1.645 Critical region:z < −1.645.
Compute test statistic. By central limit theorem can use z .
z =x̄ − µσ/√
n=
6− 7
3.1/√
50= −2.28.
Since z < zcritical , reject the null hypothesis.
There is sufficient statistical evidence to suggest that usingdrugs during pregnancy leads to lower birth weights.
MGMT 230: Introductory Statistics Hypothesis Testing for a Mean
HypothesesHypothesis test when σ is known
T-distribution
Computing significanceType I and Type II errorsSteps of a hypothesis testP-value method
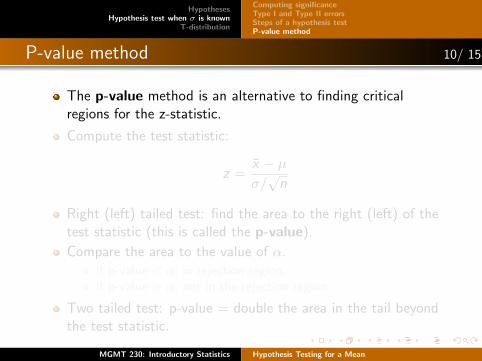
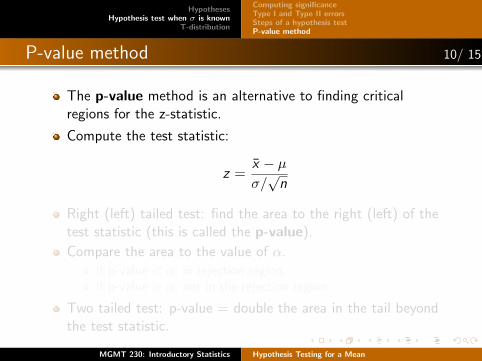
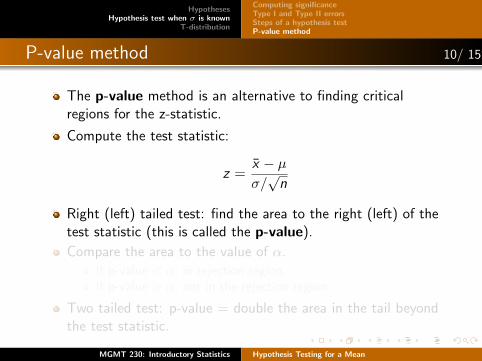
P-value method 10/ 15
The p-value method is an alternative to finding criticalregions for the z-statistic.
Compute the test statistic:
z =x̄ − µσ/√
n
Right (left) tailed test: find the area to the right (left) of thetest statistic (this is called the p-value).
Compare the area to the value of α.
If p-value < α, in rejection region.If p-value > α, not in the rejection region.
Two tailed test: p-value = double the area in the tail beyondthe test statistic.
MGMT 230: Introductory Statistics Hypothesis Testing for a Mean
HypothesesHypothesis test when σ is known
T-distribution
Computing significanceType I and Type II errorsSteps of a hypothesis testP-value method
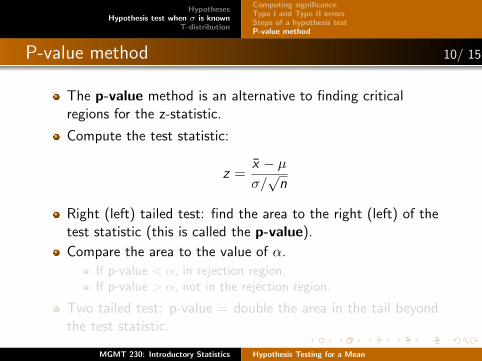
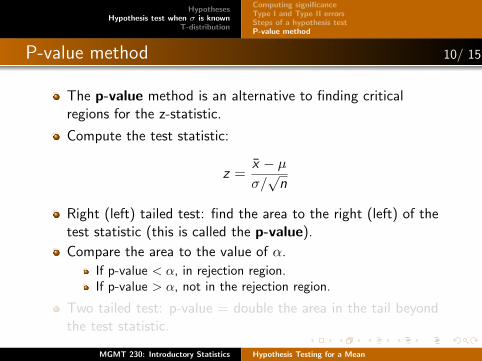
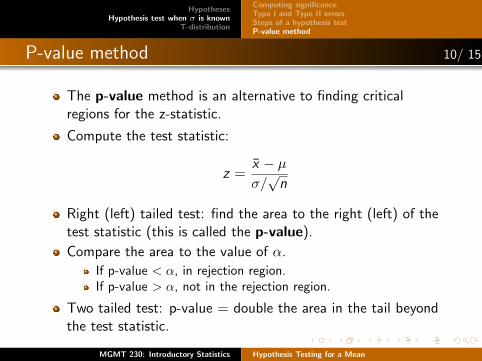
P-value method 10/ 15
The p-value method is an alternative to finding criticalregions for the z-statistic.
Compute the test statistic:
z =x̄ − µσ/√
n
Right (left) tailed test: find the area to the right (left) of thetest statistic (this is called the p-value).
Compare the area to the value of α.
If p-value < α, in rejection region.If p-value > α, not in the rejection region.
Two tailed test: p-value = double the area in the tail beyondthe test statistic.
MGMT 230: Introductory Statistics Hypothesis Testing for a Mean

HypothesesHypothesis test when σ is known
T-distribution
AssumptionsT-distributionWilliam Sealy Gosset
When σ is unknown. 11/ 15
Assume we have a sample size n > 30 or..
Assume the population has a normal distribution.
The population standard deviation, σ is not known. Our bestestimate is the sample standard deviation, s.
MGMT 230: Introductory Statistics Hypothesis Testing for a Mean
HypothesesHypothesis test when σ is known
T-distribution
AssumptionsT-distributionWilliam Sealy Gosset
More uncertainty 12/ 15
Since we need to estimate σ with s, this adds moreuncertainty.
More uncertainty means we need to widen the confidenceinterval.
Introduce a new critical statistic, the T-statistic (instead ofusing Z ).
The degree of uncertainty depends on the sample size.
MGMT 230: Introductory Statistics Hypothesis Testing for a Mean
HypothesesHypothesis test when σ is known
T-distribution
AssumptionsT-distributionWilliam Sealy Gosset
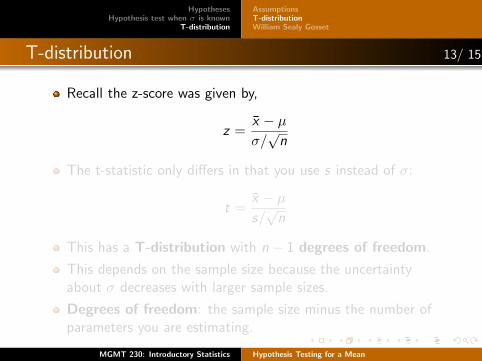
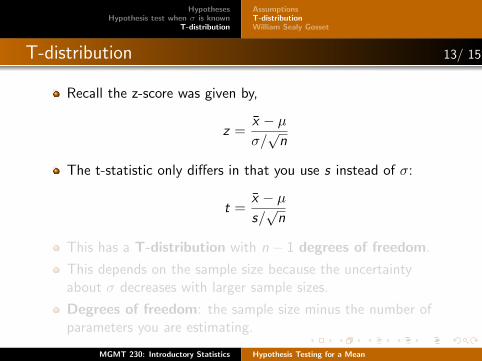
T-distribution 13/ 15
Recall the z-score was given by,
z =x̄ − µσ/√
n
The t-statistic only differs in that you use s instead of σ:
t =x̄ − µs/√
n
This has a T-distribution with n − 1 degrees of freedom.
This depends on the sample size because the uncertaintyabout σ decreases with larger sample sizes.
Degrees of freedom: the sample size minus the number ofparameters you are estimating.
MGMT 230: Introductory Statistics Hypothesis Testing for a Mean
HypothesesHypothesis test when σ is known
T-distribution
AssumptionsT-distributionWilliam Sealy Gosset
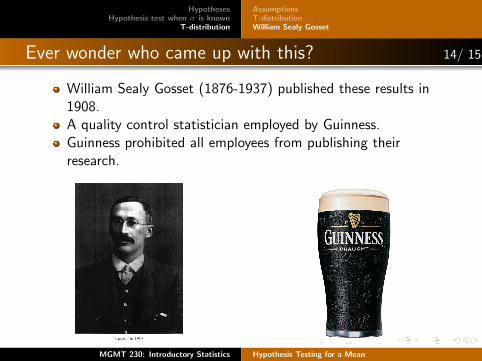
Ever wonder who came up with this? 14/ 15
William Sealy Gosset (1876-1937) published these results in1908.A quality control statistician employed by Guinness.Guinness prohibited all employees from publishing theirresearch.
MGMT 230: Introductory Statistics Hypothesis Testing for a Mean
HypothesesHypothesis test when σ is known
T-distributionHomework
Homework 15/ 15
Hypothesis testing when σ is known: Section 9.3, page 346,problems 9.44 through 9.47.
Hypothesis testing when σ is unknown: Section 9.4, page 351,problems 9.48 through 9.57.
MGMT 230: Introductory Statistics Hypothesis Testing for a Mean