
Hypersil GOLD 1.9 μm HPLC Columns Technical …...The 1.9 µm Hypersil GOLD columns build on the...
16
Optimizing Performance – Making Your Assay More Productive – Faster Analyses – Improved Resolution – Enhanced Sensitivity – Increased Peak Capacity – Easier Method Development Hypersil GOLD ™ 1.9 μm HPLC Columns Technical Guide Part of Thermo Fisher Scientific chromatography
Transcript of Hypersil GOLD 1.9 μm HPLC Columns Technical …...The 1.9 µm Hypersil GOLD columns build on the...
Optimizing Performance – Making Your Assay More Productive– Faster Analyses
– Improved Resolution
– Enhanced Sensitivity
– Increased Peak Capacity
– Easier Method Development
Hypersil GOLD™
1.9 μm HPLC ColumnsTechnical Guide
Part of Thermo Fisher Scientific
c h r o m a t o g r a p h y
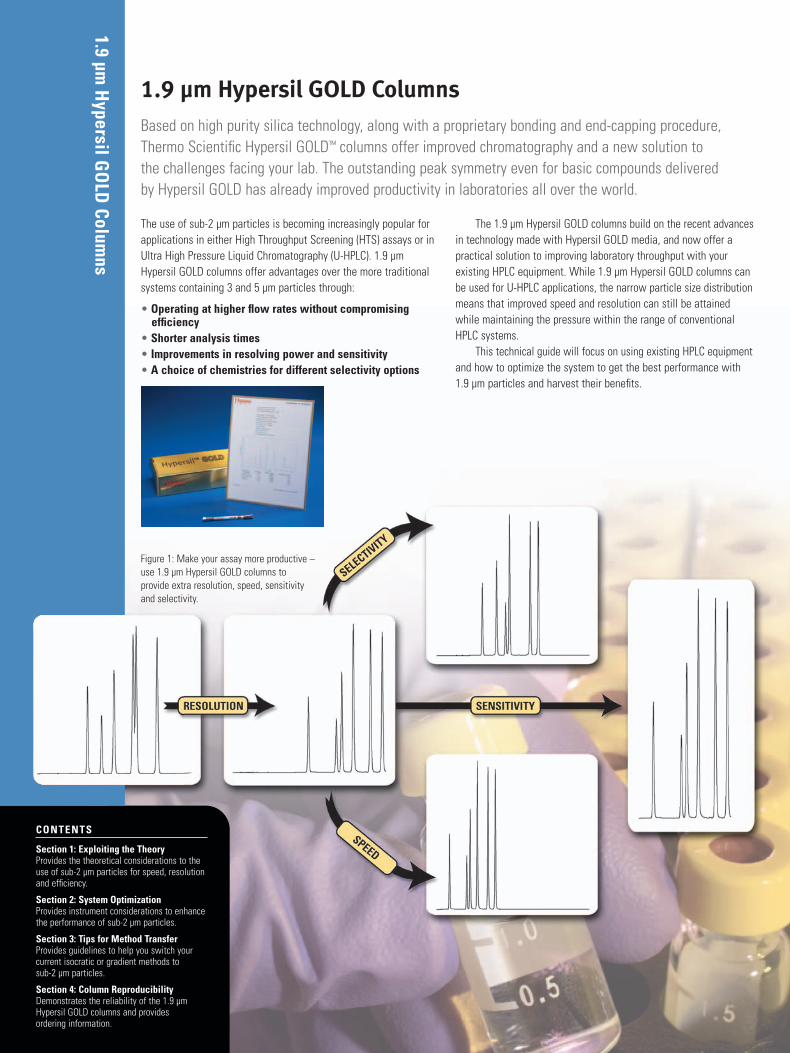
Figure 1: Make your assay more productive –use 1.9 µm Hypersil GOLD columns to provide extra resolution, speed, sensitivityand selectivity.
1.9 µm H
ypersil GO
LD Colum
ns
1.9 μm Hypersil GOLD ColumnsBased on high purity silica technology, along with a proprietary bonding and end-capping procedure,Thermo Scientific Hypersil GOLD™ columns offer improved chromatography and a new solution tothe challenges facing your lab. The outstanding peak symmetry even for basic compounds deliveredby Hypersil GOLD has already improved productivity in laboratories all over the world.
The use of sub-2 µm particles is becoming increasingly popular forapplications in either High Throughput Screening (HTS) assays or inUltra High Pressure Liquid Chromatography (U-HPLC). 1.9 µmHypersil GOLD columns offer advantages over the more traditionalsystems containing 3 and 5 µm particles through:
• Operating at higher flow rates without compromising efficiency
• Shorter analysis times• Improvements in resolving power and sensitivity• A choice of chemistries for different selectivity options
The 1.9 µm Hypersil GOLD columns build on the recent advancesin technology made with Hypersil GOLD media, and now offer apractical solution to improving laboratory throughput with yourexisting HPLC equipment. While 1.9 µm Hypersil GOLD columns canbe used for U-HPLC applications, the narrow particle size distributionmeans that improved speed and resolution can still be attainedwhile maintaining the pressure within the range of conventionalHPLC systems.
This technical guide will focus on using existing HPLC equipmentand how to optimize the system to get the best performance with1.9 µm particles and harvest their benefits.
CONTENTS
Section 1: Exploiting the TheoryProvides the theoretical considerations to the use of sub-2 µm particles for speed, resolution and efficiency.
Section 2: System OptimizationProvides instrument considerations to enhance the performance of sub-2 µm particles.
Section 3: Tips for Method TransferProvides guidelines to help you switch yourcurrent isocratic or gradient methods to sub-2 µm particles.
Section 4: Column ReproducibilityDemonstrates the reliability of the 1.9 µm Hypersil GOLD columns and provides ordering information.
The separating power of a chromatographic column can be describedby the height equivalent to a theoretical plate (H), which varies withthe linear velocity (u) of the mobile phase as it passes through thecolumn, the particle size (dp), the diffusion coefficient in the mobilephase (Dm) and is given by Equation 1:
H = Adp + BDm/u + C(dp2 /Dm)u (1)
where A, B, and C are constants relating to particle morphology,particle size and column packing.
The lower the plate height, the higher the separating power ofthe column, and there is an optimum linear velocity for which H is a minimum and the plate number, or efficiency, N, is a maximum.The plate height is related to the efficiency by Equation 2:
H = L/N (2)
where L is the column length.
These equations also show that the efficiency is inversely proportional to the square of particle size.
N α 1/dp2 (3)
In short, the efficiency increases as particle size decreases.
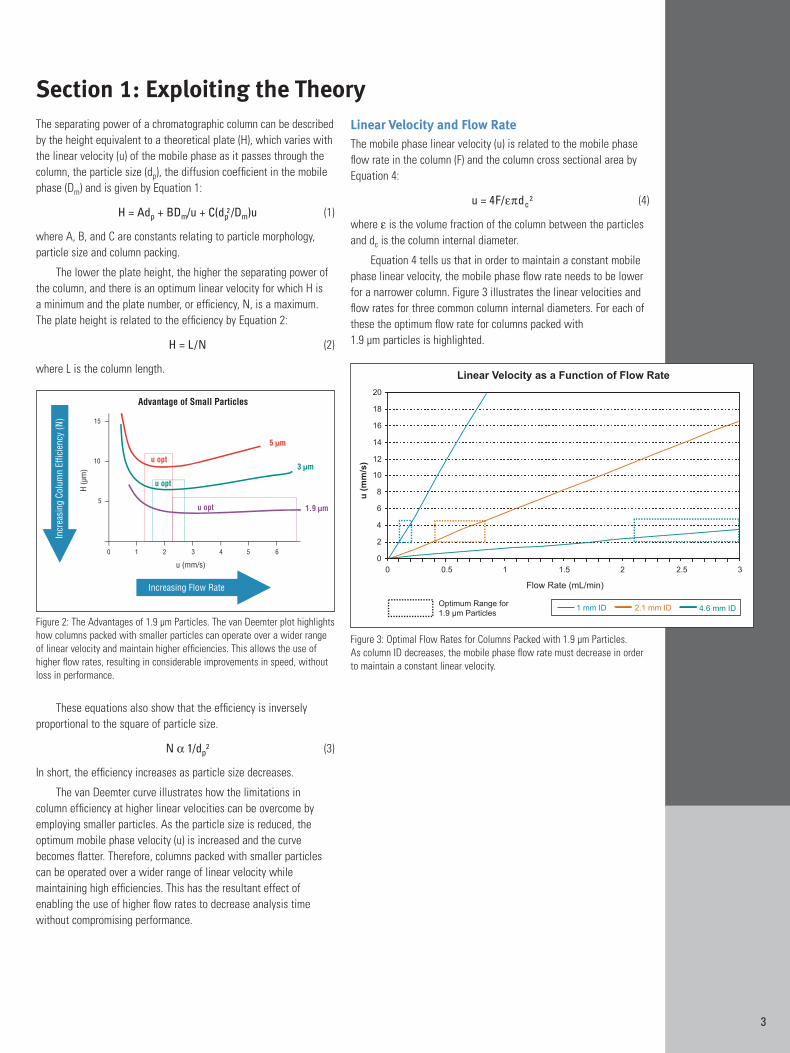
The van Deemter curve illustrates how the limitations in column efficiency at higher linear velocities can be overcome byemploying smaller particles. As the particle size is reduced, the optimum mobile phase velocity (u) is increased and the curvebecomes flatter. Therefore, columns packed with smaller particlescan be operated over a wider range of linear velocity while maintaining high efficiencies. This has the resultant effect ofenabling the use of higher flow rates to decrease analysis timewithout compromising performance.
Linear Velocity and Flow RateThe mobile phase linear velocity (u) is related to the mobile phaseflow rate in the column (F) and the column cross sectional area byEquation 4:
u = 4F/επdc2 (4)
where ε is the volume fraction of the column between the particlesand dc is the column internal diameter.
Equation 4 tells us that in order to maintain a constant mobilephase linear velocity, the mobile phase flow rate needs to be lowerfor a narrower column. Figure 3 illustrates the linear velocities andflow rates for three common column internal diameters. For each ofthese the optimum flow rate for columns packed with 1.9 µm particles is highlighted.
Section 1: Exploiting the Theory
Figure 2: The Advantages of 1.9 µm Particles. The van Deemter plot highlightshow columns packed with smaller particles can operate over a wider rangeof linear velocity and maintain higher efficiencies. This allows the use ofhigher flow rates, resulting in considerable improvements in speed, withoutloss in performance.
Figure 3: Optimal Flow Rates for Columns Packed with 1.9 µm Particles. As column ID decreases, the mobile phase flow rate must decrease in order to maintain a constant linear velocity.
3
ResolutionThe aim of a chromatographic separation is to maximize resolutionwhile minimizing analysis time. Resolution (Rs) is proportional to thesquare root of separation efficiency (N), as described by Equation 5(which expresses resolution as a function of capacity factor (k),selectivity (α), and efficiency (N)). Efficiency is in turn inversely propor-tional to the square diameter of particle size (dp), as discussed above.
(5)
Resolution and analysis time are determined by the ratio of column length to particle size. When particle size is reduced, columnlength can also be reduced while keeping separation efficiency constant (and therefore Rs if all other experimental conditionsremain unchanged). Figure 4 illustrates this concept. For example, if13,500 plates (green line on graph) are needed to obtain the required
resolution, a 150 mm column packed with 5 µm particles would berequired. However, if the particle size is reduced to 1.9 µm then only50 mm of column is needed to obtain the same 13,500 plates. For aconstant flow rate, analysis time would be reduced approximately 3-fold with this change in particle size and column length.
SelectivityEquation 5 also points out another very effective way to increasethe resolution of two chromatographic bands – increasing the selectivity factor (α) by manipulating column chemistry or mobilephase composition. We offer 1.9 µm Hypersil GOLD columns in three chemistries. • Hypersil GOLD gives outstanding peak shapes using generic
gradients with C18 selectivity.
• Hypersil GOLD aQ is a C18 polar endcapped stationary phasewhich can be used for challenging reverse phase separationsemploying highly aqueous mobile phases.
• Hypersil GOLD PFP is a perfluorinated phenyl stationary phasewhich can offer alternative selectivity in reverse phase applications.
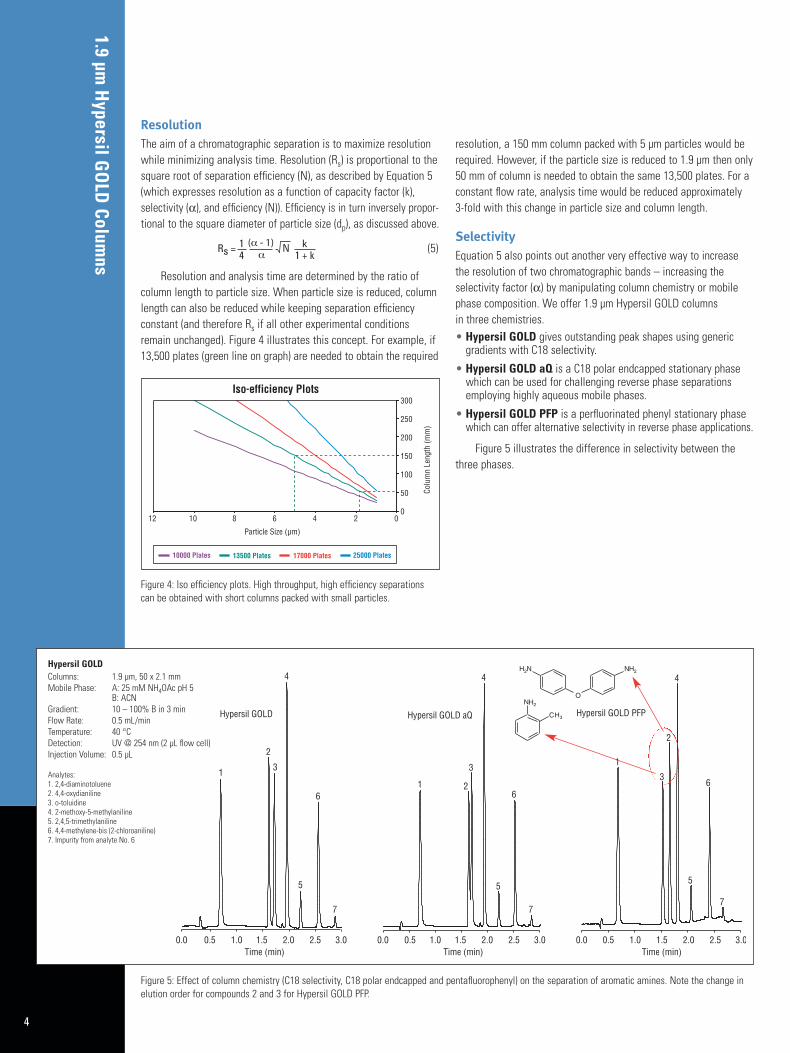
Figure 5 illustrates the difference in selectivity between thethree phases.
1.9 µm H
ypersil GO
LD Colum
ns
Figure 5: Effect of column chemistry (C18 selectivity, C18 polar endcapped and pentafluorophenyl) on the separation of aromatic amines. Note the change in elution order for compounds 2 and 3 for Hypersil GOLD PFP.
Hypersil GOLDColumns: 1.9 µm, 50 x 2.1 mmMobile Phase: A: 25 mM NH4OAc pH 5
B: ACNGradient: 10 – 100% B in 3 minFlow Rate: 0.5 mL/minTemperature: 40 °CDetection: UV @ 254 nm (2 µL flow cell)Injection Volume: 0.5 µL
Analytes: 1. 2,4-diaminotoluene2. 4,4-oxydianiline3. o-toluidine4. 2-methoxy-5-methylaniline5. 2,4,5-trimethylaniline6. 4,4-methylene-bis (2-chloroaniline)7. Impurity from analyte No. 6
Figure 4: Iso efficiency plots. High throughput, high efficiency separationscan be obtained with short columns packed with small particles.
4
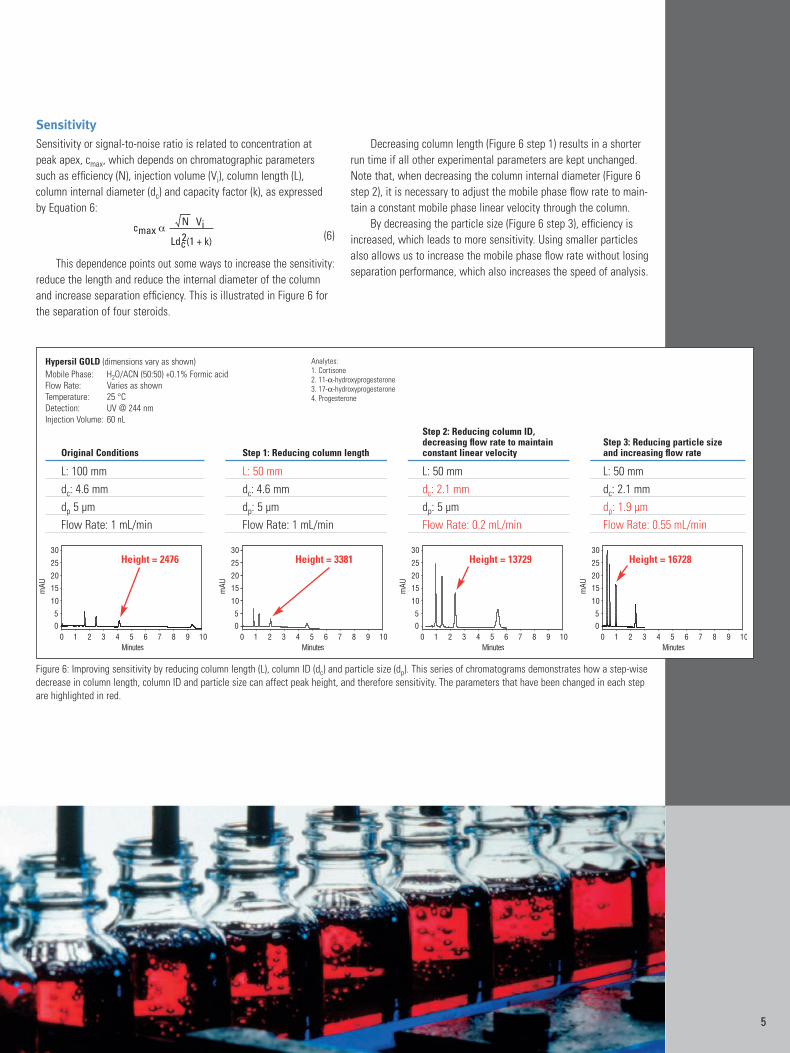
SensitivitySensitivity or signal-to-noise ratio is related to concentration atpeak apex, cmax, which depends on chromatographic parameterssuch as efficiency (N), injection volume (Vi), column length (L), column internal diameter (dc) and capacity factor (k), as expressedby Equation 6:
(6)
This dependence points out some ways to increase the sensitivity:reduce the length and reduce the internal diameter of the columnand increase separation efficiency. This is illustrated in Figure 6 forthe separation of four steroids.
Decreasing column length (Figure 6 step 1) results in a shorterrun time if all other experimental parameters are kept unchanged.Note that, when decreasing the column internal diameter (Figure 6step 2), it is necessary to adjust the mobile phase flow rate to main-tain a constant mobile phase linear velocity through the column.
By decreasing the particle size (Figure 6 step 3), efficiency isincreased, which leads to more sensitivity. Using smaller particlesalso allows us to increase the mobile phase flow rate without losingseparation performance, which also increases the speed of analysis.
Step 2: Reducing column ID, decreasing flow rate to maintain Step 3: Reducing particle size
Original Conditions Step 1: Reducing column length constant linear velocity and increasing flow rate
L: 100 mm L: 50 mm L: 50 mm L: 50 mmdc: 4.6 mm dc: 4.6 mm dc: 2.1 mm dc: 2.1 mmdp 5 µm dp: 5 µm dp: 5 µm dp: 1.9 µmFlow Rate: 1 mL/min Flow Rate: 1 mL/min Flow Rate: 0.2 mL/min Flow Rate: 0.55 mL/min
Figure 6: Improving sensitivity by reducing column length (L), column ID (dc) and particle size (dp). This series of chromatograms demonstrates how a step-wisedecrease in column length, column ID and particle size can affect peak height, and therefore sensitivity. The parameters that have been changed in each stepare highlighted in red.
Height = 2476 Height = 3381 Height = 13729 Height = 16728
Hypersil GOLD (dimensions vary as shown)Mobile Phase: H2O/ACN (50:50) +0.1% Formic acidFlow Rate: Varies as shownTemperature: 25 °CDetection: UV @ 244 nm Injection Volume: 60 nL
Analytes:1. Cortisone2. 11-α-hydroxyprogesterone3. 17-α-hydroxyprogesterone4. Progesterone
5
1.9 µm H
ypersil GO
LD Colum
ns
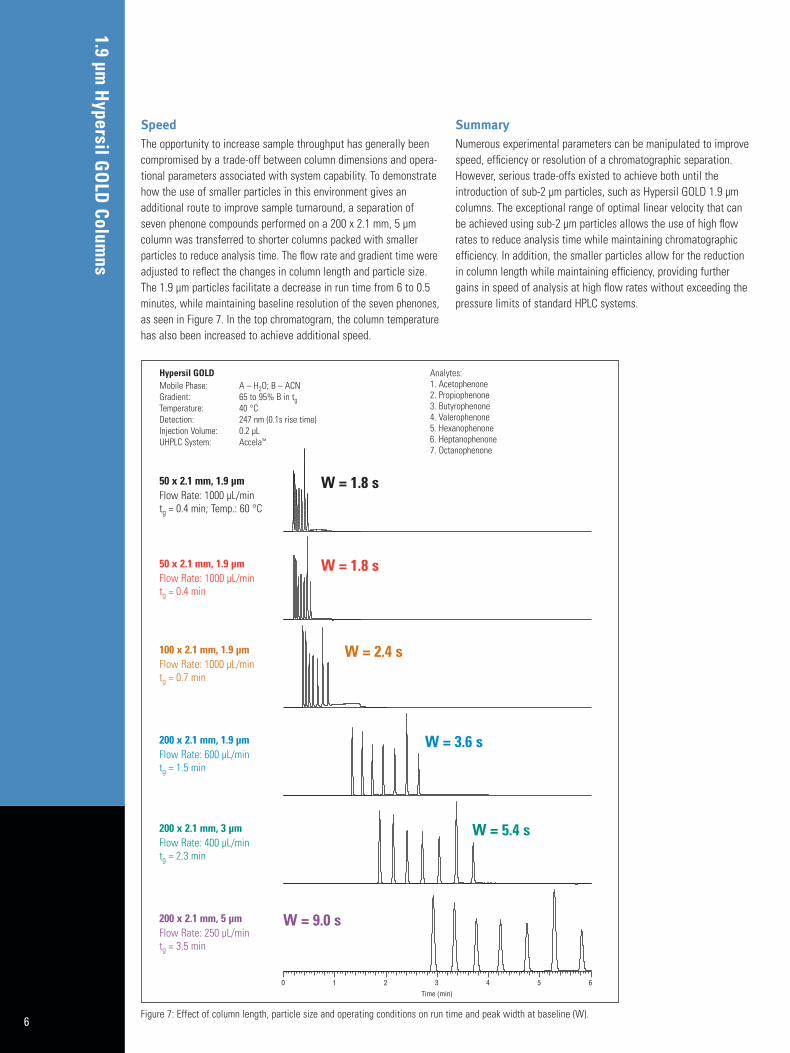
SpeedThe opportunity to increase sample throughput has generally beencompromised by a trade-off between column dimensions and opera-tional parameters associated with system capability. To demonstratehow the use of smaller particles in this environment gives an additional route to improve sample turnaround, a separation ofseven phenone compounds performed on a 200 x 2.1 mm, 5 µm column was transferred to shorter columns packed with smaller particles to reduce analysis time. The flow rate and gradient time wereadjusted to reflect the changes in column length and particle size.The 1.9 µm particles facilitate a decrease in run time from 6 to 0.5minutes, while maintaining baseline resolution of the seven phenones,as seen in Figure 7. In the top chromatogram, the column temperaturehas also been increased to achieve additional speed.
SummaryNumerous experimental parameters can be manipulated to improvespeed, efficiency or resolution of a chromatographic separation.However, serious trade-offs existed to achieve both until the introduction of sub-2 µm particles, such as Hypersil GOLD 1.9 µmcolumns. The exceptional range of optimal linear velocity that canbe achieved using sub-2 µm particles allows the use of high flowrates to reduce analysis time while maintaining chromatographicefficiency. In addition, the smaller particles allow for the reductionin column length while maintaining efficiency, providing furthergains in speed of analysis at high flow rates without exceeding thepressure limits of standard HPLC systems.
Figure 7: Effect of column length, particle size and operating conditions on run time and peak width at baseline (W).
Hypersil GOLD Mobile Phase: A – H2O; B – ACNGradient: 65 to 95% B in tgTemperature: 40 °CDetection: 247 nm (0.1s rise time)Injection Volume: 0.2 µLUHPLC System: Accela™
50 x 2.1 mm, 1.9 µm Flow Rate: 1000 µL/mintg = 0.4 min; Temp.: 60 °C
W = 1.8 s
W = 1.8 s
W = 2.4 s
W = 3.6 s
W = 5.4 s
W = 9.0 s
200 x 2.1 mm, 1.9 µm Flow Rate: 600 µL/mintg = 1.5 min
200 x 2.1 mm, 3 µm Flow Rate: 400 µL/mintg = 2.3 min
100 x 2.1 mm, 1.9 µm Flow Rate: 1000 µL/mintg = 0.7 min
200 x 2.1 mm, 5 µm Flow Rate: 250 µL/mintg = 3.5 min
50 x 2.1 mm, 1.9 µm Flow Rate: 1000 µL/mintg = 0.4 min
Analytes:1. Acetophenone2. Propiophenone3. Butyrophenone4. Valerophenone5. Hexanophenone6. Heptanophenone7. Octanophenone
6
We have seen that when using columns packed with 1.9 µm particles,analyses can be performed with a high linear velocity through thecolumn without loss in performance. To obtain the best data usingfast chromatography, however, it is critical that the LC instrumentsystem is optimized to operate under these conditions. All systemcomponents for the assay should be considered. System volume(connecting tubing ID and length, injection volume, flow cell volumein UV) must be minimized, detector time constant and sampling rateneed to be carefully selected, and when running fast gradientspump dwell volume needs to be minimal.
System DispersionBand broadening, which has a detrimental effect on the chromato-graphic performance, can occur in the column, in the autosampler, in the tubing connecting the column to injector and detector and inthe detector flow cell. These band broadening effects which occur in the fluid path of the HPLC instrument are volumetric effects; eachcontributes a variance (σ) to the width of the chromatographic bandand are additive:
σ 2total = σ 2
col + σ 2ext (7)
where the subscripts mean: col – inside column, ext – extra column.
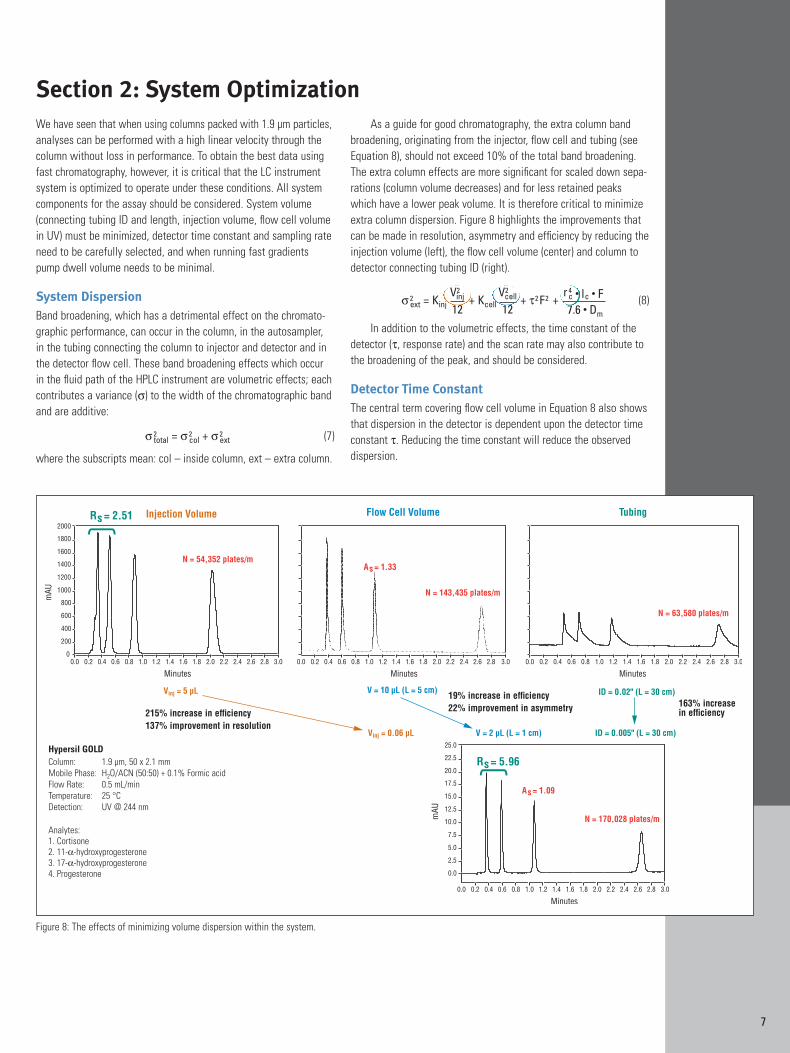
As a guide for good chromatography, the extra column bandbroadening, originating from the injector, flow cell and tubing (seeEquation 8), should not exceed 10% of the total band broadening.The extra column effects are more significant for scaled down sepa-rations (column volume decreases) and for less retained peakswhich have a lower peak volume. It is therefore critical to minimizeextra column dispersion. Figure 8 highlights the improvements thatcan be made in resolution, asymmetry and efficiency by reducing theinjection volume (left), the flow cell volume (center) and column todetector connecting tubing ID (right).
σ 2ext = Kinj 12
V2inj + Kcell 12
V2cell + τ2 F2 +
r 4c • lc • F7.6 • Dm
(8)
In addition to the volumetric effects, the time constant of thedetector (τ, response rate) and the scan rate may also contribute tothe broadening of the peak, and should be considered.
Detector Time ConstantThe central term covering flow cell volume in Equation 8 also showsthat dispersion in the detector is dependent upon the detector timeconstant τ. Reducing the time constant will reduce the observed dispersion.
Section 2: System Optimization
Figure 8: The effects of minimizing volume dispersion within the system.
215% increase in efficiency 137% improvement in resolution
19% increase in efficiency 22% improvement in asymmetry 163% increase
in efficiency
Hypersil GOLD Column: 1.9 µm, 50 x 2.1 mmMobile Phase: H2O/ACN (50:50) + 0.1% Formic acidFlow Rate: 0.5 mL/minTemperature: 25 °CDetection: UV @ 244 nm
Analytes:1. Cortisone2. 11-α-hydroxyprogesterone3. 17-α-hydroxyprogesterone4. Progesterone
7
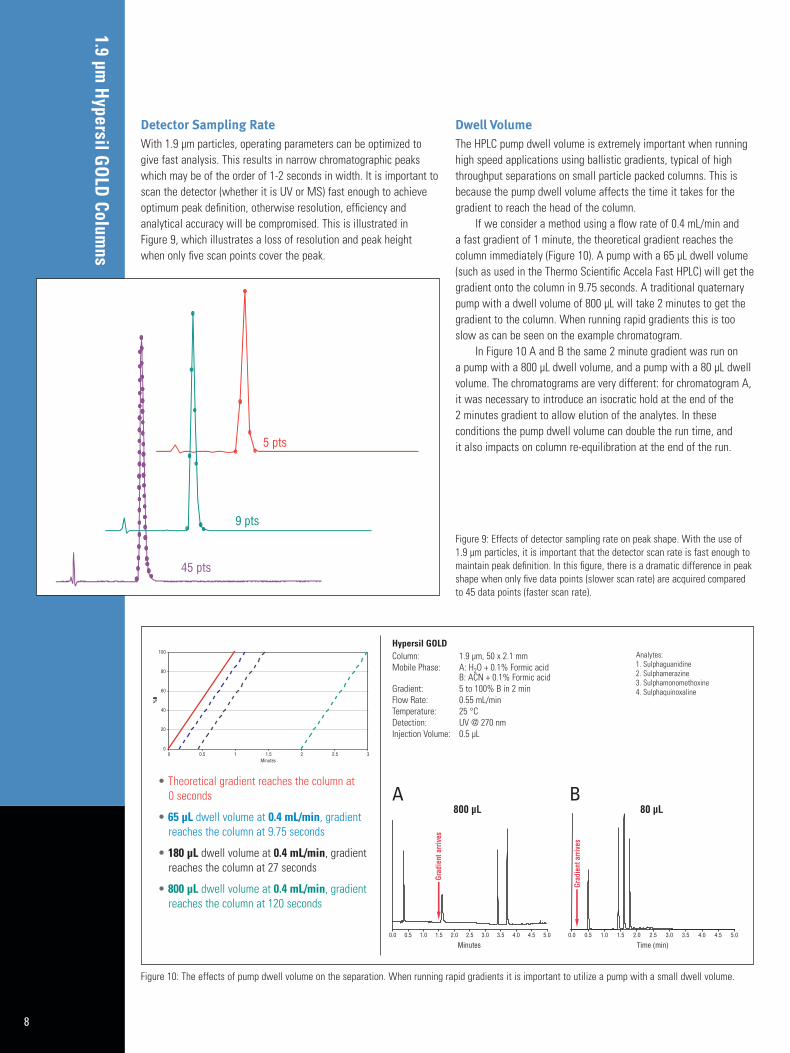
Detector Sampling RateWith 1.9 µm particles, operating parameters can be optimized togive fast analysis. This results in narrow chromatographic peakswhich may be of the order of 1-2 seconds in width. It is important toscan the detector (whether it is UV or MS) fast enough to achieveoptimum peak definition, otherwise resolution, efficiency and analytical accuracy will be compromised. This is illustrated in Figure 9, which illustrates a loss of resolution and peak height when only five scan points cover the peak.
Dwell VolumeThe HPLC pump dwell volume is extremely important when running high speed applications using ballistic gradients, typical of highthroughput separations on small particle packed columns. This isbecause the pump dwell volume affects the time it takes for thegradient to reach the head of the column.
If we consider a method using a flow rate of 0.4 mL/min and a fast gradient of 1 minute, the theoretical gradient reaches the column immediately (Figure 10). A pump with a 65 µL dwell volume(such as used in the Thermo Scientific Accela Fast HPLC) will get thegradient onto the column in 9.75 seconds. A traditional quaternarypump with a dwell volume of 800 µL will take 2 minutes to get thegradient to the column. When running rapid gradients this is tooslow as can be seen on the example chromatogram.
In Figure 10 A and B the same 2 minute gradient was run on a pump with a 800 µL dwell volume, and a pump with a 80 µL dwellvolume. The chromatograms are very different: for chromatogram A,it was necessary to introduce an isocratic hold at the end of the 2 minutes gradient to allow elution of the analytes. In these conditions the pump dwell volume can double the run time, and it also impacts on column re-equilibration at the end of the run.
Figure 10: The effects of pump dwell volume on the separation. When running rapid gradients it is important to utilize a pump with a small dwell volume.
Hypersil GOLDColumn: 1.9 µm, 50 x 2.1 mmMobile Phase: A: H2O + 0.1% Formic acid
B: ACN + 0.1% Formic acidGradient: 5 to 100% B in 2 minFlow Rate: 0.55 mL/minTemperature: 25 °CDetection: UV @ 270 nm Injection Volume: 0.5 µL
Figure 9: Effects of detector sampling rate on peak shape. With the use of1.9 µm particles, it is important that the detector scan rate is fast enough tomaintain peak definition. In this figure, there is a dramatic difference in peakshape when only five data points (slower scan rate) are acquired comparedto 45 data points (faster scan rate).
• Theoretical gradient reaches the column at 0 seconds
• 65 µL dwell volume at 0.4 mL/min, gradientreaches the column at 9.75 seconds
• 180 µL dwell volume at 0.4 mL/min, gradientreaches the column at 27 seconds
• 800 µL dwell volume at 0.4 mL/min, gradientreaches the column at 120 seconds
Analytes:1. Sulphaguanidine2. Sulphamerazine3. Sulphamonomethoxine4. Sulphaquinoxaline
A B
1.9 µm Hypersil GOLD Colum
ns
8

System PressureIn order to tune your assay to your HPLC system, remember that asthe particle size is reduced, resistance to flow increases, causingpressure drop to increase within the system. This is approximatedby the Equation 9 below:
Pressure Drop (psi) ~ 250 L η F / dp2 dc
2 (9)
where L = Column Length (mm)η = Mobile Phase Viscosity (cP)F = Flow Rate (mL/min)dp = Particle Diameter (µm)dc = Column Internal Diameter (mm)
This equation shows that the pressure drop across the columnvaries with:• The length of the column. Longer columns have higher
pressure drops.• The ID of the column. Narrower columns have higher
pressure drops.• The diameter of the particles packed within the column.
The smaller the particles the higher the pressure drop. This is asquared relationship and has a significant effect.
• The flow rate. A higher flow rate will result in a higher pressure drop.
• The viscosity of the mobile phase. Higher viscosities willresult in higher pressure drops. Increased temperatures reducethe viscosity, enabling a higher flow rate to be used for an equivalent pressure drop.
For the fastest results from small particle columns, you mustensure that your system can function reliably at higher operatingpressure. Figure 11 shows that the flow rates for optimum efficiency(taken from the van Deemter plot) can lie within the limits of conventional HPLC systems, even for 1.9 µm particles.
Figure 11: System pressure considerations with 1.9 µm particles. The shadedareas indicate typical system pressures at the optimum flow rates, measuredon a 20 mm length column.
9
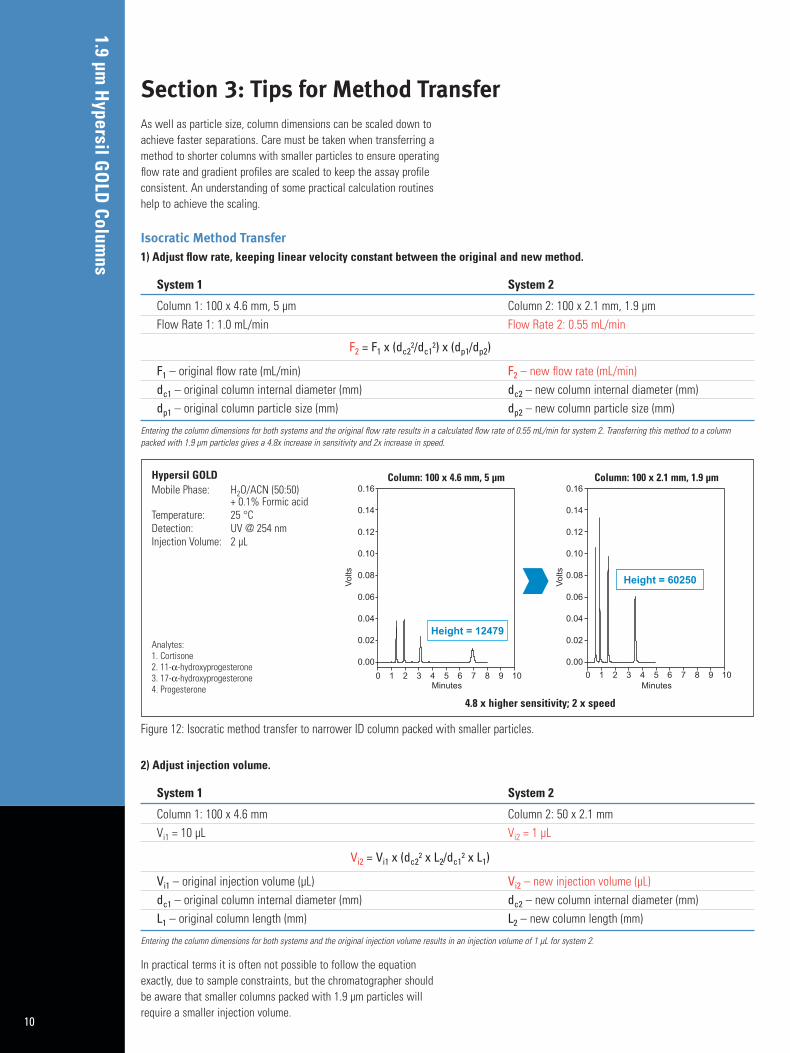
As well as particle size, column dimensions can be scaled down toachieve faster separations. Care must be taken when transferring amethod to shorter columns with smaller particles to ensure operatingflow rate and gradient profiles are scaled to keep the assay profileconsistent. An understanding of some practical calculation routineshelp to achieve the scaling.
Section 3: Tips for Method Transfer
Hypersil GOLD Mobile Phase: H2O/ACN (50:50)
+ 0.1% Formic acidTemperature: 25 °CDetection: UV @ 254 nm Injection Volume: 2 µL
Analytes:1. Cortisone2. 11-α-hydroxyprogesterone3. 17-α-hydroxyprogesterone4. Progesterone
4.8 x higher sensitivity; 2 x speed
Isocratic Method Transfer1) Adjust flow rate, keeping linear velocity constant between the original and new method.
System 1 System 2
Column 1: 100 x 4.6 mm, 5 µm Column 2: 100 x 2.1 mm, 1.9 µmFlow Rate 1: 1.0 mL/min Flow Rate 2: 0.55 mL/min
F2 = F1 x (dc22/dc1
2) x (dp1/dp2)
F1 – original flow rate (mL/min) F2 – new flow rate (mL/min)dc1 – original column internal diameter (mm) dc2 – new column internal diameter (mm)dp1 – original column particle size (mm) dp2 – new column particle size (mm)
Entering the column dimensions for both systems and the original flow rate results in a calculated flow rate of 0.55 mL/min for system 2. Transferring this method to a columnpacked with 1.9 µm particles gives a 4.8x increase in sensitivity and 2x increase in speed.
Figure 12: Isocratic method transfer to narrower ID column packed with smaller particles.
2) Adjust injection volume.
System 1 System 2
Column 1: 100 x 4.6 mm Column 2: 50 x 2.1 mmVi1 = 10 µL Vi2 = 1 µL
Vi2 = Vi1 x (dc22 x L2/dc1
2 x L1)
Vi1 – original injection volume (µL) Vi2 – new injection volume (µL)dc1 – original column internal diameter (mm) dc2 – new column internal diameter (mm)L1 – original column length (mm) L2 – new column length (mm)
Entering the column dimensions for both systems and the original injection volume results in an injection volume of 1 µL for system 2.
In practical terms it is often not possible to follow the equationexactly, due to sample constraints, but the chromatographer shouldbe aware that smaller columns packed with 1.9 µm particles willrequire a smaller injection volume.
1.9 µm H
ypersil GO
LD Colum
ns
Column: 100 x 4.6 mm, 5 µm Column: 100 x 2.1 mm, 1.9 µm
10
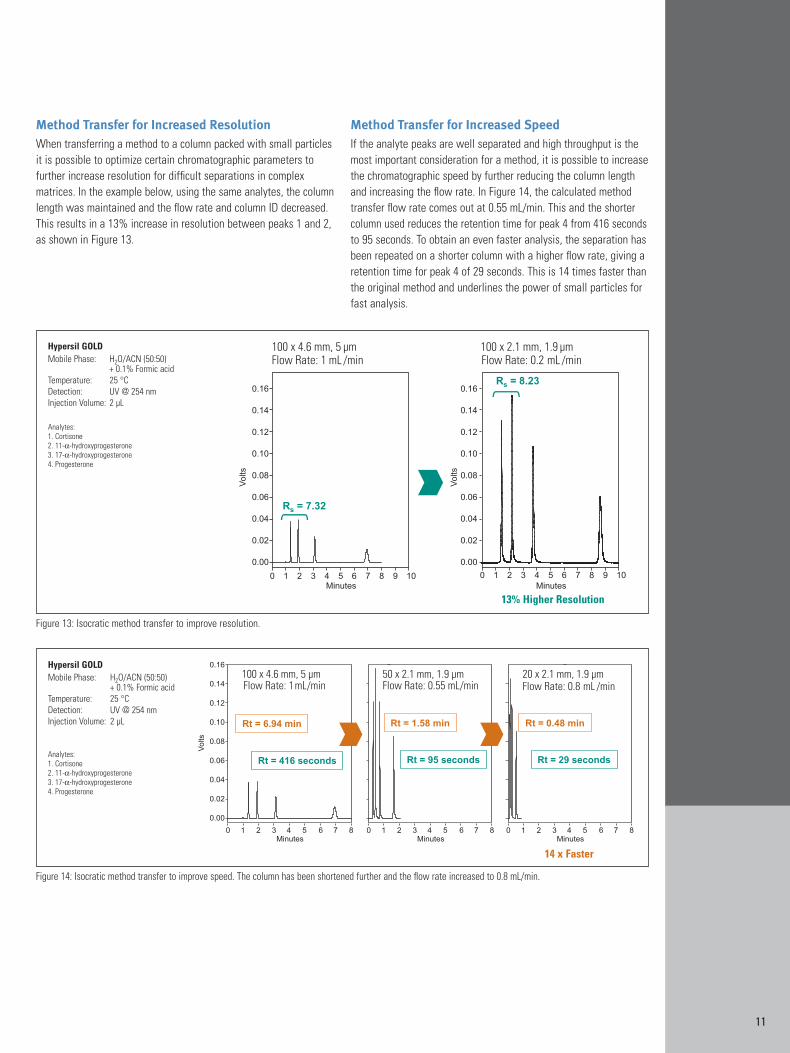
Method Transfer for Increased ResolutionWhen transferring a method to a column packed with small particlesit is possible to optimize certain chromatographic parameters to further increase resolution for difficult separations in complex matrices. In the example below, using the same analytes, the columnlength was maintained and the flow rate and column ID decreased.This results in a 13% increase in resolution between peaks 1 and 2,as shown in Figure 13.
Method Transfer for Increased SpeedIf the analyte peaks are well separated and high throughput is themost important consideration for a method, it is possible to increasethe chromatographic speed by further reducing the column lengthand increasing the flow rate. In Figure 14, the calculated methodtransfer flow rate comes out at 0.55 mL/min. This and the shortercolumn used reduces the retention time for peak 4 from 416 secondsto 95 seconds. To obtain an even faster analysis, the separation hasbeen repeated on a shorter column with a higher flow rate, giving aretention time for peak 4 of 29 seconds. This is 14 times faster thanthe original method and underlines the power of small particles forfast analysis.
Figure 14: Isocratic method transfer to improve speed. The column has been shortened further and the flow rate increased to 0.8 mL/min.
Hypersil GOLD Mobile Phase: H2O/ACN (50:50)
+ 0.1% Formic acidTemperature: 25 °CDetection: UV @ 254 nm Injection Volume: 2 µL
Analytes:1. Cortisone2. 11-α-hydroxyprogesterone3. 17-α-hydroxyprogesterone4. Progesterone
Figure 13: Isocratic method transfer to improve resolution.
Hypersil GOLD Mobile Phase: H2O/ACN (50:50)
+ 0.1% Formic acidTemperature: 25 °CDetection: UV @ 254 nm Injection Volume: 2 µL
Analytes:1. Cortisone2. 11-α-hydroxyprogesterone3. 17-α-hydroxyprogesterone4. Progesterone
13% Higher Resolution
14 x Faster
11

1.9 µm H
ypersil GO
LD Colum
ns
In the example chromatograms on the following page (Figure 15),a gradient method for separating sulphonamides has beentransferred from a standard 5 µm analytical column to a shortercolumn containing 1.9 µm particles. This has been performedstepwise to illustrate the effect of each parameter change. For each step the gradient and flow rate have been scaled in accordance with the previous calculations. The final chromatogram illustrates where the column has been furthershortened and the flow rate and gradient made even faster to increase throughput.
The table compares key parameters from the start and endmethods and shows that even under ultra fast conditions (thefinal gradient is 15 times faster than the starting gradient),baseline separation is still achieved. The peak heights are similar even though the injection volume is 10% of the startinginjection volume accentuating the increased sensitivityachieved using 1.9 µm particles.
Gradient Method Transfer
1) Adjust flow rate, keeping linear velocity constant between the original and new method. (in accordance with the isocratic method transfer equations on page 10)
2) Adjust injection volume. (in accordance with the isocratic method transfer equations on page 10)
3) Adjust gradient, keeping initial and final composition unchanged.
System 1 System 2
Column 1: 150 x 4.6 mm Column 2: 50 x 2.1 mmGradient Profile 1 (tg1): 5 to 50% in 15 mins Gradient Profile 2 (tg2): 5 to 50% in 5 minsColumn Volume: 1.7 mL Column Volume: 0.11 mL
tg2 = tg1 x (V02/V01) x (F1/F2)
tg1 – gradient time in original method (min) tg2 – gradient time in new method (min)V01 – original column volume (mL) V02 – new column volume (mL)F1 – original flow rate (mL/min) F2 – new flow rate (mL/min)
Entering the column dimensions and flow rates for both systems and the original gradient gives a tg of 5 minutes for system 2.
Column Volume (V0)
V0 = 0.68 x π x r2 x L
V0 – column void volume (mL)L – column length (cm)r – column radius (cm)0.68 is the approximate fraction of the column volume occupied by mobile phase (for porous particles)
12

Figure 15: Stepwise transfer of a gradient method to 1.9 µm Hypersil GOLD. In each step, the gradient and flow rate are scaled using the calculations presented. In step 1, column length was reduced. Step 2 shows the effects of a reduction in column ID. In Step 3 particle size is reduced to 1.9 µm. In Step 4, the column length is decreased again, while the flow rate is increased.
150 x 4.6 mm, 5 µm 30 x 2.1 mm, 1.9 µmChromatogram A Chromatogram E
Peak Width* (s) 9.0 4.213.2 3.610.2 3.011.4 2.4
Resolution* 11.2 8.85.4 2.07.4 2.2
Peak Height 236331 71764231151 139283220165 170483222985 135603
* baseline
Hypersil GOLD Column: 150 x 4.6 mm, 5 µm (V = 1.7 mL)Gradient: 5 to 100% B in 15 minutesMobile Phase: A: H2O + 0.1% Formic acid
B: ACN + 0.1% Formic acidTemperature: 25 °CDetection: UV @ 254 nm Injection Volume: 5 µLFlow Rate: 1 mL/min
Analytes:1. Sulphaguanidine2. Sulphamerazine3. Sulphamonomethoxine4. Sulphaquinoxaline
Column: 100 x 4.6 mm, 5 µm (V = 1.1 mL)Gradient: 5 to 100% B in 10 minutesFlow Rate: 1 mL/min
Column: 50 x 2.1 mm, 5 µm (V = 0.11 mL)Gradient: 5 to 100% B in 5 minutesFlow Rate: 0.2 mL/min
Column: 50 x 2.1 mm, 1.9 µm (V = 0.11 mL)Gradient: 5 to 100% B in 2 minutesFlow Rate: 0.55 mL/minInjection Volume: 0.5 µL
Column: 30 x 2.1 mm, 1.9 µm (V = 0.07 mL)Gradient: 5 to 100% B in 1 minutesFlow Rate: 0.7 mL/minInjection Volume: 0.5 µL
Cycle Time Reduced by 10 Fold
A
B
C
D
E
13

1.9 µm H
ypersil GO
LD Colum
ns
Hypersil GOLD columns are exceptionally reproducible for reliablechromatography, column after column. This allows the user to beconfident that assays developed with Hypersil GOLD columns willbe robust and stable for the life of the assay, making them the idealchoice for new method development.
Built on 30 years of experience in product development andmanufacturing of HPLC media and columns, Thermo ScientificHypersil GOLD consumables continue upon their success with the
development of a new state-of-the-art family of columns, based on1.9 µm particles, designed for improved chromatography. HypersilGOLD columns are manufactured in ISO 9001:2000 accredited laboratories under strict protocols using a robust manufacturing procedure and extensive quality control testing.
To obtain the most accurate results when performing quantitativeanalysis it is important that key chromatographic parameters suchas retention time and peak area remain consistent.
Figure 16: 1.9 µm Hypersil GOLD Batch Reproducibility. The capacity factorwas measured for a series of peaks across 5 separate batches of 1.9 µmHypersil GOLD. The reproducible values provide the chromatographer withconfidence that analyte peaks will elute at the same time, every time.
Figure 17: 1.9 µm Hypersil GOLD Column Reproducibility. 1.9 µm HypersilGOLD columns show excellent reproducibility, column after column. In thisexample, the efficiency of 200 different columns is shown. Efficiency inexcess of 160,000 plates/m is consistently achieved, column after column.
Figure 18: Batch Reproducibility with 1.9 µm Hypersil GOLD Columns. For allbatches, the tailing factor measured for a very basic analyte, is close tounity, highlighting the excellent symmetrical peak shape which is characteristic of all Hypersil GOLD columns.
Figure 19: System Back Pressure with 1.9 µm Hypersil GOLD. The systemback pressure has been measured over eight separate columns at two flowrates. The minimal variation in column back pressure can only be achievedusing consistently well-packed stationary phase with a reproducible narrowparticle size distribution.
Section 4: Column Reproducibility
14

Assay ReproducibilityThe analysis of a mixture of sulphonamides using 1.9 µm HypersilGOLD column gives a linear response over a range of concentrationsbetween 25 and 250 ng/mL (Figure 20).
The table shows excellent reproducibility for retention times (< 1% RSD) and peak area (< 2% RSD) over six injections. This highlights that accurate data can be obtained under fast chromato-graphic conditions, where peak widths might be as narrow as 1-2 seconds.
Figure 20: Calibration Curves for Sulphonamides. 1.9 µm Hypersil GOLDcolumns produce a linear response over a range of concentrations.
Rt (min) Rt (min) Rt (min) Peak Area Peak Area Peak Area Mean STD RSD (%) Mean STD RSD (%)
Sulphaguanidine
Level 1 (25 ng/µL) 0.50 0.000 0.00 58066 1153 1.99
Level 2 (50 ng/µL) 0.51 0.005 0.93 109285 920 0.84
Level 3 (250 ng/µL) 0.51 0.004 0.73 545729 2962 0.54
Sulphamerazine
Level 1 (25 ng/µL) 1.06 0.005 0.47 76352 941 1.23
Level 2 (50 ng/µL) 1.10 0.011 0.97 153414 2229 1.45
Level 3 (250 ng/µL) 1.08 0.009 0.83 873540 11653 1.33
Sulphamonomethoxine
Level 1 (25 ng/µL) 1.19 0.005 0.42 107601 1389 1.29
Level 2 (50 ng/µL) 1.23 0.010 0.78 182809 2954 1.62
Level 3 (250 ng/µL) 1.22 0.011 0.83 859790 14827 1.72
Sulphaquinoxaline
Level 1 (25 ng/µL) 1.32 0.004 0.28 74714 1252 1.68
Level 2 (50 ng/µL) 1.36 0.012 0.85 146760 2225 1.52
Level 3 (250 ng/µL) 1.35 0.007 0.51 688423 10197 1.48
Hypersil GOLD, 1.9 µm, 50 x 2.1 mmMobile Phase: A: H2O + 0.1% Formic acid
B: ACN + 0.1% Formic acidGradient: 5 to 100% B in 2 minFlow Rate: 0.55 mL/minTemperature: 25 °CDetection: UV @ 270 nmInjection Volume: 0.5 µL
Analytes: 1. Sulphaguanidine2. Sulphamerazine3. Sulphamonomethoxine4. Sulphaquinoxaline
Ordering InformationDescription Particle Size Length (mm) 3.0 mm ID 2.1 mm ID 1.0 mm ID 320 µm ID
Hypersil GOLD 1.9 µm 20 25002-023030 25002-022130 – –
30 25002-033030 25002-032130 25002-031030 –
50 25002-053030 25002-052130 25002-051030 25002-050365
100 25002-103030 25002-102130 25002-101030 25002-100365
200 – 25002-202130 – –
Hypersil GOLD aQ 1.9 µm 20 25302-023030 25302-022130 – –
30 25302-033030 25302-032130 25302-031030 –
50 25302-053030 25302-052130 25302-051030 25302-050365
100 25302-103030 25302-102130 25302-101030 25302-100365
200 – 25302-202130 – –
Hypersil GOLD PFP 1.9 µm 20 25402-023030 25402-022130 – –
30 25402-033030 25402-032130 25402-031030 –
50 25402-053030 25402-052130 25402-051030 25402-050365
100 25402-103030 25402-102130 25402-101030 25402-100365
200 – 25402-202130 – –
Other custom column dimensions are available. Please call your local Customer Service for more information.
15
North America+1 800 437 [email protected]
T
E
Africa, Asia, Europe, Latin America and Middle East+44 (0) 1928 [email protected]
T
E
For Technical Support:
Visit our New Chromatography Resource Center @ www.thermo.com/columnsTG20338_E 06/07M
©2007 Thermo Fisher Scientific Inc. All rights reserved.All trademarks are the property of Thermo FisherScientific Inc. and its subsidiaries.
Specifications, terms and pricing are subject to change.Not all products are available in all countries. Pleaseconsult your local sales representative for details.
Tap our expertise throughout the life of your instrument. Thermo Scientific Services
extends its support throughout our worldwide network of highly trained and certified
engineers who are experts in laboratory technologies and applications. Put our team
of experts to work for you in a range of disciplines – from system installation, training
and technical support, to complete asset management and regulatory compliance
consulting. Improve your productivity and lower the cost of instrument ownership
through our product support services. Maximize uptime while eliminating the
uncontrollable cost of unplanned maintenance and repairs. When it’s time to
enhance your system, we also offer certified parts and a range of accessories and
consumables suited to your application.
To learn more about our products and comprehensive service offerings,
visit us at www.thermo.com.
Laboratory Solutions Backed by Worldwide Service and Support In addition to these offices, ThermoFisher Scientific maintains a network of representative organizationsthroughout the world.
Australia+61 2 8844 9500 • [email protected]
Austria+43 1 333 50340 • [email protected]
Belgium+32 2 482 30 30 • [email protected]
Canada+1 800 532 4752 • [email protected]
China+86 10 5850 3588 • [email protected]
Denmark+45 70 23 62 60 • [email protected]
France+33 1 60 92 48 00 • [email protected]
Germany+49 6103 408 1014 • [email protected]
India+91 22 6742 9434 • [email protected]
Italy+39 02 950 591 • [email protected]
Japan+81 45 453 9100 • [email protected]
Latin America+1 608 276 5659 • [email protected]
Netherlands+31 76 587 98 88 • [email protected]
South Africa+27 11 570 1840 • [email protected]
Spain+34 91 657 4930 • [email protected]
Sweden / Norway / Finland+46 8 556 468 00 • [email protected]
Switzerland+41 61 48784 00 • [email protected]
UK+44 1442 233555 • [email protected]
USA+1 800 532 4752 • [email protected]
www.thermo.com/columns
Thermo Hypersil Ltd., Runcorn, UK is ISO Certified.
Thermo Electron Corporation,Bellefonte, PA is ISO Certified.
ISO 9001:2000 FM 76231


![surpass all possibilities - · PDF fileTRUTH BEHIND INCREASED EFFICIENCY WITH SOLID-CORE PARTICLES [ CORTECS 2.7 µm COLUMNS ] Waters CORTECS Columns are](https://static.fdocument.org/doc/165x107/5aac376e7f8b9a2e088c9e52/surpass-all-possibilities-behind-increased-efficiency-with-solid-core-particles.jpg)