Hierarchical virtual screening: identification of potential high-affinity and selective β ...
21
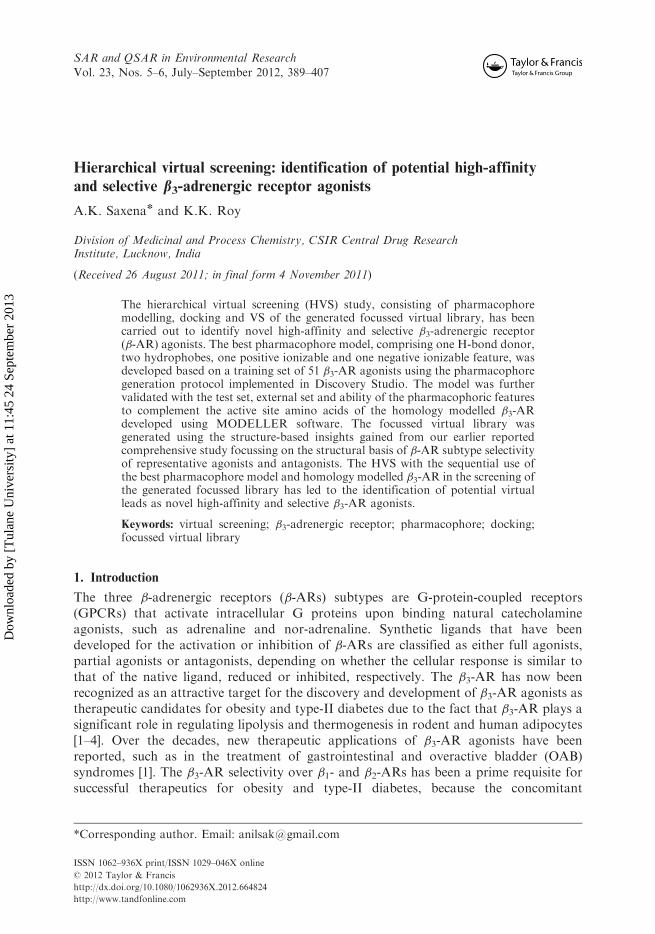
This article was downloaded by: [Tulane University] On: 24 September 2013, At: 11:45 Publisher: Taylor & Francis Informa Ltd Registered in England and Wales Registered Number: 1072954 Registered office: Mortimer House, 37-41 Mortimer Street, London W1T 3JH, UK SAR and QSAR in Environmental Research Publication details, including instructions for authors and subscription information: http://www.tandfonline.com/loi/gsar20 Hierarchical virtual screening: identification of potential high-affinity and selective β 3 -adrenergic receptor agonists A.K. Saxena a & K.K. Roy a a Division of Medicinal and Process Chemistry, CSIR Central Drug Research Institute, Lucknow, India Published online: 27 Mar 2012. To cite this article: A.K. Saxena & K.K. Roy (2012) Hierarchical virtual screening: identification of potential high-affinity and selective β 3 -adrenergic receptor agonists, SAR and QSAR in Environmental Research, 23:5-6, 389-407, DOI: 10.1080/1062936X.2012.664824 To link to this article: http://dx.doi.org/10.1080/1062936X.2012.664824 PLEASE SCROLL DOWN FOR ARTICLE Taylor & Francis makes every effort to ensure the accuracy of all the information (the “Content”) contained in the publications on our platform. However, Taylor & Francis, our agents, and our licensors make no representations or warranties whatsoever as to the accuracy, completeness, or suitability for any purpose of the Content. Any opinions and views expressed in this publication are the opinions and views of the authors, and are not the views of or endorsed by Taylor & Francis. The accuracy of the Content should not be relied upon and should be independently verified with primary sources of information. Taylor and Francis shall not be liable for any losses, actions, claims, proceedings, demands, costs, expenses, damages, and other liabilities whatsoever or howsoever caused arising directly or indirectly in connection with, in relation to or arising out of the use of the Content. This article may be used for research, teaching, and private study purposes. Any substantial or systematic reproduction, redistribution, reselling, loan, sub-licensing, systematic supply, or distribution in any form to anyone is expressly forbidden. Terms &
Transcript of Hierarchical virtual screening: identification of potential high-affinity and selective β ...
This article was downloaded by: [Tulane University]On: 24 September 2013, At: 11:45Publisher: Taylor & FrancisInforma Ltd Registered in England and Wales Registered Number: 1072954 Registeredoffice: Mortimer House, 37-41 Mortimer Street, London W1T 3JH, UK
SAR and QSAR in EnvironmentalResearchPublication details, including instructions for authors andsubscription information:http://www.tandfonline.com/loi/gsar20
Hierarchical virtual screening:identification of potential high-affinityand selective β3-adrenergic receptoragonistsA.K. Saxena a & K.K. Roy aa Division of Medicinal and Process Chemistry, CSIR Central DrugResearch Institute, Lucknow, IndiaPublished online: 27 Mar 2012.
To cite this article: A.K. Saxena & K.K. Roy (2012) Hierarchical virtual screening: identificationof potential high-affinity and selective β3-adrenergic receptor agonists, SAR and QSAR inEnvironmental Research, 23:5-6, 389-407, DOI: 10.1080/1062936X.2012.664824
To link to this article: http://dx.doi.org/10.1080/1062936X.2012.664824
PLEASE SCROLL DOWN FOR ARTICLE
Taylor & Francis makes every effort to ensure the accuracy of all the information (the“Content”) contained in the publications on our platform. However, Taylor & Francis,our agents, and our licensors make no representations or warranties whatsoever as tothe accuracy, completeness, or suitability for any purpose of the Content. Any opinionsand views expressed in this publication are the opinions and views of the authors,and are not the views of or endorsed by Taylor & Francis. The accuracy of the Contentshould not be relied upon and should be independently verified with primary sourcesof information. Taylor and Francis shall not be liable for any losses, actions, claims,proceedings, demands, costs, expenses, damages, and other liabilities whatsoever orhowsoever caused arising directly or indirectly in connection with, in relation to or arisingout of the use of the Content.
This article may be used for research, teaching, and private study purposes. Anysubstantial or systematic reproduction, redistribution, reselling, loan, sub-licensing,systematic supply, or distribution in any form to anyone is expressly forbidden. Terms &

Conditions of access and use can be found at http://www.tandfonline.com/page/terms-and-conditions
Dow
nloa
ded
by [
Tul
ane
Uni
vers
ity]
at 1
1:45
24
Sept
embe
r 20
13
SAR and QSAR in Environmental ResearchVol. 23, Nos. 5–6, July–September 2012, 389–407
Hierarchical virtual screening: identification of potential high-affinity
and selective b3-adrenergic receptor agonists
A.K. Saxena* and K.K. Roy
Division of Medicinal and Process Chemistry, CSIR Central Drug ResearchInstitute, Lucknow, India
(Received 26 August 2011; in final form 4 November 2011)
The hierarchical virtual screening (HVS) study, consisting of pharmacophoremodelling, docking and VS of the generated focussed virtual library, has beencarried out to identify novel high-affinity and selective �3-adrenergic receptor(�-AR) agonists. The best pharmacophore model, comprising one H-bond donor,two hydrophobes, one positive ionizable and one negative ionizable feature, wasdeveloped based on a training set of 51 �3-AR agonists using the pharmacophoregeneration protocol implemented in Discovery Studio. The model was furthervalidated with the test set, external set and ability of the pharmacophoric featuresto complement the active site amino acids of the homology modelled �3-ARdeveloped using MODELLER software. The focussed virtual library wasgenerated using the structure-based insights gained from our earlier reportedcomprehensive study focussing on the structural basis of �-AR subtype selectivityof representative agonists and antagonists. The HVS with the sequential use ofthe best pharmacophore model and homology modelled �3-AR in the screening ofthe generated focussed library has led to the identification of potential virtualleads as novel high-affinity and selective �3-AR agonists.
Keywords: virtual screening; �3-adrenergic receptor; pharmacophore; docking;focussed virtual library
1. Introduction
The three �-adrenergic receptors (�-ARs) subtypes are G-protein-coupled receptors(GPCRs) that activate intracellular G proteins upon binding natural catecholamineagonists, such as adrenaline and nor-adrenaline. Synthetic ligands that have beendeveloped for the activation or inhibition of �-ARs are classified as either full agonists,partial agonists or antagonists, depending on whether the cellular response is similar tothat of the native ligand, reduced or inhibited, respectively. The �3-AR has now beenrecognized as an attractive target for the discovery and development of �3-AR agonists astherapeutic candidates for obesity and type-II diabetes due to the fact that �3-AR plays asignificant role in regulating lipolysis and thermogenesis in rodent and human adipocytes[1–4]. Over the decades, new therapeutic applications of �3-AR agonists have beenreported, such as in the treatment of gastrointestinal and overactive bladder (OAB)syndromes [1]. The �3-AR selectivity over �1- and �2-ARs has been a prime requisite forsuccessful therapeutics for obesity and type-II diabetes, because the concomitant
*Corresponding author. Email: [email protected]
ISSN 1062–936X print/ISSN 1029–046X online
� 2012 Taylor & Francis
http://dx.doi.org/10.1080/1062936X.2012.664824
http://www.tandfonline.com
Dow
nloa
ded
by [
Tul
ane
Uni
vers
ity]
at 1
1:45
24
Sept
embe
r 20
13
activation of �1- and �2-ARs would lead to undesirable side effects, such as increased heartrate and/or muscle tremors [4,5].
Most members of the GPCR superfamily share a common topology in terms of theseven-transmembrane (TM) helix bundle, even though sequence conservation across thesuperfamily is minimal [5,6]. Being the integral membrane proteins, it has been a dauntingtask to obtain atomic resolution structures of GPCRs. Some high-resolution co-crystalstructures of the �1- and �2-ARs bound to their potent and selective agonists are availablein the Research Collaboratory for Structural Bioinformatics (RCSB) protein data bank(www.rcsb.org). However, the structural biologists are unsuccessful in elucidating thecrystal structure of �3-AR. Recently, we have reported a three-dimensional (3D) structureof �3-AR bound to the agonist and antagonist based on a high-resolution crystal structureof �2-AR, and also elucidated the structural basis of �-AR subtype selectivity of thereported diverse representative �-AR agonists and antagonists using molecular docking,molecular dynamics simulations and binding free energy calculations [5]. The globalsequence identity and similarity between the three subtypes of �-ARs are 48.0 and 66.5%,respectively. The sequence identity and similarity between seven TMs of �1- and �3-ARsare 61.2 and 75.3%, respectively, whereas between �2- and �3-ARs are 59.9 and 75.8%,respectively [5].
Virtual screening (VS) of compound databases has been a major hit-identificationtechnique and a major platform in the current drug discovery paradigm [7,8]. The VSmethods can be broadly classified as structure-based virtual screening (SBVS) requiringthe structure of the target protein or ligand-based virtual screening (LBVS) methodscompletely based on ligand similarity [9]. The SBVS method has become the most commontool applied in VS, mostly for post-processing of hits that are not in good agreement withactive site residues of the target protein [10]. Despite more than a decade of researchtowards the improvement of scoring functions, a precise scoring function that canaccurately predict binding affinities of a molecule for a protein still remains elusive.Therefore, the discovery of high-quality leads is hampered during a SBVS. High-qualityidentification of leads is important in drug discovery research and the optimization ofdocking applications represents the next step in attaining better enrichment rates duringSBVS [10].
Pharmacophore modelling is one of the powerful LBVS methods for furnishing the3D-pharmacophore for the prospective/retrospective VS processes. Pharmacophoremodels are usually developed with a collection of structurally diverse compounds sharinga common active site of the target protein [10–13]. The crucial strategies leading tosuccessful pharmacophore-based VS (PBVS) are: (i) the enumeration of a multi-conformational database; (ii) the selection of chemical features for a specific pharmaco-phore model; (iii) the incorporation of excluded volumes to enhance the geographicalrestrictions; and (iv) the optimization of the pharmacophore model [10,14]. The PBVS issuperior over SBVS with respect to its ability to screen multi-conformational databases ofmillions of compounds in comparatively lesser time and retrieval of structurally diversehigh-quality hits/leads [10] . Although PBVS has been most commonly used in the earlyphases of drug discovery, it lacks the ability to precisely predict the activity of the hits/leads, because pharmacophore model development takes into account the range of activityfalling in the uncertainty of 3 [10]. Moreover, both PBVS and SBVS give many falsepositive hits/leads that impede the drug discovery process. One possible explanation forthe failures of both PBVS and SBVS individually may be a poor identification of theimportant physicochemical parameters contributing in the activity modulation. In the
390 A.K. Saxena and K.K. Roy
Dow
nloa
ded
by [
Tul
ane
Uni
vers
ity]
at 1
1:45
24
Sept
embe
r 20
13
recent past, few attempts [10,15,16] have been made to ameliorate the above drawbacks of
both PBVS and SBVS by integrating the two well-applied computer-aided design anddrafting (CADD) approaches viz. ligand- and structure-based drug design.
Over the decades, a number of potent and selective human �3-AR agonists have been
discovered [1,3,5]. In 2005, we have reported a four-point pharmacophore model (two ringaromatic (RA) features, one hydrogen-bond donor (HBD) feature and one positive
ionizable (PI) feature) for �3-AR agonists using the CATALYST/HypoGen method [17].Although this model was of good statistical significance, it failed to correctly predict few
clinically potent and selective �3-AR agonists, such as AJ9677 (EC50 observed¼ 0.062 nM,predicted¼ 250 nM), CL316243 (EC50 observed¼ 18 nM, predicted¼ 280 nM), etc.
Recently, Jin et al. [18] have reported a five-point pharmacophore model (one HBA,two HY, one RA and one PI) considering the heterogeneous dataset of 144 �3-AR
agonists. Since the use of the heterogeneous dataset is one of the most deleterious aspects
towards developing a robust quantitative structure-activity relationship (QSAR) model,the reported pharmacophore model [18] is questionable in terms of its prediction quality.
Furthermore, this model has not been assessed for the prediction quality of the clinicallypotent and selective human �3-AR agonists (such as AJ9677, Amibegron, Solabegron).
The use of these clinical molecules can be highly helpful in selecting an appropriatepharmacophore model, being capable of correctly predicting these clinically potent �3-AR
agonists and providing novel scaffolds as potential �3-AR agonists through VS.In view of the above and an emerging importance of the integrated use of PBVS and
SBVS in the VS, a systematic hierarchical virtual screening (HVS) study, consisting of
pharmacophore modelling, docking and VS of the generated focussed virtual library, hasbeen carried out to identify novel high-affinity and selective �3-AR agonists. The
predictive pharmacophore model has been developed using the training set of 51
compounds and validated using the test set of 124 compounds reported as �3-AR agonists[19–23]. The important pharmacophoric features of the developed model well comple-
mented with the active site residues of the homology modelled �3-AR reported by us veryrecently [5]. Finally, the integrated use of the PBVS and SBVS in the HVS protocol has led
into the identification of novel potential �3-AR agonists covering structurally novelscaffolds, such as carbazole, benzopyran, biphenyl, etc., which is described in this paper.
2. Materials and methods
2.1 Modelling tools and dataset
The 3D-QSAR pharmacophore modelling was accomplished using the pharmacophoregeneration protocols implemented in the Windows-based Accelry’s Discovery Studio (DS
version 2.0) [24]. A structurally diverse and homogeneous dataset of 175 �3-AR agonists[19–23] with agonistic activity (expressed as EC50), spanning about four log orders of
magnitude (0.029–180 nM), was considered for pharmacophore modelling and optimiza-tion studies. The �3-AR agonists were grouped into highly active (EC50� 0.5 nM),
moderately active (0.55EC505 50 nM) and inactive (EC50� 50 nM). The dataset wasclassified into the training set (51 compounds; Figure 1) and test set (124 compounds;
Table 1S in the supplementary material) in such a way to avoid any redundancy in terms of
structural features or activity range and also to provide clear and concise informationduring pharmacophore model development [10–13].
SAR and QSAR in Environmental Research 391
Dow
nloa
ded
by [
Tul
ane
Uni
vers
ity]
at 1
1:45
24
Sept
embe
r 20
13
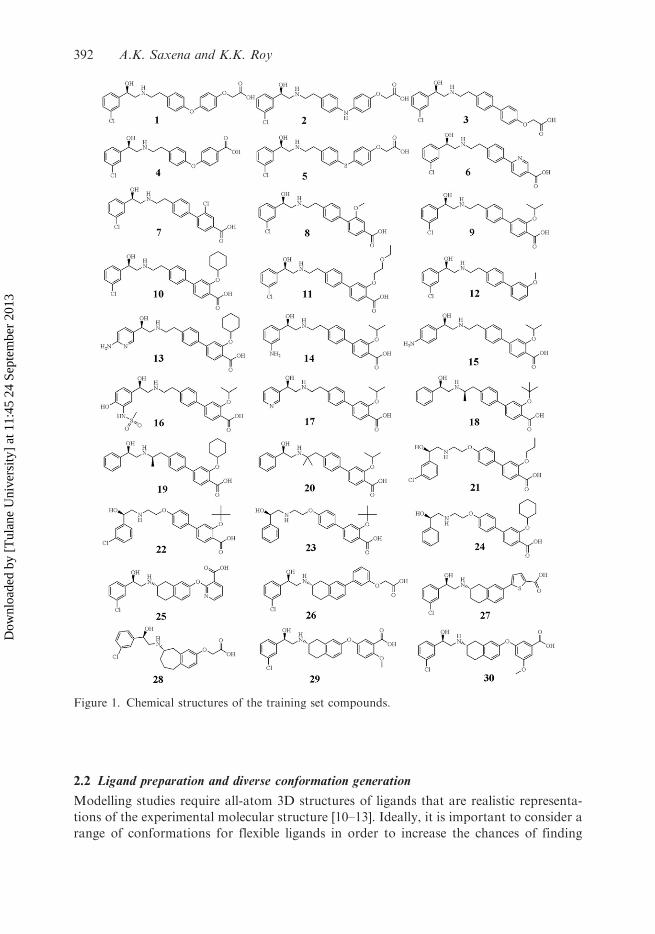
2.2 Ligand preparation and diverse conformation generation
Modelling studies require all-atom 3D structures of ligands that are realistic representa-
tions of the experimental molecular structure [10–13]. Ideally, it is important to consider a
range of conformations for flexible ligands in order to increase the chances of finding
Figure 1. Chemical structures of the training set compounds.
392 A.K. Saxena and K.K. Roy
Dow
nloa
ded
by [
Tul
ane
Uni
vers
ity]
at 1
1:45
24
Sept
embe
r 20
13
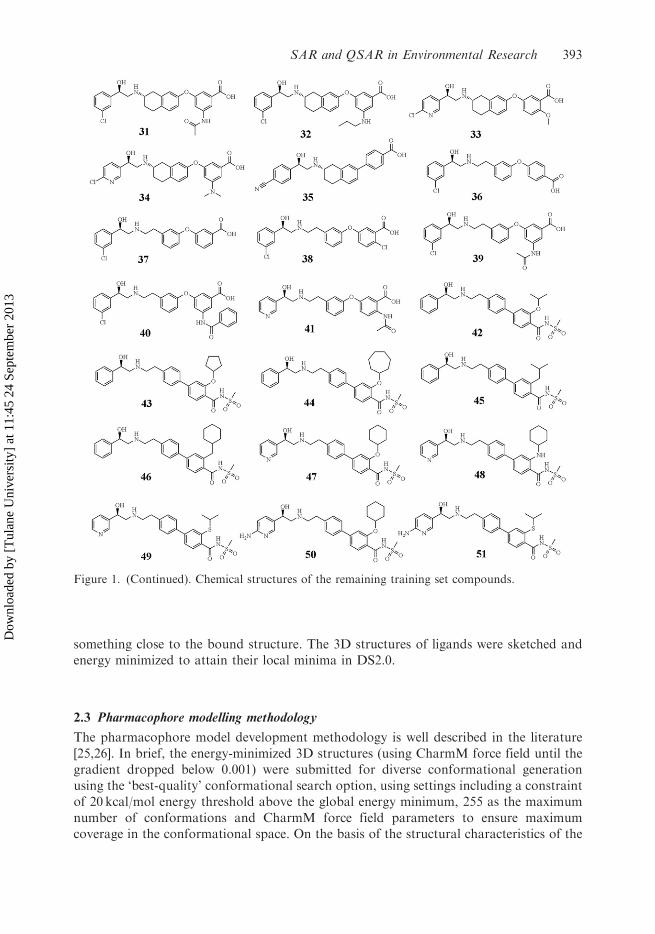
something close to the bound structure. The 3D structures of ligands were sketched andenergy minimized to attain their local minima in DS2.0.
2.3 Pharmacophore modelling methodology
The pharmacophore model development methodology is well described in the literature[25,26]. In brief, the energy-minimized 3D structures (using CharmM force field until thegradient dropped below 0.001) were submitted for diverse conformational generationusing the ‘best-quality’ conformational search option, using settings including a constraintof 20 kcal/mol energy threshold above the global energy minimum, 255 as the maximumnumber of conformations and CharmM force field parameters to ensure maximumcoverage in the conformational space. On the basis of the structural characteristics of the
Figure 1. (Continued). Chemical structures of the remaining training set compounds.
SAR and QSAR in Environmental Research 393
Dow
nloa
ded
by [
Tul
ane
Uni
vers
ity]
at 1
1:45
24
Sept
embe
r 20
13
training set compounds, different combinations of the eight pharmacophore features,
namely hydrogen-bond acceptor (HBA), HBD, hydrophobic (H or HY), hydrophobic
aliphatic (HAl), hydrophobic aromatic (HAr), RA, P or PI and negative ionizable (N or
NI), were considered for the model development. The sulfonamide group behaves as a
NI feature, as exemplified by the sulfa drugs such as sulfaquinoxaline, sulfanilamide,
etc., as competitive inhibitors of p-amino benzoic acid (PABA). Thus, the NI feature
was customized in the present study in order to pick the sulfonamide group as the
NI group.The pharmacophore modelling, which is executed in three subsequent phases viz.
constructive, subtractive and optimization phases [10–14], was accomplished using the 3D-
QSAR pharmacophore generation protocol based on the training set of 51 compounds.
The top 10 scoring pharmacophore models (hypotheses) were analysed for their statistical
significance, where the optimal model was selected by analysing the quality of the mapped
conformations as well as analysis of theoretical costs, namely fixed, null, total, error,
weight, configuration and residual costs [10–14,27]. The term ‘cost’ indicates the number
of binary bits required to generate a particular pharmacophore/hypothesis. The
recommended values of residual, weight and configuration costs are �40, �2 and �17,
respectively. Further quality assessment and validation of the pharmacophore model was
done using the large test set of 124 compounds, which were kept apart during the model
development process.
2.4 Generation of the focussed virtual library
The focussed virtual library was generated using the CombiGlide module [28] implemented
in the Schrodinger software package [29]. The fragment collections were created based on
the structural insights gained from our recently published study [5]. The created fragment
libraries were prepared using the Reagent Preparation panel for the use in the enumeration
of the combinatorial library.
2.5 Molecular docking and scoring
The molecular docking of ligands into the active site of the homology modelled �3-AR was
done using Glide module [30] implemented in Schrodinger software package. Protein was
prepared using the Protein Preparation Wizard implemented in the Schrodinger
package [29]. The receptor grid was generated using the best docked complex of AJ9677
with the modelled �3-AR recently reported by us [5]. To allow residues to be readily
compared between AR subtypes, the standardized numbering system of Ballesteros and
Weinstein [31] was used to designate amino acids present in the seven TM helices. Along
with numbering their positions in the primary amino acid sequence, the residues havenumbers in parentheses (X.YZ) that indicate their position in each TM helix (X), relative
to a conserved reference residue in that TM helix (YZ). However, the numbering was not
used in the extra/intracellular loop regions. The molecular graphics depicting key
interactions between the ligand agonists and the binding site residues of �3-AR were
produced using the PyMol program [32].
394 A.K. Saxena and K.K. Roy
Dow
nloa
ded
by [
Tul
ane
Uni
vers
ity]
at 1
1:45
24
Sept
embe
r 20
13
3. Results and discussion
3.1 Pharmacophore generation
The top five pharmacophore hypotheses/models among various pharmacophore models
generated using the 3D-QSAR pharmacophore generation protocol based on the training
set of 51 �3-AR agonists are summarized in Table 1. The quality assessment of the
generated pharmacophore models was accomplished considering the observed values of
various parameters, namely cost values, residual costs, correlations and root-mean-square
(RMS) deviations. The residual cost that is the difference between the total cost and the
null cost should be as large as possible; however, a value of 40–60 bits difference may
indicate that there is a 75–90% chance of representing a true correlation in the dataset
used. The residual costs of the top five pharmacophore models were more than 70, while
the configuration costs were less than 15 (Table 1). Besides, the correlation values of these
10 pharmacophore models were greater than 0.9 and the RMS deviations were less than
0.9. These statistical results demonstrated the capability of the pharmacophore model to
correctly predict the activity of the training set compounds and, thus, suggested their
reliability and predictive ability for the compounds other than the training set.According to the statistical parameters summarized in Table 1, the hypo1 with the
highest residual cost (78.086), lowest RMS deviation (0.790), lowest configuration cost
(16.691) and highest correlation coefficient (0.923) was chosen as the best pharmacophore
model for predicting the �3-AR agonistic activity. The best pharmacophore model (hypo1)
was composed of a total of five features, namely one HBD, two hydrophobes (HYs), one
PI feature and one NI. The 3D space and distance constraints of these five
pharmacophoric features characteristic of hypo1 are depicted in Figure 2(a).The comparison of superimposed pharmacophore (hypo1) into the active site of the �3-
AR homology model recently reported by us is shown in Figure 2(c). As shown, all
pharmacophoric features were in excellent agreement with the active site residues (i.e.
Asp1173.32, Val1183.33, Val1213.36, Ala197 (ECL2), Phe198 (ECL2), Val2055.39, Trp3056.48,
Phe3086.51, Phe3096.52, Arg3156.58, Gly3257.32, Pro3267.33, Phe3287.35, Leu3297.36,
Asn3327.39 and Tyr3367.43). The NI feature complemented with the selectivity determining
PI residue Arg3156.58, while the two hydrophobic features present in the close proximity of
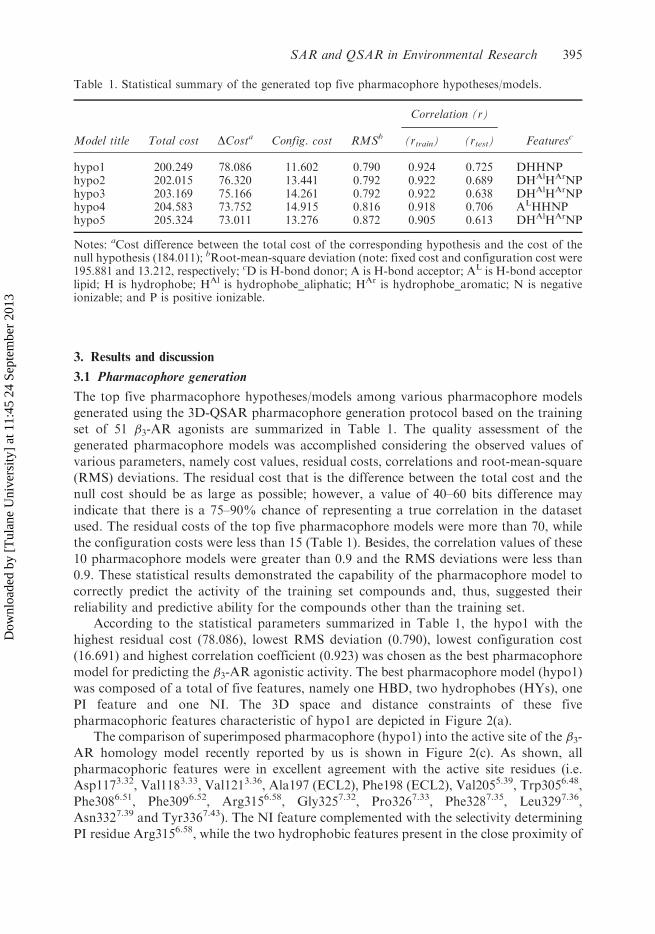
Table 1. Statistical summary of the generated top five pharmacophore hypotheses/models.
Model title Total cost DCosta Config. cost RMSb
Correlation (r)
Featuresc(rtrain) (rtest)
hypo1 200.249 78.086 11.602 0.790 0.924 0.725 DHHNPhypo2 202.015 76.320 13.441 0.792 0.922 0.689 DHAlHArNPhypo3 203.169 75.166 14.261 0.792 0.922 0.638 DHAlHArNPhypo4 204.583 73.752 14.915 0.816 0.918 0.706 ALHHNPhypo5 205.324 73.011 13.276 0.872 0.905 0.613 DHAlHArNP
Notes: aCost difference between the total cost of the corresponding hypothesis and the cost of thenull hypothesis (184.011); bRoot-mean-square deviation (note: fixed cost and configuration cost were195.881 and 13.212, respectively; cD is H-bond donor; A is H-bond acceptor; AL is H-bond acceptorlipid; H is hydrophobe; HAl is hydrophobe_aliphatic; HAr is hydrophobe_aromatic; N is negativeionizable; and P is positive ionizable.
SAR and QSAR in Environmental Research 395
Dow
nloa
ded
by [
Tul
ane
Uni
vers
ity]
at 1
1:45
24
Sept
embe
r 20
13
the NI feature complemented with the hydrophobic residues Ala197 (ECL2) and
Val2055.39, and Phe198 (ECL2), Phe3287.35 and Leu3297.36 respectively. The PI and
HBD features complemented with Asp1173.32, Asn3327.39 and Tyr3367.43 amino acids.
These residues have been recently reported to directly interact with the
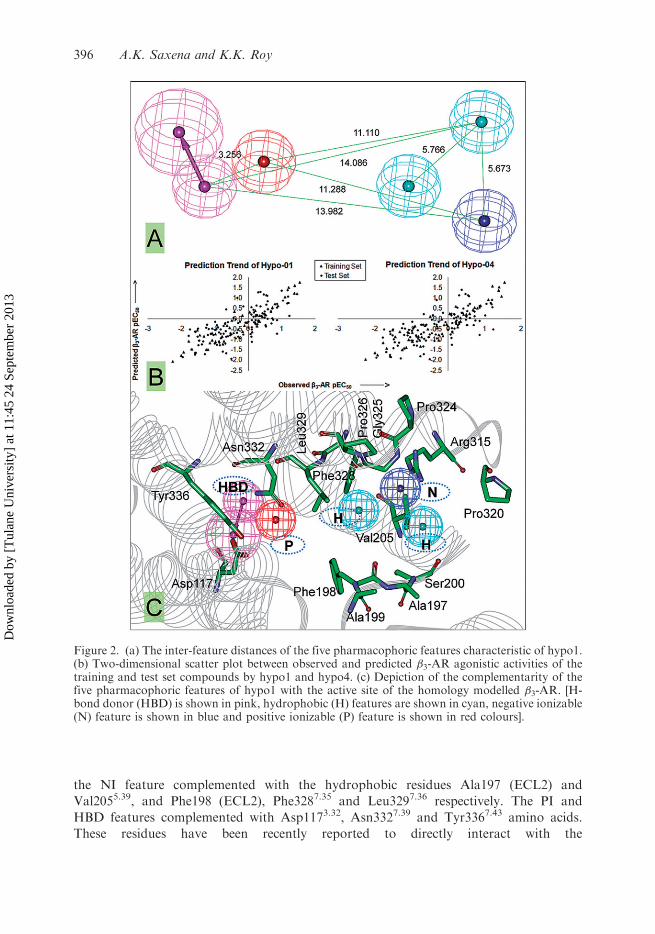
Figure 2. (a) The inter-feature distances of the five pharmacophoric features characteristic of hypo1.(b) Two-dimensional scatter plot between observed and predicted �3-AR agonistic activities of thetraining and test set compounds by hypo1 and hypo4. (c) Depiction of the complementarity of thefive pharmacophoric features of hypo1 with the active site of the homology modelled �3-AR. [H-bond donor (HBD) is shown in pink, hydrophobic (H) features are shown in cyan, negative ionizable(N) feature is shown in blue and positive ionizable (P) feature is shown in red colours].
396 A.K. Saxena and K.K. Roy
Dow
nloa
ded
by [
Tul
ane
Uni
vers
ity]
at 1
1:45
24
Sept
embe
r 20
13
�-hydroxylethylamine moiety of the classical non-selective �-AR agonist (epinephrine) and
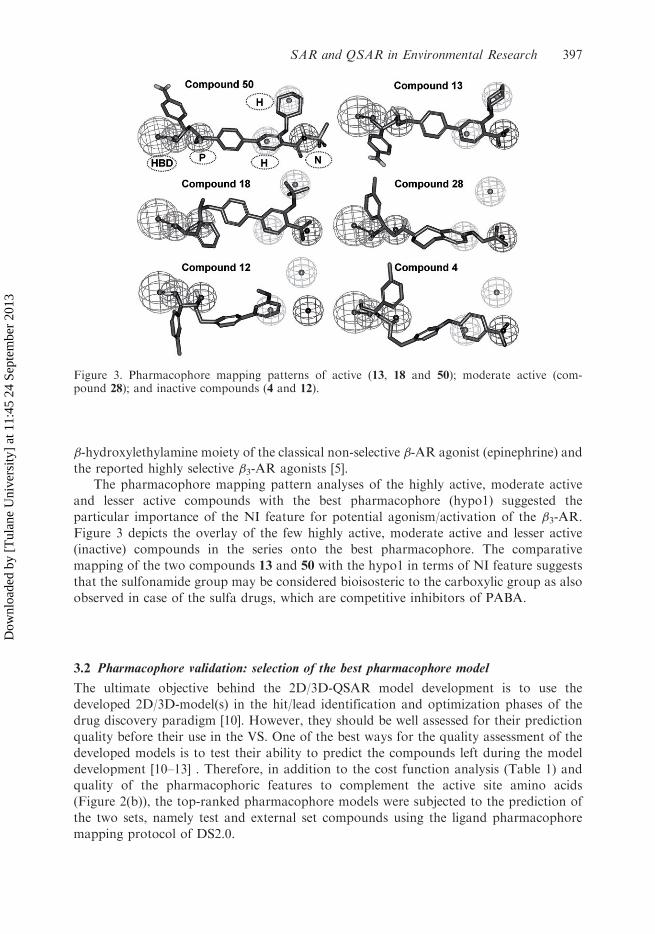
the reported highly selective �3-AR agonists [5].The pharmacophore mapping pattern analyses of the highly active, moderate active
and lesser active compounds with the best pharmacophore (hypo1) suggested the
particular importance of the NI feature for potential agonism/activation of the �3-AR.
Figure 3 depicts the overlay of the few highly active, moderate active and lesser active
(inactive) compounds in the series onto the best pharmacophore. The comparative
mapping of the two compounds 13 and 50 with the hypo1 in terms of NI feature suggests
that the sulfonamide group may be considered bioisosteric to the carboxylic group as also
observed in case of the sulfa drugs, which are competitive inhibitors of PABA.
3.2 Pharmacophore validation: selection of the best pharmacophore model
The ultimate objective behind the 2D/3D-QSAR model development is to use the
developed 2D/3D-model(s) in the hit/lead identification and optimization phases of the
drug discovery paradigm [10]. However, they should be well assessed for their prediction
quality before their use in the VS. One of the best ways for the quality assessment of the
developed models is to test their ability to predict the compounds left during the model
development [10–13] . Therefore, in addition to the cost function analysis (Table 1) andquality of the pharmacophoric features to complement the active site amino acids
(Figure 2(b)), the top-ranked pharmacophore models were subjected to the prediction of
the two sets, namely test and external set compounds using the ligand pharmacophore
mapping protocol of DS2.0.
Figure 3. Pharmacophore mapping patterns of active (13, 18 and 50); moderate active (com-pound 28); and inactive compounds (4 and 12).
SAR and QSAR in Environmental Research 397
Dow
nloa
ded
by [
Tul
ane
Uni
vers
ity]
at 1
1:45
24
Sept
embe
r 20
13
As summarized in Table 1, the hypo1 was found to be the best among the top fivepharmacophore models in terms of the prediction of the test set of 124 compounds with acorrelation (R) of 0.730 (R2
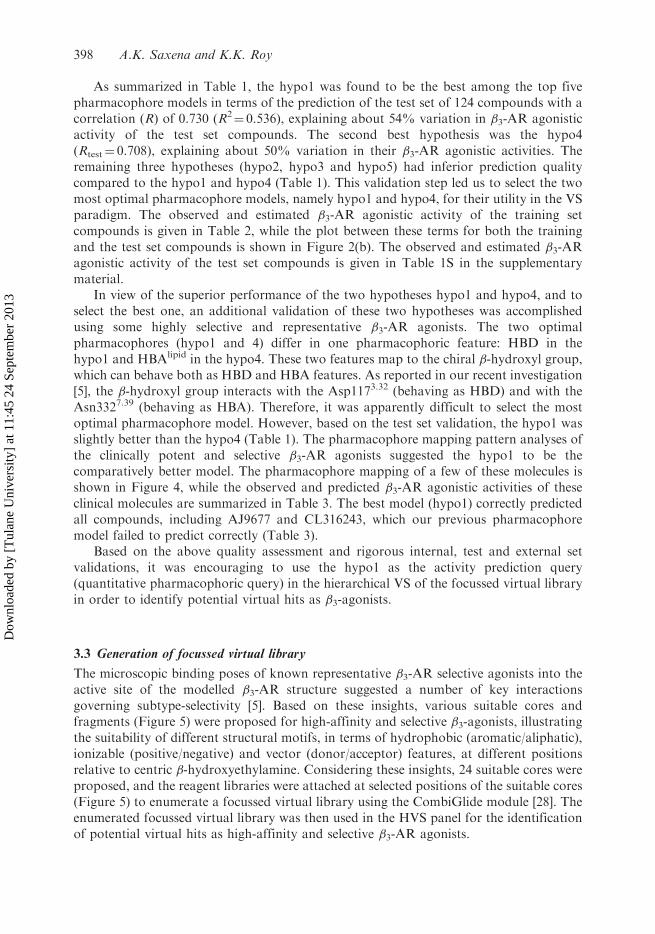
¼ 0.536), explaining about 54% variation in �3-AR agonisticactivity of the test set compounds. The second best hypothesis was the hypo4(Rtest¼ 0.708), explaining about 50% variation in their �3-AR agonistic activities. Theremaining three hypotheses (hypo2, hypo3 and hypo5) had inferior prediction qualitycompared to the hypo1 and hypo4 (Table 1). This validation step led us to select the twomost optimal pharmacophore models, namely hypo1 and hypo4, for their utility in the VSparadigm. The observed and estimated �3-AR agonistic activity of the training setcompounds is given in Table 2, while the plot between these terms for both the trainingand the test set compounds is shown in Figure 2(b). The observed and estimated �3-ARagonistic activity of the test set compounds is given in Table 1S in the supplementarymaterial.
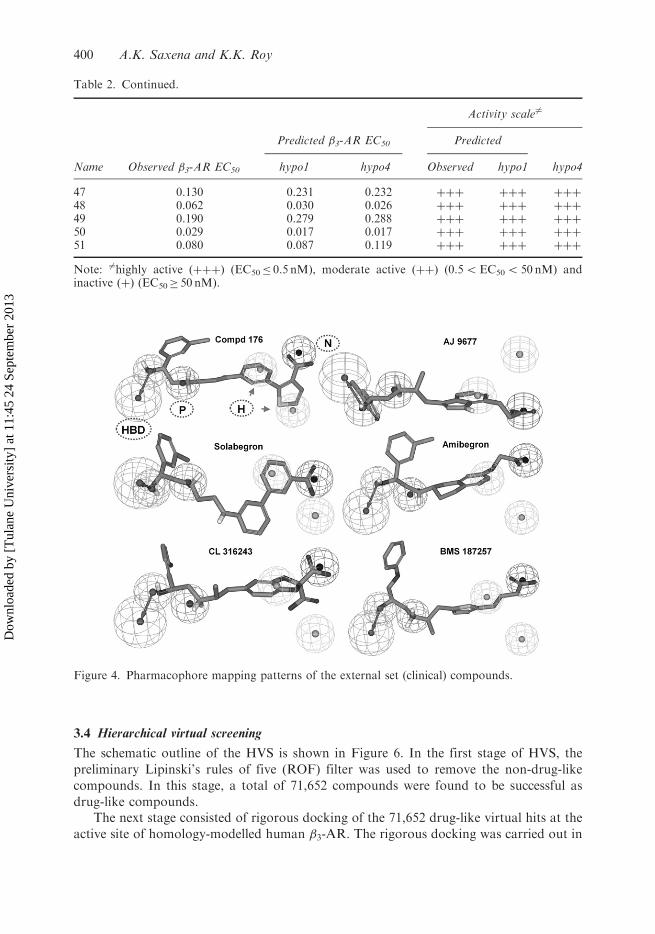
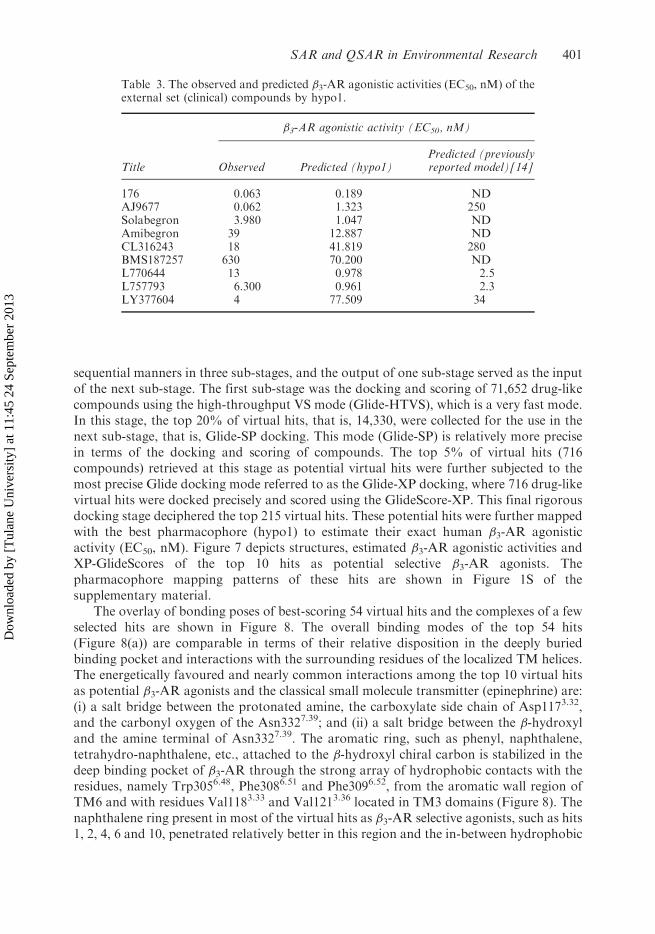
In view of the superior performance of the two hypotheses hypo1 and hypo4, and toselect the best one, an additional validation of these two hypotheses was accomplishedusing some highly selective and representative �3-AR agonists. The two optimalpharmacophores (hypo1 and 4) differ in one pharmacophoric feature: HBD in thehypo1 and HBAlipid in the hypo4. These two features map to the chiral �-hydroxyl group,which can behave both as HBD and HBA features. As reported in our recent investigation[5], the �-hydroxyl group interacts with the Asp1173.32 (behaving as HBD) and with theAsn3327.39 (behaving as HBA). Therefore, it was apparently difficult to select the mostoptimal pharmacophore model. However, based on the test set validation, the hypo1 wasslightly better than the hypo4 (Table 1). The pharmacophore mapping pattern analyses ofthe clinically potent and selective �3-AR agonists suggested the hypo1 to be thecomparatively better model. The pharmacophore mapping of a few of these molecules isshown in Figure 4, while the observed and predicted �3-AR agonistic activities of theseclinical molecules are summarized in Table 3. The best model (hypo1) correctly predictedall compounds, including AJ9677 and CL316243, which our previous pharmacophoremodel failed to predict correctly (Table 3).
Based on the above quality assessment and rigorous internal, test and external setvalidations, it was encouraging to use the hypo1 as the activity prediction query(quantitative pharmacophoric query) in the hierarchical VS of the focussed virtual libraryin order to identify potential virtual hits as �3-agonists.
3.3 Generation of focussed virtual library
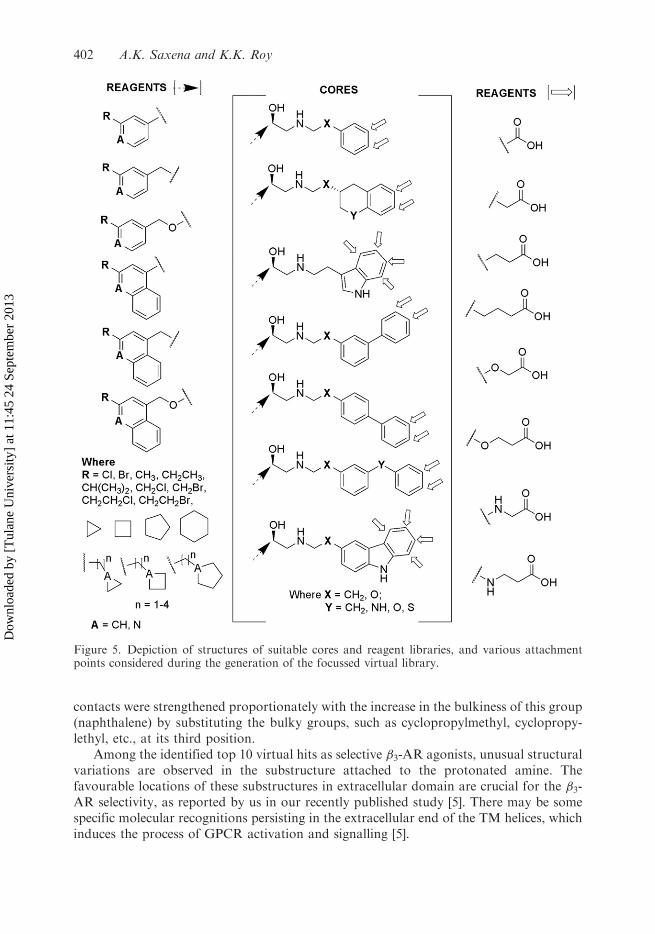
The microscopic binding poses of known representative �3-AR selective agonists into theactive site of the modelled �3-AR structure suggested a number of key interactionsgoverning subtype-selectivity [5]. Based on these insights, various suitable cores andfragments (Figure 5) were proposed for high-affinity and selective �3-agonists, illustratingthe suitability of different structural motifs, in terms of hydrophobic (aromatic/aliphatic),ionizable (positive/negative) and vector (donor/acceptor) features, at different positionsrelative to centric �-hydroxyethylamine. Considering these insights, 24 suitable cores wereproposed, and the reagent libraries were attached at selected positions of the suitable cores(Figure 5) to enumerate a focussed virtual library using the CombiGlide module [28]. Theenumerated focussed virtual library was then used in the HVS panel for the identificationof potential virtual hits as high-affinity and selective �3-AR agonists.
398 A.K. Saxena and K.K. Roy
Dow
nloa
ded
by [
Tul
ane
Uni
vers
ity]
at 1
1:45
24
Sept
embe
r 20
13
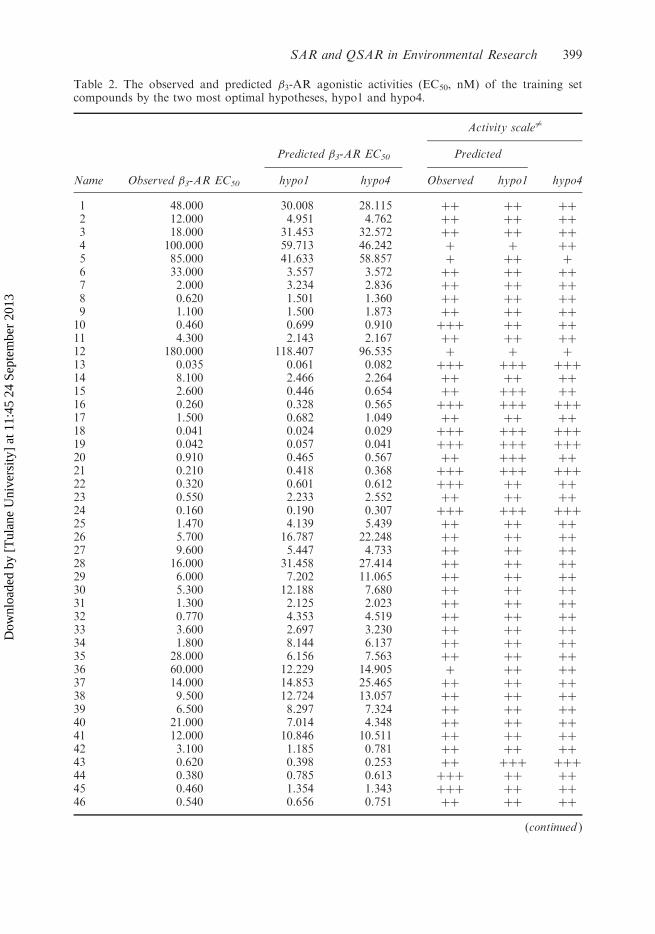
Table 2. The observed and predicted �3-AR agonistic activities (EC50, nM) of the training setcompounds by the two most optimal hypotheses, hypo1 and hypo4.
Activity scale 6¼
Predicted �3-AR EC50 Predicted
Name Observed �3-AR EC50 hypo1 hypo4 Observed hypo1 hypo4
1 48.000 30.008 28.115 þþ þþ þþ
2 12.000 4.951 4.762 þþ þþ þþ
3 18.000 31.453 32.572 þþ þþ þþ
4 100.000 59.713 46.242 þ þ þþ
5 85.000 41.633 58.857 þ þþ þ
6 33.000 3.557 3.572 þþ þþ þþ
7 2.000 3.234 2.836 þþ þþ þþ
8 0.620 1.501 1.360 þþ þþ þþ
9 1.100 1.500 1.873 þþ þþ þþ
10 0.460 0.699 0.910 þþþ þþ þþ
11 4.300 2.143 2.167 þþ þþ þþ
12 180.000 118.407 96.535 þ þ þ
13 0.035 0.061 0.082 þþþ þþþ þþþ
14 8.100 2.466 2.264 þþ þþ þþ
15 2.600 0.446 0.654 þþ þþþ þþ
16 0.260 0.328 0.565 þþþ þþþ þþþ
17 1.500 0.682 1.049 þþ þþ þþ
18 0.041 0.024 0.029 þþþ þþþ þþþ
19 0.042 0.057 0.041 þþþ þþþ þþþ
20 0.910 0.465 0.567 þþ þþþ þþ
21 0.210 0.418 0.368 þþþ þþþ þþþ
22 0.320 0.601 0.612 þþþ þþ þþ
23 0.550 2.233 2.552 þþ þþ þþ
24 0.160 0.190 0.307 þþþ þþþ þþþ
25 1.470 4.139 5.439 þþ þþ þþ
26 5.700 16.787 22.248 þþ þþ þþ
27 9.600 5.447 4.733 þþ þþ þþ
28 16.000 31.458 27.414 þþ þþ þþ
29 6.000 7.202 11.065 þþ þþ þþ
30 5.300 12.188 7.680 þþ þþ þþ
31 1.300 2.125 2.023 þþ þþ þþ
32 0.770 4.353 4.519 þþ þþ þþ
33 3.600 2.697 3.230 þþ þþ þþ
34 1.800 8.144 6.137 þþ þþ þþ
35 28.000 6.156 7.563 þþ þþ þþ
36 60.000 12.229 14.905 þ þþ þþ
37 14.000 14.853 25.465 þþ þþ þþ
38 9.500 12.724 13.057 þþ þþ þþ
39 6.500 8.297 7.324 þþ þþ þþ
40 21.000 7.014 4.348 þþ þþ þþ
41 12.000 10.846 10.511 þþ þþ þþ
42 3.100 1.185 0.781 þþ þþ þþ
43 0.620 0.398 0.253 þþ þþþ þþþ
44 0.380 0.785 0.613 þþþ þþ þþ
45 0.460 1.354 1.343 þþþ þþ þþ
46 0.540 0.656 0.751 þþ þþ þþ
(continued )
SAR and QSAR in Environmental Research 399
Dow
nloa
ded
by [
Tul
ane
Uni
vers
ity]
at 1
1:45
24
Sept
embe
r 20
13
3.4 Hierarchical virtual screening
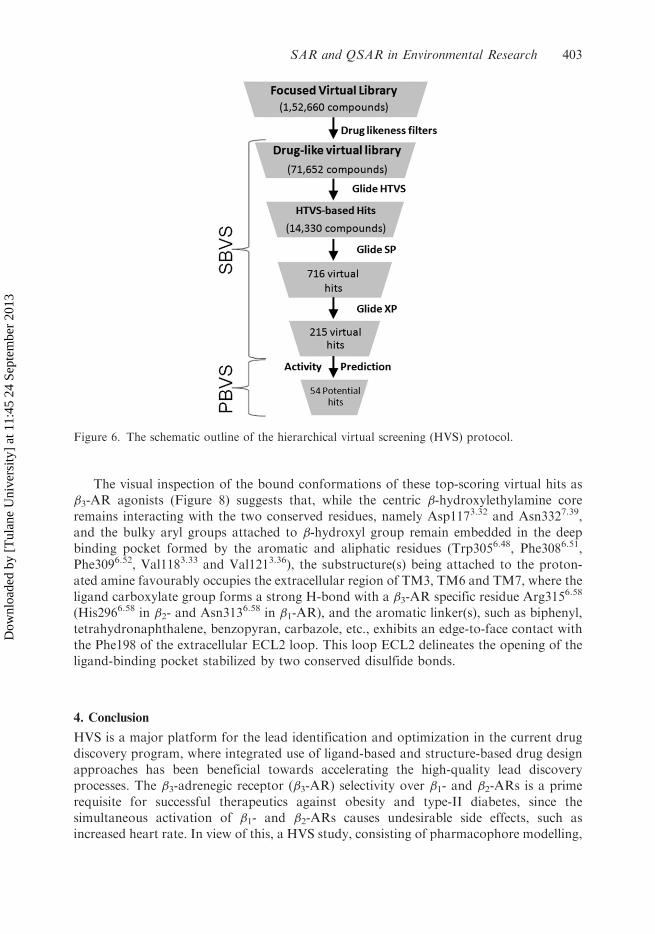
The schematic outline of the HVS is shown in Figure 6. In the first stage of HVS, the
preliminary Lipinski’s rules of five (ROF) filter was used to remove the non-drug-like
compounds. In this stage, a total of 71,652 compounds were found to be successful as
drug-like compounds.The next stage consisted of rigorous docking of the 71,652 drug-like virtual hits at the
active site of homology-modelled human �3-AR. The rigorous docking was carried out in
Table 2. Continued.
Activity scale 6¼
Predicted �3-AR EC50 Predicted
Name Observed �3-AR EC50 hypo1 hypo4 Observed hypo1 hypo4
47 0.130 0.231 0.232 þþþ þþþ þþþ
48 0.062 0.030 0.026 þþþ þþþ þþþ
49 0.190 0.279 0.288 þþþ þþþ þþþ
50 0.029 0.017 0.017 þþþ þþþ þþþ
51 0.080 0.087 0.119 þþþ þþþ þþþ
Note: 6¼highly active (þþþ) (EC50� 0.5 nM), moderate active (þþ) (0.55EC505 50 nM) andinactive (þ) (EC50� 50 nM).
Figure 4. Pharmacophore mapping patterns of the external set (clinical) compounds.
400 A.K. Saxena and K.K. Roy
Dow
nloa
ded
by [
Tul
ane
Uni
vers
ity]
at 1
1:45
24
Sept
embe
r 20
13
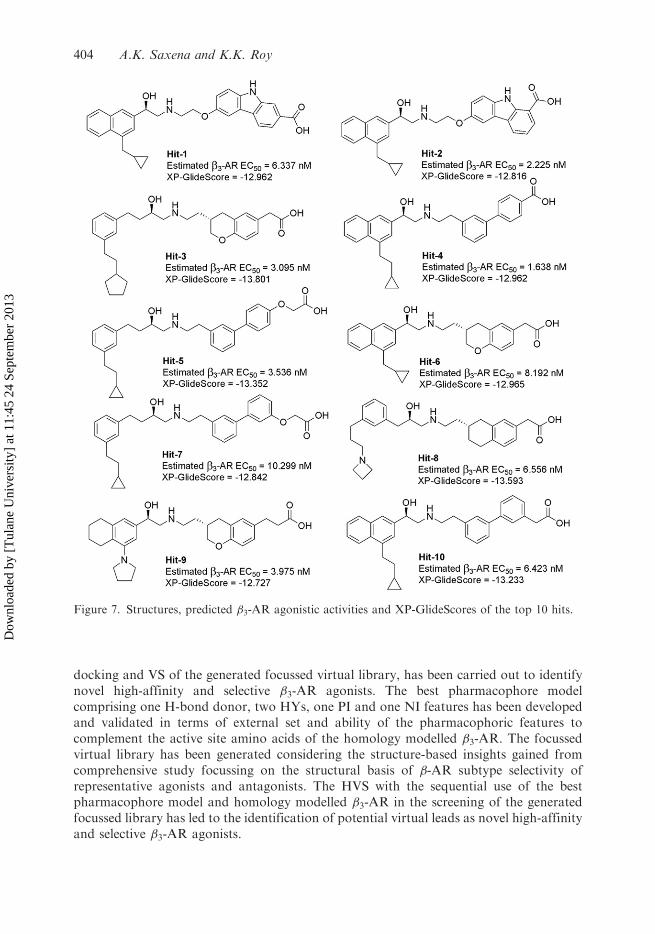
sequential manners in three sub-stages, and the output of one sub-stage served as the inputof the next sub-stage. The first sub-stage was the docking and scoring of 71,652 drug-likecompounds using the high-throughput VS mode (Glide-HTVS), which is a very fast mode.In this stage, the top 20% of virtual hits, that is, 14,330, were collected for the use in thenext sub-stage, that is, Glide-SP docking. This mode (Glide-SP) is relatively more precisein terms of the docking and scoring of compounds. The top 5% of virtual hits (716compounds) retrieved at this stage as potential virtual hits were further subjected to themost precise Glide docking mode referred to as the Glide-XP docking, where 716 drug-likevirtual hits were docked precisely and scored using the GlideScore-XP. This final rigorousdocking stage deciphered the top 215 virtual hits. These potential hits were further mappedwith the best pharmacophore (hypo1) to estimate their exact human �3-AR agonisticactivity (EC50, nM). Figure 7 depicts structures, estimated �3-AR agonistic activities andXP-GlideScores of the top 10 hits as potential selective �3-AR agonists. Thepharmacophore mapping patterns of these hits are shown in Figure 1S of thesupplementary material.
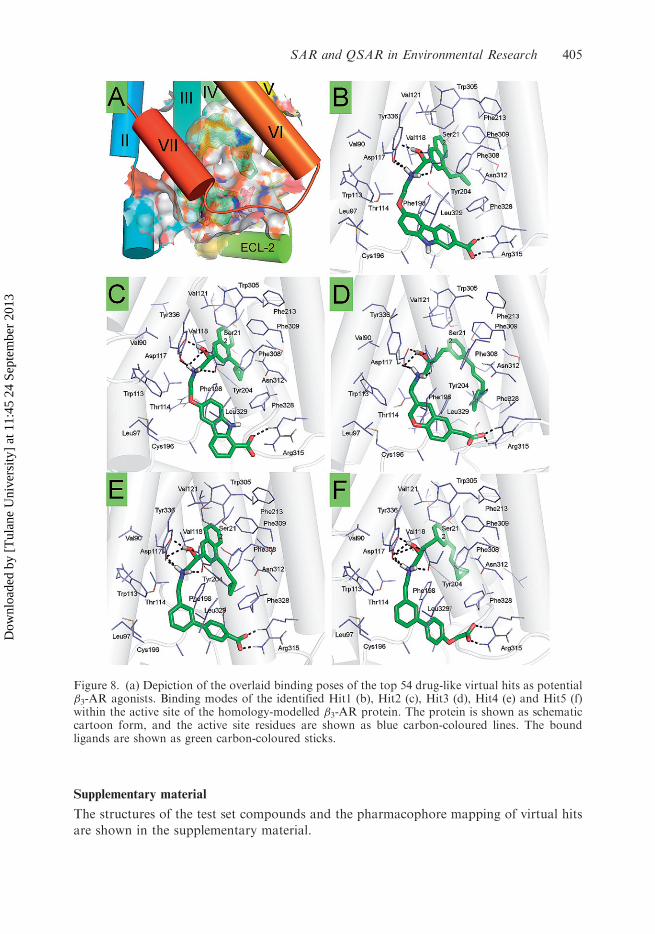
The overlay of bonding poses of best-scoring 54 virtual hits and the complexes of a fewselected hits are shown in Figure 8. The overall binding modes of the top 54 hits(Figure 8(a)) are comparable in terms of their relative disposition in the deeply buriedbinding pocket and interactions with the surrounding residues of the localized TM helices.The energetically favoured and nearly common interactions among the top 10 virtual hitsas potential �3-AR agonists and the classical small molecule transmitter (epinephrine) are:(i) a salt bridge between the protonated amine, the carboxylate side chain of Asp1173.32,and the carbonyl oxygen of the Asn3327.39; and (ii) a salt bridge between the �-hydroxyland the amine terminal of Asn3327.39. The aromatic ring, such as phenyl, naphthalene,tetrahydro-naphthalene, etc., attached to the �-hydroxyl chiral carbon is stabilized in thedeep binding pocket of �3-AR through the strong array of hydrophobic contacts with theresidues, namely Trp3056.48, Phe3086.51 and Phe3096.52, from the aromatic wall region ofTM6 and with residues Val1183.33 and Val1213.36 located in TM3 domains (Figure 8). Thenaphthalene ring present in most of the virtual hits as �3-AR selective agonists, such as hits1, 2, 4, 6 and 10, penetrated relatively better in this region and the in-between hydrophobic
Table 3. The observed and predicted �3-AR agonistic activities (EC50, nM) of theexternal set (clinical) compounds by hypo1.
Title
�3-AR agonistic activity (EC50, nM)
Observed Predicted (hypo1)Predicted (previouslyreported model)[14]
176 0.063 0.189 NDAJ9677 0.062 1.323 250Solabegron 3.980 1.047 NDAmibegron 39 12.887 NDCL316243 18 41.819 280BMS187257 630 70.200 NDL770644 13 0.978 2.5L757793 6.300 0.961 2.3LY377604 4 77.509 34
SAR and QSAR in Environmental Research 401
Dow
nloa
ded
by [
Tul
ane
Uni
vers
ity]
at 1
1:45
24
Sept
embe
r 20
13
contacts were strengthened proportionately with the increase in the bulkiness of this group(naphthalene) by substituting the bulky groups, such as cyclopropylmethyl, cyclopropy-lethyl, etc., at its third position.
Among the identified top 10 virtual hits as selective �3-AR agonists, unusual structuralvariations are observed in the substructure attached to the protonated amine. Thefavourable locations of these substructures in extracellular domain are crucial for the �3-AR selectivity, as reported by us in our recently published study [5]. There may be somespecific molecular recognitions persisting in the extracellular end of the TM helices, whichinduces the process of GPCR activation and signalling [5].
Figure 5. Depiction of structures of suitable cores and reagent libraries, and various attachmentpoints considered during the generation of the focussed virtual library.
402 A.K. Saxena and K.K. Roy
Dow
nloa
ded
by [
Tul
ane
Uni
vers
ity]
at 1
1:45
24
Sept
embe
r 20
13
The visual inspection of the bound conformations of these top-scoring virtual hits as�3-AR agonists (Figure 8) suggests that, while the centric �-hydroxylethylamine coreremains interacting with the two conserved residues, namely Asp1173.32 and Asn3327.39,and the bulky aryl groups attached to �-hydroxyl group remain embedded in the deepbinding pocket formed by the aromatic and aliphatic residues (Trp3056.48, Phe3086.51,Phe3096.52, Val1183.33 and Val1213.36), the substructure(s) being attached to the proton-ated amine favourably occupies the extracellular region of TM3, TM6 and TM7, where theligand carboxylate group forms a strong H-bond with a �3-AR specific residue Arg3156.58
(His2966.58 in �2- and Asn3136.58 in �1-AR), and the aromatic linker(s), such as biphenyl,tetrahydronaphthalene, benzopyran, carbazole, etc., exhibits an edge-to-face contact withthe Phe198 of the extracellular ECL2 loop. This loop ECL2 delineates the opening of theligand-binding pocket stabilized by two conserved disulfide bonds.
4. Conclusion
HVS is a major platform for the lead identification and optimization in the current drugdiscovery program, where integrated use of ligand-based and structure-based drug designapproaches has been beneficial towards accelerating the high-quality lead discoveryprocesses. The �3-adrenegic receptor (�3-AR) selectivity over �1- and �2-ARs is a primerequisite for successful therapeutics against obesity and type-II diabetes, since thesimultaneous activation of �1- and �2-ARs causes undesirable side effects, such asincreased heart rate. In view of this, a HVS study, consisting of pharmacophore modelling,
Figure 6. The schematic outline of the hierarchical virtual screening (HVS) protocol.
SAR and QSAR in Environmental Research 403
Dow
nloa
ded
by [
Tul
ane
Uni
vers
ity]
at 1
1:45
24
Sept
embe
r 20
13
docking and VS of the generated focussed virtual library, has been carried out to identifynovel high-affinity and selective �3-AR agonists. The best pharmacophore modelcomprising one H-bond donor, two HYs, one PI and one NI features has been developedand validated in terms of external set and ability of the pharmacophoric features tocomplement the active site amino acids of the homology modelled �3-AR. The focussedvirtual library has been generated considering the structure-based insights gained fromcomprehensive study focussing on the structural basis of �-AR subtype selectivity ofrepresentative agonists and antagonists. The HVS with the sequential use of the bestpharmacophore model and homology modelled �3-AR in the screening of the generatedfocussed library has led to the identification of potential virtual leads as novel high-affinityand selective �3-AR agonists.
Figure 7. Structures, predicted �3-AR agonistic activities and XP-GlideScores of the top 10 hits.
404 A.K. Saxena and K.K. Roy
Dow
nloa
ded
by [
Tul
ane
Uni
vers
ity]
at 1
1:45
24
Sept
embe
r 20
13
Supplementary material
The structures of the test set compounds and the pharmacophore mapping of virtual hits
are shown in the supplementary material.
Figure 8. (a) Depiction of the overlaid binding poses of the top 54 drug-like virtual hits as potential�3-AR agonists. Binding modes of the identified Hit1 (b), Hit2 (c), Hit3 (d), Hit4 (e) and Hit5 (f)within the active site of the homology-modelled �3-AR protein. The protein is shown as schematiccartoon form, and the active site residues are shown as blue carbon-coloured lines. The boundligands are shown as green carbon-coloured sticks.
SAR and QSAR in Environmental Research 405
Dow
nloa
ded
by [
Tul
ane
Uni
vers
ity]
at 1
1:45
24
Sept
embe
r 20
13
Acknowledgments
The author (K.K.R.) is thankful to the Council of Scientific and Industrial Research (CSIR), NewDelhi, for the financial assistance in the form of a fellowship and to Jawaharlal Nehru University(JNU), New Delhi, for the Ph.D. registration. The technical assistance of Mr. A.S. Kushwaha is alsogratefully acknowledged. CDRI Communication number: 8212.
References
[1] M.G. Ursino, V. Vasinaa, E. Raschia, F. Cremab, and F.D. Pontia, The �3-adrenoceptor as a
therapeutic target: Current perspectives, Pharmacol. Res. 59 (2009), pp. 221–234.[2] J.R.S. Arch, A.T. Ainsworth, M.A. Cawthorne, V. Piercy, M.V. Sennitt, V.E. Thody,
C. Wilson, and S. Wilson, Atypical �-adrenoceptor on brown adipocytes as target for anti-obesity
drugs, Nature 309 (1984), pp. 163–165.[3] B. Hu and L.L. Jennings, Orally bioavailable �3-adrenergic receptor agonists as potential
therapeutic agents for obesity and type-II diabetes, Prog. Med. Chem. 41 (2003), pp. 167–194.[4] N. Shakya, K.K. Roy, and A.K. Saxena, Substituted 1, 2, 3, 4-tetrahydroquinolin-6-
yloxypropanes as �3-adrenergic receptor agonists: Design, synthesis, biological evaluation and
pharmacophore modelling, Bioorg. Med. Chem. 17 (2009), pp. 830–847.
[5] K.K. Roy and A.K. Saxena, Structural basis for the �-adrenergic receptor subtype selectivity of
the representative agonists and antagonists, J. Chem. Inf. Model. 51 (2011), pp. 1405–1422.
[6] D.M. Rosenbaum, S.G. Rasmussen, and B.K. Kobilka, The structure and function of G-protein-
coupled receptors, Nature 459 (2009), pp. 356–363.[7] H. Geppert, M. Vogt, and J. Bajorath, Current trends in ligand-based virtual screening:
Molecular representations, data mining methods, new application areas, and performance
evaluation, J. Chem. Inf. Model. 50 (2010), pp. 205–216.
[8] S.S. Chaudhaery, K.K. Roy, N. Shakya, G. Saxena, S.R. Sammi, A. Nazir, C. Nath, and
A.K. Saxena, Novel carbamates as orally active acetylcholinesterase inhibitors found to improve
scopolamine-induced cognition impairment: Pharmacophore-based virtual screening, synthesis and
pharmacology, J. Med. Chem. 53 (2010), pp. 6490–6505.[9] P. Ripphausen, B. Nisius, L. Peltason, and J. Bajorath, Quo vadis, virtual screening? A
comprehensive survey of prospective applications, J. Med. Chem. 53 (2010), pp. 8461–8467.[10] K.K. Roy, S. Singh, and A.K. Saxena, Integration-mediated prediction enrichment of quantitative
model for Hsp90 inhibitors as anti-cancer agents: 3D-QSAR study, Mol. Divers. 15 (2011),
pp. 477–489.
[11] A.K. Gupta, S.S. Bhunia, V.M. Balaramnavar, and A.K. Saxena, Pharmacophore modelling,
molecular docking and virtual screening for EGFR (HER 1) tyrosine kinase inhibitors, SAR
QSAR Env. Res. 22 (2011), pp. 239–263.[12] S. Saxena, S.S. Chaudhaery, K. Varshney, and A.K. Saxena, Pharmacophore-based virtual
screening and docking studies on Hsp90 inhibitors, SAR QSAR Env. Res. 21 (2010), pp. 445–462.[13] A.K. Saxena, S. Saxena, and S.S. Chaudhaery, Molecular modelling and docking studies on heat
shock protein 90 (Hsp90) inhibitors, SAR QSAR Env. Res. 21 (2010), pp. 1–20.[14] H. Sun, Pharmacophore-based virtual screening, Curr. Med. Chem. 15 (2008), pp. 1018–1024.
[15] O. Nicolotti, T.F. Miscioscia, A. Carotti, F. Leonetti, and A. Carotti, An integrated approach to
ligand- and structure-based drug design: Development and application to a series of serine protease
inhibitors, J. Chem. Inf. Model. 48 (2008), pp. 1211–1226.[16] A.J.S. Knox, T. Price, M. Pawlak, G. Golfis, C.T. Flood, D. Fayne, D.C. Williams,
M.J. Meegan, and D.J. Lloyd, Integration of ligand and structure-based virtual screening for the
identification of the first dual targeting agent for heat shock protein 90 (Hsp90) and tubulin,
J. Med. Chem. 52 (2009), pp. 2177–2180.
406 A.K. Saxena and K.K. Roy
Dow
nloa
ded
by [
Tul
ane
Uni
vers
ity]
at 1
1:45
24
Sept
embe
r 20
13
[17] P. Prathipati and A.K. Saxena, Characterization of �3 adrenergic receptor: Determination of
pharmacophore and 3D QSAR model for �3 adrenergic receptor agonism, J. Comput. Aided Mol.
Des. 19 (2005), pp. 93–110.[18] F. Jin, C. Lu, X. Sun, W. Li, G. Liu, and Y. Tang, Insights into the binding modes of human �3-
adrenergic receptor agonists with ligand-based and receptor-based methods, Mol. Divers. 15
(2011), pp. 817–831.[19] M. Imanishi, Y. Tomishima, S. Itou, H. Hamashima, Y. Nakajima, K. Washizuka, M. Sakurai,
S. Matsui, E. Imamura, K. Ueshima, T. Yamamoto, N. Yamamoto, H. Ishikawa, K. Nakano,
N. Unami, K. Hamada, Y. Matsumura, F. Takamura, and K. Hattori, Discovery of a novel
series of biphenyl benzoic acid derivatives as potent and selective human �3-adrenergic receptor
agonists with good oral bioavailability. Part I, J. Med. Chem. 51 (2008), pp. 1925–1944.[20] M. Imanishi, Y. Nakajima, Y. Tomishima, H. Hamashima, K. Washizuka, M. Sakurai,
S. Matsui, E. Imamura, K. Ueshima, T. Yamamoto, N. Yamamoto, H. Ishikawa, K. Nakano,
N. Unami, K. Hamada, Y. Matsumura, F. Takamura, and K. Hattori, Discovery of a novel
series of benzoic acid derivatives as potent and selective human �3 adrenergic receptor agonists withgood oral bioavailability. 3. Phenylethanolaminotetraline (PEAT) skeleton containing biphenyl or
biphenyl ether moiety, J. Med. Chem. 51 (2008), pp. 4804–4822.[21] M. Imanishi, S. Itou, K. Washizuka, H. Hamashima, Y. Nakajima, T. Araki, Y. Tomishima,
M. Sakurai, S. Matsui, E. Imamura, K. Ueshima, T. Yamamoto, N. Yamamoto, H. Ishikawa,
K. Nakano, N. Unami, K. Hamada, Y. Matsumura, F. Takamura, and K. Hattori, Discovery of
a novel series of biphenyl benzoic acid derivatives as highly potent and selective human �3-adrenergic receptor agonists with good oral bioavailability. Part II, J. Med. Chem. 51 (2008),
pp. 4002–4020.
[22] K. Hattori, S. Toda, M. Imanishi, S. Itou, Y. Nakajima, K. Washizuka, T. Araki,
H. Hamashima, Y. Tomishima, M. Sakurai, S. Matsui, E. Imamura, K. Ueshima,
T. Yamamoto, N. Yamamoto, H. Ishikawa, K. Nakano, N. Unami, K. Hamada,
Y. Matsumura, and F. Takamura, Discovery of highly potent and selective biphenylacylsulfo-
namide-based �3-adrenergic receptor agonists and evaluation of physical properties as potential
overactive bladder therapies: Part 5, J. Med. Chem. 52 (2009), pp. 3063–3072.[23] Y. Nakajima, M. Imanishi, S. Itou, H. Hamashima, Y. Tomishima, K. Washizuka, M. Sakurai,
S. Matsui, E. Imamura, K. Ueshima, T. Yamamoto, N. Yamamoto, H. Ishikawa, K. Nakano,
N. Unami, K. Hamada, and K. Hattori, Discovery of novel series of benzoic acid derivatives
containing biphenyl ether moiety as potent and selective human �3-adrenergic receptor agonists:
Part IV, Bioorg. Med. Chem. Lett. 18 (2008), pp. 5037–5040.[24] Accelrys Discovery Studio, version 2.0; Accelrys Inc., San Diego, CA, 2007. http://
www.accelrys.com[25] Y. Kurogi and O.F. Guner, Pharmacophore modelling and three-dimensional database searching
for drug design using catalyst, Curr. Med. Chem. 8 (2001), pp. 1035–1055.
[26] P.W. Sprague, Automated chemical hypothesis generation and database searching with catalyst, in
Perspectives in Drug Discovery and Design, K. Muller, ed., ESCOM Science Publishers BV,
Leiden, Netherlands, 1995.[27] J. Sutter, O.F. Guner, R. Hoffman, H. Li, and M. Waldman, Effect of variable weight and
tolerances on predictive model generation, in Pharmacophore Perception, Development, and use in
Drug Design, O.F. Guner, ed., International University Line, La Jolla, CA, 1999.[28] CombiGlide, version 2.5; Schrodinger, LLC, New York, 2009. http://www.schrodinger.com[29] Schrodinger, version 8.0; Schrodinger, LLC, New York, 2005. http://www.schrodinger.com
[30] Glide, version 5.0; Schrodinger: LLC, New York, 2008. http://www.schrodinger.com[31] J.A. Ballesteros and H. Weinstein, Integrated methods for the construction of three dimensional
models and computational probing of structure-function relations in G-protein coupled receptors,
Methods Neurosci. 25 (1995), pp. 366–428.[32] The PyMOL Molecular Graphics System, version 1.3r1; Schrodinger, LLC, Portland, OR, 2010
http://www.schrodinger.com
SAR and QSAR in Environmental Research 407
Dow
nloa
ded
by [
Tul
ane
Uni
vers
ity]
at 1
1:45
24
Sept
embe
r 20
13