
Affinity and Specificity of Protein U1A-RNA Complex...
15
Affinity and Specificity of Protein U1A-RNA Complex Formation Based on an Additive Component Free Energy Model Bethany L. Kormos 1 ⁎, Yulia Benitex 1 , Anne M. Baranger 1,2 and David L. Beveridge 1 1 Chemistry Department and Molecular Biophysics Program, Wesleyan University, Middletown, CT 06459, USA 2 Department of Chemistry, University of Illinois at Urbana-Champaign, Urbana, IL 61801, USA An MM-GBSA computational protocol was used to investigate wild-type U1A-RNA and F56 U1A mutant experimental binding free energies. The trend in mutant binding free energies compared to wild-type is well- reproduced. Following application of a linear-response-like equation to scale the various energy components, the binding free energies agree quantitatively with observed experimental values. Conformational adapta- tion contributes to the binding free energy for both the protein and the RNA in these systems. Small differences in ΔGs are the result of different and sometimes quite large relative contributions from various energetic com- ponents. Residual free energy decomposition indicates differences not only at the site of mutation, but throughout the entire protein. MM-GBSA and ab initio calculations performed on model systems suggest that stacking interactions may nearly, but not completely, account for observed dif- ferences in mutant binding affinities. This study indicates that there may be different underlying causes of ostensibly similar experimentally ob- served binding affinities of different mutants, and thus recommends cau- tion in the interpretation of binding affinities and specificities purely by inspection. © 2007 Elsevier Ltd. All rights reserved. *Corresponding author Keywords: MM-PB(GB)SA; U1A; protein–RNA recognition; molecular dynamics; binding free energy Introduction The protein U1A is a component of the spliceo- some, which excises introns from pre-mRNA prior to gene expression in eukaryotes. 1 Fine control of complex formation between U1A and stem loop 2 (SL2) of U1 snRNA (U1A-RNA) has been studied via experiments involving U1A mutants and SL2 base replacements, and observed affinities (ΔG) and specificities (ΔΔG) have been reported for the wild-type system and a number of modified forms. 2–24 The results of these experiments have raised interesting and important questions about the nature of U1A-RNA complex formation at the molecular level and the relative contributions of various chemical forces to binding. U1A binds single-stranded RNA through one of the most common eukaryotic binding domains, the RNA recognition motif (RRM), also known as the RNA binding domain (RBD) or the ribonucleopro- tein (RNP) domain. 2 The general RRM structure is comprised of a βαββαβ sandwich fold that forms a four-stranded antiparallel β-sheet supported by two α-helices. 3 The N-terminal RRM of U1A binds SL2 of U1 snRNA and two adjacent internal loops in the 3′-untranslated region of its own pre-mRNA with high affinity and specificity. 4–6 All three target sites contain nearly identical sequences in the loop, AUUGCAC closed by a CG base-pair. The structure of the N-terminal RRM of U1A (residues 2–117) has been solved by NMR spectros- copy 7 and X-ray crystallography (residues 3–92), 8 and the complex of the N-terminal RRM of U1A (residues 2–97) with SL2 RNA (21 bases) has been Abbreviations used: SL2, stem-loop 2; RRM, RNA recognition motif; MM, molecular mechanics; PB, Poisson- Boltzman; MD, molecular dynamics; LR, linear response; GB, generalized Born. E-mail address of the corresponding author: [email protected] doi:10.1016/j.jmb.2007.06.003 J. Mol. Biol. (2007) 371, 1405–1419 0022-2836/$ - see front matter © 2007 Elsevier Ltd. All rights reserved.
Transcript of Affinity and Specificity of Protein U1A-RNA Complex...
doi:10.1016/j.jmb.2007.06.003 J. Mol. Biol. (2007) 371, 1405–1419
Affinity and Specificity of Protein U1A-RNA ComplexFormation Based on an Additive Component FreeEnergy Model
Bethany L. Kormos1⁎, Yulia Benitex1, Anne M. Baranger1,2
and David L. Beveridge1
1Chemistry Department andMolecular Biophysics Program,Wesleyan University,Middletown, CT 06459, USA2Department of Chemistry,University of Illinois atUrbana-Champaign, Urbana,IL 61801, USA
Abbreviations used: SL2, stem-loorecognition motif; MM, molecular mBoltzman; MD, molecular dynamicsGB, generalized Born.E-mail address of the correspondi
0022-2836/$ - see front matter © 2007 E
An MM-GBSA computational protocol was used to investigate wild-typeU1A-RNA and F56 U1A mutant experimental binding free energies. Thetrend in mutant binding free energies compared to wild-type is well-reproduced. Following application of a linear-response-like equation toscale the various energy components, the binding free energies agreequantitatively with observed experimental values. Conformational adapta-tion contributes to the binding free energy for both the protein and the RNAin these systems. Small differences in ΔGs are the result of different andsometimes quite large relative contributions from various energetic com-ponents. Residual free energy decomposition indicates differences not onlyat the site of mutation, but throughout the entire protein. MM-GBSA and abinitio calculations performed on model systems suggest that stackinginteractions may nearly, but not completely, account for observed dif-ferences in mutant binding affinities. This study indicates that there maybe different underlying causes of ostensibly similar experimentally ob-served binding affinities of different mutants, and thus recommends cau-tion in the interpretation of binding affinities and specificities purely byinspection.
© 2007 Elsevier Ltd. All rights reserved.
Keywords: MM-PB(GB)SA; U1A; protein–RNA recognition; moleculardynamics; binding free energy
*Corresponding authorIntroduction
The protein U1A is a component of the spliceo-some, which excises introns from pre-mRNA priorto gene expression in eukaryotes.1 Fine control ofcomplex formation between U1A and stem loop 2(SL2) of U1 snRNA (U1A-RNA) has been studied viaexperiments involving U1A mutants and SL2 basereplacements, and observed affinities (ΔG) andspecificities (ΔΔG) have been reported for thewild-type system and a number of modifiedforms.2–24 The results of these experiments haveraised interesting and important questions about the
p 2; RRM, RNAechanics; PB, Poisson-; LR, linear response;
ng author:
lsevier Ltd. All rights reserve
nature of U1A-RNA complex formation at themolecular level and the relative contributions ofvarious chemical forces to binding.U1A binds single-stranded RNA through one of
the most common eukaryotic binding domains, theRNA recognition motif (RRM), also known as theRNA binding domain (RBD) or the ribonucleopro-tein (RNP) domain.2 The general RRM structure iscomprised of a βαββαβ sandwich fold that forms afour-stranded antiparallel β-sheet supported by twoα-helices.3 The N-terminal RRM of U1A binds SL2of U1 snRNA and two adjacent internal loops in the3′-untranslated region of its own pre-mRNA withhigh affinity and specificity.4–6 All three target sitescontain nearly identical sequences in the loop,AUUGCAC closed by a CG base-pair.The structure of the N-terminal RRM of U1A
(residues 2–117) has been solved by NMR spectros-copy7 and X-ray crystallography (residues 3–92),8
and the complex of the N-terminal RRM of U1A(residues 2–97) with SL2 RNA (21 bases) has been
d.
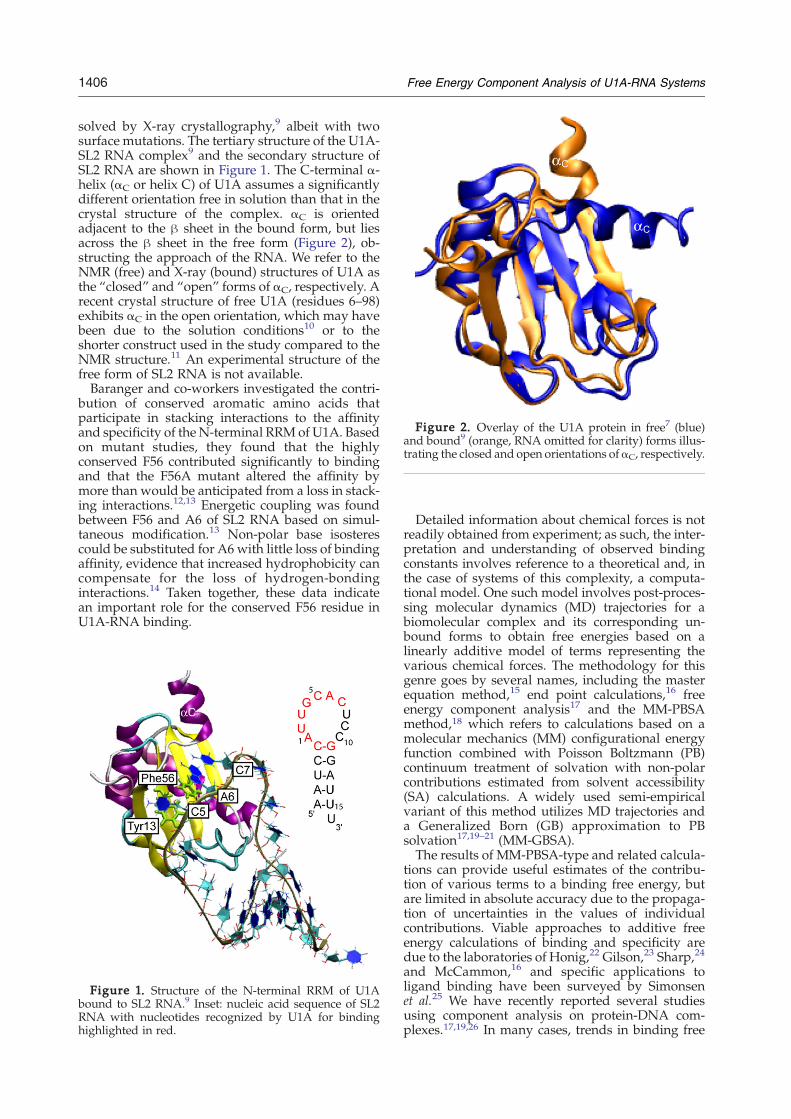
Figure 2. Overlay of the U1A protein in free7 (blue)and bound9 (orange, RNA omitted for clarity) forms illus-trating the closed and open orientations ofαC, respectively.
1406 Free Energy Component Analysis of U1A-RNA Systems
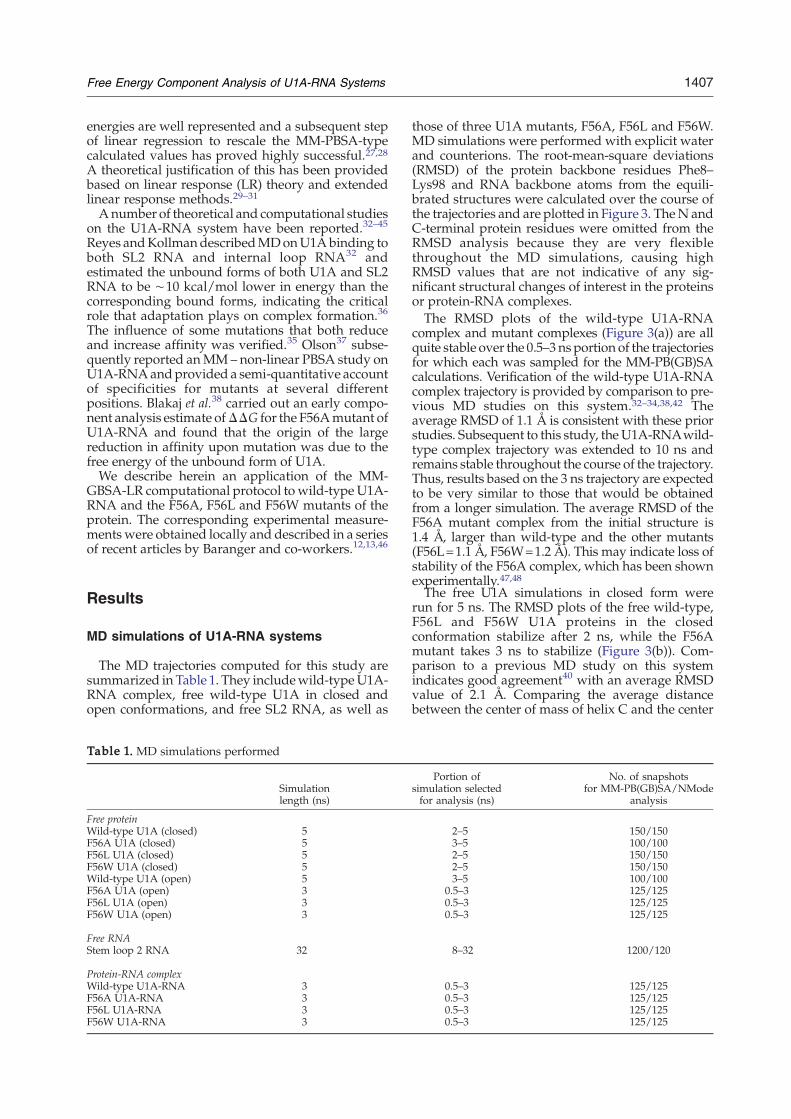
solved by X-ray crystallography,9 albeit with twosurface mutations. The tertiary structure of the U1A-SL2 RNA complex9 and the secondary structure ofSL2 RNA are shown in Figure 1. The C-terminal α-helix (αC or helix C) of U1A assumes a significantlydifferent orientation free in solution than that in thecrystal structure of the complex. αC is orientedadjacent to the β sheet in the bound form, but liesacross the β sheet in the free form (Figure 2), ob-structing the approach of the RNA. We refer to theNMR (free) and X-ray (bound) structures of U1A asthe “closed” and “open” forms of αC, respectively. Arecent crystal structure of free U1A (residues 6–98)exhibits αC in the open orientation, which may havebeen due to the solution conditions10 or to theshorter construct used in the study compared to theNMR structure.11 An experimental structure of thefree form of SL2 RNA is not available.Baranger and co-workers investigated the contri-
bution of conserved aromatic amino acids thatparticipate in stacking interactions to the affinityand specificity of the N-terminal RRM of U1A. Basedon mutant studies, they found that the highlyconserved F56 contributed significantly to bindingand that the F56A mutant altered the affinity bymore than would be anticipated from a loss in stack-ing interactions.12,13 Energetic coupling was foundbetween F56 and A6 of SL2 RNA based on simul-taneous modification.13 Non-polar base isosterescould be substituted for A6 with little loss of bindingaffinity, evidence that increased hydrophobicity cancompensate for the loss of hydrogen-bondinginteractions.14 Taken together, these data indicatean important role for the conserved F56 residue inU1A-RNA binding.
Figure 1. Structure of the N-terminal RRM of U1Abound to SL2 RNA.9 Inset: nucleic acid sequence of SL2RNA with nucleotides recognized by U1A for bindinghighlighted in red.
Detailed information about chemical forces is notreadily obtained from experiment; as such, the inter-pretation and understanding of observed bindingconstants involves reference to a theoretical and, inthe case of systems of this complexity, a computa-tional model. One such model involves post-proces-sing molecular dynamics (MD) trajectories for abiomolecular complex and its corresponding un-bound forms to obtain free energies based on alinearly additive model of terms representing thevarious chemical forces. The methodology for thisgenre goes by several names, including the masterequation method,15 end point calculations,16 freeenergy component analysis17 and the MM-PBSAmethod,18 which refers to calculations based on amolecular mechanics (MM) configurational energyfunction combined with Poisson Boltzmann (PB)continuum treatment of solvation with non-polarcontributions estimated from solvent accessibility(SA) calculations. A widely used semi-empiricalvariant of this method utilizes MD trajectories anda Generalized Born (GB) approximation to PBsolvation17,19–21 (MM-GBSA).The results of MM-PBSA-type and related calcula-
tions can provide useful estimates of the contribu-tion of various terms to a binding free energy, butare limited in absolute accuracy due to the propaga-tion of uncertainties in the values of individualcontributions. Viable approaches to additive freeenergy calculations of binding and specificity aredue to the laboratories of Honig,22 Gilson,23 Sharp,24
and McCammon,16 and specific applications toligand binding have been surveyed by Simonsenet al.25 We have recently reported several studiesusing component analysis on protein-DNA com-plexes.17,19,26 In many cases, trends in binding free
1407Free Energy Component Analysis of U1A-RNA Systems
energies are well represented and a subsequent stepof linear regression to rescale the MM-PBSA-typecalculated values has proved highly successful.27,28A theoretical justification of this has been providedbased on linear response (LR) theory and extendedlinear response methods.29–31Anumber of theoretical and computational studies
on the U1A-RNA system have been reported.32–45
Reyes andKollmandescribedMDonU1Abinding toboth SL2 RNA and internal loop RNA32 andestimated the unbound forms of both U1A and SL2RNA to be ∼10 kcal/mol lower in energy than thecorresponding bound forms, indicating the criticalrole that adaptation plays on complex formation.36
The influence of some mutations that both reduceand increase affinity was verified.35 Olson37 subse-quently reported anMM – non-linear PBSA study onU1A-RNAandprovided a semi-quantitative accountof specificities for mutants at several differentpositions. Blakaj et al.38 carried out an early compo-nent analysis estimate ofΔΔG for the F56Amutant ofU1A-RNA and found that the origin of the largereduction in affinity upon mutation was due to thefree energy of the unbound form of U1A.We describe herein an application of the MM-
GBSA-LR computational protocol to wild-type U1A-RNA and the F56A, F56L and F56W mutants of theprotein. The corresponding experimental measure-ments were obtained locally and described in a seriesof recent articles by Baranger and co-workers.12,13,46
Results
MD simulations of U1A-RNA systems
The MD trajectories computed for this study aresummarized in Table 1. They includewild-typeU1A-RNA complex, free wild-type U1A in closed andopen conformations, and free SL2 RNA, as well as
Table 1. MD simulations performed
Simulationlength (ns)
Free proteinWild-type U1A (closed) 5F56A U1A (closed) 5F56L U1A (closed) 5F56W U1A (closed) 5Wild-type U1A (open) 5F56A U1A (open) 3F56L U1A (open) 3F56W U1A (open) 3
Free RNAStem loop 2 RNA 32
Protein-RNA complexWild-type U1A-RNA 3F56A U1A-RNA 3F56L U1A-RNA 3F56W U1A-RNA 3
those of three U1A mutants, F56A, F56L and F56W.MD simulations were performed with explicit waterand counterions. The root-mean-square deviations(RMSD) of the protein backbone residues Phe8–Lys98 and RNA backbone atoms from the equili-brated structures were calculated over the course ofthe trajectories and are plotted in Figure 3. TheN andC-terminal protein residues were omitted from theRMSD analysis because they are very flexiblethroughout the MD simulations, causing highRMSD values that are not indicative of any sig-nificant structural changes of interest in the proteinsor protein-RNA complexes.The RMSD plots of the wild-type U1A-RNA
complex and mutant complexes (Figure 3(a)) are allquite stable over the 0.5–3 ns portion of the trajectoriesfor which each was sampled for the MM-PB(GB)SAcalculations. Verification of the wild-type U1A-RNAcomplex trajectory is provided by comparison to pre-vious MD studies on this system.32–34,38,42 Theaverage RMSD of 1.1 Å is consistent with these priorstudies. Subsequent to this study, the U1A-RNAwild-type complex trajectory was extended to 10 ns andremains stable throughout the course of the trajectory.Thus, results based on the 3 ns trajectory are expectedto be very similar to those that would be obtainedfrom a longer simulation. The average RMSD of theF56A mutant complex from the initial structure is1.4 Å, larger than wild-type and the other mutants(F56L=1.1 Å, F56W=1.2 Å). This may indicate loss ofstability of the F56A complex, which has been shownexperimentally.47,48The free U1A simulations in closed form were
run for 5 ns. The RMSD plots of the free wild-type,F56L and F56W U1A proteins in the closedconformation stabilize after 2 ns, while the F56Amutant takes 3 ns to stabilize (Figure 3(b)). Com-parison to a previous MD study on this systemindicates good agreement40 with an average RMSDvalue of 2.1 Å. Comparing the average distancebetween the center of mass of helix C and the center
Portion ofsimulation selectedfor analysis (ns)
No. of snapshotsfor MM-PB(GB)SA/NMode
analysis
2–5 150/1503–5 100/1002–5 150/1502–5 150/1503–5 100/100
0.5–3 125/1250.5–3 125/1250.5–3 125/125
8–32 1200/120
0.5–3 125/1250.5–3 125/1250.5–3 125/1250.5–3 125/125
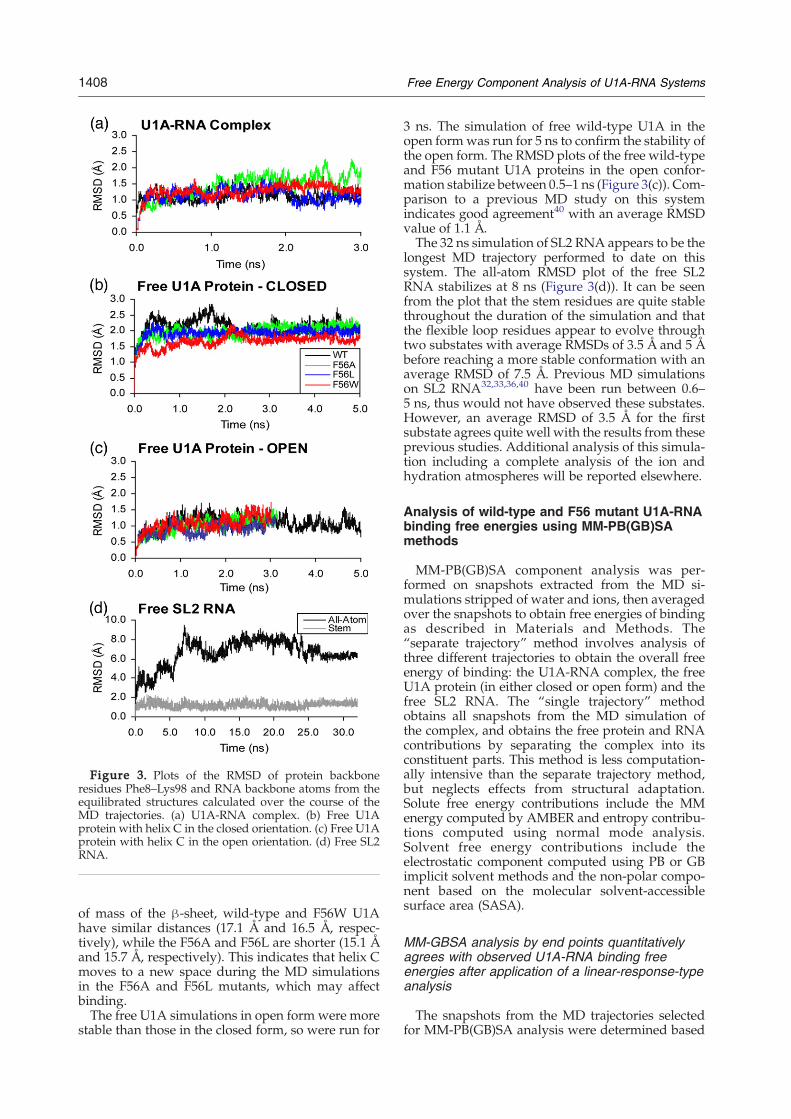
Figure 3. Plots of the RMSD of protein backboneresidues Phe8–Lys98 and RNA backbone atoms from theequilibrated structures calculated over the course of theMD trajectories. (a) U1A-RNA complex. (b) Free U1Aprotein with helix C in the closed orientation. (c) Free U1Aprotein with helix C in the open orientation. (d) Free SL2RNA.
1408 Free Energy Component Analysis of U1A-RNA Systems
of mass of the β-sheet, wild-type and F56W U1Ahave similar distances (17.1 Å and 16.5 Å, respec-tively), while the F56A and F56L are shorter (15.1 Åand 15.7 Å, respectively). This indicates that helix Cmoves to a new space during the MD simulationsin the F56A and F56L mutants, which may affectbinding.The free U1A simulations in open form were more
stable than those in the closed form, so were run for
3 ns. The simulation of free wild-type U1A in theopen formwas run for 5 ns to confirm the stability ofthe open form. The RMSD plots of the free wild-typeand F56 mutant U1A proteins in the open confor-mation stabilize between 0.5–1 ns (Figure 3(c)). Com-parison to a previous MD study on this systemindicates good agreement40 with an average RMSDvalue of 1.1 Å.The 32 ns simulation of SL2 RNA appears to be the
longest MD trajectory performed to date on thissystem. The all-atom RMSD plot of the free SL2RNA stabilizes at 8 ns (Figure 3(d)). It can be seenfrom the plot that the stem residues are quite stablethroughout the duration of the simulation and thatthe flexible loop residues appear to evolve throughtwo substates with average RMSDs of 3.5 Å and 5 Åbefore reaching a more stable conformation with anaverage RMSD of 7.5 Å. Previous MD simulationson SL2 RNA32,33,36,40 have been run between 0.6–5 ns, thus would not have observed these substates.However, an average RMSD of 3.5 Å for the firstsubstate agrees quite well with the results from theseprevious studies. Additional analysis of this simula-tion including a complete analysis of the ion andhydration atmospheres will be reported elsewhere.
Analysis of wild-type and F56 mutant U1A-RNAbinding free energies using MM-PB(GB)SAmethods
MM-PB(GB)SA component analysis was per-formed on snapshots extracted from the MD si-mulations stripped of water and ions, then averagedover the snapshots to obtain free energies of bindingas described in Materials and Methods. The“separate trajectory” method involves analysis ofthree different trajectories to obtain the overall freeenergy of binding: the U1A-RNA complex, the freeU1A protein (in either closed or open form) and thefree SL2 RNA. The “single trajectory” methodobtains all snapshots from the MD simulation ofthe complex, and obtains the free protein and RNAcontributions by separating the complex into itsconstituent parts. This method is less computation-ally intensive than the separate trajectory method,but neglects effects from structural adaptation.Solute free energy contributions include the MMenergy computed by AMBER and entropy contribu-tions computed using normal mode analysis.Solvent free energy contributions include theelectrostatic component computed using PB or GBimplicit solvent methods and the non-polar compo-nent based on the molecular solvent-accessiblesurface area (SASA).
MM-GBSA analysis by end points quantitativelyagrees with observed U1A-RNA binding freeenergies after application of a linear-response-typeanalysis
The snapshots from the MD trajectories selectedfor MM-PB(GB)SA analysis were determined based
1409Free Energy Component Analysis of U1A-RNA Systems
on stabilization of the RMSD plots (Figure 3) and arereported in Table 1. MM-PB(GB)SA binding freeenergies were calculated as described in Materialsand Methods. The electrostatic contribution to thesolvation free energy (Ges in equation (8)) wascalculated using PB as implemented in the pbsaprogram in AMBER 8 as well as a number of GBmethods (see Materials and Methods). Upon com-parison of the computed binding free energies to theexperimental values, the GBOBC(I) method49,50 pro-vided the most reasonable overall binding freeenergies in conjunction with normal mode analysis.The correct trends for the binding free energies ofmutants are observed by all of the GB methods,however GBOBC(I) performs best, even compared toPB (results not shown). As such, analysis through-out the remainder of this article pertains to theresults obtained using the GBOBC(I) method.Computed MM-GBSA binding free energies for
wild-type and F56 mutant U1A-RNA systems usingboth the single trajectory and separate trajectorymethods are reported in Table 2. Numbers are re-ported using either the closed or open form of freeU1A protein in the separate trajectory method. ΔGsrelative to wild-type are indicated in parentheses foreach system. In all cases, the computed free energiesof binding for the U1A mutants to SL2 RNA followthe trend of the experimental binding free energiescompared to the wild-type system. However, thebinding free energies are overestimated by MM-GBSA, a common result that has been seen in otherstudies.20,36 The standard errors (σ) reported in Table2 are comparable to those seen in other similar MM-GBSA studies20,36 and are generally smaller than theΔΔGs for the mutants compared to the wild-typesystem. This indicates that the trend in binding freeenergies compared to the experimental data is up-held upon taking into account the standard error foreach system.The differences in the binding free energies be-
tween the single trajectory and separate trajectorymethods stems from conformational adaptation.The free energies of the bound conformations ofU1A protein and SL2 RNA from the single tra-jectory method are expected to be higher than thoseof the free conformations from the separate trajec-tories. As such, the free energies of binding com-puted from separate trajectories should be smallerthan those calculated from the single trajectory
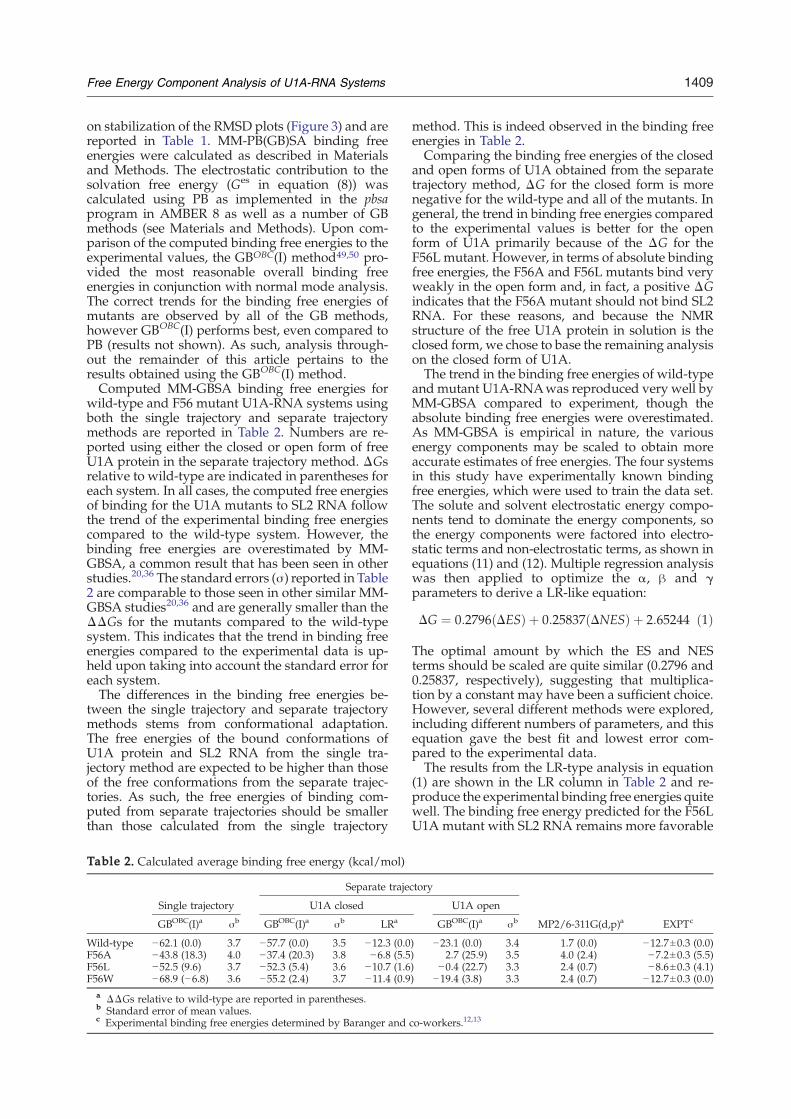
Table 2. Calculated average binding free energy (kcal/mol)
Separate traje
Single trajectory U1A closed
GBOBC(I)a σb GBOBC(I)a σb LRa
Wild-type −62.1 (0.0) 3.7 −57.7 (0.0) 3.5 −12.3 (0.0F56A −43.8 (18.3) 4.0 −37.4 (20.3) 3.8 −6.8 (5.5F56L −52.5 (9.6) 3.7 −52.3 (5.4) 3.6 −10.7 (1.6F56W −68.9 (−6.8) 3.6 −55.2 (2.4) 3.7 −11.4 (0.9
a ΔΔGs relative to wild-type are reported in parentheses.b Standard error of mean values.c Experimental binding free energies determined by Baranger and
method. This is indeed observed in the binding freeenergies in Table 2.Comparing the binding free energies of the closed
and open forms of U1A obtained from the separatetrajectory method, ΔG for the closed form is morenegative for the wild-type and all of the mutants. Ingeneral, the trend in binding free energies comparedto the experimental values is better for the openform of U1A primarily because of the ΔG for theF56L mutant. However, in terms of absolute bindingfree energies, the F56A and F56L mutants bind veryweakly in the open form and, in fact, a positive ΔGindicates that the F56A mutant should not bind SL2RNA. For these reasons, and because the NMRstructure of the free U1A protein in solution is theclosed form, we chose to base the remaining analysison the closed form of U1A.The trend in the binding free energies of wild-type
and mutant U1A-RNAwas reproduced very well byMM-GBSA compared to experiment, though theabsolute binding free energies were overestimated.As MM-GBSA is empirical in nature, the variousenergy components may be scaled to obtain moreaccurate estimates of free energies. The four systemsin this study have experimentally known bindingfree energies, which were used to train the data set.The solute and solvent electrostatic energy compo-nents tend to dominate the energy components, sothe energy components were factored into electro-static terms and non-electrostatic terms, as shown inequations (11) and (12). Multiple regression analysiswas then applied to optimize the α, β and γparameters to derive a LR-like equation:
DG ¼ 0:2796ðDESÞ þ 0:25837ðDNESÞ þ 2:65244 ð1Þ
The optimal amount by which the ES and NESterms should be scaled are quite similar (0.2796 and0.25837, respectively), suggesting that multiplica-tion by a constant may have been a sufficient choice.However, several different methods were explored,including different numbers of parameters, and thisequation gave the best fit and lowest error com-pared to the experimental data.The results from the LR-type analysis in equation
(1) are shown in the LR column in Table 2 and re-produce the experimental binding free energies quitewell. The binding free energy predicted for the F56LU1A mutant with SL2 RNA remains more favorable
ctory
U1A open
GBOBC(I)a σb MP2/6-311G(d,p)a EXPTc
) −23.1 (0.0) 3.4 1.7 (0.0) −12.7±0.3 (0.0)) 2.7 (25.9) 3.5 4.0 (2.4) −7.2±0.3 (5.5)) −0.4 (22.7) 3.3 2.4 (0.7) −8.6±0.3 (4.1)) −19.4 (3.8) 3.3 2.4 (0.7) −12.7±0.3 (0.0)
co-workers.12,13
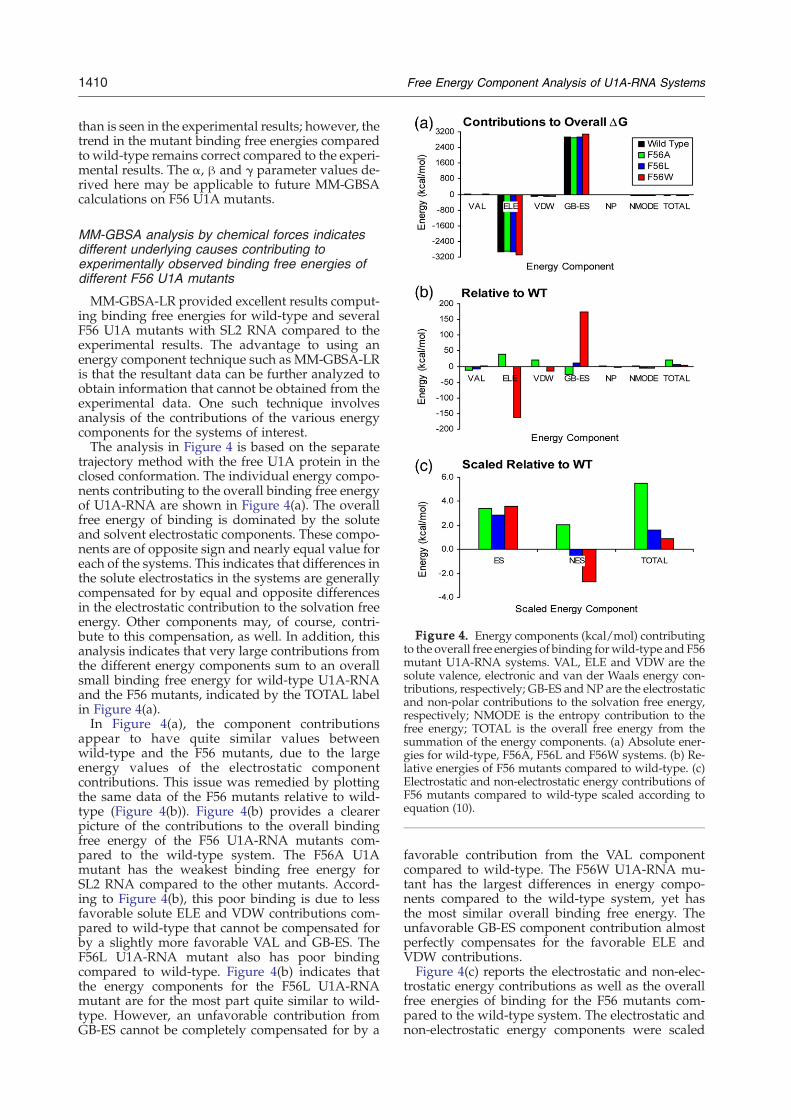
Figure 4. Energy components (kcal/mol) contributingto the overall free energies of binding forwild-type and F56mutant U1A-RNA systems. VAL, ELE and VDW are thesolute valence, electronic and van der Waals energy con-tributions, respectively; GB-ES andNP are the electrostaticand non-polar contributions to the solvation free energy,respectively; NMODE is the entropy contribution to thefree energy; TOTAL is the overall free energy from thesummation of the energy components. (a) Absolute ener-gies for wild-type, F56A, F56L and F56W systems. (b) Re-lative energies of F56 mutants compared to wild-type. (c)Electrostatic and non-electrostatic energy contributions ofF56 mutants compared to wild-type scaled according toequation (10).
1410 Free Energy Component Analysis of U1A-RNA Systems
than is seen in the experimental results; however, thetrend in the mutant binding free energies comparedto wild-type remains correct compared to the experi-mental results. The α, β and γ parameter values de-rived here may be applicable to future MM-GBSAcalculations on F56 U1A mutants.
MM-GBSA analysis by chemical forces indicatesdifferent underlying causes contributing toexperimentally observed binding free energies ofdifferent F56 U1A mutants
MM-GBSA-LR provided excellent results comput-ing binding free energies for wild-type and severalF56 U1A mutants with SL2 RNA compared to theexperimental results. The advantage to using anenergy component technique such as MM-GBSA-LRis that the resultant data can be further analyzed toobtain information that cannot be obtained from theexperimental data. One such technique involvesanalysis of the contributions of the various energycomponents for the systems of interest.The analysis in Figure 4 is based on the separate
trajectory method with the free U1A protein in theclosed conformation. The individual energy compo-nents contributing to the overall binding free energyof U1A-RNA are shown in Figure 4(a). The overallfree energy of binding is dominated by the soluteand solvent electrostatic components. These compo-nents are of opposite sign and nearly equal value foreach of the systems. This indicates that differences inthe solute electrostatics in the systems are generallycompensated for by equal and opposite differencesin the electrostatic contribution to the solvation freeenergy. Other components may, of course, contri-bute to this compensation, as well. In addition, thisanalysis indicates that very large contributions fromthe different energy components sum to an overallsmall binding free energy for wild-type U1A-RNAand the F56 mutants, indicated by the TOTAL labelin Figure 4(a).In Figure 4(a), the component contributions
appear to have quite similar values betweenwild-type and the F56 mutants, due to the largeenergy values of the electrostatic componentcontributions. This issue was remedied by plottingthe same data of the F56 mutants relative to wild-type (Figure 4(b)). Figure 4(b) provides a clearerpicture of the contributions to the overall bindingfree energy of the F56 U1A-RNA mutants com-pared to the wild-type system. The F56A U1Amutant has the weakest binding free energy forSL2 RNA compared to the other mutants. Accord-ing to Figure 4(b), this poor binding is due to lessfavorable solute ELE and VDW contributions com-pared to wild-type that cannot be compensated forby a slightly more favorable VAL and GB-ES. TheF56L U1A-RNA mutant also has poor bindingcompared to wild-type. Figure 4(b) indicates thatthe energy components for the F56L U1A-RNAmutant are for the most part quite similar to wild-type. However, an unfavorable contribution fromGB-ES cannot be completely compensated for by a
favorable contribution from the VAL componentcompared to wild-type. The F56W U1A-RNA mu-tant has the largest differences in energy compo-nents compared to the wild-type system, yet hasthe most similar overall binding free energy. Theunfavorable GB-ES component contribution almostperfectly compensates for the favorable ELE andVDW contributions.Figure 4(c) reports the electrostatic and non-elec-
trostatic energy contributions as well as the overallfree energies of binding for the F56 mutants com-pared to the wild-type system. The electrostatic andnon-electrostatic energy components were scaled
1411Free Energy Component Analysis of U1A-RNA Systems
using the α and β parameters, respectively, fromequation (1). This graph indicates that the F56A sys-tem has the lowest binding free energy of all of themutants because both the ES and NES contributionsare unfavorable compared to wild-type. This is incontrast to the F56L and F56W systems, which in-dicate unfavorable ES contributions that are com-pensated for by favorable NES contributionscompared to the wild-type system. For the F56Wsystem, the ES and NES contributions are nearlyequal in magnitude and opposite in sign, whereasfor the F56L system, the favorable NES contributionis not large enough to compensate completely forthe unfavorable ES contribution.Figure 5 plots the energy components of SL2 RNA
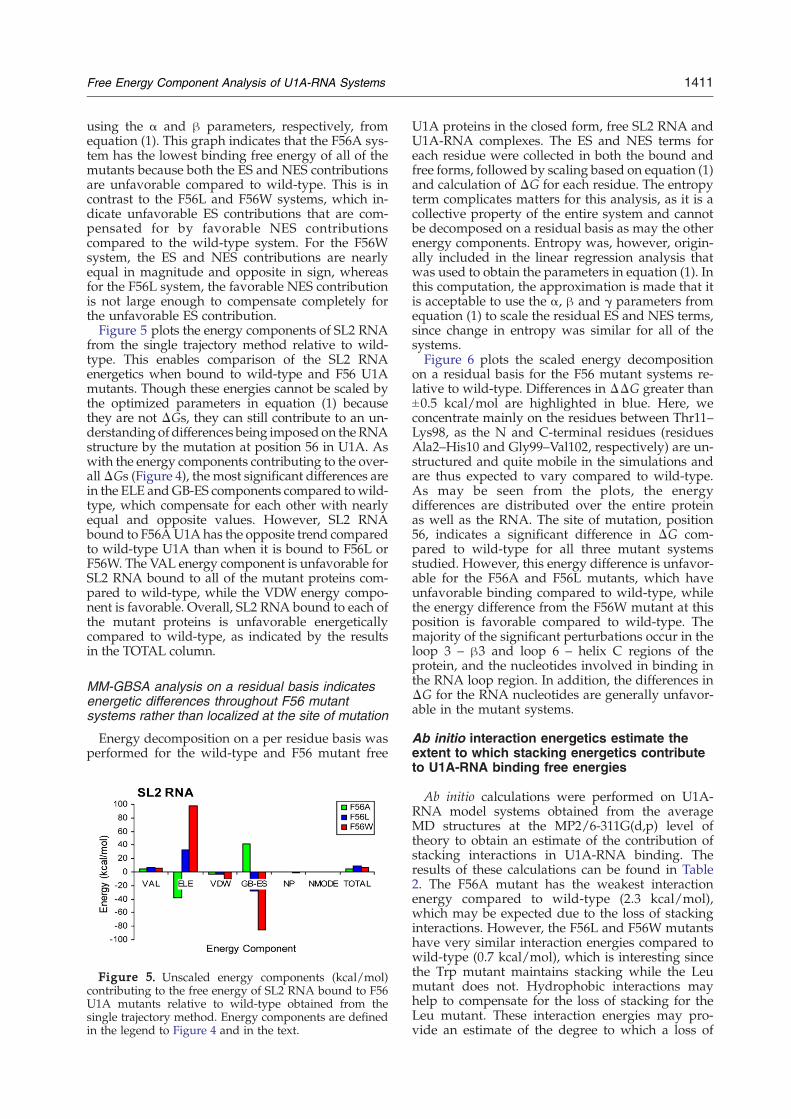
from the single trajectory method relative to wild-type. This enables comparison of the SL2 RNAenergetics when bound to wild-type and F56 U1Amutants. Though these energies cannot be scaled bythe optimized parameters in equation (1) becausethey are not ΔGs, they can still contribute to an un-derstanding of differences being imposed on the RNAstructure by the mutation at position 56 in U1A. Aswith the energy components contributing to the over-allΔGs (Figure 4), the most significant differences arein the ELE andGB-ES components compared towild-type, which compensate for each other with nearlyequal and opposite values. However, SL2 RNAbound to F56AU1A has the opposite trend comparedto wild-type U1A than when it is bound to F56L orF56W. The VAL energy component is unfavorable forSL2 RNA bound to all of the mutant proteins com-pared to wild-type, while the VDW energy compo-nent is favorable. Overall, SL2 RNA bound to each ofthe mutant proteins is unfavorable energeticallycompared to wild-type, as indicated by the resultsin the TOTAL column.
MM-GBSA analysis on a residual basis indicatesenergetic differences throughout F56 mutantsystems rather than localized at the site of mutation
Energy decomposition on a per residue basis wasperformed for the wild-type and F56 mutant free
Figure 5. Unscaled energy components (kcal/mol)contributing to the free energy of SL2 RNA bound to F56U1A mutants relative to wild-type obtained from thesingle trajectory method. Energy components are definedin the legend to Figure 4 and in the text.
U1A proteins in the closed form, free SL2 RNA andU1A-RNA complexes. The ES and NES terms foreach residue were collected in both the bound andfree forms, followed by scaling based on equation (1)and calculation of ΔG for each residue. The entropyterm complicates matters for this analysis, as it is acollective property of the entire system and cannotbe decomposed on a residual basis as may the otherenergy components. Entropy was, however, origin-ally included in the linear regression analysis thatwas used to obtain the parameters in equation (1). Inthis computation, the approximation is made that itis acceptable to use the α, β and γ parameters fromequation (1) to scale the residual ES and NES terms,since change in entropy was similar for all of thesystems.Figure 6 plots the scaled energy decomposition
on a residual basis for the F56 mutant systems re-lative to wild-type. Differences in ΔΔG greater than±0.5 kcal/mol are highlighted in blue. Here, weconcentrate mainly on the residues between Thr11–Lys98, as the N and C-terminal residues (residuesAla2–His10 and Gly99–Val102, respectively) are un-structured and quite mobile in the simulations andare thus expected to vary compared to wild-type.As may be seen from the plots, the energydifferences are distributed over the entire proteinas well as the RNA. The site of mutation, position56, indicates a significant difference in ΔG com-pared to wild-type for all three mutant systemsstudied. However, this energy difference is unfavor-able for the F56A and F56L mutants, which haveunfavorable binding compared to wild-type, whilethe energy difference from the F56W mutant at thisposition is favorable compared to wild-type. Themajority of the significant perturbations occur in theloop 3 – β3 and loop 6 – helix C regions of theprotein, and the nucleotides involved in binding inthe RNA loop region. In addition, the differences inΔG for the RNA nucleotides are generally unfavor-able in the mutant systems.
Ab initio interaction energetics estimate theextent to which stacking energetics contributeto U1A-RNA binding free energies
Ab initio calculations were performed on U1A-RNA model systems obtained from the averageMD structures at the MP2/6-311G(d,p) level oftheory to obtain an estimate of the contribution ofstacking interactions in U1A-RNA binding. Theresults of these calculations can be found in Table2. The F56A mutant has the weakest interactionenergy compared to wild-type (2.3 kcal/mol),which may be expected due to the loss of stackinginteractions. However, the F56L and F56W mutantshave very similar interaction energies compared towild-type (0.7 kcal/mol), which is interesting sincethe Trp mutant maintains stacking while the Leumutant does not. Hydrophobic interactions mayhelp to compensate for the loss of stacking for theLeu mutant. These interaction energies may pro-vide an estimate of the degree to which a loss of
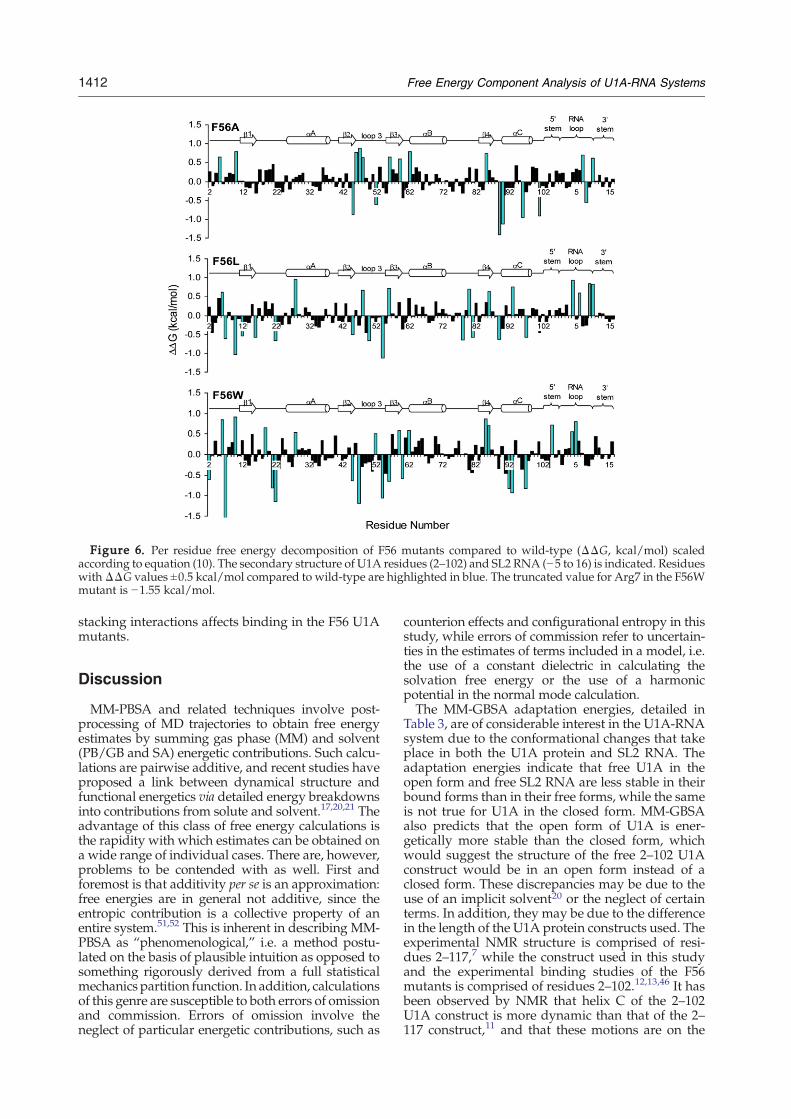
Figure 6. Per residue free energy decomposition of F56 mutants compared to wild-type (ΔΔG, kcal/mol) scaledaccording to equation (10). The secondary structure of U1A residues (2–102) and SL2 RNA (−5 to 16) is indicated. ResidueswithΔΔG values ±0.5 kcal/mol compared to wild-type are highlighted in blue. The truncated value for Arg7 in the F56Wmutant is −1.55 kcal/mol.
1412 Free Energy Component Analysis of U1A-RNA Systems
stacking interactions affects binding in the F56 U1Amutants.
Discussion
MM-PBSA and related techniques involve post-processing of MD trajectories to obtain free energyestimates by summing gas phase (MM) and solvent(PB/GB and SA) energetic contributions. Such calcu-lations are pairwise additive, and recent studies haveproposed a link between dynamical structure andfunctional energetics via detailed energy breakdownsinto contributions from solute and solvent.17,20,21 Theadvantage of this class of free energy calculations isthe rapidity with which estimates can be obtained ona wide range of individual cases. There are, however,problems to be contended with as well. First andforemost is that additivity per se is an approximation:free energies are in general not additive, since theentropic contribution is a collective property of anentire system.51,52 This is inherent in describing MM-PBSA as “phenomenological,” i.e. a method postu-lated on the basis of plausible intuition as opposed tosomething rigorously derived from a full statisticalmechanics partition function. In addition, calculationsof this genre are susceptible to both errors of omissionand commission. Errors of omission involve theneglect of particular energetic contributions, such as
counterion effects and configurational entropy in thisstudy, while errors of commission refer to uncertain-ties in the estimates of terms included in a model, i.e.the use of a constant dielectric in calculating thesolvation free energy or the use of a harmonicpotential in the normal mode calculation.The MM-GBSA adaptation energies, detailed in
Table 3, are of considerable interest in the U1A-RNAsystem due to the conformational changes that takeplace in both the U1A protein and SL2 RNA. Theadaptation energies indicate that free U1A in theopen form and free SL2 RNA are less stable in theirbound forms than in their free forms, while the sameis not true for U1A in the closed form. MM-GBSAalso predicts that the open form of U1A is ener-getically more stable than the closed form, whichwould suggest the structure of the free 2–102 U1Aconstruct would be in an open form instead of aclosed form. These discrepancies may be due to theuse of an implicit solvent20 or the neglect of certainterms. In addition, they may be due to the differencein the length of the U1A protein constructs used. Theexperimental NMR structure is comprised of resi-dues 2–117,7 while the construct used in this studyand the experimental binding studies of the F56mutants is comprised of residues 2–102.12,13,46 It hasbeen observed by NMR that helix C of the 2–102U1A construct is more dynamic than that of the 2–117 construct,11 and that these motions are on the
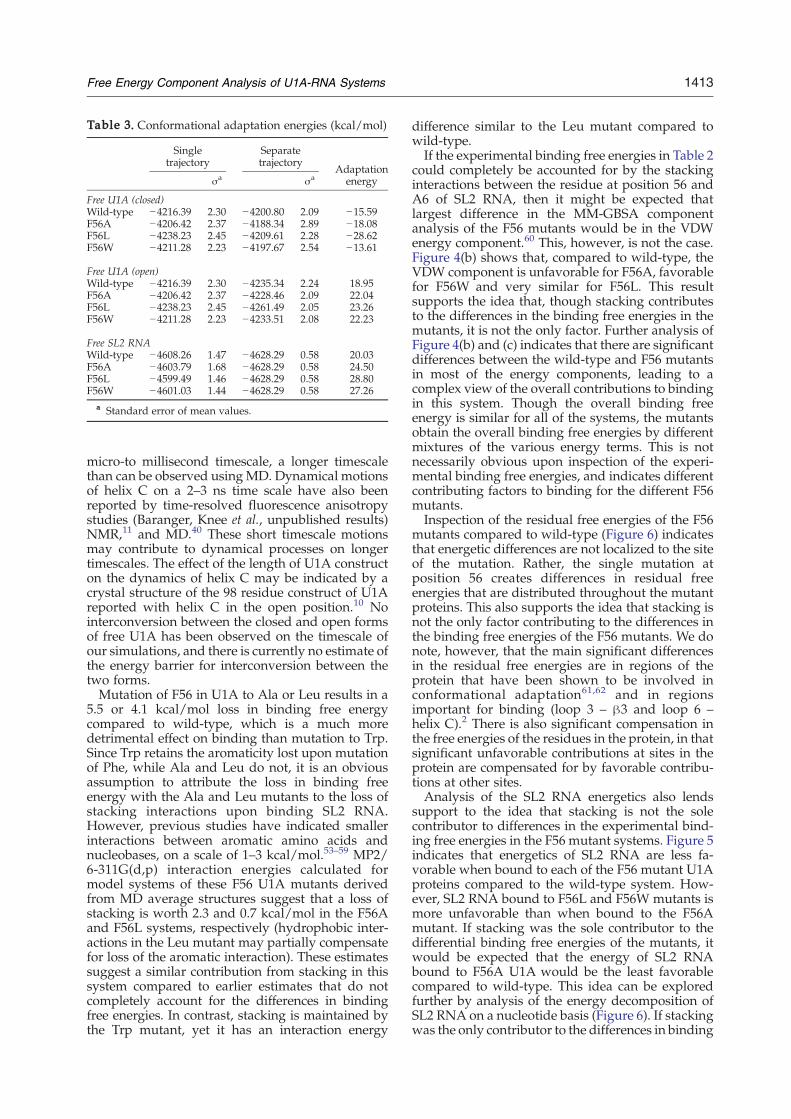
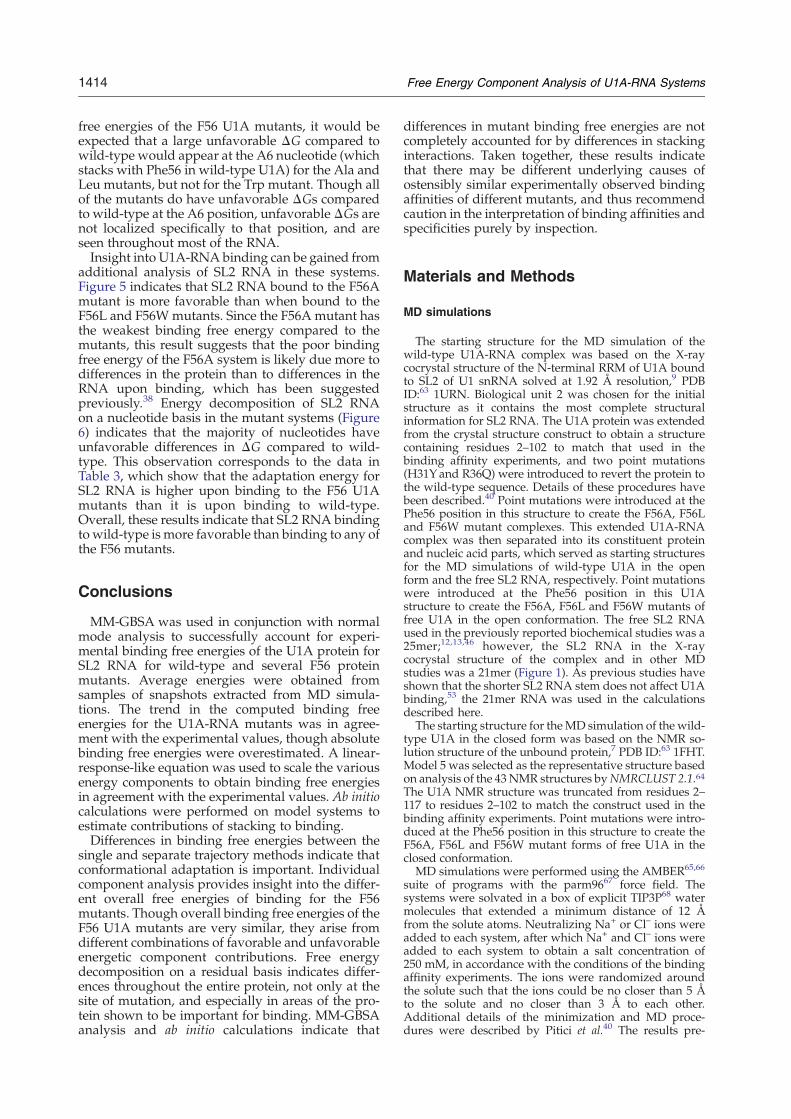
Table 3. Conformational adaptation energies (kcal/mol)
Singletrajectory
Separatetrajectory
Adaptationenergyσa σa
Free U1A (closed)Wild-type −4216.39 2.30 −4200.80 2.09 −15.59F56A −4206.42 2.37 −4188.34 2.89 −18.08F56L −4238.23 2.45 −4209.61 2.28 −28.62F56W −4211.28 2.23 −4197.67 2.54 −13.61
Free U1A (open)Wild-type −4216.39 2.30 −4235.34 2.24 18.95F56A −4206.42 2.37 −4228.46 2.09 22.04F56L −4238.23 2.45 −4261.49 2.05 23.26F56W −4211.28 2.23 −4233.51 2.08 22.23
Free SL2 RNAWild-type −4608.26 1.47 −4628.29 0.58 20.03F56A −4603.79 1.68 −4628.29 0.58 24.50F56L −4599.49 1.46 −4628.29 0.58 28.80F56W −4601.03 1.44 −4628.29 0.58 27.26
a Standard error of mean values.
1413Free Energy Component Analysis of U1A-RNA Systems
micro-to millisecond timescale, a longer timescalethan can be observed using MD. Dynamical motionsof helix C on a 2–3 ns time scale have also beenreported by time-resolved fluorescence anisotropystudies (Baranger, Knee et al., unpublished results)NMR,11 and MD.40 These short timescale motionsmay contribute to dynamical processes on longertimescales. The effect of the length of U1A constructon the dynamics of helix C may be indicated by acrystal structure of the 98 residue construct of U1Areported with helix C in the open position.10 Nointerconversion between the closed and open formsof free U1A has been observed on the timescale ofour simulations, and there is currently no estimate ofthe energy barrier for interconversion between thetwo forms.Mutation of F56 in U1A to Ala or Leu results in a
5.5 or 4.1 kcal/mol loss in binding free energycompared to wild-type, which is a much moredetrimental effect on binding than mutation to Trp.Since Trp retains the aromaticity lost upon mutationof Phe, while Ala and Leu do not, it is an obviousassumption to attribute the loss in binding freeenergy with the Ala and Leu mutants to the loss ofstacking interactions upon binding SL2 RNA.However, previous studies have indicated smallerinteractions between aromatic amino acids andnucleobases, on a scale of 1–3 kcal/mol.53–59 MP2/6-311G(d,p) interaction energies calculated formodel systems of these F56 U1A mutants derivedfrom MD average structures suggest that a loss ofstacking is worth 2.3 and 0.7 kcal/mol in the F56Aand F56L systems, respectively (hydrophobic inter-actions in the Leu mutant may partially compensatefor loss of the aromatic interaction). These estimatessuggest a similar contribution from stacking in thissystem compared to earlier estimates that do notcompletely account for the differences in bindingfree energies. In contrast, stacking is maintained bythe Trp mutant, yet it has an interaction energy
difference similar to the Leu mutant compared towild-type.If the experimental binding free energies in Table 2
could completely be accounted for by the stackinginteractions between the residue at position 56 andA6 of SL2 RNA, then it might be expected thatlargest difference in the MM-GBSA componentanalysis of the F56 mutants would be in the VDWenergy component.60 This, however, is not the case.Figure 4(b) shows that, compared to wild-type, theVDW component is unfavorable for F56A, favorablefor F56W and very similar for F56L. This resultsupports the idea that, though stacking contributesto the differences in the binding free energies in themutants, it is not the only factor. Further analysis ofFigure 4(b) and (c) indicates that there are significantdifferences between the wild-type and F56 mutantsin most of the energy components, leading to acomplex view of the overall contributions to bindingin this system. Though the overall binding freeenergy is similar for all of the systems, the mutantsobtain the overall binding free energies by differentmixtures of the various energy terms. This is notnecessarily obvious upon inspection of the experi-mental binding free energies, and indicates differentcontributing factors to binding for the different F56mutants.Inspection of the residual free energies of the F56
mutants compared to wild-type (Figure 6) indicatesthat energetic differences are not localized to the siteof the mutation. Rather, the single mutation atposition 56 creates differences in residual freeenergies that are distributed throughout the mutantproteins. This also supports the idea that stacking isnot the only factor contributing to the differences inthe binding free energies of the F56 mutants. We donote, however, that the main significant differencesin the residual free energies are in regions of theprotein that have been shown to be involved inconformational adaptation61,62 and in regionsimportant for binding (loop 3 – β3 and loop 6 –helix C).2 There is also significant compensation inthe free energies of the residues in the protein, in thatsignificant unfavorable contributions at sites in theprotein are compensated for by favorable contribu-tions at other sites.Analysis of the SL2 RNA energetics also lends
support to the idea that stacking is not the solecontributor to differences in the experimental bind-ing free energies in the F56 mutant systems. Figure 5indicates that energetics of SL2 RNA are less fa-vorable when bound to each of the F56 mutant U1Aproteins compared to the wild-type system. How-ever, SL2 RNA bound to F56L and F56W mutants ismore unfavorable than when bound to the F56Amutant. If stacking was the sole contributor to thedifferential binding free energies of the mutants, itwould be expected that the energy of SL2 RNAbound to F56A U1A would be the least favorablecompared to wild-type. This idea can be exploredfurther by analysis of the energy decomposition ofSL2 RNA on a nucleotide basis (Figure 6). If stackingwas the only contributor to the differences in binding
1414 Free Energy Component Analysis of U1A-RNA Systems
free energies of the F56 U1A mutants, it would beexpected that a large unfavorable ΔG compared towild-type would appear at the A6 nucleotide (whichstacks with Phe56 in wild-type U1A) for the Ala andLeu mutants, but not for the Trp mutant. Though allof the mutants do have unfavorable ΔGs comparedto wild-type at the A6 position, unfavorableΔGs arenot localized specifically to that position, and areseen throughout most of the RNA.Insight into U1A-RNA binding can be gained from
additional analysis of SL2 RNA in these systems.Figure 5 indicates that SL2 RNA bound to the F56Amutant is more favorable than when bound to theF56L and F56Wmutants. Since the F56A mutant hasthe weakest binding free energy compared to themutants, this result suggests that the poor bindingfree energy of the F56A system is likely due more todifferences in the protein than to differences in theRNA upon binding, which has been suggestedpreviously.38 Energy decomposition of SL2 RNAon a nucleotide basis in the mutant systems (Figure6) indicates that the majority of nucleotides haveunfavorable differences in ΔG compared to wild-type. This observation corresponds to the data inTable 3, which show that the adaptation energy forSL2 RNA is higher upon binding to the F56 U1Amutants than it is upon binding to wild-type.Overall, these results indicate that SL2 RNA bindingto wild-type is more favorable than binding to any ofthe F56 mutants.
Conclusions
MM-GBSA was used in conjunction with normalmode analysis to successfully account for experi-mental binding free energies of the U1A protein forSL2 RNA for wild-type and several F56 proteinmutants. Average energies were obtained fromsamples of snapshots extracted from MD simula-tions. The trend in the computed binding freeenergies for the U1A-RNA mutants was in agree-ment with the experimental values, though absolutebinding free energies were overestimated. A linear-response-like equation was used to scale the variousenergy components to obtain binding free energiesin agreement with the experimental values. Ab initiocalculations were performed on model systems toestimate contributions of stacking to binding.Differences in binding free energies between the
single and separate trajectory methods indicate thatconformational adaptation is important. Individualcomponent analysis provides insight into the differ-ent overall free energies of binding for the F56mutants. Though overall binding free energies of theF56 U1A mutants are very similar, they arise fromdifferent combinations of favorable and unfavorableenergetic component contributions. Free energydecomposition on a residual basis indicates differ-ences throughout the entire protein, not only at thesite of mutation, and especially in areas of the pro-tein shown to be important for binding. MM-GBSAanalysis and ab initio calculations indicate that
differences in mutant binding free energies are notcompletely accounted for by differences in stackinginteractions. Taken together, these results indicatethat there may be different underlying causes ofostensibly similar experimentally observed bindingaffinities of different mutants, and thus recommendcaution in the interpretation of binding affinities andspecificities purely by inspection.
Materials and Methods
MD simulations
The starting structure for the MD simulation of thewild-type U1A-RNA complex was based on the X-raycocrystal structure of the N-terminal RRM of U1A boundto SL2 of U1 snRNA solved at 1.92 Å resolution,9 PDBID:63 1URN. Biological unit 2 was chosen for the initialstructure as it contains the most complete structuralinformation for SL2 RNA. The U1A protein was extendedfrom the crystal structure construct to obtain a structurecontaining residues 2–102 to match that used in thebinding affinity experiments, and two point mutations(H31Yand R36Q) were introduced to revert the protein tothe wild-type sequence. Details of these procedures havebeen described.40 Point mutations were introduced at thePhe56 position in this structure to create the F56A, F56Land F56W mutant complexes. This extended U1A-RNAcomplex was then separated into its constituent proteinand nucleic acid parts, which served as starting structuresfor the MD simulations of wild-type U1A in the openform and the free SL2 RNA, respectively. Point mutationswere introduced at the Phe56 position in this U1Astructure to create the F56A, F56L and F56W mutants offree U1A in the open conformation. The free SL2 RNAused in the previously reported biochemical studies was a25mer;12,13,46 however, the SL2 RNA in the X-raycocrystal structure of the complex and in other MDstudies was a 21mer (Figure 1). As previous studies haveshown that the shorter SL2 RNA stem does not affect U1Abinding,53 the 21mer RNA was used in the calculationsdescribed here.The starting structure for theMD simulation of the wild-
type U1A in the closed form was based on the NMR so-lution structure of the unbound protein,7 PDB ID:63 1FHT.Model 5 was selected as the representative structure basedon analysis of the 43NMR structures byNMRCLUST 2.1.64The U1A NMR structure was truncated from residues 2–117 to residues 2–102 to match the construct used in thebinding affinity experiments. Point mutations were intro-duced at the Phe56 position in this structure to create theF56A, F56L and F56W mutant forms of free U1A in theclosed conformation.MD simulations were performed using the AMBER65,66
suite of programs with the parm9667 force field. Thesystems were solvated in a box of explicit TIP3P68 watermolecules that extended a minimum distance of 12 Åfrom the solute atoms. Neutralizing Na+ or Cl– ions wereadded to each system, after which Na+ and Cl– ions wereadded to each system to obtain a salt concentration of250 mM, in accordance with the conditions of the bindingaffinity experiments. The ions were randomized aroundthe solute such that the ions could be no closer than 5 Åto the solute and no closer than 3 Å to each other.Additional details of the minimization and MD proce-dures were described by Pitici et al.40 The results pre-
1415Free Energy Component Analysis of U1A-RNA Systems
sented here are based on a production runs of 3 ns to32 ns (see Table 1).
Methodology
Free energies of binding were estimated using MM-PBSA or MM-GBSA in AMBER 866 according the methodsdescribed by Gohlke and Case,20 using an additive freeenergy component analysis approach. This analysis fol-lows a similar protocol established by Beveridge, Barangeret al. in studies of the U1A-RNA complex,38,40,43 the EcoRIendonuclease complex,17 the λ repressor-operator26 and anumber of protein-DNA complexes.19
The overall objective of this method is to calculate theabsolute binding free energy for the non-covalent associa-tion of any two molecules, A and B, in solution, i.e.:
½A�aq þ ½B�aqf½A*B*�aq* ð2Þ
where [A]aq refers to the dynamical structure of moleculeA free in solution, [B]aq refers to the dynamical structureof molecule B free in solution, and [A*B*]aq* representsthe complex formed from molecules A and B, taking intoaccount any structural changes ([A*] and [B*]) andsolvent reorganization (aq*) that may occur upon com-plex formation.In principle, this calculation requires three MD simula-
tions, one each on [A]aq, [B]aq, and [A*B*]aq*. Gohlke andCase20 refer to this protocol as “separate trajectories” or“three trajectories” (3T). One may also make the (ques-tionable) approximation that structural adaptation isnegligible and draw the trajectories for [A]aq and [B]aqfrom the single MD carried out on [A*B*]aq*, simply byseparating the complex into its constituent parts, [A*] aq*and [B*] aq*. This is referred to as the “single trajectory” (1T)method.The binding free energy for the non-covalent association
of two molecules may be written as:
DGðAþ BYABÞ ¼ GAB � GA � GB: ð3ÞThe free energy of anymoleculeXmay be divided into a
contribution from the solute and a contribution from thesolvent:
GðXÞ ¼ GsoluteðXÞ þ GsolventðXÞ ð4ÞThe free energy contribution from the solute may be
expressed as:
GsoluteðXÞ ¼ UðXÞ � TSðXÞ ð5Þwhere
UðXÞ ¼ hEðXÞi ¼ hEvalðXÞ þ EeleðXÞ þ EvdWðXÞi ð6Þand
SðXÞ ¼ Strans þ Srot þ Svib ð7ÞHere, ⟨E(X)⟩ represents the average MM energy of snap-shots obtained from the MD simulation(s), which iscomprised of internal energy contributions from bonds,angles and torsions (Eval), the electronic energy contribu-tion (Eele) and the van der Waals distance-dependent in-teraction energy (EvdW), Strans and Srot are the entropiccontributions from translational and rotational motion,respectively, obtained from classical statistical mechanics,and Svib is the entropic contribution from vibrationalmotion, obtained using the normal mode analysis module
nmode implemented in AMBER 8. Note that this protocolneglects any small changes in volume upon complexformation as well as configurational entropy contributionsfrom side-chain reorganization.The quasi-harmonic analysis69,70 was used as an
alternative method of computing the entropy for thisstudy. The length of the MD simulations were not ex-tensive enough to provide convergent behavior (data notshown), which has been shown previously.20,70 Inaddition, the quasi-harmonic vibrational entropy is highlydependent on the superposition of the structures used foranalysis.20 As such, we used results from the normal-mode analysis to estimate entropic contributions in thisstudy.The free energy contribution from the solvent may be
expressed as:
GsolventðXÞ ¼ GesðXÞ þ GnpðXÞ ð8Þwhere Ges is the electrostatic contribution and Gnp is thenon-polar contribution. In this study, the electrostaticcontribution was calculated using PB as implemented inthe pbsa program in AMBER 8 or one of several GBprograms. GB is an analytic approximation to the PBmethod for solving the electrostatic contribution to thesolvation free energy. The GB methods compared in thisstudy are the Hawkins, Cramer, Truhlar pairwise general-ized Born model71,72 with parameters described by Tsuiand Case73 (GBHCT, called by IGB=1 in AMBER 8), themodified GB model developed by Onufriev, Bashford andCase, which has been optimized with two different α, βand γ parameter sets49,50 (GBOBC(I), called by IGB=2 inAMBER 8 and GBOBC(II), called by IGB=5 in AMBER 8),and the GB andmodifiedGBparameterizations derived byJayaram, Sprous and Beveridge74 (GBJSB, called by IGB=3in AMBER 7 and MGBJSB, called by IGB=4 in AMBER 7).The non-polar contribution to the solvation free energy iscalculated by:
GnpðXÞ ¼ gSASAðXÞ þ b ð9Þwhere γ is a surface tension parameter, set to 0.005 for PB75
and 0.0072 for GB,76 SASA(X) is the solvent-accessiblesurface area of molecule X, computed with the programmolsurf,77 and b is a parameterized value, set to 0.86 forPB75 and 0.0 for GB.76Free energy decomposition was performed on a per-
residue basis. Solute free energies and the electrostaticcontribution to the solvation free energy were computedaccording to the methods described earlier in this section,while the non-polar contribution to the solvation freeenergy was determined using the LCPO method.78
MM-PB(GB)SA-LR calculations
Snapshots for MM-PB(GB)SA analysis were collectedfrom the MD simulations once every 20 ps over the stableportion of computed trajectories, as determined fromconvergence of RMSD plots (Table 1). The same snapshotswere used for normal mode analysis except for the freeSL2 RNA trajectory, for which snapshots were collectedevery 200 ps. MM-PB(GB)SA and normal mode analysiswere performed on each snapshot and averaged to obtainenergy components and overall free energies of binding.Energy components were subsequently scaled using a LR-like equation:
DG ¼ aðDESÞ þ hðDNESÞ þ g ð10Þwhere α, β and γ are weight factors derived from a mul-tiple regression analysis and ΔES and ΔNES represent the
1416 Free Energy Component Analysis of U1A-RNA Systems
electrostatic and non-electrostatic energy components,respectively, derived from MM-GBSA:
DES ¼ Deleþ DGB ð11Þ
DNES ¼ Dvalþ DvdW þ Dnp� TDS ð12Þ
Ab initio calculations
To probe the stacking energetics involved in U1A-RNAbinding, ab initio calculations were performed between A6of SL2 RNA and Phe56 of U1A, as well as the Ala, Leu, andTrp mutants. Bound forms were obtained using the ave-rage structures from MD simulations, followed bydeletion of all atoms but the ones of interest. The riboseof A6 and the Cα of the amino acids were then replacedwith a methyl group. Interaction energies were calculatedusing Gaussian 0379 at the MP2/6-311G(d,p) level oftheory80–86 in the presence of solvent using a PolarizableContinuum model (PCM).87–99 The free systems werecalculated in water (ε=78.39) to mimic a solvatedenvironment, and the bound forms were calculated indiethyl ether (ε=4.335) to mimic the hydrophobic coreenvironment in the U1A-RNA complex. Reported inter-action energies include (gas-phase) basis set superpositionerror (BSSE) corrections.100
Acknowledgements
We thank Dr Surjit Dixit and Laure Dykas formany helpful discussions and Dr Felicia Pitici for theuse of several earlier U1A MD simulations. Fundingwas provided by the NIH to A.M.B. (GM-56857) andto D.L.B. (GM-076490). B.L.K. was supported by aNIH Postdoctoral Fellowship (F32 GM072345). Thiswork was partially supported by the NationalScience Foundation through TeraGrid resources pro-vided by the National Center for SupercomputingApplications under LRAC/NRAC grant numberMCA94P011 utilizing the Xeon Linux Cluster and bythe Texas Advanced Computing Center utilizing theCray-Dell PowerEdge Xeon Linux Cluster.
References
1. Stark, H. & Lührmann, R. (2006). Cryo-electronmicroscopy of spliceosomal components. Annu. Rev.Biophys. Biomol. Struct. 35, 435–457.
2. Maris, C., Dominguez, C. & Allain, F. H.-T. (2005).The RNA recognition motif, a plastic RNA-bindingplatform to regulate post-transcriptional gene expres-sion. FEBS J. 272, 2118–2131.
3. Varani, G. & Nagai, K. (1998). RNA recognition byRNP proteins during RNA processing. Annu. Rev.Biophys. Biomol. Struct. 27, 407–445.
4. Hall, K. B. (1994). Interaction of RNA hairpins withthe human U1A N-terminal RNA binding domain.Biochemisty, 33, 10076–10088.
5. Tsai, D. E., Harper, D. S. & Keene, J. D. (1991). U1-snRNP-A selects a ten nucleotide consensus sequencefrom a degenerate RNA pool presented in variousstructural contexts. Nucl. Acids Res. 19, 4931–4936.
6. Boelens, W. C., Jansen, E. J., van Venrooij, W. J.,Stripecke, R., Mattaj, I. W. & Gunderson, S. I. (1993).The human U1 snRNP-specific U1A protein inhibitspolyadenylation of its own pre-mRNA. Cell, 72,881–892.
7. Avis, J. M., Allain, F. H.-T., Howe, P. W. A., Varani, G.,Nagai, K. & Neuhaus, D. (1996). Solution structure ofthe N-terminal RNP domain of U1A protein: the roleof C-terminal residues in structure stability and RNAbinding. J. Mol. Biol. 257, 398–411.
8. Nagai, K., Oubridge, C., Jessen, T. H., Li, J. & Evans,P. R. (1990). Crystal structure of the RNA-bindingdomain of the U1 small nuclear ribonucleoprotein A.Nature, 348, 515–520.
9. Oubridge, C., Ito, N., Evans, P. R., Teo, C. H. &Nagai,K. (1994). Crystal structure at 1.92 Å resolution of theRNA-binding domain of the U1A spliceosomalprotein complexed with an RNA hairpin. Nature,372, 432–438.
10. Rupert, P. B., Xiao, H. & Ferre-D'Amare, A. R. (2003).U1A RNA-binding domain at 1.8 A resolution. ActaCrystallog. sect. D, 59, 1521–1524.
11. Mittermaier, A., Varani, L., Muhandiram, D. R., Kay,L. E. & Varani, G. (1999). Changes in side-chain andbackbone dynamics identify determinants of specifi-city in RNA recognition by human U1A protein.J. Mol. Biol. 294, 967–979.
12. Nolan, S. J., Shiels, J. C., Tuite, J. B., Cecere, K. L. &Baranger, A. M. (1999). Recognition of an essentialadenine at a protein-RNA interface: comparison ofthe contributions of hydrogen bonds and a stackinginteraction. J. Am. Chem. Soc. 121, 8951–8952.
13. Shiels, J. C., Tuite, J. B., Nolan, S. J. & Baranger, A. M.(2002). Investigation of a conserved stacking interac-tion in target site recognition by the U1A protein.Nucl. Acids Res. 30, 550–558.
14. Tuite, J. B., Shiels, J. C. & Baranger, A. M. (2002).Substitution of an essential adenine in the U1A-RNAcomplex with a non-polar isostere. Nucl. Acids Res.30, 5269–5275.
15. Ajay, A. & Murcko, M. A. (1995). Computationalmethods to predict binding free energies in ligand-receptor complexes. J. Med. Chem. 38, 4953–4967.
16. Swanson, J. M., Henchman, R. H. & McCammon,J. A. (2004). Revisiting free energy calculations: atheoretical connection to MM/PBSA and directcalculation of the association free energy. Biophys. J.86, 67–74.
17. Jayaram, B., McConnell, K., Dixit, S. B. & Beveridge,D. L. (1999). Free energy analysis of protein-DNAbinding: the EcoRI endonuclease- DNA complex.J. Comput. Phys. 151, 333–357.
18. Kollman, P. A., Massova, I., Reyes, C., Kuhn, B., Huo,S., Chong, L. et al. (2000). Calculating structures andfree energies of complex molecules: combiningmolecular mechanics and continuum models. Acc.Chem. Res. 33, 889–897.
19. Jayaram, B., McConnell, K., Dixit, S. B., Das, A. &Beveridge, D. L. (2002). Free-energy componentanalysis of 40 protein-DNA complexes: a consensusview on the thermodynamics of binding at themolecular level. J. Comput. Chem. 23, 1–14.
20. Gohlke, H. & Case, D. A. (2004). Converging freeenergy estimates: MM-PB(GB)SA studies on theprotein–protein complex Ras-Raf. J. Comput. Chem. 25,238–250.
21. Gohlke, H., Kiel, C. & Case, D. A. (2003). Insights intoprotein–protein binding by binding free energycalculation and free energy decomposition for the
1417Free Energy Component Analysis of U1A-RNA Systems
Ras-Raf and Ras-RalGDS complexes. J. Mol. Biol. 330,891–913.
22. Proloff, N.,Windemuth, A. &Honig, B. (1997). On thecalculation of binding free energies using continuummethods: application toMHCClass I protein-peptideinteractions. Protein Sci. 6, 1293–1301.
23. Gilson, M. K., Given, J. A., Bush, B. L. &McCammon,J. A. (1997). The statistical thermodynamic basis forcomputation of binding affinities: a critical review.Biophys. J. 72, 1047–1069.
24. Novotny, J., Bruccoleri, R. E., Davis,M. & Sharp, K. A.(1997). Empirical free energy calculations: a blind testand further improvements to the method. J. Mol. Biol.268, 401–411.
25. Simonson, T., Archontis, G. & Karplus, M. (2002).Free energy simulations come of age: protein-ligandrecognition. Acc. Chem. Res. 35, 430–437.
26. Kombo, D. C., Jayaram, B., McConnell, K. J. &Beveridge, D. L. (2002). Calculation of the affinity ofthe λ repressor-operator complex based on freeenergy component analysis. Mol. Simul. 28, 187–211.
27. Zhou, Z. & Madura, J. D. (2004). Relative free energyof binding and binding mode calculations of HIV-1RT inhibitors based on Dock-MM-PG/GS. Proteins:Struct. Funct. Bioinf. 57, 403–493.
28. Zhou, Z., Bates, M. & Madura, J. D. (2006). Structuremodeling, ligand binding, and binding affinitycalculation (LR-MM-PBSA) of human heparanasefor inhibition and drug design. Proteins: Struct. Funct.Bioinf. 65, 580–592.
29. Lee, F. S., Chu, Z.-T., Bolger, M. B. & Warshel, A.(1992). Calculations of antibody-antigen interactions:microscopic and semi-microscopic evaluation of thefree energies of binding of phosphorylcholine ana-logs to McPC603. Protein Eng. 5, 215–228.
30. Aqvist, J., Medina, C. & Samuelsson, J. E. (1994). Anew method for predicting binding affinity incomputer-aided drug design. Protein Eng. 7, 385–391.
31. Carlson, H. A. & Jorgensen,W. L. (1995). An extendedlinear resonse method for determining free energiesof hydration. J. Phys. Chem. 99, 10673–10677.
32. Reyes, C. M. & Kollman, P. A. (1999). Moleculardynamics studies of U1A-RNA complexes. RNA, 5,235–244.
33. Tang, Y. & Nilsson, L. (1999). Molecular dynamicssimulations of the complex between human U1Aprotein and hairpin II of U1 small nuclear RNA andof free RNA in solution. Biophys. J. 77, 1284–1305.
34. Hermann, T. & Westhof, E. (1999). Simulations of thedynamics at an RNA-protein interface. Nature Struct.Biol. 6, 540–544.
35. Reyes, C. M. & Kollman, P. A. (2000). Investigatingthe binding specificity of U1A-RNA by computa-tional mutagenesis. J. Mol. Biol. 295, 1–6.
36. Reyes, C. M. & Kollman, P. A. (2000). Structure andthermodynamics of RNA-protein binding: usingmolecular dynamics and free energy analyses tocalculate the free energies of binding and conforma-tional change. J. Mol. Biol. 297, 1145–1158.
37. Olson, M. A. (2001). Calculations of free-energycontributions to protein-RNA complex stabilization.Biophys. J. 81, 1841–1853.
38. Blakaj, D. M., McConnell, K. J., Beveridge, D. L. &Baranger, A. M. (2001). Molecular dynamics andthermodynamics of protein-RNA interactions: muta-tion of a conserved aromatic residue modifiesstacking interactions and structural adaptation inthe U1A-stem loop 2 RNA complex. J. Am. Chem. Soc.123, 2548–2551.
39. Showalter, S. A. &Hall, K. B. (2002). A functional rolefor correlated motion in the N-terminal RNA-bind-ing domain of human U1A protein. J. Mol. Biol. 322,533–542.
40. Pitici, F., Beveridge, D. L. & Baranger, A. M. (2002).Molecular dynamics simulation studies of induced fitand conformational capture in U1A-RNA binding:do molecular substates code for specificity? Biopoly-mers, 65, 424–435.
41. Showalter, S. A. & Hall, K. B. (2004). Altering theRNA-binding mode of the U1A RBD1 protein. J. Mol.Biol. 335, 465–480.
42. Showalter, S. A. & Hall, K. B. (2005). Correlatedmotions in the U1 snRNA stem/loop 2:U1A RBD1complex. Biophys. J. 89, 2046–2058.
43. Zhao, Y., Kormos, B. L., Beveridge, D. L. & Baranger,A. M. (2006). Molecular dynamics simulation studiesof a protein-RNA complex with a selectively mod-ified binding interface. Biopolymers, 81, 256–269.
44. Kormos, B. L., Baranger, A. M. & Beveridge, D. L.(2006). Do collective atomic fluctuations account forcooperative effects? Molecular dynamics studies ofthe U1A-RNA complex. J. Am. Chem. Soc. 128,8992–8993.
45. Kormos, B. L., Baranger, A. M. & Beveridge, D. L.(2007). A study of collective atomic fluctuations andcooperativity in the U1A-RNA complex based onmolecular dynamics simulations. J. Struct. Biol. 157,500–513.
46. Zhao, Y. & Baranger, A. M. (2003). Design of anadenosine analogue that selectively improves theaffinity of a mutant U1A protein for RNA. J. Am.Chem. Soc. 125, 2480–2488.
47. Katsamba, P. S., Myszka, D. G. & Laird-Offringa, I. A.(2001). Two functionally distinct steps mediate highaffinity binding of U1A protein to U1 hairpin II RNA.J. Biol. Chem. 276, 21476–21481.
48. Law, M. J., Chambers, E. J., Katsamba, P. S., Haworth,I. S. & Laird-Offringa, I. A. (2005). Kinetic analysis ofthe role of the tyrosine 13, phenylalanine 56 andglutamine 54 network in the U1A/U1 hairpin IIinteraction. Nucl. Acids Res. 33, 2917–2928.
49. Onufriev, A., Bashford, D. & Case, D. A. (2000).Modification of the generalized Born model sui-table for macromolecules. J. Phys. Chem. B, 104,3712–3720.
50. Onufriev, A., Bashford, D. & Case, D. A. (2004).Exploring protein native states and large-scale con-formational changes with a modified generalizedBornmodel.Proteins: Struct. Funct. Bioinf. 55, 383–394.
51. Dill, K. A. (1997). Additivity principles in biochem-istry. J. Biol. Chem. 272, 701–704.
52. Smith, P. E. & van Gunsteren, W. F. (1994). When arefree energy components meaningful? J. Phys. Chem.98, 13735–13740.
53. Kranz, J. K., Lu, J. & Hall, K. B. (1996). Contributionof the tyrosines to the structure and function of thehuman U1A N-terminal RNA binding domain.Protein Sci. 5, 1567–1583.
54. LeCuyer, K. A., Behlen, L. S. & Uhlenbeck, O. C.(1996). Mutagenesis of a stacking contact in the MS2coat protein-RNA complex. EMBO J. 15, 6847–6853.
55. Deardorff, J. A. & Sachs, A. B. (1997). Differentialeffects of aromatic and charged residue substitutionsin the RNA binding domains of the yeast poly(A)-binding protein. J. Mol. Biol. 269, 67–81.
56. Anderson, E.M., Halsey,W.A. &Wuttke, D. S. (2003).Site-directed mutagenesis reveals the thermody-namic requirements for single-stranded DNA recog-
1418 Free Energy Component Analysis of U1A-RNA Systems
nition by the telomere-binding protein Cdc13. Bio-chemisty, 42, 3751–3758.
57. Butterfield, S. M., Cooper, W. J. & Waters, M. L.(2005). Minimalist protein design: a β-hairpin pep-tide that binds ssDNA. J. Am. Chem. Soc. 127, 24–25.
58. Huang, C.-Y., Hsu, C.-H., Sun, Y.-J., Wu, H.-N. &Hsiao, C.-D. (2006). Complexed crystal structure ofreplication restart primosome protein PriB reveals anovel single-stranded DNA-bonding mode. Nucl.Acids Res. 34, 3878–3886.
59. Zeeb, M., Max, K. E. A., Weininger, U., Löw, C.,Sticht, H. & Balbach, J. (2006). Recognition of T-richsingle-stranded DNA by the cold shock protein Bs-CspB in solution. Nucl. Acids Res. 34, 4561–4571.
60. Friedman, R. A. & Honig, B. (1995). A free energyanalysis of nucleic acid base stacking in aqueoussolution. Biophys. J. 69, 1528–1535.
61. Williamson, J. R. (2000). Induced fit in RNA-proteinrecognition. Nature Struct. Biol. 7, 834–837.
62. Leulliot, N. & Varani, G. (2001). Current topics inRNA-protein recognition: control of specificity andbiological function through induced fit and confor-mational capture. Biochemisty, 40, 7947–7956.
63. Berman, H. M., Westbrook, J., Feng, Z., Gilliland, G.,Bhat, T. N., Weissig, H. et al. (2000). The Protein DataBank. Nucl. Acids Res. 28, 235–242.
64. Kelley, L. A., Gardner, S. P. & Sutcliffe,M. J. (1996). Anautomated approach for clustering an ensemble ofNMR-derived protein structures into conformation-ally-related subfamilies. Protein Eng. 9, 1063–1065.
65. Pearlman, D. A., Case, D. A., Caldwell, J. W., Ross, W.S., Cheatham, T. E., III & DeBolt, S. (1995). AMBER, apackage of computer programs for applying mole-cular mechanics, normal mode analysis, moleculardynamics and free energy calculations to simulatethe structural and energetic properties of molecules.Comput. Phys. Commun. 91, 1–41.
66. Case, D. A., Darden, T. A., Cheatham, T. E., III,Simmerling, C. L., Wang, J., Duke, R. E. et al. (2004).AMBER 8. University of California, San Francisco.
67. Kollman, P. A., Dixon, R., Cornell, W., Fox, T.,Chipot, C. & Pohorille, A. (1997). The development/application of a ‘minimalist’ organic/biochemicalmolecular mechanic force field using a combinationof ab initio calculations and experimental data. InComputer Simulation of Biomolecular Systems (Wilk-inson, A., Weiner, P. & van Gunsteren, W. F., eds),vol. 3, pp. 83–96. Kluwer, London.
68. Jorgensen, W. L., Chandrasekhar, J., Madura, J. D.,Impey, R. W. & Klein, M. L. (1983). Comparison ofsimple potential functions for simulating liquidwater. J. Chem. Phys. 79, 926–936.
69. Schlitter, J. (1993). Estimation of absolute and relativeentropies of macromolecules using the covariancematrix. Chem. Phys. Letters, 215, 617–621.
70. Dixit, S. B., Andrews, D. Q. & Beveridge, D. L. (2005).Induced fit and the entropy of structural adaptation inthe complexation of CAP and lambda repressor withcognate DNA sequences. Biophys. J. 88, 3147–3157.
71. Hawkins, G. D., Cramer, C. J. & Truhlar, D. G. (1995).Pairwise solute descreening of solute charges from adielectric medium. Chem. Phys. Letters, 246, 122–129.
72. Hawkins, G. D., Cramer, C. J. & Truhlar, D. G. (1996).Parametrized models of aqueous free energies ofsolvation based on pairwise descreening of soluteatomic charges from a dielectric medium. J. Phys.Chem. 100, 19824–19839.
73. Tsui, V. & Case, D. A. (2001). Theory and applicationsof the generalized Born solvation model in macro-
molecular simulations. Biopolymers (Nucl. Acid Sci.),56, 257–291.
74. Jayaram, B., Sprous, D. & Beveridge, D. L. (1998).Solvation free energy of biomacromolecules: para-meters for a modified generalized Born modelconsistent with the AMBER force field. J. Phys.Chem. B, 102, 9571–9576.
75. Sitkoff, D., Sharp, K. A. & Honig, B. (1994). Accuratecalculation of hydration free energies using macro-scopic solvent models. J. Phys. Chem. 98, 1978–1988.
76. Still, W. C., Tempczyk, A., Hawley, R. C. &Hendrickson, T. (1990). Semianalytical treatment ofsolvation for molecular mechanics and dynamics.J. Am. Chem. Soc. 112, 6127–6129.
77. Connolly, M. L. (1983). Analytical molecular surfacecalculation. J. Appl. Crystallog. 16, 548–558.
78. Weiser, J., Shenkin, P. S. & Still, W. C. (1999).Approximate atomic surfaces from linear combina-tions of pairwise overlaps (LCPO). J. Comput. Chem.20, 217–230.
79. Frisch, M. J., Trucks, G. W., Schlegel, H. B., Scuseria,G. E., Robb, M. A., Cheeseman, J. R. et al. (2004).Gaussian 03. Gaussian, Inc., Wallingford, CT.
80. Møller, C. & Plesset, M. S. (1934). Note on anapproximation treatment for many-electron systems.Phys. Rev. 46, 618–622.
81. Head-Gordon, M., Pople, J. A. & Frisch, M. J. (1988).MP2 energy evaluation by direct methods. Chem.Phys. Letters, 153, 503–506.
82. Sæbø, S. & Almlöf, J. (1989). Avoiding the integralstorage bottleneck in LCAO calculations of electroncorrelation. Chem. Phys. Letters, 154, 83–89.
83. Frisch, M. J., Head-Gordon, M. & Pople, J. A. (1990).A direct MP2 gradient method. Chem. Phys. Letters, 3,275–280.
84. Frisch, M. J., Head-Gordon, M. & Pople, J. A. (1990).Semi-direct algorithms for the MP2 energy andgradient. Chem. Phys. Letters, 166, 281–289.
85. Head-Gordon,M.&Head-Gordon, T. (1994). AnalyticMP2 frequencies without fifth-order storage. Theoryand application to bifurcated hydrogen bonds in thewater hexamer. Chem. Phys. Letters, 220, 122–128.
86. Hehre,W. J., Radom, L., Schleyer, J. A. & Pople, P. v. R.(1986). Ab Initio Molecular Orbital Theory. Wiley, NewYork.
87. Miertš, S., Scrocco, E. & Tomasi, J. (1981). Electrostaticinteraction of a solute with a continuum. A directutilization of ab initio molecular potentials for theprevision of solvent effects. Chem. Phys. 55, 117–129.
88. Miertš, S. & Tomasi, J. (1982). Approximate evalua-tions of the electrostatic free energy and internalenergy changes in solution processes. Chem. Phys. 65,239–245.
89. Cossi, M., Barone, V., Cammi, R. & Tomasi, J. (1996).Ab initio study of solvated molecules: a newimplementation of the polarizable continuummodel. Chem. Phys. Letters, 255, 327–335.
90. Mennucci, B. & Tomasi, J. (1997). Continuum solva-tion models: a new approach to the problem ofsolute's charge distribution and cavity boundaries.J. Chem. Phys. 106, 5151–5158.
91. Mennucci, B., Cances, E. & Tomasi, J. (1997).Evaluation of solvent effects in isotropic andanisotropic dielectrics and in ionic solutions with aunified integral equation method: theoretical bases,computational implementation, and numericalapplications. J. Phys. Chem. B, 101, 10506–10517.
92. Cammi, R., Mennucci, B. & Tomasi, J. (1999).Second-order Møller-Plesset analytical derivatives
1419Free Energy Component Analysis of U1A-RNA Systems
for the polarizable continuum model using therelaxed density approach. J. Chem. Phys. A, 103,9100–9108.
93. Cossi, M., Barone, V. & Robb, M. A. (1999). A directprocedure for the evaluation of solvent effects in MC-SCF calculations. J. Chem. Phys. 111, 5295–5302.
94. Cammi, R., Mennucci, B. & Tomasi, J. (2000). Fastevaluation of geometries and properties of excitedmolecules in solution: a Tamm-Dancoff model withapplication to 4-dimethylaminobenzonitrile. J. Phys.Chem. A, 104, 5631–5637.
95. Cossi, M. & Barone, V. (2000). Solvent effect onvertical electronic transitions by the polarizablecontinuum model. J. Chem. Phys. 112, 2427–2435.
96. Cossi, M. & Barone, V. (2001). Time-dependentdensity functional theory for molecules in liquidsolutions. J. Chem. Phys. 115, 4708–4717.
97. Cossi, M., Rega, N., Scalmani, G. & Barone, V. (2001).Polarizable dielectric model of solvation with inclu-sion of charge penetration effects. J. Chem. Phys. 114,5691–5701.
98. Cossi, M., Scalmani, G., Rega, N. & Barone, V. (2002).New developments in the polarizable continuummodel for quantum mechanical and classical calcula-tions on molecules in solution. J. Chem. Phys. 117,43–54.
99. Cossi, M., Rega, N., Scalmani, G. & Barone, V. (2003).Energies, structures, and electronic properties ofmolecules in solution with the C-PCM solvationmodel. J. Comput. Chem. 24, 669–681.
100. Boys, S. F. & Bernardi, F. (1970). The calculation ofsmall molecular interactions by the differences ofseparate total energies. Some procedures withreduced errors. Mol. Phys. 19, 553–566.
Edited by D. Case
(Received 1 March 2007; received in revised form 2 June 2007; accepted 4 June 2007)Available online 9 June 2007