Heat Capacity of β-Manganese.
2
The data in Table I1 were obtained after the procedure was altered to provide for the seeding of the melt and a slow, orderly solidification of the crucible contents. The details of the necessary modifications are contained in the earlier description (1) of experiments with the element tellurium, where a similar problem was encountered. The data obtained clearly indicate that the melting points of SbzTea and PbTe must initially increase as the pressure rises above one atmosphere. In contrast, above 15,000 atmospheres the melting points of both these com- pounds were observed (2) to decrease with increasing pressure. Thus, in each case, a maximum melting point must be encountered at some intermediate pressure. A direct measurement of these values was not possible since the high pressure equipment used (a tetrahedral anvil apparatus) does not provide sustained, reliable pressure below about 15,000 atmospheres. LITERATURE CITED (1) Ball, D.L., J. CHEM. ENG. DATA 8, 61 (1963). (2) Ball, D.L., "Liquids - Structure, Properties, and Solid Inter- action," Proceedings of General Motors Research Laboratories Symposium, Sept. 5-6, 1963, Warren, Mich., Elsevier, in press. (3) Fritts, R.W., "Thermoelectric Materials and Devices," p. 146, Reinhold, New York, 1960. (4) Testardi, L.R., Wiese, J.R., Trans. AlME 221, 647 (1961). (5) West, T.D., "West's Molders' Text-Book," pp. 4-7, Wiley, New York, 1885. RECEIVED for review June 8, 1964. Accepted September 8, 1964. Heat Capacity of ,&Manganese R. A. BUTERA and R. S. CRAIG Department of Chemistry, University of Pittsburgh, Pittsburgh, Pa. The molar heat capacity of p-Mn has been measured from 14" to 300'K. in an adiabatic calorimeter. Both measured and smooth values of the data are presented. THE ELEMENT MANGANESE has in recent years been a subject of considerable interest. In 1958, Weiss and Tauer published a paper (6) on the thermodynamics and magnetic structure of the allotropic modifications of this element. Additional thermal data on some of the allotropic forms were needed. More recently Arrott, Zimmerman, and coworkers have been engaged in a comprehensive study of the thermodynamics of a-, p-, and y-manganese (2). As a contribution to this effort, the authors have undertaken to measure the specific heat of p-Mn between 14" and 300" K. Previous thermal measurements on p-Mn have been made at low temperatures by Booth, Hoare, and Murphy (3) (12" to 20.K.) and Zimmerman (2) (1.6" to 19.K.). Heat capacity measurements were also made in the high tempera- ture region (1000" to 1050" K.) by Armstrong and Grayson- Smith (I ) . EXPERIMENTAL The adiabatic calorimeter used in the investigation has been described (4). The sample container employed is one which had been used in heat capacity measurements on Cd and Mg. It consisted of a thin-walled copper can into which the sample could be sealed with a few cm. of He gas to promote heat exchange. I t was designed to receive a sample machined to cylindrical form with a tapered hole along the axis. The tapered hole was intended to fit over a tapered pin, an integral part of the sample container, which con- tained the heater and Pt resistance thermometer so that good thermal contact could be established. The 0-Mn sample, however, was in the form of small chunks and not readily adaptable to the customary method of loading. The p-Mn (262.401 grams) was simply sealed into the sample container, and reliance was placed upon the He exchange gas to maintain thermal equilibrium. The atomic weight of manganese was taken as 54.94 grams per mole. The starting material was electrolytic a-Mn which was arc melted under argon and quenched to convert it to the p-allotrope. The principle impurities, shown by spectro- graphic analysis, and their approximate concentrations in per cent were Fe(0.2), Ni(0.04), Pb(0.05), and Si(0.05). X-ray diffraction patterns, obtained both before and after the heat capacity measurements, showed no a-Mn lines. The x-ray patterns did show evidence for the presence of MnO, however, and it was estimated that this substance might be present in the sample to the extent of about 2 mole ?i (7). RESULTS AND DISCUSSION The raw data are shown in Table I. As an index of the precision, the averages of the absolute values of the per- centage deviations of the measured points from the smooth curve have been computed. Between 13" and 40°K. the average deviation is about 2.5%, between 40" and 100" K. the average deviation is about 0.3%, between 100" and 273" K. it is less than 0.1%, while between 273" and 300" K. the average deviation is about 0.2%. The precision obtained in these measurements is not as good as has been obtained in measurements on other metals in the calorimeter. The fact that the sample was in the form of pellets rather than a single solid piece may account for the difference in behavior. A large scale plot of the raw data shows a slight deviation in the curve of C, us. T at about 125" K. The magnitude of the deviation is such that a smooth curve interpolated 38 JOURNAL OF CHEMICAL AND ENGINEERING DATA
Transcript of Heat Capacity of β-Manganese.
The data in Table I1 were obtained after the procedure was altered to provide for the seeding of the melt and a slow, orderly solidification of the crucible contents. The details of the necessary modifications are contained in the earlier description (1) of experiments with the element tellurium, where a similar problem was encountered.
The data obtained clearly indicate that the melting points of SbzTea and PbTe must initially increase as the pressure rises above one atmosphere. I n contrast, above 15,000 atmospheres the melting points of both these com- pounds were observed (2) to decrease with increasing pressure. Thus, in each case, a maximum melting point must be encountered a t some intermediate pressure. A direct measurement of these values was not possible since the high pressure equipment used (a tetrahedral anvil apparatus)
does not provide sustained, reliable pressure below about 15,000 atmospheres.
LITERATURE CITED
(1) Ball, D.L., J. CHEM. ENG. DATA 8, 61 (1963). (2) Ball, D.L., "Liquids - Structure, Properties, and Solid Inter-
action," Proceedings of General Motors Research Laboratories Symposium, Sept. 5-6, 1963, Warren, Mich., Elsevier, in press.
(3) Fritts, R.W., "Thermoelectric Materials and Devices," p. 146, Reinhold, New York, 1960.
(4) Testardi, L.R., Wiese, J.R., Trans. A l M E 221, 647 (1961). (5) West, T.D., "West's Molders' Text-Book," pp. 4-7, Wiley,
New York, 1885.
RECEIVED for review June 8, 1964. Accepted September 8, 1964.
Heat Capacity of ,&Manganese
R. A. BUTERA and R. S. CRAIG Department of Chemistry, University of Pittsburgh, Pittsburgh, Pa.
The molar heat capacity of p-Mn has been measured from 14" to 300'K. in an adiabatic calorimeter. Both measured and smooth values of the data are presented.
THE ELEMENT MANGANESE has in recent years been a subject of considerable interest. I n 1958, Weiss and Tauer published a paper (6) on the thermodynamics and magnetic structure of the allotropic modifications of this element. Additional thermal data on some of the allotropic forms were needed. More recently Arrott, Zimmerman, and coworkers have been engaged in a comprehensive study of the thermodynamics of a - , p- , and y-manganese (2). As a contribution to this effort, the authors have undertaken to measure the specific heat of p-Mn between 14" and 300" K.
Previous thermal measurements on p-Mn have been made a t low temperatures by Booth, Hoare, and Murphy (3) (12" to 20.K.) and Zimmerman (2) (1.6" to 19.K.). Heat capacity measurements were also made in the high tempera- ture region (1000" to 1050" K.) by Armstrong and Grayson- Smith ( I ) .
EXPERIMENTAL
The adiabatic calorimeter used in the investigation has been described ( 4 ) . The sample container employed is one which had been used in heat capacity measurements on Cd and Mg. It consisted of a thin-walled copper can into which the sample could be sealed with a few cm. of He gas to promote heat exchange. I t was designed to receive a sample machined to cylindrical form with a tapered hole along the axis. The tapered hole was intended to fit over a tapered pin, an integral part of the sample container, which con- tained the heater and Pt resistance thermometer so that good thermal contact could be established. The 0-Mn sample, however, was in the form of small chunks and not readily adaptable to the customary method of loading. The p-Mn (262.401 grams) was simply sealed into the
sample container, and reliance was placed upon the He exchange gas to maintain thermal equilibrium. The atomic weight of manganese was taken as 54.94 grams per mole.
The starting material was electrolytic a -Mn which was arc melted under argon and quenched to convert it to the p-allotrope. The principle impurities, shown by spectro- graphic analysis, and their approximate concentrations in per cent were Fe(0.2), Ni(0.04), Pb(0.05), and Si(0.05). X-ray diffraction patterns, obtained both before and after the heat capacity measurements, showed no a-Mn lines. The x-ray patterns did show evidence for the presence of MnO, however, and it was estimated that this substance might be present in the sample to the extent of about 2 mole ?i (7).
RESULTS AND DISCUSSION
The raw data are shown in Table I. As an index of the precision, the averages of the absolute values of the per- centage deviations of the measured points from the smooth curve have been computed. Between 13" and 40°K. the average deviation is about 2.5%, between 40" and 100" K. the average deviation is about 0.3%, between 100" and 273" K. it is less than 0.1%, while between 273" and 300" K. the average deviation is about 0.2%. The precision obtained in these measurements is not as good as has been obtained in measurements on other metals in the calorimeter. The fact that the sample was in the form of pellets rather than a single solid piece may account for the difference in behavior.
A large scale plot of the raw data shows a slight deviation in the curve of C, us. T a t about 125" K. The magnitude of the deviation is such that a smooth curve interpolated
38 JOURNAL OF CHEMICAL AND ENGINEERING DATA
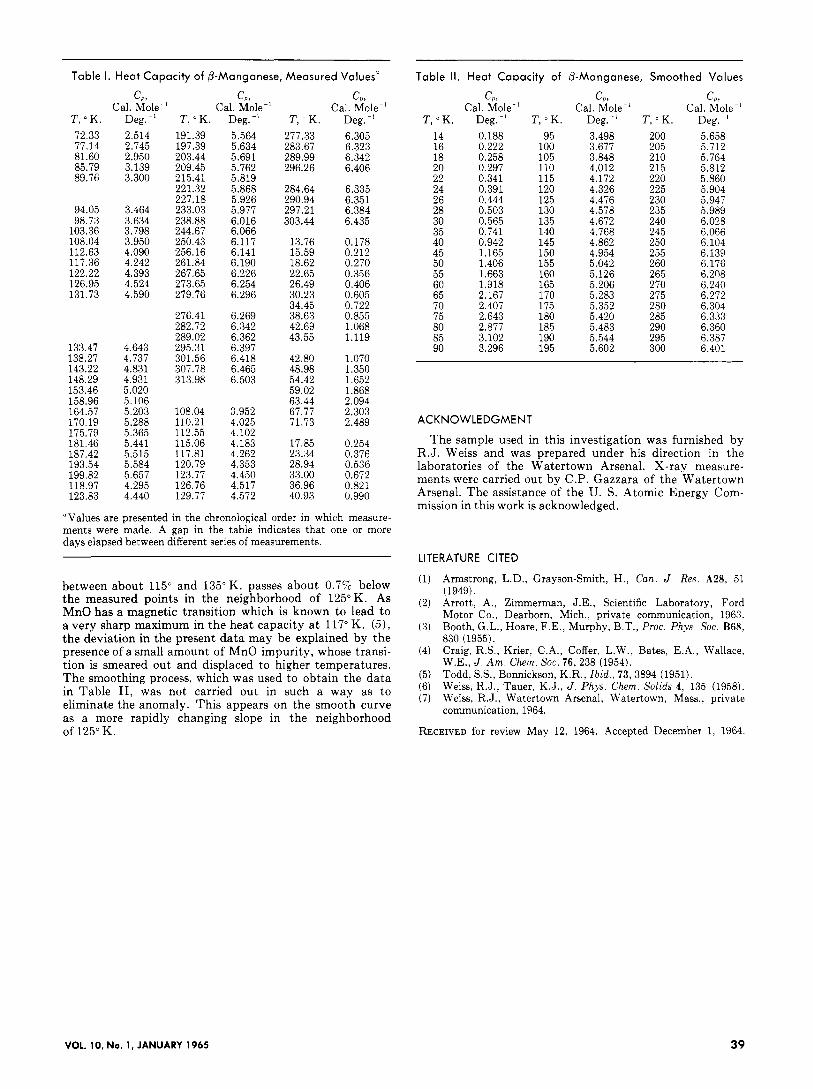
Table I. Heat Capacity of @-Manganese, Measured Values"
T , K 72.33 77.14 81.60 85.79 89.76
94.05 98.73
103.36 108.04 112.63 117.36 122.22 126.95 131.73
133.47 138.27 143.22 148.29 153.46 158.96 164.57 170.19 175.79 181.46 187.42 193.54 199.82 118.97 123.83
c, ! Cm Cal. Mole-' Cal. Mole-'
Deg. -' 2.514 2.745 2.950 3.139 3.300
3.464 3.634 3.798 3.950 4.090 4.242 4.393 4.524 4.590
4.643 4.731 4.831 4.931 5.020 5.106 5.203 5.288 5.365 5.441 5.515 5.584 5.657 4.295 4.440
T , K 191.39 197.39 203.44 209.45 215.41 221.32 227.18 233.03 238.88 244.67 250.43 256.16 261.84 267.65 273.65 279.76
276.41 282.72 289.02 295.31 301.56 307.78 313.98
108.04 110.21 112.55 115.06 117.81 120.79 123.77 126.76 129.77
Deg. -' 5.564 5.634 5.691 5.762 5.819 5.868 5.926 5.977 6.016 6.066 6.117 6.141 6.190 6.226 6.254 6.296
6.269 6.342 6.362 6.397 6.418 6.465 6.503
3.952 4.025 4.102 4.183 4.262 4.353 4.450 4.517 4.572
T , O K 277.33 283.67 289.99 296.26
284.64 290.94 297.21 303.44
13.76 15.59 18.62 22.65 26.49 30.23 34.45 38.63 42.69 43.55
42.80 48.98 54.42 59.02 63.44 67.77 71.73
17.85 23.34 28.94 33.00 36.96 40.93
CP I
Cal. Mole-' Deg.-' 6.305 6.323 6.342 6.406
6.335 6.351 6.384 6.435
0.178 0.212 0.270 0.356 0.406 0.605 0.722 0.855 1.068 1.119
1.070 1.350 1.652 1.868 2.094 2.303 2.489
0.254 0.376 0.536 0.672 0.821 0.990
"Values are presented in the chronological order in which measure- ments were made. A gap in the table indicates that one or more days elapsed between different series of measurements.
between about 115" and 135" K. passes about 0.7% below the measured points in the neighborhood of 125°K. As MnO has a magnetic transition which is known to lead to a very sharp maximum in the heat capacity at 117" K. ( 5 ) , the deviation in the present data may be explained by the presence of a small amount of MnO impurity, whose transi- tion is smeared out and displaced to higher temperatures. The smoothing process, which was used to obtain the data in Table 11, was not carried out in such a way as to eliminate the anomaly. This appears on the smooth curve as a more rapidly changing slope in the neighborhood of 125" K.
~~~
Table 11. Heat Capacity of 6-Manganese, Smoothed Values
T , K. 14 16 18 20 22 24 26 28 30 35 40 45 50 55 60 65 70 75 80 85 90
CP , Cal. Mole-'
CP 9
Cal. Mole- Deg.-' T, OK. Deg.-' 0.188 95 3.498 0.222 100 3.677 0.258 0.297 0.341 0.391 0.444
105 3.848 110 4.012 115 4.172 120 4.326 125 4.476
0.503 130 4.578 0.565 135 4.672 0.741 140 4.768 0.942 145 4.862 1.165 150 4.954 1.406 155 5.042 1.663 160 5.126 1.918 165 5.206 2.167 2.407 2.643 2.877 3.102
170 5.283 175 5.352 180 5.420 185 5.483 190 5.544
3.296 195 5.602
1
T , O K. 200 205 210 215 220 225 230 235 240 245 250 255 260 265 270 275 280 285 290 295 300
CP 9
Cal. Mole-' Deg. ' 5.658 5.712 5.764 5.812 5.860 5.904 5.947 5.989 6.028 6.066 6.104 6.139 6.176 6.208 6.240 6.272 6.304 6.333 6.360 6.387 6.401
ACKNOWLEDGMENT
The sample used in this investigation was furnished by R.J. Weiss and was prepared under his direction in the laboratories of the Watertown Arsenal. X-ray measure- ments were carried out by C.P. Gazzara of the Watertown Arsenal. The assistance of the U. S. Atomic Energy Com- mission in this work is acknowledged.
LITERATURE CITED
(1) Armstrong, L.D., Grayson-Smith, H. , Can. J . Res. A28, 51 (1949).
(2) Arrott, A , , Zimmerman, J.E., Scientific Laboratory, Ford Motor Co., Dearborn, Mich., private communication, 1963.
(3) Booth, G.L., Hoare, F.E., Murphy, B.T., Proc. Phys. SOC. B68, 830 (1955).
(4) Craig, R.S., Krier, C.A., Coffer, L.W., Bates, E.A., Wallace, W.E., J . Am. Chem. SOC. 76, 238 (1954).
(5) Todd, S.S., Bonnickson, K.R., Ibid., 73, 3894 (1951). (6) Weiss, R.J., Tauer, K.J., J . Phys. Chem. Solids 4, 135 (1958). (7) Weiss, R.J., Watertown Arsenal, Watertown, Mass., private
communication, 1964.
RECEIVED for review May 12, 1964. Accepted December 1, 1964.
VOL. 10, No. 1, JANUARY 1965 39