HEALTH TECHNOLOGY ASSESSMENT · evaluation Mark Corbett,1 Marta Soares,2 Gurleen Jhuti,2 Stephen...
376
HEALTH TECHNOLOGY ASSESSMENT VOLUME 20 ISSUE 9 FEBRUARY 2016 ISSN 1366-5278 DOI 10.3310/hta20090 Tumour necrosis factor-α inhibitors for ankylosing spondylitis and non-radiographic axial spondyloarthritis: a systematic review and economic evaluation Mark Corbett, Marta Soares, Gurleen Jhuti, Stephen Rice, Eldon Spackman, Eleftherios Sideris, Thirimon Moe-Byrne, Dave Fox, Helena Marzo-Ortega, Lesley Kay, Nerys Woolacott and Stephen Palmer
Transcript of HEALTH TECHNOLOGY ASSESSMENT · evaluation Mark Corbett,1 Marta Soares,2 Gurleen Jhuti,2 Stephen...
HEALTH TECHNOLOGY ASSESSMENTVOLUME 20 ISSUE 9 FEBRUARY 2016
ISSN 1366-5278
DOI 10.3310/hta20090
Tumour necrosis factor-α inhibitors for ankylosing spondylitis and non-radiographic axial spondyloarthritis: a systematic review and economic evaluation
Mark Corbett, Marta Soares, Gurleen Jhuti, Stephen Rice, Eldon Spackman, Eleftherios Sideris, Thirimon Moe-Byrne, Dave Fox, Helena Marzo-Ortega, Lesley Kay, Nerys Woolacott and Stephen Palmer

Tumour necrosis factor-α inhibitorsfor ankylosing spondylitis andnon-radiographic axial spondyloarthritis:a systematic review and economicevaluation
Mark Corbett,1 Marta Soares,2 Gurleen Jhuti,2
Stephen Rice,1 Eldon Spackman,2 Eleftherios Sideris,2
Thirimon Moe-Byrne,1 Dave Fox,1
Helena Marzo-Ortega,3 Lesley Kay,3
Nerys Woolacott1* and Stephen Palmer2
1Centre for Reviews and Dissemination, University of York, York, UK2Centre for Health Economics, University of York, York, UK3Division of Rheumatic and Musculoskeletal Disease, Chapel Allerton Hospital,Leeds Teaching Hospitals NHS Trust and University of Leeds, Leeds, UK
4Department of Rheumatology, Freeman Hospital, Newcastle upon TyneHospitals NHS Foundation Trust, Newcastle upon Tyne, UK
*Corresponding author
Declared competing interests of authors: Lesley Kay has received sponsorship to attend meetings byAbbVie and Merck Sharp & Dohme Limited in 2014. Helena Marzo-Ortega has received grants,sponsorship and/or honoraria from AbbVie, Janssen, Merck Sharp & Dohme Limited, Pfizer and UCB.
Published February 2016DOI: 10.3310/hta20090
This report should be referenced as follows:
Corbett M, Soares M, Jhuti G, Rice S, Spackman E, Sideris E, et al. Tumour necrosis factor-αinhibitors for ankylosing spondylitis and non-radiographic axial spondyloarthritis: a systematic
review and economic evaluation. Health Technol Assess 2016;20(9).
Health Technology Assessment is indexed and abstracted in Index Medicus/MEDLINE, ExcerptaMedica/EMBASE, Science Citation Index Expanded (SciSearch®) and Current Contents®/Clinical Medicine.

Health Technology Assessment NICE TAR and DAR
ISSN 1366-5278 (Print)
ISSN 2046-4924 (Online)
Impact factor: 5.027
Health Technology Assessment is indexed in MEDLINE, CINAHL, EMBASE, The Cochrane Library and the ISI Science Citation Index.
This journal is a member of and subscribes to the principles of the Committee on Publication Ethics (COPE) (www.publicationethics.org/).
Editorial contact: [email protected]
The full HTA archive is freely available to view online at www.journalslibrary.nihr.ac.uk/hta. Print-on-demand copies can be purchased from thereport pages of the NIHR Journals Library website: www.journalslibrary.nihr.ac.uk
Criteria for inclusion in the Health Technology Assessment journalReports are published in Health Technology Assessment (HTA) if (1) they have resulted from work for the HTA programme, and (2) theyare of a sufficiently high scientific quality as assessed by the reviewers and editors.
Reviews in Health Technology Assessment are termed ‘systematic’ when the account of the search appraisal and synthesis methods (tominimise biases and random errors) would, in theory, permit the replication of the review by others.
HTA programmeThe HTA programme, part of the National Institute for Health Research (NIHR), was set up in 1993. It produces high-quality researchinformation on the effectiveness, costs and broader impact of health technologies for those who use, manage and provide care in the NHS.‘Health technologies’ are broadly defined as all interventions used to promote health, prevent and treat disease, and improve rehabilitationand long-term care.
The journal is indexed in NHS Evidence via its abstracts included in MEDLINE and its Technology Assessment Reports inform National Institutefor Health and Care Excellence (NICE) guidance. HTA research is also an important source of evidence for National Screening Committee (NSC)policy decisions.
For more information about the HTA programme please visit the website: http://www.nets.nihr.ac.uk/programmes/hta
This reportThe research reported in this issue of the journal was commissioned and funded by the HTA programme on behalf of NICE as project number13/46/01. The protocol was agreed in June 2014. The assessment report began editorial review in January 2015 and was accepted forpublication in April 2015. The authors have been wholly responsible for all data collection, analysis and interpretation, and for writing up theirwork. The HTA editors and publisher have tried to ensure the accuracy of the authors’ report and would like to thank the reviewers for theirconstructive comments on the draft document. However, they do not accept liability for damages or losses arising from material published inthis report.
This report presents independent research funded by the National Institute for Health Research (NIHR). The views and opinions expressed byauthors in this publication are those of the authors and do not necessarily reflect those of the NHS, the NIHR, NETSCC, the HTA programmeor the Department of Health. If there are verbatim quotations included in this publication the views and opinions expressed by theinterviewees are those of the interviewees and do not necessarily reflect those of the authors, those of the NHS, the NIHR, NETSCC, the HTAprogramme or the Department of Health.
© Queen’s Printer and Controller of HMSO 2016. This work was produced by Corbett et al. under the terms of a commissioningcontract issued by the Secretary of State for Health. This issue may be freely reproduced for the purposes of private research andstudy and extracts (or indeed, the full report) may be included in professional journals provided that suitable acknowledgementis made and the reproduction is not associated with any form of advertising. Applications for commercial reproduction should beaddressed to: NIHR Journals Library, National Institute for Health Research, Evaluation, Trials and Studies Coordinating Centre,Alpha House, University of Southampton Science Park, Southampton SO16 7NS, UK.
Published by the NIHR Journals Library (www.journalslibrary.nihr.ac.uk), produced by Prepress Projects Ltd, Perth, Scotland(www.prepress-projects.co.uk).
Editor-in-Chief
Health Technology Assessment
NIHR Journals Library
Professor Tom Walley Director, NIHR Evaluation, Trials and Studies and Director of the HTA Programme, UK
NIHR Journals Library Editors
Professor Ken Stein Chair of HTA Editorial Board and Professor of Public Health, University of Exeter Medical School, UK
Professor Andree Le May Chair of NIHR Journals Library Editorial Group (EME, HS&DR, PGfAR, PHR journals)
Dr Martin Ashton-Key Consultant in Public Health Medicine/Consultant Advisor, NETSCC, UK
Professor Matthias Beck Chair in Public Sector Management and Subject Leader (Management Group), Queen’s University Management School, Queen’s University Belfast, UK
Professor Aileen Clarke Professor of Public Health and Health Services Research, Warwick Medical School, University of Warwick, UK
Dr Tessa Crilly Director, Crystal Blue Consulting Ltd, UK
Dr Peter Davidson Director of NETSCC, HTA, UK
Ms Tara Lamont Scientific Advisor, NETSCC, UK
Professor Elaine McColl Director, Newcastle Clinical Trials Unit, Institute of Health and Society, Newcastle University, UK
Professor William McGuire Professor of Child Health, Hull York Medical School, University of York, UK
Professor Geoffrey Meads Professor of Health Sciences Research, Health and Wellbeing Research and
Professor John Norrie Health Services Research Unit, University of Aberdeen, UK
Professor John Powell Consultant Clinical Adviser, National Institute for Health and Care Excellence (NICE), UK
Professor James Raftery Professor of Health Technology Assessment, Wessex Institute, Faculty of Medicine, University of Southampton, UK
Dr Rob Riemsma Reviews Manager, Kleijnen Systematic Reviews Ltd, UK
Professor Helen Roberts Professor of Child Health Research, UCL Institute of Child Health, UK
Professor Helen Snooks Professor of Health Services Research, Institute of Life Science, College of Medicine, Swansea University, UK
Professor Jim Thornton Professor of Obstetrics and Gynaecology, Faculty of Medicine and Health Sciences, University of Nottingham, UK
Please visit the website for a list of members of the NIHR Journals Library Board: www.journalslibrary.nihr.ac.uk/about/editors
Editorial contact: [email protected]
Development Group, University of Winchester, UK
Editor-in-Chief
Professor Hywel Williams Director, HTA Programme, UK and Foundation Professor and Co-Director of theCentre of Evidence-Based Dermatology, University of Nottingham, UK
Professor Jonathan Ross Professor of Sexual Health and HIV, University Hospital Birmingham, UK
NIHR Journals Library www.journalslibrary.nihr.ac.uk
Abstract
Tumour necrosis factor-α inhibitors for ankylosingspondylitis and non-radiographic axial spondyloarthritis:a systematic review and economic evaluation
Mark Corbett,1 Marta Soares,2 Gurleen Jhuti,2 Stephen Rice,1
Eldon Spackman,2 Eleftherios Sideris,2 Thirimon Moe-Byrne,1
Dave Fox,1 Helena Marzo-Ortega,3 Lesley Kay,3 Nerys Woolacott1*
and Stephen Palmer2
1Centre for Reviews and Dissemination, University of York, York, UK2Centre for Health Economics, University of York, York, UK3Division of Rheumatic and Musculoskeletal Disease, Chapel Allerton Hospital, Leeds TeachingHospitals NHS Trust and University of Leeds, Leeds, UK
4Department of Rheumatology, Freeman Hospital, Newcastle upon Tyne Hospitals NHSFoundation Trust, Newcastle upon Tyne, UK
*Corresponding author [email protected]
Background: Tumour necrosis factor (TNF)-α inhibitors (anti-TNFs) are typically used when theinflammatory rheumatologic diseases ankylosing spondylitis (AS) and non-radiographic axialspondyloarthritis (nr-AxSpA) have not responded adequately to conventional therapy. Current NationalInstitute for Health and Care Excellence (NICE) guidance recommends treatment with adalimumab,etanercept and golimumab in adults with active (severe) AS only if certain criteria are fulfilled but it doesnot recommend infliximab for AS. Anti-TNFs for patients with nr-AxSpA have not previously beenappraised by NICE.
Objective: To determine the clinical effectiveness, safety and cost-effectiveness within the NHS ofadalimumab, certolizumab pegol, etanercept, golimumab and infliximab, within their licensed indications,for the treatment of severe active AS or severe nr-AxSpA (but with objective signs of inflammation).
Design: Systematic review and economic model.
Data sources: Fifteen databases were searched for relevant studies in July 2014.
Review methods: Clinical effectiveness data from randomised controlled trials (RCTs) were synthesisedusing Bayesian network meta-analysis methods. Results from other studies were summarised narratively.Only full economic evaluations that compared two or more options and considered both costs andconsequences were included in the systematic review of cost-effectiveness studies. The differences in theapproaches and assumptions used across the studies, and also those in the manufacturer’s submissions,were examined in order to explain any discrepancies in the findings and to identify key areas ofuncertainty. A de novo decision model was developed with a generalised framework for evidence synthesisthat pooled change in disease activity (BASDAI and BASDAI 50) and simultaneously synthesisedinformation on function (BASFI) to determine the long-term quality-adjusted life-year and cost burden ofthe disease in the economic model. The decision model was developed in accordance with the NICEreference case. The model has a lifetime horizon (60 years) and considers costs from the perspective of theNHS and personal social services. Health effects were expressed in terms of quality-adjusted life-years.
DOI: 10.3310/hta20090 HEALTH TECHNOLOGY ASSESSMENT 2016 VOL. 20 NO. 9
© Queen’s Printer and Controller of HMSO 2016. This work was produced by Corbett et al. under the terms of a commissioning contract issued by the Secretary of State forHealth. This issue may be freely reproduced for the purposes of private research and study and extracts (or indeed, the full report) may be included in professional journalsprovided that suitable acknowledgement is made and the reproduction is not associated with any form of advertising. Applications for commercial reproduction should beaddressed to: NIHR Journals Library, National Institute for Health Research, Evaluation, Trials and Studies Coordinating Centre, Alpha House, University of Southampton SciencePark, Southampton SO16 7NS, UK.
v
Results: In total, 28 eligible RCTs were identified and 26 were placebo controlled (mostly up to 12 weeks);17 extended into open-label active treatment-only phases. Most RCTs were judged to have a low risk ofbias overall. In both AS and nr-AxSpA populations, anti-TNFs produced clinically important benefits topatients in terms of improving function and reducing disease activity; for AS, the relative risks for ASAS40 ranged from 2.53 to 3.42. The efficacy estimates were consistently slightly smaller for nr-AxSpA thanfor AS. Statistical (and clinical) heterogeneity was more apparent in the nr-AxSpA analyses than in the ASanalyses; both the reliability of the nr-AxSpA meta-analysis results and their true relevance to patients seenin clinical practice are questionable. In AS, anti-TNFs are approximately equally effective. Effectivenessappears to be maintained over time, with around 50% of patients still responding at 2 years. Evidence foran effect of anti-TNFs delaying disease progression was limited; results from ongoing long-term studiesshould help to clarify this issue. Sequential treatment with anti-TNFs can be worthwhile but the drugsurvival response rates and benefits are reduced with second and third anti-TNFs. The de novo model,which addressed many of the issues of earlier evaluations, generated incremental cost-effectiveness ratiosranging from £19,240 to £66,529 depending on anti-TNF and modelling assumptions.
Conclusions: In both AS and nr-AxSpA populations anti-TNFs are clinically effective, although more soin AS than in nr-AxSpA. Anti-TNFs may be an effective use of NHS resources depending on whichassumptions are considered appropriate.
Future work recommendations: Randomised trials are needed to identify the nr-AxSpA population whowill benefit the most from anti-TNFs.
Study registration: This study is registered as PROSPERO CRD42014010182.
Funding: The National Institute for Health Research Health Technology Assessment programme.
ABSTRACT
NIHR Journals Library www.journalslibrary.nihr.ac.uk
vi
Contents
List of tables xi
List of figures xxi
List of boxes xxiii
Glossary xxv
List of abbreviations xxix
Plain English summary xxxi
Scientific summary xxxiii
Chapter 1 Background 1Description of health problem 1
Prognosis 2Epidemiology 2Measurement of disease 2Placebo response 2
Current service provision 4Management of disease 4
Description of technology under assessment 5
Chapter 2 Definition of decision problem 7Decision problem in terms of Population, Intervention, Comparator, Outcome,Study design and other key issues 7Previous National Institute for Health and Care Excellence appraisals 7Overall aims and objectives of assessment 7
Chapter 3 Assessment of clinical effectiveness 9Methods for reviewing effectiveness 9
Inclusion criteria 9Searches 10Data extraction 10Critical appraisal 10Methods of data synthesis 11
Clinical effectiveness results 12Quantity and quality of research available 12Clinical effectiveness results: efficacy results from randomised controlled trials 20Long-term efficacy results from open-label extensions of randomised controlled trials 38Findings from anti-tumour necrosis factor patient registry studies 42Clinical effectiveness results: adverse events 52Review of natural history of ankylosing spondylitis and non-radiographicaxial spondyloarthritis 57
Clinical effectiveness summary and conclusions 64Summary of randomised controlled trial results 64Long-term efficacy 64
DOI: 10.3310/hta20090 HEALTH TECHNOLOGY ASSESSMENT 2016 VOL. 20 NO. 9
© Queen’s Printer and Controller of HMSO 2016. This work was produced by Corbett et al. under the terms of a commissioning contract issued by the Secretary of State forHealth. This issue may be freely reproduced for the purposes of private research and study and extracts (or indeed, the full report) may be included in professional journalsprovided that suitable acknowledgement is made and the reproduction is not associated with any form of advertising. Applications for commercial reproduction should beaddressed to: NIHR Journals Library, National Institute for Health Research, Evaluation, Trials and Studies Coordinating Centre, Alpha House, University of Southampton SciencePark, Southampton SO16 7NS, UK.
vii
Adverse effects 65Natural history 65Overall conclusions 66
Chapter 4 Assessment of existing cost-effectiveness evidence 67Systematic review of existing cost-effectiveness evidence 67
Methods 67Results of review of existing cost-effectiveness evidence 67Assessment of published cost-effectiveness studies 68Summary and critique of published cost-effectiveness studies 77
Summary of manufacturers’ de novo submissions 83Overview of AbbVie (adalimumab) model 83Base-case results from AbbVie (adalimumab) model 84Overview of UCB (certolizumab) model 86Base-case results from UCB (certolizumab) model 91Overview of Pfizer (etanercept) model 92Results of Pfizer (etanercept) model 96Overview of Merck Sharp & Dohme (golimumab, infliximab) model 98Results of the Merck Sharp & Dohme (golimumab, infliximab) model 100
Chapter 5 Independent economic assessment: extended synthesis 111Ankylosing spondylitis population 112
Brief description of the data 112General aspects of implementation and software 113Exploring assumptions for the relative effectiveness of individual anti-tumour necrosisfactor treatments (modelling approach A) 113Extending the modelling approach to jointly relate outcomes (modelling approach B) 117Extending the modelling framework to synthesise change in Bath AnkylosingSpondylitis Functional Index scores (modelling approach C) 118
Non-radiographic axial spondyloarthritis population 120Brief description of the data 120Description of approaches to the synthesis 121Results of the synthesis 121Interpretation/discussion 122
Bath Ankylosing Spondylitis Disease Activity Index and Bath Ankylosing SpondylitisFunctional Index scores conditional on Bath Ankylosing Spondylitis Disease ActivityIndex response 122
Brief description of methods 122Results for ankylosing spondylitis 122Results for non-radiographic axial spondyloarthritis 125Interpretation/discussion 125
Discussion/conclusion 128
Chapter 6 Independent economic assessment: York model 129Overview 129Contribution of the York model 129Comparators 130Model structure 131Model input parameters 132
Baseline patient characteristics 132Response, change in Bath Ankylosing Spondylitis Disease Activity Index/BathAnkylosing Spondylitis Functional Index and conditional baselines 139Longer-term Bath Ankylosing Spondylitis Functional Index progression 139
CONTENTS
NIHR Journals Library www.journalslibrary.nihr.ac.uk
viii
Longer-term discontinuation 141Health-related quality of life 142Resource use and costs 145Adverse events 149Mortality 150
Analytic methods 150Sensitivity analyses 150Model validation 151
Results of the independent economic assessment 152Base-case results: ankylosing spondylitis population 152Base-case results: non-radiographic axial spondyloarthritis population 153Sensitivity analyses results: ankylosing spondylitis population 154Sensitivity analyses results: non-radiographic axial spondyloarthritis population 155
Discussion and comparison with manufacturer models 156
Chapter 7 Assessment of factors relevant to the NHS and other parties 161
Chapter 8 Discussion 163Statement of principal findings 163Strengths and limitations of the assessment 164
Strengths 164Limitations 165
Uncertainties 165
Chapter 9 Conclusions 167Implications for service provision 167Suggested research priorities 167
Acknowledgements 169
References 171
Appendix 1 Search strategies for clinical and economic reviews 191
Appendix 2 Synthesis methods for clinical efficacy network meta-analyses 199
Appendix 3 Risk-of-bias data 201
Appendix 4 Trial results 213
Appendix 5 Bath Ankylosing Spondylitis Disease Activity Index and BathAnkylosing Spondylitis Functional Index scores conditional on Bath AnkylosingSpondylitis Disease Activity Index response 227
Appendix 6 Bath Ankylosing Spondylitis Disease Activity Index and BathAnkylosing Spondylitis Functional Index scores conditional on response data 231
Appendix 7 Relative effects of anti-tumour necrosis factors 237
Appendix 8 Long-term efficacy data 245
Appendix 9 Adverse events 261
DOI: 10.3310/hta20090 HEALTH TECHNOLOGY ASSESSMENT 2016 VOL. 20 NO. 9
© Queen’s Printer and Controller of HMSO 2016. This work was produced by Corbett et al. under the terms of a commissioning contract issued by the Secretary of State forHealth. This issue may be freely reproduced for the purposes of private research and study and extracts (or indeed, the full report) may be included in professional journalsprovided that suitable acknowledgement is made and the reproduction is not associated with any form of advertising. Applications for commercial reproduction should beaddressed to: NIHR Journals Library, National Institute for Health Research, Evaluation, Trials and Studies Coordinating Centre, Alpha House, University of Southampton SciencePark, Southampton SO16 7NS, UK.
ix
Appendix 10 Quality assessment of studies included in thecost-effectiveness review 267
Appendix 11 Comparison of parameter inputs across manufacturer models 269
Appendix 12 Extended synthesis models 279
Appendix 13 Synthesis of evidence on the non-radiographic axialspondyloarthritis population 297
Appendix 14 Utility review 301
Appendix 15 Additional cost-effectiveness results 315
Appendix 16 Full incremental cost-effectiveness ratio tables for scenarios 319
CONTENTS
NIHR Journals Library www.journalslibrary.nihr.ac.uk
x
List of tables
TABLE 1 Disease assessment tools 3
TABLE 2 General trial characteristics 14
TABLE 3 Baseline characteristics of trial populations 16
TABLE 4 Risk of bias assessment results 21
TABLE 5 The AS population model DIC statistics 23
TABLE 6 The nr-AxSpA population model DIC statistics 24
TABLE 7 Results versus placebo for AS population: response outcomes atbetween 10 and 16 weeks 25
TABLE 8 Results vs. placebo for nr-AxSpA population: response outcomes at10–16 weeks 27
TABLE 9 Results vs. placebo for AS population: continuous outcomes at 10–16 weeks 28
TABLE 10 Results vs. placebo for nr-AxSpA population: continuous outcomes atbetween 10 and 16 weeks 31
TABLE 11 The difference in change from baseline for BASDAI and BASFI scoresassuming all TNFs have the same effect and assuming infliximab may be different 33
TABLE 12 Comparison of placebo response rates in trials reporting ASAS 20results together with ASAS 40 or BASDAI 50 results 35
TABLE 13 Baseline characteristics of trials analysed by the FDA 37
TABLE 14 Food and Drug Administration analyses: percentage differences fromplacebo, by method of diagnosis 37
TABLE 15 Treatment effect over time (AS only) (results calculated usingnon-responder imputation) 39
TABLE 16 Treatment effect over time (nr-AxSpA only) 40
TABLE 17 Observed or completer analysis results 41
TABLE 18 Effect of anti-TNFs on radiographic progression 42
TABLE 19 Summary of long-term results for mSASSS change 43
TABLE 20 Registry studies reporting data on drug survival and anti-TNF switching 45
TABLE 21 Drug survival results from analysis of DANBIO registry 51
DOI: 10.3310/hta20090 HEALTH TECHNOLOGY ASSESSMENT 2016 VOL. 20 NO. 9
© Queen’s Printer and Controller of HMSO 2016. This work was produced by Corbett et al. under the terms of a commissioning contract issued by the Secretary of State forHealth. This issue may be freely reproduced for the purposes of private research and study and extracts (or indeed, the full report) may be included in professional journalsprovided that suitable acknowledgement is made and the reproduction is not associated with any form of advertising. Applications for commercial reproduction should beaddressed to: NIHR Journals Library, National Institute for Health Research, Evaluation, Trials and Studies Coordinating Centre, Alpha House, University of Southampton SciencePark, Southampton SO16 7NS, UK.
xi

TABLE 22 Efficacy results from analysis of DANBIO registry 51
TABLE 23 Cochrane summary of findings table for biologics as a class(reproduced with permission from Singh et al.) 53
TABLE 24 Cochrane summary of findings table for individual anti-TNFs(adapted from Singh et al.) 54
TABLE 25 Prevalence ranges of SAEs from non-randomised studies and RCTs(reproduced from Rodgers et al.) 55
TABLE 26 Studies with adverse event data at around 2 years (or later) 56
TABLE 27 Natural history of axSpA: relevant outcomes and impact of anti-TNFs 58
TABLE 28 Lifetime cost per QALY estimates reported by Kobelt et al.(NHS and PSS perspective) 69
TABLE 29 Bath Ankylosing Spondylitis Disease Activity Index, BASFI and EQ-5Dmeasurements at weeks 12 and 24 69
TABLE 30 Twenty-five-year cost per QALY estimates reported by Ara et al.(NHS and PSS perspective) 70
TABLE 31 Thirty-year cost per QALY estimates reported by Botteman et al.(NHS and PSS perspective) 72
TABLE 32 Manufacturer cost-effectiveness results: 20-year horizon 76
TABLE 33 Evidence Review Group exploratory cost-effectiveness results:lifetime horizon 77
TABLE 34 Evidence Review Group exploratory cost-effectiveness results:correction for BASFI error (from NICE TA233) 77
TABLE 35 Evidence Review Group exploratory cost-effectiveness results:correction for BASFI error and common BASFI progression after 2 years(from NICE TA233) 77
TABLE 36 Tumour necrosis factor-α inhibitors compared with CC for AS:AbbVie (base case) 84
TABLE 37 Fully incremental comparison of anti-TNFs for AS: assessment groupanalysis based on AbbVie (base case) 85
TABLE 38 Anti-TNFs compared with CC for nr-AxSpA: AbbVie (base case) 85
TABLE 39 Fully incremental comparison of anti-TNFs for nr-AxSpA: assessmentgroup analysis based on AbbVie (base case) 85
TABLE 40 Base-case model inputs: ASAS 20 response at week 24(AS subpopulation, certolizumab pegol-pooled dosing) 86
LIST OF TABLES
NIHR Journals Library www.journalslibrary.nihr.ac.uk
xii
TABLE 41 Base-case model inputs: ASAS 20 response at week 12(nr-AxSpA subpopulation, certolizumab pegol-pooled dosing) 87
TABLE 42 Base-case model inputs: change from baseline in BASFI score atweek 24 (AS subpopulation, certolizumab pegol-pooled dosing) 87
TABLE 43 Base-case model inputs: change from baseline in BASDAI score atweek 24 (AS subpopulation, certolizumab pegol-pooled dosing) 88
TABLE 44 Base-case model inputs: change from baseline in BASFI score atweek 12 (nr-AxSpA subpopulation, certolizumab pegol-pooled dosing) 89
TABLE 45 Base-case model inputs: change from baseline in BASDAI score atweek 12 (nr-AxSpA subpopulation, certolizumab pegol-pooled dosing) 89
TABLE 46 Tumour necrosis factor-α inhibitors compared with CC for AS:UCB (base case) 91
TABLE 47 Fully incremental comparison of anti-TNFs for AS: assessment groupanalysis based on UCB (base case) 91
TABLE 48 Tumour necrosis factor-α inhibitors compared with CC for nr-AxSpA:UCB (base case) 92
TABLE 49 Fully incremental comparison of anti-TNFs for nr-AxSpA: assessmentgroup analysis based on UCB (base case) 92
TABLE 50 Tumour necrosis factor-α inhibitors compared with CC for AS:Pfizer (base case) 96
TABLE 51 Fully incremental comparison of anti-TNFs for AS: assessment groupanalysis based on Pfizer (base case) 97
TABLE 52 Anti-TNFs compared with CC for nr-AxSpA: Pfizer (base case) 97
TABLE 53 Fully incremental comparison of nr-AxSpA: assessment group analysisbased on Pfizer (base case) 97
TABLE 54 Incremental results of etanercept vs. adalimumab in nr-AxSpA(using MAIC data): Pfizer 98
TABLE 55 Odds ratios and probability of BASDAI 50 score response to anti-TNFsand conventional therapy (Merck Sharp & Dohme) 98
TABLE 56 Short-term regression equations used by Merck Sharp & Dohmefor BASDAI/BASFI score (0–24 weeks): all patients 99
TABLE 57 Long-term regression equations used by Merck Sharp & Dohmefor BASDAI/BASFI score (24–108 weeks): responders only 100
TABLE 58 Anti-TNFs compared with CC for AS: Merck Sharp & Dohme (base case) 101
DOI: 10.3310/hta20090 HEALTH TECHNOLOGY ASSESSMENT 2016 VOL. 20 NO. 9
© Queen’s Printer and Controller of HMSO 2016. This work was produced by Corbett et al. under the terms of a commissioning contract issued by the Secretary of State forHealth. This issue may be freely reproduced for the purposes of private research and study and extracts (or indeed, the full report) may be included in professional journalsprovided that suitable acknowledgement is made and the reproduction is not associated with any form of advertising. Applications for commercial reproduction should beaddressed to: NIHR Journals Library, National Institute for Health Research, Evaluation, Trials and Studies Coordinating Centre, Alpha House, University of Southampton SciencePark, Southampton SO16 7NS, UK.
xiii
TABLE 59 Fully incremental comparison of anti-TNFs for AS: assessment groupanalysis based on Merck Sharp & Dohme (base case) 101
TABLE 60 Comparison of manufacturer ICER estimates vs. CC (AS population) 101
TABLE 61 Comparison of manufacturer ICER estimates vs. CC (nr-AxSpApopulation) 102
TABLE 62 Model structure and key structural assumptions: AS population 103
TABLE 63 Model structure and key structural assumptions: nr-AxSpA population 104
TABLE 64 The BASDAI score difference for treatment responders vs.CC: AS population 106
TABLE 65 The BASFI score difference for responders vs. CC: AS population 106
TABLE 66 The BASDAI score difference for responders vs. CC: nr-AxSpA population 107
TABLE 67 The BASFI score difference for responders vs. CC: nr-AxSpA population 107
TABLE 68 Evidence on BASDAI- and BASFI-related outcomes for the AS population 112
TABLE 69 Assumptions over the relative effectiveness of anti-TNFtreatments: results 115
TABLE 70 Shrunken estimates of treatment effect from model A5 116
TABLE 71 Modelling approach B: results 117
TABLE 72 Shrunken estimates of treatment effect from model B 118
TABLE 73 Modelling approach C: results 119
TABLE 74 Shrunken estimates of treatment effect from model C 120
TABLE 75 Evidence on BASDAI and BASFI-related outcomes for thenr-AxSpA population 120
TABLE 76 Nr-axSpA population: results 121
TABLE 77 Conditional scores predicted for the AS population using thesynthesis model 123
TABLE 78 Conditional scores observed in trials in AS 124
TABLE 79 Conditional scores predicted for the nr-AxSpA population using resultsand assumptions of the synthesis model 126
TABLE 80 Conditional scores observed in trials in nr-AxSpA 127
TABLE 81 Comparators evaluated in the different indications 130
LIST OF TABLES
NIHR Journals Library www.journalslibrary.nihr.ac.uk
xiv
TABLE 82 List of parameter estimates used in the York model: AS population 133
TABLE 83 List of parameter estimates used in the York model: nr-AxSpA population136
TABLE 84 Comparison of alternative EQ-5D utility regression models (AS) 143
TABLE 85 Comparison of alternative EQ-5D utility regression models (nr-AxSpA) 143
TABLE 86 Drug acquisition costs 145
TABLE 87 Anti-TNFs licensed dosage in AS and nr-AxSpA 145
TABLE 88 Drug administration costs 146
TABLE 89 Initiation and monitoring resource use and costs: AS population 147
TABLE 90 Initiation and monitoring resource use and costs: nr-AxSpA population 147
TABLE 91 Summary of drug acquisition, administration and monitoring costsused in economic model: AS population 148
TABLE 92 Summary of drug acquisition, administration and monitoring costsused in economic model: nr-AxSpA population 148
TABLE 93 Disease-related costs 149
TABLE 94 Costs of serious infection (from Pfizer submission) 149
TABLE 95 Base-case cost-effectiveness results: AS (rebound equal to gain) 152
TABLE 96 Base-case cost-effectiveness results: AS (rebound to CC) 152
TABLE 97 Base-case cost-effectiveness results: nr-AxSpA (rebound equal to gain) 153
TABLE 98 Base-case cost-effectiveness results: nr-AxSpA (rebound to CC) 153
TABLE 99 Summary of cost-effectiveness scenarios: AS population 154
TABLE 100 Summary of ICERs across scenarios (rebound equal to gain):AS population 154
TABLE 101 Summary of ICERs across scenarios (rebound to CC): AS population 155
TABLE 102 Summary of cost-effectiveness scenarios: nr-AxSpA population 155
TABLE 103 Summary of ICERs across scenarios (rebound equal to gain):nr-AxSpA population 156
TABLE 104 Summary of ICERs across scenarios (rebound to CC):nr-AxSpA population 156
TABLE 105 Comparison of cost-effectiveness results from York model vs.manufacturers (AS population) 157
DOI: 10.3310/hta20090 HEALTH TECHNOLOGY ASSESSMENT 2016 VOL. 20 NO. 9
© Queen’s Printer and Controller of HMSO 2016. This work was produced by Corbett et al. under the terms of a commissioning contract issued by the Secretary of State forHealth. This issue may be freely reproduced for the purposes of private research and study and extracts (or indeed, the full report) may be included in professional journalsprovided that suitable acknowledgement is made and the reproduction is not associated with any form of advertising. Applications for commercial reproduction should beaddressed to: NIHR Journals Library, National Institute for Health Research, Evaluation, Trials and Studies Coordinating Centre, Alpha House, University of Southampton SciencePark, Southampton SO16 7NS, UK.
xv
TABLE 106 Comparison of cost-effectiveness results from York model vs.manufacturers (nr-AxSpA population) 157
TABLE 107 Non-radiographic axial spondyloarthritis: additional validationscenario (rebound equal to gain and responders/non-responders do not differ interms of baseline BASDAI/BASFI scores) 159
TABLE 108 The class and independent BASDAI change from baseline of theanti-TNFs vs. placebo assuming 0.3 and 0.7 within-study correlation 200
TABLE 109 Full risk-of-bias results 202
TABLE 110 Prognostic indicators of important baseline imbalance used inrisk-of-bias assessment 212
TABLE 111 Continuous outcomes: final values results 214
TABLE 112 Continuous outcomes: change from baseline results 218
TABLE 113 Binary response outcomes results 223
TABLE 114 Conditional scores predicted for the AS population using thesynthesis model 228
TABLE 115 Conditional scores predicted for the nr-AxSpA population usingresults and assumptions of the synthesis model 229
TABLE 116 Baseline BASDAI score according to conditional on response atweek 12 (or nearest time point) 231
TABLE 117 Baseline BASFI according to conditional on response at week 12(or nearest time point) 234
TABLE 118 Relative effects relative risk BASDAI 50 AS 237
TABLE 119 Relative effects OR BASDAI 50 AS 237
TABLE 120 Relative effects relative risk ASAS 20 AS 238
TABLE 121 Relative effects OR ASAS 20 AS 238
TABLE 122 Relative effects relative risk ASAS 40 AS 239
TABLE 123 Relative effects OR ASAS 40 AS 239
TABLE 124 Relative effects relative risk ASAS 50 AS 239
TABLE 125 Relative effects OR ASAS 50 AS 240
TABLE 126 Relative effects mean difference BASDAI change from baseline AS 240
TABLE 127 Relative effects mean difference BASFI change from baseline AS 240
LIST OF TABLES
NIHR Journals Library www.journalslibrary.nihr.ac.uk
xvi
TABLE 128 Relative effects mean difference BASMI change from baseline AS 241
TABLE 129 Relative effects mean difference SF-36 PCS change from baseline AS 241
TABLE 130 Relative effects mean difference MASES change from baseline AS 241
TABLE 131 Relative effects mean difference SF-36 MCS change from baseline AS 241
TABLE 132 Relative effects relative risk BASDAI 50 nr-AxSpA 242
TABLE 133 Relative effects OR BASDAI 50 nr-AxSpA 242
TABLE 134 Relative effects relative risk ASAS 20 nr-AxSpA 242
TABLE 135 Relative effects OR ASAS 20 nr-AxSpA 242
TABLE 136 Relative effects relative risk ASAS 40 nr-AxSpA 243
TABLE 137 Relative effects OR ASAS 40 nr-AxSpA 243
TABLE 138 Relative effects mean difference BASDAI change from baselinenr-AxSpA 243
TABLE 139 Relative effects mean difference BASFI change from baselinenr-AxSpA 243
TABLE 140 Relative effects mean difference BASMI change from baselinenr-AxSpA 244
TABLE 141 Relative effects mean difference SF-36 PCS change from baselinenr-AxSpA 244
TABLE 142 Relative effects mean difference SF-36 MCS change from baselinenr-AxSpA 244
TABLE 143 Data from open label extensions of included RCTs 246
TABLE 144 Adverse events in RCT placebo phases 262
TABLE 145 Quality assessment of studies included in the cost-effectiveness review 267
TABLE 146 Summary of main model inputs in manufacturer models:AS population 269
TABLE 147 Summary of main model inputs in manufacturer models:nr-AxSpA population 270
TABLE 148 Cost inputs in manufacturer’s submissions (AS and nr-AxSpApopulation) 275
TABLE 149 Withdrawal inputs in manufacturer’s submissions (AS and nr-AxSpApopulation) 276
DOI: 10.3310/hta20090 HEALTH TECHNOLOGY ASSESSMENT 2016 VOL. 20 NO. 9
© Queen’s Printer and Controller of HMSO 2016. This work was produced by Corbett et al. under the terms of a commissioning contract issued by the Secretary of State forHealth. This issue may be freely reproduced for the purposes of private research and study and extracts (or indeed, the full report) may be included in professional journalsprovided that suitable acknowledgement is made and the reproduction is not associated with any form of advertising. Applications for commercial reproduction should beaddressed to: NIHR Journals Library, National Institute for Health Research, Evaluation, Trials and Studies Coordinating Centre, Alpha House, University of Southampton SciencePark, Southampton SO16 7NS, UK.
xvii
TABLE 150 Adverse events inputs in manufacturer’s submissions: AS population 277
TABLE 151 Adverse events inputs in manufacturer’s submissions:nr-AxSpA population 277
TABLE 152 Evidence on BASDAI and BASFI score-related outcomes for theAS population 280
TABLE 153 Modelling approach A: data 280
TABLE 154 Modelling approach A: results 285
TABLE 155 Shrunken estimates of treatment effect from model A5 286
TABLE 156 Data used in modelling approach B and C 287
TABLE 157 Modelling approach B: results 291
TABLE 158 Shrunken estimates of treatment effect from model B 291
TABLE 159 Modelling approach C: results 294
TABLE 160 Shrunken estimates of treatment effect from model C 295
TABLE 161 Evidence on BASDAI and BASFI-related outcomes for thenr-AxSpA population 297
TABLE 162 Data on the nr-AxSpA population 297
TABLE 163 Non-radiographic axial spondyloarthritis population: results 298
TABLE 164 Summary of utility studies that meet the NICE reference case 302
TABLE 165 Conditional scores predicted for the AS population using thesynthesis model (truncated baseline BASDAI) 315
TABLE 166 Revised base-case cost-effectiveness results (truncated normal):AS (rebound equal to gain) 316
TABLE 167 Revised base-case cost-effectiveness results (truncated normal):AS (rebound to CC) 316
TABLE 168 Conditional scores predicted for the nr-AxSpA population using thesynthesis model (truncated baseline BASDAI) 317
TABLE 169 Revised base-case cost-effectiveness results (truncated normal):nr-AxSpA (rebound equal to gain) 317
TABLE 170 Revised base-case cost-effectiveness results (truncated normal):nr-AxSpA (rebound to CC) 317
TABLE 171 Revised base-case results using list price for Remsima: AS population(rebound equal to gain) 318
LIST OF TABLES
NIHR Journals Library www.journalslibrary.nihr.ac.uk
xviii
TABLE 172 Revised base-case results using list price for Remsima: AS population(rebound to CC) 318
TABLE 173 Summary of cost-effectiveness scenarios: AS population 319
TABLE 174 Ankylosing spondylitis: scenario 1 (rebound equal to gain) 319
TABLE 175 Ankylosing spondylitis: scenario 2 (rebound equal to gain) 320
TABLE 176 Ankylosing spondylitis: scenario 3 (rebound equal to gain) 320
TABLE 177 Ankylosing spondylitis: scenario 4 (rebound equal to gain) 321
TABLE 178 Ankylosing spondylitis: scenario 5 (rebound equal to gain) 321
TABLE 179 Ankylosing spondylitis: scenario 6 (rebound equal to gain) 322
TABLE 180 Ankylosing spondylitis: scenario 7 (rebound equal to gain) 322
TABLE 181 Ankylosing spondylitis: scenario 1 (rebound to CC) 323
TABLE 182 Ankylosing spondylitis: scenario 2 (rebound to CC) 323
TABLE 183 Ankylosing spondylitis: scenario 3 (rebound to CC) 324
TABLE 184 Ankylosing spondylitis: scenario 4 (rebound to CC) 324
TABLE 185 Ankylosing spondylitis: scenario 5 (rebound to CC) 325
TABLE 186 Ankylosing spondylitis: scenario 6 (rebound to CC) 325
TABLE 187 Ankylosing spondylitis: scenario 7 (rebound to CC) 326
TABLE 188 Summary of cost-effectiveness scenarios: nr-AxSpA population 326
TABLE 189 Non-radiographic axial spondyloarthritis: scenario 1 (rebound equalto gain) 327
TABLE 190 Non-radiographic axial spondyloarthritis: scenario 2 (rebound equalto gain) 327
TABLE 191 Non-radiographic axial spondyloarthritis: scenario 3 (rebound equalto gain) 327
TABLE 192 Non-radiographic axial spondyloarthritis: scenario 4 (rebound equalto gain) 328
TABLE 193 Non-radiographic axial spondyloarthritis: scenario 5 (rebound equalto gain) 328
TABLE 194 Non-radiographic axial spondyloarthritis: scenario 6 (rebound equalto gain) 328
DOI: 10.3310/hta20090 HEALTH TECHNOLOGY ASSESSMENT 2016 VOL. 20 NO. 9
© Queen’s Printer and Controller of HMSO 2016. This work was produced by Corbett et al. under the terms of a commissioning contract issued by the Secretary of State forHealth. This issue may be freely reproduced for the purposes of private research and study and extracts (or indeed, the full report) may be included in professional journalsprovided that suitable acknowledgement is made and the reproduction is not associated with any form of advertising. Applications for commercial reproduction should beaddressed to: NIHR Journals Library, National Institute for Health Research, Evaluation, Trials and Studies Coordinating Centre, Alpha House, University of Southampton SciencePark, Southampton SO16 7NS, UK.
xix
TABLE 195 Non-radiographic axial spondyloarthritis: scenario 7 (rebound equalto gain) 329
TABLE 196 Non-radiographic axial spondyloarthritis: scenario 1 (rebound to CC) 329
TABLE 197 Non-radiographic axial spondyloarthritis: scenario 2 (rebound to CC) 329
TABLE 198 Non-radiographic axial spondyloarthritis: scenario 3 (rebound to CC) 330
TABLE 199 Non-radiographic axial spondyloarthritis: scenario 4 (rebound to CC) 330
TABLE 200 Non-radiographic axial spondyloarthritis: scenario 5 (rebound to CC) 330
TABLE 201 Non-radiographic axial spondyloarthritis: scenario 6 (rebound to CC) 331
TABLE 202 Non-radiographic axial spondyloarthritis: scenario 7 (rebound to CC) 331
TABLE 203 Ankylosing spondylitis: rebound equal to gain 332
TABLE 204 Ankylosing spondylitis: rebound to CC 332
TABLE 205 Non-radiographic axial spondyloarthritis: rebound equal to gain 333
TABLE 206 Non-radiographic axial spondyloarthritis: rebound to CC 333
LIST OF TABLES
NIHR Journals Library www.journalslibrary.nihr.ac.uk
xx
List of figures
FIGURE 1 Flow chart showing the number of studies identified and included 13
FIGURE 2 Illustration of the scenario of rebound equal to gain 80
FIGURE 3 Illustration of the scenario of rebound to CC 80
FIGURE 4 Observed mean BASDAI and BASFI scores for adalimumab ASAS 20responders in the licensed population from ATLAS (AS) 83
FIGURE 5 Observed mean BASDAI and BASFI scores for adalimumab ASAS 40responders in the licensed population from ABILITY-1 (nr-AxSpA) 83
FIGURE 6 Pfizer DES model schematic 94
FIGURE 7 AiC information has been removed 96
FIGURE 8 AiC information has been removed 96
FIGURE 9 Comparison of cohort BASDAI/BASFI scores for AS population fromAbbVie model (adalimumab) 105
FIGURE 10 Comparison of cohort BASDAI/BASFI scores for AS population fromUCB model (certolizumab) 105
FIGURE 11 Comparison of cohort BASDAI/BASFI scores for AS population fromMerck Sharp & Dohme models (golimumab/infliximab) 105
FIGURE 12 Comparison of cohort BASDAI/BASFI scores for nr-AxSpA populationfrom AbbVie model (adalimumab) 106
FIGURE 13 Comparison of cohort BASDAI/BASFI scores for nr-AxSpA populationfrom UCB model (certolizumab) 107
FIGURE 14 Scatterplot of BASDAI and BASFI change scores observed in thetrials (AS) 119
FIGURE 15 A simplified schematic of the York model structure 131
FIGURE 16 Comparison of withdrawal rates: AS population 141
FIGURE 17 Comparison of withdrawal rates: nr-AxSpA population 142
FIGURE 18 Illustration of predicted EQ-5D values using different mappingalgorithms: constant BASDAI and varying BASFI (AS) 144
FIGURE 19 Illustration of predicted EQ-5D values using different mappingalgorithms: constant BASFI and varying BASDAI (AS) 144
FIGURE 20 AiC information has been removed 144
DOI: 10.3310/hta20090 HEALTH TECHNOLOGY ASSESSMENT 2016 VOL. 20 NO. 9
© Queen’s Printer and Controller of HMSO 2016. This work was produced by Corbett et al. under the terms of a commissioning contract issued by the Secretary of State forHealth. This issue may be freely reproduced for the purposes of private research and study and extracts (or indeed, the full report) may be included in professional journalsprovided that suitable acknowledgement is made and the reproduction is not associated with any form of advertising. Applications for commercial reproduction should beaddressed to: NIHR Journals Library, National Institute for Health Research, Evaluation, Trials and Studies Coordinating Centre, Alpha House, University of Southampton SciencePark, Southampton SO16 7NS, UK.
xxi
FIGURE 21 AiC information has been removed 144
FIGURE 22 Comparison of main manufacturer cost regressions: assumingconstant BASDAI score 273
FIGURE 23 Comparison of main manufacturer cost regressions: assumingconstant BASFI score 273
FIGURE 24 Comparison of AbbVie cost regressions: assuming constantBASDAI score 274
FIGURE 25 Comparison of AbbVie cost regressions: assuming constantBASFI score 274
FIGURE 26 WinBUGS code for modelling approach B 290
FIGURE 27 WinBUGS code for modelling approach C 293
LIST OF FIGURES
NIHR Journals Library www.journalslibrary.nihr.ac.uk
xxii
List of boxes
BOX 1 Modified New York criteria for AS (1984) 1
DOI: 10.3310/hta20090 HEALTH TECHNOLOGY ASSESSMENT 2016 VOL. 20 NO. 9
© Queen’s Printer and Controller of HMSO 2016. This work was produced by Corbett et al. under the terms of a commissioning contract issued by the Secretary of State forHealth. This issue may be freely reproduced for the purposes of private research and study and extracts (or indeed, the full report) may be included in professional journalsprovided that suitable acknowledgement is made and the reproduction is not associated with any form of advertising. Applications for commercial reproduction should beaddressed to: NIHR Journals Library, National Institute for Health Research, Evaluation, Trials and Studies Coordinating Centre, Alpha House, University of Southampton SciencePark, Southampton SO16 7NS, UK.
xxiii

Glossary
Adverse effect An abnormal or harmful effect caused by, and attributable to, exposure to a chemical(e.g. a drug), which is indicated by some result such as death, a physical symptom or visible illness. Aneffect may be classed as adverse if it causes functional or anatomical damage, causes irreversible change inthe homeostasis of the organism or increases the susceptibility of the organism to other chemical orbiological stress.
Ankylosing spondylitis A rheumatic disease that affects the spine and may lead to some degree ofstiffness in the back. As the inflammation reduces and healing takes place, bone grows out from bothsides of the vertebrae and may join the two together; this stiffening is called ankylosis. If definite, changesto spinal and/or pelvic joints are present on plain radiographs.
Articular Of or relating to the joints.
Axial spondyloarthritis Refers to a form of arthritis in which the predominant symptom is back pain dueto inflammation of spinal and/or pelvic joints. If definite changes on plain radiographs are present, thedisease is classified as ankylosing spondylitis, but if they are absent the disease is classified asnon-radiographic axial spondyloarthritis. Further tests may indicate that in some patients it is very likelythat non-radiographic axial spondyloarthritis is ankylosing spondylitis, only at an earlier stage of disease.
Between-study variance Between-study variance is a measure of statistical heterogeneity that dependson the scale of the outcome measured. It represents the variation in reported study effects over and abovethe variation expected given the within-study variation.
Biologic therapies (synonym: biological) Medical preparations derived from living organisms. Includesanti-tumour necrosis factor drugs and other new drugs which target pathologically active T cells.
Biosimilar An imitation biological medical product (such as an anti-tumour necrosis factor) usuallymarketed by a different manufacturer to the original biological product, once a patent has expired.The biosimilar should be similar to the original licensed product in terms of safety and efficacy.
C-reactive protein Concentrations of this protein in the blood can be measured as a test of inflammationor disease activity, for example in ankylosing spondylitis and non-radiographic axial spondyloarthritis.
Corticosteroid A synthetic hormone, similar to that produced naturally by the adrenal glands, which isavailable in pill, topical and injectable forms.
Cost–benefit analysis An economic analysis that converts the effects or consequences of interventionsinto the same monetary terms as the costs and compares them using a measure of net benefit or acost–benefit ratio.
Cost-effectiveness analysis An economic analysis that expresses the effects or consequences ofinterventions on a single dimension. This would normally be expressed in ‘natural’ units (e.g. cases cured,life-years gained or additional strokes prevented). The difference between interventions in terms of costsand effects is typically expressed as an incremental cost-effectiveness ratio (e.g. the incremental cost perlife-year gained).
Cost–utility analysis The same as a cost-effectiveness analysis but the effects or consequences ofinterventions are expressed in generic units of health gain, usually quality-adjusted life-years.
DOI: 10.3310/hta20090 HEALTH TECHNOLOGY ASSESSMENT 2016 VOL. 20 NO. 9
© Queen’s Printer and Controller of HMSO 2016. This work was produced by Corbett et al. under the terms of a commissioning contract issued by the Secretary of State forHealth. This issue may be freely reproduced for the purposes of private research and study and extracts (or indeed, the full report) may be included in professional journalsprovided that suitable acknowledgement is made and the reproduction is not associated with any form of advertising. Applications for commercial reproduction should beaddressed to: NIHR Journals Library, National Institute for Health Research, Evaluation, Trials and Studies Coordinating Centre, Alpha House, University of Southampton SciencePark, Southampton SO16 7NS, UK.
xxv
Credible interval In Bayesian statistics, a credible interval is a posterior probability interval estimationwhich incorporates problem-specific contextual information from the prior distribution. Credible intervalsare used for the purposes similar to those of confidence intervals in frequentist statistics.
Disease-modifying antirheumatic drugs Disease-modifying antirheumatic drugs are drugs capable ofmodifying the progression of rheumatic disease. The term is, however, applied to what are nowconsidered to be traditional disease-modifying drugs, in particular sulphasalazine, methotrexate andciclosporin, as well as azathioprine, cyclophosphamide, antimalarials, penicillamine and gold. The neweragent leflunomide may be included as a disease-modifying antirheumatic drug. The biologics such asetanercept and infliximab are not generally referred to as disease-modifying antirheumatic drugs.
Erythrocyte sedimentation rate One of the tests designed to measure the degree of inflammation.
Fixed-effect model A statistical model that stipulates that the units under analysis (e.g. people in a trialor study in a meta-analysis) are the ones of interest, and thus constitute the entire population of units.Only within-study variation is taken to influence the uncertainty of results (as reflected in the confidenceinterval) of a meta-analysis using a fixed-effect model.
Heterogeneity In systematic reviews heterogeneity refers to variability or differences between studies inthe estimates of effects. A distinction is sometimes made between ‘statistical heterogeneity’ (differencesin the reported effects), ‘methodological heterogeneity’ (differences in study design) and ‘clinicalheterogeneity’ (differences between studies in key characteristics of the participants, interventions oroutcome measures).
I-squared (I2) A measure of ‘statistical heterogeneity’ (differences in the reported effects). It variesbetween 0 and 1, for which 0 indicates that the differences in reported effects are entirely consistent withthe within-study uncertainty and 1 indicates that the differences in reported effects are entirely explainedby study characteristics that vary across studies.
Intention to treat An intention-to-treat analysis is one in which all the participants in a trial are analysedaccording to the intervention to which they were allocated, whether or not they received it.
Monoclonal antibody An antibody produced in a laboratory from a single clone that recognises onlyone antigen.
Non-radiographic axial spondyloarthritis Axial spondyloarthritis for which definite changes to spinaland/or pelvic joints on plain radiographs are not present. Further tests may indicate that in some patients itis very likely that non-radiographic axial spondyloarthritis ankylosing spondylitis, only at an earlier stageof disease.
Non-steroidal anti-inflammatory drugs Consists of a large range of drugs of the aspirin family,prescribed for different kinds of arthritis which reduce inflammation and control pain, swellingand stiffness.
Open-label study A type of study in which both participants and researchers know which treatment isbeing administered.
Placebo An inactive substance or procedure administered to a patient, usually to compare its effects withthose of a real drug or other intervention but sometimes for the psychological benefit to the patientthrough a belief that s/he is receiving treatment.
GLOSSARY
NIHR Journals Library www.journalslibrary.nihr.ac.uk
xxvi
Quality-adjusted life-year An index of health gain in which survival duration is weighted or adjusted bythe patient’s quality of life during the survival period. Quality-adjusted life-years have the advantage ofincorporating changes in both quantity (mortality) and quality (morbidity) of life.
Quality of life A concept incorporating all the factors that might impact on an individual’s life, includingfactors such as the absence of disease or infirmity as well as other factors which might affect their physical,mental and social well-being.
Random-effects model A statistical model sometimes used in meta-analysis in which both within-studysampling error (variance) and between-studies variation are included in the assessment of the uncertainty(confidence interval) of the results of a meta-analysis.
Randomised controlled trial (synonym: randomised clinical trial) An experiment in whichinvestigators randomly allocate eligible people into intervention groups to receive, or not to receive, one ormore interventions that are being compared.
Relative risk (synonym: risk ratio) The ratio of risk in the intervention group to the risk in the controlgroup. The risk (proportion, probability or rate) is the ratio of people with an event in a group to the totalin the group. A relative risk of one indicates no difference between comparison groups. For undesirableoutcomes, a relative risk that is less than one indicates that the intervention was effective in reducing therisk of that outcome.
Sensitivity analysis An analysis used to determine how sensitive the results of a study or systematicreview are to changes in how it was done. Sensitivity analyses are used to assess how robust the resultsare to uncertain decisions or assumptions about the data and the methods that were used.
Tumour necrosis factor One of the cytokines, or messengers, known to be involved in the process ofsystemic inflammation.
Weighted mean difference (in meta-analysis) A method of meta-analysis used to combine measureson continuous scales, where the mean, standard deviation and sample size in each group are known.The weight given to each study is determined by the precision of its estimate of effect and is equal to theinverse of the variance. This method assumes that all of the trials have measured the outcome onthe same scale.
DOI: 10.3310/hta20090 HEALTH TECHNOLOGY ASSESSMENT 2016 VOL. 20 NO. 9
© Queen’s Printer and Controller of HMSO 2016. This work was produced by Corbett et al. under the terms of a commissioning contract issued by the Secretary of State forHealth. This issue may be freely reproduced for the purposes of private research and study and extracts (or indeed, the full report) may be included in professional journalsprovided that suitable acknowledgement is made and the reproduction is not associated with any form of advertising. Applications for commercial reproduction should beaddressed to: NIHR Journals Library, National Institute for Health Research, Evaluation, Trials and Studies Coordinating Centre, Alpha House, University of Southampton SciencePark, Southampton SO16 7NS, UK.
xxvii

List of abbreviations
AE adverse event
AiC academic in confidence
AS ankylosing spondylitis
ASAS Assessment in AnkylosingSpondylitis
ASDAS Ankylosing Spondylitis DiseaseActivity Score
ASQoL Ankylosing Spondylitis Qualityof Life
ASSERT Ankylosing Spondylitis Study forthe Evaluation of RecombinantInfliximab Therapy
ATLAS Adalimumab Trial Evaluating Long-term Efficacy and Safety forAnkylosing Spondylitis
ATP adalimumab target population
axSpA axial spondyloarthritis
BASDAI Bath Ankylosing Spondylitis DiseaseActivity Index
BASFI Bath Ankylosing SpondylitisFunctional Index
BASMI Bath Ankylosing SpondylitisMetrology Index
BSR British Society for Rheumatology
BSRBR British Society for RheumatologyBiologics Register
CC conventional care
CI confidence interval
CiC commercial in confidence
CrI credible interval
CRP C-reactive protein
DES discrete event simulation
DIC deviance information criterion
DMARD disease-modifying antirheumaticdrug
DSU Decision Support Unit
EQ-5D European Quality of Life-5Dimensions
ERG Evidence Review Group
ESR erythrocyte sedimentation rate
FDA Food and Drug Administration
GESPIC German SpondyloarthritisInception Cohort
HLA human leucocyte antigen
HRG Healthcare Resource Group
HRQoL health-related quality of life
HUI Health Utilities Index
ICER incremental cost-effectiveness ratio
ITT intention to treat
LOCF last observation carried forward
LRiG Liverpool Reviews andImplementation Group
MAIC match-adjusted indirect comparison
MASES Maastricht Ankylosing SpondylitisEnthesitis Score
MCID minimum clinically importantdifference
mCMC Markov chain Monte Carlo
MCS mental component summary
mITT modified intention to treat
MRI magnetic resonance imaging
mSASSS modified Stoke AnkylosingSpondylitis Spinal Score
MTC mixed treatment comparison
NHS EED NHS Economic Evaluation Database
NICE National Institute for Health andCare Excellence
NNH number needed to harm
nr-AxSpA non-radiographic axialspondyloarthritis
DOI: 10.3310/hta20090 HEALTH TECHNOLOGY ASSESSMENT 2016 VOL. 20 NO. 9
© Queen’s Printer and Controller of HMSO 2016. This work was produced by Corbett et al. under the terms of a commissioning contract issued by the Secretary of State forHealth. This issue may be freely reproduced for the purposes of private research and study and extracts (or indeed, the full report) may be included in professional journalsprovided that suitable acknowledgement is made and the reproduction is not associated with any form of advertising. Applications for commercial reproduction should beaddressed to: NIHR Journals Library, National Institute for Health Research, Evaluation, Trials and Studies Coordinating Centre, Alpha House, University of Southampton SciencePark, Southampton SO16 7NS, UK.
xxix
NRI non-responder imputation
NSAID non-steroidal anti-inflammatorydrug
OASIS Outcomes in Ankylosing SpondylitisInternational Study
OMERACT Outcome Measures in Rheumatology
OR odds ratio
PAS patient access scheme
PCS physical component summary
PSA probabilistic sensitivity analysis
PSS personal social services
PSSRU Personal Social Services ResearchUnit
QALY quality-adjusted life-year
RCT randomised controlled trial
RLDQ Revised Leeds DisabilityQuestionnaire
SAE serious adverse event
SD standard deviation
SE standard error
SF-36 Short Form questionnaire-36 items
SIRAS Scotland and Ireland Registry forAnkylosing Spondylitis
SMART St Mary RheumaToid Arthritis
SMR standardised mortality ratio
SpA spondyloarthritis
TA technology appraisal
TNF tumour necrosis factor
VAS visual analogue scale
Note
This monograph is based on the Technology Assessment Report produced for NICE. The full
report contained a considerable number of data that were deemed academic-in-confidence
and commercial-in-confidence. The full report was used by the Appraisal Committee at NICE
in their deliberations. The full report with each piece of academic-in-confidence data and
commercial-in-confidence removed and replaced by the statement ‘academic-in-confidence
and/or commercial-in-confidence information (or data) removed’ is available on the NICE
website: www.nice.org.uk.
The present monograph presents as full a version of the report as is possible while retaining
readability, but some sections, sentences, tables and figures have been removed. Readers
should bear in mind that the discussion, conclusions and implications for practice and research
are based on all the data considered in the original full NICE report.
LIST OF ABBREVIATIONS
NIHR Journals Library www.journalslibrary.nihr.ac.uk
xxx
Plain English summary
Axial spondyloarthritis is a progressive form of arthritis which causes severe back pain because ofinflammation of spinal and/or pelvic joints. If definite changes on plain radiographs are present, the
disease is classified as ankylosing spondylitis (AS), but if they are absent the disease is classified asnon-radiographic axial spondyloarthritis (nr-AxSpA). Usual therapy includes anti-inflammatory drugs,exercise and physiotherapy. Tumour necrosis factor inhibitors (also known as anti-TNFs) are typically usedwhen the disease has not responded adequately to this.
This project systematically reviewed the evidence on five anti-TNF treatments (adalimumab, certolizumabpegol, etanercept, golimumab and infliximab), for treating severe active AS or nr-AxSpA. The objective ofthis project was to assess the benefits and adverse effects of these anti-TNFs and to run an economicmodel using both response to treatment and the impact of disease progression, to evaluate if their use totreat these patients is a cost-effective use of NHS resources.
In total, 28 eligible randomised controlled trials were identified and 26 were placebo controlled (most ofthe trials which used a placebo did so for no more than 12 weeks); the majority were good quality and 17were extended into active treatment-only phases. In both AS and nr-AxSpA populations, anti-TNFsproduced clinically important benefits to patients in terms of improving function and reducing diseaseactivity. The benefit of treatment was consistently slightly smaller for nr-AxSpA than for AS. In AS thedifferent anti-TNFs are approximately equally effective and effectiveness appears to be maintained overtime. The results of the economic model indicated that anti-TNFs may be an effective use of NHS resourcesdepending on which assumptions are considered appropriate.
DOI: 10.3310/hta20090 HEALTH TECHNOLOGY ASSESSMENT 2016 VOL. 20 NO. 9
© Queen’s Printer and Controller of HMSO 2016. This work was produced by Corbett et al. under the terms of a commissioning contract issued by the Secretary of State forHealth. This issue may be freely reproduced for the purposes of private research and study and extracts (or indeed, the full report) may be included in professional journalsprovided that suitable acknowledgement is made and the reproduction is not associated with any form of advertising. Applications for commercial reproduction should beaddressed to: NIHR Journals Library, National Institute for Health Research, Evaluation, Trials and Studies Coordinating Centre, Alpha House, University of Southampton SciencePark, Southampton SO16 7NS, UK.
xxxi

Scientific summary
Background
Spondyloarthritis encompasses a heterogeneous group of inflammatory rheumatologic diseases.Spondyloarthritis can be categorised as having predominantly axial or peripheral involvement. In peoplewith axial spondyloarthritis (axSpA), the predominant symptoms are back pain and stiffness developedbefore age 45 years. For axSpA patients to be classified as having ankylosing spondylitis (AS), imagingevidence of joint damage using radiography is required. Patients with non-radiographic axialspondyloarthritis (nr-AxSpA) may, or may not, have signs of sacroiliac joint inflammation on a magneticresonance image. The use of magnetic resonance imaging allows for earlier detection of axSpA, as jointdamage may not become evident on radiographs for many years. Progression of axSpA is difficultto predict.
Tumour necrosis factor (TNF)-α inhibitors (anti-TNFs) are typically used when the disease has not respondedadequately to conventional therapy. Current National Institute for Health and Care Excellence (NICE)guidance recommends treatment with adalimumab, etanercept and golimumab in adults with active(severe) AS only if certain criteria are fulfilled, but it does not recommend infliximab for AS. Anti-TNFs forpatients with nr-AxSpA have not previously been appraised by NICE.
Objectives
To determine the clinical effectiveness, safety and cost-effectiveness within the NHS of adalimumab,certolizumab pegol, etanercept, golimumab and infliximab, within their respective licensed indications,for the treatment of severe active AS or severe nr-AxSpA (but with objective signs of inflammation).
Methods
For the systematic review of clinical efficacy, randomised controlled trials (RCTs) were eligible, including anyopen-label extensions. Adverse events data were sought from existing reviews of anti-TNFs used in anydisease and from other appropriately large studies. For studies of natural history, long-term effectiveness,adherence and sequential use, published analyses based on large and long-term data sets (registry data)were eligible. Eligible studies were of adults with either severe active AS or severe nr-AxSpA but withobjective signs of inflammation. The treatments of interest were adalimumab, certolizumab pegol,etanercept, golimumab, infliximab or any of their biosimilars. The relevant comparators were conventionalmanagement strategies (either with or without placebo) and alternative anti-TNFs. Key outcomes includedmultiple domain response criteria [such as Assessment in Ankylosing Spondylitis (ASAS) 40] and measures ofdisease activity [Bath Ankylosing Spondylitis Disease Activity Index (BASDAI)] and function [Bath AnkylosingSpondylitis Functional Index (BASFI)].
Fifteen databases were searched for relevant studies in July 2014. Clinical effectiveness data from RCTswere synthesised using Bayesian network meta-analysis methods. Sensitivity analyses were performed inwhich trials at risk of bias were excluded. Results from other studies were summarised narratively.
A systematic review of cost-effectiveness studies was undertaken to assess the relevance of existing datafrom the perspective of the NHS. Three databases were searched. Only full economic evaluations thatcompared two or more options and considered both costs and consequences were included. The
DOI: 10.3310/hta20090 HEALTH TECHNOLOGY ASSESSMENT 2016 VOL. 20 NO. 9
© Queen’s Printer and Controller of HMSO 2016. This work was produced by Corbett et al. under the terms of a commissioning contract issued by the Secretary of State forHealth. This issue may be freely reproduced for the purposes of private research and study and extracts (or indeed, the full report) may be included in professional journalsprovided that suitable acknowledgement is made and the reproduction is not associated with any form of advertising. Applications for commercial reproduction should beaddressed to: NIHR Journals Library, National Institute for Health Research, Evaluation, Trials and Studies Coordinating Centre, Alpha House, University of Southampton SciencePark, Southampton SO16 7NS, UK.
xxxiii
differences in the approaches and assumptions used across the studies were examined in order to explainany discrepancies in the findings and to identify key areas of uncertainty. A separate review of themanufacturer’s submissions was also undertaken and the findings were compared with those found in thereview of previously published studies.
The findings from the clinical effectiveness and cost-effectiveness reviews were used to inform thedevelopment of a de-novo decision model to assess the cost-effectiveness of the alternative anti-TNFs inaccordance with their licences for the separate indications. We developed a generalised framework forevidence synthesis that pools evidence on the change in BASDAI by considering those studies that reportthis measure directly and also those that report the proportion of patients achieving a BASDAI 50 response(a ≥ 50% improvement in BASDAI score). We expressed BASDAI 50 as a function of the absolute changein BASDAI and we used this relationship in the extended synthesis. We also aimed to simultaneouslysynthesise information on BASFI (function) score, a measure that is used together with the BASDAI score todetermine the long-term quality-adjusted life-year (QALY) and cost burden of the disease in the economicmodel. The decision model was a cohort model structured as a modified decision tree tracking response at12 weeks and treatment failure at subsequent time points within the time horizon. These events determinechanges in BASDAI and BASFI scores, which are further used to define costs and utilities. The modelconsiders the independent effects on BASFI as a result of disease activity (BASDAI) and the extent andprogression of radiographic disease (as measured by the modified Stoke Ankylosing Spondylitis SpinalScore). The model was developed in accordance with the NICE reference case. The model has a lifetimehorizon (60 years) and considers costs from the perspective of the NHS and personal social services. Healtheffects were expressed in terms of QALYs.
Results
Clinical efficacy from randomised controlled trialsTwenty-eight eligible RCTs were identified, with 24 being suitable for data synthesis. All but seven of thetrials were extended into open-label active treatment-only phases. Most RCTs were judged to have a lowrisk of bias overall.
For the AS population, the 10- to 16-week data showed consistent effects across the different anti-TNFswhen compared with placebo: for ASAS 20 the pooled relative risks ranged from 1.80 (certolizumabpegol) to 2.45 (infliximab); for the ASAS 40 data the relative risks ranged from 2.53 (certolizumab pegol)to 3.42 (adalimumab) and for BASDAI 50 the relative risks ranged from 3.16 (adalimumab) to 4.86(infliximab). Adalimumab, certolizumab pegol, etanercept and infliximab produced statistically significantand clinically important reductions in disease activity, with BASDAI reductions ranging from 1.46 units(certolizumab pegol) to 2.28 units (infliximab), and function, with BASFI reductions ranging from 1.1 units(certolizumab pegol) to 2.16 units (infliximab).
When analysed as a class, anti-TNFs were statistically significantly more likely than placebo to result inpatients with AS achieving an ASAS 20 response (relative risk 2.21), an ASAS 40 response (relative risk3.06), and a BASDAI 50 response (relative risk 3.37). They also produced statistically significantimprovements (calculated using mean difference in change from baseline) in disease activity (BASDAI meandifference –1.66 units) and in function (BASFI mean difference –1.38 units). There was little evidence ofstatistical heterogeneity for the key outcomes (ASAS outcomes, BASFI, BASDAI and BASDAI 50) butsubstantial heterogeneity was seen for other outcomes. Results of the sensitivity analyses performed forthe AS studies were very similar to the main analyses.
For the nr-AxSpA population, five RCTs were included. When anti-TNFs were considered as a class,statistically significant improvements were found for ASAS 20 (relative risk 1.65); ASAS 40 (relative risk2.74); BASDAI 50 (relative risk 2.31); BASDAI (mean difference –1.32 units); and BASFI (mean difference
SCIENTIFIC SUMMARY
NIHR Journals Library www.journalslibrary.nihr.ac.uk
xxxiv
–0.99 units). For the disease activity, function and responder outcomes, these common class efficacyestimates were consistently slightly smaller for nr-AxSpA than for AS, most noticeably for BASFI andBASDAI 50. Statistical heterogeneity (when such estimates could be calculated) was apparent in thenr-AxSpA analyses.
Long-term efficacyFor AS, across all the anti-TNFs, after around 2 years and 5 years of treatment, roughly half of patientswere still achieving a good level of response to therapy. However, the long-term studies produced lessreliable data than the RCTs. Fewer studies were available of nr-AxSpA patients, although the results werebroadly similar to those of the AS studies.
Evidence for an effect of anti-TNFs on radiographic disease progression was limited; the relativelyshort-term follow-up available to date and the insensitivity of radiography as an imaging tool precludedthe drawing of firm conclusions regarding the role of anti-TNFs in preventing or delaying the progressionof AS. There are some data to suggest an identifiable benefit from around 4 years, but results fromongoing long-term studies should help to clarify this issue.
Registry data demonstrate that around 60% of patients with AS treated with a first anti-TNF will still be ontreatment at 2 years. Sequential treatment with anti-TNFs can be worthwhile but the drug survivalresponse rates and benefits are reduced with second and third anti-TNFs, with the proportion of BASDAI50 responders falling approximately 10% with each subsequent anti-TNF and the median BASDAI andBASFIs achieved increasing (worsening).
Adverse effectsData from large systematic reviews, which included patients with a wide range of diseases, suggest that,in the short term, anti-TNFs as a group are associated with significantly higher rates of serious infections,tuberculosis reactivation, non-melanoma skin cancer, total adverse events (AEs) and withdrawals becauseof AEs than control treatments. Specifically, infliximab is associated with significantly higher rates of totalAEs and withdrawals because of AEs and certolizumab pegol is associated with significantly higher rates ofserious infections and serious AEs. The available open-label data on AEs were limited by the small samplesizes and non-randomised study designs.
Cost-effectiveness reported in existing published studies andmanufacturer’s submissionsA total of six UK studies reporting on the cost-effectiveness of anti-TNFs were identified, all for thetreatment of AS. There appear marked differences between the results of the previously publishedindustry-funded assessments in AS and the results reported in a previous independent assessment.Although all models reviewed used changes in BASDAI and/or BASFI to quantitatively model the short- andlonger-term costs and quality-of-life effects, there appeared significant variation in the assumptionsemployed. We identified important conceptual issues with all existing models relating to the subsequentprojection of BASDAI and BASFI scores over a longer time horizon.
Manufacturers submitted de novo analyses for both AS (AbbVie, UCB, Pfizer, Merck Sharp & Dohme) andnr-AxSpA (AbbVie, UCB, Pfizer) populations. Despite the different model structures and assumptionsapplied across the various manufacturer’s submissions, the incremental cost-effectiveness ratios (ICERs)reported for the anti-TNFs versus conventional care (CC) appeared consistent in AS. Across the separatebase-case analyses, the ICERs ranged from £16,391 to £44,448 for the alternative anti-TNFs comparedwith CC alone. Infliximab was routinely reported to have the highest ICER. When infliximab was excludedfrom consideration, the ICERs ranged from £16,391 to £21,972 for the other anti-TNFs.
DOI: 10.3310/hta20090 HEALTH TECHNOLOGY ASSESSMENT 2016 VOL. 20 NO. 9
© Queen’s Printer and Controller of HMSO 2016. This work was produced by Corbett et al. under the terms of a commissioning contract issued by the Secretary of State forHealth. This issue may be freely reproduced for the purposes of private research and study and extracts (or indeed, the full report) may be included in professional journalsprovided that suitable acknowledgement is made and the reproduction is not associated with any form of advertising. Applications for commercial reproduction should beaddressed to: NIHR Journals Library, National Institute for Health Research, Evaluation, Trials and Studies Coordinating Centre, Alpha House, University of Southampton SciencePark, Southampton SO16 7NS, UK.
xxxv
The differences in structural and parameter assumptions appear more evident in the cost-effectivenessresults for the nr-AxSpA population. The ICERs for adalimumab, certolizumab and etanercept rangedbetween £12,866 and £50,692 per QALY. Importantly, when the results in the separate populations werecompared, no consistent relationship appeared to emerge across the manufacturer’s submissions regardingthe cost-effectiveness on anti-TNFs in AS compared with the nr-AxSpA population. In addition, many ofthe same conceptual concerns identified from the review of published cost-effectiveness studies were alsostill evident.
An independent model was developed to address the conceptual concerns and areas of remaininguncertainty. Although it shared several of the assumptions and parameter estimates from the manufacturermodels, it has a different conceptual structure (linking BASFI progression to evidence from radiographicassessments) and applies a more generalised framework for the synthesis of clinical-effectiveness data.The extended synthesis approach showed the effectiveness of the different anti-TNFs to be similar.Consequently, the treatment effects for the anti-TNFs were assumed to come from a ‘common’distribution, that is a ‘class effect’. We developed a simulation model that allowed prediction of theconditional change scores for responders/non-responders to BASDAI 50 at 12 weeks and to exploredifferences in the baseline BASDAI/BASFI scores according to response status.
Base-case cost-effectiveness results were presented for two alternative ‘rebound’ assumptions. In therebound equal to gain scenario, the ICER of the alternative anti-TNFs varied between £19,240[certolizumab with the proposed patient access scheme (PAS)] to £40,467 per additional QALY (infliximab)in AS patients. In the rebound to CC scenario, the ICER of the alternative anti-TNFs varied between£33,762 (certolizumab with the proposed PAS) to £66,529 per additional QALY (infliximab) in AS patients.
In the rebound equal to gain scenario, the ICER of the alternative anti-TNFs for nr-AxSpA patients variedbetween £28,247 (certolizumab with the proposed PAS) to £29,784 per additional QALY (etanercept) inAS patients. In the rebound to CC scenario, the ICER of the alternative anti-TNFs for nr-AxSpA patientsvaried between £32,528 (certolizumab with the proposed PAS) to £34,232 (etanercept) peradditional QALY.
Discussion
The key strengths of the systematic review are the rigorous methods used and the extensive breadth of thetypes of study included. The York model confers several advantages over current cost-effectiveness studiesby linking changes in function to a more explicit clinical/biological process and facilitating a more formalconsideration of the potential impact of anti-TNFs on function, via the specific effects these drugs have onthe different processes which independently relate to this parameter.
The meta-analysis results derived from a substantial and generally high-quality evidence base demonstratedthat anti-TNFs produce clinically important benefits to AS patients in terms of improved function andreduced disease activity following around 3 months of treatment with an anti-TNF. Smaller benefits wereseen across outcomes in patients with nr-AxSpA, which was a more heterogeneous population. Lessreliable data were available on long-term efficacy, although it appears that around half of patients stillachieve a good level of response after around 2 years of treatment.
Although there are a number of important differences in approaches both among the differentmanufacturer models and compared with the York model, the comparison of ICERs based on the Yorkrebound equal to gain scenario appears broadly consistent with that reported by the manufacturers inboth populations.
SCIENTIFIC SUMMARY
NIHR Journals Library www.journalslibrary.nihr.ac.uk
xxxvi
Conclusions
l In both AS and nr-AxSpA populations anti-TNFs produce clinically important benefits to patients interms of improving function and reducing disease activity. The efficacy estimates were consistentlyslightly smaller for nr-AxSpA than for AS.
l Statistical (and clinical) heterogeneity was more apparent in the nr-AxSpA analyses than in the ASanalyses; both the reliability of the nr-AxSpA meta-analysis results and their true relevance to patientsseen in clinical practice are questionable.
l In AS anti-TNFs can be assumed to have a class effect, with the treatments being equally effective.l Effectiveness appears to be maintained over time in about 50% of patients at 2 years.l Evidence for an effect of anti-TNFs delaying disease progression was limited; results from ongoing
long-term studies should help to clarify this issue.l Sequential treatment with anti-TNFs can be worthwhile but the drug survival response rates and
benefits are reduced with second and third anti-TNFs.l The de novo model, which had addressed many of the issues of earlier evaluations, generated ICERs
ranging from £19,240 to £66,529 depending on anti-TNF and modelling assumptions.
Suggested research prioritiesRandomised trials are needed to identify the nr-AxSpA population that will benefit the most fromanti-TNFs. Long-term studies are needed to clarify the effect of anti-TNFs on the progression of structuraldamage in AS and to help clarify the characteristics of nr-AxSpA patients who go on to develop AS.Studies are also needed to better inform the efficacy estimates relating to sequential use of anti-TNFs.
Study registration
This study is registered as PROSPERO CRD42014010182.
Funding
Funding for this study was provided by the Health Technology Assessment programme of the NationalInstitute for Health Research.
DOI: 10.3310/hta20090 HEALTH TECHNOLOGY ASSESSMENT 2016 VOL. 20 NO. 9
© Queen’s Printer and Controller of HMSO 2016. This work was produced by Corbett et al. under the terms of a commissioning contract issued by the Secretary of State forHealth. This issue may be freely reproduced for the purposes of private research and study and extracts (or indeed, the full report) may be included in professional journalsprovided that suitable acknowledgement is made and the reproduction is not associated with any form of advertising. Applications for commercial reproduction should beaddressed to: NIHR Journals Library, National Institute for Health Research, Evaluation, Trials and Studies Coordinating Centre, Alpha House, University of Southampton SciencePark, Southampton SO16 7NS, UK.
xxxvii

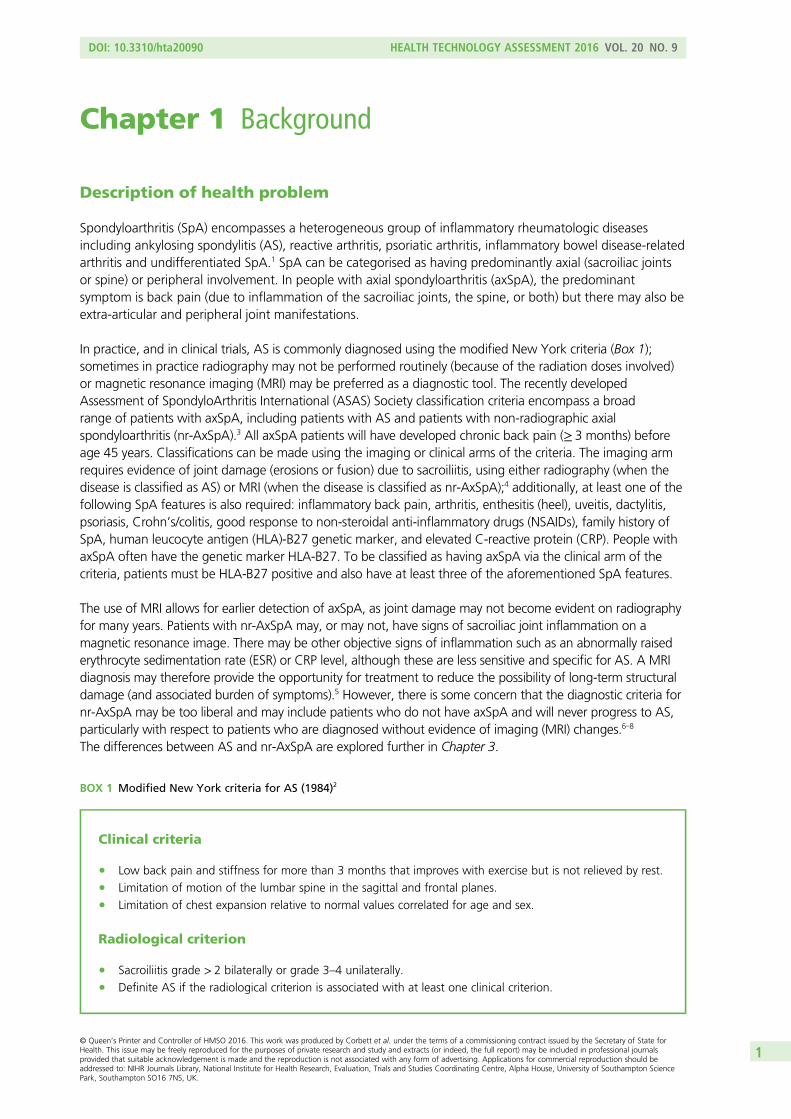
Chapter 1 Background
Description of health problem
Spondyloarthritis (SpA) encompasses a heterogeneous group of inflammatory rheumatologic diseasesincluding ankylosing spondylitis (AS), reactive arthritis, psoriatic arthritis, inflammatory bowel disease-relatedarthritis and undifferentiated SpA.1 SpA can be categorised as having predominantly axial (sacroiliac jointsor spine) or peripheral involvement. In people with axial spondyloarthritis (axSpA), the predominantsymptom is back pain (due to inflammation of the sacroiliac joints, the spine, or both) but there may also beextra-articular and peripheral joint manifestations.
In practice, and in clinical trials, AS is commonly diagnosed using the modified New York criteria (Box 1);sometimes in practice radiography may not be performed routinely (because of the radiation doses involved)or magnetic resonance imaging (MRI) may be preferred as a diagnostic tool. The recently developedAssessment of SpondyloArthritis International (ASAS) Society classification criteria encompass a broadrange of patients with axSpA, including patients with AS and patients with non-radiographic axialspondyloarthritis (nr-AxSpA).3 All axSpA patients will have developed chronic back pain (≥ 3 months) beforeage 45 years. Classifications can be made using the imaging or clinical arms of the criteria. The imaging armrequires evidence of joint damage (erosions or fusion) due to sacroiliitis, using either radiography (when thedisease is classified as AS) or MRI (when the disease is classified as nr-AxSpA);4 additionally, at least one of thefollowing SpA features is also required: inflammatory back pain, arthritis, enthesitis (heel), uveitis, dactylitis,psoriasis, Crohn’s/colitis, good response to non-steroidal anti-inflammatory drugs (NSAIDs), family history ofSpA, human leucocyte antigen (HLA)-B27 genetic marker, and elevated C-reactive protein (CRP). People withaxSpA often have the genetic marker HLA-B27. To be classified as having axSpA via the clinical arm of thecriteria, patients must be HLA-B27 positive and also have at least three of the aforementioned SpA features.
The use of MRI allows for earlier detection of axSpA, as joint damage may not become evident on radiographyfor many years. Patients with nr-AxSpA may, or may not, have signs of sacroiliac joint inflammation on amagnetic resonance image. There may be other objective signs of inflammation such as an abnormally raisederythrocyte sedimentation rate (ESR) or CRP level, although these are less sensitive and specific for AS. A MRIdiagnosis may therefore provide the opportunity for treatment to reduce the possibility of long-term structuraldamage (and associated burden of symptoms).5 However, there is some concern that the diagnostic criteria fornr-AxSpA may be too liberal and may include patients who do not have axSpA and will never progress to AS,particularly with respect to patients who are diagnosed without evidence of imaging (MRI) changes.6–8
The differences between AS and nr-AxSpA are explored further in Chapter 3.
BOX 1 Modified New York criteria for AS (1984)2
Clinical criteria
l Low back pain and stiffness for more than 3 months that improves with exercise but is not relieved by rest.l Limitation of motion of the lumbar spine in the sagittal and frontal planes.l Limitation of chest expansion relative to normal values correlated for age and sex.
Radiological criterion
l Sacroiliitis grade > 2 bilaterally or grade 3–4 unilaterally.l Definite AS if the radiological criterion is associated with at least one clinical criterion.
DOI: 10.3310/hta20090 HEALTH TECHNOLOGY ASSESSMENT 2016 VOL. 20 NO. 9
© Queen’s Printer and Controller of HMSO 2016. This work was produced by Corbett et al. under the terms of a commissioning contract issued by the Secretary of State forHealth. This issue may be freely reproduced for the purposes of private research and study and extracts (or indeed, the full report) may be included in professional journalsprovided that suitable acknowledgement is made and the reproduction is not associated with any form of advertising. Applications for commercial reproduction should beaddressed to: NIHR Journals Library, National Institute for Health Research, Evaluation, Trials and Studies Coordinating Centre, Alpha House, University of Southampton SciencePark, Southampton SO16 7NS, UK.
1
PrognosisAxial spondyloarthritis is a painful, progressive form of inflammatory arthritis. It mainly affects the spine but canalso affect other joints, tendons and ligaments. Other areas such as the eyes and bowel can also sometimes beinvolved in non-radiographic and radiographic (AS) forms of axSpA.9 The pain and stiffness of axSpA adverselyaffects optimal daily functioning. These symptoms are a result of a combination of reversible components ofthe disease, such as inflammation and flares, and irreversible components, such as syndesmophytes andvertebral bridging (bony deposition).10 Most patients with AS develop the first symptoms at 25–45 years ofage.11 Progression of the disease is variable and difficult to predict.12 There is often a delay of many yearsbetween patients first noticing symptoms and the diagnosis of axSpA being received. Many people with axSpAhave AS, with evidence of bony deposition as well as inflammation. In later-stage AS, joints and bones mayfuse together, a process that can occur over a long period of time and cause restricted movement. Thefunctional impairment because of inflammation and/or bony deposition can have a profound effect on healthand quality of life, and lead to withdrawal from active employment, with resultant adverse financialconsequences; the burden of disease is greater in more socially deprived patients.13 The prognosis is poor,although there is some evidence that deterioration plateaus in well-established AS.14 Paradoxically, early disease(nr-AxSpA) may be less readily diagnosed and patients offered fewer treatment options even though it can beas, or even more, debilitating that established AS.15
Ankylosing spondylitis is associated with an increased risk of death; it is estimated that patients have astandardised mortality ratio (SMR) of ≥ 1.5. The increased risk appears to be greater in men, with onestudy reporting a statistically significant increase in SMR of 1.63 in men but no significant increase inwomen (SMR 1.38) with AS.16 This study found that, after correcting for age, sex, disease duration andpre-existing cardiovascular disease, independent predictors of increased mortality were elevated CRP level,diagnostic delay, not using NSAIDs and work disability. According to British Society for Rheumatology (BSR)guidelines, the excess mortality is mainly accounted for by cardiac valvular disease, amyloidosis andfractures.17 nr-AxSpA affects approximately equal numbers of men and women, but it is more likely thatmen will develop AS.18
EpidemiologyCurrently, only limited epidemiological data are available for axSpA defined according to ASAS criteria.For AS, the prevalence is thought to be around 0.25% in European populations.19 It is around three timesmore common in men than in women.20 A recent study published in the USA reported an estimated ASprevalence of 0.52–0.55%, and the prevalence of axSpA as approximately 1.0–1.4%.21 The proportion ofnr-AxSpA among patients with axSpA is estimated to be between 20% and 80%.22 Each year in the UK anestimated 2% of patients in a general practice will present with back pain and up to 5% of these willshow features of AS.23
Measurement of diseaseThere are a number of components and measures of disease activity in axSpA;24 a patient’s health-relatedquality of life (HRQoL) is determined by both by physical functioning and by disease activity. In turn, physicalfunction is determined by spinal mobility and disease activity, and spinal mobility is determined by structuraldamage and inflammation of the spine.24 In nr-AxSpA, a patient may have significant inflammation but nodetectable structural damage; in AS, a patient may have both significant inflammation and structural damage;and in late AS, there may be less inflammation but extensive structural damage.
The main tools used for the assessment of various components of the disease are listed in Table 1.
Placebo responseThe term ‘placebo effect’ can be used to describe different types of ‘effect’ but it generally encompassesone or more of three different meanings. First, there is the temporal (before–after) change after placebomedication, in which the effects of a placebo intervention cannot be distinguished from the natural courseof the disease or regression to the mean. Second, there is the causal effect of placebo interventionassociated with the treatment ritual, and, finally, there is the effect of all the psychological processes
BACKGROUND
NIHR Journals Library www.journalslibrary.nihr.ac.uk
2
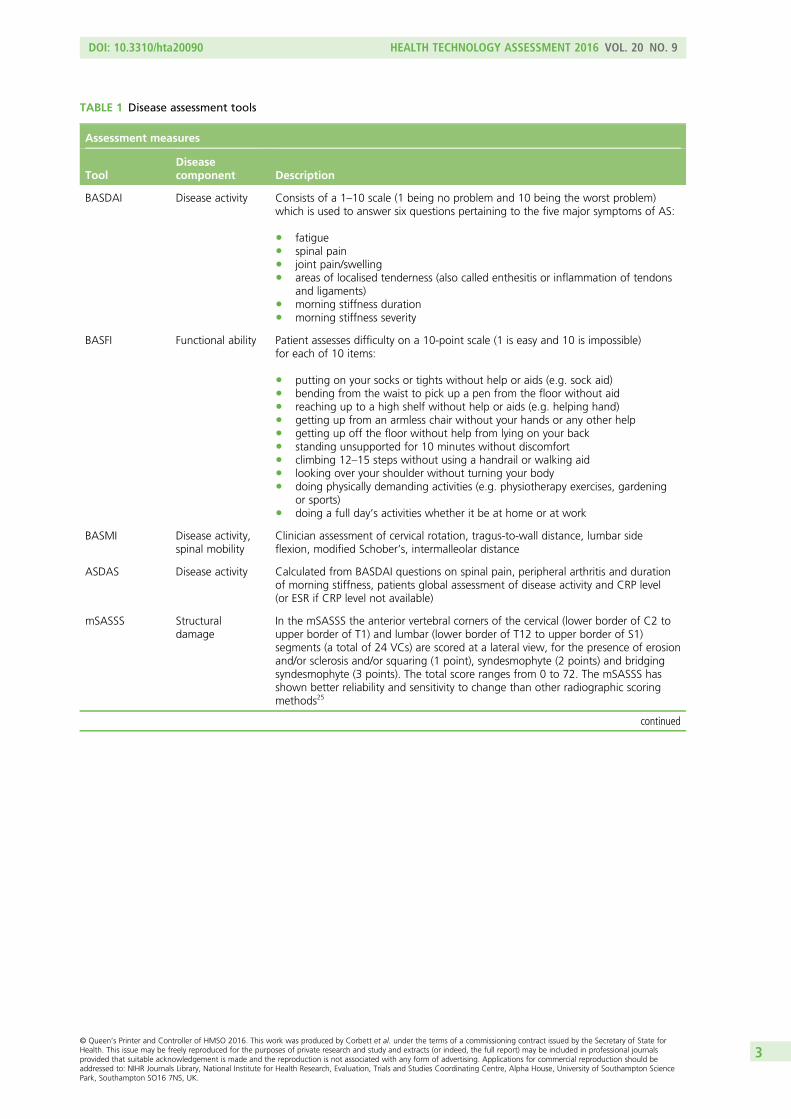
TABLE 1 Disease assessment tools
Assessment measures
ToolDiseasecomponent Description
BASDAI Disease activity Consists of a 1–10 scale (1 being no problem and 10 being the worst problem)which is used to answer six questions pertaining to the five major symptoms of AS:
l fatiguel spinal painl joint pain/swellingl areas of localised tenderness (also called enthesitis or inflammation of tendons
and ligaments)l morning stiffness durationl morning stiffness severity
BASFI Functional ability Patient assesses difficulty on a 10-point scale (1 is easy and 10 is impossible)for each of 10 items:
l putting on your socks or tights without help or aids (e.g. sock aid)l bending from the waist to pick up a pen from the floor without aidl reaching up to a high shelf without help or aids (e.g. helping hand)l getting up from an armless chair without your hands or any other helpl getting up off the floor without help from lying on your backl standing unsupported for 10 minutes without discomfortl climbing 12–15 steps without using a handrail or walking aidl looking over your shoulder without turning your bodyl doing physically demanding activities (e.g. physiotherapy exercises, gardening
or sports)l doing a full day’s activities whether it be at home or at work
BASMI Disease activity,spinal mobility
Clinician assessment of cervical rotation, tragus-to-wall distance, lumbar sideflexion, modified Schober’s, intermalleolar distance
ASDAS Disease activity Calculated from BASDAI questions on spinal pain, peripheral arthritis and durationof morning stiffness, patients global assessment of disease activity and CRP level(or ESR if CRP level not available)
mSASSS Structuraldamage
In the mSASSS the anterior vertebral corners of the cervical (lower border of C2 toupper border of T1) and lumbar (lower border of T12 to upper border of S1)segments (a total of 24 VCs) are scored at a lateral view, for the presence of erosionand/or sclerosis and/or squaring (1 point), syndesmophyte (2 points) and bridgingsyndesmophyte (3 points). The total score ranges from 0 to 72. The mSASSS hasshown better reliability and sensitivity to change than other radiographic scoringmethods25
continued
DOI: 10.3310/hta20090 HEALTH TECHNOLOGY ASSESSMENT 2016 VOL. 20 NO. 9
© Queen’s Printer and Controller of HMSO 2016. This work was produced by Corbett et al. under the terms of a commissioning contract issued by the Secretary of State forHealth. This issue may be freely reproduced for the purposes of private research and study and extracts (or indeed, the full report) may be included in professional journalsprovided that suitable acknowledgement is made and the reproduction is not associated with any form of advertising. Applications for commercial reproduction should beaddressed to: NIHR Journals Library, National Institute for Health Research, Evaluation, Trials and Studies Coordinating Centre, Alpha House, University of Southampton SciencePark, Southampton SO16 7NS, UK.
3
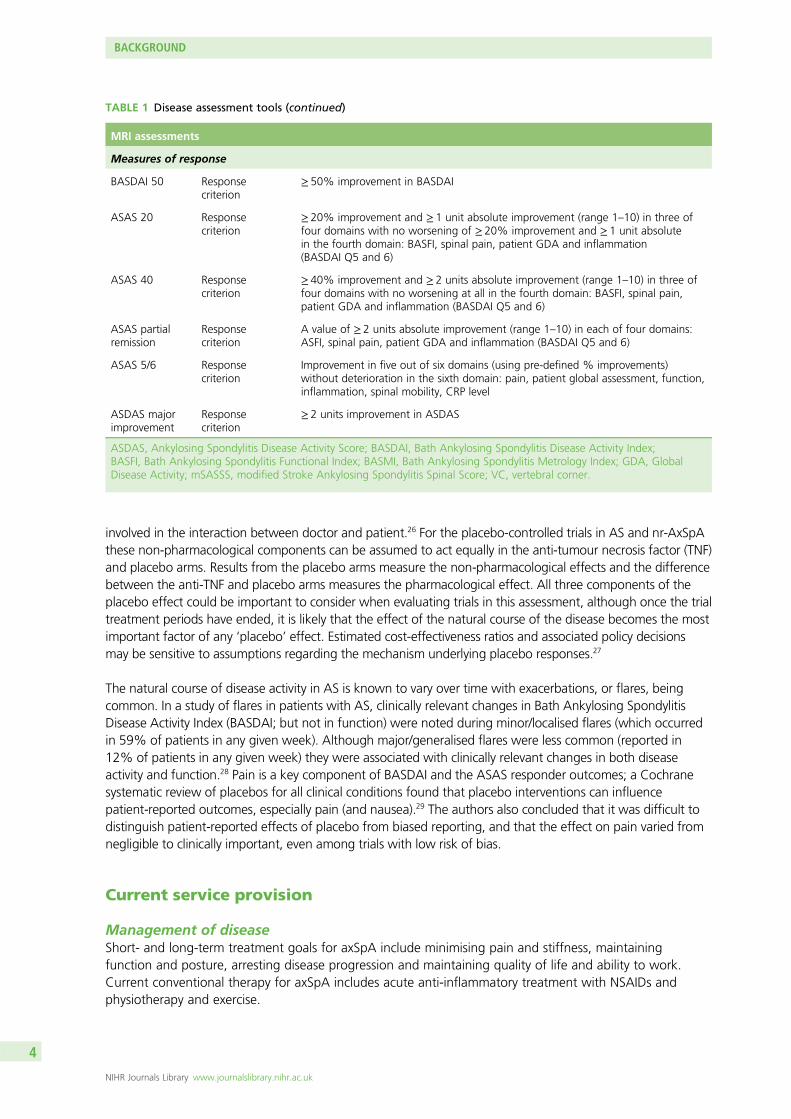
involved in the interaction between doctor and patient.26 For the placebo-controlled trials in AS and nr-AxSpAthese non-pharmacological components can be assumed to act equally in the anti-tumour necrosis factor (TNF)and placebo arms. Results from the placebo arms measure the non-pharmacological effects and the differencebetween the anti-TNF and placebo arms measures the pharmacological effect. All three components of theplacebo effect could be important to consider when evaluating trials in this assessment, although once the trialtreatment periods have ended, it is likely that the effect of the natural course of the disease becomes the mostimportant factor of any ‘placebo’ effect. Estimated cost-effectiveness ratios and associated policy decisionsmay be sensitive to assumptions regarding the mechanism underlying placebo responses.27
The natural course of disease activity in AS is known to vary over time with exacerbations, or flares, beingcommon. In a study of flares in patients with AS, clinically relevant changes in Bath Ankylosing SpondylitisDisease Activity Index (BASDAI; but not in function) were noted during minor/localised flares (which occurredin 59% of patients in any given week). Although major/generalised flares were less common (reported in12% of patients in any given week) they were associated with clinically relevant changes in both diseaseactivity and function.28 Pain is a key component of BASDAI and the ASAS responder outcomes; a Cochranesystematic review of placebos for all clinical conditions found that placebo interventions can influencepatient-reported outcomes, especially pain (and nausea).29 The authors also concluded that it was difficult todistinguish patient-reported effects of placebo from biased reporting, and that the effect on pain varied fromnegligible to clinically important, even among trials with low risk of bias.
Current service provision
Management of diseaseShort- and long-term treatment goals for axSpA include minimising pain and stiffness, maintainingfunction and posture, arresting disease progression and maintaining quality of life and ability to work.Current conventional therapy for axSpA includes acute anti-inflammatory treatment with NSAIDs andphysiotherapy and exercise.
MRI assessments
Measures of response
BASDAI 50 Responsecriterion
≥ 50% improvement in BASDAI
ASAS 20 Responsecriterion
≥ 20% improvement and ≥ 1 unit absolute improvement (range 1–10) in three offour domains with no worsening of ≥ 20% improvement and ≥ 1 unit absolutein the fourth domain: BASFI, spinal pain, patient GDA and inflammation(BASDAI Q5 and 6)
ASAS 40 Responsecriterion
≥ 40% improvement and ≥ 2 units absolute improvement (range 1–10) in three offour domains with no worsening at all in the fourth domain: BASFI, spinal pain,patient GDA and inflammation (BASDAI Q5 and 6)
ASAS partialremission
Responsecriterion
A value of ≥ 2 units absolute improvement (range 1–10) in each of four domains:ASFI, spinal pain, patient GDA and inflammation (BASDAI Q5 and 6)
ASAS 5/6 Responsecriterion
Improvement in five out of six domains (using pre-defined % improvements)without deterioration in the sixth domain: pain, patient global assessment, function,inflammation, spinal mobility, CRP level
ASDAS majorimprovement
Responsecriterion
≥ 2 units improvement in ASDAS
ASDAS, Ankylosing Spondylitis Disease Activity Score; BASDAI, Bath Ankylosing Spondylitis Disease Activity Index;BASFI, Bath Ankylosing Spondylitis Functional Index; BASMI, Bath Ankylosing Spondylitis Metrology Index; GDA, GlobalDisease Activity; mSASSS, modified Stroke Ankylosing Spondylitis Spinal Score; VC, vertebral corner.
TABLE 1 Disease assessment tools (continued)
BACKGROUND
NIHR Journals Library www.journalslibrary.nihr.ac.uk
4
Conventional therapy for AS is limited to NSAIDs (despite very limited supporting clinical trial evidence)30 andrecommendations regarding appropriate physical activity. Other statements in the ASAS/EULAR (EuropeanLeague Against Rheumatism) recommendations for the management of AS include analgesics such asparacetamol and opioid-like drugs that may be considered for residual pain. Glucocorticoid injections into thedirect site of inflammation (but not systemic) may be of benefit. The use of disease-modifying antirheumaticdrugs (DMARDs, such as methotrexate and sulfasalazine) has been all but abandoned after evidence of lack ofbenefit. The cornerstone of non-pharmacological treatment of patients with AS is patient education andregular exercise; home exercises are effective. Physical therapy with supervised exercises, land- or water-based,individually or in a group, should be preferred, as these are more effective than home exercises. Patientassociations and self-help groups may be useful. A Cochrane review of 11 trials concluded that the currentbest available evidence suggests that physiotherapy is beneficial for people with AS, but that it is still not clearwhich treatment protocol, duration and intensity should be recommended in the management of AS.31
Physiotherapy is universally recommended32 but variable in practice.
Biologic drugs are the only treatment shown to be efficacious in the treatment of symptoms and signs ofdisease activity in axSpA and AS. Current National Institute for Health and Care Excellence (NICE) and BSRguidance recommends treatment with the anti-TNFs adalimumab, etanercept and golimumab in adultswith active (severe) AS only if certain criteria are fulfilled, but it does not recommend infliximab for AS.17,33
Description of technology under assessment
Tumour necrosis factor-α inhibitors (adalimumab, certolizumab pegol, etanercept, golimumab andinfliximab), also referred to as anti-TNFs, are typically used when the disease has not responded adequatelyto conventional therapy. They target the activation of TNF-α and its subsequent activation of downstreaminflammatory processes, and as such have the potential to offer symptom control as well as alter diseaseprogression. Adalimumab, certolizumab pegol, golimumab and infliximab are monoclonal antibodies,whereas etanercept is a recombinant human TNF receptor fusion protein.
Adalimumab, etanercept, golimumab and infliximab are licensed in the UK for the treatment of adults withsevere active AS that has responded inadequately to conventional therapy. Certolizumab pegol is licensedfor the treatment of adults with severe active AS whose disease has responded inadequately to, or whoare intolerant of, NSAIDs.
Adalimumab, etanercept and certolizumab pegol are also licensed for the treatment of adults with severenr-AxSpA with objective signs of inflammation (including elevated CRP level and/or positive MRI), whosedisease has responded inadequately to, or who are intolerant of, NSAIDs. Golimumab and infliximab donot currently have a UK marketing authorisation for nr-AxSpA. Current NICE guidance recommendstreatment with adalimumab, etanercept or golimumab in adults with active (severe) AS only if certaincriteria are fulfilled (including a stipulation that patients must have tried at least two different NSAIDs,which have failed to control symptoms), but it does not recommend infliximab for AS.17,33 Anti-TNFs forpatients with nr-AxSpA have not previously been appraised by NICE.
DOI: 10.3310/hta20090 HEALTH TECHNOLOGY ASSESSMENT 2016 VOL. 20 NO. 9
© Queen’s Printer and Controller of HMSO 2016. This work was produced by Corbett et al. under the terms of a commissioning contract issued by the Secretary of State forHealth. This issue may be freely reproduced for the purposes of private research and study and extracts (or indeed, the full report) may be included in professional journalsprovided that suitable acknowledgement is made and the reproduction is not associated with any form of advertising. Applications for commercial reproduction should beaddressed to: NIHR Journals Library, National Institute for Health Research, Evaluation, Trials and Studies Coordinating Centre, Alpha House, University of Southampton SciencePark, Southampton SO16 7NS, UK.
5

Chapter 2 Definition of decision problem
Decision problem in terms of Population, Intervention,Comparator, Outcome, Study design and other key issues
The decision problem relates to the optimal use of adalimumab, certolizumab pegol, etanercept,golimumab and infliximab, within their licensed indications, for the treatment of severe/active AS or severeaxSpA without radiographic evidence of AS (but with objective signs of inflammation).
Previous National Institute for Health and CareExcellence appraisals
In the previous NICE technology appraisal (TA) 143, adalimumab, etanercept and infliximab were evaluatedfor AS, while in TA23333 golimumab was evaluated for AS. A number of key areas of uncertainty andpotential limitations of the evidence base were identified from these appraisals. These include:
1. a lack of direct head-to-head trial evidence evaluating the relative efficacy and safety of theTNF-α inhibitors
2. a lack of evidence on the efficacy and safety of the sequential use of TNF-α inhibitors3. the long-term effectiveness of TNF-α inhibitors in controlling disease activity4. the rate of disease progression in responders and non-responders to treatment, and in those
on placebo5. the proportion of patients who may experience a significant improvement in their condition without
TNF-α inhibitor treatment6. the rate of treatment withdrawal on TNF-α inhibitors and the degree to which a patient’s condition
might be expected to rebound if therapy is withdrawn7. the adverse effects associated with the long-term use of TNF-α inhibitors8. the impact of TNF-α inhibitors on the progression of structural damage in the spine and functional
disability associated with ankylosis9. the time horizon appropriate for considering the cost-effectiveness of TNF-α inhibitors
10. a lack of registry data of patients receiving TNF-α inhibitors for severe active AS.
This assessment would consider each of these areas of uncertainty and identify the relevant evidenceavailable to inform the limitations of the previous appraisals.
Overall aims and objectives of assessment
The aim of the study is to determine the clinical effectiveness, safety and cost-effectiveness within the NHSof adalimumab, certolizumab pegol, etanercept, golimumab and infliximab, within their licensedindications, for the treatment of severe active AS or severe axSpA without radiographic evidence of AS(but with objective signs of inflammation). If evidence allows, the clinical effectiveness andcost-effectiveness of sequential use of these treatments will also be evaluated.
DOI: 10.3310/hta20090 HEALTH TECHNOLOGY ASSESSMENT 2016 VOL. 20 NO. 9
© Queen’s Printer and Controller of HMSO 2016. This work was produced by Corbett et al. under the terms of a commissioning contract issued by the Secretary of State forHealth. This issue may be freely reproduced for the purposes of private research and study and extracts (or indeed, the full report) may be included in professional journalsprovided that suitable acknowledgement is made and the reproduction is not associated with any form of advertising. Applications for commercial reproduction should beaddressed to: NIHR Journals Library, National Institute for Health Research, Evaluation, Trials and Studies Coordinating Centre, Alpha House, University of Southampton SciencePark, Southampton SO16 7NS, UK.
7

Chapter 3 Assessment of clinical effectiveness
Methods for reviewing effectiveness
Inclusion criteriaTwo reviewers independently screened all titles and abstracts. Full manuscripts of any titles/abstracts thatwere relevant were obtained where possible and the relevance of each study assessed by two reviewersaccording to the criteria below. Any discrepancies were resolved by consensus and, when necessary, athird reviewer was consulted. Studies available only as abstracts were included.
Study designFor the review of clinical efficacy randomised controlled trials (RCTs) were eligible, including any open-labelextensions of RCTs. Adverse event (AE) data were sought from existing reviews and other appropriatelylarge studies. For studies of natural history, long-term effectiveness, adherence and sequential use,published analyses based on large and long-term data sets (including studies of registry data) were eligible.
InterventionsAdalimumab, certolizumab pegol, etanercept, golimumab, infliximab or any of their biosimilarswere eligible.
ComparatorsRelevant comparators were conventional management strategies (either with or without placebo) and alsothe different TNF-α inhibitors listed above (i.e. head-to-head trials).
ParticipantsStudies of adults with either severe active AS or severe axSpA without radiographic evidence of AS butwith objective signs of inflammation (such as elevated CRP levels or a positive MRI) were eligible. Patientswith predominantly peripheral spondyloarthritis were excluded. Data relating to serious adverse effectsassociated with anti-TNF agents used in other indications were also considered.
OutcomesStudies reporting the following outcomes were eligible:
l multiple domain response criteria: (e.g. ASAS 20, ASAS 40, ASAS 5/6 and ASAS partial remission)l disease activity (e.g. BASDAI)l functional capacity [e.g. Bath Ankylosing Spondylitis Functional Index (BASFI)]l disease progression [e.g. modified Stoke Ankylosing Spondylitis Spinal Score (mSASSS)]l pain [e.g. visual analogue scale (VAS) scores]l peripheral symptoms (including enthesitis, peripheral arthritis and dactylitis)l symptoms of extra-articular manifestations (including anterior uveitis, inflammatory bowel disease
and psoriasis)l HRQoL [e.g. European Quality of Life-5 Dimensions (EQ-5D)]l rates of treatment discontinuation and withdrawall AEs.
For AEs the evaluation specifically focused on known possible AEs of anti-TNFs, such as reactivation oflatent tuberculosis, malignancies, non-melanoma skin cancer, severe infections, congestive heart failure,and injection site reactions. Withdrawals because of AEs and events categorised as serious adverse events(SAEs) were also evaluated.
DOI: 10.3310/hta20090 HEALTH TECHNOLOGY ASSESSMENT 2016 VOL. 20 NO. 9
© Queen’s Printer and Controller of HMSO 2016. This work was produced by Corbett et al. under the terms of a commissioning contract issued by the Secretary of State forHealth. This issue may be freely reproduced for the purposes of private research and study and extracts (or indeed, the full report) may be included in professional journalsprovided that suitable acknowledgement is made and the reproduction is not associated with any form of advertising. Applications for commercial reproduction should beaddressed to: NIHR Journals Library, National Institute for Health Research, Evaluation, Trials and Studies Coordinating Centre, Alpha House, University of Southampton SciencePark, Southampton SO16 7NS, UK.
9
SearchesThe following databases were searched for relevant clinical effectiveness and cost-effectiveness research:
l MEDLINEl EMBASEl Cumulative Index to Nursing and Allied Health Literature Plusl Science Citation Indexl ClinicalTrials.govl Cochrane Central Register of Controlled Trialsl Cochrane Database of Systematic Reviewsl Database of Abstracts of Reviews of Effectsl International Prospective Register of Systematic Reviews (PROSPERO)l Health Technology Assessment Databasel Conference Proceedings Citation Index – Sciencel National Guidelines Clearinghousel NHS Evidencel NHS Clinical Knowledge Summariesl NHS Economic Evaluation Database (NHS EED).
The terms for search strategies were identified through discussion within the research team, by scanning thebackground literature and browsing the MEDLINE medical subject headings. No date or language limits wereapplied. As several databases were searched, some degree of duplication resulted. To manage this issue, thetitles and abstracts of bibliographic records were imported into EndNote bibliographic management software(version X7, Thomson Reuters, CA, USA) to remove duplicate records. Databases were searched frominception, with most of the searches being performed in June or July 2014. The full search strategies used ineach database, together with the search dates, are listed in Appendix 1.
Data extractionData relating to study design, outcome results and quality were extracted by one reviewer using astandardised data extraction form and independently checked for accuracy by a second reviewer.Disagreements were resolved through consensus, and, when necessary, a third reviewer was consulted.Data from studies with multiple publications were extracted and reported as a single study. Data were alsoextracted from the manufacturer’s submissions when they were not available from other sources.34–37
Clinicaltrials.gov records and relevant US Food and Drug Administration (FDA) or European MedicinesAgency reports were also used to extract any missing data. When data could only be estimated fromgraphs, the estimates used in the previous assessment report38 were used when available. In the light ofthe multidomain outcomes which incorporated pain scores (the ASAS and BASDAI outcomes), it wasdecided that pain scores on their own would not be extracted.
This report contains reference to confidential information provided as part of the NICE appraisal process.This information has been removed from the report and the results, discussions and conclusions of thereport do not include the confidential information. These sections are clearly marked in the report.
Critical appraisalThe quality of RCTs was assessed using the Cochrane risk of bias tool,39 with additional assessments madefor baseline imbalance of important prognostic indicators.40 The relevant prognostic and treatmentresponse indicators were identified from both published research and clinical advice. The risk of biasassessments were performed by one reviewer, and independently checked by a second. Disagreementswere resolved through consensus, and, when necessary, a third reviewer was consulted. Open-labelextension studies were evaluated based on the imputation methods and patient withdrawal criteria used.
ASSESSMENT OF CLINICAL EFFECTIVENESS
NIHR Journals Library www.journalslibrary.nihr.ac.uk
10
Methods of data synthesisThis section describes the data set construction and meta-analyses conducted for the different outcomesindividually. Chapter 5 provides detailed evidence synthesis methods that incorporate different outcomeswithin one analysis and presents clinical outcome estimates appropriate for the economic model.
Results of the data extraction in terms of study characteristics and quality assessment are presented intables and summarised narratively. Results of open-label studies, drug survival and switching studies andnatural history studies were also summarised narratively. As several of the RCTs were placebo-controlledup to 24 weeks, only time points beyond 24 weeks were evaluated in the open-label studies. AE data fromthe RCTs were pooled when enough data were identified; otherwise, the AE data and the other studiesrelating specifically to AEs were summarised narratively.
Clinical effectiveness data were synthesised using Bayesian meta-analysis methods. The main analysis wasof outcomes reported from 10 to 16 weeks. A sensitivity analysis was done of outcomes reported from24 to 30 weeks.
Dosage and pooling of trial armsThe doses included in the analyses were:
l adalimumab – 40mg every other weekl certolizumab pegol – 200mg every 2 weeks, 400mg every 4 weeksl etanercept – 25mg twice weekly, 50mg weeklyl golimumab – 50mg every monthl infliximab – 5mg/kg at 0, 2 or ≥ 6 weeks.
Golimumab of 100mg every 4 weeks was excluded when it was not used according to its licence.
Data from active treatment arms were pooled in trials which studied different doses. This occurred forcertolizumab pegol 200mg every 2 weeks and 400mg every 4 weeks and for etanercept 25mg twiceweekly and 50mg weekly.
Data imputation and assumptionsMedians were treated as means. Although the median may not be exactly the same as the mean, themedian was considered to give sufficiently accurate information. Standard deviations (SDs) were estimatedfrom interquartile ranges, the method of which is described in Appendix 2. Where no SD was reported,the highest SD from the other trials was used as a conservative estimate.
In the meta-analyses, ‘change from baseline’ outcomes were used in the analysis for continuous outcomes.Where these were not reported, but adequate baseline and final value outcomes were reported, thechange from baseline and its SD were derived from the baseline and final values and their SDs.The detailed methods are described in Appendix 2.
The imputation of change from baseline or final values required a within-trial correlation estimate, andtrials that reported the SDs of baseline, change from baseline and final values were used to estimate thewithin-trial correlation. For BASDAI the within-study correlation varied from 0.33 to 0.67 across four trials.Given the small samples of some trials, the within-study correlation can vary significantly from trial to trial.For the base-case analysis, a correlation estimate of 0.3 was used and an estimate of 0.7 was tested insensitivity analysis. For the calculation of final values, the lowest possible correlation was used when 0.3 or0.7 were not feasible solutions (see Appendix 2).
DOI: 10.3310/hta20090 HEALTH TECHNOLOGY ASSESSMENT 2016 VOL. 20 NO. 9
© Queen’s Printer and Controller of HMSO 2016. This work was produced by Corbett et al. under the terms of a commissioning contract issued by the Secretary of State forHealth. This issue may be freely reproduced for the purposes of private research and study and extracts (or indeed, the full report) may be included in professional journalsprovided that suitable acknowledgement is made and the reproduction is not associated with any form of advertising. Applications for commercial reproduction should beaddressed to: NIHR Journals Library, National Institute for Health Research, Evaluation, Trials and Studies Coordinating Centre, Alpha House, University of Southampton SciencePark, Southampton SO16 7NS, UK.
11
Change from baseline was imputed for three trials for BASDAI, five trials for BASFI, one trial for BathAnkylosing Spondylitis Metrology Index (BASMI), two trials for Short Form questionnaire-36 items (SF-36)physical component summary (PCS), and one trial for SF-36 mental component summary (MCS). For eachof these outcomes, one of the imputations was for a trial with a non-radiographic population.
Binary event outcomesOdds ratios (ORs) were derived for binary event outcomes. Relative risks were also derived from the ORsusing the placebo absolute risks estimated from all the trials measuring the relevant outcome withinweeks 10 to 16. The relative risk estimates are therefore based on the population distribution of the trialsacross the interventions. As the placebo absolute risk was based on more trials than those informing theORs for some outcomes, the 95% credible interval (CrI) estimates of the relative risk were narrower thanthe CrI estimates of the OR. The placebo absolute risk was estimated using both fixed- and random-effectmodels within WinBUGS (Medical Research Council Biostatistics Unit, Cambridge, UK). As therandom-effect model for the placebo absolute risk was a better fit than the fixed effect model accordingto the deviance information criterion (DIC) statistic, the placebo absolute risks from the random-effectmodels were used. For the ASAS outcomes, fewer trials reported the greater response outcomes, so a priordistribution was used for the between-study SD based on the closest ASAS outcome (see Appendix 2).
AnalysesAnalyses were conducted in WinBUGS version 1.4.3. See Chapter 5 for more details on the models. Foreach outcome, multiple-treatment meta-analyses were conducted assuming that the treatments hadindependent effects [related to models A1 (fixed effect) and A2 (random effects) in Chapter 5]. They werealso run assuming that they had a common class effect [related to models A3 (fixed effect) and A4(random effects) in Chapter 5] and that the DIC statistic was used to determine the model that best fittedthe data. The random-effect models with independent treatment effects were assumed to have a commonbetween-study variance across the comparisons in the network.
The sensitivity of random-effect models to the between-study SD priors was tested. I2 statistics forheterogeneity were calculated for random-effect models that were insensitive to change in the priordistribution for the between-study SD. Results were only presented for random-effect models.
Clinical effectiveness results
Quantity and quality of research availableThe electronic database searches identified 2284 references. After screening titles and abstracts, full copiesof 198 papers were assessed for inclusion in the review. Three trials of axSpA populations were excludedbecause results were not available separately for the AS and nr-AxSpA populations.41–43 One study ofadalimumab appeared likely to be eligible but was excluded as it was only available as a ClinicalTrials.govrecord, without any results or further study details.44 One excluded study was an ongoing trial ofgolimumab (called GO-AHEAD).45
Twenty-eight eligible RCTs were identified, with 24 being suitable for data synthesis. Three etanercepttrials were not suitable for data synthesis because the study durations were only 6 weeks,46–48 andone infliximab trial was unsuitable because a (currently) unlicensed dose (3 mg/kg) had been studied.49 TheBarkham 2009 trial50,51 of infliximab in nr-AxSpA patients (see Table 2) was included in the clinical efficacysection because, even though infliximab is not currently licensed for patients with nr-AxSpA, the dose usedin this trial was the same as that licensed for AS. Furthermore, there was no reason to think it could not beconsidered in the same class as the other anti-TNFs when treating a nr-AxSpA population. The results ofthe trial therefore had the potential to be useful to help inform the relative efficacy of anti-TNFs fornr-AxSpA.
ASSESSMENT OF CLINICAL EFFECTIVENESS
NIHR Journals Library www.journalslibrary.nihr.ac.uk
12
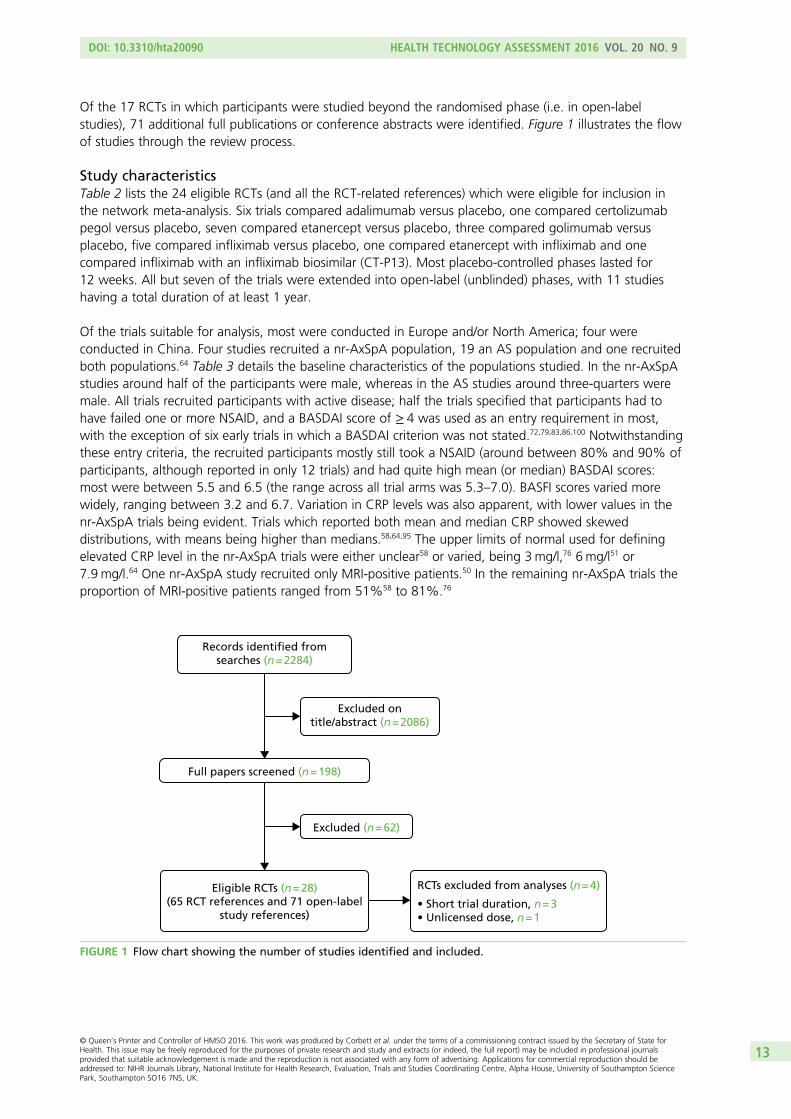
Of the 17 RCTs in which participants were studied beyond the randomised phase (i.e. in open-labelstudies), 71 additional full publications or conference abstracts were identified. Figure 1 illustrates the flowof studies through the review process.
Study characteristicsTable 2 lists the 24 eligible RCTs (and all the RCT-related references) which were eligible for inclusion inthe network meta-analysis. Six trials compared adalimumab versus placebo, one compared certolizumabpegol versus placebo, seven compared etanercept versus placebo, three compared golimumab versusplacebo, five compared infliximab versus placebo, one compared etanercept with infliximab and onecompared infliximab with an infliximab biosimilar (CT-P13). Most placebo-controlled phases lasted for12 weeks. All but seven of the trials were extended into open-label (unblinded) phases, with 11 studieshaving a total duration of at least 1 year.
Of the trials suitable for analysis, most were conducted in Europe and/or North America; four wereconducted in China. Four studies recruited a nr-AxSpA population, 19 an AS population and one recruitedboth populations.64 Table 3 details the baseline characteristics of the populations studied. In the nr-AxSpAstudies around half of the participants were male, whereas in the AS studies around three-quarters weremale. All trials recruited participants with active disease; half the trials specified that participants had tohave failed one or more NSAID, and a BASDAI score of ≥ 4 was used as an entry requirement in most,with the exception of six early trials in which a BASDAI criterion was not stated.72,79,83,86,100 Notwithstandingthese entry criteria, the recruited participants mostly still took a NSAID (around between 80% and 90% ofparticipants, although reported in only 12 trials) and had quite high mean (or median) BASDAI scores:most were between 5.5 and 6.5 (the range across all trial arms was 5.3–7.0). BASFI scores varied morewidely, ranging between 3.2 and 6.7. Variation in CRP levels was also apparent, with lower values in thenr-AxSpA trials being evident. Trials which reported both mean and median CRP showed skeweddistributions, with means being higher than medians.58,64,95 The upper limits of normal used for definingelevated CRP level in the nr-AxSpA trials were either unclear58 or varied, being 3mg/l,76 6 mg/l51 or7.9 mg/l.64 One nr-AxSpA study recruited only MRI-positive patients.50 In the remaining nr-AxSpA trials theproportion of MRI-positive patients ranged from 51%58 to 81%.76
Records identified fromsearches (n = 2284)
Full papers screened (n = 198)
Excluded ontitle/abstract (n = 2086)
Excluded (n = 62)
Eligible RCTs (n = 28)(65 RCT references and 71 open-label
study references)
RCTs excluded from analyses (n = 4)
• Short trial duration, n = 3• Unlicensed dose, n = 1
FIGURE 1 Flow chart showing the number of studies identified and included.
DOI: 10.3310/hta20090 HEALTH TECHNOLOGY ASSESSMENT 2016 VOL. 20 NO. 9
© Queen’s Printer and Controller of HMSO 2016. This work was produced by Corbett et al. under the terms of a commissioning contract issued by the Secretary of State forHealth. This issue may be freely reproduced for the purposes of private research and study and extracts (or indeed, the full report) may be included in professional journalsprovided that suitable acknowledgement is made and the reproduction is not associated with any form of advertising. Applications for commercial reproduction should beaddressed to: NIHR Journals Library, National Institute for Health Research, Evaluation, Trials and Studies Coordinating Centre, Alpha House, University of Southampton SciencePark, Southampton SO16 7NS, UK.
13
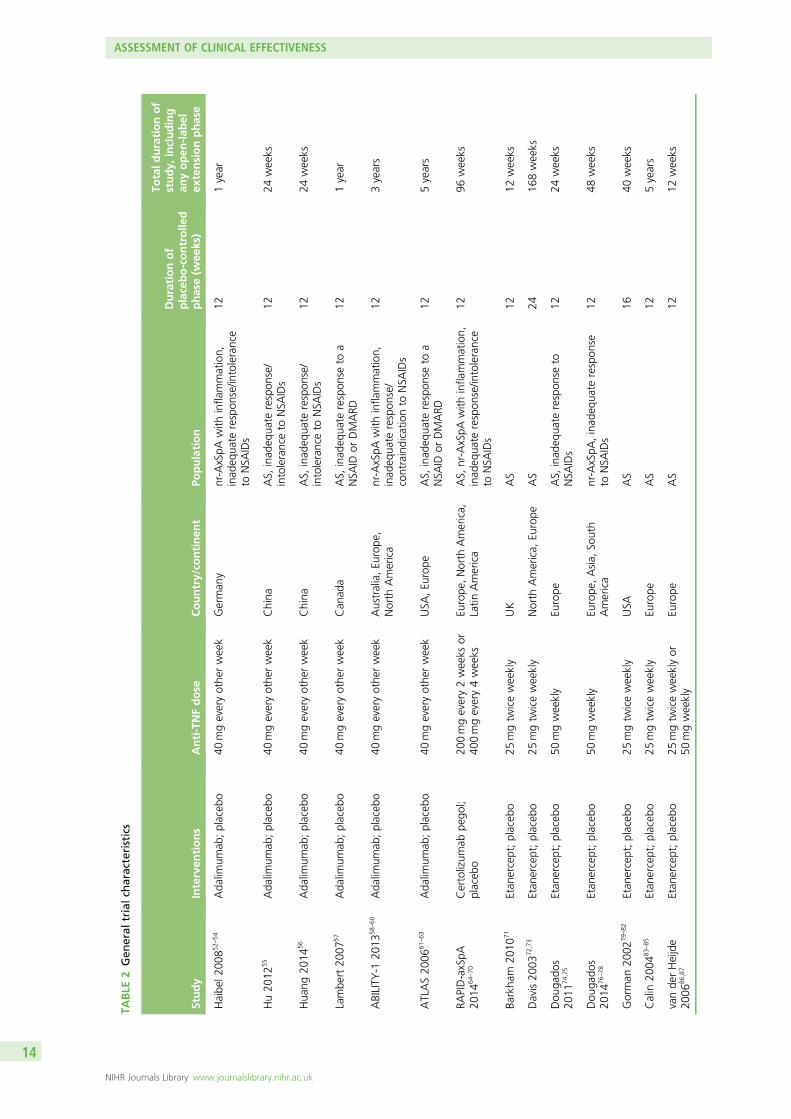
TABLE
2Gen
eral
trialch
aracteristics
Study
Interven
tions
Anti-TNFdose
Country/co
ntinen
tPo
pulation
Durationof
placebo-controlle
dphase(w
eeks)
Totald
urationof
study,
including
anyopen
-lab
elex
tensionphase
Haibe
l200
852–
54Ada
limum
ab;placeb
o40
mgeveryothe
rweek
German
ynr-AxSpA
with
infla
mmation,
inad
equa
terespon
se/in
tolerance
toNSA
IDs
121year
Hu20
1255
Ada
limum
ab;placeb
o40
mgeveryothe
rweek
China
AS,
inad
equa
terespon
se/
intoleranceto
NSA
IDs
1224
weeks
Hua
ng20
1456
Ada
limum
ab;placeb
o40
mgeveryothe
rweek
China
AS,
inad
equa
terespon
se/
intoleranceto
NSA
IDs
1224
weeks
Lambe
rt20
0757
Ada
limum
ab;placeb
o40
mgeveryothe
rweek
Can
ada
AS,
inad
equa
terespon
seto
aNSA
IDor
DMARD
121year
ABILITY
-120
1358
–60
Ada
limum
ab;placeb
o40
mgeveryothe
rweek
Australia,Eu
rope
,North
America
nr-AxSpA
with
infla
mmation,
inad
equa
terespon
se/
contraindicatio
nto
NSA
IDs
123years
ATLAS20
0661
–63
Ada
limum
ab;placeb
o40
mgeveryothe
rweek
USA
,Eu
rope
AS,
inad
equa
terespon
seto
aNSA
IDor
DMARD
125years
RAPID-axSpA
2014
64–70
Certolizum
abpe
gol;
placeb
o20
0mgevery2weeks
or40
0mgevery4weeks
Europe
,North
America,
Latin
America
AS,
nr-AxSpA
with
infla
mmation,
inad
equa
terespon
se/in
tolerance
toNSA
IDs
1296
weeks
Barkha
m20
1071
Etan
ercept;placeb
o25
mgtw
iceweekly
UK
AS
1212
weeks
Davis20
0372
,73
Etan
ercept;placeb
o25
mgtw
iceweekly
North
America,
Europe
AS
2416
8weeks
Dou
gado
s20
1174
,75
Etan
ercept;placeb
o50
mgweekly
Europe
AS,
inad
equa
terespon
seto
NSA
IDs
1224
weeks
Dou
gado
s20
1476
–78
Etan
ercept;placeb
o50
mgweekly
Europe
,Asia,
South
America
nr-AxSpA
,inad
equa
terespon
seto
NSA
IDs
1248
weeks
Gorman
2002
79–82
Etan
ercept;placeb
o25
mgtw
iceweekly
USA
AS
1640
weeks
Calin
2004
83–85
Etan
ercept;placeb
o25
mgtw
iceweekly
Europe
AS
125years
vande
rHeijde
2006
86,87
Etan
ercept;placeb
o25
mgtw
iceweeklyor
50mgweekly
Europe
AS
1212
weeks
ASSESSMENT OF CLINICAL EFFECTIVENESS
NIHR Journals Library www.journalslibrary.nihr.ac.uk
14
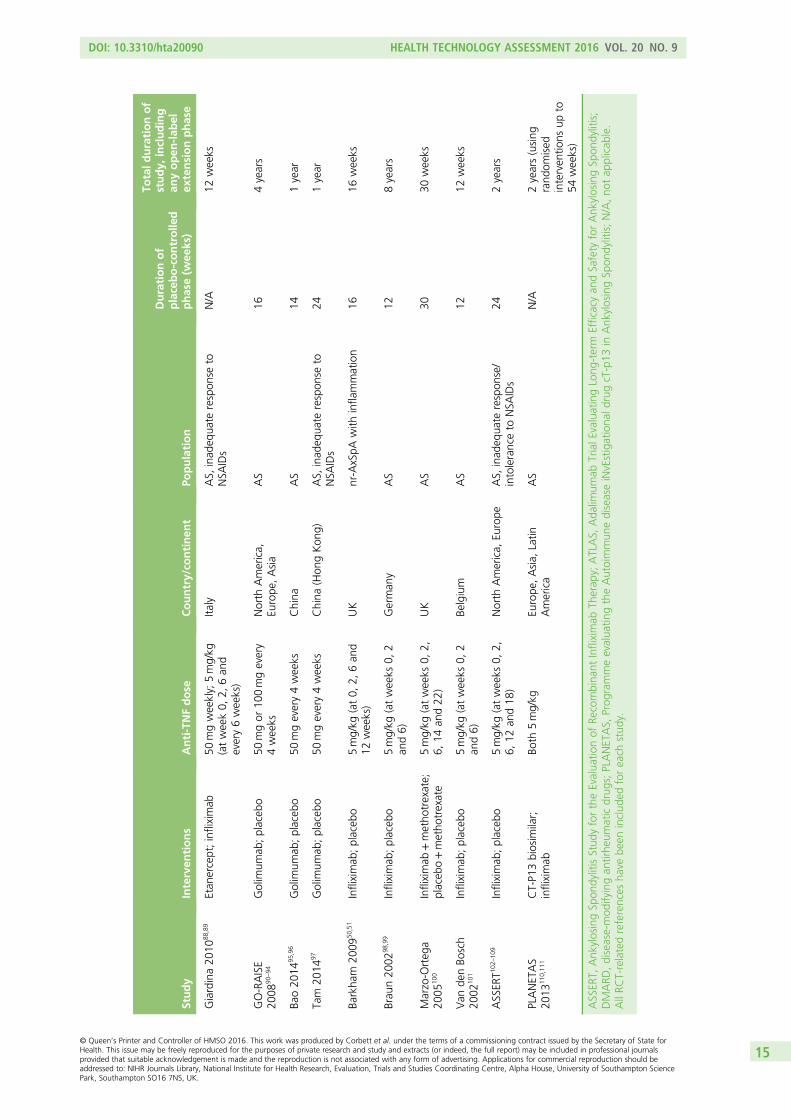
Study
Interven
tions
Anti-TNFdose
Country/co
ntinen
tPo
pulation
Durationof
placebo-controlle
dphase(w
eeks)
Totald
urationof
study,
including
anyopen
-lab
elex
tensionphase
Giardina20
1088
,89
Etan
ercept;infliximab
50mgweekly;
5mg/kg
(atweek0,
2,6an
devery6weeks)
Italy
AS,
inad
equa
terespon
seto
NSA
IDs
N/A
12weeks
GO-RAISE
2008
90–94
Golim
umab
;placeb
o50
mgor
100mgevery
4weeks
North
America,
Europe
,Asia
AS
164years
Bao20
1495
,96
Golim
umab
;placeb
o50
mgevery4weeks
China
AS
141year
Tam
2014
97Golim
umab
;placeb
o50
mgevery4weeks
China
(Hon
gKon
g)AS,
inad
equa
terespon
seto
NSA
IDs
241year
Barkha
m20
0950
,51
Infliximab
;placeb
o5mg/kg
(at0,
2,6an
d12
weeks)
UK
nr-AxSpA
with
infla
mmation
1616
weeks
Brau
n20
0298
,99
Infliximab
;placeb
o5mg/kg
(atweeks
0,2
and6)
German
yAS
128years
Marzo-O
rteg
a20
0510
0Infliximab
+metho
trexate;
placeb
o+metho
trexate
5mg/kg
(atweeks
0,2,
6,14
and22
)UK
AS
3030
weeks
Van
denBo
sch
2002
101
Infliximab
;placeb
o5mg/kg
(atweeks
0,2
and6)
Belgium
AS
1212
weeks
ASSER
T102
–10
9Infliximab
;placeb
o5mg/kg
(atweeks
0,2,
6,12
and18
)North
America,
Europe
AS,
inad
equa
terespon
se/
intoleranceto
NSA
IDs
242years
PLANETAS
2013
110 ,11
1CT-P1
3biosim
ilar;
infliximab
Both
5mg/kg
Europe
,Asia,
Latin
America
AS
N/A
2years(using
rand
omised
interven
tions
upto
54weeks)
ASSER
T,Ank
ylosingSp
ondylitisStud
yfortheEvalua
tionof
Recombina
ntInfliximab
Therap
y;ATLAS,
Ada
limum
abTrialE
valuatingLong
-term
Efficacyan
dSafety
forAnk
ylosingSp
ondylitis;
DMARD
,disease-mod
ifyingan
tirhe
umaticdrug
s;PLANETAS,
Prog
rammeevalua
tingtheAutoimmun
ediseaseiNvEstigationa
ldrugcT-p13
inAnk
ylosingSp
ondylitis;N/A,no
tap
plicab
le.
AllRC
T-relatedreferences
have
been
includ
edforeach
stud
y.
DOI: 10.3310/hta20090 HEALTH TECHNOLOGY ASSESSMENT 2016 VOL. 20 NO. 9
© Queen’s Printer and Controller of HMSO 2016. This work was produced by Corbett et al. under the terms of a commissioning contract issued by the Secretary of State forHealth. This issue may be freely reproduced for the purposes of private research and study and extracts (or indeed, the full report) may be included in professional journalsprovided that suitable acknowledgement is made and the reproduction is not associated with any form of advertising. Applications for commercial reproduction should beaddressed to: NIHR Journals Library, National Institute for Health Research, Evaluation, Trials and Studies Coordinating Centre, Alpha House, University of Southampton SciencePark, Southampton SO16 7NS, UK.
15
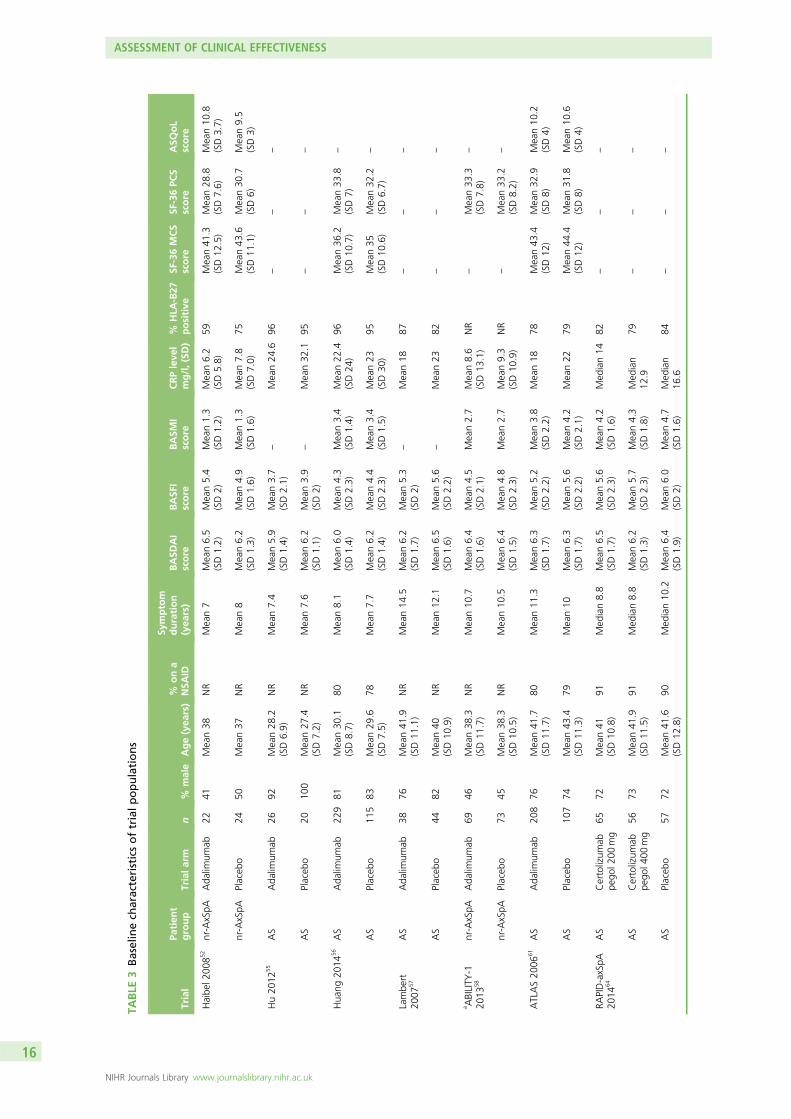
TABLE
3Baselinech
aracteristicsoftrialp
opulations
Trial
Patien
tgroup
Trialarm
n%
male
Age(yea
rs)
%ona
NSA
ID
Symptom
duration
(yea
rs)
BASD
AI
score
BASF
Iscore
BASM
Iscore
CRPleve
lmg/l,(SD
)%
HLA
-B27
positive
SF-36MCS
score
SF-36PC
Sscore
ASQ
oL
score
Haibe
l200
852
nr-AxSpA
Ada
limum
ab22
41Mean38
NR
Mean7
Mean6.5
(SD1.2)
Mean5.4
(SD2)
Mean1.3
(SD1.2)
Mean6.2
(SD5.8)
59Mean41
.3(SD12
.5)
Mean28
.8(SD7.6)
Mean10
.8(SD3.7)
nr-AxSpA
Placeb
o24
50Mean37
NR
Mean8
Mean6.2
(SD1.3)
Mean4.9
(SD1.6)
Mean1.3
(SD1.6)
Mean7.8
(SD7.0)
75Mean43
.6(SD11
.1)
Mean30
.7(SD6)
Mean9.5
(SD3)
Hu20
1255
AS
Ada
limum
ab26
92Mean28
.2(SD6.9)
NR
Mean7.4
Mean5.9
(SD1.4)
Mean3.7
(SD2.1)
–Mean24
.696
––
–
AS
Placeb
o20
100
Mean27
.4(SD7.2)
NR
Mean7.6
Mean6.2
(SD1.1)
Mean3.9
(SD2)
–Mean32
.195
––
–
Hua
ng20
1456
AS
Ada
limum
ab22
981
Mean30
.1(SD8.7)
80Mean8.1
Mean6.0
(SD1.4)
Mean4.3
(SD2.3)
Mean3.4
(SD1.4)
Mean22
.4(SD24
)96
Mean36
.2(SD10
.7)
Mean33
.8(SD7)
–
AS
Placeb
o11
583
Mean29
.6(SD7.5)
78Mean7.7
Mean6.2
(SD1.4)
Mean4.4
(SD2.3)
Mean3.4
(SD1.5)
Mean23
(SD30
)95
Mean35
(SD10
.6)
Mean32
.2(SD6.7)
–
Lambe
rt20
0757
AS
Ada
limum
ab38
76Mean41
.9(SD11
.1)
NR
Mean14
.5Mean6.2
(SD1.7)
Mean5.3
(SD2)
–Mean18
87–
––
AS
Placeb
o44
82Mean40
(SD10
.9)
NR
Mean12
.1Mean6.5
(SD1.6)
Mean5.6
(SD2.2)
–Mean23
82–
––
a ABILITY
-120
1358
nr-AxSpA
Ada
limum
ab69
46Mean38
.3(SD11
.7)
NR
Mean10
.7Mean6.4
(SD1.6)
Mean4.5
(SD2.1)
Mean2.7
Mean8.6
(SD13
.1)
NR
–Mean33
.3(SD7.8)
–
nr-AxSpA
Placeb
o73
45Mean38
.3(SD10
.5)
NR
Mean10
.5Mean6.4
(SD1.5)
Mean4.8
(SD2.3)
Mean2.7
Mean9.3
(SD10
.9)
NR
–Mean33
.2(SD8.2)
–
ATLAS20
0661
AS
Ada
limum
ab20
876
Mean41
.7(SD11
.7)
80Mean11
.3Mean6.3
(SD1.7)
Mean5.2
(SD2.2)
Mean3.8
(SD2.2)
Mean18
78Mean43
.4(SD12
)Mean32
.9(SD8)
Mean10
.2(SD4)
AS
Placeb
o10
774
Mean43
.4(SD11
.3)
79Mean10
Mean6.3
(SD1.7)
Mean5.6
(SD2.2)
Mean4.2
(SD2.1)
Mean22
79Mean44
.4(SD12
)Mean31
.8(SD8)
Mean10
.6(SD4)
RAPID-axSpA
2014
64AS
Certolizum
abpe
gol2
00mg
6572
Mean41
(SD10
.8)
91Med
ian8.8
Mean6.5
(SD1.7)
Mean5.6
(SD2.3)
Mean4.2
(SD1.6)
Med
ian14
82–
––
AS
Certolizum
abpe
gol4
00mg
5673
Mean41
.9(SD11
.5)
91Med
ian8.8
Mean6.2
(SD1.3)
Mean5.7
(SD2.3)
Mean4.3
(SD1.8)
Med
ian
12.9
79–
––
AS
Placeb
o57
72Mean41
.6(SD12
.8)
90Med
ian10
.2Mean6.4
(SD1.9)
Mean6.0
(SD2)
Mean4.7
(SD1.6)
Med
ian
16.6
84–
––
ASSESSMENT OF CLINICAL EFFECTIVENESS
NIHR Journals Library www.journalslibrary.nihr.ac.uk
16
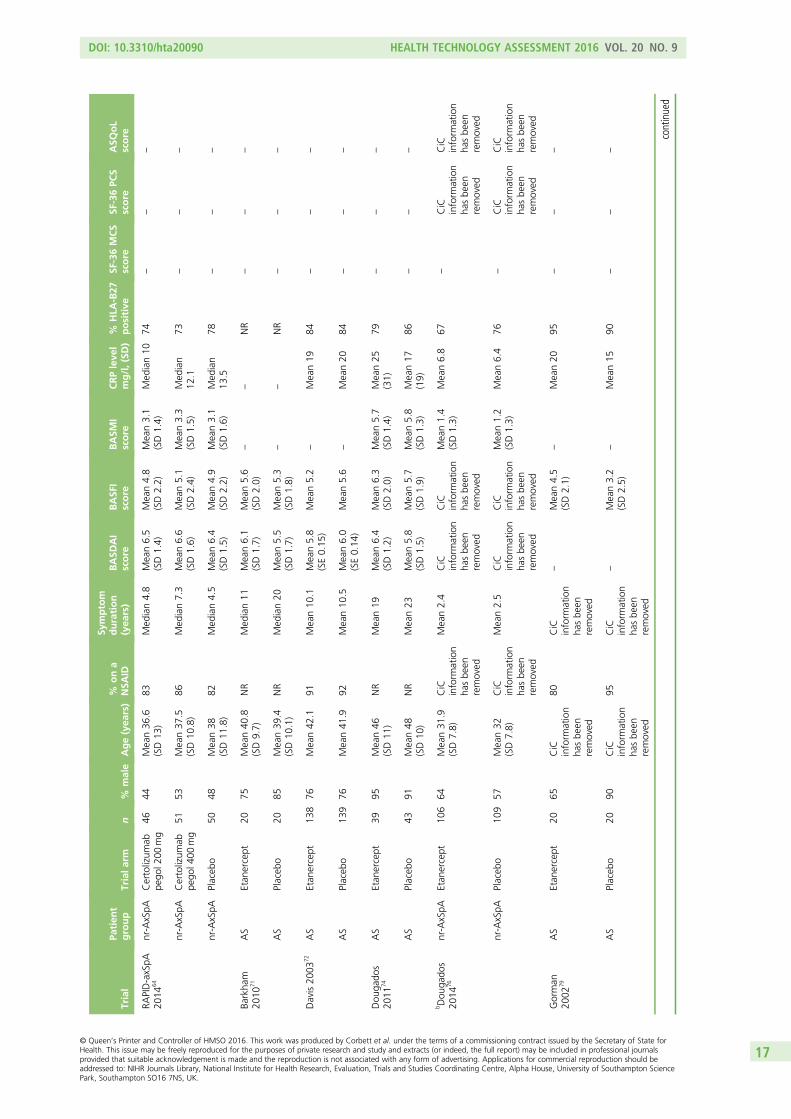
Trial
Patien
tgroup
Trialarm
n%
male
Age(yea
rs)
%ona
NSA
ID
Symptom
duration
(yea
rs)
BASD
AI
score
BASF
Iscore
BASM
Iscore
CRPleve
lmg/l,(SD
)%
HLA
-B27
positive
SF-36MCS
score
SF-36PC
Sscore
ASQ
oL
score
RAPID-axSpA
2014
64nr-AxSpA
Certolizum
abpe
gol2
00mg
4644
Mean36
.6(SD13
)83
Med
ian4.8
Mean6.5
(SD1.4)
Mean4.8
(SD2.2)
Mean3.1
(SD1.4)
Med
ian10
74–
––
nr-AxSpA
Certolizum
abpe
gol4
00mg
5153
Mean37
.5(SD10
.8)
86Med
ian7.3
Mean6.6
(SD1.6)
Mean5.1
(SD2.4)
Mean3.3
(SD1.5)
Med
ian
12.1
73–
––
nr-AxSpA
Placeb
o50
48Mean38
(SD11
.8)
82Med
ian4.5
Mean6.4
(SD1.5)
Mean4.9
(SD2.2)
Mean3.1
(SD1.6)
Med
ian
13.5
78–
––
Barkha
m20
1071
AS
Etan
ercept
2075
Mean40
.8(SD9.7)
NR
Med
ian11
Mean6.1
(SD1.7)
Mean5.6
(SD2.0)
––
NR
––
–
AS
Placeb
o20
85Mean39
.4(SD10
.1)
NR
Med
ian20
Mean5.5
(SD1.7)
Mean5.3
(SD1.8)
––
NR
––
–
Davis20
0372
AS
Etan
ercept
138
76Mean42
.191
Mean10
.1Mean5.8
(SE0.15
)Mean5.2
–Mean19
84–
––
AS
Placeb
o13
976
Mean41
.992
Mean10
.5Mean6.0
(SE0.14
)Mean5.6
–Mean20
84–
––
Dou
gado
s20
1174
AS
Etan
ercept
3995
Mean46
(SD11
)NR
Mean19
Mean6.4
(SD1.2)
Mean6.3
(SD2.0)
Mean5.7
(SD1.4)
Mean25
(31)
79–
––
AS
Placeb
o43
91Mean48
(SD10
)NR
Mean23
Mean5.8
(SD1.5)
Mean5.7
(SD1.9)
Mean5.8
(SD1.3)
Mean17
(19)
86–
––
bDou
gado
s20
1476
nr-AxSpA
Etan
ercept
106
64Mean31
.9(SD7.8)
CiC
inform
ation
hasbe
enremoved
Mean2.4
CiC
inform
ation
hasbe
enremoved
CiC
inform
ation
hasbe
enremoved
Mean1.4
(SD1.3)
Mean6.8
67–
CiC
inform
ation
hasbe
enremoved
CiC
inform
ation
hasbe
enremoved
nr-AxSpA
Placeb
o10
957
Mean32
(SD7.8)
CiC
inform
ation
hasbe
enremoved
Mean2.5
CiC
inform
ation
hasbe
enremoved
CiC
inform
ation
hasbe
enremoved
Mean1.2
(SD1.3)
Mean6.4
76–
CiC
inform
ation
hasbe
enremoved
CiC
inform
ation
hasbe
enremoved
Gorman
2002
79AS
Etan
ercept
2065
CiC
inform
ation
hasbe
enremoved
80CiC
inform
ation
hasbe
enremoved
–Mean4.5
(SD2.1)
–Mean20
95–
––
AS
Placeb
o20
90CiC
inform
ation
hasbe
enremoved
95CiC
inform
ation
hasbe
enremoved
–Mean3.2
(SD2.5)
–Mean15
90–
––
continued
DOI: 10.3310/hta20090 HEALTH TECHNOLOGY ASSESSMENT 2016 VOL. 20 NO. 9
© Queen’s Printer and Controller of HMSO 2016. This work was produced by Corbett et al. under the terms of a commissioning contract issued by the Secretary of State forHealth. This issue may be freely reproduced for the purposes of private research and study and extracts (or indeed, the full report) may be included in professional journalsprovided that suitable acknowledgement is made and the reproduction is not associated with any form of advertising. Applications for commercial reproduction should beaddressed to: NIHR Journals Library, National Institute for Health Research, Evaluation, Trials and Studies Coordinating Centre, Alpha House, University of Southampton SciencePark, Southampton SO16 7NS, UK.
17
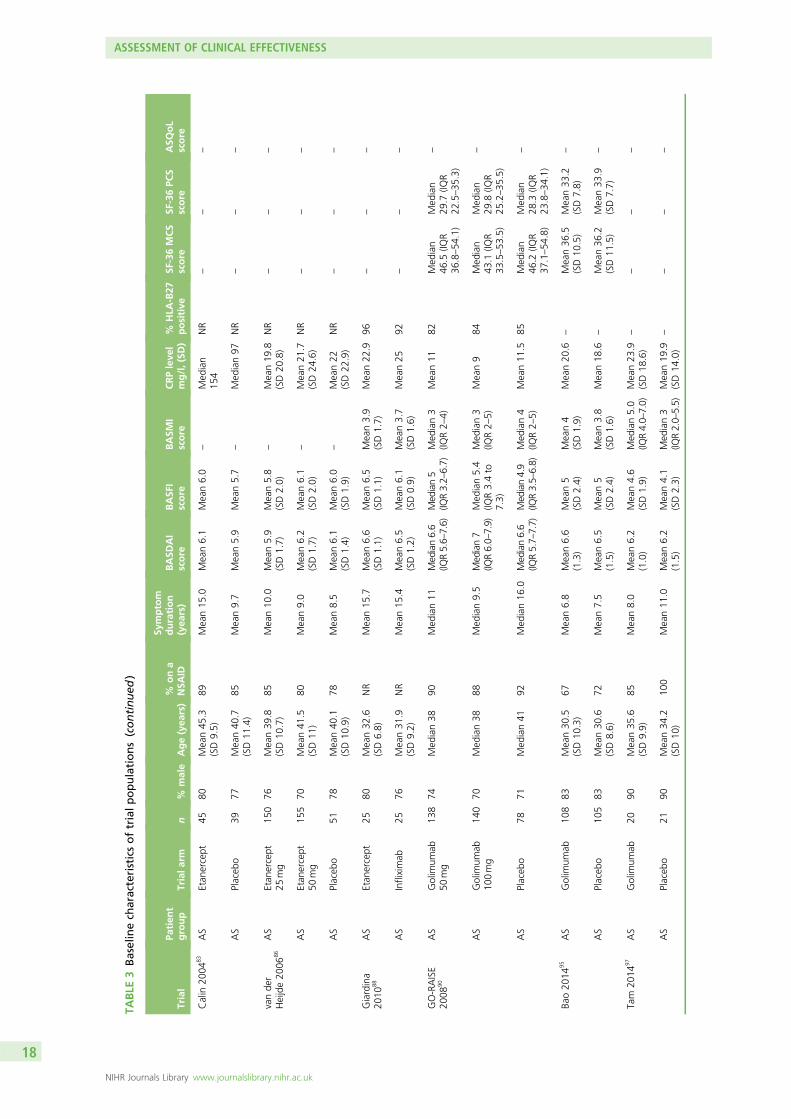
TABLE
3Baselinech
aracteristicsoftrialp
opulations(continued
)
Trial
Patien
tgroup
Trialarm
n%
male
Age(yea
rs)
%ona
NSA
ID
Symptom
duration
(yea
rs)
BASD
AI
score
BASF
Iscore
BASM
Iscore
CRPleve
lmg/l,(SD
)%
HLA
-B27
positive
SF-36MCS
score
SF-36PC
Sscore
ASQ
oL
score
Calin
2004
83AS
Etan
ercept
4580
Mean45
.3(SD9.5)
89Mean15
.0Mean6.1
Mean6.0
–Med
ian
154
NR
––
–
AS
Placeb
o39
77Mean40
.7(SD11
.4)
85Mean9.7
Mean5.9
Mean5.7
–Med
ian97
NR
––
–
vande
rHeijde20
0686
AS
Etan
ercept
25mg
150
76Mean39
.8(SD10
.7)
85Mean10
.0Mean5.9
(SD1.7)
Mean5.8
(SD2.0)
–Mean19
.8(SD20
.8)
NR
––
–
AS
Etan
ercept
50mg
155
70Mean41
.5(SD11
)80
Mean9.0
Mean6.2
(SD1.7)
Mean6.1
(SD2.0)
–Mean21
.7(SD24
.6)
NR
––
–
AS
Placeb
o51
78Mean40
.1(SD10
.9)
78Mean8.5
Mean6.1
(SD1.4)
Mean6.0
(SD1.9)
–Mean22
(SD22
.9)
NR
––
–
Giardina
2010
88AS
Etan
ercept
2580
Mean32
.6(SD6.8)
NR
Mean15
.7Mean6.6
(SD1.1)
Mean6.5
(SD1.1)
Mean3.9
(SD1.7)
Mean22
.996
––
–
AS
Infliximab
2576
Mean31
.9(SD9.2)
NR
Mean15
.4Mean6.5
(SD1.2)
Mean6.1
(SD0.9)
Mean3.7
(SD1.6)
Mean25
92–
––
GO-RAISE
2008
90AS
Golim
umab
50mg
138
74Med
ian38
90Med
ian11
Median6.6
(IQR5.6–
7.6)
Med
ian5
(IQR3.2–6.7)
Med
ian3
(IQR2–
4)Mean11
82Med
ian
46.5
(IQR
36.8–54
.1)
Med
ian
29.7
(IQR
22.5–35
.3)
–
AS
Golim
umab
100mg
140
70Med
ian38
88Med
ian9.5
Median7
(IQR6.0–
7.9)
Med
ian5.4
(IQR3.4to
7.3)
Med
ian3
(IQR2–
5)Mean9
84Med
ian
43.1
(IQR
33.5–53
.5)
Med
ian
29.8
(IQR
25.2–35
.5)
–
AS
Placeb
o78
71Med
ian41
92Med
ian16
.0Median6.6
(IQR5.7–
7.7)
Med
ian4.9
(IQR3.5–6.8)
Med
ian4
(IQR2–
5)Mean11
.585
Med
ian
46.2
(IQR
37.1–54
.8)
Med
ian
28.3
(IQR
23.8–34
.1)
–
Bao20
1495
AS
Golim
umab
108
83Mean30
.5(SD10
.3)
67Mean6.8
Mean6.6
(1.3)
Mean5
(SD2.4)
Mean4
(SD1.9)
Mean20
.6–
Mean36
.5(SD10
.5)
Mean33
.2(SD7.8)
–
AS
Placeb
o10
583
Mean30
.6(SD8.6)
72Mean7.5
Mean6.5
(1.5)
Mean5
(SD2.4)
Mean3.8
(SD1.6)
Mean18
.6–
Mean36
.2(SD11
.5)
Mean33
.9(SD7.7)
–
Tam
2014
97AS
Golim
umab
2090
Mean35
.6(SD9.9)
85Mean8.0
Mean6.2
(1.0)
Mean4.6
(SD1.9)
Med
ian5.0
(IQR4.0–7.0)
Mean23
.9(SD18
.6)
––
––
AS
Placeb
o21
90Mean34
.2(SD10
)10
0Mean11
.0Mean6.2
(1.5)
Mean4.1
(SD2.3)
Med
ian3
(IQR2.0–5.5)
Mean19
.9(SD14
.0)
––
––
ASSESSMENT OF CLINICAL EFFECTIVENESS
NIHR Journals Library www.journalslibrary.nihr.ac.uk
18
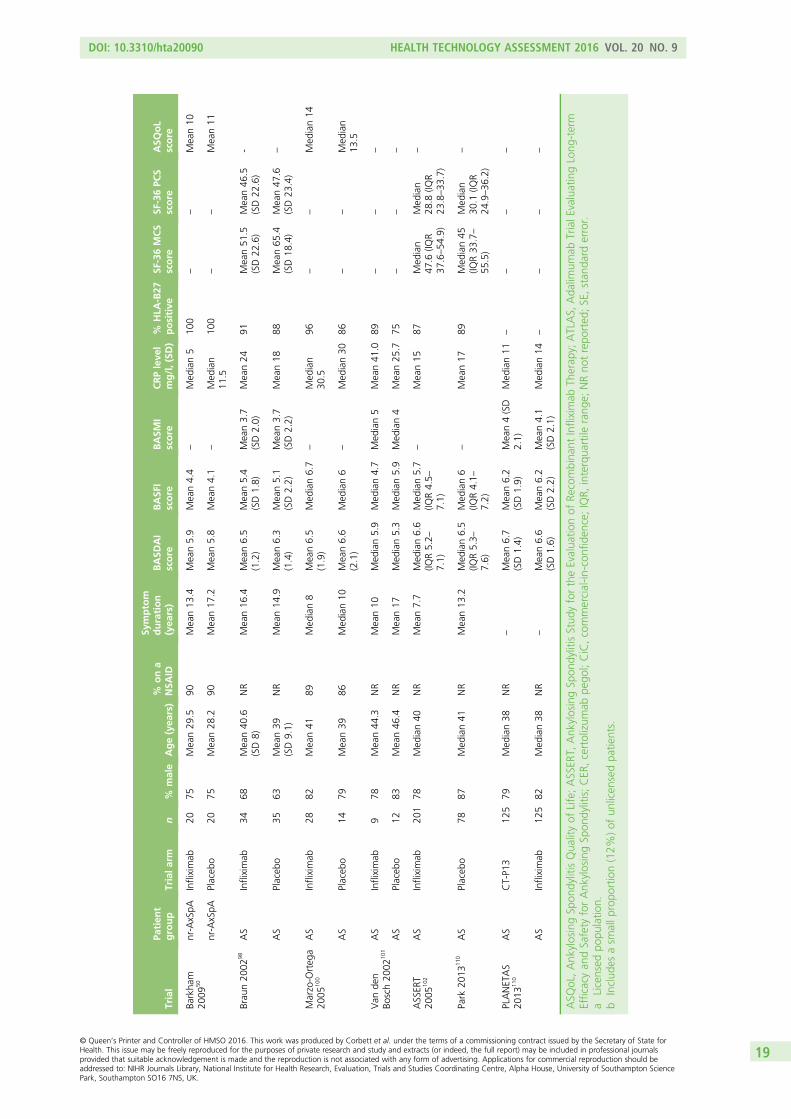
Trial
Patien
tgroup
Trialarm
n%
male
Age(yea
rs)
%ona
NSA
ID
Symptom
duration
(yea
rs)
BASD
AI
score
BASF
Iscore
BASM
Iscore
CRPleve
lmg/l,(SD
)%
HLA
-B27
positive
SF-36MCS
score
SF-36PC
Sscore
ASQ
oL
score
Barkha
m20
0950
nr-AxSpA
Infliximab
2075
Mean29
.590
Mean13
.4Mean5.9
Mean4.4
–Med
ian5
100
––
Mean10
nr-AxSpA
Placeb
o20
75Mean28
.290
Mean17
.2Mean5.8
Mean4.1
–Med
ian
11.5
100
––
Mean11
Brau
n20
0298
AS
Infliximab
3468
Mean40
.6(SD8)
NR
Mean16
.4Mean6.5
(1.2)
Mean5.4
(SD1.8)
Mean3.7
(SD2.0)
Mean24
91Mean51
.5(SD22
.6)
Mean46
.5(SD22
.6)
-
AS
Placeb
o35
63Mean39
(SD9.1)
NR
Mean14
.9Mean6.3
(1.4)
Mean5.1
(SD2.2)
Mean3.7
(SD2.2)
Mean18
88Mean65
.4(SD18
.4)
Mean47
.6(SD23
.4)
–
Marzo-O
rteg
a20
0510
0AS
Infliximab
2882
Mean41
89Med
ian8
Mean6.5
(1.9)
Med
ian6.7
–Med
ian
30.5
96–
–Med
ian14
AS
Placeb
o14
79Mean39
86Med
ian10
Mean6.6
(2.1)
Med
ian6
–Med
ian30
86–
–Med
ian
13.5
Van
den
Bosch20
0210
1AS
Infliximab
978
Mean44
.3NR
Mean10
Med
ian5.9
Med
ian4.7
Med
ian5
Mean41
.089
––
–
AS
Placeb
o12
83Mean46
.4NR
Mean17
Med
ian5.3
Med
ian5.9
Med
ian4
Mean25
.775
––
–
ASSER
T20
0510
2AS
Infliximab
201
78Med
ian40
NR
Mean7.7
Med
ian6.6
(IQR5.2–
7.1)
Med
ian5.7
(IQR4.5–
7.1)
–Mean15
87Med
ian
47.6
(IQR
37.6–54
.9)
Med
ian
28.8
(IQR
23.8–33
.7)
–
Park
2013
110
AS
Placeb
o78
87Med
ian41
NR
Mean13
.2Med
ian6.5
(IQR5.3–
7.6)
Med
ian6
(IQR4.1–
7.2)
–Mean17
89Med
ian45
(IQR33
.7–
55.5)
Med
ian
30.1
(IQR
24.9–36
.2)
–
PLANETAS
2013
110
AS
CT-P1
312
579
Med
ian38
NR
–Mean6.7
(SD1.4)
Mean6.2
(SD1.9)
Mean4(SD
2.1)
Med
ian11
––
––
AS
Infliximab
125
82Med
ian38
NR
–Mean6.6
(SD1.6)
Mean6.2
(SD2.2)
Mean4.1
(SD2.1)
Med
ian14
––
––
ASQ
oL,Ank
ylosingSp
ondylitisQua
lityof
Life;ASSER
T,Ank
ylosingSp
ondylitisStud
yfortheEvalua
tionof
Recombina
ntInfliximab
Therap
y;ATLAS,
Ada
limum
abTrialE
valuatingLong
-term
Efficacyan
dSafety
forAnk
ylosingSp
ondylitis;CER
,certolizum
abpe
gol;CiC,commercial-in
-con
fiden
ce;IQR,
interqua
rtile
rang
e;NRno
trepo
rted
;SE,stan
dard
error.
aLicensed
popu
latio
n.b
Includ
esasm
allp
ropo
rtion(12%
)of
unlicen
sedpa
tients.
DOI: 10.3310/hta20090 HEALTH TECHNOLOGY ASSESSMENT 2016 VOL. 20 NO. 9
© Queen’s Printer and Controller of HMSO 2016. This work was produced by Corbett et al. under the terms of a commissioning contract issued by the Secretary of State forHealth. This issue may be freely reproduced for the purposes of private research and study and extracts (or indeed, the full report) may be included in professional journalsprovided that suitable acknowledgement is made and the reproduction is not associated with any form of advertising. Applications for commercial reproduction should beaddressed to: NIHR Journals Library, National Institute for Health Research, Evaluation, Trials and Studies Coordinating Centre, Alpha House, University of Southampton SciencePark, Southampton SO16 7NS, UK.
19
Risk of biasResults of the risk of bias judgements are presented in Table 4. Further details, including judgementreasons and the prognostic indicators of important baseline imbalance, are available in Appendix 3. Mosttrials were judged to have a low risk of bias overall; when possible bias was detected, there was littleindication to suggest that this varied across the different anti-TNF trials.
Over half the trials did not report adequate details about methods of randomisation and allocationconcealment, although in the majority of those trials (8 out of 14) an assessment could be made ofwhether or not groups were balanced in all five of the important prognostic indicators of treatmentresponse. Using both randomisation method details and a baseline assessment to judge the risk ofselection bias, 15 trials were judged as having a low risk of selection bias, five trials were judged as havingan unclear risk51,71,86,96,112 and four as having a high risk;50,79,83,101 in one of these four trials the risk wasdeemed likely to be a result of a chance effect.79
The risk of performance bias arising from lack of blinding of participants and personnel was low in20 trials, unclear in three trials55,57,64 and high in the one head-to-head trial, in which blinding would havebeen difficult to achieve because of the different modes and timings of delivery (weekly injection foretanercept vs. 6-weekly infusion for infliximab).88 All except one of the trials were at low risk of detectionbias, as they were all adequately placebo controlled (except the head-to-head trial), with nearly all the keyoutcomes being self-reported by patients (a notable exception being BASMI). The blinded patients werethe outcome assessors, and the effect of any unblinded study personnel on patient questionnaireresponses was likely to be minimal at most. The proportion of patients withdrawing or dropping out oftrials was generally low; most trials received low risk judgements for attrition bias. In two of the trials withunclear risk judgements, there were nevertheless reasons to suspect the possibility of important bias (seeAppendix 3).55,71 Of the studies with missing data which also reported details on the populations andimputations used in analyses, ‘last observation carried forward’ (LOCF) was used; this was done using amodified intention-to-treat (mITT) approach in just over half the trials (in which patients had to havereceived at least one dose of treatment) and an intention-to-treat (ITT) approach in the remaining trials(see Appendix 3). There was no evidence of reporting bias in any of the trials with all being judged as lowrisk, except for one trial with an unclear risk of bias.55
Clinical effectiveness results: efficacy results from randomisedcontrolled trialsIndividual results for all 24 trials are presented in Appendix 4.
Exclusions from the meta-analysesOf the trials with results at between 10 and 16 weeks, one small head-to-head trial (n= 50) comparingetanercept with infliximab was excluded, as it was redundant in a class-effect model (in addition, blindingwas not feasible in this trial).88 One trial110 was excluded because it compared infliximab and CT-P13, andtherefore did not include any of the relevant comparators needed for meta-analysis. The maximum numberof studies included for any one outcome was 16.
Exclusions from the sensitivity analysesFive studies were excluded in the sensitivity analyses because of risk of bias judgements.55,71,79,83,101 Furtherdetails can be found in Appendix 3. A sensitivity analysis of the nr-AxSpA trials was not performed, as the onetrial judged to have a high risk of bias had only 40 patients;50 any effect arising from the removal of such asmall study would have been likely to have been minimal.
ASSESSMENT OF CLINICAL EFFECTIVENESS
NIHR Journals Library www.journalslibrary.nihr.ac.uk
20
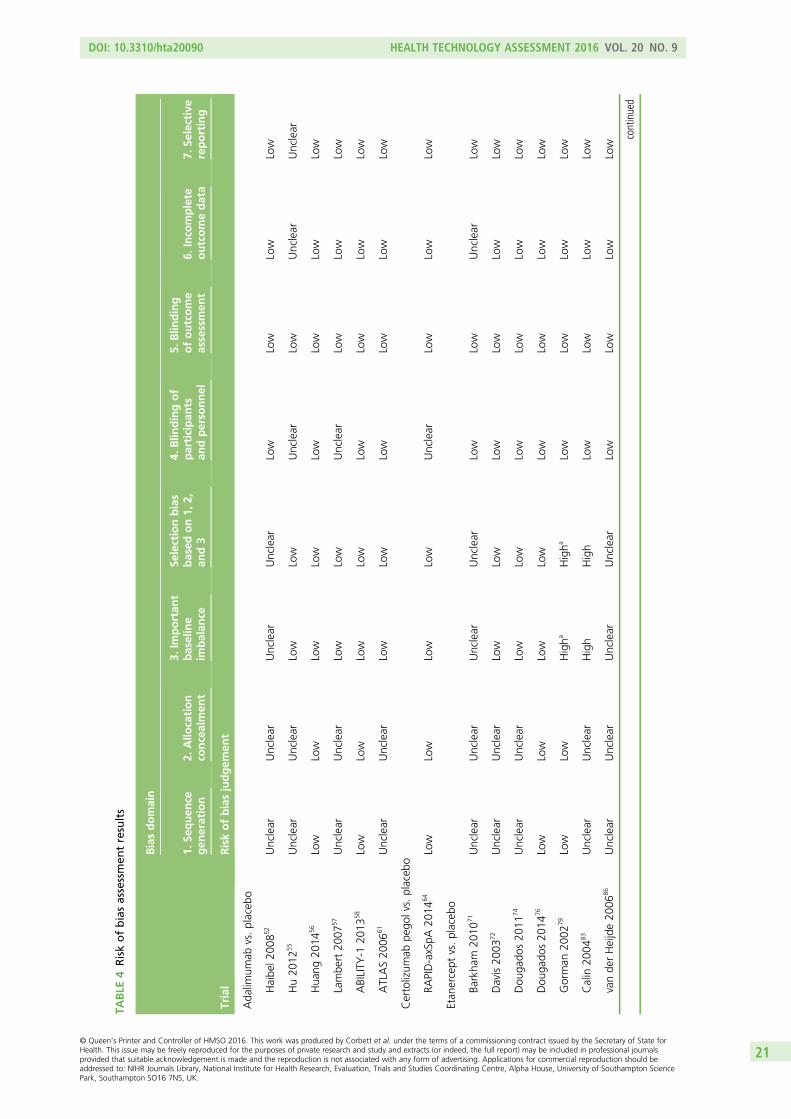
TABLE
4Riskofbiasassessmen
tresults
Trial
Biasdomain
1.Se
quen
cegen
eration
2.Allo
cation
concealmen
t
3.Im
portan
tbaseline
imbalan
ce
Selectionbias
based
on1,
2,an
d3
4.Blin
dingof
participan
tsan
dperso
nnel
5.Blin
ding
ofoutcome
assessmen
t6.
Inco
mplete
outcomedata
7.Se
lective
reporting
Riskofbiasjudgem
ent
Ada
limum
abvs.placeb
o
Haibe
l200
852
Unclear
Unclear
Unclear
Unclear
Low
Low
Low
Low
Hu20
1255
Unclear
Unclear
Low
Low
Unclear
Low
Unclear
Unclear
Hua
ng20
1456
Low
Low
Low
Low
Low
Low
Low
Low
Lambe
rt20
0757
Unclear
Unclear
Low
Low
Unclear
Low
Low
Low
ABILITY
-120
1358
Low
Low
Low
Low
Low
Low
Low
Low
ATLAS20
0661
Unclear
Unclear
Low
Low
Low
Low
Low
Low
Certolizum
abpe
golvs.placeb
o
RAPID-axSpA
2014
64Low
Low
Low
Low
Unclear
Low
Low
Low
Etan
ercept
vs.placeb
o
Barkha
m20
1071
Unclear
Unclear
Unclear
Unclear
Low
Low
Unclear
Low
Davis20
0372
Unclear
Unclear
Low
Low
Low
Low
Low
Low
Dou
gado
s20
1174
Unclear
Unclear
Low
Low
Low
Low
Low
Low
Dou
gado
s20
1476
Low
Low
Low
Low
Low
Low
Low
Low
Gorman
2002
79Low
Low
Higha
Higha
Low
Low
Low
Low
Calin
2004
83Unclear
Unclear
High
High
Low
Low
Low
Low
vande
rHeijde20
0686
Unclear
Unclear
Unclear
Unclear
Low
Low
Low
Low
continued
DOI: 10.3310/hta20090 HEALTH TECHNOLOGY ASSESSMENT 2016 VOL. 20 NO. 9
© Queen’s Printer and Controller of HMSO 2016. This work was produced by Corbett et al. under the terms of a commissioning contract issued by the Secretary of State forHealth. This issue may be freely reproduced for the purposes of private research and study and extracts (or indeed, the full report) may be included in professional journalsprovided that suitable acknowledgement is made and the reproduction is not associated with any form of advertising. Applications for commercial reproduction should beaddressed to: NIHR Journals Library, National Institute for Health Research, Evaluation, Trials and Studies Coordinating Centre, Alpha House, University of Southampton SciencePark, Southampton SO16 7NS, UK.
21
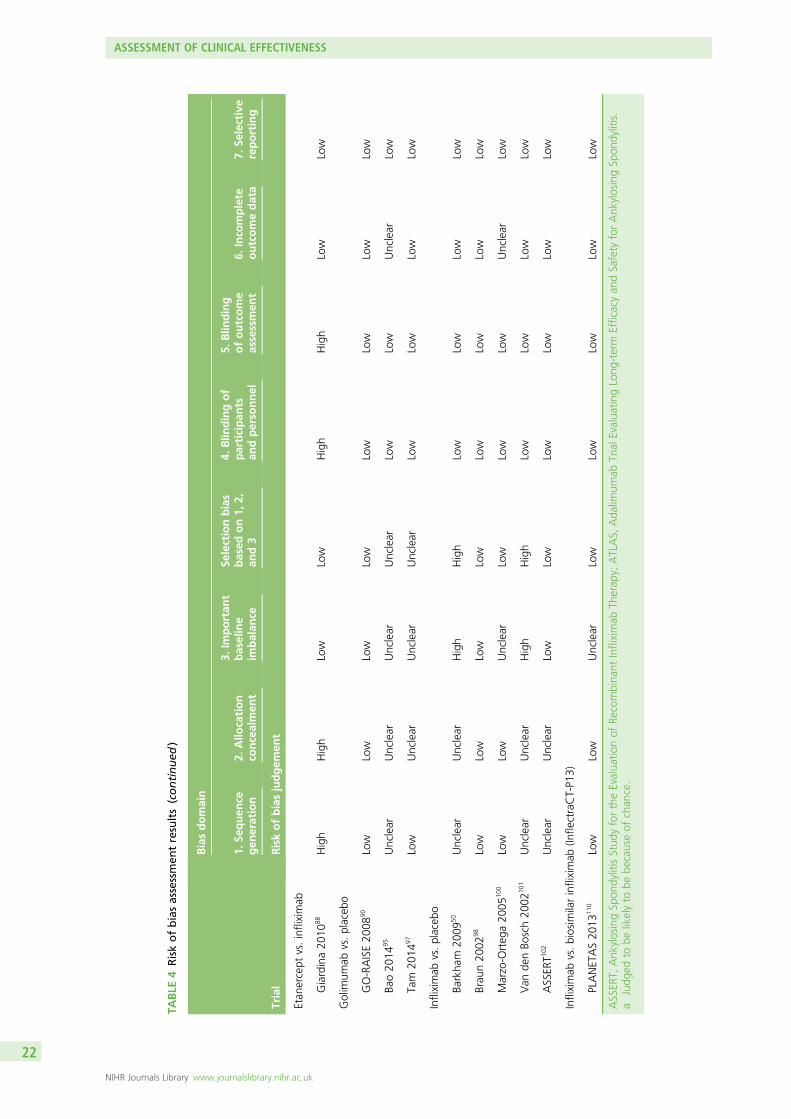
TABLE
4Riskofbiasassessmen
tresults(continued
)
Trial
Biasdomain
1.Se
quen
cegen
eration
2.Allo
cation
concealmen
t
3.Im
portan
tbaseline
imbalan
ce
Selectionbias
based
on1,
2,an
d3
4.Blin
dingof
participan
tsan
dperso
nnel
5.Blin
ding
ofoutcome
assessmen
t6.
Inco
mplete
outcomedata
7.Se
lective
reporting
Riskofbiasjudgem
ent
Etan
ercept
vs.infliximab
Giardina20
1088
High
High
Low
Low
High
High
Low
Low
Golim
umab
vs.placeb
o
GO-RAISE20
0890
Low
Low
Low
Low
Low
Low
Low
Low
Bao20
1495
Unclear
Unclear
Unclear
Unclear
Low
Low
Unclear
Low
Tam
2014
97Low
Unclear
Unclear
Unclear
Low
Low
Low
Low
Infliximab
vs.placeb
o
Barkha
m20
0950
Unclear
Unclear
High
High
Low
Low
Low
Low
Brau
n20
0298
Low
Low
Low
Low
Low
Low
Low
Low
Marzo-O
rteg
a20
0510
0Low
Low
Unclear
Low
Low
Low
Unclear
Low
Van
denBo
sch20
0210
1Unclear
Unclear
High
High
Low
Low
Low
Low
ASSER
T102
Unclear
Unclear
Low
Low
Low
Low
Low
Low
Infliximab
vs.biosim
ilarinfliximab
(Infle
ctraCT-P1
3)
PLANETAS20
1311
0Low
Low
Unclear
Low
Low
Low
Low
Low
ASSER
T,Ank
ylosingSp
ondylitisStud
yfortheEvalua
tionof
Recombina
ntInfliximab
Therap
y;ATLAS,
Ada
limum
abTrialE
valuatingLong
-term
Efficacyan
dSafety
forAnk
ylosingSp
ondylitis.
aJudg
edto
belikelyto
bebe
causeof
chan
ce.
ASSESSMENT OF CLINICAL EFFECTIVENESS
NIHR Journals Library www.journalslibrary.nihr.ac.uk
22
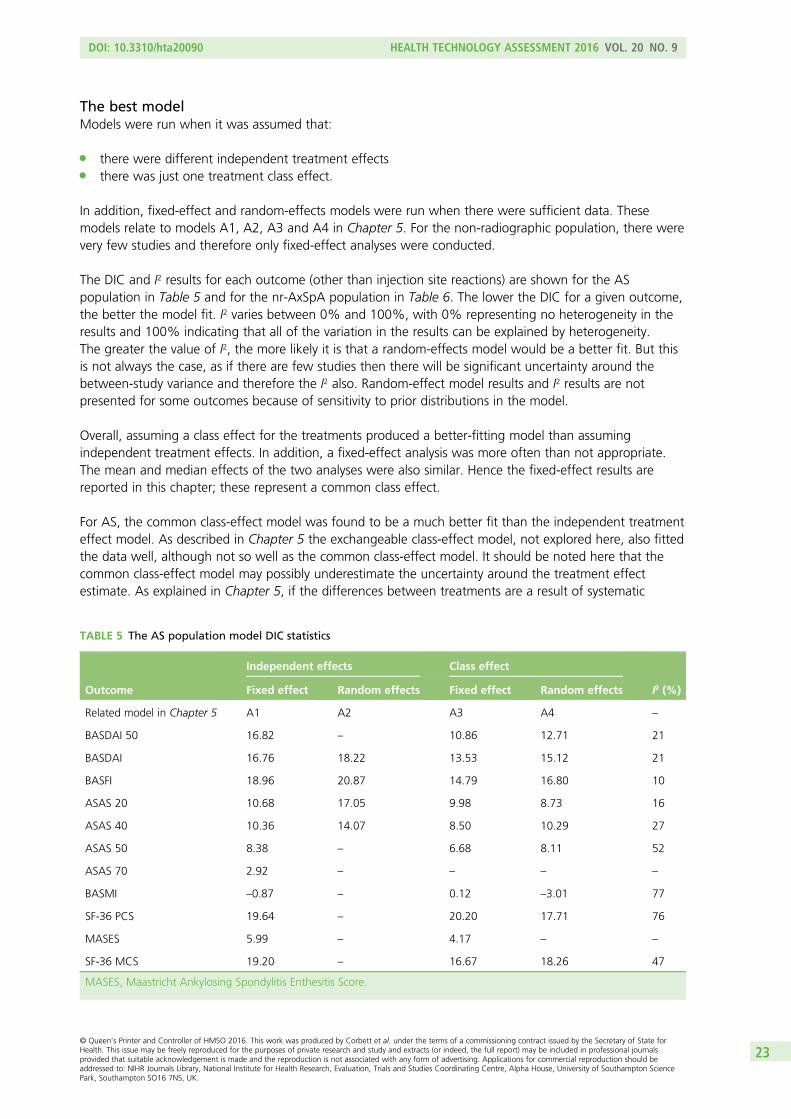
The best modelModels were run when it was assumed that:
l there were different independent treatment effectsl there was just one treatment class effect.
In addition, fixed-effect and random-effects models were run when there were sufficient data. Thesemodels relate to models A1, A2, A3 and A4 in Chapter 5. For the non-radiographic population, there werevery few studies and therefore only fixed-effect analyses were conducted.
The DIC and I2 results for each outcome (other than injection site reactions) are shown for the ASpopulation in Table 5 and for the nr-AxSpA population in Table 6. The lower the DIC for a given outcome,the better the model fit. I2 varies between 0% and 100%, with 0% representing no heterogeneity in theresults and 100% indicating that all of the variation in the results can be explained by heterogeneity.The greater the value of I2, the more likely it is that a random-effects model would be a better fit. But thisis not always the case, as if there are few studies then there will be significant uncertainty around thebetween-study variance and therefore the I2 also. Random-effect model results and I2 results are notpresented for some outcomes because of sensitivity to prior distributions in the model.
Overall, assuming a class effect for the treatments produced a better-fitting model than assumingindependent treatment effects. In addition, a fixed-effect analysis was more often than not appropriate.The mean and median effects of the two analyses were also similar. Hence the fixed-effect results arereported in this chapter; these represent a common class effect.
For AS, the common class-effect model was found to be a much better fit than the independent treatmenteffect model. As described in Chapter 5 the exchangeable class-effect model, not explored here, also fittedthe data well, although not so well as the common class-effect model. It should be noted here that thecommon class-effect model may possibly underestimate the uncertainty around the treatment effectestimate. As explained in Chapter 5, if the differences between treatments are a result of systematic
TABLE 5 The AS population model DIC statistics
Outcome
Independent effects Class effect
I2 (%)Fixed effect Random effects Fixed effect Random effects
Related model in Chapter 5 A1 A2 A3 A4 –
BASDAI 50 16.82 – 10.86 12.71 21
BASDAI 16.76 18.22 13.53 15.12 21
BASFI 18.96 20.87 14.79 16.80 10
ASAS 20 10.68 17.05 9.98 8.73 16
ASAS 40 10.36 14.07 8.50 10.29 27
ASAS 50 8.38 – 6.68 8.11 52
ASAS 70 2.92 – – – –
BASMI –0.87 – 0.12 –3.01 77
SF-36 PCS 19.64 – 20.20 17.71 76
MASES 5.99 – 4.17 – –
SF-36 MCS 19.20 – 16.67 18.26 47
MASES, Maastricht Ankylosing Spondylitis Enthesitis Score.
DOI: 10.3310/hta20090 HEALTH TECHNOLOGY ASSESSMENT 2016 VOL. 20 NO. 9
© Queen’s Printer and Controller of HMSO 2016. This work was produced by Corbett et al. under the terms of a commissioning contract issued by the Secretary of State forHealth. This issue may be freely reproduced for the purposes of private research and study and extracts (or indeed, the full report) may be included in professional journalsprovided that suitable acknowledgement is made and the reproduction is not associated with any form of advertising. Applications for commercial reproduction should beaddressed to: NIHR Journals Library, National Institute for Health Research, Evaluation, Trials and Studies Coordinating Centre, Alpha House, University of Southampton SciencePark, Southampton SO16 7NS, UK.
23
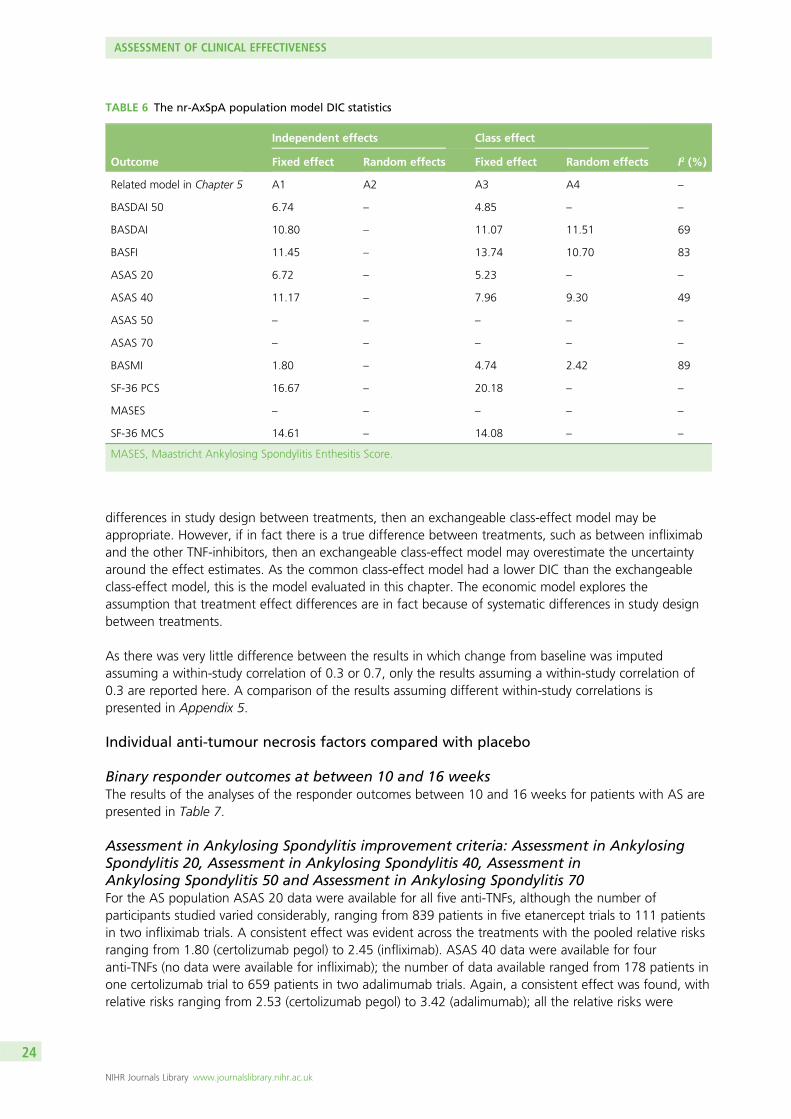
differences in study design between treatments, then an exchangeable class-effect model may beappropriate. However, if in fact there is a true difference between treatments, such as between infliximaband the other TNF-inhibitors, then an exchangeable class-effect model may overestimate the uncertaintyaround the effect estimates. As the common class-effect model had a lower DIC than the exchangeableclass-effect model, this is the model evaluated in this chapter. The economic model explores theassumption that treatment effect differences are in fact because of systematic differences in study designbetween treatments.
As there was very little difference between the results in which change from baseline was imputedassuming a within-study correlation of 0.3 or 0.7, only the results assuming a within-study correlation of0.3 are reported here. A comparison of the results assuming different within-study correlations ispresented in Appendix 5.
Individual anti-tumour necrosis factors compared with placebo
Binary responder outcomes at between 10 and 16 weeksThe results of the analyses of the responder outcomes between 10 and 16 weeks for patients with AS arepresented in Table 7.
Assessment in Ankylosing Spondylitis improvement criteria: Assessment in AnkylosingSpondylitis 20, Assessment in Ankylosing Spondylitis 40, Assessment inAnkylosing Spondylitis 50 and Assessment in Ankylosing Spondylitis 70For the AS population ASAS 20 data were available for all five anti-TNFs, although the number ofparticipants studied varied considerably, ranging from 839 patients in five etanercept trials to 111 patientsin two infliximab trials. A consistent effect was evident across the treatments with the pooled relative risksranging from 1.80 (certolizumab pegol) to 2.45 (infliximab). ASAS 40 data were available for fouranti-TNFs (no data were available for infliximab); the number of data available ranged from 178 patients inone certolizumab trial to 659 patients in two adalimumab trials. Again, a consistent effect was found, withrelative risks ranging from 2.53 (certolizumab pegol) to 3.42 (adalimumab); all the relative risks were
TABLE 6 The nr-AxSpA population model DIC statistics
Outcome
Independent effects Class effect
I2 (%)Fixed effect Random effects Fixed effect Random effects
Related model in Chapter 5 A1 A2 A3 A4 –
BASDAI 50 6.74 – 4.85 – –
BASDAI 10.80 – 11.07 11.51 69
BASFI 11.45 – 13.74 10.70 83
ASAS 20 6.72 – 5.23 – –
ASAS 40 11.17 – 7.96 9.30 49
ASAS 50 – – – – –
ASAS 70 – – – – –
BASMI 1.80 – 4.74 2.42 89
SF-36 PCS 16.67 – 20.18 – –
MASES – – – – –
SF-36 MCS 14.61 – 14.08 – –
MASES, Maastricht Ankylosing Spondylitis Enthesitis Score.
ASSESSMENT OF CLINICAL EFFECTIVENESS
NIHR Journals Library www.journalslibrary.nihr.ac.uk
24
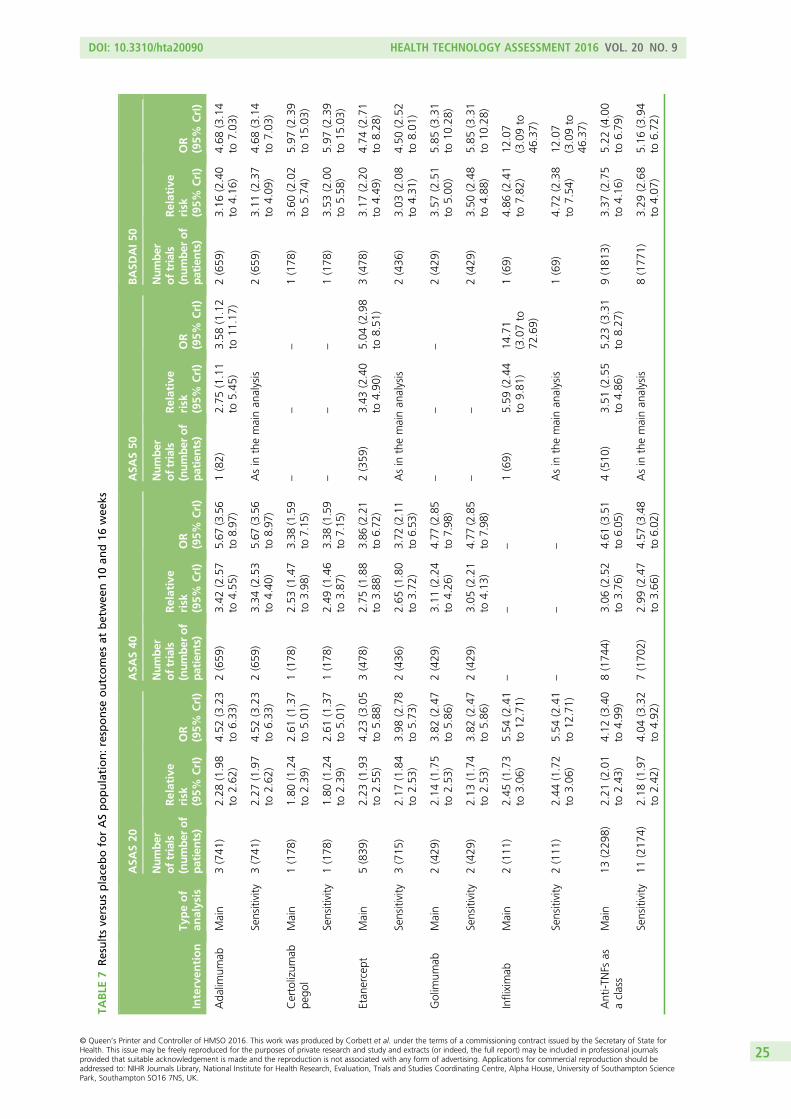
TABLE
7Resultsve
rsusplaceboforASpopulation:response
outcomes
atbetwee
n10
and16
wee
ks
Interven
tion
Typeof
analysis
ASA
S20
ASA
S40
ASA
S50
BASD
AI5
0
Number
oftrials
(number
of
patients)
Relative
risk
(95%
CrI)
OR
(95%
CrI)
Number
oftrials
(number
of
patients)
Relative
risk
(95%
CrI)
OR
(95%
CrI)
Number
oftrials
(number
of
patients)
Relative
risk
(95%
CrI)
OR
(95%
CrI)
Number
oftrials
(number
of
patients)
Relative
risk
(95%
CrI)
OR
(95%
CrI)
Ada
limum
abMain
3(741
)2.28
(1.98
to2.62
)4.52
(3.23
to6.33
)2(659
)3.42
(2.57
to4.55
)5.67
(3.56
to8.97
)1(82)
2.75
(1.11
to5.45
)3.58
(1.12
to11
.17)
2(659
)3.16
(2.40
to4.16
)4.68
(3.14
to7.03
)
Sensitivity
3(741
)2.27
(1.97
to2.62
)4.52
(3.23
to6.33
)2(659
)3.34
(2.53
to4.40
)5.67
(3.56
to8.97
)Asin
themainan
alysis
2(659
)3.11
(2.37
to4.09
)4.68
(3.14
to7.03
)
Certolizum
abpe
gol
Main
1(178
)1.80
(1.24
to2.39
)2.61
(1.37
to5.01
)1(178
)2.53
(1.47
to3.98
)3.38
(1.59
to7.15
)–
––
1(178
)3.60
(2.02
to5.74
)5.97
(2.39
to15
.03)
Sensitivity
1(178
)1.80
(1.24
to2.39
)2.61
(1.37
to5.01
)1(178
)2.49
(1.46
to3.87
)3.38
(1.59
to7.15
)–
––
1(178
)3.53
(2.00
to5.58
)5.97
(2.39
to15
.03)
Etan
ercept
Main
5(839
)2.23
(1.93
to2.55
)4.23
(3.05
to5.88
)3(478
)2.75
(1.88
to3.88
)3.86
(2.21
to6.72
)2(359
)3.43
(2.40
to4.90
)5.04
(2.98
to8.51
)3(478
)3.17
(2.20
to4.49
)4.74
(2.71
to8.28
)
Sensitivity
3(715
)2.17
(1.84
to2.53
)3.98
(2.78
to5.73
)2(436
)2.65
(1.80
to3.72
)3.72
(2.11
to6.53
)Asin
themainan
alysis
2(436
)3.03
(2.08
to4.31
)4.50
(2.52
to8.01
)
Golim
umab
Main
2(429
)2.14
(1.75
to2.53
)3.82
(2.47
to5.86
)2(429
)3.11
(2.24
to4.26
)4.77
(2.85
to7.98
)–
––
2(429
)3.57
(2.51
to5.00
)5.85
(3.31
to10
.28)
Sensitivity
2(429
)2.13
(1.74
to2.53
)3.82
(2.47
to5.86
)2(429
)3.05
(2.21
to4.13
)4.77
(2.85
to7.98
)–
–2(429
)3.50
(2.48
to4.88
)5.85
(3.31
to10
.28)
Infliximab
Main
2(111
)2.45
(1.73
to3.06
)5.54
(2.41
to12
.71)
––
–1(69)
5.59
(2.44
to9.81
)14
.71
(3.07to
72.69)
1(69)
4.86
(2.41
to7.82
)12
.07
(3.09to
46.37)
Sensitivity
2(111
)2.44
(1.72
to3.06
)5.54
(2.41
to12
.71)
––
–Asin
themainan
alysis
1(69)
4.72
(2.38
to7.54
)12
.07
(3.09to
46.37)
Anti-T
NFs
asaclass
Main
13(229
8)2.21
(2.01
to2.43
)4.12
(3.40
to4.99
)8(174
4)3.06
(2.52
to3.76
)4.61
(3.51
to6.05
)4(510
)3.51
(2.55
to4.86
)5.23
(3.31
to8.27
)9(181
3)3.37
(2.75
to4.16
)5.22
(4.00
to6.79
)
Sensitivity
11(217
4)2.18
(1.97
to2.42
)4.04
(3.32
to4.92
)7(170
2)2.99
(2.47
to3.66
)4.57
(3.48
to6.02
)Asin
themainan
alysis
8(177
1)3.29
(2.68
to4.07
)5.16
(3.94
to6.72
)
DOI: 10.3310/hta20090 HEALTH TECHNOLOGY ASSESSMENT 2016 VOL. 20 NO. 9
© Queen’s Printer and Controller of HMSO 2016. This work was produced by Corbett et al. under the terms of a commissioning contract issued by the Secretary of State forHealth. This issue may be freely reproduced for the purposes of private research and study and extracts (or indeed, the full report) may be included in professional journalsprovided that suitable acknowledgement is made and the reproduction is not associated with any form of advertising. Applications for commercial reproduction should beaddressed to: NIHR Journals Library, National Institute for Health Research, Evaluation, Trials and Studies Coordinating Centre, Alpha House, University of Southampton SciencePark, Southampton SO16 7NS, UK.
25
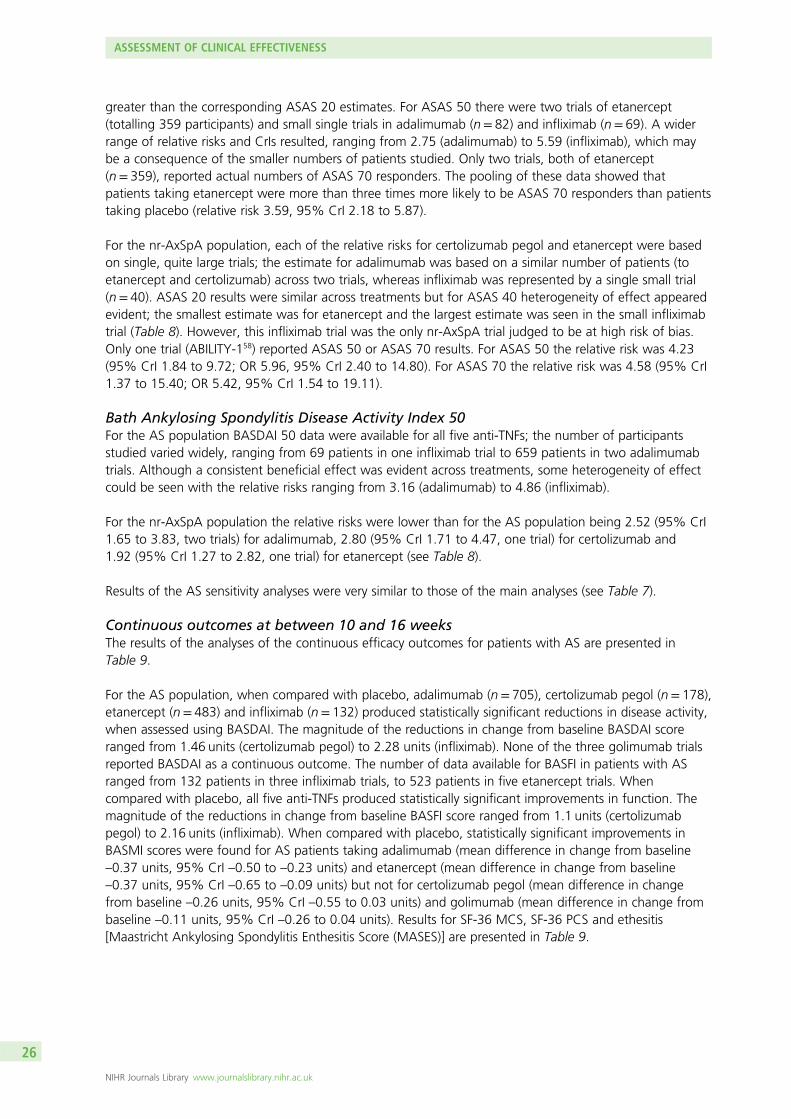
greater than the corresponding ASAS 20 estimates. For ASAS 50 there were two trials of etanercept(totalling 359 participants) and small single trials in adalimumab (n= 82) and infliximab (n= 69). A widerrange of relative risks and CrIs resulted, ranging from 2.75 (adalimumab) to 5.59 (infliximab), which maybe a consequence of the smaller numbers of patients studied. Only two trials, both of etanercept(n= 359), reported actual numbers of ASAS 70 responders. The pooling of these data showed thatpatients taking etanercept were more than three times more likely to be ASAS 70 responders than patientstaking placebo (relative risk 3.59, 95% CrI 2.18 to 5.87).
For the nr-AxSpA population, each of the relative risks for certolizumab pegol and etanercept were basedon single, quite large trials; the estimate for adalimumab was based on a similar number of patients (toetanercept and certolizumab) across two trials, whereas infliximab was represented by a single small trial(n= 40). ASAS 20 results were similar across treatments but for ASAS 40 heterogeneity of effect appearedevident; the smallest estimate was for etanercept and the largest estimate was seen in the small infliximabtrial (Table 8). However, this infliximab trial was the only nr-AxSpA trial judged to be at high risk of bias.Only one trial (ABILITY-158) reported ASAS 50 or ASAS 70 results. For ASAS 50 the relative risk was 4.23(95% CrI 1.84 to 9.72; OR 5.96, 95% CrI 2.40 to 14.80). For ASAS 70 the relative risk was 4.58 (95% CrI1.37 to 15.40; OR 5.42, 95% CrI 1.54 to 19.11).
Bath Ankylosing Spondylitis Disease Activity Index 50For the AS population BASDAI 50 data were available for all five anti-TNFs; the number of participantsstudied varied widely, ranging from 69 patients in one infliximab trial to 659 patients in two adalimumabtrials. Although a consistent beneficial effect was evident across treatments, some heterogeneity of effectcould be seen with the relative risks ranging from 3.16 (adalimumab) to 4.86 (infliximab).
For the nr-AxSpA population the relative risks were lower than for the AS population being 2.52 (95% CrI1.65 to 3.83, two trials) for adalimumab, 2.80 (95% CrI 1.71 to 4.47, one trial) for certolizumab and1.92 (95% CrI 1.27 to 2.82, one trial) for etanercept (see Table 8).
Results of the AS sensitivity analyses were very similar to those of the main analyses (see Table 7).
Continuous outcomes at between 10 and 16 weeksThe results of the analyses of the continuous efficacy outcomes for patients with AS are presented inTable 9.
For the AS population, when compared with placebo, adalimumab (n= 705), certolizumab pegol (n= 178),etanercept (n= 483) and infliximab (n= 132) produced statistically significant reductions in disease activity,when assessed using BASDAI. The magnitude of the reductions in change from baseline BASDAI scoreranged from 1.46 units (certolizumab pegol) to 2.28 units (infliximab). None of the three golimumab trialsreported BASDAI as a continuous outcome. The number of data available for BASFI in patients with ASranged from 132 patients in three infliximab trials, to 523 patients in five etanercept trials. Whencompared with placebo, all five anti-TNFs produced statistically significant improvements in function. Themagnitude of the reductions in change from baseline BASFI score ranged from 1.1 units (certolizumabpegol) to 2.16 units (infliximab). When compared with placebo, statistically significant improvements inBASMI scores were found for AS patients taking adalimumab (mean difference in change from baseline–0.37 units, 95% CrI –0.50 to –0.23 units) and etanercept (mean difference in change from baseline–0.37 units, 95% CrI –0.65 to –0.09 units) but not for certolizumab pegol (mean difference in changefrom baseline –0.26 units, 95% CrI –0.55 to 0.03 units) and golimumab (mean difference in change frombaseline –0.11 units, 95% CrI –0.26 to 0.04 units). Results for SF-36 MCS, SF-36 PCS and ethesitis[Maastricht Ankylosing Spondylitis Enthesitis Score (MASES)] are presented in Table 9.
ASSESSMENT OF CLINICAL EFFECTIVENESS
NIHR Journals Library www.journalslibrary.nihr.ac.uk
26
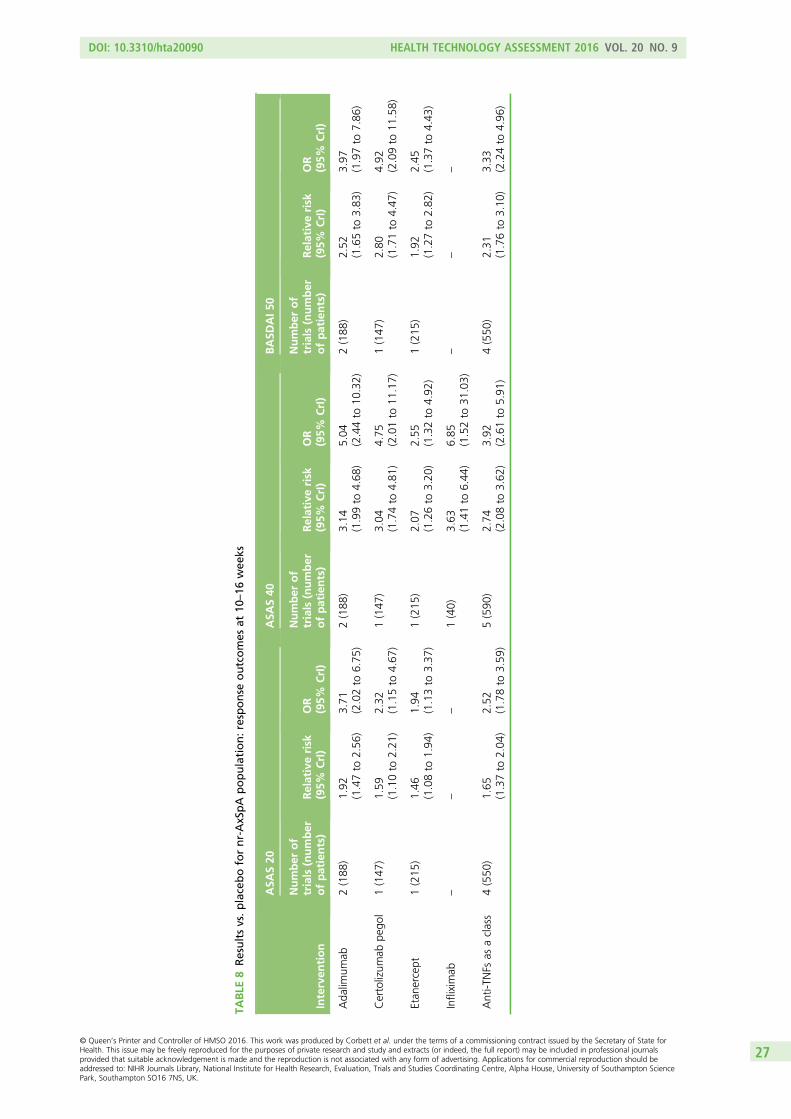
TABLE
8Resultsvs.placebofornr-AxSpA
population:response
outcomes
at10
–16
wee
ks
Interven
tion
ASA
S20
ASA
S40
BASD
AI50
Number
of
trials
(number
ofpatients)
Relativerisk
(95%
CrI)
OR
(95%
CrI)
Number
of
trials
(number
ofpatients)
Relativerisk
(95%
CrI)
OR
(95%
CrI)
Number
of
trials
(number
ofpatients)
Relativerisk
(95%
CrI)
OR
(95%
CrI)
Ada
limum
ab2(188
)1.92
(1.47to
2.56
)3.71
(2.02to
6.75
)2(188
)3.14
(1.99to
4.68
)5.04
(2.44to
10.32)
2(188
)2.52
(1.65to
3.83
)3.97
(1.97to
7.86
)
Certolizum
abpe
gol
1(147
)1.59
(1.10to
2.21
)2.32
(1.15to
4.67
)1(147
)3.04
(1.74to
4.81
)4.75
(2.01to
11.17)
1(147
)2.80
(1.71to
4.47
)4.92
(2.09to
11.58)
Etan
ercept
1(215
)1.46
(1.08to
1.94
)1.94
(1.13to
3.37
)1(215
)2.07
(1.26to
3.20
)2.55
(1.32to
4.92
)1(215
)1.92
(1.27to
2.82
)2.45
(1.37to
4.43
)
Infliximab
––
–1(40)
3.63
(1.41to
6.44
)6.85
(1.52to
31.03)
––
–
Anti-T
NFs
asaclass
4(550
)1.65
(1.37to
2.04
)2.52
(1.78to
3.59
)5(590
)2.74
(2.08to
3.62
)3.92
(2.61to
5.91
)4(550
)2.31
(1.76to
3.10
)3.33
(2.24to
4.96
)
DOI: 10.3310/hta20090 HEALTH TECHNOLOGY ASSESSMENT 2016 VOL. 20 NO. 9
© Queen’s Printer and Controller of HMSO 2016. This work was produced by Corbett et al. under the terms of a commissioning contract issued by the Secretary of State forHealth. This issue may be freely reproduced for the purposes of private research and study and extracts (or indeed, the full report) may be included in professional journalsprovided that suitable acknowledgement is made and the reproduction is not associated with any form of advertising. Applications for commercial reproduction should beaddressed to: NIHR Journals Library, National Institute for Health Research, Evaluation, Trials and Studies Coordinating Centre, Alpha House, University of Southampton SciencePark, Southampton SO16 7NS, UK.
27
TABLE 9 Results vs. placebo for AS population: continuous outcomes at 10–16 weeks
InterventionType ofanalysis
BASDAI score BASFI score
Number of trials(number of patients)
Mean differencein change frombaseline (95% CrI)
Number of trials(number of patients)
Mean differencein change frombaseline (95% CrI)
Adalimumab Main 3 (705) –1.55 (–1.88to –1.22)
2 (390) –1.25 (–1.63to –0.87)
Sensitivity 2 (659) –1.55 (–1.89to –1.21)
1 (344) –1.28 (–1.68to –0.88)
Certolizumabpegol
Main 1 (178) –1.46 (–2.17to –0.74)
1 (178) –1.10 (–1.83to –0.37)
Sensitivity Same as the main analysis Same as the main analysis
Etanercept Main 4 (483) –1.75 (–2.14to –1.37)
5 (523) –1.43 (–1.82to –1.04)
Sensitivity 2 (359) –1.72 (–2.16to –1.29)
2 (359) –1.29 (–1.76to –0.84)
Golimumab Main – – 2 (429) –1.45 (–1.84to –1.05)
Sensitivity – – Same as the main analysis
Infliximab Main 3 (132) –2.28 (–3.18to –1.38)
3 (132) –2.16 (–3.18to –1.12)
Sensitivity 2 (111) –2.18 (–3.14to –1.21)
2 (111) –1.94 (–3.07to –0.80)
Anti-TNFs asa class
Main 11 (1498) –1.66 (–1.88to –1.43)
13 (1652) –1.38 (–1.59to –1.18)
Sensitivity 7 (1305) –1.63 (–1.88to –1.39)
8 (1419) –1.34 (–1.57to –1.12)
MASES, Maastricht Ankylosing Spondylitis Enthesitis Score.
ASSESSMENT OF CLINICAL EFFECTIVENESS
NIHR Journals Library www.journalslibrary.nihr.ac.uk
28
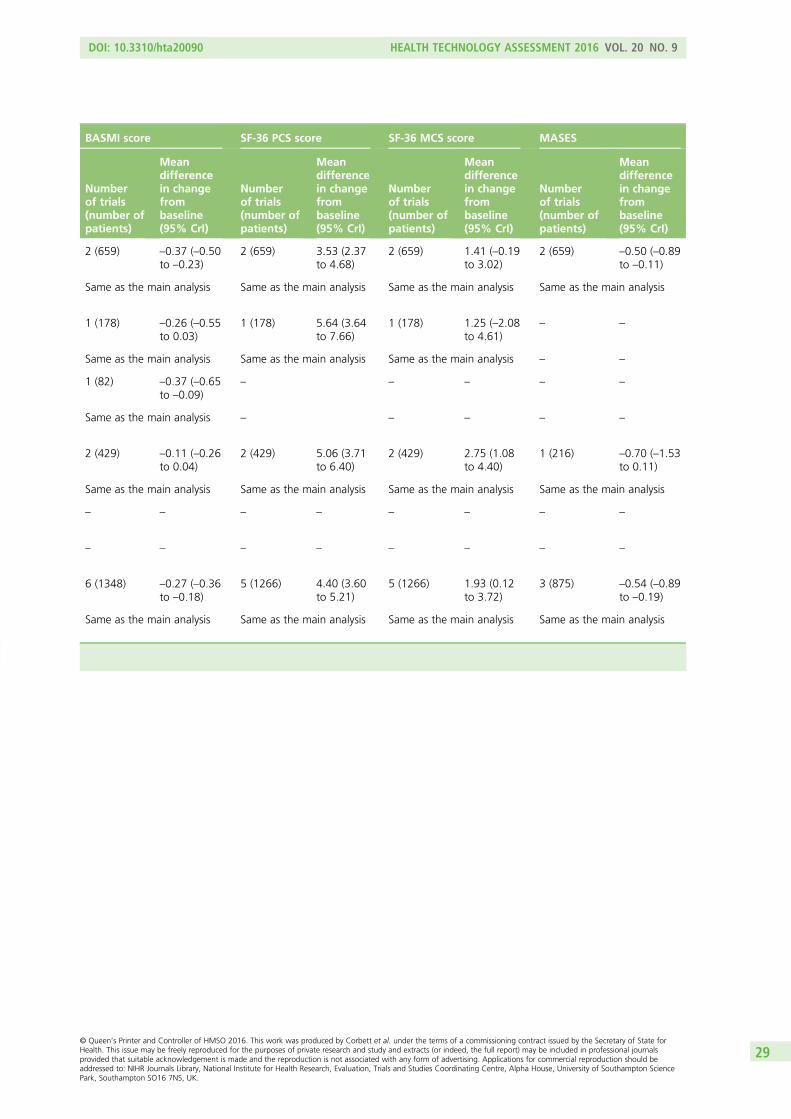
BASMI score SF-36 PCS score SF-36 MCS score MASES
Numberof trials(number ofpatients)
Meandifferencein changefrombaseline(95% CrI)
Numberof trials(number ofpatients)
Meandifferencein changefrombaseline(95% CrI)
Numberof trials(number ofpatients)
Meandifferencein changefrombaseline(95% CrI)
Numberof trials(number ofpatients)
Meandifferencein changefrombaseline(95% CrI)
2 (659) –0.37 (–0.50to –0.23)
2 (659) 3.53 (2.37to 4.68)
2 (659) 1.41 (–0.19to 3.02)
2 (659) –0.50 (–0.89to –0.11)
Same as the main analysis Same as the main analysis Same as the main analysis Same as the main analysis
1 (178) –0.26 (–0.55to 0.03)
1 (178) 5.64 (3.64to 7.66)
1 (178) 1.25 (–2.08to 4.61)
– –
Same as the main analysis Same as the main analysis Same as the main analysis – –
1 (82) –0.37 (–0.65to –0.09)
– – – – –
Same as the main analysis – – – – –
2 (429) –0.11 (–0.26to 0.04)
2 (429) 5.06 (3.71to 6.40)
2 (429) 2.75 (1.08to 4.40)
1 (216) –0.70 (–1.53to 0.11)
Same as the main analysis Same as the main analysis Same as the main analysis Same as the main analysis
– – – – – – – –
– – – – – – – –
6 (1348) –0.27 (–0.36to –0.18)
5 (1266) 4.40 (3.60to 5.21)
5 (1266) 1.93 (0.12to 3.72)
3 (875) –0.54 (–0.89to –0.19)
Same as the main analysis Same as the main analysis Same as the main analysis Same as the main analysis
DOI: 10.3310/hta20090 HEALTH TECHNOLOGY ASSESSMENT 2016 VOL. 20 NO. 9
© Queen’s Printer and Controller of HMSO 2016. This work was produced by Corbett et al. under the terms of a commissioning contract issued by the Secretary of State forHealth. This issue may be freely reproduced for the purposes of private research and study and extracts (or indeed, the full report) may be included in professional journalsprovided that suitable acknowledgement is made and the reproduction is not associated with any form of advertising. Applications for commercial reproduction should beaddressed to: NIHR Journals Library, National Institute for Health Research, Evaluation, Trials and Studies Coordinating Centre, Alpha House, University of Southampton SciencePark, Southampton SO16 7NS, UK.
29
For the nr-AxSpA population, a heterogeneity of effect on BASDAI and BASFI appears evident from therelative risks of the individual anti-TNFs. The smallest estimates were for etanercept and the largestestimates were seen in the small infliximab trial, although this trial was the only nr-AxSpA trial judged tobe at high risk of bias (Table 10).
Results of the AS sensitivity analyses were very similar to those of the main analyses (see Table 9).
When the mean baseline BASDAI and BASFI are presented by treatment response at week 12 (or 14 forgolimumab) for three of the five anti-TNFs (see Appendix 6), it can be seen that in patients with AS andpatients with nr-AxSpA, on average baseline BASDAI does not differ greatly between responders andnon-responders to either placebo or active anti-TNF therapy. In patients with AS or nr-AxSpA from thetrials of adalimumab [ATLAS (Adalimumab Trial Evaluating Long-term Efficacy and Safety for AnkylosingSpondylitis)61 and ABILITY-158] and golimumab (GO-RAISE90) on average baseline BASFI was higher innon-responders compared with responders. However, this was not seen in the etanercept trials.
Individual anti-tumour necrosis factors compared with each otherFor efficacy outcomes, all of the comparisons that could be made between different anti-TNFs at 10–16 weeksresulted in no statistically significant differences between treatments. For the full results see Appendix 7.
One small trial, which could not be included in the meta-analysis (see Study characteristics), comparedinfliximab with etanercept in a 2-year unblinded randomised study of 50 AS patients.88 At 12 weeks therewere statistically significant differences between groups in terms of BASDAI score (3.5 vs. 5.6; p< 0.005)and BASFI score (3.5 vs. 5; p< 0.005), favouring treatment with infliximab. By week 48, the BASDAI andBASFI scores were almost identical across the treatment groups (data were only presented graphically).In addition, at 12 weeks 19 of 25 infliximab patients were ASAS 20 responders compared with 15 of25 etanercept patients (not a statistically significant difference). This study concluded that infliximabproduces a more rapid clinical improvement, but, at the end of the study, treatment with both etanerceptand infliximab was effective and safe. The results of this trial may explain why at 10–16 weeks themeta-analysis results for infliximab were a little better than those of the other anti-TNFs.
Another trial which could not be included in the meta-analysis compared infliximab with an infliximabbiosimilar called CT-P13 in 250 AS patients.110 The ASAS 40 response rates at week 14 were 42% forCT-P13 and 46% for infliximab [OR 0.85; 95% confidence interval (CI) 0.51 to 1.42] and at week 30 theywere 52% for CT-P13 and 47% for infliximab (OR 1.19, 95% CI 0.70 to 2.00). At week 14 BASDAImedian change from baseline scores were identical (–2.7) and at week 30 they differed slightly (–3.1CT-P13 vs. –2.5 infliximab). For BASFI the median change from baseline scores were –2.2 CT-P13 versus–2.4 infliximab at week 14 and –2.6 CT-P13 versus –2.2 infliximab at week 30. The study concluded thatCT-P13 had a comparable efficacy and safety profile with that of infliximab.
Anti-tumour necrosis factors as a class compared with placeboWithin this section the class effect, calculated as a common effect across all the TNF-inhibitors underconsideration, assumes a single treatment effect for all the TNF-inhibitors. It is calculated as the pooledtreatment effect using a fixed effect model. The common class-effect model may possibly underestimatethe uncertainty around the treatment effect estimate. As explained in Chapter 5, if the differencesbetween treatments is a result of systematic differences in study design between treatments then anexchangeable class-effect model may be appropriate. However, if in fact there is a true difference betweentreatments, such as between infliximab and the other TNF-inhibitors, then an exchangeable class-effectmodel may overestimate the uncertainty around the mean class-effect estimates. As the commonclass-effect model had a lower DIC than the exchangeable class-effect model, this is the model evaluatedin this chapter. The economic model in Chapter 6 explores the assumption that treatment effectdifferences are because of differences in study design between treatments.
ASSESSMENT OF CLINICAL EFFECTIVENESS
NIHR Journals Library www.journalslibrary.nihr.ac.uk
30
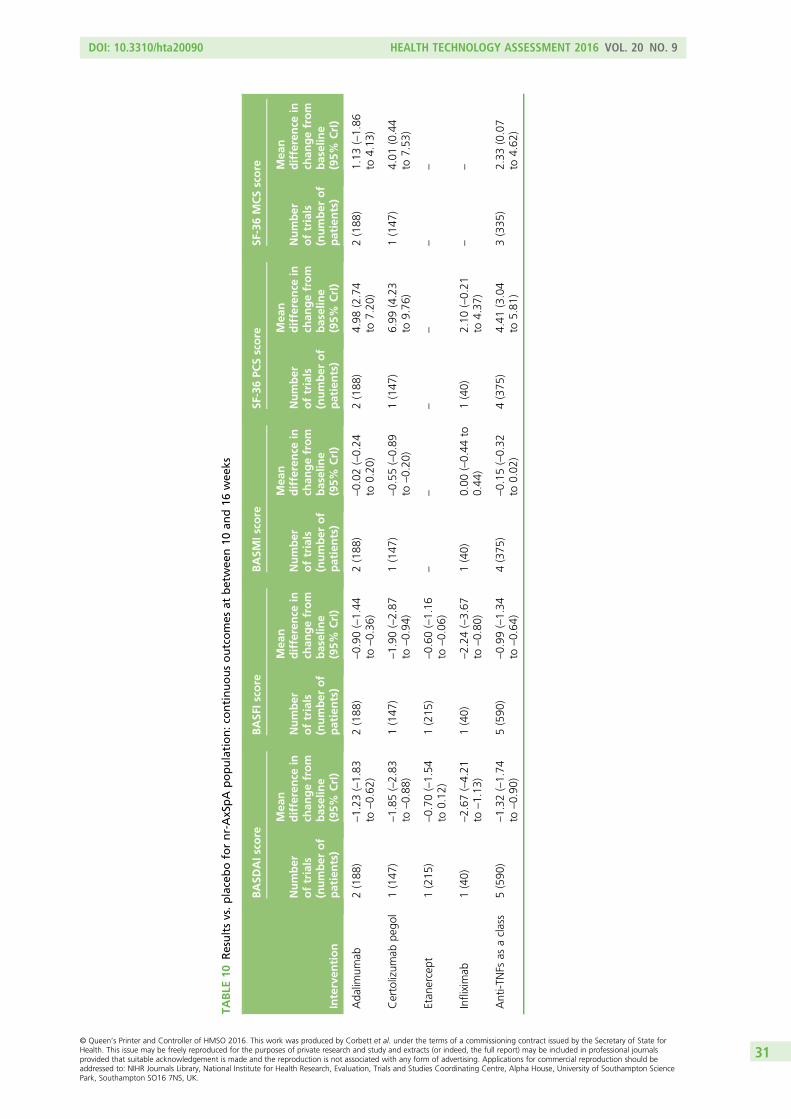
TABLE
10Resultsvs.placebofornr-AxSpA
population:co
ntinuousoutcomes
atbetwee
n10
and16
wee
ks
Interven
tion
BASD
AIs
core
BASF
Iscore
BASM
Iscore
SF-36PC
Sscore
SF-36MCSscore
Number
oftrials
(number
of
patients)
Mea
ndifference
inch
angefrom
baseline
(95%
CrI)
Number
oftrials
(number
of
patients)
Mea
ndifference
inch
angefrom
baseline
(95%
CrI)
Number
oftrials
(number
of
patients)
Mea
ndifference
inch
angefrom
baseline
(95%
CrI)
Number
oftrials
(number
of
patients)
Mea
ndifference
inch
angefrom
baseline
(95%
CrI)
Number
oftrials
(number
of
patients)
Mea
ndifference
inch
angefrom
baseline
(95%
CrI)
Ada
limum
ab2(188
)–1.23
(–1.83
to–0.62
)2(188
)–0.90
(–1.44
to–0.36
)2(188
)–0.02
(–0.24
to0.20
)2(188
)4.98
(2.74
to7.20
)2(188
)1.13
(–1.86
to4.13
)
Certolizum
abpe
gol
1(147
)–1.85
(–2.83
to–0.88
)1(147
)–1.90
(–2.87
to–0.94
)1(147
)–0.55
(–0.89
to–0.20
)1(147
)6.99
(4.23
to9.76
)1(147
)4.01
(0.44
to7.53
)
Etan
ercept
1(215
)–0.70
(–1.54
to0.12
)1(215
)–0.60
(–1.16
to–0.06
)–
––
––
–
Infliximab
1(40)
–2.67
(–4.21
to–1.13
)1(40)
–2.24
(–3.67
to–0.80
)1(40)
0.00
(–0.44
to0.44
)1(40)
2.10
(–0.21
to4.37
)–
–
Anti-T
NFs
asaclass
5(590
)–1.32
(–1.74
to–0.90
)5(590
)–0.99
(–1.34
to–0.64
)4(375
)–0.15
(–0.32
to0.02
)4(375
)4.41
(3.04
to5.81
)3(335
)2.33
(0.07
to4.62
)
DOI: 10.3310/hta20090 HEALTH TECHNOLOGY ASSESSMENT 2016 VOL. 20 NO. 9
© Queen’s Printer and Controller of HMSO 2016. This work was produced by Corbett et al. under the terms of a commissioning contract issued by the Secretary of State forHealth. This issue may be freely reproduced for the purposes of private research and study and extracts (or indeed, the full report) may be included in professional journalsprovided that suitable acknowledgement is made and the reproduction is not associated with any form of advertising. Applications for commercial reproduction should beaddressed to: NIHR Journals Library, National Institute for Health Research, Evaluation, Trials and Studies Coordinating Centre, Alpha House, University of Southampton SciencePark, Southampton SO16 7NS, UK.
31
Binary responder outcomes at between 10 and 16 weeks
Assessment in Ankylosing Spondylitis improvement criteria – ASAS 20, ASAS 40, ASAS 50 andASAS 70 When compared with placebo, anti-TNFs as a common class were more than twice as likely toresult in patients with AS achieving an ASAS 20 response (relative risk 2.21, 95% CrI 2.01 to 2.43;13 trials, see Table 7). Anti-TNFs were also around three times as likely to result in patients achieving anASAS 40 response (relative risk 3.06, 95% CrI 2.52 to 3.76; eight trials) and three and a half times as likelyto result in patients achieving an ASAS 50 response (relative risk 3.51, 95% CrI 2.55 to 4.86; four trials).Only two trials, both of etanercept, reported data suitable for the ASAS 70 analysis; the results arepresented in Individual anti-TNFs compared with placebo. There was little evidence of heterogeneity forASAS 20 (I2= 16%) and ASAS 40 (I2= 27%) but heterogeneity was evident for ASAS 50 (I2= 52%).For ASAS 50, three of the four trials were small (i.e. fewer than 100 participants), which may partly explainthe heterogeneity estimate.
For the nr-AxSpA population anti-TNFs as a common class were statistically significantly more effectivethan placebo, although the relative risks being lower than for the AS population. For ASAS 20 the relativerisk was 1.65 (95% CrI 1.37 to 2.04; four trials) and for ASAS 40 the relative risk was 2.74 (95% CrI 2.08to 3.62; five trials). Only one trial presented ASAS 50 and ASAS 70 results (see Clinical effectiveness results:efficacy results from randomised controlled trials). A heterogeneity estimate could be calculated for onlyASAS 40 (I2= 49%).
BASDAI 50 Anti-TNFs as a common class resulted in patients with AS being more than three times morelikely to achieve a BASDAI 50 response than patients taking placebo (relative risk 3.37, 95% CrI 2.75 to4.16; nine trials). There was little evidence of heterogeneity (I2= 21%).
For the nr-AxSpA population, anti-TNFs as a common class were also statistically significantly moreeffective than placebo in terms of achieving a BASDAI 50, although the relative risk was lower than for theAS population (relative risk 2.31, 95% CrI 1.76 to 3.10; four trials). Results of the AS sensitivity analyseswere very similar to the main analyses (see Table 7).
Binary responder outcomes at between 24 and 30 weeksFour AS trials reported outcomes at between 24 and 30 weeks (see Table 2). Anti-TNFs as a common classwere statistically significantly more effective than placebo at 24–30 weeks; for ASAS 20 the relative riskwas 1.69 (95% CrI 1.30 to 2.14; four trials). No studies reported BASDAI 50 or ASAS 70 results, and onlysingle studies reported on ASAS 40 (relative risk 4.01, 95% CrI 2.13 to 7.55)102 and ASAS 50 (relative risk4.17, 95% CrI 2.45 to 7.12).72
Continuous outcomes at between 10 and 16 weeksWhen considered together as a group compared with placebo (see Table 9), treatment with an anti-TNF inpatients with AS produced statistically significant improvements (calculated using mean difference inchange from baseline) in the following areas: disease activity (BASDAI mean difference –1.66 units,95% CrI –1.88 to –1.43 units; 11 trials); function (BASFI mean difference –1.38 units, 95% CrI –1.59 to–1.18 units; 13 trials); spinal mobility (BASMI mean difference –0.27 units, 95% CrI –0.36 to –0.18 units);physical health (SF-36 PCS mean difference 4.40 units, 95% CrI 3.60 to 5.21 units; five trials); mentalhealth (SF-36 MCS mean difference 1.96 units, 95% CrI 0.87 to 3.05 units; five trials); and enthesitis(MASES mean difference –0.54 units, 95% CrI –0.89 to –0.19 units; three trials). There was little evidenceof heterogeneity for BASDAI (I2= 21%) and BASFI (I2= 10%), but evidence of substantial heterogeneity forBASMI (I2= 77%), SF-36 PCS (I2= 76%), SF-36 MCS (I2= 47%) and MASES (I2= 91%).
In the nr-AxSpA population the mean differences achieved with anti-TNFs (see Table 10) were alsostatistically significant, although slightly lower than for the AS population. For BASDAI the mean differencewas –1.32 units (95% CrI –1.74 to –0.90; I2= 69%) and for BASFI the mean difference was –0.99 units(95% CrI –1.34 to –0.64 units; I2= 83%) but there was evidence of substantial heterogeneity. The resultsfor SF-36 MCS and SF-36 PCS were similar to those for AS (see Table 10).
ASSESSMENT OF CLINICAL EFFECTIVENESS
NIHR Journals Library www.journalslibrary.nihr.ac.uk
32
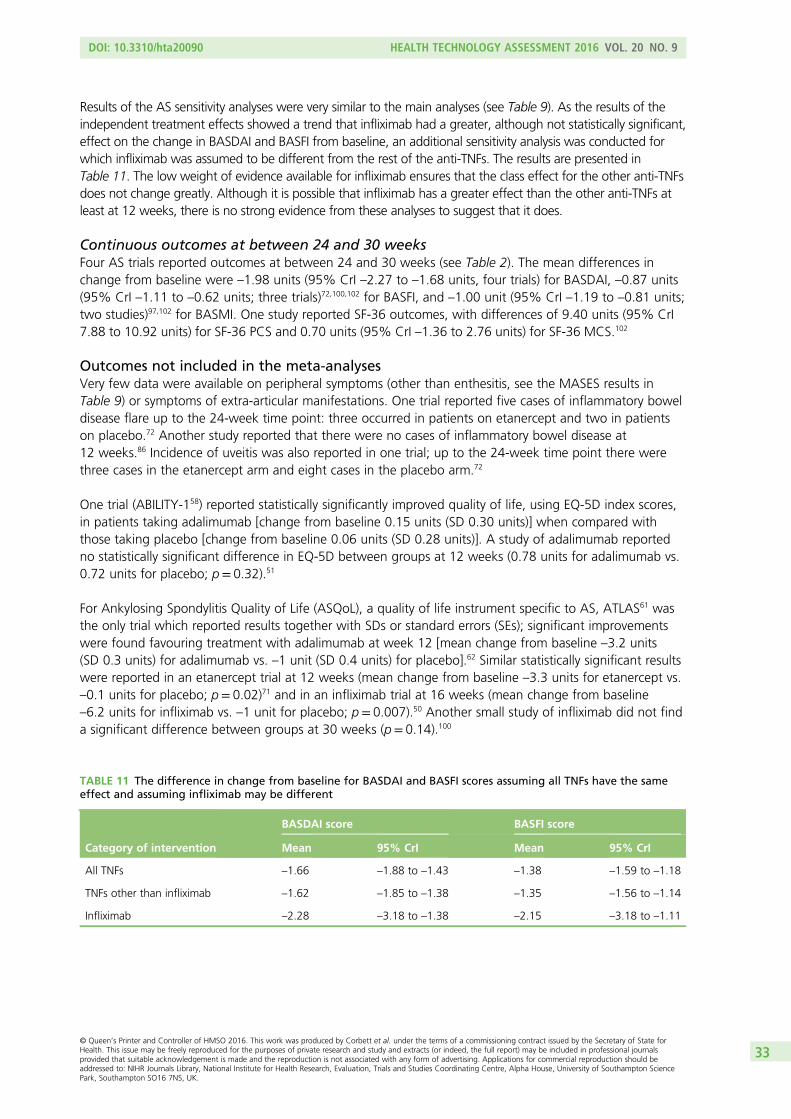
Results of the AS sensitivity analyses were very similar to the main analyses (see Table 9). As the results of theindependent treatment effects showed a trend that infliximab had a greater, although not statistically significant,effect on the change in BASDAI and BASFI from baseline, an additional sensitivity analysis was conducted forwhich infliximab was assumed to be different from the rest of the anti-TNFs. The results are presented inTable 11. The low weight of evidence available for infliximab ensures that the class effect for the other anti-TNFsdoes not change greatly. Although it is possible that infliximab has a greater effect than the other anti-TNFs atleast at 12 weeks, there is no strong evidence from these analyses to suggest that it does.
Continuous outcomes at between 24 and 30 weeksFour AS trials reported outcomes at between 24 and 30 weeks (see Table 2). The mean differences inchange from baseline were –1.98 units (95% CrI –2.27 to –1.68 units, four trials) for BASDAI, –0.87 units(95% CrI –1.11 to –0.62 units; three trials)72,100,102 for BASFI, and –1.00 unit (95% CrI –1.19 to –0.81 units;two studies)97,102 for BASMI. One study reported SF-36 outcomes, with differences of 9.40 units (95% CrI7.88 to 10.92 units) for SF-36 PCS and 0.70 units (95% CrI –1.36 to 2.76 units) for SF-36 MCS.102
Outcomes not included in the meta-analysesVery few data were available on peripheral symptoms (other than enthesitis, see the MASES results inTable 9) or symptoms of extra-articular manifestations. One trial reported five cases of inflammatory boweldisease flare up to the 24-week time point: three occurred in patients on etanercept and two in patientson placebo.72 Another study reported that there were no cases of inflammatory bowel disease at12 weeks.86 Incidence of uveitis was also reported in one trial; up to the 24-week time point there werethree cases in the etanercept arm and eight cases in the placebo arm.72
One trial (ABILITY-158) reported statistically significantly improved quality of life, using EQ-5D index scores,in patients taking adalimumab [change from baseline 0.15 units (SD 0.30 units)] when compared withthose taking placebo [change from baseline 0.06 units (SD 0.28 units)]. A study of adalimumab reportedno statistically significant difference in EQ-5D between groups at 12 weeks (0.78 units for adalimumab vs.0.72 units for placebo; p= 0.32).51
For Ankylosing Spondylitis Quality of Life (ASQoL), a quality of life instrument specific to AS, ATLAS61 wasthe only trial which reported results together with SDs or standard errors (SEs); significant improvementswere found favouring treatment with adalimumab at week 12 [mean change from baseline –3.2 units(SD 0.3 units) for adalimumab vs. –1 unit (SD 0.4 units) for placebo].62 Similar statistically significant resultswere reported in an etanercept trial at 12 weeks (mean change from baseline –3.3 units for etanercept vs.–0.1 units for placebo; p= 0.02)71 and in an infliximab trial at 16 weeks (mean change from baseline–6.2 units for infliximab vs. –1 unit for placebo; p= 0.007).50 Another small study of infliximab did not finda significant difference between groups at 30 weeks (p= 0.14).100
TABLE 11 The difference in change from baseline for BASDAI and BASFI scores assuming all TNFs have the sameeffect and assuming infliximab may be different
Category of intervention
BASDAI score BASFI score
Mean 95% CrI Mean 95% CrI
All TNFs –1.66 –1.88 to –1.43 –1.38 –1.59 to –1.18
TNFs other than infliximab –1.62 –1.85 to –1.38 –1.35 –1.56 to –1.14
Infliximab –2.28 –3.18 to –1.38 –2.15 –3.18 to –1.11
DOI: 10.3310/hta20090 HEALTH TECHNOLOGY ASSESSMENT 2016 VOL. 20 NO. 9
© Queen’s Printer and Controller of HMSO 2016. This work was produced by Corbett et al. under the terms of a commissioning contract issued by the Secretary of State forHealth. This issue may be freely reproduced for the purposes of private research and study and extracts (or indeed, the full report) may be included in professional journalsprovided that suitable acknowledgement is made and the reproduction is not associated with any form of advertising. Applications for commercial reproduction should beaddressed to: NIHR Journals Library, National Institute for Health Research, Evaluation, Trials and Studies Coordinating Centre, Alpha House, University of Southampton SciencePark, Southampton SO16 7NS, UK.
33
‘Placebo’ response in ankylosing spondylitis and non-radiographicaxial spondyloarthritisTo inform insight into the extent of any ‘placebo’ effects (outlined in Chapter 1, Description of healthproblem), Table 12 compares the placebo response rates in trials which reported ASAS 20 results and atleast one of ASAS 40 or BASDAI 50 results. These data highlight the relatively high rates of ASAS 20response (median 31%, range 21–40%) when compared with ASAS 40 response (median 15%, range10–23%) and BASDAI 50 response (median 16%, range 5–24%).
However, the extent of the ‘placebo’ response on the ASAS 20 results might result in an underestimationof anti-TNF efficacy, notably when ASAS 20 is the only ASAS improvement outcome reported in a trial.An increase in the likelihood of being a responder (i.e. the relative risks when compared with placebo)when moving up the ASAS thresholds seems apparent from the results in Clinical effectiveness results:efficacy results from randomised controlled trials. This might be explained by considering the subset ofpatients who achieve an ASAS 20 response largely because of regression to the mean (i.e. because ofnatural variation in repeated data measurements, such as patients transitioning from flare at randomisationto no flare at 12 weeks). For those patients who experience regression to the mean after taking ananti-TNF, the true benefit of treatment may be hidden in the ASAS 20 outcome for some patients, and theproportion of ASAS 20 responders might therefore differ only moderately between the anti-TNF andplacebo groups. As the bar for response is raised, from ASAS 20 through to ASAS 70, this difference inthe proportion of responders between active treatment and placebo groups is likely to increase as aneffect because regression to the mean becomes less probable. The diluting effect of a placebo response onthe relative risks therefore diminishes as the ASAS thresholds increase (and more informative estimates oftreatment benefit can be seen). Regardless of the reason, these results highlight the limited applicability ofASAS 20 as a clinically informative outcome measure. ASAS 20 was nevertheless the most commonlyreported responder outcome across the trials.
Summary of the randomised controlled trial clinical efficacy resultsFor both the AS and nr-AxSpA populations the results of the meta-analyses demonstrated that anti-TNFsproduce statistically significant and clinically relevant benefits to patients in terms of improving functionand reducing disease activity. The common class-effect model used may have underestimated theuncertainty in the effect estimates. Although there is a possibility that infliximab is more effective thanother TNF inhibitors, at least at 12 weeks, there is no strong evidence to support this. For the diseaseactivity, function and responder outcomes, the class-efficacy estimates were consistently slightly smaller fornr-AxSpA than for AS, most noticeably for BASFI and BASDAI 50.
The included RCTs were generally subject to low risks of bias and no important variation in baselinecharacteristics was evident, with the exception of CRP levels: in the nr-AxSpA trial populations CRP levelswere much lower than in the AS populations. Although heterogeneity of CRP levels was evident acrossboth the AS trials and the nr-AxSpA trials, in almost all the AS trials the CRP levels were higher than the14mg/l threshold identified as being a key predictor of treatment response (in AS, higher CRP levelsare associated with an increased likelihood of BASDAI 50 response).112 In the nr-AxSpA trials only theRAPID-axSpA64 population came close to this cut-off point. These lower CRP levels may therefore have hadan impact on the efficacy estimates for the nr-AxSpA population.
Statistical heterogeneity was more apparent in the nr-AxSpA analyses than in the AS analyses. This may bea result of both clinical heterogeneity in the nr-AxSpA trials (such as variation in CRP thresholds, or theproportion of MRI positive patients) and the fact that fewer studies were available for analysis. In the lightof the statistical heterogeneity across the nr-AxSpA trials, both the reliability of the nr-AxSpA-pooledestimates and their true relevance to patients seen in clinical practice are questionable.
The clinical relevance of the efficacy of anti-TNFs can be evaluated in part by considering the literature onminimum clinically important differences (MCIDs) or minimum clinically important improvements. In a studyof 125 AS patients, Pavy et al.113 reported a MCID of 1 unit (or a 20% relative change) for BASDAI and
ASSESSMENT OF CLINICAL EFFECTIVENESS
NIHR Journals Library www.journalslibrary.nihr.ac.uk
34
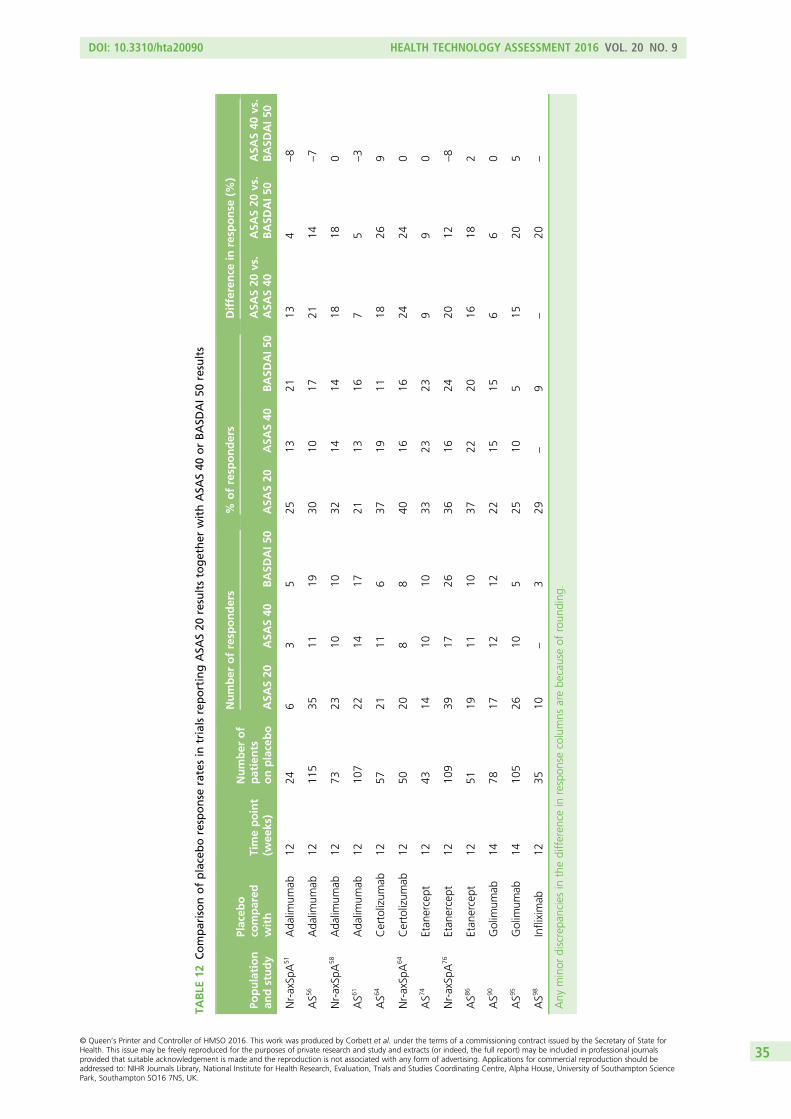
TABLE
12Comparisonofplaceboresponse
ratesin
trialsreportingASA
S20
resultstogether
withASA
S40
orBASD
AI50
results
Population
andstudy
Placeb
oco
mpared
with
Timepoint
(wee
ks)
Number
of
patients
onplacebo
Number
ofresp
onders
%ofresp
onders
Difference
inresp
onse
(%)
ASA
S20
ASA
S40
BASD
AI5
0ASA
S20
ASA
S40
BASD
AI5
0ASA
S20
vs.
ASA
S40
ASA
S20
vs.
BASD
AI50
ASA
S40
vs.
BASD
AI50
Nr-axSp
A51
Ada
limum
ab12
246
35
2513
2113
4–8
AS5
6Ada
limum
ab12
115
3511
1930
1017
2114
–7
Nr-axSp
A58
Ada
limum
ab12
7323
1010
3214
1418
180
AS6
1Ada
limum
ab12
107
2214
1721
1316
75
–3
AS6
4Certolizum
ab12
5721
116
3719
1118
269
Nr-axSp
A64
Certolizum
ab12
5020
88
4016
1624
240
AS7
4Etan
ercept
1243
1410
1033
2323
99
0
Nr-axSp
A76
Etan
ercept
1210
939
1726
3616
2420
12–8
AS8
6Etan
ercept
1251
1911
1037
2220
1618
2
AS9
0Golim
umab
1478
1712
1222
1515
66
0
AS9
5Golim
umab
1410
526
105
2510
515
205
AS9
8Infliximab
1235
10–
329
–9
–20
–
Any
minor
discrepa
nciesin
thedifferen
cein
respon
secolumns
arebe
causeof
roun
ding
.
DOI: 10.3310/hta20090 HEALTH TECHNOLOGY ASSESSMENT 2016 VOL. 20 NO. 9
© Queen’s Printer and Controller of HMSO 2016. This work was produced by Corbett et al. under the terms of a commissioning contract issued by the Secretary of State forHealth. This issue may be freely reproduced for the purposes of private research and study and extracts (or indeed, the full report) may be included in professional journalsprovided that suitable acknowledgement is made and the reproduction is not associated with any form of advertising. Applications for commercial reproduction should beaddressed to: NIHR Journals Library, National Institute for Health Research, Evaluation, Trials and Studies Coordinating Centre, Alpha House, University of Southampton SciencePark, Southampton SO16 7NS, UK.
35
0.7 units (17.5% relative change) for BASFI. All the effect estimates from this review for both BASDAIand BASFI were considerably higher than these MCIDs. The small effect on spinal mobility (a group effectreduction of around 0.3 BASMI units) appears unlikely to be clinically important.
Summary of some key issues arising from the Food and Drug Administrationassessments of the ABILITY-158 and RAPID-axSpA64 trialsThe FDA Arthritis Advisory Committee met in July 2013 to discuss licence applications for adalimumab forpatients with active nr-AxSpA (with objective signs of inflammation) and certolizumab pegol for patientswith active axSpA, including patients with AS.114 An important issue which arose in both trials was thedifferences in diagnoses arising from radiograph images evaluated centrally compared with images beingevaluated locally. The implications for efficacy were explored via further analyses.
RAPID-axSpA64 trial (certolizumab pegol)This trial aimed to recruit both AS and nr-AxSpA patients.64 The nr-AxSpA patients had to have a positiveMRI or an elevated CRP level; the definition used for CRP level elevation was 7.9mg/l.
Comparison of ankylosing spondylitis and non-radiographic axial spondyloarthritis populationcharacteristics In AS males predominated (72%), whereas in nr-AxSpA the male-to-female ratio was roughlyequal. The AS population had a mean age of 41.5 years, which was around four years older than the nr-AxSpApopulation. Baseline BASFI, BASMI and CRP levels suggested more functional and mobility impairment andmore inflammation in the AS group when compared with the nr-AxSpA group. However, baseline back painseverity and BASDAI scores were similar between the AS and nr-AxSpA subgroups (Table 13).
Methods used to evaluate radiograph images In the trial, many patients had their disease reclassifiedwhen radiographs were evaluated centrally, rather than being evaluated locally. Two readers were involvedin the central evaluation of the radiographs, they were blinded to both the assigned subgroup and thetreatment group; a third reader was used in cases of disagreement. Twenty-one per cent of locallyclassified AS patients were reclassified as nr-AxSpA by central readers and 51% of locally classifiednr-AxSpA patients were reclassified as AS by the central readers. Based on the central assessments184 patients had AS and 98 patients had nr-AxSpA. Central reads could not be made for 43 patients asradiographs were not available (37 AS patients and six nr-AxSpA patients).
ABILITY-158 trial (adalimumab)This trial intended to recruit only nr-AxSpA patients, although this included patients (n= 43) who hadnr-AxSpA but neither a positive MRI nor an elevated CRP level.58 The population with these 43 patientsexcluded is referred to as the ‘adalimumab target population’ (ATP). As in the RAPID-axSpA64 trial, centralrereading of radiographs was performed (in addition to local evaluation), although this was only done forper-protocol patients who also reached week 104 [n= 102 (out of 185) patients]. Thirty-eight of the102 patients were identified as having AS rather than nr-AxSpA. The FDA statistician analysed the results inthese 38 patients and compared them to those for patients with centrally confirmed nr-AxSpA. The FDAdocument reported results for the subpopulations based on local or central diagnosis, including ATP analyses.
Comparison of ankylosing spondylitis and non-radiographic axial spondyloarthritisresults and impact of reclassification in the trialsFor certolizumab pegol the FDA statistical review stated that ‘efficacy findings were consistent in both ASand nr-AxSpA subpopulations regardless of the discrepancy in pelvic X-ray readings at local or central labfor modified New York criteria’115 (Table 14).
For ABILITY-158 a notably higher proportion of patients in the AS subgroup responded to adalimumab(ASAS 40) than placebo compared with patients with confirmed nr-AxSpA. This suggests that thetreatment benefit in the whole trial population may be driven by benefit in AS patients rather than innr-AxSpA patients, skewing the results for the ATP (see Table 14). It should be noted, however, that thismay be an atypical AS population; the trial had intended to recruit only nr-AxSpA patients.
ASSESSMENT OF CLINICAL EFFECTIVENESS
NIHR Journals Library www.journalslibrary.nihr.ac.uk
36
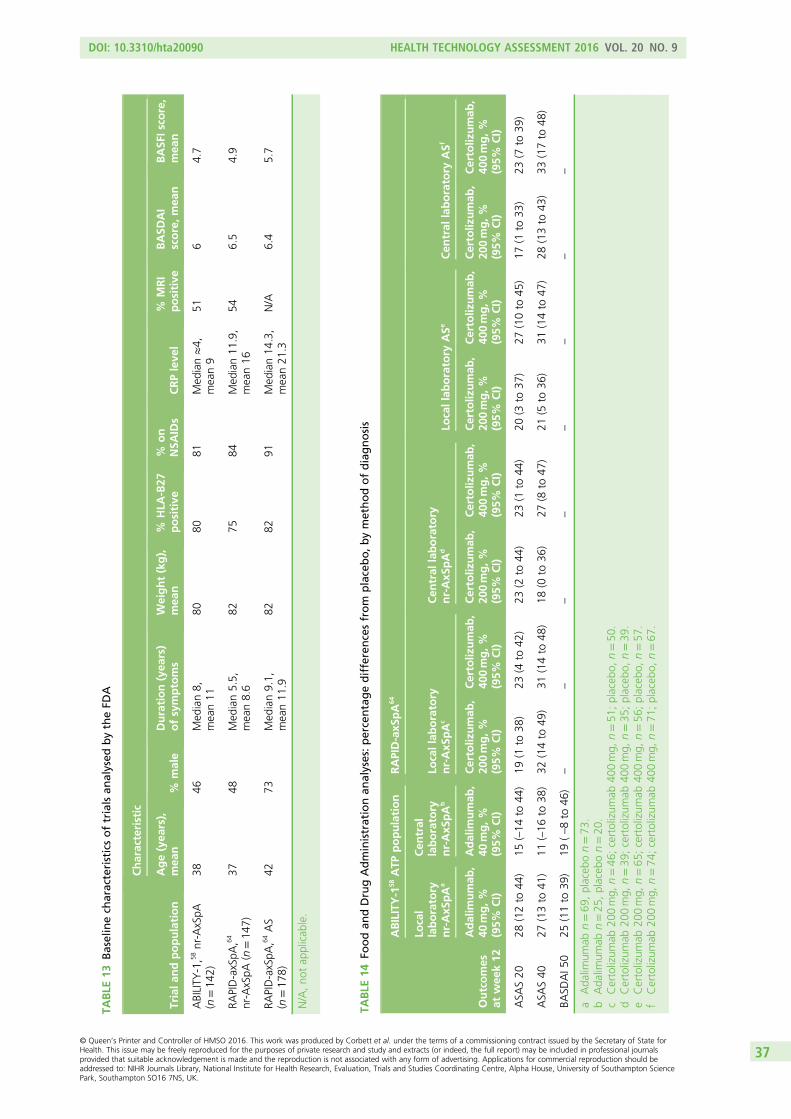
TABLE
13Baselinech
aracteristicsoftrialsan
alysed
bytheFD
A
Triala
ndpopulation
Characteristic
Age(yea
rs),
mea
n%
male
Duration(yea
rs)
ofsymptoms
Weight(kg),
mea
n%
HLA
-B27
positive
%on
NSA
IDs
CRPleve
l%
MRI
positive
BASD
AI
score,mea
nBASF
Isco
re,
mea
n
ABILITY
-1,5
8nr-AxSpA
(n=14
2)38
46Med
ian8,
mean11
8080
81Med
ian≈4,
mean9
516
4.7
RAPID-axSpA
,64
nr-AxSpA
(n=14
7)37
48Med
ian5.5,
mean8.6
8275
84Med
ian11
.9,
mean16
546.5
4.9
RAPID-axSpA
,64AS
(n=17
8)42
73Med
ian9.1,
mean11
.982
8291
Med
ian14
.3,
mean21
.3N/A
6.4
5.7
N/A,no
tap
plicab
le.
TABLE
14Fo
odan
dDrugAdministrationan
alyses:percentagedifferencesfrom
placebo,b
ymethodofdiagnosis
Outcomes
atwee
k12
ABILITY-1
58ATP
population
RAPID-axS
pA
64
Local
laboratory
nr-AxS
pA
a
Cen
tral
laboratory
nr-AxS
pA
bLo
callaboratory
nr-AxS
pA
cCen
tral
laboratory
nr-AxS
pA
dLo
callab
oratory
ASe
Cen
tral
laboratory
ASf
Adalim
umab
,40
mg,%
(95%
CI)
Adalim
umab
,40
mg,%
(95%
CI)
Certoliz
umab
,20
0mg,%
(95%
CI)
Certoliz
umab
,40
0mg,%
(95%
CI)
Certoliz
umab
,20
0mg,%
(95%
CI)
Certoliz
umab
,40
0mg,%
(95%
CI)
Certoliz
umab
,20
0mg,%
(95%
CI)
Certoliz
umab
,40
0mg,%
(95%
CI)
Certoliz
umab
,20
0mg,%
(95%
CI)
Certoliz
umab
,40
0mg,%
(95%
CI)
ASA
S20
28(12to
44)
15(–14
to44
)19
(1to
38)
23(4
to42
)23
(2to
44)
23(1
to44
)20
(3to
37)
27(10to
45)
17(1
to33
)23
(7to
39)
ASA
S40
27(13to
41)
11(–16
to38
)32
(14to
49)
31(14to
48)
18(0
to36
)27
(8to
47)
21(5
to36
)31
(14to
47)
28(13to
43)
33(17to
48)
BASD
AI5
025
(11to
39)
19(–8to
46)
––
––
––
––
aAda
limum
abn=69
,placeb
on=73
.b
Ada
limum
abn=25
,placeb
on=20
.c
Certolizum
ab20
0mg,
n=46
;certolizum
ab40
0mg,
n=51
;placeb
o,n=50
.d
Certolizum
ab20
0mg,
n=39
;certolizum
ab40
0mg,
n=35
;placeb
o,n=39
.e
Certolizum
ab20
0mg,
n=65
;certolizum
ab40
0mg,
n=56
;placeb
o,n=57
.f
Certolizum
ab20
0mg,
n=74
;certolizum
ab40
0mg,
n=71
;placeb
o,n=67
.
DOI: 10.3310/hta20090 HEALTH TECHNOLOGY ASSESSMENT 2016 VOL. 20 NO. 9
© Queen’s Printer and Controller of HMSO 2016. This work was produced by Corbett et al. under the terms of a commissioning contract issued by the Secretary of State forHealth. This issue may be freely reproduced for the purposes of private research and study and extracts (or indeed, the full report) may be included in professional journalsprovided that suitable acknowledgement is made and the reproduction is not associated with any form of advertising. Applications for commercial reproduction should beaddressed to: NIHR Journals Library, National Institute for Health Research, Evaluation, Trials and Studies Coordinating Centre, Alpha House, University of Southampton SciencePark, Southampton SO16 7NS, UK.
37
Owing to the fact that only a select group of patients could be subject to central confirmation of theirnr-AxSpA status, the FDA statistician explored assumptions around the proportion of true nr-AxSpA patientsin the whole trial population. Given that the treatment difference in the non-centrally read patients was 23%:
l Assuming that all non-centrally read patients were true negatives and therefore including them in theanalysis with the centrally read negatives, the treatment difference for the centrally read andnon-centrally read negatives was 15%.
l Assuming that a fraction (i.e. 63%) of non-centrally read patients were true negatives and includingonly this fraction of non-centrally read patients with the centrally read negatives, the treatmentdifference was 14%.
The FDA document stated that:
Because there was a differential treatment effect between the centrally-read positive and centrally-readnegative, it is safe to assume that the difference of 23% is an overestimate of the treatment effectbecause this includes both positive and negative x-ray groups. If there is a fraction of patients whoare negative in the non-centrally-read group, treatment difference among this negative groupwould be smaller. Therefore, the treatment difference for negative x-rays (i.e. centrally-read andnon-centrally-read) should be at most 15%. Based on the data provided, the estimate of the treatmenteffect in ASAS40 response for nr-AxSpA should be no bigger than 15%
FDA Briefing Package116
Overall, the results suggest reduced efficacy of anti-TNFs in the centrally diagnosed nr-AxSpA populationcompared with the locally diagnosed population. Nevertheless, there was noticeable variation across thetwo trials. In RAPID-axSpA64 (certolizumab) the difference between the central and local populationsappears small (and is not evident for 400-mg vs. placebo results). Conversely, in ABILITY-158 (adalimumab)the locally diagnosed population had notably more responders than the centrally diagnosed population,although the treatment group sample sizes were small.
Long-term efficacy results from open-label extensions of randomisedcontrolled trialsOf the 24 included RCTs, 17 reported data from an open-label extension phase. Results for all studies arepresented in Appendix 8. Considerable effort has been put into patient follow-up in anti-TNF trials withthe result that data up to 5 years are available (there are data up to 8 years for infliximab but theseincluded an involuntary treatment break which is not discussed further). The longest follow-up durations inpatients with AS by anti-TNF are adalimumab 260 weeks, etanercept 264 weeks, infliximab 156 weeks,golimumab 268 weeks and certolizumab pegol 96 weeks. However, the data were reported acrossnumerous publications and in various formats. Results were reported as observed, as completer analyses,using imputation (and rarely LOCF) for non-responders and LOCF for missing continuous data, but theserelated to differing populations (at varying time points): all patients randomised, all patients who tookactive drug at any point in the study or all patients who took active drug just during the open-label phase.The follow-up protocols were not clearly reported, with stopping rules unclear, but it appears that not allnon-responders discontinued therapy. Therefore, the results may not reflect clinical practice shouldresponse be required for treatment continuation.
Table 15 presents the results based on non-responder imputation (NRI) analyses for the main studies whenthese results could be extracted. For AS the results show that across all the anti-TNFs after approximately2 years of treatment, around half of patients are still achieving a good level of response to therapy. Theresults for golimumab look particularly strong with around 60% of all randomised patients achievingASAS 40 and BASDAI 50 after 5 years. However, this is probably not reflective of clinical practice, as manyof the normal weight patients took the 100-mg dose of golimumab rather than the 50-mg dose: thelicence permits the use of 100-mg dose only in patients with a body weight of more than 100 kg who donot achieve an adequate clinical response after three or four doses. The equivalent results for adalimumaband etanercept are approximately 30% and 50%, although it is unknown if the difference may bebecause of variations in follow-up protocols rather than true treatment difference.
ASSESSMENT OF CLINICAL EFFECTIVENESS
NIHR Journals Library www.journalslibrary.nihr.ac.uk
38
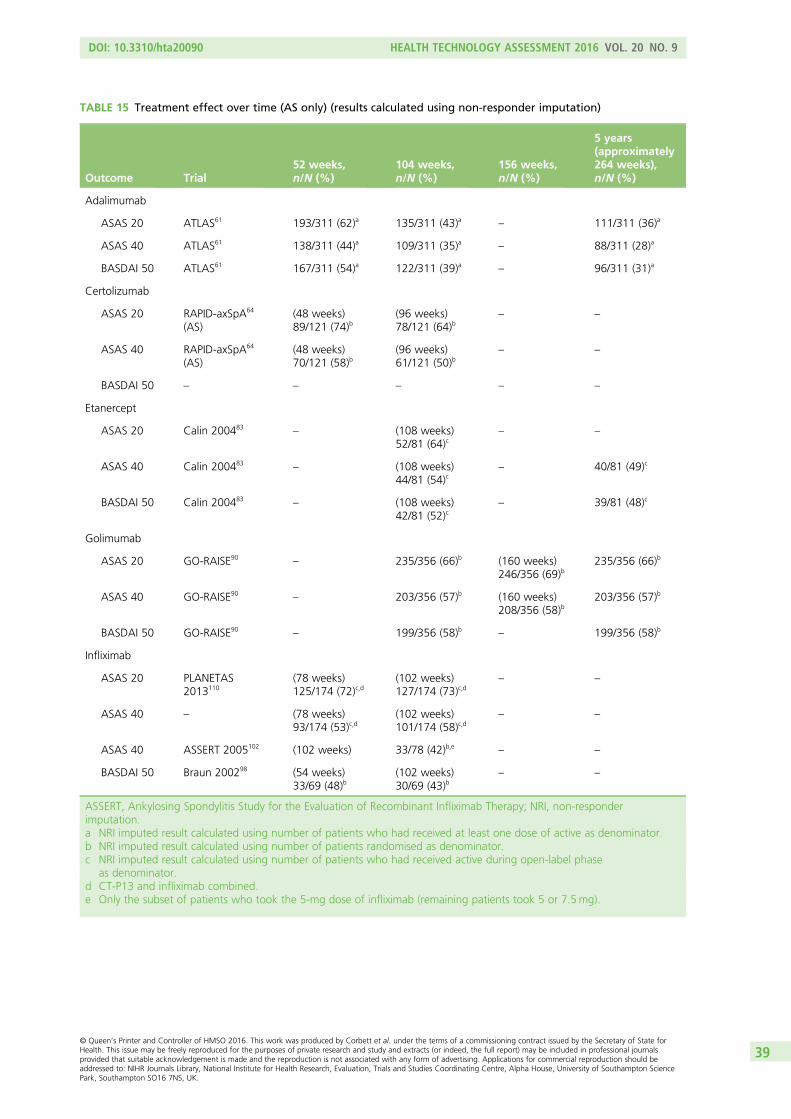
TABLE 15 Treatment effect over time (AS only) (results calculated using non-responder imputation)
Outcome Trial52 weeks,n/N (%)
104 weeks,n/N (%)
156 weeks,n/N (%)
5 years(approximately264 weeks),n/N (%)
Adalimumab
ASAS 20 ATLAS61 193/311 (62)a 135/311 (43)a – 111/311 (36)a
ASAS 40 ATLAS61 138/311 (44)a 109/311 (35)a – 88/311 (28)a
BASDAI 50 ATLAS61 167/311 (54)a 122/311 (39)a – 96/311 (31)a
Certolizumab
ASAS 20 RAPID-axSpA64
(AS)(48 weeks)89/121 (74)b
(96 weeks)78/121 (64)b
– –
ASAS 40 RAPID-axSpA64
(AS)(48 weeks)70/121 (58)b
(96 weeks)61/121 (50)b
– –
BASDAI 50 – – – – –
Etanercept
ASAS 20 Calin 200483– (108 weeks)
52/81 (64)c– –
ASAS 40 Calin 200483– (108 weeks)
44/81 (54)c– 40/81 (49)c
BASDAI 50 Calin 200483– (108 weeks)
42/81 (52)c– 39/81 (48)c
Golimumab
ASAS 20 GO-RAISE90– 235/356 (66)b (160 weeks)
246/356 (69)b235/356 (66)b
ASAS 40 GO-RAISE90– 203/356 (57)b (160 weeks)
208/356 (58)b203/356 (57)b
BASDAI 50 GO-RAISE90– 199/356 (58)b – 199/356 (58)b
Infliximab
ASAS 20 PLANETAS2013110
(78 weeks)125/174 (72)c,d
(102 weeks)127/174 (73)c,d
– –
ASAS 40 – (78 weeks)93/174 (53)c,d
(102 weeks)101/174 (58)c,d
– –
ASAS 40 ASSERT 2005102 (102 weeks) 33/78 (42)b,e – –
BASDAI 50 Braun 200298 (54 weeks)33/69 (48)b
(102 weeks)30/69 (43)b
– –
ASSERT, Ankylosing Spondylitis Study for the Evaluation of Recombinant Infliximab Therapy; NRI, non-responderimputation.a NRI imputed result calculated using number of patients who had received at least one dose of active as denominator.b NRI imputed result calculated using number of patients randomised as denominator.c NRI imputed result calculated using number of patients who had received active during open-label phase
as denominator.d CT-P13 and infliximab combined.e Only the subset of patients who took the 5-mg dose of infliximab (remaining patients took 5 or 7.5mg).
DOI: 10.3310/hta20090 HEALTH TECHNOLOGY ASSESSMENT 2016 VOL. 20 NO. 9
© Queen’s Printer and Controller of HMSO 2016. This work was produced by Corbett et al. under the terms of a commissioning contract issued by the Secretary of State forHealth. This issue may be freely reproduced for the purposes of private research and study and extracts (or indeed, the full report) may be included in professional journalsprovided that suitable acknowledgement is made and the reproduction is not associated with any form of advertising. Applications for commercial reproduction should beaddressed to: NIHR Journals Library, National Institute for Health Research, Evaluation, Trials and Studies Coordinating Centre, Alpha House, University of Southampton SciencePark, Southampton SO16 7NS, UK.
39
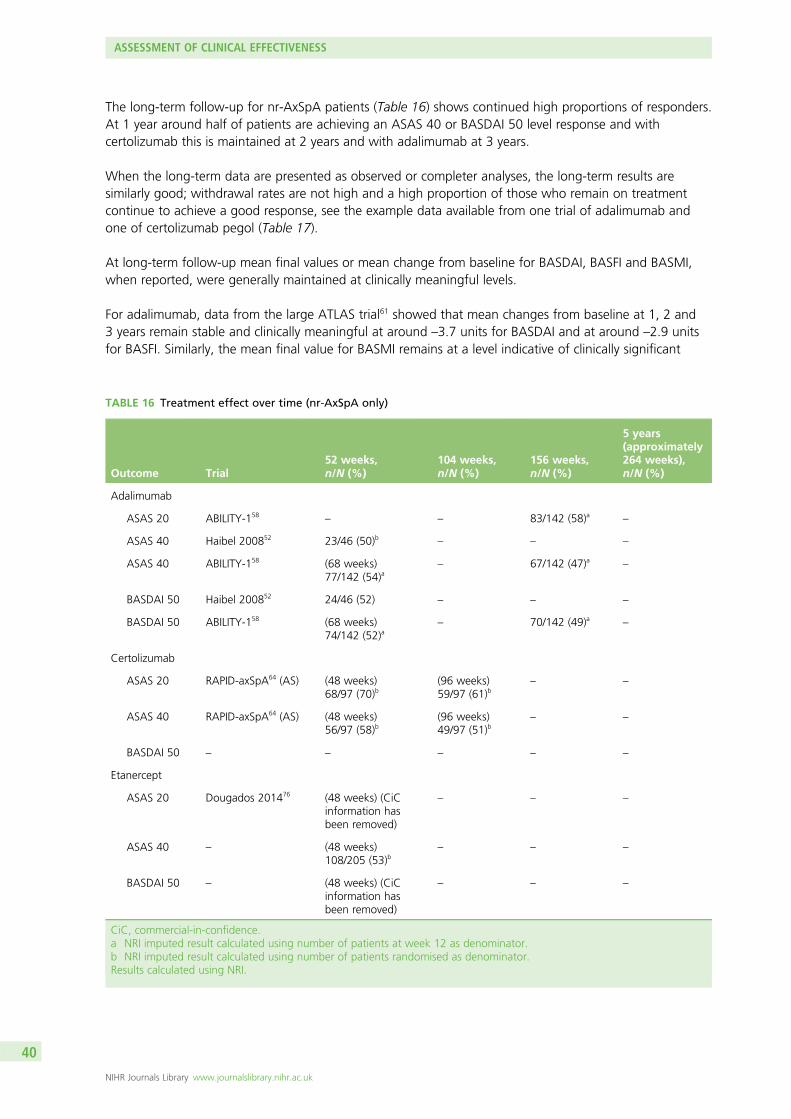
The long-term follow-up for nr-AxSpA patients (Table 16) shows continued high proportions of responders.At 1 year around half of patients are achieving an ASAS 40 or BASDAI 50 level response and withcertolizumab this is maintained at 2 years and with adalimumab at 3 years.
When the long-term data are presented as observed or completer analyses, the long-term results aresimilarly good; withdrawal rates are not high and a high proportion of those who remain on treatmentcontinue to achieve a good response, see the example data available from one trial of adalimumab andone of certolizumab pegol (Table 17).
At long-term follow-up mean final values or mean change from baseline for BASDAI, BASFI and BASMI,when reported, were generally maintained at clinically meaningful levels.
For adalimumab, data from the large ATLAS trial61 showed that mean changes from baseline at 1, 2 and3 years remain stable and clinically meaningful at around –3.7 units for BASDAI and at around –2.9 unitsfor BASFI. Similarly, the mean final value for BASMI remains at a level indicative of clinically significant
TABLE 16 Treatment effect over time (nr-AxSpA only)
Outcome Trial52 weeks,n/N (%)
104 weeks,n/N (%)
156 weeks,n/N (%)
5 years(approximately264 weeks),n/N (%)
Adalimumab
ASAS 20 ABILITY-158– – 83/142 (58)a –
ASAS 40 Haibel 200852 23/46 (50)b – – –
ASAS 40 ABILITY-158 (68 weeks)77/142 (54)a
– 67/142 (47)a –
BASDAI 50 Haibel 200852 24/46 (52) – – –
BASDAI 50 ABILITY-158 (68 weeks)74/142 (52)a
– 70/142 (49)a –
Certolizumab
ASAS 20 RAPID-axSpA64 (AS) (48 weeks)68/97 (70)b
(96 weeks)59/97 (61)b
– –
ASAS 40 RAPID-axSpA64 (AS) (48 weeks)56/97 (58)b
(96 weeks)49/97 (51)b
– –
BASDAI 50 – – – – –
Etanercept
ASAS 20 Dougados 201476 (48 weeks) (CiCinformation hasbeen removed)
– – –
ASAS 40 – (48 weeks)108/205 (53)b
– – –
BASDAI 50 – (48 weeks) (CiCinformation hasbeen removed)
– – –
CiC, commercial-in-confidence.a NRI imputed result calculated using number of patients at week 12 as denominator.b NRI imputed result calculated using number of patients randomised as denominator.Results calculated using NRI.
ASSESSMENT OF CLINICAL EFFECTIVENESS
NIHR Journals Library www.journalslibrary.nihr.ac.uk
40
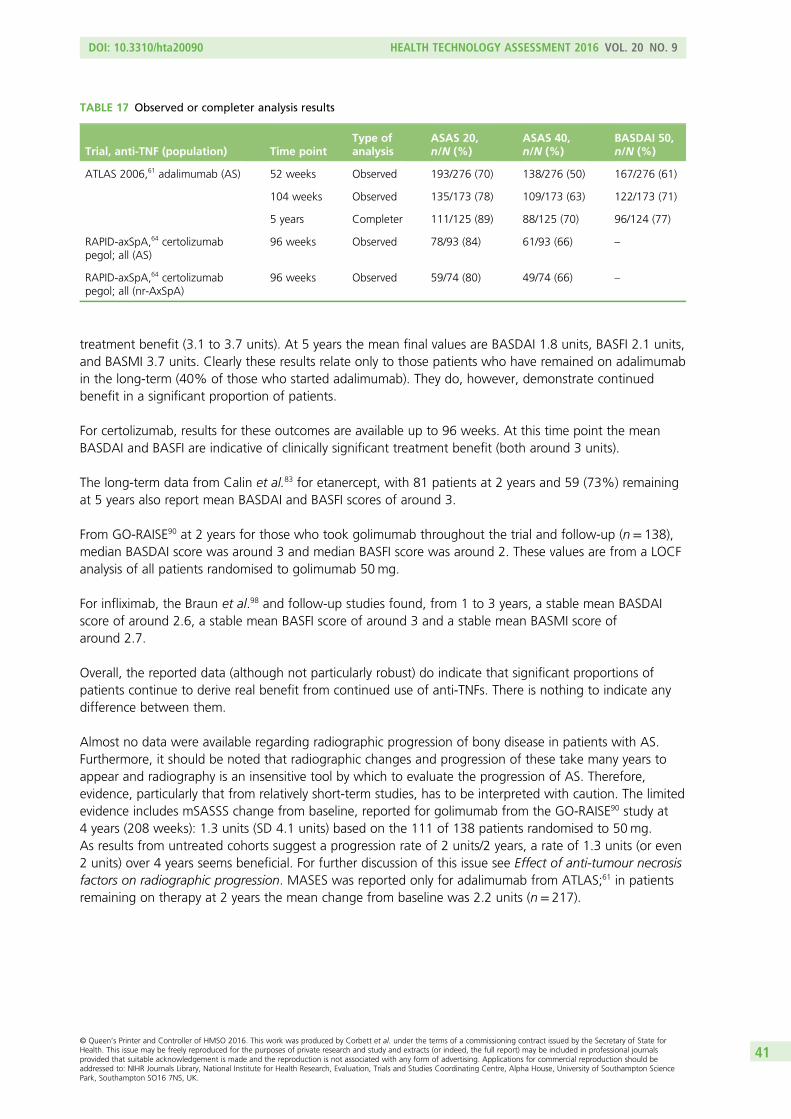
treatment benefit (3.1 to 3.7 units). At 5 years the mean final values are BASDAI 1.8 units, BASFI 2.1 units,and BASMI 3.7 units. Clearly these results relate only to those patients who have remained on adalimumabin the long-term (40% of those who started adalimumab). They do, however, demonstrate continuedbenefit in a significant proportion of patients.
For certolizumab, results for these outcomes are available up to 96 weeks. At this time point the meanBASDAI and BASFI are indicative of clinically significant treatment benefit (both around 3 units).
The long-term data from Calin et al.83 for etanercept, with 81 patients at 2 years and 59 (73%) remainingat 5 years also report mean BASDAI and BASFI scores of around 3.
From GO-RAISE90 at 2 years for those who took golimumab throughout the trial and follow-up (n= 138),median BASDAI score was around 3 and median BASFI score was around 2. These values are from a LOCFanalysis of all patients randomised to golimumab 50mg.
For infliximab, the Braun et al.98 and follow-up studies found, from 1 to 3 years, a stable mean BASDAIscore of around 2.6, a stable mean BASFI score of around 3 and a stable mean BASMI score ofaround 2.7.
Overall, the reported data (although not particularly robust) do indicate that significant proportions ofpatients continue to derive real benefit from continued use of anti-TNFs. There is nothing to indicate anydifference between them.
Almost no data were available regarding radiographic progression of bony disease in patients with AS.Furthermore, it should be noted that radiographic changes and progression of these take many years toappear and radiography is an insensitive tool by which to evaluate the progression of AS. Therefore,evidence, particularly that from relatively short-term studies, has to be interpreted with caution. The limitedevidence includes mSASSS change from baseline, reported for golimumab from the GO-RAISE90 study at4 years (208 weeks): 1.3 units (SD 4.1 units) based on the 111 of 138 patients randomised to 50mg.As results from untreated cohorts suggest a progression rate of 2 units/2 years, a rate of 1.3 units (or even2 units) over 4 years seems beneficial. For further discussion of this issue see Effect of anti-tumour necrosisfactors on radiographic progression. MASES was reported only for adalimumab from ATLAS;61 in patientsremaining on therapy at 2 years the mean change from baseline was 2.2 units (n= 217).
TABLE 17 Observed or completer analysis results
Trial, anti-TNF (population) Time pointType ofanalysis
ASAS 20,n/N (%)
ASAS 40,n/N (%)
BASDAI 50,n/N (%)
ATLAS 2006,61 adalimumab (AS) 52 weeks Observed 193/276 (70) 138/276 (50) 167/276 (61)
104 weeks Observed 135/173 (78) 109/173 (63) 122/173 (71)
5 years Completer 111/125 (89) 88/125 (70) 96/124 (77)
RAPID-axSpA,64 certolizumabpegol; all (AS)
96 weeks Observed 78/93 (84) 61/93 (66) –
RAPID-axSpA,64 certolizumabpegol; all (nr-AxSpA)
96 weeks Observed 59/74 (80) 49/74 (66) –
DOI: 10.3310/hta20090 HEALTH TECHNOLOGY ASSESSMENT 2016 VOL. 20 NO. 9
© Queen’s Printer and Controller of HMSO 2016. This work was produced by Corbett et al. under the terms of a commissioning contract issued by the Secretary of State forHealth. This issue may be freely reproduced for the purposes of private research and study and extracts (or indeed, the full report) may be included in professional journalsprovided that suitable acknowledgement is made and the reproduction is not associated with any form of advertising. Applications for commercial reproduction should beaddressed to: NIHR Journals Library, National Institute for Health Research, Evaluation, Trials and Studies Coordinating Centre, Alpha House, University of Southampton SciencePark, Southampton SO16 7NS, UK.
41
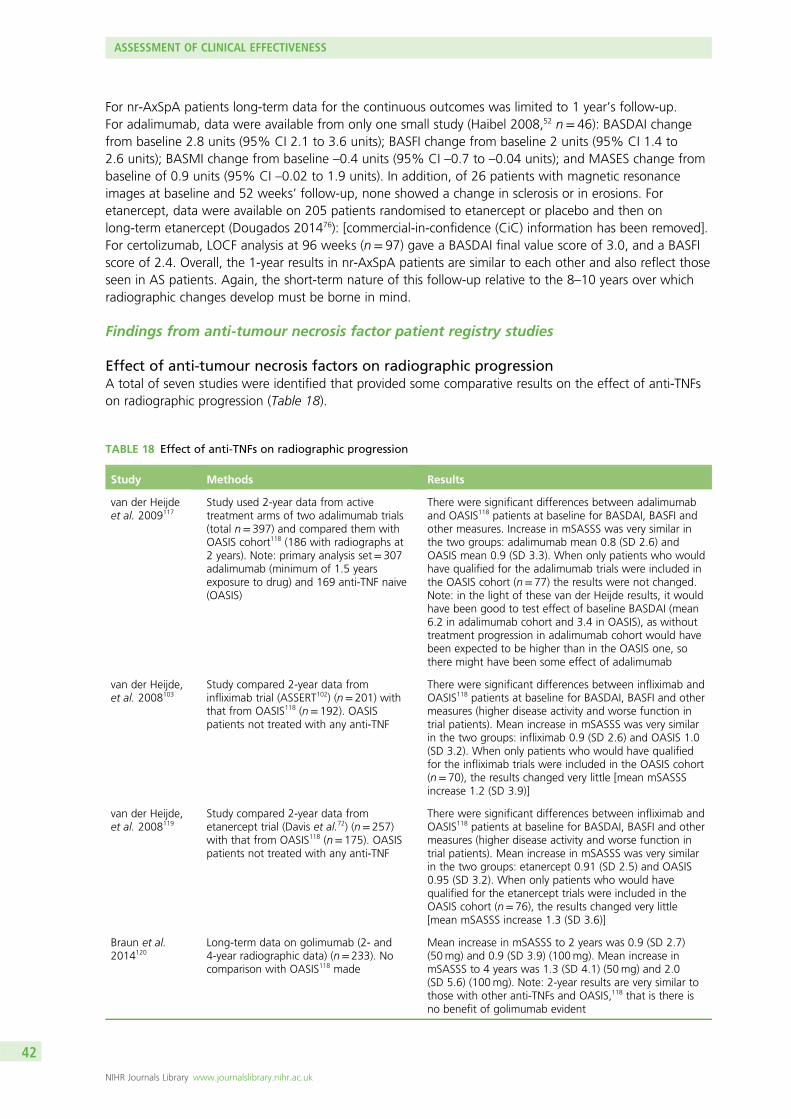
For nr-AxSpA patients long-term data for the continuous outcomes was limited to 1 year’s follow-up.For adalimumab, data were available from only one small study (Haibel 2008,52 n= 46): BASDAI changefrom baseline 2.8 units (95% CI 2.1 to 3.6 units); BASFI change from baseline 2 units (95% CI 1.4 to2.6 units); BASMI change from baseline –0.4 units (95% CI –0.7 to –0.04 units); and MASES change frombaseline of 0.9 units (95% CI –0.02 to 1.9 units). In addition, of 26 patients with magnetic resonanceimages at baseline and 52 weeks’ follow-up, none showed a change in sclerosis or in erosions. Foretanercept, data were available on 205 patients randomised to etanercept or placebo and then onlong-term etanercept (Dougados 201476): [commercial-in-confidence (CiC) information has been removed].For certolizumab, LOCF analysis at 96 weeks (n= 97) gave a BASDAI final value score of 3.0, and a BASFIscore of 2.4. Overall, the 1-year results in nr-AxSpA patients are similar to each other and also reflect thoseseen in AS patients. Again, the short-term nature of this follow-up relative to the 8–10 years over whichradiographic changes develop must be borne in mind.
Findings from anti-tumour necrosis factor patient registry studies
Effect of anti-tumour necrosis factors on radiographic progressionA total of seven studies were identified that provided some comparative results on the effect of anti-TNFson radiographic progression (Table 18).
TABLE 18 Effect of anti-TNFs on radiographic progression
Study Methods Results
van der Heijdeet al. 2009117
Study used 2-year data from activetreatment arms of two adalimumab trials(total n= 397) and compared them withOASIS cohort118 (186 with radiographs at2 years). Note: primary analysis set= 307adalimumab (minimum of 1.5 yearsexposure to drug) and 169 anti-TNF naive(OASIS)
There were significant differences between adalimumaband OASIS118 patients at baseline for BASDAI, BASFI andother measures. Increase in mSASSS was very similar inthe two groups: adalimumab mean 0.8 (SD 2.6) andOASIS mean 0.9 (SD 3.3). When only patients who wouldhave qualified for the adalimumab trials were included inthe OASIS cohort (n= 77) the results were not changed.Note: in the light of these van der Heijde results, it wouldhave been good to test effect of baseline BASDAI (mean6.2 in adalimumab cohort and 3.4 in OASIS), as withouttreatment progression in adalimumab cohort would havebeen expected to be higher than in the OASIS one, sothere might have been some effect of adalimumab
van der Heijde,et al. 2008103
Study compared 2-year data frominfliximab trial (ASSERT102) (n= 201) withthat from OASIS118 (n= 192). OASISpatients not treated with any anti-TNF
There were significant differences between infliximab andOASIS118 patients at baseline for BASDAI, BASFI and othermeasures (higher disease activity and worse function intrial patients). Mean increase in mSASSS was very similarin the two groups: infliximab 0.9 (SD 2.6) and OASIS 1.0(SD 3.2). When only patients who would have qualifiedfor the infliximab trials were included in the OASIS cohort(n= 70), the results changed very little [mean mSASSSincrease 1.2 (SD 3.9)]
van der Heijde,et al. 2008119
Study compared 2-year data frometanercept trial (Davis et al.72) (n= 257)with that from OASIS118 (n= 175). OASISpatients not treated with any anti-TNF
There were significant differences between infliximab andOASIS118 patients at baseline for BASDAI, BASFI and othermeasures (higher disease activity and worse function intrial patients). Mean increase in mSASSS was very similarin the two groups: etanercept 0.91 (SD 2.5) and OASIS0.95 (SD 3.2). When only patients who would havequalified for the etanercept trials were included in theOASIS cohort (n= 76), the results changed very little[mean mSASSS increase 1.3 (SD 3.6)]
Braun et al.2014120
Long-term data on golimumab (2- and4-year radiographic data) (n= 233). Nocomparison with OASIS118 made
Mean increase in mSASSS to 2 years was 0.9 (SD 2.7)(50mg) and 0.9 (SD 3.9) (100mg). Mean increase inmSASSS to 4 years was 1.3 (SD 4.1) (50mg) and 2.0(SD 5.6) (100mg). Note: 2-year results are very similar tothose with other anti-TNFs and OASIS,118 that is there isno benefit of golimumab evident
ASSESSMENT OF CLINICAL EFFECTIVENESS
NIHR Journals Library www.journalslibrary.nihr.ac.uk
42
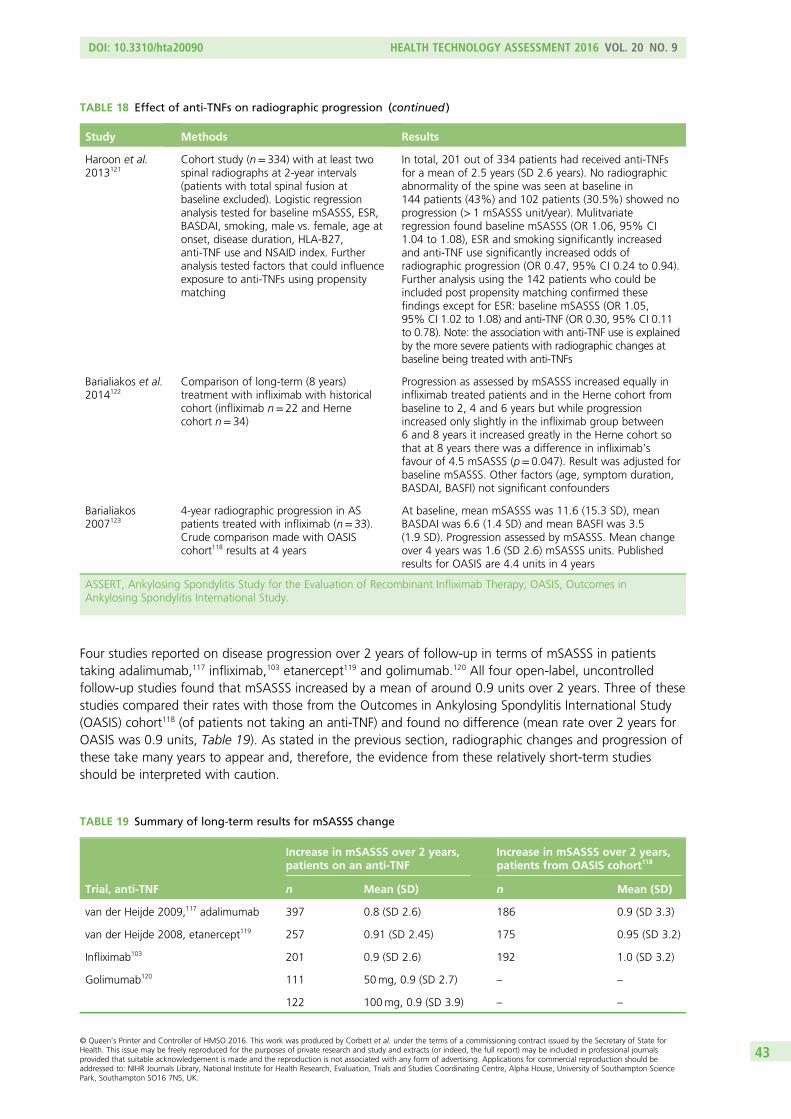
Four studies reported on disease progression over 2 years of follow-up in terms of mSASSS in patientstaking adalimumab,117 infliximab,103 etanercept119 and golimumab.120 All four open-label, uncontrolledfollow-up studies found that mSASSS increased by a mean of around 0.9 units over 2 years. Three of thesestudies compared their rates with those from the Outcomes in Ankylosing Spondylitis International Study(OASIS) cohort118 (of patients not taking an anti-TNF) and found no difference (mean rate over 2 years forOASIS was 0.9 units, Table 19). As stated in the previous section, radiographic changes and progression ofthese take many years to appear and, therefore, the evidence from these relatively short-term studiesshould be interpreted with caution.
TABLE 18 Effect of anti-TNFs on radiographic progression (continued )
Study Methods Results
Haroon et al.2013121
Cohort study (n= 334) with at least twospinal radiographs at 2-year intervals(patients with total spinal fusion atbaseline excluded). Logistic regressionanalysis tested for baseline mSASSS, ESR,BASDAI, smoking, male vs. female, age atonset, disease duration, HLA-B27,anti-TNF use and NSAID index. Furtheranalysis tested factors that could influenceexposure to anti-TNFs using propensitymatching
In total, 201 out of 334 patients had received anti-TNFsfor a mean of 2.5 years (SD 2.6 years). No radiographicabnormality of the spine was seen at baseline in144 patients (43%) and 102 patients (30.5%) showed noprogression (> 1 mSASSS unit/year). Mulitvariateregression found baseline mSASSS (OR 1.06, 95% CI1.04 to 1.08), ESR and smoking significantly increasedand anti-TNF use significantly increased odds ofradiographic progression (OR 0.47, 95% CI 0.24 to 0.94).Further analysis using the 142 patients who could beincluded post propensity matching confirmed thesefindings except for ESR: baseline mSASSS (OR 1.05,95% CI 1.02 to 1.08) and anti-TNF (OR 0.30, 95% CI 0.11to 0.78). Note: the association with anti-TNF use is explainedby the more severe patients with radiographic changes atbaseline being treated with anti-TNFs
Barialiakos et al.2014122
Comparison of long-term (8 years)treatment with infliximab with historicalcohort (infliximab n= 22 and Hernecohort n= 34)
Progression as assessed by mSASSS increased equally ininfliximab treated patients and in the Herne cohort frombaseline to 2, 4 and 6 years but while progressionincreased only slightly in the infliximab group between6 and 8 years it increased greatly in the Herne cohort sothat at 8 years there was a difference in infliximab’sfavour of 4.5 mSASSS (p= 0.047). Result was adjusted forbaseline mSASSS. Other factors (age, symptom duration,BASDAI, BASFI) not significant confounders
Barialiakos2007123
4-year radiographic progression in ASpatients treated with infliximab (n= 33).Crude comparison made with OASIScohort118 results at 4 years
At baseline, mean mSASSS was 11.6 (15.3 SD), meanBASDAI was 6.6 (1.4 SD) and mean BASFI was 3.5(1.9 SD). Progression assessed by mSASSS. Mean changeover 4 years was 1.6 (SD 2.6) mSASSS units. Publishedresults for OASIS are 4.4 units in 4 years
ASSERT, Ankylosing Spondylitis Study for the Evaluation of Recombinant Infliximab Therapy; OASIS, Outcomes inAnkylosing Spondylitis International Study.
TABLE 19 Summary of long-term results for mSASSS change
Trial, anti-TNF
Increase in mSASSS over 2 years,patients on an anti-TNF
Increase in mSASSS over 2 years,patients from OASIS cohort118
n Mean (SD) n Mean (SD)
van der Heijde 2009,117 adalimumab 397 0.8 (SD 2.6) 186 0.9 (SD 3.3)
van der Heijde 2008, etanercept119 257 0.91 (SD 2.45) 175 0.95 (SD 3.2)
Infliximab103 201 0.9 (SD 2.6) 192 1.0 (SD 3.2)
Golimumab120 111 50mg, 0.9 (SD 2.7) – –
122 100mg, 0.9 (SD 3.9) – –
DOI: 10.3310/hta20090 HEALTH TECHNOLOGY ASSESSMENT 2016 VOL. 20 NO. 9
© Queen’s Printer and Controller of HMSO 2016. This work was produced by Corbett et al. under the terms of a commissioning contract issued by the Secretary of State forHealth. This issue may be freely reproduced for the purposes of private research and study and extracts (or indeed, the full report) may be included in professional journalsprovided that suitable acknowledgement is made and the reproduction is not associated with any form of advertising. Applications for commercial reproduction should beaddressed to: NIHR Journals Library, National Institute for Health Research, Evaluation, Trials and Studies Coordinating Centre, Alpha House, University of Southampton SciencePark, Southampton SO16 7NS, UK.
43
Comparison of the rates calculated from the OASIS cohort118 in these studies with those from the studiesby Ramiro124,125 highlight a discrepancy; the latter reported rates of 2 mSASSS units every 2 years, ratherthan the 0.9 units/2 years used here to compare with individual anti-TNFs.
Two very small studies of infliximab reported some inhibiting effect on radiographic progression.122,123
The first123 compared findings in 22 infliximab patients with 34 from the HERNE cohort, over 2, 4, 6 and8 years. Progression as assessed by mSASSS increased equally in infliximab treated patients and in theuntreated HERNE cohort from baseline to 2, 4 and 6 years but then while progression increased onlyslightly in the infliximab group between 6 and 8 years it increased greatly in the HERNE cohort so that at8 years there was a difference in infliximab’s favour of 4.5 mSASSS units. The result was adjusted forbaseline mSASSS (other factors, age, symptom duration, BASDAI, BASFI, etc., were not statisticallysignificant confounders). The other study of 33 patients123 found the mean progression over 4 years was1.6 mSASSS units (SD 2.6 units), lower than the 4.4 units seen in the untreated OASIS cohort118 at 4 years.
Another study examined a cohort of 334 patients with at least two spinal radiographs at 2-year intervals(patients with total spinal fusion at baseline were excluded).121 In this study 201 out of 334 patients hadreceived anti-TNFs for a mean of 2.5 years (SD 2.6 years) and no radiographic abnormality of the spinewas seen at baseline in 144 patients (43%). At follow-up 102 patients (30.5%) showed no progression(≥ 1 mSASSS unit/year). Mulitvariate regression found baseline mSASSS (OR 1.06, 95% CI 1.04 to 1.08),ESR and smoking significantly increased the odds of radiographic progression, but anti-TNF use wassignificantly associated with a > 50% reduction in the (adjusted) odds of progression (0.47, 95% CI 0.24to 0.94). Further analysis that tested factors that could influence exposure to anti-TNFs using propensitymatching confirmed the association with mSASSS and found a stronger association with anti-TNF use(OR 0.30, 95% CI 0.11 to 0.78).
In conclusion, there is evidence of disease progression over time, although the disease course is highlyvariable. Best estimates of yearly disease progression rates without anti-TNF therapy are around 1.0 mSASSSunits and 0.035–0.07 BASFI units. Whether or not there is any impact of anti-TNF treatment is unclear;a beneficial effect can neither be assumed, and nor, given the short-term nature of the follow-up and theinsensitivity of radiography as a tool for the evaluation of disease progression in AS, can one be discounted.
Drug survival and anti-tumour necrosis factor switchingThe EndNote Library generated by the searches for RCTs of all the anti-TNFs were separately screened toidentify patient registry studies of any or all of the anti-TNFs. This was possible because the search strategyfor RCTs was very sensitive and will have identified any clinical study including any of the named anti-TNFs.
A total of 25 potentially relevant studies were screened fully and 12 publications that reported some dataon drug survival or the efficacy of anti-TNFs after switching were identified (see Table 20 for summarydetails of each). Across the 12 studies, the sources of data were either retrospective cohort studies orprospective registers (although analysis plans may have been retrospective), from a range of regions:USA (two studies), Canada (one study) and Europe (nine studies). No data from a UK-based cohort wereavailable. Most of the cohorts and registries included experience with the three oldest anti-TNFs: infliximab,etanercept and adalimumab. One study (of the RHAPSODY cohort) included results from 326 patientstreated with adalimumab as second anti-TNF after infliximab or etanercept. Small numbers of patientsprovided data on golimumab (three studies) and even smaller numbers on certolizumab (two studies).The population in 10 of the 12 studies was AS, although the diagnostic criteria used to specify AS wererarely given. One study provided results specifically for nr-AxSpA and one study provided results for axialSpA (nr-AxSpA or AS).
ASSESSMENT OF CLINICAL EFFECTIVENESS
NIHR Journals Library www.journalslibrary.nihr.ac.uk
44
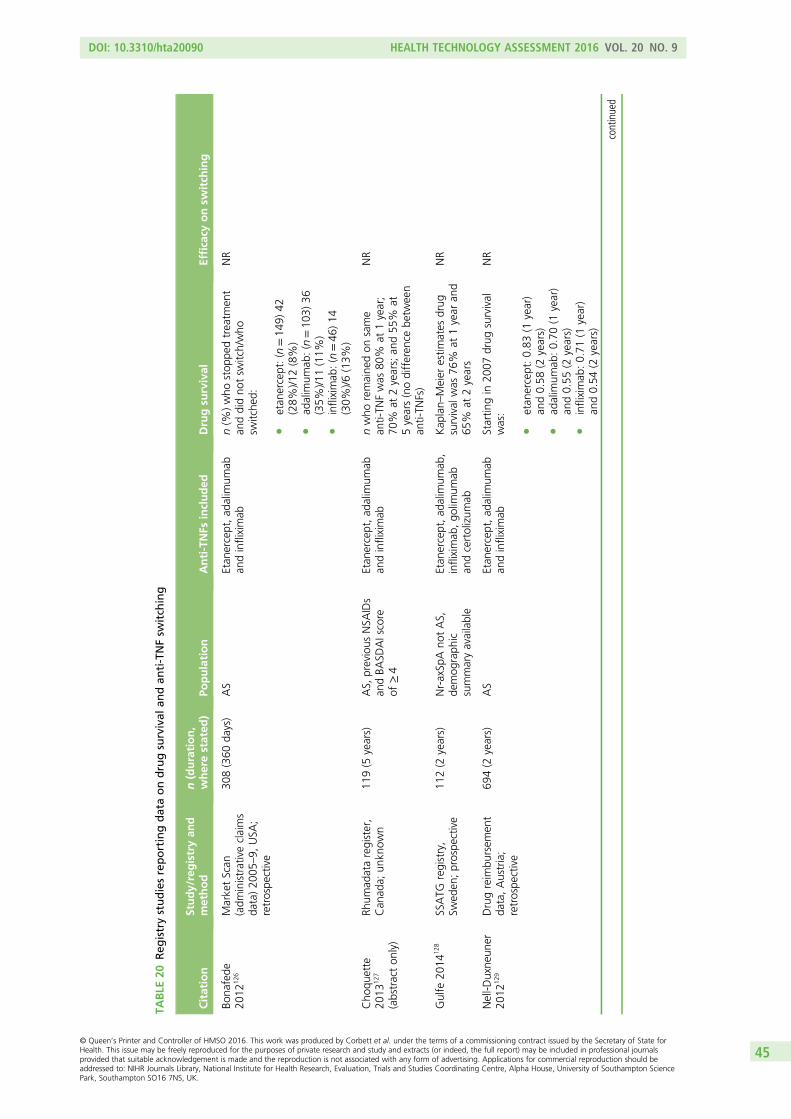
TABLE
20Reg
istrystudiesreportingdataondrugsurvival
andan
ti-TNFsw
itch
ing
Citation
Study/registryan
dmethod
n(duration,
wherestated
)Po
pulation
Anti-TNFs
included
Drugsu
rvival
Efficacy
onsw
itch
ing
Bona
fede
2012
126
MarketScan
(adm
inistrativeclaims
data)20
05–9,
USA
;retrospe
ctive
308(360
days)
AS
Etan
ercept,ad
alim
umab
andinfliximab
n(%
)who
stop
pedtreatm
ent
anddidno
tsw
itch/who
switche
d:
letan
ercept:(n=14
9)42
(28%
)/12(8%)
lad
alim
umab
:(n=10
3)36
(35%
)/11(11%
)l
infliximab
:(n=46
)14
(30%
)/6(13%
)
NR
Cho
quette
2013
127
(abstracton
ly)
Rhum
adataregister,
Can
ada;
unkn
own
119(5
years)
AS,
previous
NSA
IDs
andBA
SDAIscore
of≥4
Etan
ercept,ad
alim
umab
andinfliximab
nwho
remaine
don
same
anti-TN
Fwas
80%
at1year;
70%
at2years;an
d55
%at
5years(nodifferen
cebe
tween
anti-TN
Fs)
NR
Gulfe
2014
128
SSATG
registry,
Swed
en;prospe
ctive
112(2
years)
Nr-axSp
Ano
tAS,
demog
raph
icsummaryavailable
Etan
ercept,ad
alim
umab
,infliximab
,go
limum
aban
dcertolizum
ab
Kap
lan–
Meier
estim
ates
drug
survival
was
76%
at1year
and
65%
at2years
NR
Nell-D
uxne
uner
2012
129
Drugreim
bursem
ent
data,Austria;
retrospe
ctive
694(2
years)
AS
Etan
ercept,ad
alim
umab
andinfliximab
Startin
gin
2007
drug
survival
was:
letan
ercept:0.83
(1year)
and0.58
(2years)
lad
alim
umab
:0.70
(1year)
and0.55
(2years)
linfliximab
:0.71
(1year)
and0.54
(2years)
NR
continued
DOI: 10.3310/hta20090 HEALTH TECHNOLOGY ASSESSMENT 2016 VOL. 20 NO. 9
© Queen’s Printer and Controller of HMSO 2016. This work was produced by Corbett et al. under the terms of a commissioning contract issued by the Secretary of State forHealth. This issue may be freely reproduced for the purposes of private research and study and extracts (or indeed, the full report) may be included in professional journalsprovided that suitable acknowledgement is made and the reproduction is not associated with any form of advertising. Applications for commercial reproduction should beaddressed to: NIHR Journals Library, National Institute for Health Research, Evaluation, Trials and Studies Coordinating Centre, Alpha House, University of Southampton SciencePark, Southampton SO16 7NS, UK.
45
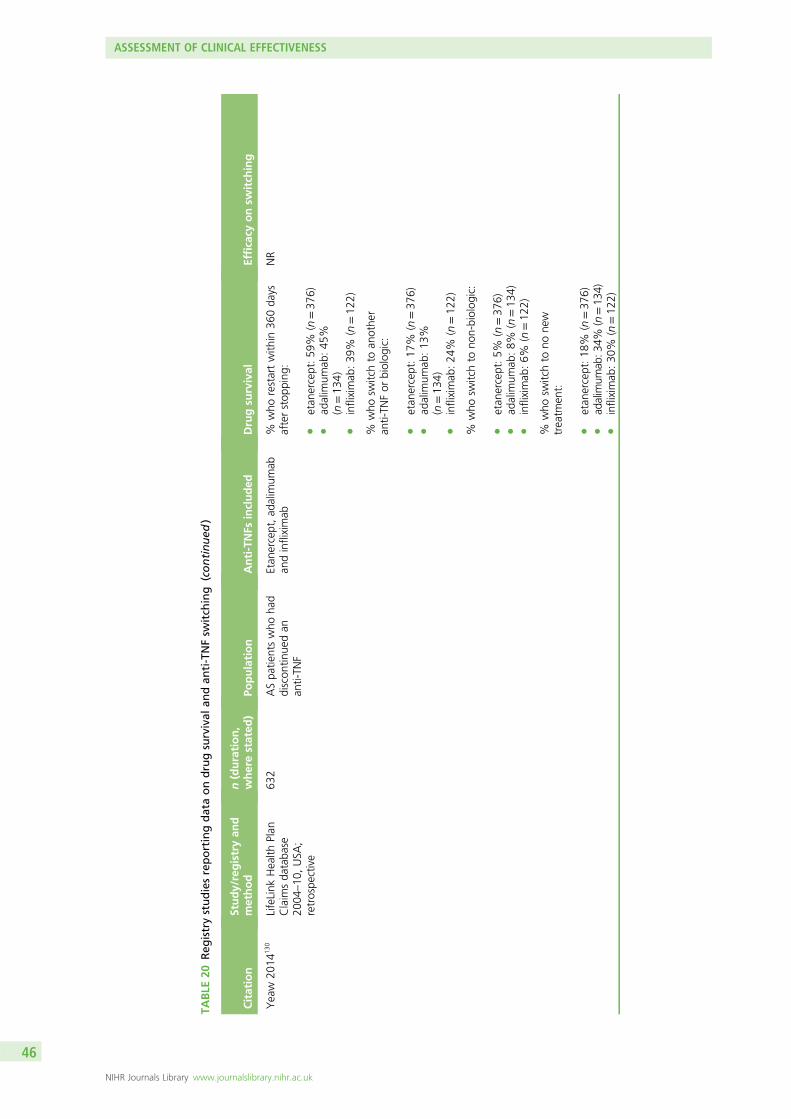
TABLE
20Reg
istrystudiesreportingdataondrugsurvival
andan
ti-TNFsw
itch
ing
(continued
)
Citation
Study/registryan
dmethod
n(duration,
wherestated
)Po
pulation
Anti-TNFs
included
Drugsu
rvival
Efficacy
onsw
itch
ing
Yeaw
2014
130
LifeLink
Health
Plan
Claim
sda
taba
se20
04–10
,USA
;retrospe
ctive
632
ASpa
tientswho
had
discon
tinue
dan
anti-TN
F
Etan
ercept,ad
alim
umab
andinfliximab
%who
restartwith
in36
0da
ysafterstop
ping
:
letan
ercept:59
%(n=37
6)l
adalim
umab
:45
%(n=13
4)l
infliximab
:39
%(n=12
2)
NR
%who
switchto
anothe
ran
ti-TN
For
biolog
ic:
letan
ercept:17
%(n=37
6)l
adalim
umab
:13
%(n=13
4)l
infliximab
:24
%(n=12
2)
%who
switchto
non-biolog
ic:
letan
ercept:5%
(n=37
6)l
adalim
umab
:8%
(n=13
4)l
infliximab
:6%
(n=12
2)
%who
switchto
none
wtreatm
ent:
letan
ercept:18
%(n=37
6)l
adalim
umab
:34%
(n=13
4)l
infliximab
:30
%(n=12
2)
ASSESSMENT OF CLINICAL EFFECTIVENESS
NIHR Journals Library www.journalslibrary.nihr.ac.uk
46
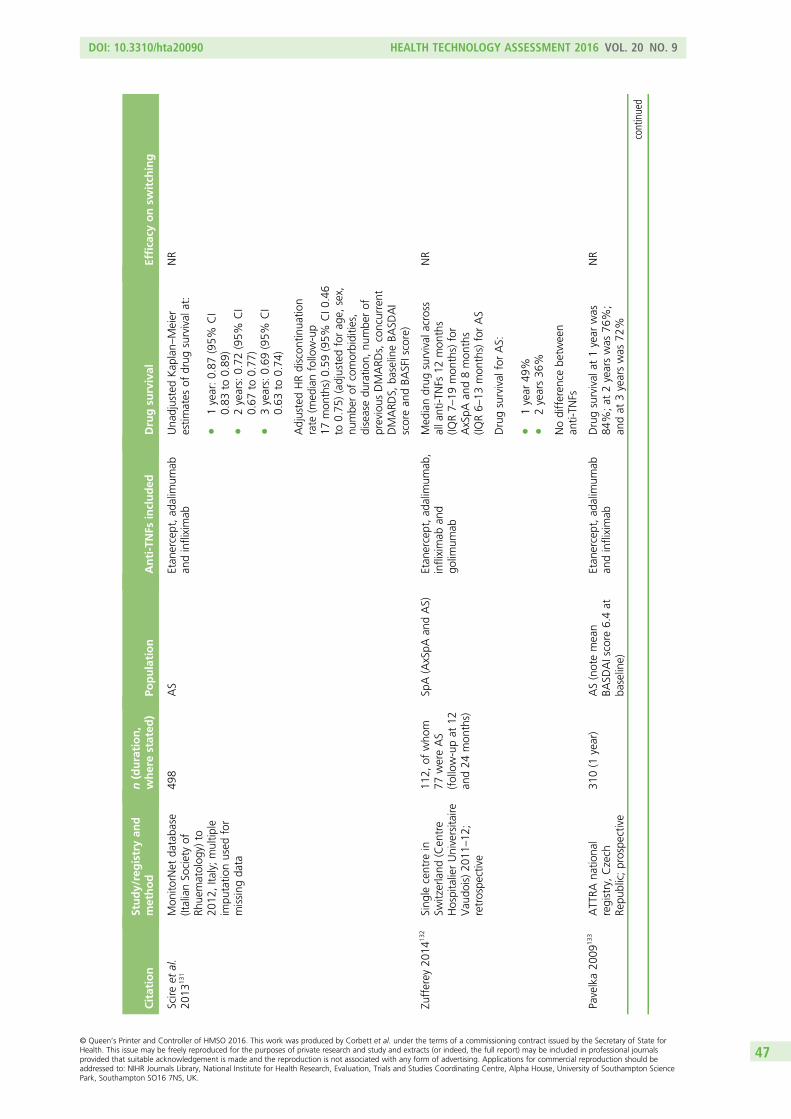
Citation
Study/registryan
dmethod
n(duration,
wherestated
)Po
pulation
Anti-TNFs
included
Drugsu
rvival
Efficacy
onsw
itch
ing
Scire
etal.
2013
131
Mon
itorNet
databa
se(ItalianSo
cietyof
Rhue
matolog
y)to
2012
,Ita
ly;multip
leim
putatio
nused
for
missing
data
498
AS
Etan
ercept,ad
alim
umab
andinfliximab
Una
djustedKap
lan–
Meier
estim
ates
ofdrug
survival
at:
l1year:0.87
(95%
CI
0.83
to0.89
)l
2years:0.72
(95%
CI
0.67
to0.77
)l
3years:0.69
(95%
CI
0.63
to0.74
)
NR
AdjustedHRdiscon
tinua
tion
rate
(med
ianfollow-up
17mon
ths)0.59
(95%
CI0
.46
to0.75
)(adjustedforag
e,sex,
numbe
rof
comorbiditie
s,diseasedu
ratio
n,nu
mbe
rof
previous
DMARD
s,concurrent
DMARD
S,ba
selineBA
SDAI
scorean
dBA
SFIscore)
Zufferey
2014
132
Sing
lecentre
inSw
itzerland
(Cen
tre
HospitalierUniversita
ireVau
dois)20
11–12
;retrospe
ctive
112,
ofwho
m77
wereAS
(follow-upat
12an
d24
mon
ths)
SpA(AxSpA
andAS)
Etan
ercept,ad
alim
umab
,infliximab
and
golim
umab
Med
iandrug
survival
across
alla
nti-T
NFs
12mon
ths
(IQR7–
19mon
ths)for
AxSpA
and8mon
ths
(IQR6–
13mon
ths)forAS
NR
Drugsurvival
forAS:
l1year
49%
l2years36
%
Nodifferen
cebe
tween
anti-TN
Fs
Pavelka20
0913
3ATTRA
natio
nal
registry,Czech
Repu
blic;prospe
ctive
310(1
year)
AS(notemean
BASD
AIscore
6.4at
baseline)
Etan
ercept,ad
alim
umab
andinfliximab
Drugsurvival
at1year
was
84%;at
2yearswas
76%;
andat
3yearswas
72%
NR
continued
DOI: 10.3310/hta20090 HEALTH TECHNOLOGY ASSESSMENT 2016 VOL. 20 NO. 9
© Queen’s Printer and Controller of HMSO 2016. This work was produced by Corbett et al. under the terms of a commissioning contract issued by the Secretary of State forHealth. This issue may be freely reproduced for the purposes of private research and study and extracts (or indeed, the full report) may be included in professional journalsprovided that suitable acknowledgement is made and the reproduction is not associated with any form of advertising. Applications for commercial reproduction should beaddressed to: NIHR Journals Library, National Institute for Health Research, Evaluation, Trials and Studies Coordinating Centre, Alpha House, University of Southampton SciencePark, Southampton SO16 7NS, UK.
47
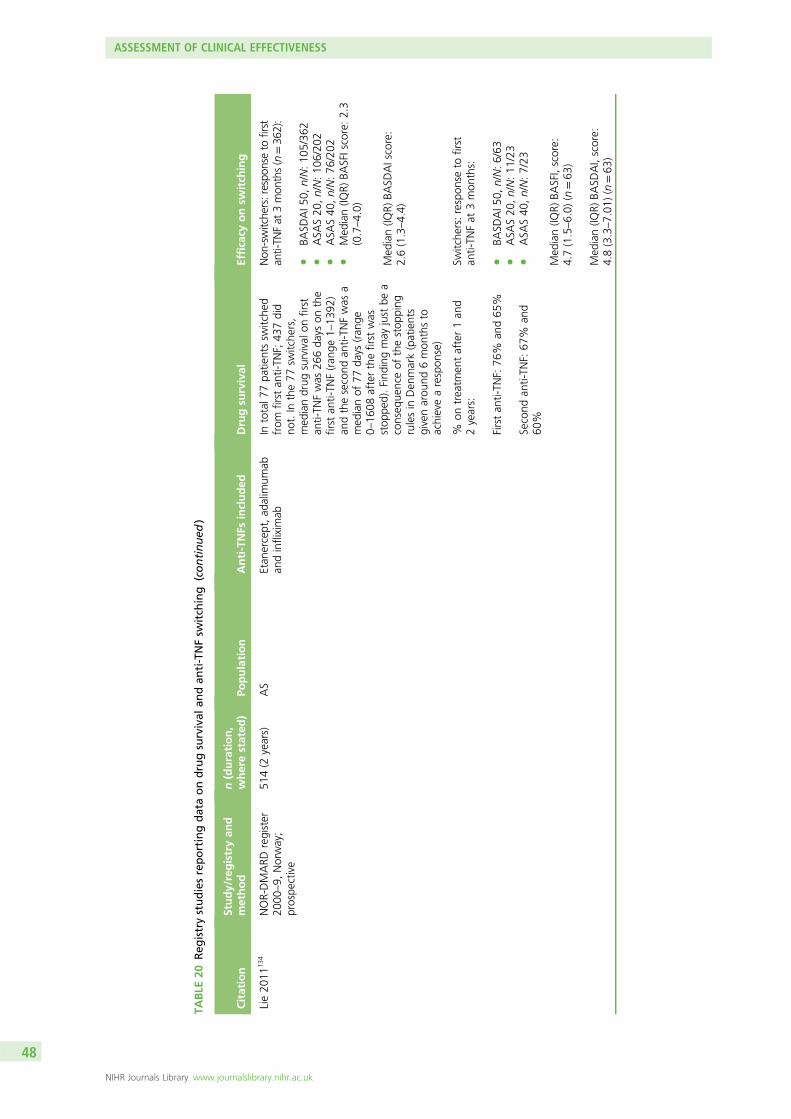
TABLE
20Reg
istrystudiesreportingdataondrugsurvival
andan
ti-TNFsw
itch
ing
(continued
)
Citation
Study/registryan
dmethod
n(duration,
wherestated
)Po
pulation
Anti-TNFs
included
Drugsu
rvival
Efficacy
onsw
itch
ing
Lie20
1113
4NOR-DMARD
register
2000
–9,
Norway;
prospe
ctive
514(2
years)
AS
Etan
ercept,ad
alim
umab
andinfliximab
Intotal7
7pa
tientssw
itche
dfrom
first
anti-TN
F;43
7did
not.In
the77
switche
rs,
med
iandrug
survival
onfirst
anti-TN
Fwas
266da
yson
the
first
anti-TN
F(ran
ge1–
1392
)an
dthesecond
anti-TN
Fwas
amed
ianof
77da
ys(ran
ge0–
1608
afterthefirst
was
stop
ped).Find
ingmay
just
bea
conseq
uenceof
thestop
ping
rulesin
Den
mark(patients
givenarou
nd6mon
thsto
achievearespon
se)
Non
-switche
rs:respo
nseto
first
anti-TN
Fat
3mon
ths(n=36
2):
lBA
SDAI5
0,n/N:10
5/36
2l
ASA
S20
,n/N:10
6/20
2l
ASA
S40
,n/N:76
/202
lMed
ian(IQ
R)BA
SFIscore:2.3
(0.7–4.0)
Med
ian(IQ
R)BA
SDAIscore:
2.6(1.3–4.4)
%on
treatm
entafter1an
d2years:
Firstan
ti-TN
F:76
%an
d65
%
Second
anti-TN
F:67
%an
d60
%
Switche
rs:respon
seto
first
anti-TN
Fat
3mon
ths:
lBA
SDAI5
0,n/N:6/63
lASA
S20
,n/N:11
/23
lASA
S40
,n/N:7/23
Med
ian(IQ
R)BA
SFI,score:
4.7(1.5–6.0)
(n=63
)
Med
ian(IQ
R)BA
SDAI,score:
4.8(3.3–7.01
)(n=63
)
ASSESSMENT OF CLINICAL EFFECTIVENESS
NIHR Journals Library www.journalslibrary.nihr.ac.uk
48
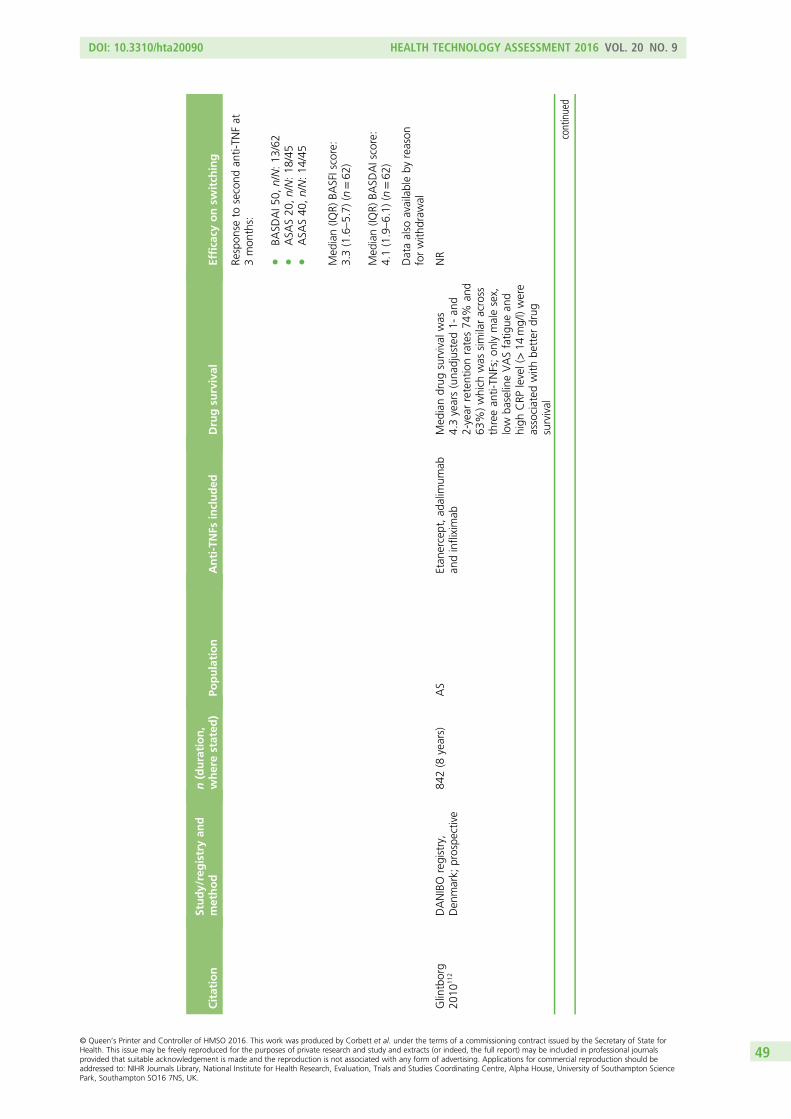
Citation
Study/registryan
dmethod
n(duration,
wherestated
)Po
pulation
Anti-TNFs
included
Drugsu
rvival
Efficacy
onsw
itch
ing
Respon
seto
second
anti-TN
Fat
3mon
ths:
lBA
SDAI5
0,n/N:13
/62
lASA
S20
,n/N:18
/45
lASA
S40
,n/N:14
/45
Med
ian(IQ
R)BA
SFIscore:
3.3(1.6–5.7)
(n=62
)
Med
ian(IQ
R)BA
SDAIscore:
4.1(1.9–6.1)
(n=62
)
Dataalso
availableby
reason
forwith
draw
al
Glintborg
2010
112
DANIBO
registry,
Den
mark;
prospe
ctive
842(8
years)
AS
Etan
ercept,ad
alim
umab
andinfliximab
Med
iandrug
survival
was
4.3years(una
djusted1-
and
2-year
retentionrates74
%an
d63
%)which
was
similaracross
threean
ti-TN
Fs;on
lymalesex,
low
baselineVASfatig
uean
dhigh
CRP
level(>14
mg/l)were
associated
with
better
drug
survival
NR
continued
DOI: 10.3310/hta20090 HEALTH TECHNOLOGY ASSESSMENT 2016 VOL. 20 NO. 9
© Queen’s Printer and Controller of HMSO 2016. This work was produced by Corbett et al. under the terms of a commissioning contract issued by the Secretary of State forHealth. This issue may be freely reproduced for the purposes of private research and study and extracts (or indeed, the full report) may be included in professional journalsprovided that suitable acknowledgement is made and the reproduction is not associated with any form of advertising. Applications for commercial reproduction should beaddressed to: NIHR Journals Library, National Institute for Health Research, Evaluation, Trials and Studies Coordinating Centre, Alpha House, University of Southampton SciencePark, Southampton SO16 7NS, UK.
49
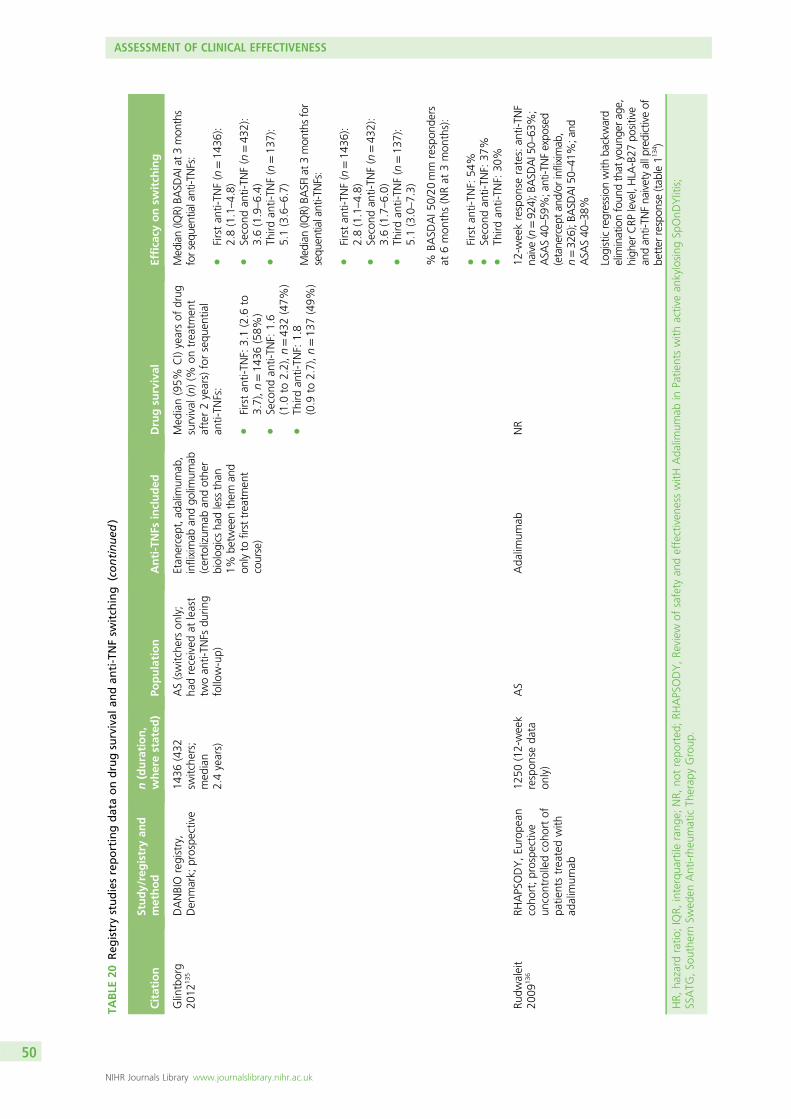
TABLE
20Reg
istrystudiesreportingdataondrugsurvival
andan
ti-TNFsw
itch
ing
(continued
)
Citation
Study/registryan
dmethod
n(duration,
wherestated
)Po
pulation
Anti-TNFs
included
Drugsu
rvival
Efficacy
onsw
itch
ing
Glintborg
2012
135
DANBIO
registry,
Den
mark;
prospe
ctive
1436
(432
switche
rs;
med
ian
2.4years)
AS(switche
rson
ly;
hadreceived
atleast
twoan
ti-TN
Fsdu
ring
follow-up)
Etan
ercept,a
dalim
umab
,infliximab
andgo
limum
ab(certolizum
aban
dothe
rbiolog
icsha
dless
than
1%be
tweenthem
and
onlyto
firsttreatm
ent
course)
Med
ian(95%
CI)yearsof
drug
survival
(n)(%
ontreatm
ent
after2years)forsequ
entia
lan
ti-TN
Fs:
lFirstan
ti-TN
F:3.1(2.6
to3.7),n=14
36(58%
)l
Second
anti-TN
F:1.6
(1.0
to2.2),n=43
2(47%
)l
Third
anti-TN
F:1.8
(0.9
to2.7),n=13
7(49%
)
Median(IQ
R)BA
SDAIat3
mon
ths
forsequ
entialanti-TNFs:
lFirstan
ti-TN
F(n=14
36):
2.8(1.1–4.8)
lSecond
anti-TN
F(n=43
2):
3.6(1.9–6.4)
lTh
irdan
ti-TN
F(n=13
7):
5.1(3.6–6.7)
Med
ian(IQ
R)BA
SFIat3mon
thsfor
sequ
entialanti-TNFs:
lFirstan
ti-TN
F(n=14
36):
2.8(1.1–4.8)
lSecond
anti-TN
F(n=43
2):
3.6(1.7–6.0)
lTh
irdan
ti-TN
F(n=13
7):
5.1(3.0–7.3)
%BA
SDAI5
0/20
mm
respon
ders
at6mon
ths(NRat
3mon
ths):
lFirstan
ti-TN
F:54
%l
Second
anti-TN
F:37
%l
Third
anti-TN
F:30
%
Rudw
aleit
2009
136
RHAPSODY,Eu
rope
ancoho
rt;prospe
ctive
uncontrolledcoho
rtof
patie
ntstreatedwith
adalim
umab
1250
(12-week
respon
seda
taon
ly)
AS
Ada
limum
abNR
12-w
eekrespon
serates:an
ti-TN
Fna
ive(n=92
4);B
ASD
AI50–
63%;
ASA
S40
–59
%;anti-TNFexpo
sed
(etane
rcep
tan
d/or
infliximab
,n=32
6);B
ASD
AI50–
41%;and
ASA
S40
–38
%
Logisticregression
with
backward
elim
inationfoun
dthat
youn
gera
ge,
high
erCRP
level,HLA
-B27
positive
andan
ti-TN
Fna
ivetyallpredictiveof
better
respon
se(tab
le11
34)
HR,
hazard
ratio
;IQR,
interqua
rtile
rang
e;NR,
notrepo
rted
;RH
APSODY,Re
view
ofsafety
andeffectiven
esswitH
Ada
limum
abin
Patie
ntswith
activean
kylosing
SpOnD
Ylitis;
SSATG
,So
uthe
rnSw
eden
Anti-rhe
umaticTh
erap
yGroup
.
ASSESSMENT OF CLINICAL EFFECTIVENESS
NIHR Journals Library www.journalslibrary.nihr.ac.uk
50
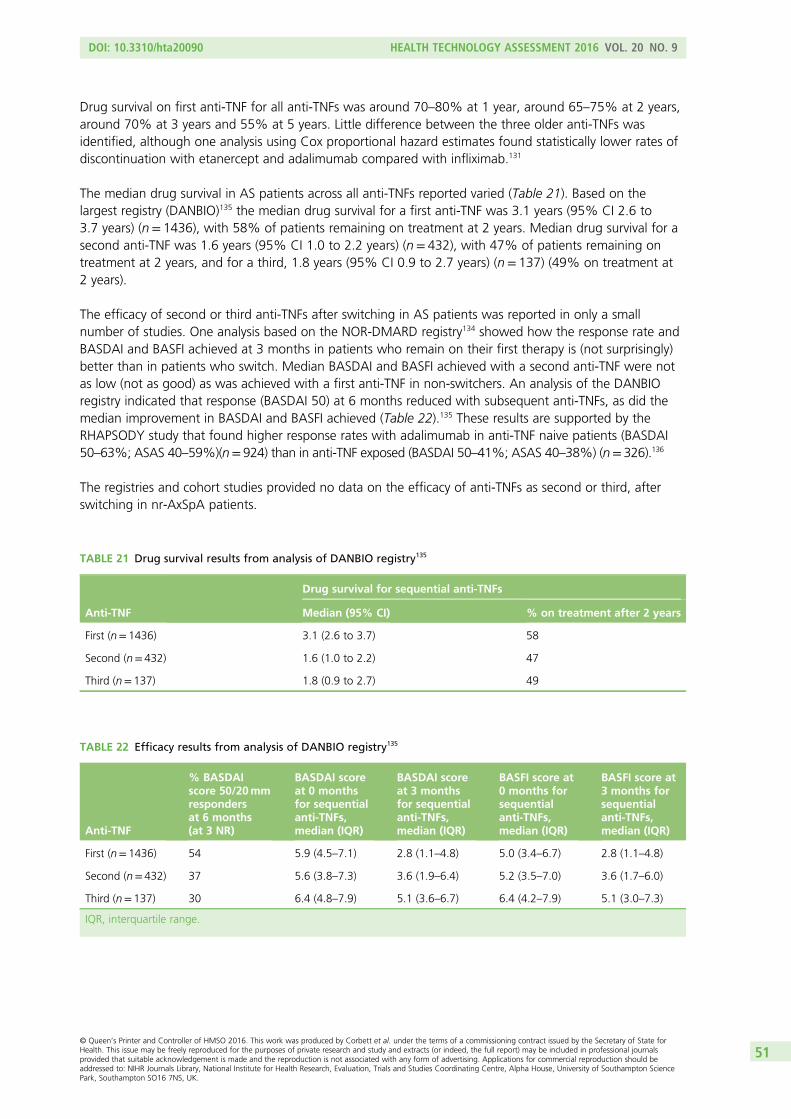
Drug survival on first anti-TNF for all anti-TNFs was around 70–80% at 1 year, around 65–75% at 2 years,around 70% at 3 years and 55% at 5 years. Little difference between the three older anti-TNFs wasidentified, although one analysis using Cox proportional hazard estimates found statistically lower rates ofdiscontinuation with etanercept and adalimumab compared with infliximab.131
The median drug survival in AS patients across all anti-TNFs reported varied (Table 21). Based on thelargest registry (DANBIO)135 the median drug survival for a first anti-TNF was 3.1 years (95% CI 2.6 to3.7 years) (n= 1436), with 58% of patients remaining on treatment at 2 years. Median drug survival for asecond anti-TNF was 1.6 years (95% CI 1.0 to 2.2 years) (n= 432), with 47% of patients remaining ontreatment at 2 years, and for a third, 1.8 years (95% CI 0.9 to 2.7 years) (n= 137) (49% on treatment at2 years).
The efficacy of second or third anti-TNFs after switching in AS patients was reported in only a smallnumber of studies. One analysis based on the NOR-DMARD registry134 showed how the response rate andBASDAI and BASFI achieved at 3 months in patients who remain on their first therapy is (not surprisingly)better than in patients who switch. Median BASDAI and BASFI achieved with a second anti-TNF were notas low (not as good) as was achieved with a first anti-TNF in non-switchers. An analysis of the DANBIOregistry indicated that response (BASDAI 50) at 6 months reduced with subsequent anti-TNFs, as did themedian improvement in BASDAI and BASFI achieved (Table 22).135 These results are supported by theRHAPSODY study that found higher response rates with adalimumab in anti-TNF naive patients (BASDAI50–63%; ASAS 40–59%)(n= 924) than in anti-TNF exposed (BASDAI 50–41%; ASAS 40–38%) (n= 326).136
The registries and cohort studies provided no data on the efficacy of anti-TNFs as second or third, afterswitching in nr-AxSpA patients.
TABLE 21 Drug survival results from analysis of DANBIO registry135
Anti-TNF
Drug survival for sequential anti-TNFs
Median (95% CI) % on treatment after 2 years
First (n= 1436) 3.1 (2.6 to 3.7) 58
Second (n= 432) 1.6 (1.0 to 2.2) 47
Third (n= 137) 1.8 (0.9 to 2.7) 49
TABLE 22 Efficacy results from analysis of DANBIO registry135
Anti-TNF
% BASDAIscore 50/20mmrespondersat 6 months(at 3 NR)
BASDAI scoreat 0 monthsfor sequentialanti-TNFs,median (IQR)
BASDAI scoreat 3 monthsfor sequentialanti-TNFs,median (IQR)
BASFI score at0 months forsequentialanti-TNFs,median (IQR)
BASFI score at3 months forsequentialanti-TNFs,median (IQR)
First (n= 1436) 54 5.9 (4.5–7.1) 2.8 (1.1–4.8) 5.0 (3.4–6.7) 2.8 (1.1–4.8)
Second (n= 432) 37 5.6 (3.8–7.3) 3.6 (1.9–6.4) 5.2 (3.5–7.0) 3.6 (1.7–6.0)
Third (n= 137) 30 6.4 (4.8–7.9) 5.1 (3.6–6.7) 6.4 (4.2–7.9) 5.1 (3.0–7.3)
IQR, interquartile range.
DOI: 10.3310/hta20090 HEALTH TECHNOLOGY ASSESSMENT 2016 VOL. 20 NO. 9
© Queen’s Printer and Controller of HMSO 2016. This work was produced by Corbett et al. under the terms of a commissioning contract issued by the Secretary of State forHealth. This issue may be freely reproduced for the purposes of private research and study and extracts (or indeed, the full report) may be included in professional journalsprovided that suitable acknowledgement is made and the reproduction is not associated with any form of advertising. Applications for commercial reproduction should beaddressed to: NIHR Journals Library, National Institute for Health Research, Evaluation, Trials and Studies Coordinating Centre, Alpha House, University of Southampton SciencePark, Southampton SO16 7NS, UK.
51
In summary, sequential treatment with anti-TNFs can be worthwhile in patients with AS but the responserates and benefits are reduced with second and third anti-TNFs, with the proportion of BASDAI 50responders falling approximately 10% with each subsequent anti-TNF and the median BASDAI and BASFIsachieved increasing (worsening). The lower efficacy of a second anti-TNF relative to a first is reflected inlower median drug survival and proportion of patients remaining on therapy at 2 years. Interestingly,despite a further reduction in response and efficacy with a third anti-TNF, drug survival does not fall,suggesting that at this stage in their treatment history patients may continue with a less than optimallyeffective anti-TNF given any better alternative.
Clinical effectiveness results: adverse events
Randomised trialsWe focused on the following outcomes, known to have possible associations with anti-TNF treatment:serious infections, tuberculosis (including tuberculosis reactivation), injection/infusion site reactions,congestive heart failure, cancer, non-melanoma skin cancer, SAEs and withdrawals due to SAEs. For therandomised phases of the trials included in the review, the reporting of AE data was generally limited.For three of the 24 trials no information on AEs was available.55,56,74 Several trials provided AE data onlyat time points after which placebo patients may have switched to receive an anti-TNF (so true placebocomparisons were not available).
Analysable data on injection/infusion site reactions were available for 10 trials, although these studies wereonly of etanercept or infliximab. The data for certolizumab, golimumab and adalimumab trials eitherwere not reported or were only provided at time points after which placebo patients could ‘escape’ toreceive an anti-TNF; these data would not allow for an accurate comparison with placebo. Results forinjection/infusion site reactions analyses from this review for etanercept and infliximab showed a statisticallysignificant increase in reactions associated with etanercept (relative risk 2.69, 95% CrI 1.82 to 3.89)compared with placebo but no significant difference between infliximab and placebo. Compared with eachother, the risk of an injection/infusion site reaction was statistically significantly higher with etanercept thanwith infliximab (relative risk 2.27, 95% CrI 1.01 to 5.37). Incidence of serious infections was reported inonly eight trials, although such events were rare (nine cases in total). Of the eight trials which reportedincidence of tuberculosis, only four cases were identified; three cases were reported in the longest study,the 54-week trial which compared infliximab with an infliximab biosimilar (CT-P13).110 Four trials reportedon congestive heart failure (no cases reported), six trials reported on cancer (one case) and three trialsreported on non-melanoma skin cancer (two cases, one in each group of the ABILITY-158 trial). In most trialsfew SAEs were reported; group rates ranged from 0% to around 9%. Similarly, most trials had fewwithdrawals because of AEs; rates ranged from 0% to around 12%. Full results are reported in Appendix 9.
Large systematic reviewsOverall, the number and size of trials, and the short duration of their placebo-controlled phases, were toolimited to provide enough data for meaningful analyses of AE. This common problem, of having too fewdata to evaluate AEs, underpinned the rationale for a Cochrane review (and network meta-analysis) of AEsof nine biologics in adults with any disease, except HIV/AIDS.137 In order to provide a better understandingof toxicity, data were pooled across diseases by assuming a similar rate of AEs (across diseases). For thepresent assessment, estimates of AE rates have therefore been derived from the Cochrane review, whichincluded 160 RCTs (n= 48,676) and 46 open-label extension studies (n= 11,954). The median durationswere 6 months for RCTs and 13 months for open-label extension studies. The biologics included wereabatacept, adalimumab, anakinra, certolizumab pegol, etanercept, golimumab, infliximab, rituzimab andtocilizumab. The anti-TNFs included in the present assessment were studied in 115 (72%) of the RCTs and40 (87%) of the open-label studies included in the Cochrane review. Most studies assessed etanercept orinfliximab in cancer or rheumatoid arthritis patients; 10 RCTs were of AS (fewer than in this assessment,as in the Cochrane review databases were searched up until January 2010). The biologics were evaluatedboth as a group and as individual interventions. The results from the RCTs, what the review classified as
ASSESSMENT OF CLINICAL EFFECTIVENESS
NIHR Journals Library www.journalslibrary.nihr.ac.uk
52
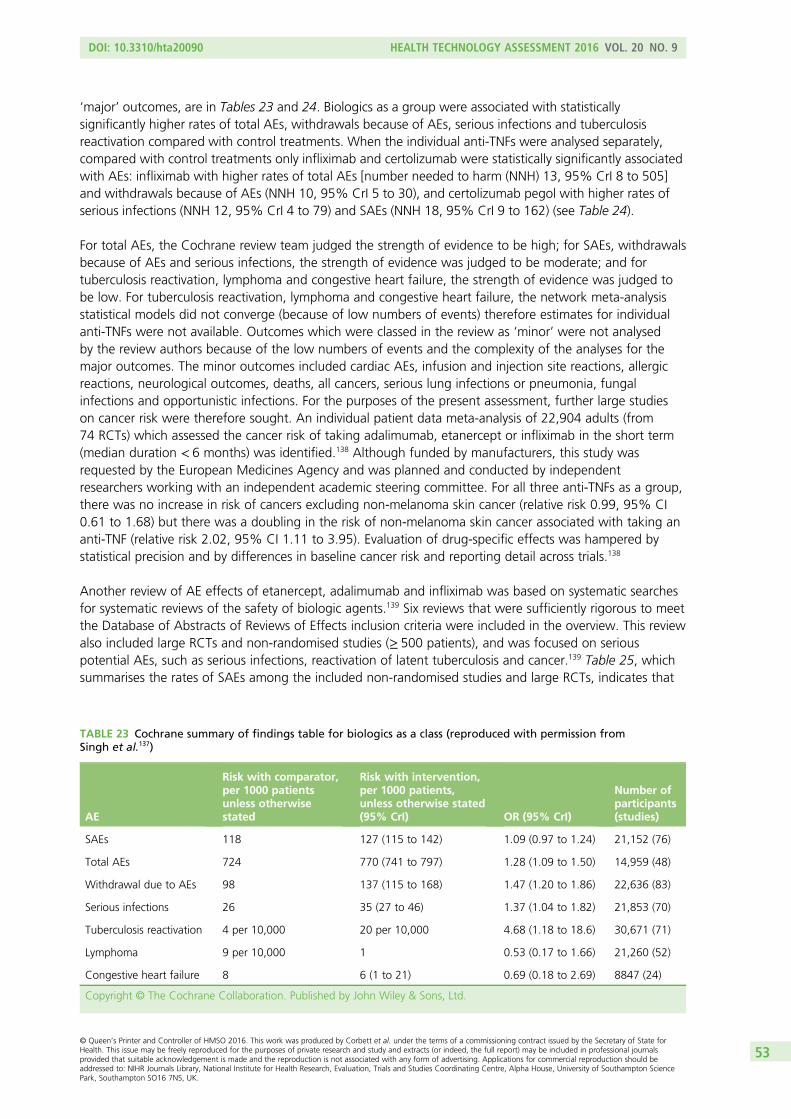
‘major’ outcomes, are in Tables 23 and 24. Biologics as a group were associated with statisticallysignificantly higher rates of total AEs, withdrawals because of AEs, serious infections and tuberculosisreactivation compared with control treatments. When the individual anti-TNFs were analysed separately,compared with control treatments only infliximab and certolizumab were statistically significantly associatedwith AEs: infliximab with higher rates of total AEs [number needed to harm (NNH) 13, 95% CrI 8 to 505]and withdrawals because of AEs (NNH 10, 95% CrI 5 to 30), and certolizumab pegol with higher rates ofserious infections (NNH 12, 95% CrI 4 to 79) and SAEs (NNH 18, 95% CrI 9 to 162) (see Table 24).
For total AEs, the Cochrane review team judged the strength of evidence to be high; for SAEs, withdrawalsbecause of AEs and serious infections, the strength of evidence was judged to be moderate; and fortuberculosis reactivation, lymphoma and congestive heart failure, the strength of evidence was judged tobe low. For tuberculosis reactivation, lymphoma and congestive heart failure, the network meta-analysisstatistical models did not converge (because of low numbers of events) therefore estimates for individualanti-TNFs were not available. Outcomes which were classed in the review as ‘minor’ were not analysedby the review authors because of the low numbers of events and the complexity of the analyses for themajor outcomes. The minor outcomes included cardiac AEs, infusion and injection site reactions, allergicreactions, neurological outcomes, deaths, all cancers, serious lung infections or pneumonia, fungalinfections and opportunistic infections. For the purposes of the present assessment, further large studieson cancer risk were therefore sought. An individual patient data meta-analysis of 22,904 adults (from74 RCTs) which assessed the cancer risk of taking adalimumab, etanercept or infliximab in the short term(median duration < 6 months) was identified.138 Although funded by manufacturers, this study wasrequested by the European Medicines Agency and was planned and conducted by independentresearchers working with an independent academic steering committee. For all three anti-TNFs as a group,there was no increase in risk of cancers excluding non-melanoma skin cancer (relative risk 0.99, 95% CI0.61 to 1.68) but there was a doubling in the risk of non-melanoma skin cancer associated with taking ananti-TNF (relative risk 2.02, 95% CI 1.11 to 3.95). Evaluation of drug-specific effects was hampered bystatistical precision and by differences in baseline cancer risk and reporting detail across trials.138
Another review of AE effects of etanercept, adalimumab and infliximab was based on systematic searchesfor systematic reviews of the safety of biologic agents.139 Six reviews that were sufficiently rigorous to meetthe Database of Abstracts of Reviews of Effects inclusion criteria were included in the overview. This reviewalso included large RCTs and non-randomised studies (≥ 500 patients), and was focused on seriouspotential AEs, such as serious infections, reactivation of latent tuberculosis and cancer.139 Table 25, whichsummarises the rates of SAEs among the included non-randomised studies and large RCTs, indicates that
TABLE 23 Cochrane summary of findings table for biologics as a class (reproduced with permission fromSingh et al.137)
AE
Risk with comparator,per 1000 patientsunless otherwisestated
Risk with intervention,per 1000 patients,unless otherwise stated(95% CrI) OR (95% CrI)
Number ofparticipants(studies)
SAEs 118 127 (115 to 142) 1.09 (0.97 to 1.24) 21,152 (76)
Total AEs 724 770 (741 to 797) 1.28 (1.09 to 1.50) 14,959 (48)
Withdrawal due to AEs 98 137 (115 to 168) 1.47 (1.20 to 1.86) 22,636 (83)
Serious infections 26 35 (27 to 46) 1.37 (1.04 to 1.82) 21,853 (70)
Tuberculosis reactivation 4 per 10,000 20 per 10,000 4.68 (1.18 to 18.6) 30,671 (71)
Lymphoma 9 per 10,000 1 0.53 (0.17 to 1.66) 21,260 (52)
Congestive heart failure 8 6 (1 to 21) 0.69 (0.18 to 2.69) 8847 (24)
Copyright © The Cochrane Collaboration. Published by John Wiley & Sons, Ltd.
DOI: 10.3310/hta20090 HEALTH TECHNOLOGY ASSESSMENT 2016 VOL. 20 NO. 9
© Queen’s Printer and Controller of HMSO 2016. This work was produced by Corbett et al. under the terms of a commissioning contract issued by the Secretary of State forHealth. This issue may be freely reproduced for the purposes of private research and study and extracts (or indeed, the full report) may be included in professional journalsprovided that suitable acknowledgement is made and the reproduction is not associated with any form of advertising. Applications for commercial reproduction should beaddressed to: NIHR Journals Library, National Institute for Health Research, Evaluation, Trials and Studies Coordinating Centre, Alpha House, University of Southampton SciencePark, Southampton SO16 7NS, UK.
53
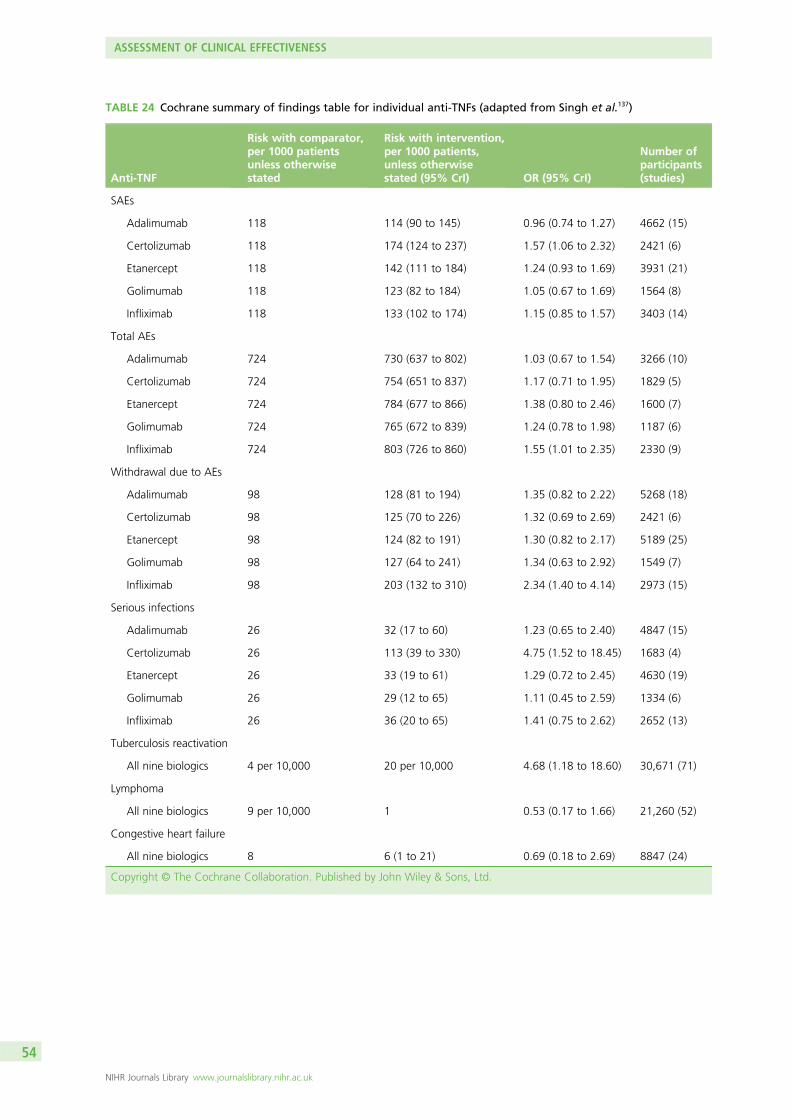
TABLE 24 Cochrane summary of findings table for individual anti-TNFs (adapted from Singh et al.137)
Anti-TNF
Risk with comparator,per 1000 patientsunless otherwisestated
Risk with intervention,per 1000 patients,unless otherwisestated (95% CrI) OR (95% CrI)
Number ofparticipants(studies)
SAEs
Adalimumab 118 114 (90 to 145) 0.96 (0.74 to 1.27) 4662 (15)
Certolizumab 118 174 (124 to 237) 1.57 (1.06 to 2.32) 2421 (6)
Etanercept 118 142 (111 to 184) 1.24 (0.93 to 1.69) 3931 (21)
Golimumab 118 123 (82 to 184) 1.05 (0.67 to 1.69) 1564 (8)
Infliximab 118 133 (102 to 174) 1.15 (0.85 to 1.57) 3403 (14)
Total AEs
Adalimumab 724 730 (637 to 802) 1.03 (0.67 to 1.54) 3266 (10)
Certolizumab 724 754 (651 to 837) 1.17 (0.71 to 1.95) 1829 (5)
Etanercept 724 784 (677 to 866) 1.38 (0.80 to 2.46) 1600 (7)
Golimumab 724 765 (672 to 839) 1.24 (0.78 to 1.98) 1187 (6)
Infliximab 724 803 (726 to 860) 1.55 (1.01 to 2.35) 2330 (9)
Withdrawal due to AEs
Adalimumab 98 128 (81 to 194) 1.35 (0.82 to 2.22) 5268 (18)
Certolizumab 98 125 (70 to 226) 1.32 (0.69 to 2.69) 2421 (6)
Etanercept 98 124 (82 to 191) 1.30 (0.82 to 2.17) 5189 (25)
Golimumab 98 127 (64 to 241) 1.34 (0.63 to 2.92) 1549 (7)
Infliximab 98 203 (132 to 310) 2.34 (1.40 to 4.14) 2973 (15)
Serious infections
Adalimumab 26 32 (17 to 60) 1.23 (0.65 to 2.40) 4847 (15)
Certolizumab 26 113 (39 to 330) 4.75 (1.52 to 18.45) 1683 (4)
Etanercept 26 33 (19 to 61) 1.29 (0.72 to 2.45) 4630 (19)
Golimumab 26 29 (12 to 65) 1.11 (0.45 to 2.59) 1334 (6)
Infliximab 26 36 (20 to 65) 1.41 (0.75 to 2.62) 2652 (13)
Tuberculosis reactivation
All nine biologics 4 per 10,000 20 per 10,000 4.68 (1.18 to 18.60) 30,671 (71)
Lymphoma
All nine biologics 9 per 10,000 1 0.53 (0.17 to 1.66) 21,260 (52)
Congestive heart failure
All nine biologics 8 6 (1 to 21) 0.69 (0.18 to 2.69) 8847 (24)
Copyright © The Cochrane Collaboration. Published by John Wiley & Sons, Ltd.
ASSESSMENT OF CLINICAL EFFECTIVENESS
NIHR Journals Library www.journalslibrary.nihr.ac.uk
54
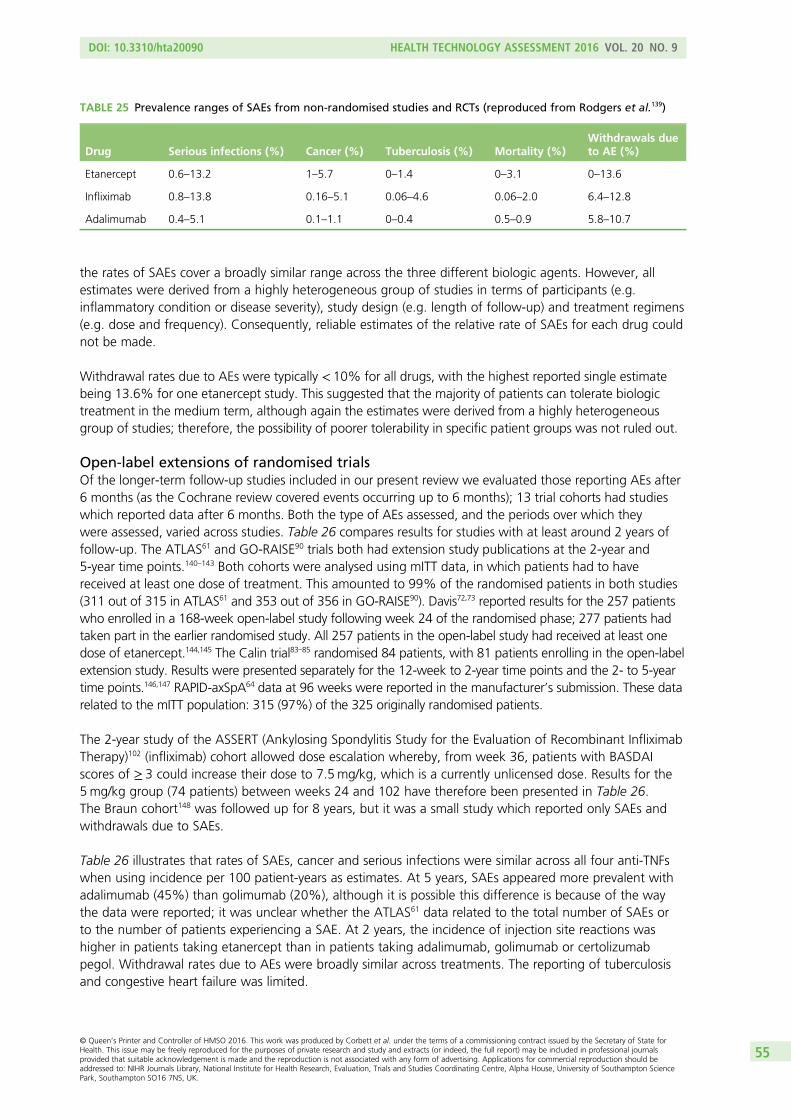
the rates of SAEs cover a broadly similar range across the three different biologic agents. However, allestimates were derived from a highly heterogeneous group of studies in terms of participants (e.g.inflammatory condition or disease severity), study design (e.g. length of follow-up) and treatment regimens(e.g. dose and frequency). Consequently, reliable estimates of the relative rate of SAEs for each drug couldnot be made.
Withdrawal rates due to AEs were typically < 10% for all drugs, with the highest reported single estimatebeing 13.6% for one etanercept study. This suggested that the majority of patients can tolerate biologictreatment in the medium term, although again the estimates were derived from a highly heterogeneousgroup of studies; therefore, the possibility of poorer tolerability in specific patient groups was not ruled out.
Open-label extensions of randomised trialsOf the longer-term follow-up studies included in our present review we evaluated those reporting AEs after6 months (as the Cochrane review covered events occurring up to 6 months); 13 trial cohorts had studieswhich reported data after 6 months. Both the type of AEs assessed, and the periods over which theywere assessed, varied across studies. Table 26 compares results for studies with at least around 2 years offollow-up. The ATLAS61 and GO-RAISE90 trials both had extension study publications at the 2-year and5-year time points.140–143 Both cohorts were analysed using mITT data, in which patients had to havereceived at least one dose of treatment. This amounted to 99% of the randomised patients in both studies(311 out of 315 in ATLAS61 and 353 out of 356 in GO-RAISE90). Davis72,73 reported results for the 257 patientswho enrolled in a 168-week open-label study following week 24 of the randomised phase; 277 patients hadtaken part in the earlier randomised study. All 257 patients in the open-label study had received at least onedose of etanercept.144,145 The Calin trial83–85 randomised 84 patients, with 81 patients enrolling in the open-labelextension study. Results were presented separately for the 12-week to 2-year time points and the 2- to 5-yeartime points.146,147 RAPID-axSpA64 data at 96 weeks were reported in the manufacturer’s submission. These datarelated to the mITT population: 315 (97%) of the 325 originally randomised patients.
The 2-year study of the ASSERT (Ankylosing Spondylitis Study for the Evaluation of Recombinant InfliximabTherapy)102 (infliximab) cohort allowed dose escalation whereby, from week 36, patients with BASDAIscores of ≥ 3 could increase their dose to 7.5mg/kg, which is a currently unlicensed dose. Results for the5mg/kg group (74 patients) between weeks 24 and 102 have therefore been presented in Table 26.The Braun cohort148 was followed up for 8 years, but it was a small study which reported only SAEs andwithdrawals due to SAEs.
Table 26 illustrates that rates of SAEs, cancer and serious infections were similar across all four anti-TNFswhen using incidence per 100 patient-years as estimates. At 5 years, SAEs appeared more prevalent withadalimumab (45%) than golimumab (20%), although it is possible this difference is because of the waythe data were reported; it was unclear whether the ATLAS61 data related to the total number of SAEs orto the number of patients experiencing a SAE. At 2 years, the incidence of injection site reactions washigher in patients taking etanercept than in patients taking adalimumab, golimumab or certolizumabpegol. Withdrawal rates due to AEs were broadly similar across treatments. The reporting of tuberculosisand congestive heart failure was limited.
TABLE 25 Prevalence ranges of SAEs from non-randomised studies and RCTs (reproduced from Rodgers et al.139)
Drug Serious infections (%) Cancer (%) Tuberculosis (%) Mortality (%)Withdrawals dueto AE (%)
Etanercept 0.6–13.2 1–5.7 0–1.4 0–3.1 0–13.6
Infliximab 0.8–13.8 0.16–5.1 0.06–4.6 0.06–2.0 6.4–12.8
Adalimumab 0.4–5.1 0.1–1.1 0–0.4 0.5–0.9 5.8–10.7
DOI: 10.3310/hta20090 HEALTH TECHNOLOGY ASSESSMENT 2016 VOL. 20 NO. 9
© Queen’s Printer and Controller of HMSO 2016. This work was produced by Corbett et al. under the terms of a commissioning contract issued by the Secretary of State forHealth. This issue may be freely reproduced for the purposes of private research and study and extracts (or indeed, the full report) may be included in professional journalsprovided that suitable acknowledgement is made and the reproduction is not associated with any form of advertising. Applications for commercial reproduction should beaddressed to: NIHR Journals Library, National Institute for Health Research, Evaluation, Trials and Studies Coordinating Centre, Alpha House, University of Southampton SciencePark, Southampton SO16 7NS, UK.
55
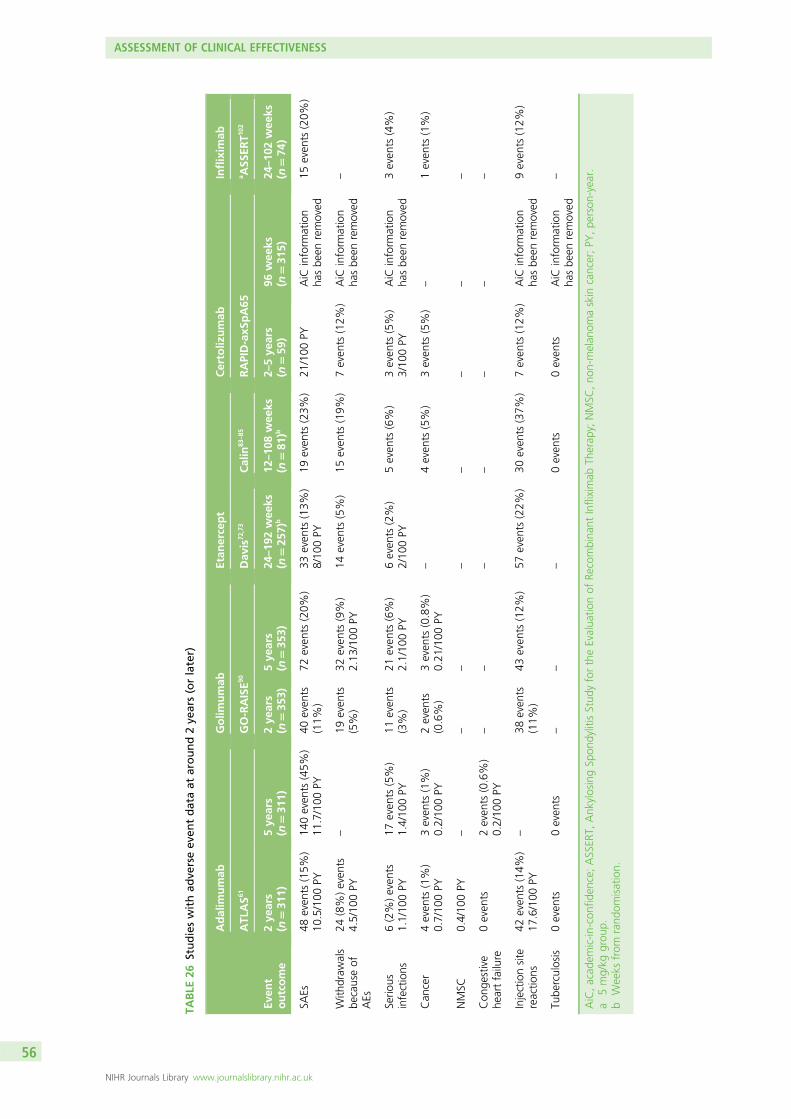
TABLE
26Studieswithad
verseev
entdataat
around2ye
ars(orlater)
Even
toutcome
Adalim
umab
Golim
umab
Etan
ercept
Certoliz
umab
Inflixim
ab
ATL
AS6
1GO-RAISE9
0Dav
is72
,73
Calin
83–85
RAPID-axS
pA65
a ASS
ERT1
02
2ye
ars
(n=31
1)5ye
ars
(n=31
1)2ye
ars
(n=35
3)5ye
ars
(n=35
3)24
–19
2wee
ks(n
=25
7)b
12–10
8wee
ks(n
=81
)b2–
5ye
ars
(n=59
)96
wee
ks(n
=31
5)24
–10
2wee
ks(n
=74
)
SAEs
48even
ts(15%
)10
.5/100
PY14
0even
ts(45%
)11
.7/100
PY40
even
ts(11%
)72
even
ts(20%
)33
even
ts(13%
)8/10
0PY
19even
ts(23%
)21
/100
PYAiC
inform
ation
hasbe
enremoved
15even
ts(20%
)
With
draw
als
becauseof
AEs
24(8%)even
ts4.5/10
0PY
–19
even
ts(5%)
32even
ts(9%)
2.13
/100
PY14
even
ts(5%)
15even
ts(19%
)7even
ts(12%
)AiC
inform
ation
hasbe
enremoved
–
Serio
usinfections
6(2%)even
ts1.1/10
0PY
17even
ts(5%)
1.4/10
0PY
11even
ts(3%)
21even
ts(6%)
2.1/10
0PY
6even
ts(2%)
2/10
0PY
5even
ts(6%)
3even
ts(5%)
3/10
0PY
AiC
inform
ation
hasbe
enremoved
3even
ts(4%)
Can
cer
4even
ts(1%)
0.7/10
0PY
3even
ts(1%)
0.2/10
0PY
2even
ts(0.6%)
3even
ts(0.8%)
0.21
/100
PY–
4even
ts(5%)
3even
ts(5%)
–1even
ts(1%)
NMSC
0.4/10
0PY
––
––
––
––
Con
gestive
heartfailure
0even
ts2even
ts(0.6%)
0.2/10
0PY
––
––
––
–
Injectionsite
reactio
ns42
even
ts(14%
)17
.6/100
PY–
38even
ts(11%
)43
even
ts(12%
)57
even
ts(22%
)30
even
ts(37%
)7even
ts(12%
)AiC
inform
ation
hasbe
enremoved
9even
ts(12%
)
Tube
rculosis
0even
ts0even
ts–
––
0even
ts0even
tsAiC
inform
ation
hasbe
enremoved
–
AiC,acad
emic-in
-con
fiden
ce;ASSER
T,Ank
ylosingSp
ondylitisStud
yfortheEvalua
tionof
Recombina
ntInfliximab
Therap
y;NMSC
,no
n-melan
omaskin
cancer;PY
,pe
rson
-year.
a5mg/kg
grou
p.b
Weeks
from
rand
omisation.
ASSESSMENT OF CLINICAL EFFECTIVENESS
NIHR Journals Library www.journalslibrary.nihr.ac.uk
56
Summary of adverse event dataData from large systematic reviews, which included patients with a wide range of diseases, suggest that,in the short term, anti-TNFs as a group are associated with significantly higher rates of serious infections,tuberculosis reactivation, non-melanoma skin cancer, total AEs and withdrawals because of AEs thancontrol treatments. Specifically, infliximab is associated with significantly higher rates of total AEs andwithdrawals because of AEs, and certolizumab pegol is associated with significantly higher rates of seriousinfections and SAEs. Analyses from the present review showed etanercept to be statistically significantlymore likely to result in an injection/infusion site reaction compared with infliximab, although analysabledata on such reactions were not reported for the three other anti-TNFs. Evaluations of longer-term dataare more scarce, although suggest similar safety profiles across anti-TNFs. Data from the open-label studiesincluded in this review also do not suggest that there are important differences between treatments, otherthan a higher incidence of injection site reactions following treatment with etanercept. These open-labeldata are, however, limited by the small sample sizes and non-randomised study designs.
Review of natural history of ankylosing spondylitis and non-radiographicaxial spondyloarthritisIn order to get some understanding of what happens to patients who, although eligible for anti-TNFtherapy for their AS or nr-AxSpA, do not receive it, we conducted a rapid review of relevant literature.This was not a systematic review but one that started with the library of papers found by the mainsearches for RCTs of the anti-TNFs and then followed relevant citations to papers on AS and axSpA inpatients not receiving an anti-TNF. Potentially relevant papers were those that reported on the pattern ofdisease, AS or nr-AxSpA or axSpA, without treatment with anti-TNFs over time. This process identifieda number of relevant registries: OASIS,118 Scotland and Ireland Registry for Ankylosing Spondylitis(SIRAS), Devenir des Spondylarthropathies Indifferenciées Récentes, Esperanza, Spanish Registry ofspondyloarthritis, German Spondyloarthritis Inception Cohort (GESPIC) and St Mary RheumaToid Arthritis(SMART). Additional searches of MEDLINE were conducted using these specific registry names. All relevantstudies identified through this process are presented in Table 27.
The studies collectively explore the associations between the various components of axSpA: diseaseactivity, structural damage and spinal mobility. The exploration of the ASSERT trial baseline data24,124
reveals that HRQoL as determined by SF-36 physical and mental components, is determined by BASFIand BASDAI; BASFI is determined by BASDAI, mSASSS and BASMI (spinal mobility); and BASMI isindependently determined both by irreversible spinal damage (mSASSS) in late disease and reversible spinaldamage (MRI) in early disease.
The studies identified that from a clinical practice and patients’ point of view disease progression in termsof BASFI, a measure of the patient’s functional ability, is very important. A number of studies on thedisease progression of AS have been based on the European OASIS cohort118 (a consecutive cohort, startedin 1996, although there were no further specific eligibility criteria); the total cohort numbers 217 patients.One of these, a study by Landewe et al.,10 demonstrated that physical function impairment (BASFI) isindependently affected by both disease activity (BASDAI) and bony progression, usually assessed usingmSASSS despite this being a measure of bony growth in the spine only (and not in the sacroiliac joints).Other studies by Ramiro124,125 have demonstrated that radiographic progression, increases on average byaround 2 mSASSS units every 2 years.124,125 However, this progression is highly variable; the average patientwith inactive disease [Ankylosing Spondylitis Disease Activity Score (ASDAS) 0] would progress by 5mSASSS units over 12 years compared with a patient with ‘very active disease’ (ASDAS 4) who would have19 units of progression.124 In addition, of 68 patients who were followed for 12 years, 18% had noprogression on mSASSS.125 The variability is also demonstrated by the results based on a different cohort:a single German clinic (n= 146).12 Baseline characteristics were similar to those in the OASIS cohort118
(see Table 27). Mean follow-up was 3.8 years (SD 1.7 years) and mean mSASSS change was 1.3 units/year(SD 2.5 units/year) with a range of 0–22.8 mSASSS units. Thirty-four (23%) patients showedno progression.
DOI: 10.3310/hta20090 HEALTH TECHNOLOGY ASSESSMENT 2016 VOL. 20 NO. 9
© Queen’s Printer and Controller of HMSO 2016. This work was produced by Corbett et al. under the terms of a commissioning contract issued by the Secretary of State forHealth. This issue may be freely reproduced for the purposes of private research and study and extracts (or indeed, the full report) may be included in professional journalsprovided that suitable acknowledgement is made and the reproduction is not associated with any form of advertising. Applications for commercial reproduction should beaddressed to: NIHR Journals Library, National Institute for Health Research, Evaluation, Trials and Studies Coordinating Centre, Alpha House, University of Southampton SciencePark, Southampton SO16 7NS, UK.
57
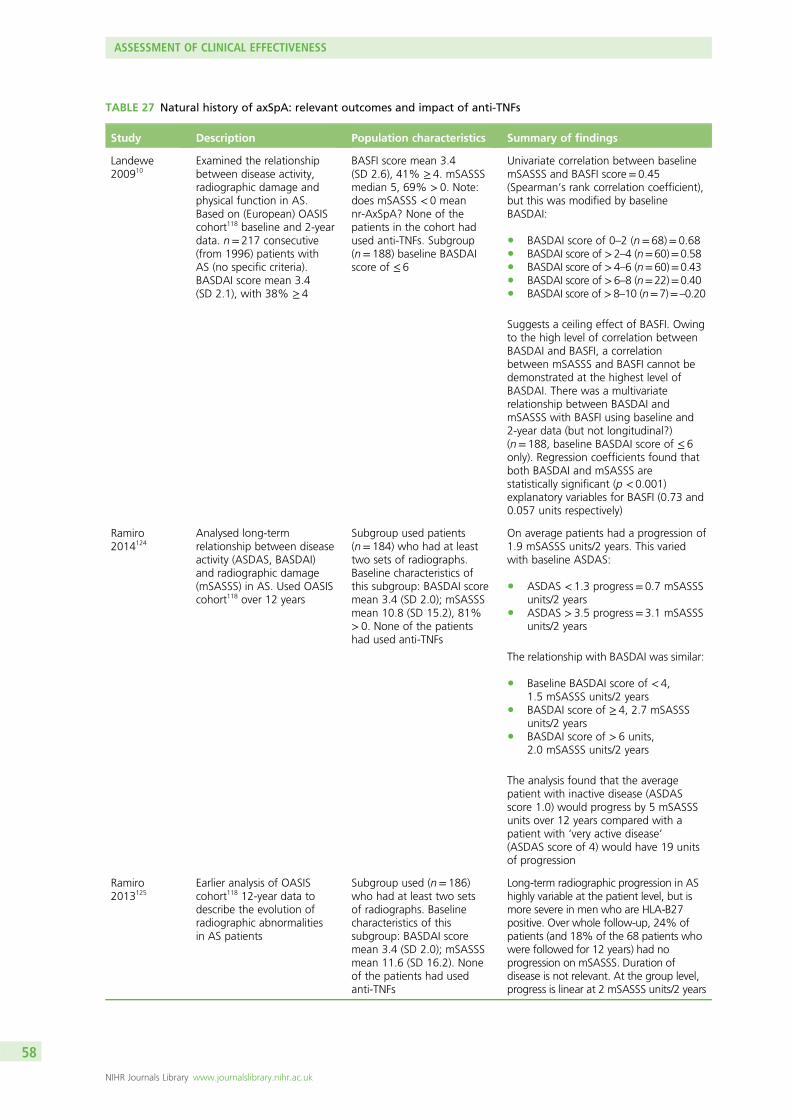
TABLE 27 Natural history of axSpA: relevant outcomes and impact of anti-TNFs
Study Description Population characteristics Summary of findings
Landewe200910
Examined the relationshipbetween disease activity,radiographic damage andphysical function in AS.Based on (European) OASIScohort118 baseline and 2-yeardata. n= 217 consecutive(from 1996) patients withAS (no specific criteria).BASDAI score mean 3.4(SD 2.1), with 38% ≥ 4
BASFI score mean 3.4(SD 2.6), 41% ≥ 4. mSASSSmedian 5, 69% > 0. Note:does mSASSS < 0 meannr-AxSpA? None of thepatients in the cohort hadused anti-TNFs. Subgroup(n= 188) baseline BASDAIscore of ≤ 6
Univariate correlation between baselinemSASSS and BASFI score= 0.45(Spearman’s rank correlation coefficient),but this was modified by baselineBASDAI:
l BASDAI score of 0–2 (n= 68)= 0.68l BASDAI score of >2–4 (n=60)=0.58l BASDAI score of >4–6 (n=60)=0.43l BASDAI score of >6–8 (n=22)=0.40l BASDAI score of >8–10 (n=7)=–0.20
Suggests a ceiling effect of BASFI. Owingto the high level of correlation betweenBASDAI and BASFI, a correlationbetween mSASSS and BASFI cannot bedemonstrated at the highest level ofBASDAI. There was a multivariaterelationship between BASDAI andmSASSS with BASFI using baseline and2-year data (but not longitudinal?)(n= 188, baseline BASDAI score of ≤ 6only). Regression coefficients found thatboth BASDAI and mSASSS arestatistically significant (p < 0.001)explanatory variables for BASFI (0.73 and0.057 units respectively)
Ramiro2014124
Analysed long-termrelationship between diseaseactivity (ASDAS, BASDAI)and radiographic damage(mSASSS) in AS. Used OASIScohort118 over 12 years
Subgroup used patients(n= 184) who had at leasttwo sets of radiographs.Baseline characteristics ofthis subgroup: BASDAI scoremean 3.4 (SD 2.0); mSASSSmean 10.8 (SD 15.2), 81%> 0. None of the patientshad used anti-TNFs
On average patients had a progression of1.9 mSASSS units/2 years. This variedwith baseline ASDAS:
l ASDAS < 1.3 progress= 0.7 mSASSSunits/2 years
l ASDAS > 3.5 progress= 3.1 mSASSSunits/2 years
The relationship with BASDAI was similar:
l Baseline BASDAI score of < 4,1.5 mSASSS units/2 years
l BASDAI score of ≥ 4, 2.7 mSASSSunits/2 years
l BASDAI score of > 6 units,2.0 mSASSS units/2 years
The analysis found that the averagepatient with inactive disease (ASDASscore 1.0) would progress by 5 mSASSSunits over 12 years compared with apatient with ‘very active disease’(ASDAS score of 4) would have 19 unitsof progression
Ramiro2013125
Earlier analysis of OASIScohort118 12-year data todescribe the evolution ofradiographic abnormalitiesin AS patients
Subgroup used (n= 186)who had at least two setsof radiographs. Baselinecharacteristics of thissubgroup: BASDAI scoremean 3.4 (SD 2.0); mSASSSmean 11.6 (SD 16.2). Noneof the patients had usedanti-TNFs
Long-term radiographic progression in AShighly variable at the patient level, but ismore severe in men who are HLA-B27positive. Over whole follow-up, 24% ofpatients (and 18% of the 68 patients whowere followed for 12 years) had noprogression on mSASSS. Duration ofdisease is not relevant. At the group level,progress is linear at 2 mSASSS units/2 years
ASSESSMENT OF CLINICAL EFFECTIVENESS
NIHR Journals Library www.journalslibrary.nihr.ac.uk
58
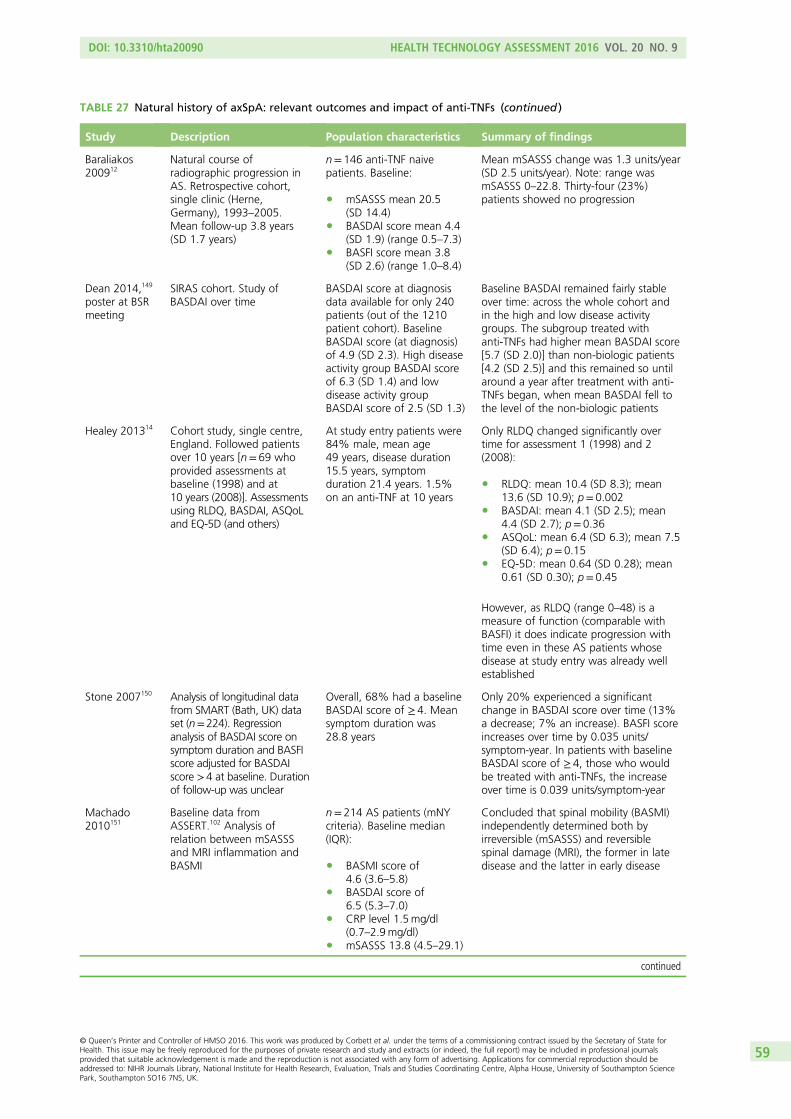
TABLE 27 Natural history of axSpA: relevant outcomes and impact of anti-TNFs (continued )
Study Description Population characteristics Summary of findings
Baraliakos200912
Natural course ofradiographic progression inAS. Retrospective cohort,single clinic (Herne,Germany), 1993–2005.Mean follow-up 3.8 years(SD 1.7 years)
n= 146 anti-TNF naivepatients. Baseline:
l mSASSS mean 20.5(SD 14.4)
l BASDAI score mean 4.4(SD 1.9) (range 0.5–7.3)
l BASFI score mean 3.8(SD 2.6) (range 1.0–8.4)
Mean mSASSS change was 1.3 units/year(SD 2.5 units/year). Note: range wasmSASSS 0–22.8. Thirty-four (23%)patients showed no progression
Dean 2014,149
poster at BSRmeeting
SIRAS cohort. Study ofBASDAI over time
BASDAI score at diagnosisdata available for only 240patients (out of the 1210patient cohort). BaselineBASDAI score (at diagnosis)of 4.9 (SD 2.3). High diseaseactivity group BASDAI scoreof 6.3 (SD 1.4) and lowdisease activity groupBASDAI score of 2.5 (SD 1.3)
Baseline BASDAI remained fairly stableover time: across the whole cohort andin the high and low disease activitygroups. The subgroup treated withanti-TNFs had higher mean BASDAI score[5.7 (SD 2.0)] than non-biologic patients[4.2 (SD 2.5)] and this remained so untilaround a year after treatment with anti-TNFs began, when mean BASDAI fell tothe level of the non-biologic patients
Healey 201314 Cohort study, single centre,England. Followed patientsover 10 years [n= 69 whoprovided assessments atbaseline (1998) and at10 years (2008)]. Assessmentsusing RLDQ, BASDAI, ASQoLand EQ-5D (and others)
At study entry patients were84% male, mean age49 years, disease duration15.5 years, symptomduration 21.4 years. 1.5%on an anti-TNF at 10 years
Only RLDQ changed significantly overtime for assessment 1 (1998) and 2(2008):
l RLDQ: mean 10.4 (SD 8.3); mean13.6 (SD 10.9); p= 0.002
l BASDAI: mean 4.1 (SD 2.5); mean4.4 (SD 2.7); p= 0.36
l ASQoL: mean 6.4 (SD 6.3); mean 7.5(SD 6.4); p= 0.15
l EQ-5D: mean 0.64 (SD 0.28); mean0.61 (SD 0.30); p= 0.45
However, as RLDQ (range 0–48) is ameasure of function (comparable withBASFI) it does indicate progression withtime even in these AS patients whosedisease at study entry was already wellestablished
Stone 2007150 Analysis of longitudinal datafrom SMART (Bath, UK) dataset (n=224). Regressionanalysis of BASDAI score onsymptom duration and BASFIscore adjusted for BASDAIscore >4 at baseline. Durationof follow-up was unclear
Overall, 68% had a baselineBASDAI score of ≥ 4. Meansymptom duration was28.8 years
Only 20% experienced a significantchange in BASDAI score over time (13%a decrease; 7% an increase). BASFI scoreincreases over time by 0.035 units/symptom-year. In patients with baselineBASDAI score of ≥ 4, those who wouldbe treated with anti-TNFs, the increaseover time is 0.039 units/symptom-year
Machado2010151
Baseline data fromASSERT.102 Analysis ofrelation between mSASSSand MRI inflammation andBASMI
n= 214 AS patients (mNYcriteria). Baseline median(IQR):
l BASMI score of4.6 (3.6–5.8)
l BASDAI score of6.5 (5.3–7.0)
l CRP level 1.5mg/dl(0.7–2.9mg/dl)
l mSASSS 13.8 (4.5–29.1)
Concluded that spinal mobility (BASMI)independently determined both byirreversible (mSASSS) and reversiblespinal damage (MRI), the former in latedisease and the latter in early disease
continued
DOI: 10.3310/hta20090 HEALTH TECHNOLOGY ASSESSMENT 2016 VOL. 20 NO. 9
© Queen’s Printer and Controller of HMSO 2016. This work was produced by Corbett et al. under the terms of a commissioning contract issued by the Secretary of State forHealth. This issue may be freely reproduced for the purposes of private research and study and extracts (or indeed, the full report) may be included in professional journalsprovided that suitable acknowledgement is made and the reproduction is not associated with any form of advertising. Applications for commercial reproduction should beaddressed to: NIHR Journals Library, National Institute for Health Research, Evaluation, Trials and Studies Coordinating Centre, Alpha House, University of Southampton SciencePark, Southampton SO16 7NS, UK.
59
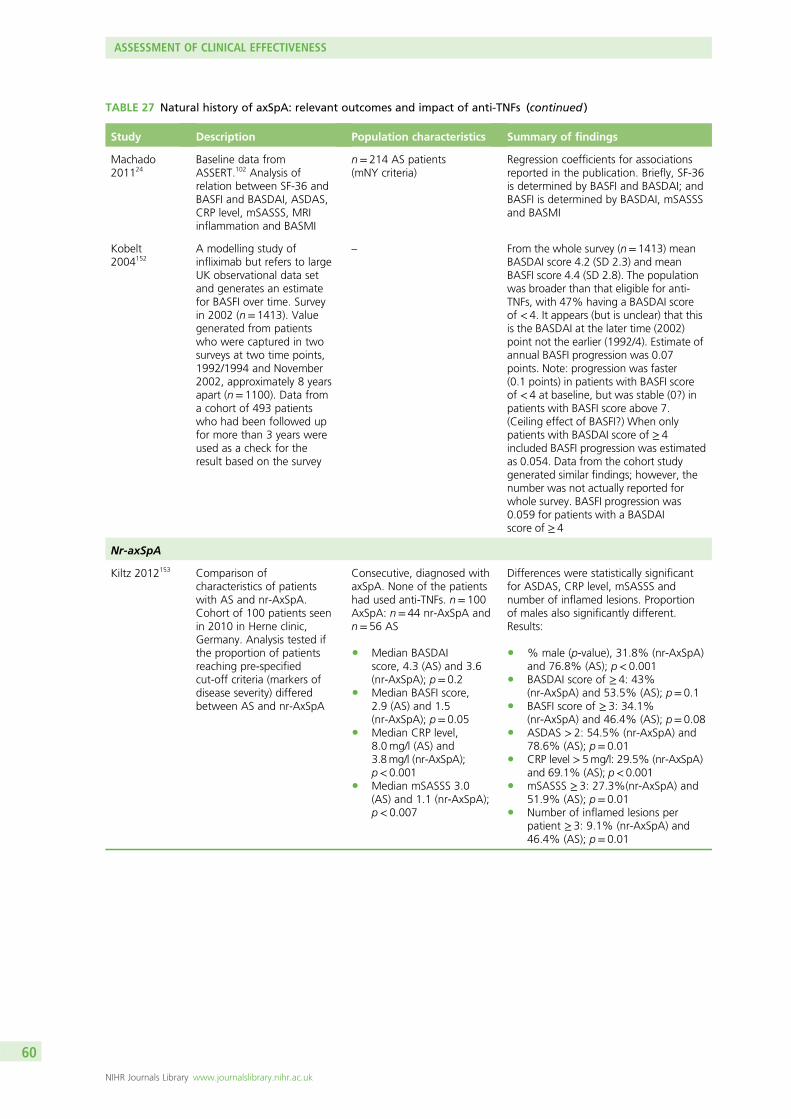
TABLE 27 Natural history of axSpA: relevant outcomes and impact of anti-TNFs (continued )
Study Description Population characteristics Summary of findings
Machado201124
Baseline data fromASSERT.102 Analysis ofrelation between SF-36 andBASFI and BASDAI, ASDAS,CRP level, mSASSS, MRIinflammation and BASMI
n= 214 AS patients(mNY criteria)
Regression coefficients for associationsreported in the publication. Briefly, SF-36is determined by BASFI and BASDAI; andBASFI is determined by BASDAI, mSASSSand BASMI
Kobelt2004152
A modelling study ofinfliximab but refers to largeUK observational data setand generates an estimatefor BASFI over time. Surveyin 2002 (n= 1413). Valuegenerated from patientswho were captured in twosurveys at two time points,1992/1994 and November2002, approximately 8 yearsapart (n= 1100). Data froma cohort of 493 patientswho had been followed upfor more than 3 years wereused as a check for theresult based on the survey
– From the whole survey (n= 1413) meanBASDAI score 4.2 (SD 2.3) and meanBASFI score 4.4 (SD 2.8). The populationwas broader than that eligible for anti-TNFs, with 47% having a BASDAI scoreof < 4. It appears (but is unclear) that thisis the BASDAI at the later time (2002)point not the earlier (1992/4). Estimate ofannual BASFI progression was 0.07points. Note: progression was faster(0.1 points) in patients with BASFI scoreof < 4 at baseline, but was stable (0?) inpatients with BASFI score above 7.(Ceiling effect of BASFI?) When onlypatients with BASDAI score of ≥ 4included BASFI progression was estimatedas 0.054. Data from the cohort studygenerated similar findings; however, thenumber was not actually reported forwhole survey. BASFI progression was0.059 for patients with a BASDAIscore of ≥ 4
Nr-axSpA
Kiltz 2012153 Comparison ofcharacteristics of patientswith AS and nr-AxSpA.Cohort of 100 patients seenin 2010 in Herne clinic,Germany. Analysis tested ifthe proportion of patientsreaching pre-specifiedcut-off criteria (markers ofdisease severity) differedbetween AS and nr-AxSpA
Consecutive, diagnosed withaxSpA. None of the patientshad used anti-TNFs. n= 100AxSpA: n= 44 nr-AxSpA andn= 56 AS
l Median BASDAIscore, 4.3 (AS) and 3.6(nr-AxSpA); p= 0.2
l Median BASFI score,2.9 (AS) and 1.5(nr-AxSpA); p= 0.05
l Median CRP level,8.0mg/l (AS) and3.8mg/l (nr-AxSpA);p<0.001
l Median mSASSS 3.0(AS) and 1.1 (nr-AxSpA);p< 0.007
Differences were statistically significantfor ASDAS, CRP level, mSASSS andnumber of inflamed lesions. Proportionof males also significantly different.Results:
l % male (p-value), 31.8% (nr-AxSpA)and 76.8% (AS); p< 0.001
l BASDAI score of ≥ 4: 43%(nr-AxSpA) and 53.5% (AS); p= 0.1
l BASFI score of ≥ 3: 34.1%(nr-AxSpA) and 46.4% (AS); p= 0.08
l ASDAS > 2: 54.5% (nr-AxSpA) and78.6% (AS); p= 0.01
l CRP level >5mg/l: 29.5% (nr-AxSpA)and 69.1% (AS); p<0.001
l mSASSS ≥ 3: 27.3%(nr-AxSpA) and51.9% (AS); p= 0.01
l Number of inflamed lesions perpatient ≥ 3: 9.1% (nr-AxSpA) and46.4% (AS); p= 0.01
ASSESSMENT OF CLINICAL EFFECTIVENESS
NIHR Journals Library www.journalslibrary.nihr.ac.uk
60
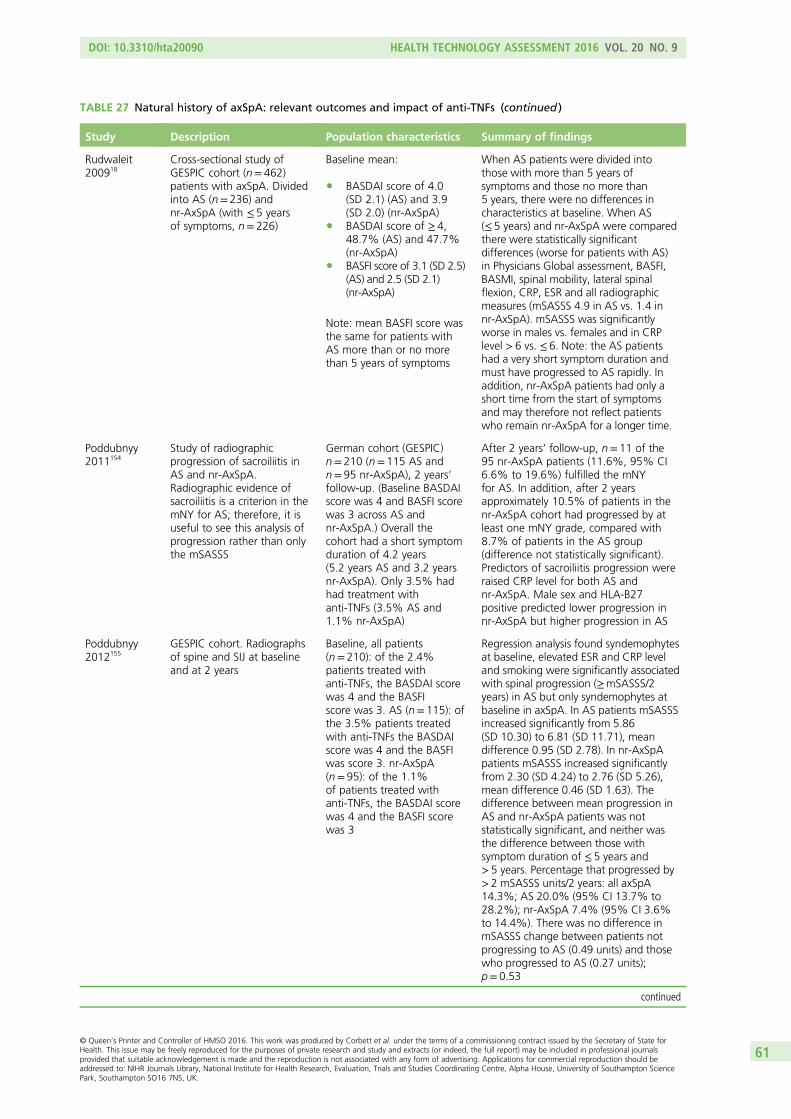
TABLE 27 Natural history of axSpA: relevant outcomes and impact of anti-TNFs (continued )
Study Description Population characteristics Summary of findings
Rudwaleit200918
Cross-sectional study ofGESPIC cohort (n= 462)patients with axSpA. Dividedinto AS (n= 236) andnr-AxSpA (with ≤ 5 yearsof symptoms, n= 226)
Baseline mean:
l BASDAI score of 4.0(SD 2.1) (AS) and 3.9(SD 2.0) (nr-AxSpA)
l BASDAI score of ≥ 4,48.7% (AS) and 47.7%(nr-AxSpA)
l BASFI score of 3.1 (SD 2.5)(AS) and 2.5 (SD 2.1)(nr-AxSpA)
Note: mean BASFI score wasthe same for patients withAS more than or no morethan 5 years of symptoms
When AS patients were divided intothose with more than 5 years ofsymptoms and those no more than5 years, there were no differences incharacteristics at baseline. When AS(≤ 5 years) and nr-AxSpA were comparedthere were statistically significantdifferences (worse for patients with AS)in Physicians Global assessment, BASFI,BASMI, spinal mobility, lateral spinalflexion, CRP, ESR and all radiographicmeasures (mSASSS 4.9 in AS vs. 1.4 innr-AxSpA). mSASSS was significantlyworse in males vs. females and in CRPlevel > 6 vs. ≤ 6. Note: the AS patientshad a very short symptom duration andmust have progressed to AS rapidly. Inaddition, nr-AxSpA patients had only ashort time from the start of symptomsand may therefore not reflect patientswho remain nr-AxSpA for a longer time.
Poddubnyy2011154
Study of radiographicprogression of sacroiliitis inAS and nr-AxSpA.Radiographic evidence ofsacroiliitis is a criterion in themNY for AS; therefore, it isuseful to see this analysis ofprogression rather than onlythe mSASSS
German cohort (GESPIC)n= 210 (n= 115 AS andn= 95 nr-AxSpA), 2 years’follow-up. (Baseline BASDAIscore was 4 and BASFI scorewas 3 across AS andnr-AxSpA.) Overall thecohort had a short symptomduration of 4.2 years(5.2 years AS and 3.2 yearsnr-AxSpA). Only 3.5% hadhad treatment withanti-TNFs (3.5% AS and1.1% nr-AxSpA)
After 2 years’ follow-up, n= 11 of the95 nr-AxSpA patients (11.6%, 95% CI6.6% to 19.6%) fulfilled the mNYfor AS. In addition, after 2 yearsapproximately 10.5% of patients in thenr-AxSpA cohort had progressed by atleast one mNY grade, compared with8.7% of patients in the AS group(difference not statistically significant).Predictors of sacroiliitis progression wereraised CRP level for both AS andnr-AxSpA. Male sex and HLA-B27positive predicted lower progression innr-AxSpA but higher progression in AS
Poddubnyy2012155
GESPIC cohort. Radiographsof spine and SIJ at baselineand at 2 years
Baseline, all patients(n= 210): of the 2.4%patients treated withanti-TNFs, the BASDAI scorewas 4 and the BASFIscore was 3. AS (n= 115): ofthe 3.5% patients treatedwith anti-TNFs the BASDAIscore was 4 and the BASFIwas score 3. nr-AxSpA(n= 95): of the 1.1%of patients treated withanti-TNFs, the BASDAI scorewas 4 and the BASFI scorewas 3
Regression analysis found syndemophytesat baseline, elevated ESR and CRP leveland smoking were significantly associatedwith spinal progression (≥mSASSS/2years) in AS but only syndemophytes atbaseline in axSpA. In AS patients mSASSSincreased significantly from 5.86(SD 10.30) to 6.81 (SD 11.71), meandifference 0.95 (SD 2.78). In nr-AxSpApatients mSASSS increased significantlyfrom 2.30 (SD 4.24) to 2.76 (SD 5.26),mean difference 0.46 (SD 1.63). Thedifference between mean progression inAS and nr-AxSpA patients was notstatistically significant, and neither wasthe difference between those withsymptom duration of ≤ 5 years and> 5 years. Percentage that progressed by> 2 mSASSS units/2 years: all axSpA14.3%; AS 20.0% (95% CI 13.7% to28.2%); nr-AxSpA 7.4% (95% CI 3.6%to 14.4%). There was no difference inmSASSS change between patients notprogressing to AS (0.49 units) and thosewho progressed to AS (0.27 units);p= 0.53
continued
DOI: 10.3310/hta20090 HEALTH TECHNOLOGY ASSESSMENT 2016 VOL. 20 NO. 9
© Queen’s Printer and Controller of HMSO 2016. This work was produced by Corbett et al. under the terms of a commissioning contract issued by the Secretary of State forHealth. This issue may be freely reproduced for the purposes of private research and study and extracts (or indeed, the full report) may be included in professional journalsprovided that suitable acknowledgement is made and the reproduction is not associated with any form of advertising. Applications for commercial reproduction should beaddressed to: NIHR Journals Library, National Institute for Health Research, Evaluation, Trials and Studies Coordinating Centre, Alpha House, University of Southampton SciencePark, Southampton SO16 7NS, UK.
61
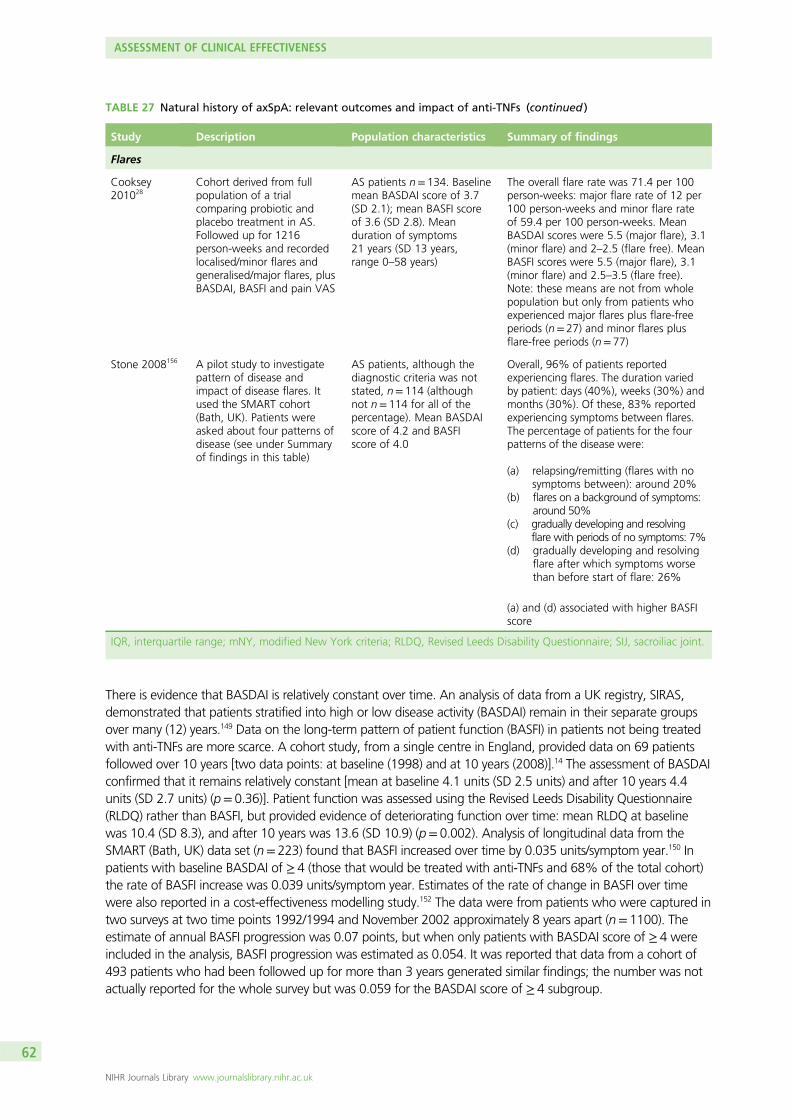
There is evidence that BASDAI is relatively constant over time. An analysis of data from a UK registry, SIRAS,demonstrated that patients stratified into high or low disease activity (BASDAI) remain in their separate groupsover many (12) years.149 Data on the long-term pattern of patient function (BASFI) in patients not being treatedwith anti-TNFs are more scarce. A cohort study, from a single centre in England, provided data on 69 patientsfollowed over 10 years [two data points: at baseline (1998) and at 10 years (2008)].14 The assessment of BASDAIconfirmed that it remains relatively constant [mean at baseline 4.1 units (SD 2.5 units) and after 10 years 4.4units (SD 2.7 units) (p= 0.36)]. Patient function was assessed using the Revised Leeds Disability Questionnaire(RLDQ) rather than BASFI, but provided evidence of deteriorating function over time: mean RLDQ at baselinewas 10.4 (SD 8.3), and after 10 years was 13.6 (SD 10.9) (p= 0.002). Analysis of longitudinal data from theSMART (Bath, UK) data set (n= 223) found that BASFI increased over time by 0.035 units/symptom year.150 Inpatients with baseline BASDAI of ≥ 4 (those that would be treated with anti-TNFs and 68% of the total cohort)the rate of BASFI increase was 0.039 units/symptom year. Estimates of the rate of change in BASFI over timewere also reported in a cost-effectiveness modelling study.152 The data were from patients who were captured intwo surveys at two time points 1992/1994 and November 2002 approximately 8 years apart (n= 1100). Theestimate of annual BASFI progression was 0.07 points, but when only patients with BASDAI score of ≥ 4 wereincluded in the analysis, BASFI progression was estimated as 0.054. It was reported that data from a cohort of493 patients who had been followed up for more than 3 years generated similar findings; the number was notactually reported for the whole survey but was 0.059 for the BASDAI score of ≥ 4 subgroup.
TABLE 27 Natural history of axSpA: relevant outcomes and impact of anti-TNFs (continued )
Study Description Population characteristics Summary of findings
Flares
Cooksey201028
Cohort derived from fullpopulation of a trialcomparing probiotic andplacebo treatment in AS.Followed up for 1216person-weeks and recordedlocalised/minor flares andgeneralised/major flares, plusBASDAI, BASFI and pain VAS
AS patients n= 134. Baselinemean BASDAI score of 3.7(SD 2.1); mean BASFI scoreof 3.6 (SD 2.8). Meanduration of symptoms21 years (SD 13 years,range 0–58 years)
The overall flare rate was 71.4 per 100person-weeks: major flare rate of 12 per100 person-weeks and minor flare rateof 59.4 per 100 person-weeks. MeanBASDAI scores were 5.5 (major flare), 3.1(minor flare) and 2–2.5 (flare free). MeanBASFI scores were 5.5 (major flare), 3.1(minor flare) and 2.5–3.5 (flare free).Note: these means are not from wholepopulation but only from patients whoexperienced major flares plus flare-freeperiods (n= 27) and minor flares plusflare-free periods (n= 77)
Stone 2008156 A pilot study to investigatepattern of disease andimpact of disease flares. Itused the SMART cohort(Bath, UK). Patients wereasked about four patterns ofdisease (see under Summaryof findings in this table)
AS patients, although thediagnostic criteria was notstated, n= 114 (althoughnot n= 114 for all of thepercentage). Mean BASDAIscore of 4.2 and BASFIscore of 4.0
Overall, 96% of patients reportedexperiencing flares. The duration variedby patient: days (40%), weeks (30%) andmonths (30%). Of these, 83% reportedexperiencing symptoms between flares.The percentage of patients for the fourpatterns of the disease were:
(a) relapsing/remitting (flares with nosymptoms between): around 20%
(b) flares on a background of symptoms:around 50%
(c) gradually developing and resolvingflare with periods of no symptoms: 7%
(d) gradually developing and resolvingflare after which symptoms worsethan before start of flare: 26%
(a) and (d) associated with higher BASFIscore
IQR, interquartile range; mNY, modified New York criteria; RLDQ, Revised Leeds Disability Questionnaire; SIJ, sacroiliac joint.
ASSESSMENT OF CLINICAL EFFECTIVENESS
NIHR Journals Library www.journalslibrary.nihr.ac.uk
62
Natural history data from patients with nr-AxSpA are even more scarce than those for AS patients, with nolong-term data identified. A comparison of AS and nr-AxSpA patients from a cohort of 100 consecutivepatients (Herne clinic, Germany) (AxSpA n= 100, nr-AxSpA n= 44, AS n= 56) found that slightly higherproportions of AS patients met pre-specified cut-off points of disease severity than did nr-AxSpA patients,but the differences were statistically significant only for ASDAS, CRP level, mSASSS and the number ofinflamed lesions; the proportion of males was also statistically significantly different.153 The results are givenin Table 27. The difference for BASFI was very close to statistical significance.
A larger cross-sectional study of the GESPIC cohort [n= 462 patients with axSpA (AS or nr-AxSpA)] alsofound differences between AS and nr-AxSpA patients.18 When AS (≤ 5 years) and nr-AxSpA werecompared, there were statistically significant differences in Physician Global Assessment, BASFI (3.1 in ASvs. 2.5 in nr-AxSpA), BASMI (1.9 in AS vs. 1.1 in nr-AxSpA), spinal mobility and lateral spinal flexion, CRPlevel and ESR, and all radiographic measures (mSASSS 4.9 in AS vs. 1.4 in nr-AxSpA). mSASSS wasstatistically significantly worse in males versus females and between CRP level > 6 and < 6, although it isunclear whether or not this is a meaningful cut-off point for CRP level.
In two longitudinal studies of progression in nr-AxSpA,154,155 also using the GESPIC cohort, progression interms of sacroiliitis and in terms of radiographic progression in the spine (mSASSS) was slightly more rapidin AS than in nr-AxSpA but not statistically significantly so. Raised CRP level at baseline was a predictor ofboth measures of progression in AS but only for sacroiliitis in nr-AxSpA. The presence of syndesmophyteswas predictive of higher progression rates as assessed by mSASSS in both AS and nr-AxSpA. Of the95 patients with nr-AxSpA, 11 (11.6%) fulfilled the modified New York criteria for AS after 2 years offollow-up. A review of the burden of illness in nr-AxSpA157 cited this (11.6%) progression rate along with a10% rate over 2 years and a 24% rate over 10 years. However, the 10-year rate was derived from abroader, more heterogeneous population than the GESPIC cohort: patients had undifferentiatedspondyloarthropathies with over half not having inflammatory low back pain.156,158 The GESPIC studyrecruited only patients with axSpA (AS or nr-AxSpA).
Studies of disease progression in nr-AxSpA focus on aspects of the disease that can be assessed throughimaging techniques: radiography or MRI. This may appear reasonable given the subjective,patient-questionnaire basis of the BASFI score.
Finally, there is evidence that as well as being progressive, the course of AS includes flares. A study basedon the population of a trial comparing probiotic and placebo treatment in AS found that the overall flarerate was 71.4 per 100 person-weeks; the major flare rate was 12/100 person-weeks and the minorflare rate was 59.4/100 person-weeks.28 BASDAI and BASFI varied with type of flare: mean BASDAI scoreswere 5.5 (major flare), 3.1 (minor flare) and 2–2.5 (flare free), and mean BASFI scores were 5.5 (majorflare), 3.1 (minor flare) and 2.5–3.5 (flare free). A pilot study used the SMART cohort (Bath, UK) toinvestigate the pattern of disease and impact of disease flares.159 Of the 114 patients, 96% reportedexperiencing flares. Flare duration varied by patient: days (40%), weeks (30%) and months (30%). Fifty percent of patients reported flares on a background of symptoms, while 26% reported gradually developingand resolving flares after which symptoms were worse than before the start of the flare. These patternswere associated with higher BASFI scores. Around 20% reported flares with no symptoms between. Asmall proportion (7%) reported gradually developing and resolving flare with periods of no symptoms.
In summary, the available studies indicate that in AS and nr-AxSpA disease activity (BASDAI) is fairly stableover time and does not generally progress, although it can be at a high (severe) level early in the disease.Patients function (as assessed by BASFI) does deteriorate over time, although the course is not constant orpredictable. BASFI is determined by both disease activity and bone neo-formation; progression of BASFIscore over time is driven by progression of bony disease as assessed by imaging scores such as mSASSS,
DOI: 10.3310/hta20090 HEALTH TECHNOLOGY ASSESSMENT 2016 VOL. 20 NO. 9
© Queen’s Printer and Controller of HMSO 2016. This work was produced by Corbett et al. under the terms of a commissioning contract issued by the Secretary of State forHealth. This issue may be freely reproduced for the purposes of private research and study and extracts (or indeed, the full report) may be included in professional journalsprovided that suitable acknowledgement is made and the reproduction is not associated with any form of advertising. Applications for commercial reproduction should beaddressed to: NIHR Journals Library, National Institute for Health Research, Evaluation, Trials and Studies Coordinating Centre, Alpha House, University of Southampton SciencePark, Southampton SO16 7NS, UK.
63
or the presence of syndesmophytes. Best estimates of yearly disease progression rates without anti-TNFtherapy are around 1.0 mSASSS units and 0.035–0.07 BASFI units. Information on the natural history ofnr-AxSpA is relatively sparse. While disease progression appears to be faster in AS, patients with nr-AxSpAcan have severe disease activity and hence poor function.
Clinical effectiveness summary and conclusions
Summary of randomised controlled trial resultsThe quality of the trial evidence was generally high; most studies were unlikely to have produced resultswhich were biased. For both the AS and nr-AxSpA populations, the results of the meta-analysesdemonstrated that anti-TNFs produce statistically significant and clinically relevant benefits to patients interms of improving function and reducing disease activity. The common class-effect model used may haveunderestimated the uncertainty in the effect estimates. Although there is a possibility that infliximab ismore effective than other TNF inhibitors at least at 12 weeks, there is no strong evidence to support this.For the disease activity, function and responder outcomes, the class-efficacy estimates were consistentlyslightly smaller for nr-AxSpA than for AS, most noticeably for BASFI and BASDAI 50. Statisticalheterogeneity was more apparent in the nr-AxSpA analyses than in the AS analyses. This may be a resultof both clinical heterogeneity in the nr-AxSpA trials (such as variation in CRP levels or the proportion ofMRI positive patients) and the fact that fewer studies were available for analysis. In the light of thestatistical heterogeneity across the nr-AxSpA trials, both the reliability of the nr-AxSpA-pooled estimatesand their true relevance to patients seen in clinical practice is questionable.
The US FDA reanalyses of two key nr-AxSpA trials further emphasised the heterogeneity in the nr-AxSpApopulation. Results for an adalimumab trial in nr-AxSpA patients suggested reduced efficacy in a centrallydiagnosed nr-AxSpA population than in a locally diagnosed population and that the treatment benefit inthe whole trial population may have been driven by benefit in patients who actually had AS, not nr-AxSpA.Conversely, in a certolizumab pegol trial which recruited both populations, the efficacy findings wereconsistent across the AS and nr-AxSpA subpopulations, regardless of the discrepancy in local or centralpelvic radiograph readings.
Long-term efficacyThe longest follow-up durations in patients with AS by anti-TNF were 5 years for adalimumab, 5 years foretanercept, 3 years for infliximab, around 5 years for golimumab and nearly 2 years for certolizumabpegol. The results showed that across all the anti-TNFs after approximately 2 years of treatment, aroundhalf of patients still achieved a good level of response to therapy. At 5 years around 60% of golimumabpatients, 50% of etanercept patients and 30% of adalimumab patients still achieved a good treatmentresponse. However, the long-term studies were not as well-reported as the RCTs, and their results werederived from less reliable data; it is therefore unknown if these are true treatment differences or a result ofdifferences in follow-up protocols, and/or imputation and analysis methods.
The long-term follow-up for nr-AxSpA patients showed a continued high proportion of responders.At 1 year around half of patients on adalimumab, etanercept or certolizumab still achieved an ASAS 40or BASDAI 50 level response. With certolizumab this is maintained at 2 years and with adalimumab at3 years.
When the long-term data are presented as observed or as completer analyses, the long-term results aresimilarly good: withdrawal rates are not high and those patients who remain on treatment continue toachieve a good response.
For all anti-TNFs, at long-term follow-up mean final values or mean change from baseline for BASDAI,BASFI and BASMI, when reported, were generally maintained at levels indicative of clinically significanttreatment benefit for those patients with AS and those with nr-AxSpA.
ASSESSMENT OF CLINICAL EFFECTIVENESS
NIHR Journals Library www.journalslibrary.nihr.ac.uk
64
Four studies reported on radiographic disease progression over 2 years of follow-up in terms of mSASSS inpatients taking adalimumab, infliximab, etanercept and golimumab. All four open-label, uncontrolledfollow-up studies found that mSASSS increased by a mean of around 0.9 over 2 years. Three of thesestudies compared their rates with those from the OASIS cohort118 (of patients not taking an anti-TNF) andfound no difference. In conclusion, there is no real evidence for the impact of anti-TNF treatment onradiographic disease progression; a beneficial effect cannot be assumed, nor, given the short-term natureof the follow-up and the insensitivity of radiography as a tool for the evaluation of disease progression inAS, can one be discounted. There are some data to suggest an identifiable benefit from around 4 yearsbut results from ongoing long-term studies should help to clarify this issue.
Registry data demonstrate that around 60% of patients with AS treated with a first anti-TNF will still betaking their therapy at 2 years, with median drug survival of 3.1 years (based on Danish registry n= 1436).Sequential treatment with anti-TNFs can be worthwhile but the drug survival response rates and benefitsare reduced with second and third anti-TNFs, with the proportion of BASDAI 50 responders fallingapproximately 10% with each subsequent anti-TNF and the median BASDAI and BASFIs achievedincreasing (worsening). The lower efficacy of a second anti-TNF relative to a first is reflected in lowermedian drug survival and proportion of patients remaining on therapy at 2 years. Interestingly, despite afurther reduction in response and efficacy with a third anti-TNF, drug survival does not fall further,suggesting that patients may be allowed to, and be prepared to, continue with a less than optimallyeffective anti-TNF at this stage in their treatment history.
Adverse effectsData from large systematic reviews, which included patients with a wide range of diseases, suggest that,in the short term, anti-TNFs as a group are associated with significantly higher rates of serious infections,tuberculosis reactivation, non-melanoma skin cancer, total AEs and withdrawals because of AEs, whencompared with control treatments. Specifically, infliximab is associated with significantly higher rates oftotal AEs and withdrawals because of AEs, and that certolizumab pegol is associated with significantlyhigher rates of serious infections and SAEs. Analyses from the present review showed etanercept to bestatistically significantly more likely to result in an injection/infusion site reaction compared with infliximab,although analysable data on such reactions were not reported for the other three anti-TNFs. Evaluations oflonger-term data are more scarce, although they suggest similar safety profiles across anti-TNFs. Data fromthe open-label studies included in this review also do not suggest that there are important differencesbetween treatments, other than a higher incidence of injection site reactions following treatment withetanercept. These open-label data are, however, limited by the small sample sizes and non-randomisedstudy designs.
Natural historyThe available studies indicate that in AS and nr-AxSpa disease activity (BASDAI) is fairly stable over timeand does not generally progress, although it can be at a high (severe) level early in the disease. Patientfunction (as assessed by BASFI) does deteriorate over time, although the course is not constant orpredictable. BASFI is determined by both disease activity and bony disease; progression of BASFI over timeis driven by progression of bony disease as assessed by imaging scores such as mSASSS, or the presence ofsyndesmophytes. Best estimates of yearly disease progression rates without anti-TNF therapy are around1.0 mSASSS units and 0.035 to 0.07 BASFI units. Information on the natural history of nr-AxSpA isrelatively sparse. While disease progression appears to be faster in AS, patients with nr-AxSpA can havesevere disease activity and hence poor function.
DOI: 10.3310/hta20090 HEALTH TECHNOLOGY ASSESSMENT 2016 VOL. 20 NO. 9
© Queen’s Printer and Controller of HMSO 2016. This work was produced by Corbett et al. under the terms of a commissioning contract issued by the Secretary of State forHealth. This issue may be freely reproduced for the purposes of private research and study and extracts (or indeed, the full report) may be included in professional journalsprovided that suitable acknowledgement is made and the reproduction is not associated with any form of advertising. Applications for commercial reproduction should beaddressed to: NIHR Journals Library, National Institute for Health Research, Evaluation, Trials and Studies Coordinating Centre, Alpha House, University of Southampton SciencePark, Southampton SO16 7NS, UK.
65
Overall conclusions
l For both the AS and nr-AxSpA populations the results of the meta-analyses demonstrated thatanti-TNFs produce statistically significant and clinically important benefits to patients in terms ofimproving function and reducing disease activity. The efficacy estimates were consistently slightlysmaller for nr-AxSpA than for AS.
l In AS, although there is a little variation in treatment effects and it is possible that infliximab may bemore effective than other anti-TNFs at 12 weeks, the evidence for this is not strong and it is plausiblethat anti-TNFs may have a common class effect, with the treatments being equally effective.
l Statistical heterogeneity was more apparent in the nr-AxSpA analyses than in the AS analyses. This maybe because of both clinical heterogeneity in the nr-AxSpA trials and the fact that fewer studies wereavailable for analysis. In the light of this heterogeneity, both the reliability of the nr-AxSpA-pooledestimates and their true relevance to patients seen in clinical practice is questionable.
l Effectiveness was maintained over time. About 50% of patients maintained a benefit at 2 and 5 years.l Evidence for an effect of anti-TNFs on radiographic disease progression was limited. The relatively
short-term follow-up available to date and the insensitivity of radiography as an imaging tool precludedthe drawing of firm conclusions regarding the role of anti-TNFs in preventing or delaying theprogression of AS; there are some data to suggest an identifiable benefit from around 4 years, butresults from ongoing long-term studies should help to clarify this issue.
l Sequential treatment with anti-TNFs can be worthwhile in patients with AS but the drug survivalresponse rates and benefits are reduced with second and third anti-TNFs.
ASSESSMENT OF CLINICAL EFFECTIVENESS
NIHR Journals Library www.journalslibrary.nihr.ac.uk
66
Chapter 4 Assessment of existing cost-effectivenessevidence
Systematic review of existing cost-effectiveness evidence
The following sections provide an overview of existing cost-effectiveness evidence and an assessment of therelevance of the data from the perspective of the UK NHS. The differences in the approaches and assumptionsused across the studies are examined in order to explain any discrepancies in the findings and to identify keyareas of remaining uncertainty. The findings from the review provide the basis for the development of a newdecision-analytic model reported in Chapter 6, Independent economic assessment: York model.
MethodsAn initial systematic search was undertaken in the NHS EED using a combination of technology names anddisease terms. Further searches were undertaken in MEDLINE and EMBASE for modelling and utility studiesusing disease terms only (as known references were not identified from the initial search in NHS EED). Onlyfull economic evaluations that compared two or more options and consider both costs and consequences(including cost-effectiveness, cost–utility and cost–benefit analyses) were included in the review of existingeconomic literature. No language and date limits were initially applied, although eligibility of studies wassubsequently restricted to those reporting results which were specific to the UK. Full details of the searchstrategies used are reported in Appendix 1.
In addition, as part of the current multiple TAs process, each manufacturer submitted de novo evidenceon the cost-effectiveness of the anti-TNFs in line with their indications for the treatment of AS andnr-AxSpA.34–37 These submissions are reviewed and the findings compared with those found in the reviewof previously published studies.
Results of review of existing cost-effectiveness evidenceThe combined searches retrieved 210 citations. A total of six UK studies reporting on the cost-effectivenessof anti-TNFs for the treatment of AS were identified. No previously published studies were identified forpatients with nr-AxSpA.
Four of these studies were industry-funded assessments of the following anti-TNFs: infliximab (Kobelt et al.2004152 and Kobelt et al. 2007160 both funded via an unrestricted grant by Schering-Plough), etanercept(Ara et al.161 funded by Wyeth pharmaceutical P.C.) and adalimumab (Botteman et al.162 funded by AbbottLaboratories). The three studies published in 2007 are largely based on the economic analyses originallysubmitted by the manufacturers to NICE as part of the previous multiple TA (TA143).17 As the earlierpublication by Kobelt has been superseded by the 2007 publication, only the latter publication is furtherconsidered in this review. The remaining two UK studies were publications of the assessments and/orcritiques undertaken by the independent Assessment Group/Evidence Review Group (ERG) for infliximab,etanercept and adalimumab for TA14338 and golimumab for TA233.163 Therefore, a total of five studiesmet the inclusion criteria and are included in this review.
The following sections provide a narrative discussion of each publication. The quality assessment of thesestudies is shown in Appendix 10. A single critique section is used to highlight the key issues and potentiallimitations of existing published cost-effectiveness evidence. These issues are then revisited with respect to thede novo analyses submitted by the manufacturers considering how these key issues and potential limitationshave been addressed in the two separate indications. The final section highlights the remaining issues anduncertainties and provides the basis for informing the development of a separate independent analysis of thecost-effectiveness of anti-TNFs for AS and nr-AxSpA relevant to informing decisions for the NHS.
DOI: 10.3310/hta20090 HEALTH TECHNOLOGY ASSESSMENT 2016 VOL. 20 NO. 9
© Queen’s Printer and Controller of HMSO 2016. This work was produced by Corbett et al. under the terms of a commissioning contract issued by the Secretary of State forHealth. This issue may be freely reproduced for the purposes of private research and study and extracts (or indeed, the full report) may be included in professional journalsprovided that suitable acknowledgement is made and the reproduction is not associated with any form of advertising. Applications for commercial reproduction should beaddressed to: NIHR Journals Library, National Institute for Health Research, Evaluation, Trials and Studies Coordinating Centre, Alpha House, University of Southampton SciencePark, Southampton SO16 7NS, UK.
67
Assessment of published cost-effectiveness studies
Kobelt et al.:160 Comparison of the Cost-Effectiveness of Infliximab in theTreatment of Ankylosing Spondylitis in the UK Based on Two DifferentClinical TrialsKobelt et al.160 estimated the cost-effectiveness of infliximab for the treatment of AS compared withstandard care over a lifetime horizon (60 years). Results were presented from both societal andNHS/personal social services (PSS) perspectives, although only the latter are reported here in line with thecurrent NICE reference case. Short-term effectiveness data were derived from two separate clinical trials(Braun et al.98 and ASSERT102,164) to inform the proportion and magnitude of initial response to treatmentexpressed in terms of BASDAI 50 (or a BASDAI ≤ 4) response (12–24 weeks) and changes in BASDAI andBASFI scores. These were combined with longer-term observational evidence on disease progression (BASFIonly) and other external sources on costs and utilities to estimate cost-effectiveness. Results were reportedseparately based on each trial. Costs and benefits were discounted at 3.5% and presented at 2005 prices.
MethodsThe cost-effectiveness model was based on a short-term decision tree representing the double-blindperiods of the trials (12–24 weeks) and a longer-term Markov model to estimate subsequent progression.The Markov model comprised three states: ‘Off treatment’, ‘On treatment’ and ‘Dead’. Only patientsresponding to treatment as defined by the following criteria [BASDAI ≤ 4 (scale 0–10) or a ≥ 50%improvement in BASDAI] remain on treatment at the end of the double-blind periods. Differential BASDAIand BASFI scores (scale 0–10) were derived from Braun [‘Off treatment’ BASDAI score= 6.3 and BASFIscore= 5.4; ‘On treatment’ (responders) BASDAI score= 1.8 and BASFI score= 2.0] and ASSERT102 [‘Offtreatment’ BASDAI score= 6.4 and BASFI score= 5.8; ‘On treatment’ (responders) BASDAI score= 1.4 andBASFI score= 1.9]. Disease progression was expressed in terms of changes in BASFI and was estimatedfrom two surveys conducted 10 years apart (n= 1110).152 The mean absolute annual change in BASFIapplied was + 0.07 (scale 0–10) and this was used to characterise the natural history of progression forpatients with AS without infliximab. Three main scenarios were presented reflecting different assumptionsconcerning the impact of infliximab on disease progression: (1) no progression while on treatment;(2) 50% of natural history (0.035/year); and (3) same as natural history (0.07/year).
Fifteen per cent of patients were assumed to discontinue from infliximab annually based on data specificto responders from the open-label extension period in the Braun trial. Interestingly, the authors noted thatthe persistence rate was lower in responders compared with the entire sample in the Braun trial98 and itsextension (approximately 10% withdrawal rate per annum). The BASDAI and BASFI scores for patientswho withdrew from infliximab were assumed to return to the mean score of the non-treated group.Mortality was modelled from general population life-tables applying a SMR of 1. Hence no additionalmortality was assumed to be related to AS and no direct or indirect benefits for mortality were assumedfor infliximab.
Disease costs and HRQoL were derived from a cross-sectional retrospective survey conducted at theUniversity of Bath, with the sample covering the full range of BASDAI and BASFI (1–10). The annual cost ofinfliximab was based on 5mg/kg body weight (weeks 0, 2 and 6 and then every 6 weeks). An initial costwas assigned to all patients starting treatment (£79.25) and an outpatient cost was applied to each infusion.
ResultsFrom a NHS perspective, the cost per quality-adjusted life-years (QALYs) gained ranged from £28,332 and£26,751 (no progression while on treatment) to £49,417 and £46,167 (no effect of treatment onprogression) as shown in Table 28. The model was also sensitive to the time horizon and the withdrawalrate. Using a 10-year horizon resulted in incremental cost-effectiveness ratios (ICERs) between 63% and66% higher than the base-case lifetime horizon (60 years) and a withdrawal rate of 5% resulted in ICERsbetween 22% and 33% higher than the base case (15%).
ASSESSMENT OF EXISTING COST-EFFECTIVENESS EVIDENCE
NIHR Journals Library www.journalslibrary.nihr.ac.uk
68
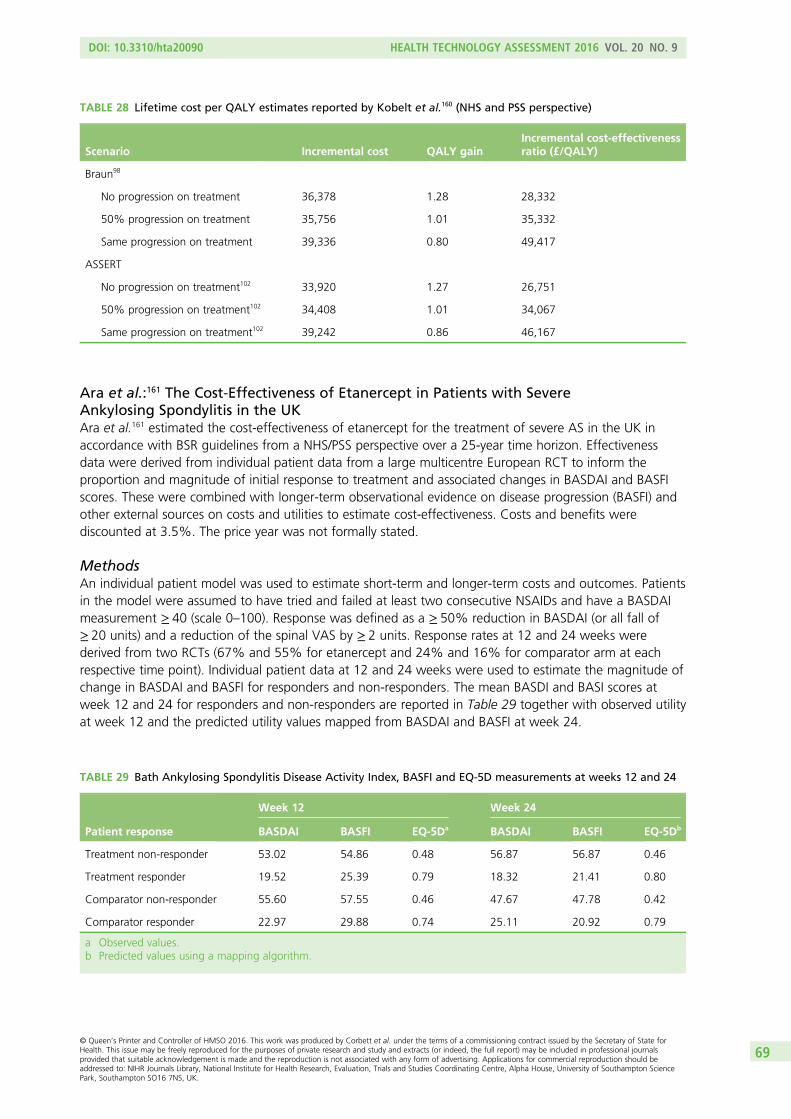
Ara et al.:161 The Cost-Effectiveness of Etanercept in Patients with SevereAnkylosing Spondylitis in the UKAra et al.161 estimated the cost-effectiveness of etanercept for the treatment of severe AS in the UK inaccordance with BSR guidelines from a NHS/PSS perspective over a 25-year time horizon. Effectivenessdata were derived from individual patient data from a large multicentre European RCT to inform theproportion and magnitude of initial response to treatment and associated changes in BASDAI and BASFIscores. These were combined with longer-term observational evidence on disease progression (BASFI) andother external sources on costs and utilities to estimate cost-effectiveness. Costs and benefits werediscounted at 3.5%. The price year was not formally stated.
MethodsAn individual patient model was used to estimate short-term and longer-term costs and outcomes. Patientsin the model were assumed to have tried and failed at least two consecutive NSAIDs and have a BASDAImeasurement ≥ 40 (scale 0–100). Response was defined as a ≥ 50% reduction in BASDAI (or all fall of≥ 20 units) and a reduction of the spinal VAS by ≥ 2 units. Response rates at 12 and 24 weeks werederived from two RCTs (67% and 55% for etanercept and 24% and 16% for comparator arm at eachrespective time point). Individual patient data at 12 and 24 weeks were used to estimate the magnitude ofchange in BASDAI and BASFI for responders and non-responders. The mean BASDI and BASI scores atweek 12 and 24 for responders and non-responders are reported in Table 29 together with observed utilityat week 12 and the predicted utility values mapped from BASDAI and BASFI at week 24.
TABLE 28 Lifetime cost per QALY estimates reported by Kobelt et al.160 (NHS and PSS perspective)
Scenario Incremental cost QALY gainIncremental cost-effectivenessratio (£/QALY)
Braun98
No progression on treatment 36,378 1.28 28,332
50% progression on treatment 35,756 1.01 35,332
Same progression on treatment 39,336 0.80 49,417
ASSERT
No progression on treatment102 33,920 1.27 26,751
50% progression on treatment102 34,408 1.01 34,067
Same progression on treatment102 39,242 0.86 46,167
TABLE 29 Bath Ankylosing Spondylitis Disease Activity Index, BASFI and EQ-5D measurements at weeks 12 and 24
Patient response
Week 12 Week 24
BASDAI BASFI EQ-5Da BASDAI BASFI EQ-5Db
Treatment non-responder 53.02 54.86 0.48 56.87 56.87 0.46
Treatment responder 19.52 25.39 0.79 18.32 21.41 0.80
Comparator non-responder 55.60 57.55 0.46 47.67 47.78 0.42
Comparator responder 22.97 29.88 0.74 25.11 20.92 0.79
a Observed values.b Predicted values using a mapping algorithm.
DOI: 10.3310/hta20090 HEALTH TECHNOLOGY ASSESSMENT 2016 VOL. 20 NO. 9
© Queen’s Printer and Controller of HMSO 2016. This work was produced by Corbett et al. under the terms of a commissioning contract issued by the Secretary of State forHealth. This issue may be freely reproduced for the purposes of private research and study and extracts (or indeed, the full report) may be included in professional journalsprovided that suitable acknowledgement is made and the reproduction is not associated with any form of advertising. Applications for commercial reproduction should beaddressed to: NIHR Journals Library, National Institute for Health Research, Evaluation, Trials and Studies Coordinating Centre, Alpha House, University of Southampton SciencePark, Southampton SO16 7NS, UK.
69
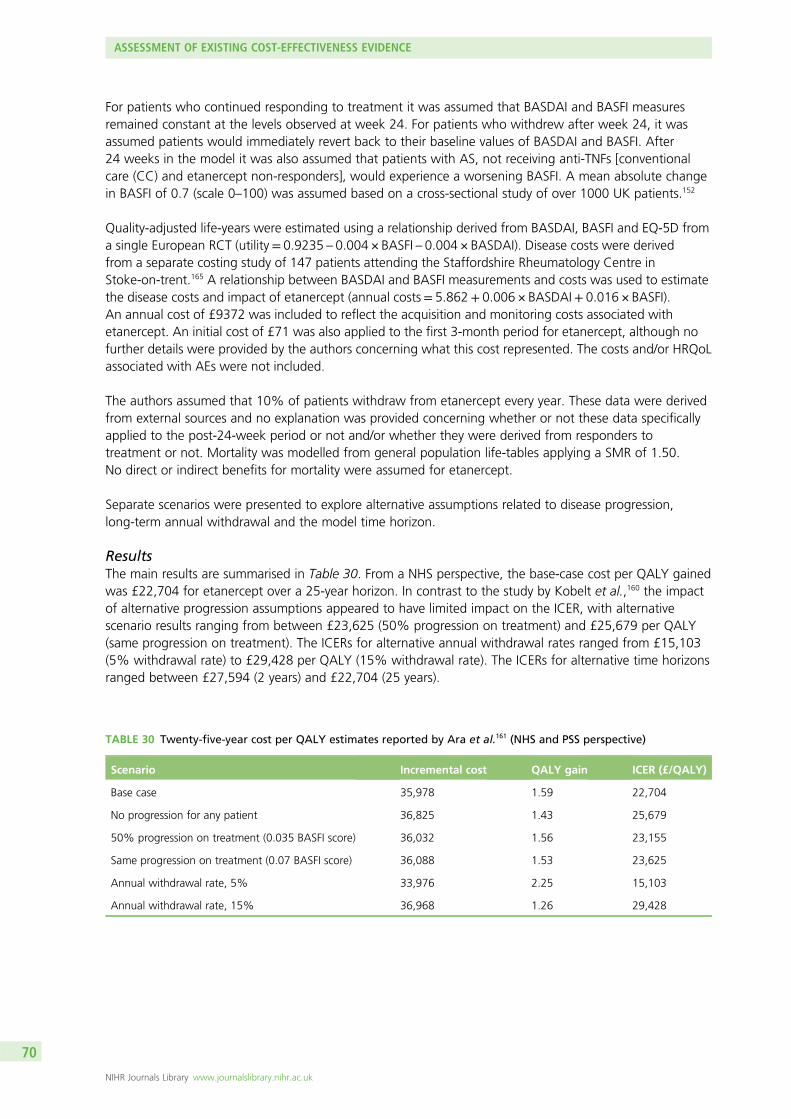
For patients who continued responding to treatment it was assumed that BASDAI and BASFI measuresremained constant at the levels observed at week 24. For patients who withdrew after week 24, it wasassumed patients would immediately revert back to their baseline values of BASDAI and BASFI. After24 weeks in the model it was also assumed that patients with AS, not receiving anti-TNFs [conventionalcare (CC) and etanercept non-responders], would experience a worsening BASFI. A mean absolute changein BASFI of 0.7 (scale 0–100) was assumed based on a cross-sectional study of over 1000 UK patients.152
Quality-adjusted life-years were estimated using a relationship derived from BASDAI, BASFI and EQ-5D froma single European RCT (utility= 0.9235 – 0.004 × BASFI – 0.004 × BASDAI). Disease costs were derivedfrom a separate costing study of 147 patients attending the Staffordshire Rheumatology Centre inStoke-on-trent.165 A relationship between BASDAI and BASFI measurements and costs was used to estimatethe disease costs and impact of etanercept (annual costs= 5.862+ 0.006 × BASDAI+ 0.016 × BASFI).An annual cost of £9372 was included to reflect the acquisition and monitoring costs associated withetanercept. An initial cost of £71 was also applied to the first 3-month period for etanercept, although nofurther details were provided by the authors concerning what this cost represented. The costs and/or HRQoLassociated with AEs were not included.
The authors assumed that 10% of patients withdraw from etanercept every year. These data were derivedfrom external sources and no explanation was provided concerning whether or not these data specificallyapplied to the post-24-week period or not and/or whether they were derived from responders totreatment or not. Mortality was modelled from general population life-tables applying a SMR of 1.50.No direct or indirect benefits for mortality were assumed for etanercept.
Separate scenarios were presented to explore alternative assumptions related to disease progression,long-term annual withdrawal and the model time horizon.
ResultsThe main results are summarised in Table 30. From a NHS perspective, the base-case cost per QALY gainedwas £22,704 for etanercept over a 25-year horizon. In contrast to the study by Kobelt et al.,160 the impactof alternative progression assumptions appeared to have limited impact on the ICER, with alternativescenario results ranging from between £23,625 (50% progression on treatment) and £25,679 per QALY(same progression on treatment). The ICERs for alternative annual withdrawal rates ranged from £15,103(5% withdrawal rate) to £29,428 per QALY (15% withdrawal rate). The ICERs for alternative time horizonsranged between £27,594 (2 years) and £22,704 (25 years).
TABLE 30 Twenty-five-year cost per QALY estimates reported by Ara et al.161 (NHS and PSS perspective)
Scenario Incremental cost QALY gain ICER (£/QALY)
Base case 35,978 1.59 22,704
No progression for any patient 36,825 1.43 25,679
50% progression on treatment (0.035 BASFI score) 36,032 1.56 23,155
Same progression on treatment (0.07 BASFI score) 36,088 1.53 23,625
Annual withdrawal rate, 5% 33,976 2.25 15,103
Annual withdrawal rate, 15% 36,968 1.26 29,428
ASSESSMENT OF EXISTING COST-EFFECTIVENESS EVIDENCE
NIHR Journals Library www.journalslibrary.nihr.ac.uk
70
Botteman et al.:162 Cost-Effectiveness of Adalimumab for the Treatment ofAnkylosing Spondylitis in the UKBotteman et al.162 evaluated the cost-effectiveness of adalimumab versus conventional therapy in patientswith active AS from a NHS perspective over a 30-year time horizon. Effectiveness data were derivedfrom pooled data from two Phase III studies in patients with an inadequate response to ≥ 1 NSAID.Micro-simulation methods were subsequently applied to these studies to simulate treatment decisions inaccordance with BSR guidelines and associated outcomes. These were combined with author assumptionson disease progression (BASFI only), utility and cost data from the clinical trials and other external sourcesto estimate cost-effectiveness. Costs and benefits were discounted at 3.5% using a 2004 price year.
MethodsMicro-simulation methods were applied to patients (n= 397) recruited into two adalimumab RCTs:ATLAS61 and M03-606. In the adalimumab clinical trials, patients were kept on active treatment even whenresponse had not been achieved. Consequently, simulation methods were applied to the patients in theclinical trial to mimic treatment decisions which more closely reflected treatment guidelines and therequirements of the economic model. In accordance with BSR guidelines, a response in the model wasdefined as a reduction of BASDAI of 50% or a decrease of ≥ 2 cm (scale 0–10) accompanied by areduction of spinal pain VAS of ≥ 2 cm. Assessment of initial response was assumed to take place 8 weeksafter treatment initiation. If the response criteria were not met at 8 weeks, a second response assessmentwas assumed at 12 weeks. Failure to achieve response on both occasions was assumed to lead towithdrawal of adalimumab therapy. Therapeutic responses were then assumed to be reviewed every3 months until the end of the simulation (year 30). Failure to maintain the original response led to repeatassessments after 6–12 weeks in the first 48 weeks. Failure to maintain response on both occasions led towithdrawal of adalimumab. After week 48, the simulation model defined inadequate response on thebasis of BASDAI scores only. In the RCTs, patients were allowed to switch to open-label adalimumab atweek 24; for these patients, LOCF at time of switch for BASDAI, BASFI and VAS values were used inthe model.
The BASDAI, BASFI and spinal pain scores were based on directly observed trial scores (until week 48) andadditional assumptions about disease progression (after week 48). The BASDAI, BASFI and spinal painscores were adjusted at each time point by a fixed value equal to the average difference betweenadalimumab and CC patients observed at baseline. BASDAI scores after week 48 were assumed to remainconstant at these levels for patients continuing to respond to adalimumab and for CC patients. BASFI wasassumed, for CC patients, to worsen after week 48 by 0.05 units (scale 0–10) annually. The estimateapplied to the increase in BASFI appears to be based on the authors’ own assumption but is argued to beconsistent with previous cost-effectiveness/epidemiological studies. In contrast, BASFI scores were assumedto remain stable for adalimumab while patients remained on therapy, which was argued to be consistentwith the assumptions applied in previous published cost-effectiveness studies. It was assumed thatpatients who discontinued would revert back to the BASFI scores of CC patients within 12 weeks (i.e. anybenefits in BASFI were not maintained over a longer period). This was argued by the authors to be aconservative assumption.
Utilities were derived from the Health Utilities Index 3 (HUI-3) from data at baseline and at 24 weeks fromboth adalimumab trials. A subsequent regression was estimated to predict utilities based on BASDAI,BASFI, sex and race [utility= 0.948857 – 0.041528 × BASDAI – 0.034481 × BASFI+ 0.047080 × Gender(1=male, 0= female) – 0.063801 × Race(1=white, 0= other)].
Estimates of disease costs were based on 2-year data from 208 patients in the OASIS study, conductedin the Netherlands, Belgium and France.118 An ordinary least squares regression was estimated usingonly BASDAI (and only BASFI in a sensitivity analysis). The regression utilised in the base-case was£708.45+ £750 × BASDAI. Hence each increase in BASDAI of 1 unit (scale 0–10) was assumed to beassociated with an increase in costs of £750.
DOI: 10.3310/hta20090 HEALTH TECHNOLOGY ASSESSMENT 2016 VOL. 20 NO. 9
© Queen’s Printer and Controller of HMSO 2016. This work was produced by Corbett et al. under the terms of a commissioning contract issued by the Secretary of State forHealth. This issue may be freely reproduced for the purposes of private research and study and extracts (or indeed, the full report) may be included in professional journalsprovided that suitable acknowledgement is made and the reproduction is not associated with any form of advertising. Applications for commercial reproduction should beaddressed to: NIHR Journals Library, National Institute for Health Research, Evaluation, Trials and Studies Coordinating Centre, Alpha House, University of Southampton SciencePark, Southampton SO16 7NS, UK.
71
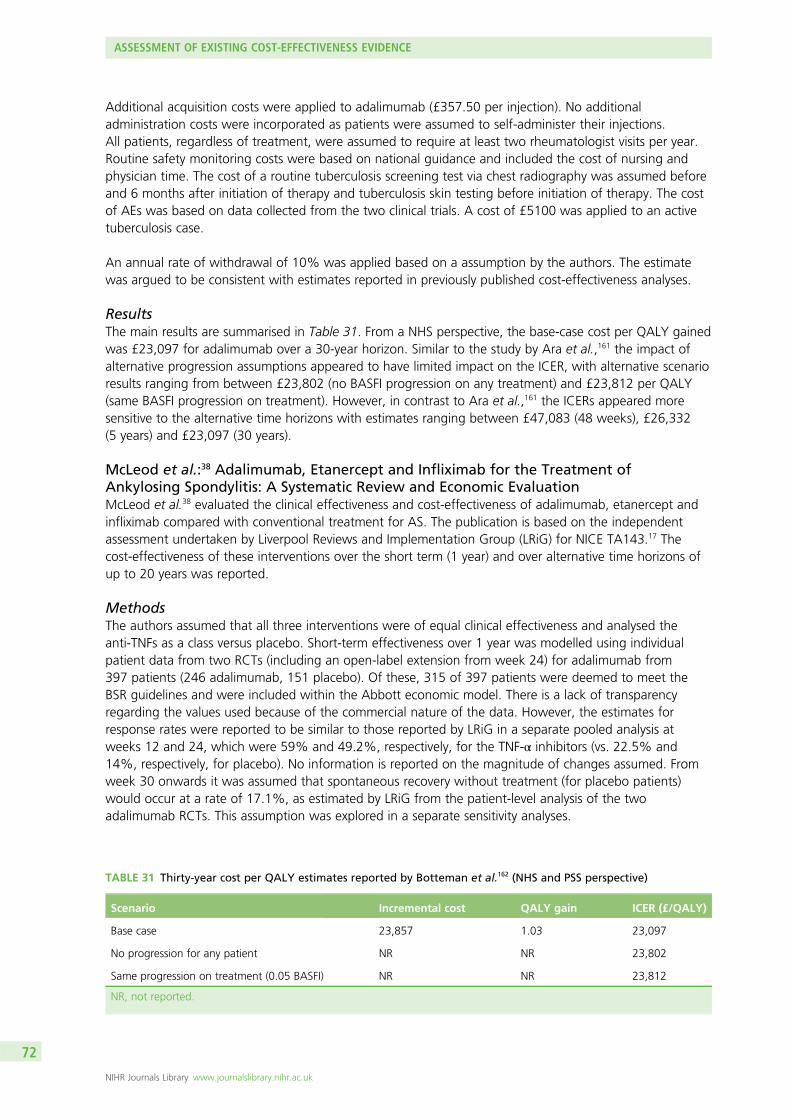
Additional acquisition costs were applied to adalimumab (£357.50 per injection). No additionaladministration costs were incorporated as patients were assumed to self-administer their injections.All patients, regardless of treatment, were assumed to require at least two rheumatologist visits per year.Routine safety monitoring costs were based on national guidance and included the cost of nursing andphysician time. The cost of a routine tuberculosis screening test via chest radiography was assumed beforeand 6 months after initiation of therapy and tuberculosis skin testing before initiation of therapy. The costof AEs was based on data collected from the two clinical trials. A cost of £5100 was applied to an activetuberculosis case.
An annual rate of withdrawal of 10% was applied based on a assumption by the authors. The estimatewas argued to be consistent with estimates reported in previously published cost-effectiveness analyses.
ResultsThe main results are summarised in Table 31. From a NHS perspective, the base-case cost per QALY gainedwas £23,097 for adalimumab over a 30-year horizon. Similar to the study by Ara et al.,161 the impact ofalternative progression assumptions appeared to have limited impact on the ICER, with alternative scenarioresults ranging from between £23,802 (no BASFI progression on any treatment) and £23,812 per QALY(same BASFI progression on treatment). However, in contrast to Ara et al.,161 the ICERs appeared moresensitive to the alternative time horizons with estimates ranging between £47,083 (48 weeks), £26,332(5 years) and £23,097 (30 years).
McLeod et al.:38 Adalimumab, Etanercept and Infliximab for the Treatment ofAnkylosing Spondylitis: A Systematic Review and Economic EvaluationMcLeod et al.38 evaluated the clinical effectiveness and cost-effectiveness of adalimumab, etanercept andinfliximab compared with conventional treatment for AS. The publication is based on the independentassessment undertaken by Liverpool Reviews and Implementation Group (LRiG) for NICE TA143.17 Thecost-effectiveness of these interventions over the short term (1 year) and over alternative time horizons ofup to 20 years was reported.
MethodsThe authors assumed that all three interventions were of equal clinical effectiveness and analysed theanti-TNFs as a class versus placebo. Short-term effectiveness over 1 year was modelled using individualpatient data from two RCTs (including an open-label extension from week 24) for adalimumab from397 patients (246 adalimumab, 151 placebo). Of these, 315 of 397 patients were deemed to meet theBSR guidelines and were included within the Abbott economic model. There is a lack of transparencyregarding the values used because of the commercial nature of the data. However, the estimates forresponse rates were reported to be similar to those reported by LRiG in a separate pooled analysis atweeks 12 and 24, which were 59% and 49.2%, respectively, for the TNF-α inhibitors (vs. 22.5% and14%, respectively, for placebo). No information is reported on the magnitude of changes assumed. Fromweek 30 onwards it was assumed that spontaneous recovery without treatment (for placebo patients)would occur at a rate of 17.1%, as estimated by LRiG from the patient-level analysis of the twoadalimumab RCTs. This assumption was explored in a separate sensitivity analyses.
TABLE 31 Thirty-year cost per QALY estimates reported by Botteman et al.162 (NHS and PSS perspective)
Scenario Incremental cost QALY gain ICER (£/QALY)
Base case 23,857 1.03 23,097
No progression for any patient NR NR 23,802
Same progression on treatment (0.05 BASFI) NR NR 23,812
NR, not reported.
ASSESSMENT OF EXISTING COST-EFFECTIVENESS EVIDENCE
NIHR Journals Library www.journalslibrary.nihr.ac.uk
72
The assessment group model assumed that patients withdraw from TNF-α inhibitor treatment at a rate of15% per year, which was considered to represent the ‘central value’ of the studies that were identifiedreporting longer-term discontinuation rates. This estimate is also the same as the annual rate reported inthe open-label extension study for infliximab (Braun trial) also reported in the review undertaken by LRiG.Rates of 7% and 24% were also explored in separate sensitivity analyses, representing the range of valuesreported across the studies considered. The annual withdrawal rate (after the first 12 months, as observedrates are used in the first 12 months) was applied to the difference in response rate between the two armsof the evaluation, rather than the absolute number of responders. This was to account for a potentialanomaly that could arise through the assumption of a constant level (17.1%) of spontaneous recoverywithout treatment.
The assessment group model took into account the cost of drug acquisition, administration, monitoringand AEs. No administration costs were assumed for etanercept and adalimumab, as it was assumed thatboth would be self-administered at home without supervision. The authors assumed an additional cost of£267 to administer infliximab infusions based on NHS Reference Costs estimates for the regular attendercost for chemotherapy with musculoskeletal primary diagnosis. Quarterly monitoring and testing wasassumed for all patients receiving long-term treatment with TNF-α inhibitors. However, two of theseassessments were assumed to take place at the patient’s routine follow-up outpatient visit, so only theadditional costs of tests for monitoring (£25) were applied to these assessments. The remaining twoassessments were assumed to be undertaken at a general practitioner’s surgery and an additional cost of£25 was assumed for nurse/general practitioner time in addition to the costs of tests for monitoring (£25).AEs costs were based on estimates reported by one manufacturer (Abbott) of £95.29 in the first year oftreatment and £47.65 per patient-year thereafter.
Disease-related costs to the NHS were estimated by fitting an exponential cost model to the weightedaggregate data from the OASIS study; a 2-year prospective study of 208 AS patients from four centresin France, Belgium and the Netherlands (n= 208).118 The exponential model estimated NHScost= £1585.30 × exp(0.1832 × BASFI). The OASIS data were considered by the authors to provide a morereliable source than other published studies from Stoke and Bath, being prospective in design and over alonger period. BASFI was used by the authors as the major predictor of costs because it was considered tobetter reflect long-term disease progression compared with BASDAI.
Health-related quality of life was estimated using the utility model provided by Schering-Plough developedfrom the Bath Survey data set on the grounds that it used a comparatively larger sample of UK AS patients(n= 1144), and also because it incorporated age and sex variables: utility= 0.8772129 – 0.0384087 ×BASDAI – 0.0322519 × BASFI – 0.0278913 ×Male+ 0.0016809 × Age.
The assessment group adopted a long-term increase in BASFI scores of 0.07 units per year for theconventional treatment comparator arm of the model. This progression rate is applied for all periods afterweek 20 in the model. In the base-case analysis, the same value was used in the intervention arm adjustedpro rata to the proportion remaining of the maximal excess response seen at 12 weeks. In effect, thisassumes that patients withdrawn from anti-TNFs are assumed to return to the same trajectory asnon-responders, such that there is no ensuring benefit associated with being an initial responder.
ResultsOver a 1-year time horizon, base-case ICERs for adalimumab and etanercept versus CC were essentially thesame (approximately £57,000 per QALY). In contrast, the ICER for infliximab was over £120,000 per QALY.With respect to modelling beyond 12 months, the results for adalimumab were considered as representative ofetanercept, and only the former were provided. In contrast with other published models, the ICERs increasedsteadily from year 2 onwards. At a 20-year horizon the ICERs for adalimumab/etanercept increased to £98,910per QALY and to £175,000 per QALY for infliximab.
DOI: 10.3310/hta20090 HEALTH TECHNOLOGY ASSESSMENT 2016 VOL. 20 NO. 9
© Queen’s Printer and Controller of HMSO 2016. This work was produced by Corbett et al. under the terms of a commissioning contract issued by the Secretary of State forHealth. This issue may be freely reproduced for the purposes of private research and study and extracts (or indeed, the full report) may be included in professional journalsprovided that suitable acknowledgement is made and the reproduction is not associated with any form of advertising. Applications for commercial reproduction should beaddressed to: NIHR Journals Library, National Institute for Health Research, Evaluation, Trials and Studies Coordinating Centre, Alpha House, University of Southampton SciencePark, Southampton SO16 7NS, UK.
73
Additional National Institute for Health and Care Excellence Decision SupportUnit analysesGiven the discrepancy between the results reported by McLeod et al.38 and the manufacturer’ssubmissions34–37 (largely reflected in the three industry-funded publications previously discussed in thissection)160–162 also submitted as part of TA143,17 additional work was undertaken by NICE’s DecisionSupport Unit (DSU) to reconcile the different models and to explore whether or not differences were aresult of different parameter inputs or alternative structural assumptions.
A common set of parameter values were applied by the DSU to the three manufacturer models and theLRiG model. The purpose of this was to attempt to identify whether or not differences between the resultsof the models persisted once this common set of values were used. The specific parameter values whichwere implemented were:
1. no improvement in BASFI or BASDAI for patients not on anti-TNFs2. BASFI progression prevented while on anti-TNFs3. BASFI progresses at 0.07 per annum when patients are not on anti-TNFs4. annual withdrawal rate of 7% from anti-TNFs5. baseline BASDAI/BASFI score averages 6.5/5.66. utility model as in the Schering-Plough submission7. assessment group parameters for cost parameters (drug costs only)8. a 20-year time horizon.
These parameter values were reported to have been the values agreed at a separate NICE committee meetingand consequently the rationale for these values and assumptions is not formally stated by the NICE DSU.
The results of the DSU analysis found that the manufacturer models all gave relatively consistent results foreach of the drugs. For Schering-Plough, the ICERs over 20 years for etanercept/adalimumab were £27,000or £24,000 and for infliximab were £58,000 and £50,000. Two figures were presented becauseSchering-Plough presented two different versions of the model which reflected two different trials. TheWyeth model gave results of £20,000 for etanercept and £39,000 for infliximab. Abbott gave results of£17,000 for adalimumab and £43,000 for infliximab (over a 30-year time horizon). These ICERs weremarkedly different from those reported by the independent assessment group. Using a similar set ofparameters the results for etanercept/adalimumab using the LRiG model were £42,000 and forinfliximab £82,000.
Further work by the DSU revealed that the differences appeared largely driven by two key assumptionswhich differed between the LRiG and industry models relating to:
1. the modelling of a ‘placebo’ effect2. the longer-term functions fitted to BASDAI and BASFI for responders to anti-TNFs.
The LRiG model applied a 17.1% rate of spontaneous recovery without treatment from week 30 onwards(i.e. akin to assuming a long-term ‘placebo’ response for CC) in contrast to the manufacturers who eitherassumed there would be no response with CC or that any response would be transient and dissipatequickly after the 12-week period.
The LRiG model also applied a quadratic function to the BASDAI and BASFI scores of responders over alonger-time horizon, compared with the linear functions used by the manufacturers. The use of a quadraticfunction assumes that that the difference compared with CC was decreasing (initially) with time; that is,over time, the differences in BASDAI/BASFI would slowly reduce in responders and eventually be the sameas for CC. However, the logical problem of applying a quadratic function is clear. While the scores arereducing for a period, at longer-time periods the function starts to increase again. The issues wereaddressed by LRiG by using various assumptions and logical constraints (i.e. BASDAI/BASFI score notallowed to be higher than CC).
ASSESSMENT OF EXISTING COST-EFFECTIVENESS EVIDENCE
NIHR Journals Library www.journalslibrary.nihr.ac.uk
74
To further reconcile the models, the DSU incorporated a series of alternative structural assumptions withinthe LRiG model. These assumptions included removing the 17.1% rate of spontaneous improvementapplied to CC and assuming constant BASDAI/BASFI scores after 1 year for responders. Applying theseassumptions resulted in an ICER for etanercept/adalimumab of £30,100 per QALY (estimates for infliximabnot reported) which were considered to be more consistent with the manufacturer results.
Importantly, the DSU highlighted that, although these analyses helped to reconcile the different modelresults, any progression in terms of BASDAI or BASFI over time while on treatment would cause the ICERto increase beyond £30,100. Similarly, the DSU concluded that the exclusion of the 17.1% spontaneousrecovery, without a comparable adjustment made to the intervention group was favourable towardsthe cost-effectiveness of TNF-α inhibitors and any adjustment for this issue would similarly lead to ahigher ICER.
Armstrong et al.:163 Golimumab for the Treatment of Ankylosing Spondylitis:a National Institute for Health and Care Excellence SingleTechnology AppraisalArmstrong et al.163 summarises the report undertaken by the ERG on the clinical effectiveness andcost-effectiveness of golimumab for AS for a NICE single technology appraisal (TA233).33 The ERG provideda critique of the manufacturer’s submission (Merck Sharp & Dohme)37 and undertook additionalexploratory analyses. The manufacturer’s model applied a 20-year time horizon in the base-case and aseparate lifetime analysis (60.1 years) was presented in a separate sensitivity analysis. The discount rateapplied was 3.5% for utilities and costs, and costs are considered from a NHS and PSS perspective.
MethodsThe manufacturer’s submission for golimumab37 was based on a single trial versus placebo (GO-RAISE90).A total of seven additional placebo controlled trials were included of other anti-TNFs; five RCTs foretanercept and two for adalimumab. In the absence of head-to-head studies directly comparing therelative effectiveness of the alternative anti-TNFs, the manufacturer undertook a Bayesian random-effectsmixed-treatment comparison (MTC) including BASDAI 50 response, discontinuations and SAEs. Alltreatments were reported by the manufacturer to be statistically significantly more effective than placeboin terms of BASDAI 50 response. No statistically significant differences were reported between each of thealternative anti-TNFs in terms of discontinuations and SAEs. When the alternative anti-TNFs were comparedwith each other, no significant differences between golimumab, adalimumab and etanercept wereidentified for BASDAI 50. A higher risk of discontinuation was reported for golimumab versus etanercept(relative risk 4.30, 95% CrI 1.01 to 18.50), although golimumab was associated with significantimprovements in BASDAI versus etanercept (mean difference –0.88, 95% CrI –1.58 to –0.14) and BASMIversus adalimumab (mean difference 0.52, 95% CrI 0.23 to 0.80).
The manufacturer cost-effectiveness model37 was based on a short-term decision tree (12 weeks) and alonger-term Markov model. The short-term tree was used to characterise response to each TNF-α inhibitortreatment based on the MTC results for BASDAI 50. After the short-term tree, patients entered a separateMarkov model with a cycle length of 12 weeks and time horizon of 20 years. If patients were alreadyreceiving a TNF-α inhibitor, they either stayed on therapy (‘on TNF inhibitor’ state) or discontinued therapybecause of lack of efficacy or AEs (‘not on TNF-inhibitor’ state). It was assumed that discontinuationsoccurred at a rate of 15% per year in line with NICE TA143.17 To model the lower disease activity justafter discontinuation of TNF-α inhibitor therapy, two 12-week tunnel states (‘just discontinued’ and‘discontinued’) were also incorporated into the model. Patients who are in the health state ‘on TNF-αinhibitor’ are assumed to have at least a 50% improvement in BASDAI (BASDAI 50) during the first12 weeks of treatment and do not discontinue. Treatment is discontinued in patients whose conditiondoes not respond to treatment and they are switched to conventional therapy. Patients in the CC armenter the Markov model in the ‘not on TNF-α inhibitor’ state. Patients could die at any point in the model.
DOI: 10.3310/hta20090 HEALTH TECHNOLOGY ASSESSMENT 2016 VOL. 20 NO. 9
© Queen’s Printer and Controller of HMSO 2016. This work was produced by Corbett et al. under the terms of a commissioning contract issued by the Secretary of State forHealth. This issue may be freely reproduced for the purposes of private research and study and extracts (or indeed, the full report) may be included in professional journalsprovided that suitable acknowledgement is made and the reproduction is not associated with any form of advertising. Applications for commercial reproduction should beaddressed to: NIHR Journals Library, National Institute for Health Research, Evaluation, Trials and Studies Coordinating Centre, Alpha House, University of Southampton SciencePark, Southampton SO16 7NS, UK.
75
Disease progression was incorporated in the model using BASDAI and BASFI scores. Data from theGO-RAISE90 trial and the open-label extension period were used to develop predictive equations of meanchange from baseline in BASDAI and BASFI scores over time. Two separate equations were developedbased on the 24-week data for all patients and post-24-week data from GO-RAISE90 for responders only.These equations were used for all anti-TNFs and the manufacturer assumed that the scores followed theGO-RAISE90 data for 2 years before they either levelled off (BASDAI) or started to deteriorate [BASFI at50% of the rate of CC, equivalent to an increase of 0.035 (scale 0–10) units per year].
Although the equations are critical to the model structure and parameter estimates, these are not reportedin the paper by Armstrong et al.163 A separate examination of the full ERG report33 revealed that thesewere reported as CiC by the manufacturer and hence it is not possible to report the assumptions made inrelation to the magnitude of change in BASDAI and BASFI over the initial 24-week period and subsequentpost-24-week period for the anti-TNFs (responders, non-responders) and CC. BASFI scores for CC werereported to deteriorate according to the GO-RAISE trial (short-term equations were available only) afterwhich they were assumed to deteriorate at a rate of 0.07 units per year. The assumptions related tothe impact of discontinuation of anti-TNFs are not formally stated in the paper by Armstrong et al.163
However, the structure of the model implies that patients will revert back to the subsequent trajectories ofCC for both BASDAI and BASFI after 2 cycles (24 weeks).
Utilities were derived from the previous NICE TA (TA14317) and incorporated age, sex, BASFI and BASDAI.Costs included in the model comprised drug acquisition, short-term (12-week) costs, longer-term diseasecosts and AEs. Longer-term disease costs were based on BASFI scores from the GO-RAISE90 trial usingthe same regression equation used for NICE TA guidance 143. Mortality was included in the model andwas considered to be a constant across the comparator treatments at a relative risk of 1.47.
ResultsThe main base-case results from the manufacturer are summarised in Table 32. From a NHS perspective,the base-case cost per QALY gained was £26,597 for golimumab compared with CC over a 20-yearhorizon. Both etanercept and adalimumab were reported to be extendedly dominated by golimumab.
The ERG undertook a limited validation of the model and reported various errors which were corrected.However, they concluded that questions remained concerning the integrity of the manufacturer model.The ERG subsequently presented results based on an exploratory reanalysis of the manufacturer’ssubmission, using results from a separate MTC analysis and employing a lifetime horizon. The results of theERG reanalysis are reported in in Table 33. The results of this re-analysis resulted in golimumab beingextendedly dominated by the other two anti-TNFs.
There is no discussion by Armstrong et al.163 of the appropriateness of the assumptions applied to BASFIprogression, despite this being a critical structural assumption. However, a separate sensitivity analysis waspresented in the full ERG report which uses the same rate of disease progression for BASFI (0.07 units peryear) for all patients after 2 years. As part of this analysis, the ERG corrected errors identified in the waythe BASFI regression equations were incorporated by the manufacturer.
TABLE 32 Manufacturer cost-effectiveness results: 20-year horizon37
Technology Costs (£) QALYs Incremental costs Incremental QALYs ICER (£)
CC 88,667 6.6581 – – –
Adalimumab 93,601 6.8426 4934 0.1845 N/A (extendedly dominated)
Etanercept 93,782 6.8504 5115 0.1923 N/A (extendedly dominated)
Golimumab 93,786 6.8506 5119 0.1925 26,597
N/A, not applicable.
ASSESSMENT OF EXISTING COST-EFFECTIVENESS EVIDENCE
NIHR Journals Library www.journalslibrary.nihr.ac.uk
76
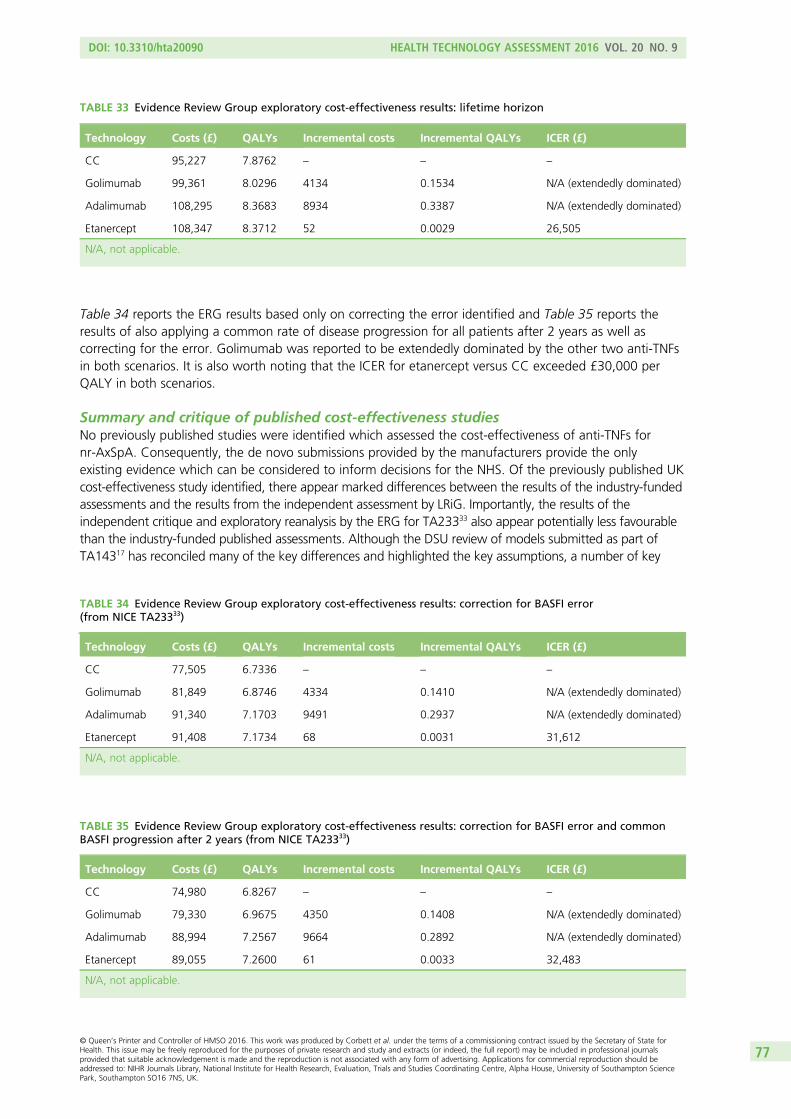
Table 34 reports the ERG results based only on correcting the error identified and Table 35 reports theresults of also applying a common rate of disease progression for all patients after 2 years as well ascorrecting for the error. Golimumab was reported to be extendedly dominated by the other two anti-TNFsin both scenarios. It is also worth noting that the ICER for etanercept versus CC exceeded £30,000 perQALY in both scenarios.
Summary and critique of published cost-effectiveness studiesNo previously published studies were identified which assessed the cost-effectiveness of anti-TNFs fornr-AxSpA. Consequently, the de novo submissions provided by the manufacturers provide the onlyexisting evidence which can be considered to inform decisions for the NHS. Of the previously published UKcost-effectiveness study identified, there appear marked differences between the results of the industry-fundedassessments and the results from the independent assessment by LRiG. Importantly, the results of theindependent critique and exploratory reanalysis by the ERG for TA23333 also appear potentially less favourablethan the industry-funded published assessments. Although the DSU review of models submitted as part ofTA14317 has reconciled many of the key differences and highlighted the key assumptions, a number of key
TABLE 33 Evidence Review Group exploratory cost-effectiveness results: lifetime horizon
Technology Costs (£) QALYs Incremental costs Incremental QALYs ICER (£)
CC 95,227 7.8762 – – –
Golimumab 99,361 8.0296 4134 0.1534 N/A (extendedly dominated)
Adalimumab 108,295 8.3683 8934 0.3387 N/A (extendedly dominated)
Etanercept 108,347 8.3712 52 0.0029 26,505
N/A, not applicable.
TABLE 35 Evidence Review Group exploratory cost-effectiveness results: correction for BASFI error and commonBASFI progression after 2 years (from NICE TA23333)
Technology Costs (£) QALYs Incremental costs Incremental QALYs ICER (£)
CC 74,980 6.8267 – – –
Golimumab 79,330 6.9675 4350 0.1408 N/A (extendedly dominated)
Adalimumab 88,994 7.2567 9664 0.2892 N/A (extendedly dominated)
Etanercept 89,055 7.2600 61 0.0033 32,483
N/A, not applicable.
TABLE 34 Evidence Review Group exploratory cost-effectiveness results: correction for BASFI error(from NICE TA23333)
Technology Costs (£) QALYs Incremental costs Incremental QALYs ICER (£)
CC 77,505 6.7336 – – –
Golimumab 81,849 6.8746 4334 0.1410 N/A (extendedly dominated)
Adalimumab 91,340 7.1703 9491 0.2937 N/A (extendedly dominated)
Etanercept 91,408 7.1734 68 0.0031 31,612
N/A, not applicable.
DOI: 10.3310/hta20090 HEALTH TECHNOLOGY ASSESSMENT 2016 VOL. 20 NO. 9
© Queen’s Printer and Controller of HMSO 2016. This work was produced by Corbett et al. under the terms of a commissioning contract issued by the Secretary of State forHealth. This issue may be freely reproduced for the purposes of private research and study and extracts (or indeed, the full report) may be included in professional journalsprovided that suitable acknowledgement is made and the reproduction is not associated with any form of advertising. Applications for commercial reproduction should beaddressed to: NIHR Journals Library, National Institute for Health Research, Evaluation, Trials and Studies Coordinating Centre, Alpha House, University of Southampton SciencePark, Southampton SO16 7NS, UK.
77
uncertainties remain. The remainder of this section provides an overview of the issues and uncertaintiesidentified based on existing published studies and the DSU reports. This summary provides an important basisfor considering the extent to which the de novo submissions provided by the manufacturers for this appraisalhave adequately addressed these.
All existing models are based on similar two part structures:
l initial-response period (short-term model used to determine initial response rate)l post-response period (longer-term model used to characterise natural history of disease (i.e. without
anti-TNFs) and impact of anti-TNFs (while on therapy and when therapy is stopped).
All models use changes in BASDAI and/or BASFI to quantitatively model the short- and longer-term costsand quality-of-life implications (using QALYs) of the use of anti-TNFs versus CC alone.
Although there are differences between the modelling of the initial response period, existing models arebroadly comparable being based on an assessment around 12 weeks (and potentially at 24 weeks as well)using a particular variant of existing BSR guidelines. Patients receiving anti-TNFs who meet the responsecriteria at the 12-/24-week assessment are continued on anti-TNFs. Anti-TNFs are withdrawn innon-responders at the 12-/24-week assessment point and patients subsequently receive CC alone.
However, there are marked differences between existing studies in relation to the modelling of thepost-response period and the assumptions used. This period is often separated into different time intervalsallowing different assumptions to be made regarding the effect of anti-TNFs (i.e. initially improving withtime in responders but then later ‘levelling off’ or even deteriorating over a longer-term time horizonrelative to CC). An important difference between existing models is the timing of this ‘levelling off’ periodand assumptions employed over a longer time horizon. The differences in approaches and the timing ofthis ‘flattening off’ period are also closely linked to the data used, that is whether or not the changes inBASDAI/BASFI used in the model are restricted to the 12- to 24-week data from RCT evidence reportedduring the double-blind phase (Kobelt et al. 2007160 and Ara et al. 2007161) or also incorporate longer-termdata from the open-label extensions. Studies which use change in BASDAI/BASFI data directly in themodel, from the double-blind phase, appear to use shorter ‘levelling off’ periods than studies usingdata from the open-label extension phase (Botteman et al. 2007,162 McLeod et al. 200738 and Armstronget al. 2007163).
Those studies incorporating an open-label extension typically assume continuing changes in BASDAI/BASFIfor responders to anti-TNFs versus non-responders/CC beyond the initial 12/24-week period. Importantly,none of the studies using open-label extension data appear to provide any discussion of the potentialfor selection bias (e.g. related to the initial consent for patients to participate and/or agree to switchtreatments as well as ongoing selection issues concerning retention over a longer period) and how theseshould be considered and/or adjusted for in the economic model. However, the implication of this isimportant, as the assumption being made by several models appears to incorporate an assumption ofan increasing effect of anti-TNFs in responders over time (i.e. in terms of continuing improvements inBASDAI/BASFI), which does not appear to be adequately justified or related to any underlying clinical/pharmacological mechanism. In the absence of the counter-factual (i.e. comparable data in patients whodid not participate or were subsequently withdrawn from the open-label study) it is unclear whether theapparent increasing effect is simply a function of the selection issue or is a real effect of the anti-TNFs.Importantly, those studies which only use data from the double-blind periods of RCTs often cite theopen-label data as providing supportive evidence regarding the maintenance of the effects observed at12/24 weeks but do not use it to support an assumption of an increasing effect over time.
ASSESSMENT OF EXISTING COST-EFFECTIVENESS EVIDENCE
NIHR Journals Library www.journalslibrary.nihr.ac.uk
78
The longer-term impact on costs and utilities beyond the initial response period are subsequentlyquantified by estimating separate BASDAI/BASFI ‘trajectories’ for different patient categories. The threemain categories are:
1. CC2. non-responder to anti-TNFs at 12-/24-week assessment3. initial responder to anti-TNFs at 12-/24-week assessment.
The ‘trajectory’ for patients who are responders to anti-TNFs at the initial 12-/24-week assessment arefurther separated into (1) the period up to the point that anti-TNFs are subsequently withdrawn(i.e. because of loss of efficacy or AEs) and (2) the period post TNF-α inhibitor withdrawal.
After the ‘levelling off’ period for BASDAI, the majority of existing studies assume BASDAI is constant over thelonger term, that is the BASDAI of responders to anti-TNFs is assumed to be lower than the equivalent BASDAIvalue (lower disease activity) applied to CC/non-responders and a constant difference is assumed to be retaineduntil patients discontinue. At the point of discontinuation of anti-TNFs, patients subsequently revert backto the same value assumed for CC/placebo and non-responders to anti-TNFs at 12/24 weeks. Hence, anyimprovement in BASDAI is assumed to dissipate immediately or within a short period (3–6 months) afterdiscontinuation of anti-TNFs.
All existing studies model BASFI as a linearly increasing function over the longer term for non-responders/CC,that is a constant rate of change is subsequently applied which is used to characterise the impact of diseaseprogression on functional ability, typically a worsening of 0.07 (0–10 scale) units per annum. Again, thesame assumptions applied to BASDAI for non-responders to anti-TNFs are applied to BASFI, that is beyond12/24 weeks non-responders are assumed to follow an identical BASFI ‘trajectory’ as that of CC/placebopatients. By contrast, patients who respond to anti-TNFs are typically assumed not to ‘progress’ further interms of functional disability, or progress at a lower rate than CC patients, while continuing to receiveanti-TNFs. Hence the difference in individual mean BASFI scores increases over time in existing economicmodels between patients who continue to receive anti-TNFs and non-responders/CC.
The only study which employs a markedly different approach to the modelling of BASDAI and BASFI forresponders is the study undertaken by the previous independent assessment group (LRiG) for TA143.17
Instead, LRiG applied a quadratic function to the BASDAI and BASFI scores of responders. This approachassumed that the difference compared with CC was decreasing (initially) with time, that is, over time,the differences in BASDAI/BASFI would slowly reduce in responders and eventually be the same as for CC.While the logical problems of applying a quadratic function over a longer period were recognised by theauthors (i.e. function begins to increase after a particular period) and was addressed using a series oflogical restrictions (i.e. BASDAI/BASFI score constrained to be the same or better than CC), the clinical‘face’ validity of this approach also appears questionable in the context of longer-term projections whichare required for appropriate assessments of cost-effectiveness.
Another key difference between existing studies relates to the assumptions made concerning thesubsequent trajectory of BASFI for patients who withdraw from active treatment. Given that BASFI islinearly increasing with time for CC, the assumption of the subsequent BASFI trajectory is potentially animportant driver of cost-effectiveness. This is often referred to as ‘rebound’. Typically, two scenariosare used:
l Rebound equal to gain: when patients fail therapy (after initially responding), their BASFI deterioratesby the same amount by which it improves when they responded to therapy.
l Rebound back to natural history/CC: when patients fail therapy (after initially responding), their BASFIdeteriorates to the level and subsequent trajectory it would have been had they not initially respondedto therapy.
DOI: 10.3310/hta20090 HEALTH TECHNOLOGY ASSESSMENT 2016 VOL. 20 NO. 9
© Queen’s Printer and Controller of HMSO 2016. This work was produced by Corbett et al. under the terms of a commissioning contract issued by the Secretary of State forHealth. This issue may be freely reproduced for the purposes of private research and study and extracts (or indeed, the full report) may be included in professional journalsprovided that suitable acknowledgement is made and the reproduction is not associated with any form of advertising. Applications for commercial reproduction should beaddressed to: NIHR Journals Library, National Institute for Health Research, Evaluation, Trials and Studies Coordinating Centre, Alpha House, University of Southampton SciencePark, Southampton SO16 7NS, UK.
79
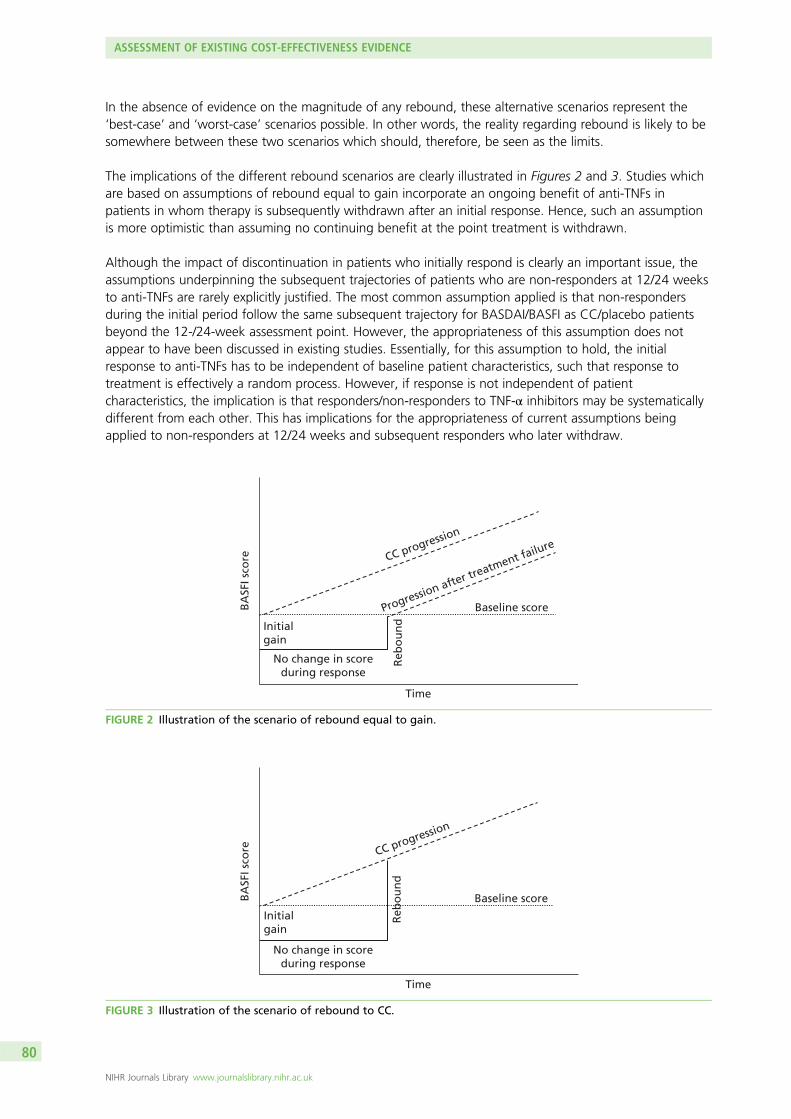
In the absence of evidence on the magnitude of any rebound, these alternative scenarios represent the‘best-case’ and ‘worst-case’ scenarios possible. In other words, the reality regarding rebound is likely to besomewhere between these two scenarios which should, therefore, be seen as the limits.
The implications of the different rebound scenarios are clearly illustrated in Figures 2 and 3. Studies whichare based on assumptions of rebound equal to gain incorporate an ongoing benefit of anti-TNFs inpatients in whom therapy is subsequently withdrawn after an initial response. Hence, such an assumptionis more optimistic than assuming no continuing benefit at the point treatment is withdrawn.
Although the impact of discontinuation in patients who initially respond is clearly an important issue, theassumptions underpinning the subsequent trajectories of patients who are non-responders at 12/24 weeksto anti-TNFs are rarely explicitly justified. The most common assumption applied is that non-respondersduring the initial period follow the same subsequent trajectory for BASDAI/BASFI as CC/placebo patientsbeyond the 12-/24-week assessment point. However, the appropriateness of this assumption does notappear to have been discussed in existing studies. Essentially, for this assumption to hold, the initialresponse to anti-TNFs has to be independent of baseline patient characteristics, such that response totreatment is effectively a random process. However, if response is not independent of patientcharacteristics, the implication is that responders/non-responders to TNF-α inhibitors may be systematicallydifferent from each other. This has implications for the appropriateness of current assumptions beingapplied to non-responders at 12/24 weeks and subsequent responders who later withdraw.
BA
SFI s
core
Time
Initialgain
Reb
ou
nd
No change in scoreduring response
Baseline score
CC progression
Progression after treatment failure
FIGURE 2 Illustration of the scenario of rebound equal to gain.
BA
SFI s
core
Time
Initialgain
Reb
ou
nd
No change in scoreduring response
Baseline score
CC progression
FIGURE 3 Illustration of the scenario of rebound to CC.
ASSESSMENT OF EXISTING COST-EFFECTIVENESS EVIDENCE
NIHR Journals Library www.journalslibrary.nihr.ac.uk
80
For example, all other things being equal, if patients with more severe disease (high BASDAI/high BASFI)were more likely not to respond, then assuming that the non-responders at 12/24 weeks follow the sametrajectory as the ‘average’ CC/placebo patient is likely to be optimistic towards the anti-TNFs (and viceversa for if less severe patients are more likely to respond). Hence, rather than following the trajectory ofan ‘average’ placebo/CC patient, a non-responder may actually follow a different trajectory, that is that ofan equivalent more/less severe CC patient. Inevitably, the impact of different patient characteristics is likelyto be more complex than the simplistic scenarios presented above.
As previously noted, all models use changes in BASDAI and/or BASFI to quantitatively model the short- andlonger-term costs and quality-of-life implications (using QALYs) of the use of anti-TNFs versus CC. Thejustification for using these measures appears largely driven by the existence of external sources of costsand health utility estimates which can be directly linked to these measures and not to others (e.g. BASMI,ASDAS, mSASSS, etc.). Hence current models appear more of a function of the data which are available tolink to costs and utilities rather than being based on a clear underlying biological or clinical process. Thisraises more general conceptual concerns regarding existing models and also regarding the generalisabilityof findings in an AS population to the separate nr-AxSpA population.
The use of BASDAI/BASFI per se is perhaps not the most significant issue, as in the absence of alternativemapping functions to costs and/or utilities it is unclear how to estimate longer-term costs and QALYswithout ultimately linking to these measures. However, it is concerning that the majority of existing studiesdo not appear to link the data and assumptions applied to these measures to any coherent clinicalunderpinning regarding differences between population characteristics and the effect of anti-TNFs.Consequently, ‘progression’ over time is currently modelled entirely via changes in BASFI, as BASDAI isassumed to remain constant. However, no attempt is made to justify why BASFI increases, the rate atwhich it increases and how this rate might differ across different groups as well as the impact thatanti-TNFs might have (i.e. any effect on BASFI which may be independent of the effect on BASDAI).
Modelling ‘progression’ implicitly (i.e. employing natural history estimates of the rate of change of BASFIfrom external studies) rather than explicitly (i.e. attempting to explain how BASFI evolves over time inrelation to inflammatory and other processes and how these may differ within populations and across theAS and nr-AxSpA groups) has led to a series of implicit/evidence-free assumptions. These include:
l No change in BASFI while receiving anti-TNFs (i.e. assuming implicitly that these act as disease modifiersand that while patients respond and continue to receive them, further deterioration in functionalprogression is completely prevented).
l Lower BASFI changes while receiving anti-TNFs (i.e. assuming that anti-TNFs do not completely haltfurther deterioration in functional progression but that the rate of progression is reduced relativeto progression on CC).
l Similar natural history rates of change in BASFI across different subgroups and populations(i.e. assuming that rate of change in BASFI is independent of time and/or patient characteristics).
Similar conceptual concerns were also highlighted by the NICE DSU in their work to support TA143, notingthat in inflammatory arthritis a clearer conceptual relationship is assumed between disease activity, radiographicprogression and physical functioning, such that changes in physical functioning can be more clearly related todifferent processes and evidence for the anti-TNFs on each separate process. In highlighting these issues, theDSU cited emerging longer-term data reported for anti-TNFs based on measures of radiographic progression(mSASSS) in AS. Although this evidence was not formally included in their analyses, the evidence was cited toindicate that an assumption of no further progression while on anti-TNFs for AS was potentially optimisticbased on emerging longer-term radiographic progression data.
Importantly, the only UK study published since the NICE DSU review did subsequently use a less favourableassumption concerning the impact of anti-TNFs on functional progression (BASFI). The assumption used bythe manufacturer for golimumab37 assumed that the longer-term rate of change in BASFI for responders
DOI: 10.3310/hta20090 HEALTH TECHNOLOGY ASSESSMENT 2016 VOL. 20 NO. 9
© Queen’s Printer and Controller of HMSO 2016. This work was produced by Corbett et al. under the terms of a commissioning contract issued by the Secretary of State forHealth. This issue may be freely reproduced for the purposes of private research and study and extracts (or indeed, the full report) may be included in professional journalsprovided that suitable acknowledgement is made and the reproduction is not associated with any form of advertising. Applications for commercial reproduction should beaddressed to: NIHR Journals Library, National Institute for Health Research, Evaluation, Trials and Studies Coordinating Centre, Alpha House, University of Southampton SciencePark, Southampton SO16 7NS, UK.
81
who continued on treatment would be 50% of that assumed for CC/non-responders. Although thisassumption is a significant departure from the base-case assumptions applied within previous industry-fundedstudies, no justification appeared to be identified to support this by Armstrong et al.163 in the review of themanufacturer’s submission.
In summary, there appear to be significant differences between the cost-effectiveness results reported inexisting UK published studies. Many of these differences appear largely because of differences in datasources (i.e. double-blind period vs. open-label extensions), subsequent assumptions and estimates relatedto the magnitude and duration of the differences in BASDAI and BASFI measurements between respondersand non-responders in the short to medium term (i.e. the ‘levelling off’ period) and then longer termin relation to assumptions concerning BASFI progression, and issues around ‘placebo’ effect and thewithdrawal of anti-TNFs. Some of the main differences between existing studies have been highlighted ina separate review by the NICE DSU. However, while this review is helpful in identifying the impact ofparameter and structural assumptions, it does not provide a basis for informing which assumptions appearmost justified based on existing data and clinical understanding of the progression of AS and the impact ofanti-TNFs. It is also concerning that many of the existing studies are based on CiC data and hence lacktransparency regarding specific inputs and assumptions.
To date, only two UK studies have attempted to assess the cost-effectiveness of the alternative anti-TNFs.One of these studies, McLeod et al.,38 assumed that the alternative treatments were identical in termsof clinical effectiveness and hence only considered differences in the acquisition, administration andmonitoring costs. The justification provided by the authors was based on the lack of statistically significantdifferences across key outcome measures based on indirect comparisons. The other study, Armstronget al.,163 assumed differences in the clinical effectiveness of the alternative anti-TNFs based on a separateMTC. However, differences between the anti-TNFs appeared sensitive to the studies included and thespecific outcomes considered. Hence different conclusions could be drawn concerning the most ‘efficient’intervention depending on the analysis considered. However, the magnitude of differences in clinical effectand QALYs remained small and the clinical and economic value of this might appear questionable.
There are conceptual concerns surrounding all existing models relating to the subsequent projection ofBASDAI and BASFI over a longer time horizon which are required in order to generate more appropriatelifetime estimates of costs and QALYs required for cost-effectiveness assessments. The speculative natureof these projections was highlighted as a significant concern by the previous independent assessmentgroup (LRiG) and hence their longer-term results were presented as exploratory scenarios. However, itappears that all existing models are largely based on implicit approaches and assumptions, and lack aclearer conceptual basis which might help to more appropriately inform parameter estimates and structuralassumptions, and facilitate a more evidence-based assessment of the potential longer-term impactof anti-TNFs.
The following sections present a summary of the de novo submissions provided by the manufacturers34–37
for the separate AS and nr-AxSpA indications. Brief overviews of the manufacturers’ submissions for ASand nr-AxSpA are provided alongside a summary of the base-case cost-effectiveness results. This isfollowed by a more in-depth comparison of key parameter and structural assumptions across themanufacturers and the separate indications. The issues and concerns regarding existing published studiesare used as the basis for a more critical assessment of these submissions and the extent to which theseconcerns have been adequately addressed and key uncertainties which still remain have been highlightedis investigated.
It should be noted that although fully incremental results were routinely presented by each manufacturer,there were differences between manufacturers in terms of how the results were presented and alsowhether or not the correct calculations based on dominance and extended dominance were included.Consequently, the fully incremental ICER tables reported are based on our own calculations to ensureaccuracy and consistency between the various manufacturer results tables.
ASSESSMENT OF EXISTING COST-EFFECTIVENESS EVIDENCE
NIHR Journals Library www.journalslibrary.nihr.ac.uk
82
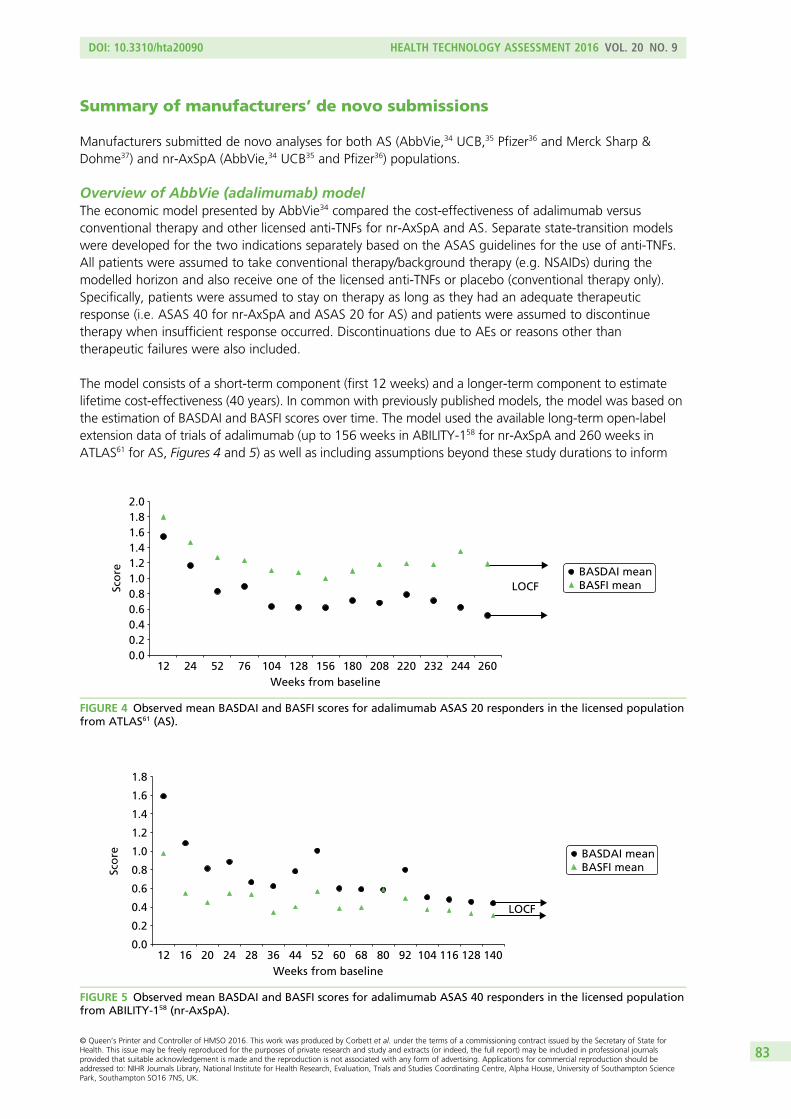
Summary of manufacturers’ de novo submissions
Manufacturers submitted de novo analyses for both AS (AbbVie,34 UCB,35 Pfizer36 and Merck Sharp &Dohme37) and nr-AxSpA (AbbVie,34 UCB35 and Pfizer36) populations.
Overview of AbbVie (adalimumab) modelThe economic model presented by AbbVie34 compared the cost-effectiveness of adalimumab versusconventional therapy and other licensed anti-TNFs for nr-AxSpA and AS. Separate state-transition modelswere developed for the two indications separately based on the ASAS guidelines for the use of anti-TNFs.All patients were assumed to take conventional therapy/background therapy (e.g. NSAIDs) during themodelled horizon and also receive one of the licensed anti-TNFs or placebo (conventional therapy only).Specifically, patients were assumed to stay on therapy as long as they had an adequate therapeuticresponse (i.e. ASAS 40 for nr-AxSpA and ASAS 20 for AS) and patients were assumed to discontinuetherapy when insufficient response occurred. Discontinuations due to AEs or reasons other thantherapeutic failures were also included.
The model consists of a short-term component (first 12 weeks) and a longer-term component to estimatelifetime cost-effectiveness (40 years). In common with previously published models, the model was based onthe estimation of BASDAI and BASFI scores over time. The model used the available long-term open-labelextension data of trials of adalimumab (up to 156 weeks in ABILITY-158 for nr-AxSpA and 260 weeks inATLAS61 for AS, Figures 4 and 5) as well as including assumptions beyond these study durations to inform
0.00.20.40.60.81.01.21.41.61.82.0
12 24 52 76 104 128 156 180 208 220 232 244 260Weeks from baseline
LOCFBASDAI meanBASFI meanSc
ore
FIGURE 4 Observed mean BASDAI and BASFI scores for adalimumab ASAS 20 responders in the licensed populationfrom ATLAS61 (AS).
0.0
0.2
0.4
0.6
0.8
1.0
1.2
1.4
1.6
1.8
12 16 20 24 28 36 44 52 60 68 80 92 104 116 128 140Weeks from baseline
LOCF
BASDAI meanBASFI meanSc
ore
FIGURE 5 Observed mean BASDAI and BASFI scores for adalimumab ASAS 40 responders in the licensed populationfrom ABILITY-158 (nr-AxSpA).
DOI: 10.3310/hta20090 HEALTH TECHNOLOGY ASSESSMENT 2016 VOL. 20 NO. 9
© Queen’s Printer and Controller of HMSO 2016. This work was produced by Corbett et al. under the terms of a commissioning contract issued by the Secretary of State forHealth. This issue may be freely reproduced for the purposes of private research and study and extracts (or indeed, the full report) may be included in professional journalsprovided that suitable acknowledgement is made and the reproduction is not associated with any form of advertising. Applications for commercial reproduction should beaddressed to: NIHR Journals Library, National Institute for Health Research, Evaluation, Trials and Studies Coordinating Centre, Alpha House, University of Southampton SciencePark, Southampton SO16 7NS, UK.
83
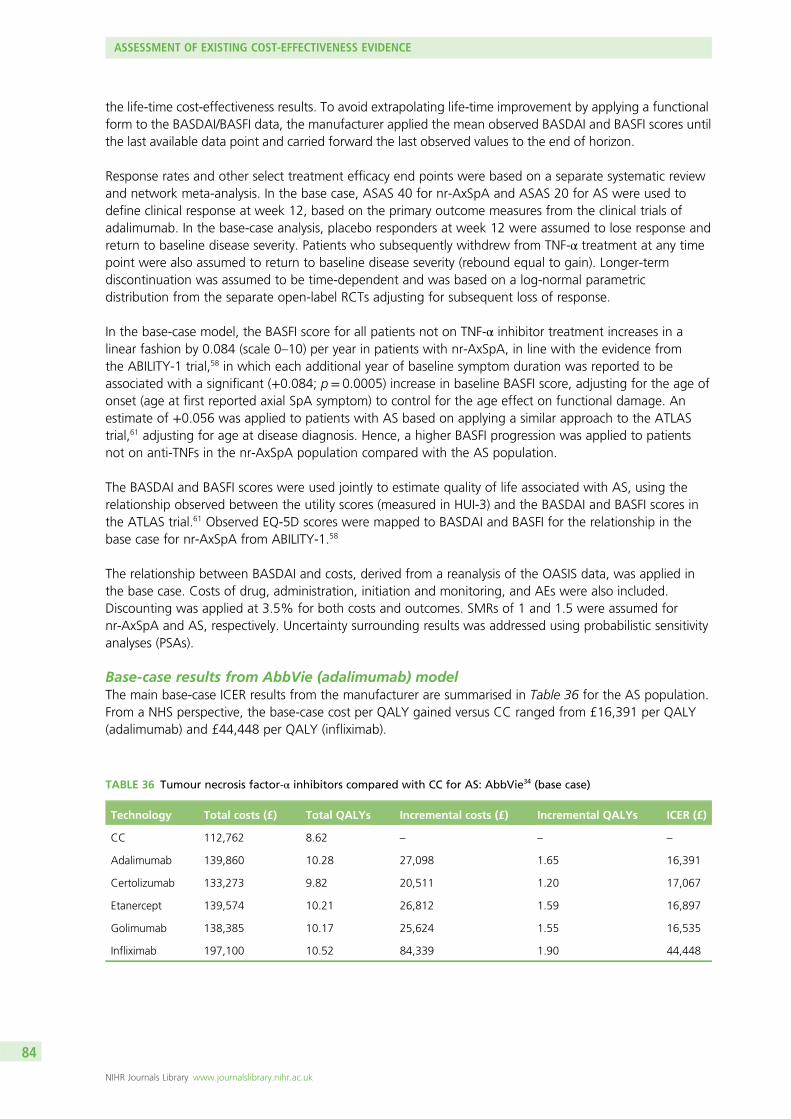
the life-time cost-effectiveness results. To avoid extrapolating life-time improvement by applying a functionalform to the BASDAI/BASFI data, the manufacturer applied the mean observed BASDAI and BASFI scores untilthe last available data point and carried forward the last observed values to the end of horizon.
Response rates and other select treatment efficacy end points were based on a separate systematic reviewand network meta-analysis. In the base case, ASAS 40 for nr-AxSpA and ASAS 20 for AS were used todefine clinical response at week 12, based on the primary outcome measures from the clinical trials ofadalimumab. In the base-case analysis, placebo responders at week 12 were assumed to lose response andreturn to baseline disease severity. Patients who subsequently withdrew from TNF-α treatment at any timepoint were also assumed to return to baseline disease severity (rebound equal to gain). Longer-termdiscontinuation was assumed to be time-dependent and was based on a log-normal parametricdistribution from the separate open-label RCTs adjusting for subsequent loss of response.
In the base-case model, the BASFI score for all patients not on TNF-α inhibitor treatment increases in alinear fashion by 0.084 (scale 0–10) per year in patients with nr-AxSpA, in line with the evidence fromthe ABILITY-1 trial,58 in which each additional year of baseline symptom duration was reported to beassociated with a significant (+0.084; p= 0.0005) increase in baseline BASFI score, adjusting for the age ofonset (age at first reported axial SpA symptom) to control for the age effect on functional damage. Anestimate of +0.056 was applied to patients with AS based on applying a similar approach to the ATLAStrial,61 adjusting for age at disease diagnosis. Hence, a higher BASFI progression was applied to patientsnot on anti-TNFs in the nr-AxSpA population compared with the AS population.
The BASDAI and BASFI scores were used jointly to estimate quality of life associated with AS, using therelationship observed between the utility scores (measured in HUI-3) and the BASDAI and BASFI scores inthe ATLAS trial.61 Observed EQ-5D scores were mapped to BASDAI and BASFI for the relationship in thebase case for nr-AxSpA from ABILITY-1.58
The relationship between BASDAI and costs, derived from a reanalysis of the OASIS data, was applied inthe base case. Costs of drug, administration, initiation and monitoring, and AEs were also included.Discounting was applied at 3.5% for both costs and outcomes. SMRs of 1 and 1.5 were assumed fornr-AxSpA and AS, respectively. Uncertainty surrounding results was addressed using probabilistic sensitivityanalyses (PSAs).
Base-case results from AbbVie (adalimumab) modelThe main base-case ICER results from the manufacturer are summarised in Table 36 for the AS population.From a NHS perspective, the base-case cost per QALY gained versus CC ranged from £16,391 per QALY(adalimumab) and £44,448 per QALY (infliximab).
TABLE 36 Tumour necrosis factor-α inhibitors compared with CC for AS: AbbVie34 (base case)
Technology Total costs (£) Total QALYs Incremental costs (£) Incremental QALYs ICER (£)
CC 112,762 8.62 – – –
Adalimumab 139,860 10.28 27,098 1.65 16,391
Certolizumab 133,273 9.82 20,511 1.20 17,067
Etanercept 139,574 10.21 26,812 1.59 16,897
Golimumab 138,385 10.17 25,624 1.55 16,535
Infliximab 197,100 10.52 84,339 1.90 44,448
ASSESSMENT OF EXISTING COST-EFFECTIVENESS EVIDENCE
NIHR Journals Library www.journalslibrary.nihr.ac.uk
84
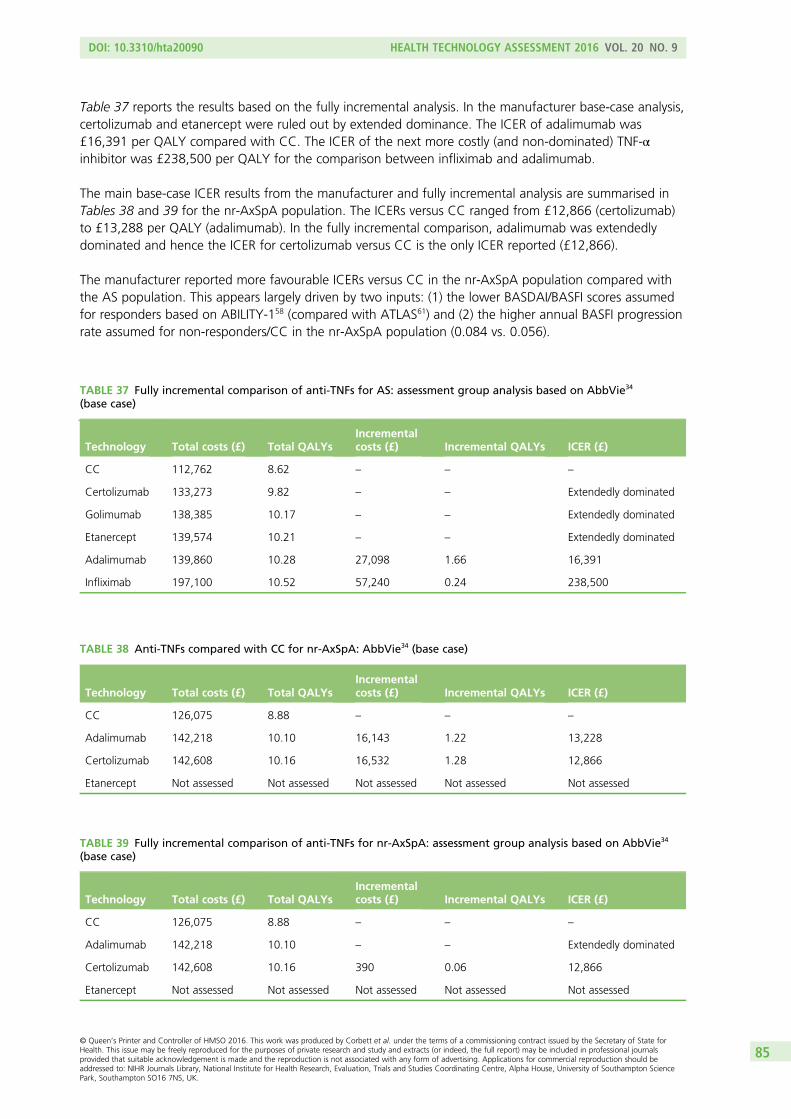
Table 37 reports the results based on the fully incremental analysis. In the manufacturer base-case analysis,certolizumab and etanercept were ruled out by extended dominance. The ICER of adalimumab was£16,391 per QALY compared with CC. The ICER of the next more costly (and non-dominated) TNF-αinhibitor was £238,500 per QALY for the comparison between infliximab and adalimumab.
The main base-case ICER results from the manufacturer and fully incremental analysis are summarised inTables 38 and 39 for the nr-AxSpA population. The ICERs versus CC ranged from £12,866 (certolizumab)to £13,288 per QALY (adalimumab). In the fully incremental comparison, adalimumab was extendedlydominated and hence the ICER for certolizumab versus CC is the only ICER reported (£12,866).
The manufacturer reported more favourable ICERs versus CC in the nr-AxSpA population compared withthe AS population. This appears largely driven by two inputs: (1) the lower BASDAI/BASFI scores assumedfor responders based on ABILITY-158 (compared with ATLAS61) and (2) the higher annual BASFI progressionrate assumed for non-responders/CC in the nr-AxSpA population (0.084 vs. 0.056).
TABLE 37 Fully incremental comparison of anti-TNFs for AS: assessment group analysis based on AbbVie34
(base case)
Technology Total costs (£) Total QALYsIncrementalcosts (£) Incremental QALYs ICER (£)
CC 112,762 8.62 – – –
Certolizumab 133,273 9.82 – – Extendedly dominated
Golimumab 138,385 10.17 – – Extendedly dominated
Etanercept 139,574 10.21 – – Extendedly dominated
Adalimumab 139,860 10.28 27,098 1.66 16,391
Infliximab 197,100 10.52 57,240 0.24 238,500
TABLE 38 Anti-TNFs compared with CC for nr-AxSpA: AbbVie34 (base case)
Technology Total costs (£) Total QALYsIncrementalcosts (£) Incremental QALYs ICER (£)
CC 126,075 8.88 – – –
Adalimumab 142,218 10.10 16,143 1.22 13,228
Certolizumab 142,608 10.16 16,532 1.28 12,866
Etanercept Not assessed Not assessed Not assessed Not assessed Not assessed
TABLE 39 Fully incremental comparison of anti-TNFs for nr-AxSpA: assessment group analysis based on AbbVie34
(base case)
Technology Total costs (£) Total QALYsIncrementalcosts (£) Incremental QALYs ICER (£)
CC 126,075 8.88 – – –
Adalimumab 142,218 10.10 – – Extendedly dominated
Certolizumab 142,608 10.16 390 0.06 12,866
Etanercept Not assessed Not assessed Not assessed Not assessed Not assessed
DOI: 10.3310/hta20090 HEALTH TECHNOLOGY ASSESSMENT 2016 VOL. 20 NO. 9
© Queen’s Printer and Controller of HMSO 2016. This work was produced by Corbett et al. under the terms of a commissioning contract issued by the Secretary of State forHealth. This issue may be freely reproduced for the purposes of private research and study and extracts (or indeed, the full report) may be included in professional journalsprovided that suitable acknowledgement is made and the reproduction is not associated with any form of advertising. Applications for commercial reproduction should beaddressed to: NIHR Journals Library, National Institute for Health Research, Evaluation, Trials and Studies Coordinating Centre, Alpha House, University of Southampton SciencePark, Southampton SO16 7NS, UK.
85
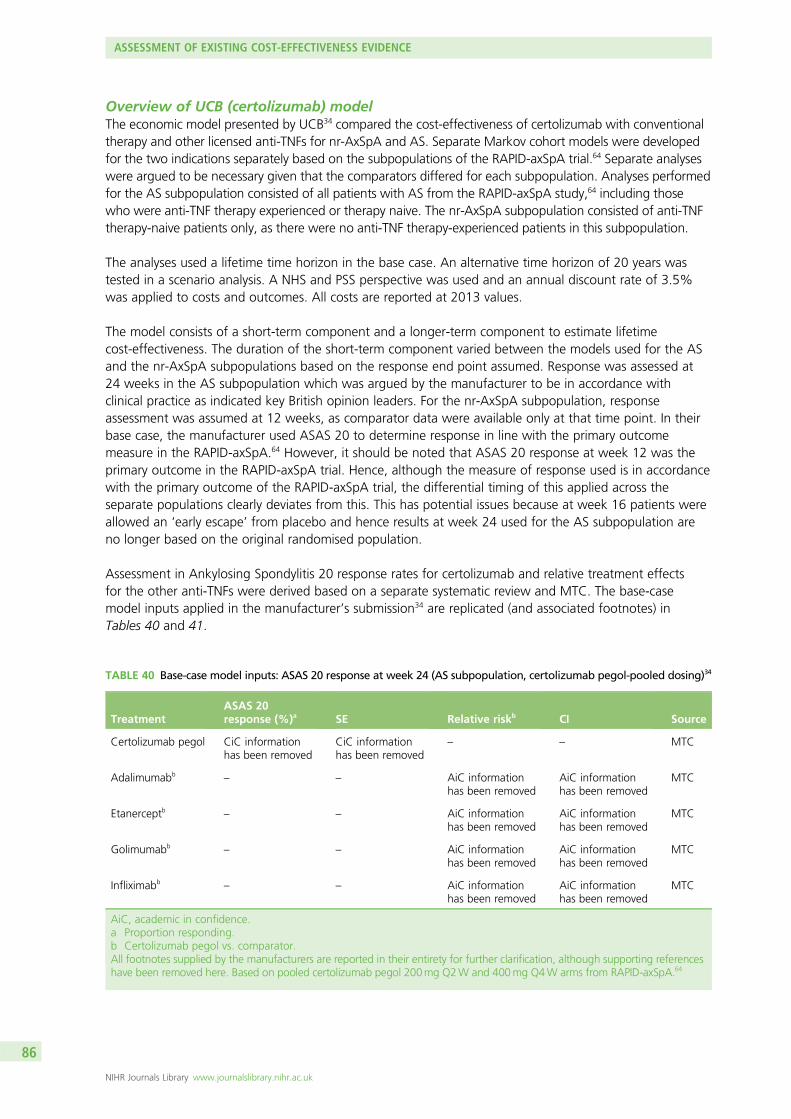
Overview of UCB (certolizumab) modelThe economic model presented by UCB34 compared the cost-effectiveness of certolizumab with conventionaltherapy and other licensed anti-TNFs for nr-AxSpA and AS. Separate Markov cohort models were developedfor the two indications separately based on the subpopulations of the RAPID-axSpA trial.64 Separate analyseswere argued to be necessary given that the comparators differed for each subpopulation. Analyses performedfor the AS subpopulation consisted of all patients with AS from the RAPID-axSpA study,64 including thosewho were anti-TNF therapy experienced or therapy naive. The nr-AxSpA subpopulation consisted of anti-TNFtherapy-naive patients only, as there were no anti-TNF therapy-experienced patients in this subpopulation.
The analyses used a lifetime time horizon in the base case. An alternative time horizon of 20 years wastested in a scenario analysis. A NHS and PSS perspective was used and an annual discount rate of 3.5%was applied to costs and outcomes. All costs are reported at 2013 values.
The model consists of a short-term component and a longer-term component to estimate lifetimecost-effectiveness. The duration of the short-term component varied between the models used for the ASand the nr-AxSpA subpopulations based on the response end point assumed. Response was assessed at24 weeks in the AS subpopulation which was argued by the manufacturer to be in accordance withclinical practice as indicated key British opinion leaders. For the nr-AxSpA subpopulation, responseassessment was assumed at 12 weeks, as comparator data were available only at that time point. In theirbase case, the manufacturer used ASAS 20 to determine response in line with the primary outcomemeasure in the RAPID-axSpA.64 However, it should be noted that ASAS 20 response at week 12 was theprimary outcome in the RAPID-axSpA trial. Hence, although the measure of response used is in accordancewith the primary outcome of the RAPID-axSpA trial, the differential timing of this applied across theseparate populations clearly deviates from this. This has potential issues because at week 16 patients wereallowed an ‘early escape’ from placebo and hence results at week 24 used for the AS subpopulation areno longer based on the original randomised population.
Assessment in Ankylosing Spondylitis 20 response rates for certolizumab and relative treatment effectsfor the other anti-TNFs were derived based on a separate systematic review and MTC. The base-casemodel inputs applied in the manufacturer’s submission34 are replicated (and associated footnotes) inTables 40 and 41.
TABLE 40 Base-case model inputs: ASAS 20 response at week 24 (AS subpopulation, certolizumab pegol-pooled dosing)34
TreatmentASAS 20response (%)a SE Relative riskb CI Source
Certolizumab pegol CiC informationhas been removed
CiC informationhas been removed
– – MTC
Adalimumabb– – AiC information
has been removedAiC informationhas been removed
MTC
Etanerceptb – – AiC informationhas been removed
AiC informationhas been removed
MTC
Golimumabb– – AiC information
has been removedAiC informationhas been removed
MTC
Infliximabb– – AiC information
has been removedAiC informationhas been removed
MTC
AiC, academic in confidence.a Proportion responding.b Certolizumab pegol vs. comparator.All footnotes supplied by the manufacturers are reported in their entirety for further clarification, although supporting referenceshave been removed here. Based on pooled certolizumab pegol 200mg Q2W and 400mg Q4W arms from RAPID-axSpA.64
ASSESSMENT OF EXISTING COST-EFFECTIVENESS EVIDENCE
NIHR Journals Library www.journalslibrary.nihr.ac.uk
86
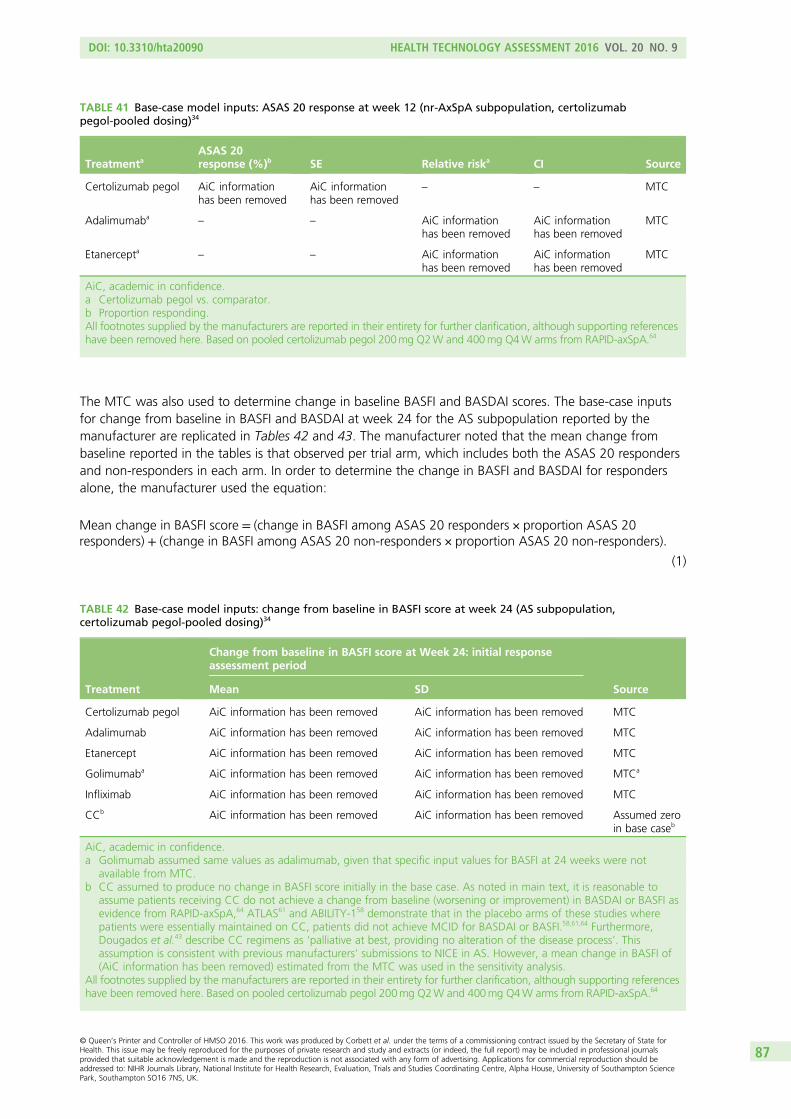
The MTC was also used to determine change in baseline BASFI and BASDAI scores. The base-case inputsfor change from baseline in BASFI and BASDAI at week 24 for the AS subpopulation reported by themanufacturer are replicated in Tables 42 and 43. The manufacturer noted that the mean change frombaseline reported in the tables is that observed per trial arm, which includes both the ASAS 20 respondersand non-responders in each arm. In order to determine the change in BASFI and BASDAI for respondersalone, the manufacturer used the equation:
Mean change in BASFI score = (change in BASFI among ASAS 20 responders × proportion ASAS 20responders) + (change in BASFI among ASAS 20 non‐responders × proportion ASAS 20 non‐responders):
(1)
TABLE 41 Base-case model inputs: ASAS 20 response at week 12 (nr-AxSpA subpopulation, certolizumabpegol-pooled dosing)34
TreatmentaASAS 20response (%)b SE Relative riska CI Source
Certolizumab pegol AiC informationhas been removed
AiC informationhas been removed
– – MTC
Adalimumaba– – AiC information
has been removedAiC informationhas been removed
MTC
Etanercepta – – AiC informationhas been removed
AiC informationhas been removed
MTC
AiC, academic in confidence.a Certolizumab pegol vs. comparator.b Proportion responding.All footnotes supplied by the manufacturers are reported in their entirety for further clarification, although supporting referenceshave been removed here. Based on pooled certolizumab pegol 200mg Q2W and 400mg Q4W arms from RAPID-axSpA.64
TABLE 42 Base-case model inputs: change from baseline in BASFI score at week 24 (AS subpopulation,certolizumab pegol-pooled dosing)34
Treatment
Change from baseline in BASFI score at Week 24: initial responseassessment period
SourceMean SD
Certolizumab pegol AiC information has been removed AiC information has been removed MTC
Adalimumab AiC information has been removed AiC information has been removed MTC
Etanercept AiC information has been removed AiC information has been removed MTC
Golimumaba AiC information has been removed AiC information has been removed MTCa
Infliximab AiC information has been removed AiC information has been removed MTC
CCb AiC information has been removed AiC information has been removed Assumed zeroin base caseb
AiC, academic in confidence.a Golimumab assumed same values as adalimumab, given that specific input values for BASFI at 24 weeks were not
available from MTC.b CC assumed to produce no change in BASFI score initially in the base case. As noted in main text, it is reasonable to
assume patients receiving CC do not achieve a change from baseline (worsening or improvement) in BASDAI or BASFI asevidence from RAPID-axSpA,64 ATLAS61 and ABILITY-158 demonstrate that in the placebo arms of these studies wherepatients were essentially maintained on CC, patients did not achieve MCID for BASDAI or BASFI.58,61,64 Furthermore,Dougados et al.43 describe CC regimens as ‘palliative at best, providing no alteration of the disease process’. Thisassumption is consistent with previous manufacturers’ submissions to NICE in AS. However, a mean change in BASFI of(AiC information has been removed) estimated from the MTC was used in the sensitivity analysis.
All footnotes supplied by the manufacturers are reported in their entirety for further clarification, although supporting referenceshave been removed here. Based on pooled certolizumab pegol 200mg Q2W and 400mg Q4W arms from RAPID-axSpA.64
DOI: 10.3310/hta20090 HEALTH TECHNOLOGY ASSESSMENT 2016 VOL. 20 NO. 9
© Queen’s Printer and Controller of HMSO 2016. This work was produced by Corbett et al. under the terms of a commissioning contract issued by the Secretary of State forHealth. This issue may be freely reproduced for the purposes of private research and study and extracts (or indeed, the full report) may be included in professional journalsprovided that suitable acknowledgement is made and the reproduction is not associated with any form of advertising. Applications for commercial reproduction should beaddressed to: NIHR Journals Library, National Institute for Health Research, Evaluation, Trials and Studies Coordinating Centre, Alpha House, University of Southampton SciencePark, Southampton SO16 7NS, UK.
87
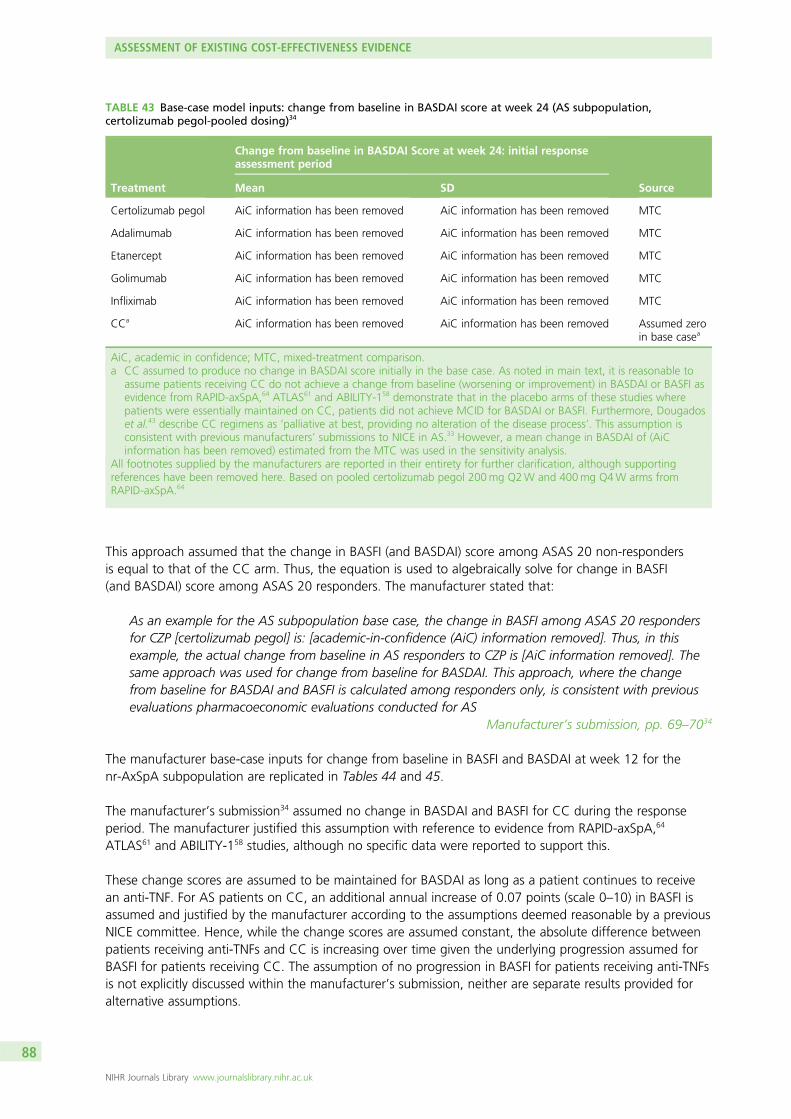
This approach assumed that the change in BASFI (and BASDAI) score among ASAS 20 non-respondersis equal to that of the CC arm. Thus, the equation is used to algebraically solve for change in BASFI(and BASDAI) score among ASAS 20 responders. The manufacturer stated that:
As an example for the AS subpopulation base case, the change in BASFI among ASAS 20 respondersfor CZP [certolizumab pegol] is: [academic-in-confidence (AiC) information removed]. Thus, in thisexample, the actual change from baseline in AS responders to CZP is [AiC information removed]. Thesame approach was used for change from baseline for BASDAI. This approach, where the changefrom baseline for BASDAI and BASFI is calculated among responders only, is consistent with previousevaluations pharmacoeconomic evaluations conducted for AS
Manufacturer’s submission, pp. 69–7034
The manufacturer base-case inputs for change from baseline in BASFI and BASDAI at week 12 for thenr-AxSpA subpopulation are replicated in Tables 44 and 45.
The manufacturer’s submission34 assumed no change in BASDAI and BASFI for CC during the responseperiod. The manufacturer justified this assumption with reference to evidence from RAPID-axSpA,64
ATLAS61 and ABILITY-158 studies, although no specific data were reported to support this.
These change scores are assumed to be maintained for BASDAI as long as a patient continues to receivean anti-TNF. For AS patients on CC, an additional annual increase of 0.07 points (scale 0–10) in BASFI isassumed and justified by the manufacturer according to the assumptions deemed reasonable by a previousNICE committee. Hence, while the change scores are assumed constant, the absolute difference betweenpatients receiving anti-TNFs and CC is increasing over time given the underlying progression assumed forBASFI for patients receiving CC. The assumption of no progression in BASFI for patients receiving anti-TNFsis not explicitly discussed within the manufacturer’s submission, neither are separate results provided foralternative assumptions.
TABLE 43 Base-case model inputs: change from baseline in BASDAI score at week 24 (AS subpopulation,certolizumab pegol-pooled dosing)34
Treatment
Change from baseline in BASDAI Score at week 24: initial responseassessment period
SourceMean SD
Certolizumab pegol AiC information has been removed AiC information has been removed MTC
Adalimumab AiC information has been removed AiC information has been removed MTC
Etanercept AiC information has been removed AiC information has been removed MTC
Golimumab AiC information has been removed AiC information has been removed MTC
Infliximab AiC information has been removed AiC information has been removed MTC
CCa AiC information has been removed AiC information has been removed Assumed zeroin base casea
AiC, academic in confidence; MTC, mixed-treatment comparison.a CC assumed to produce no change in BASDAI score initially in the base case. As noted in main text, it is reasonable to
assume patients receiving CC do not achieve a change from baseline (worsening or improvement) in BASDAI or BASFI asevidence from RAPID-axSpA,64 ATLAS61 and ABILITY-158 demonstrate that in the placebo arms of these studies wherepatients were essentially maintained on CC, patients did not achieve MCID for BASDAI or BASFI. Furthermore, Dougadoset al.43 describe CC regimens as ‘palliative at best, providing no alteration of the disease process’. This assumption isconsistent with previous manufacturers’ submissions to NICE in AS.33 However, a mean change in BASDAI of (AiCinformation has been removed) estimated from the MTC was used in the sensitivity analysis.
All footnotes supplied by the manufacturers are reported in their entirety for further clarification, although supportingreferences have been removed here. Based on pooled certolizumab pegol 200mg Q2W and 400mg Q4W arms fromRAPID-axSpA.64
ASSESSMENT OF EXISTING COST-EFFECTIVENESS EVIDENCE
NIHR Journals Library www.journalslibrary.nihr.ac.uk
88
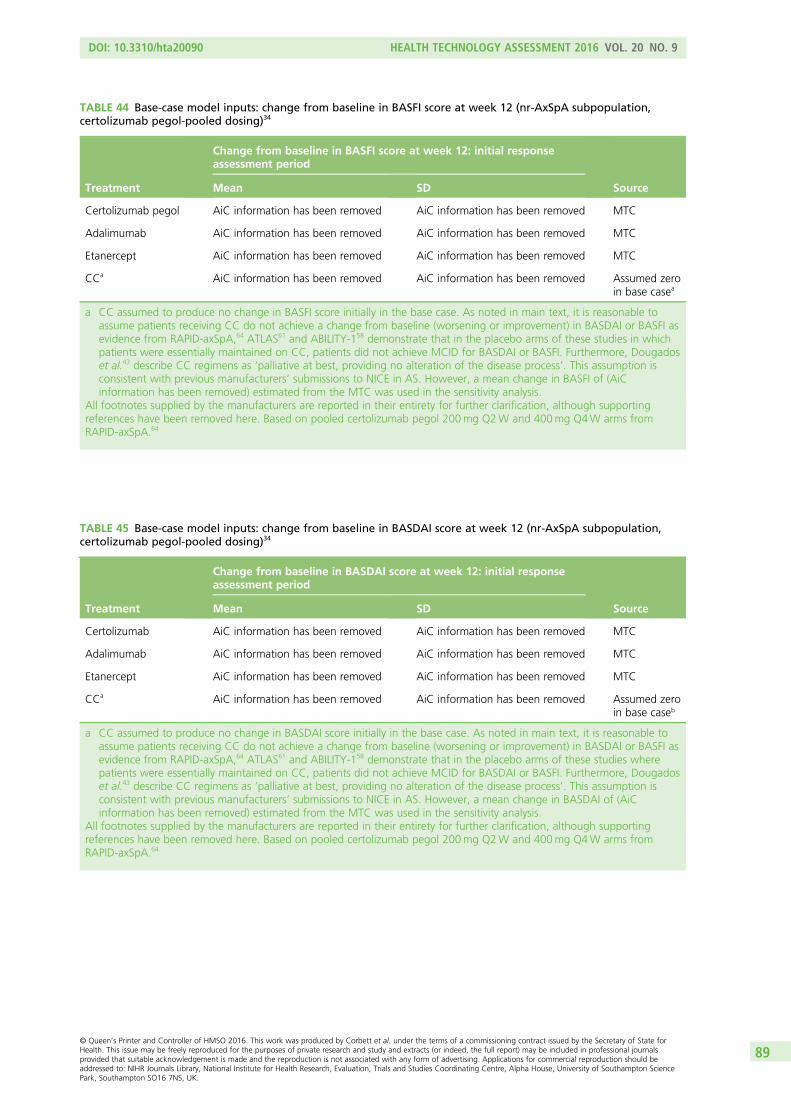
TABLE 45 Base-case model inputs: change from baseline in BASDAI score at week 12 (nr-AxSpA subpopulation,certolizumab pegol-pooled dosing)34
Treatment
Change from baseline in BASDAI score at week 12: initial responseassessment period
SourceMean SD
Certolizumab AiC information has been removed AiC information has been removed MTC
Adalimumab AiC information has been removed AiC information has been removed MTC
Etanercept AiC information has been removed AiC information has been removed MTC
CCa AiC information has been removed AiC information has been removed Assumed zeroin base caseb
a CC assumed to produce no change in BASDAI score initially in the base case. As noted in main text, it is reasonable toassume patients receiving CC do not achieve a change from baseline (worsening or improvement) in BASDAI or BASFI asevidence from RAPID-axSpA,64 ATLAS61 and ABILITY-158 demonstrate that in the placebo arms of these studies wherepatients were essentially maintained on CC, patients did not achieve MCID for BASDAI or BASFI. Furthermore, Dougadoset al.43 describe CC regimens as ‘palliative at best, providing no alteration of the disease process’. This assumption isconsistent with previous manufacturers’ submissions to NICE in AS. However, a mean change in BASDAI of (AiCinformation has been removed) estimated from the MTC was used in the sensitivity analysis.
All footnotes supplied by the manufacturers are reported in their entirety for further clarification, although supportingreferences have been removed here. Based on pooled certolizumab pegol 200mg Q2W and 400mg Q4W arms fromRAPID-axSpA.64
TABLE 44 Base-case model inputs: change from baseline in BASFI score at week 12 (nr-AxSpA subpopulation,certolizumab pegol-pooled dosing)34
Treatment
Change from baseline in BASFI score at week 12: initial responseassessment period
SourceMean SD
Certolizumab pegol AiC information has been removed AiC information has been removed MTC
Adalimumab AiC information has been removed AiC information has been removed MTC
Etanercept AiC information has been removed AiC information has been removed MTC
CCa AiC information has been removed AiC information has been removed Assumed zeroin base casea
a CC assumed to produce no change in BASFI score initially in the base case. As noted in main text, it is reasonable toassume patients receiving CC do not achieve a change from baseline (worsening or improvement) in BASDAI or BASFI asevidence from RAPID-axSpA,64 ATLAS61 and ABILITY-158 demonstrate that in the placebo arms of these studies in whichpatients were essentially maintained on CC, patients did not achieve MCID for BASDAI or BASFI. Furthermore, Dougadoset al.43 describe CC regimens as ‘palliative at best, providing no alteration of the disease process’. This assumption isconsistent with previous manufacturers’ submissions to NICE in AS. However, a mean change in BASFI of (AiCinformation has been removed) estimated from the MTC was used in the sensitivity analysis.
All footnotes supplied by the manufacturers are reported in their entirety for further clarification, although supportingreferences have been removed here. Based on pooled certolizumab pegol 200mg Q2W and 400mg Q4W arms fromRAPID-axSpA.64
DOI: 10.3310/hta20090 HEALTH TECHNOLOGY ASSESSMENT 2016 VOL. 20 NO. 9
© Queen’s Printer and Controller of HMSO 2016. This work was produced by Corbett et al. under the terms of a commissioning contract issued by the Secretary of State forHealth. This issue may be freely reproduced for the purposes of private research and study and extracts (or indeed, the full report) may be included in professional journalsprovided that suitable acknowledgement is made and the reproduction is not associated with any form of advertising. Applications for commercial reproduction should beaddressed to: NIHR Journals Library, National Institute for Health Research, Evaluation, Trials and Studies Coordinating Centre, Alpha House, University of Southampton SciencePark, Southampton SO16 7NS, UK.
89
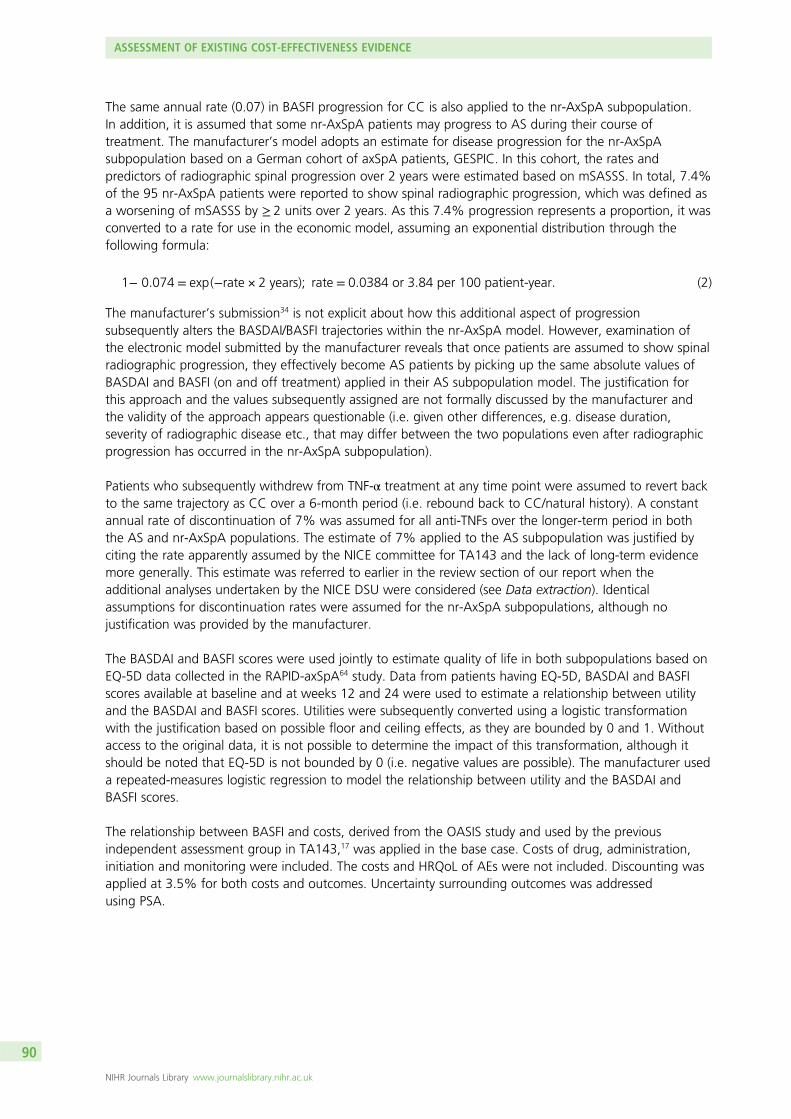
The same annual rate (0.07) in BASFI progression for CC is also applied to the nr-AxSpA subpopulation.In addition, it is assumed that some nr-AxSpA patients may progress to AS during their course oftreatment. The manufacturer’s model adopts an estimate for disease progression for the nr-AxSpAsubpopulation based on a German cohort of axSpA patients, GESPIC. In this cohort, the rates andpredictors of radiographic spinal progression over 2 years were estimated based on mSASSS. In total, 7.4%of the 95 nr-AxSpA patients were reported to show spinal radiographic progression, which was defined asa worsening of mSASSS by ≥ 2 units over 2 years. As this 7.4% progression represents a proportion, it wasconverted to a rate for use in the economic model, assuming an exponential distribution through thefollowing formula:
1− 0:074 = exp(−rate × 2 years); rate = 0:0384 or 3:84 per 100 patient‐year: (2)
The manufacturer’s submission34 is not explicit about how this additional aspect of progressionsubsequently alters the BASDAI/BASFI trajectories within the nr-AxSpA model. However, examination ofthe electronic model submitted by the manufacturer reveals that once patients are assumed to show spinalradiographic progression, they effectively become AS patients by picking up the same absolute values ofBASDAI and BASFI (on and off treatment) applied in their AS subpopulation model. The justification forthis approach and the values subsequently assigned are not formally discussed by the manufacturer andthe validity of the approach appears questionable (i.e. given other differences, e.g. disease duration,severity of radiographic disease etc., that may differ between the two populations even after radiographicprogression has occurred in the nr-AxSpA subpopulation).
Patients who subsequently withdrew from TNF-α treatment at any time point were assumed to revert backto the same trajectory as CC over a 6-month period (i.e. rebound back to CC/natural history). A constantannual rate of discontinuation of 7% was assumed for all anti-TNFs over the longer-term period in boththe AS and nr-AxSpA populations. The estimate of 7% applied to the AS subpopulation was justified byciting the rate apparently assumed by the NICE committee for TA143 and the lack of long-term evidencemore generally. This estimate was referred to earlier in the review section of our report when theadditional analyses undertaken by the NICE DSU were considered (see Data extraction). Identicalassumptions for discontinuation rates were assumed for the nr-AxSpA subpopulations, although nojustification was provided by the manufacturer.
The BASDAI and BASFI scores were used jointly to estimate quality of life in both subpopulations based onEQ-5D data collected in the RAPID-axSpA64 study. Data from patients having EQ-5D, BASDAI and BASFIscores available at baseline and at weeks 12 and 24 were used to estimate a relationship between utilityand the BASDAI and BASFI scores. Utilities were subsequently converted using a logistic transformationwith the justification based on possible floor and ceiling effects, as they are bounded by 0 and 1. Withoutaccess to the original data, it is not possible to determine the impact of this transformation, although itshould be noted that EQ-5D is not bounded by 0 (i.e. negative values are possible). The manufacturer useda repeated-measures logistic regression to model the relationship between utility and the BASDAI andBASFI scores.
The relationship between BASFI and costs, derived from the OASIS study and used by the previousindependent assessment group in TA143,17 was applied in the base case. Costs of drug, administration,initiation and monitoring were included. The costs and HRQoL of AEs were not included. Discounting wasapplied at 3.5% for both costs and outcomes. Uncertainty surrounding outcomes was addressedusing PSA.
ASSESSMENT OF EXISTING COST-EFFECTIVENESS EVIDENCE
NIHR Journals Library www.journalslibrary.nihr.ac.uk
90
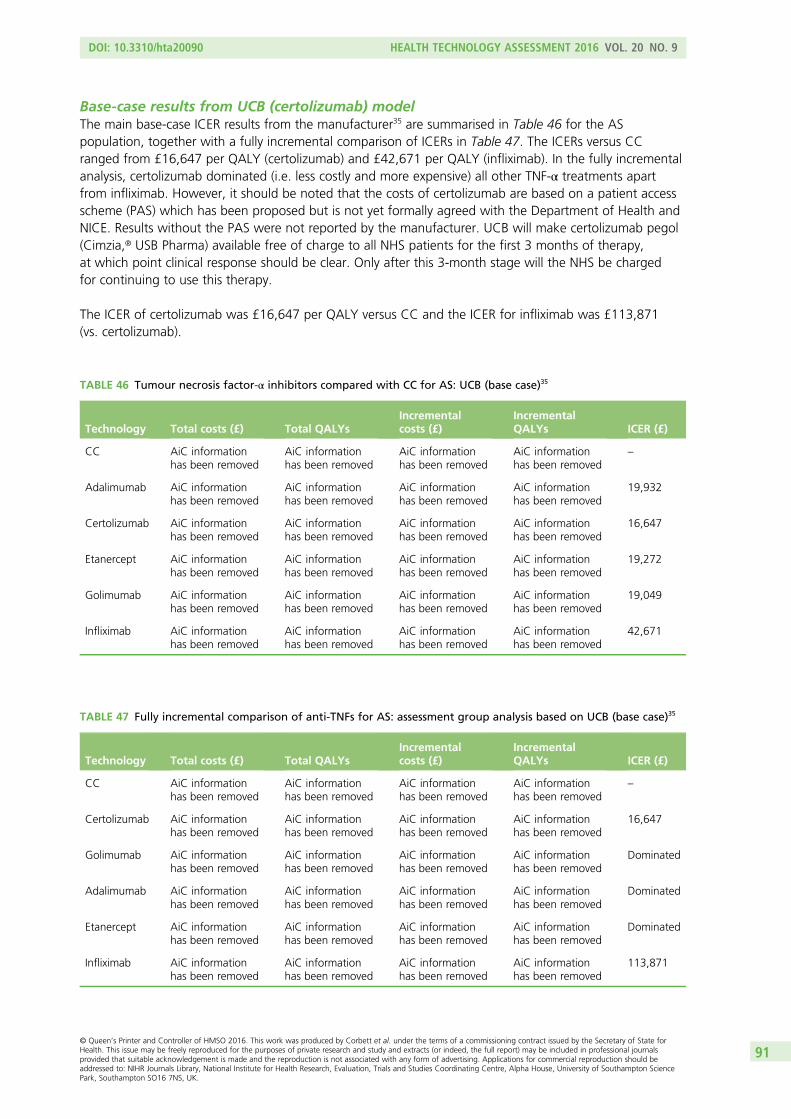
Base-case results from UCB (certolizumab) modelThe main base-case ICER results from the manufacturer35 are summarised in Table 46 for the ASpopulation, together with a fully incremental comparison of ICERs in Table 47. The ICERs versus CCranged from £16,647 per QALY (certolizumab) and £42,671 per QALY (infliximab). In the fully incrementalanalysis, certolizumab dominated (i.e. less costly and more expensive) all other TNF-α treatments apartfrom infliximab. However, it should be noted that the costs of certolizumab are based on a patient accessscheme (PAS) which has been proposed but is not yet formally agreed with the Department of Health andNICE. Results without the PAS were not reported by the manufacturer. UCB will make certolizumab pegol(Cimzia,® USB Pharma) available free of charge to all NHS patients for the first 3 months of therapy,at which point clinical response should be clear. Only after this 3-month stage will the NHS be chargedfor continuing to use this therapy.
The ICER of certolizumab was £16,647 per QALY versus CC and the ICER for infliximab was £113,871(vs. certolizumab).
TABLE 47 Fully incremental comparison of anti-TNFs for AS: assessment group analysis based on UCB (base case)35
Technology Total costs (£) Total QALYsIncrementalcosts (£)
IncrementalQALYs ICER (£)
CC AiC informationhas been removed
AiC informationhas been removed
AiC informationhas been removed
AiC informationhas been removed
–
Certolizumab AiC informationhas been removed
AiC informationhas been removed
AiC informationhas been removed
AiC informationhas been removed
16,647
Golimumab AiC informationhas been removed
AiC informationhas been removed
AiC informationhas been removed
AiC informationhas been removed
Dominated
Adalimumab AiC informationhas been removed
AiC informationhas been removed
AiC informationhas been removed
AiC informationhas been removed
Dominated
Etanercept AiC informationhas been removed
AiC informationhas been removed
AiC informationhas been removed
AiC informationhas been removed
Dominated
Infliximab AiC informationhas been removed
AiC informationhas been removed
AiC informationhas been removed
AiC informationhas been removed
113,871
TABLE 46 Tumour necrosis factor-α inhibitors compared with CC for AS: UCB (base case)35
Technology Total costs (£) Total QALYsIncrementalcosts (£)
IncrementalQALYs ICER (£)
CC AiC informationhas been removed
AiC informationhas been removed
AiC informationhas been removed
AiC informationhas been removed
–
Adalimumab AiC informationhas been removed
AiC informationhas been removed
AiC informationhas been removed
AiC informationhas been removed
19,932
Certolizumab AiC informationhas been removed
AiC informationhas been removed
AiC informationhas been removed
AiC informationhas been removed
16,647
Etanercept AiC informationhas been removed
AiC informationhas been removed
AiC informationhas been removed
AiC informationhas been removed
19,272
Golimumab AiC informationhas been removed
AiC informationhas been removed
AiC informationhas been removed
AiC informationhas been removed
19,049
Infliximab AiC informationhas been removed
AiC informationhas been removed
AiC informationhas been removed
AiC informationhas been removed
42,671
DOI: 10.3310/hta20090 HEALTH TECHNOLOGY ASSESSMENT 2016 VOL. 20 NO. 9
© Queen’s Printer and Controller of HMSO 2016. This work was produced by Corbett et al. under the terms of a commissioning contract issued by the Secretary of State forHealth. This issue may be freely reproduced for the purposes of private research and study and extracts (or indeed, the full report) may be included in professional journalsprovided that suitable acknowledgement is made and the reproduction is not associated with any form of advertising. Applications for commercial reproduction should beaddressed to: NIHR Journals Library, National Institute for Health Research, Evaluation, Trials and Studies Coordinating Centre, Alpha House, University of Southampton SciencePark, Southampton SO16 7NS, UK.
91
The main base-case ICER results from the manufacturer35 are summarised in Table 48 for the nr-AxSpApopulation, together with a fully-incremental comparison of ICERs in Table 49. In contrast to the results forAS, there was a more marked difference between the ICERs of the alternative anti-TNFs and CC. The ICERsversus CC ranged from £15,615 (certolizumab) to £50,692 per QALY (etanercept). The higher differentialICERs appears to be largely a result of the more heterogeneous trials included in the MTC for thenr-AxSpA populations and a higher differential effect assumed for certolizumab vis-à-vis the other alternativeanti-TNFs compared with the AS population. Importantly, other manufacturers (Pfizer) argue that the resultsfor certolizumab in this population may be confounded by population characteristics which could invalidatethe indirect comparison of certolizumab versus the other comparator treatments in the current nr-AxSpAMTC. In the fully incremental analysis, certolizumab dominated adalimumab and etanercept.
Overview of Pfizer (etanercept) modelThe economic model submitted by Pfizer36 compared the cost-effectiveness of etanercept versusconventional therapy and other licensed anti-TNFs for AS, nr-AxSpA and a combined population (axSpA).The results for the combined population are not summarised in this review but are reported separately inthe manufacturer’s submission. The model is based on a lifetime time horizon and costs and benefits arediscounted at an annual rate of 3.5%. The reference year for costs was reported to be 2014.
The model was based on a patient-level simulation model based on a discrete event simulation (DES). Theanalysis was conducted from a NHS/PSS perspective. Data to populate the model were derived from keyclinical trials for etanercept, the results of a clinical systematic review, MTC and, in a separate analysispresented for the nr-AxSpA population, a match-adjusted indirect comparison (MAIC). The model structurewas reported to be developed in accordance with current OMERACT (Outcome Measures in Rheumatology)guidance and was constructed around the BASDAI and the BASFI in line with other published studies.
TABLE 48 Tumour necrosis factor-α inhibitors compared with CC for nr-AxSpA: UCB (base case)35
Technology Total costs (£) Total QALYsIncrementalcosts (£)
IncrementalQALYs ICER (£)
CC AiC informationhas been removed
AiC informationhas been removed
AiC informationhas been removed
AiC informationhas been removed
–
Adalimumab AiC informationhas been removed
AiC informationhas been removed
AiC informationhas been removed
AiC informationhas been removed
30,370
Certolizumab AiC informationhas been removed
AiC informationhas been removed
AiC informationhas been removed
AiC informationhas been removed
15,615
Etanercept AiC informationhas been removed
AiC informationhas been removed
AiC informationhas been removed
AiC informationhas been removed
50,692
TABLE 49 Fully incremental comparison of anti-TNFs for nr-AxSpA: assessment group analysis based on UCB (base case)35
Technology Total costs (£) Total QALYsIncrementalcosts (£)
IncrementalQALYs ICER (£)
CC AiC informationhas been removed
AiC informationhas been removed
AiC informationhas been removed
AiC informationhas been removed
–
Certolizumab AiC informationhas been removed
AiC informationhas been removed
AiC informationhas been removed
AiC informationhas been removed
15,615
Etanercept AiC informationhas been removed
AiC informationhas been removed
AiC informationhas been removed
AiC informationhas been removed
Dominated
Adalimumab AiC informationhas been removed
AiC informationhas been removed
AiC informationhas been removed
AiC informationhas been removed
Dominated
ASSESSMENT OF EXISTING COST-EFFECTIVENESS EVIDENCE
NIHR Journals Library www.journalslibrary.nihr.ac.uk
92
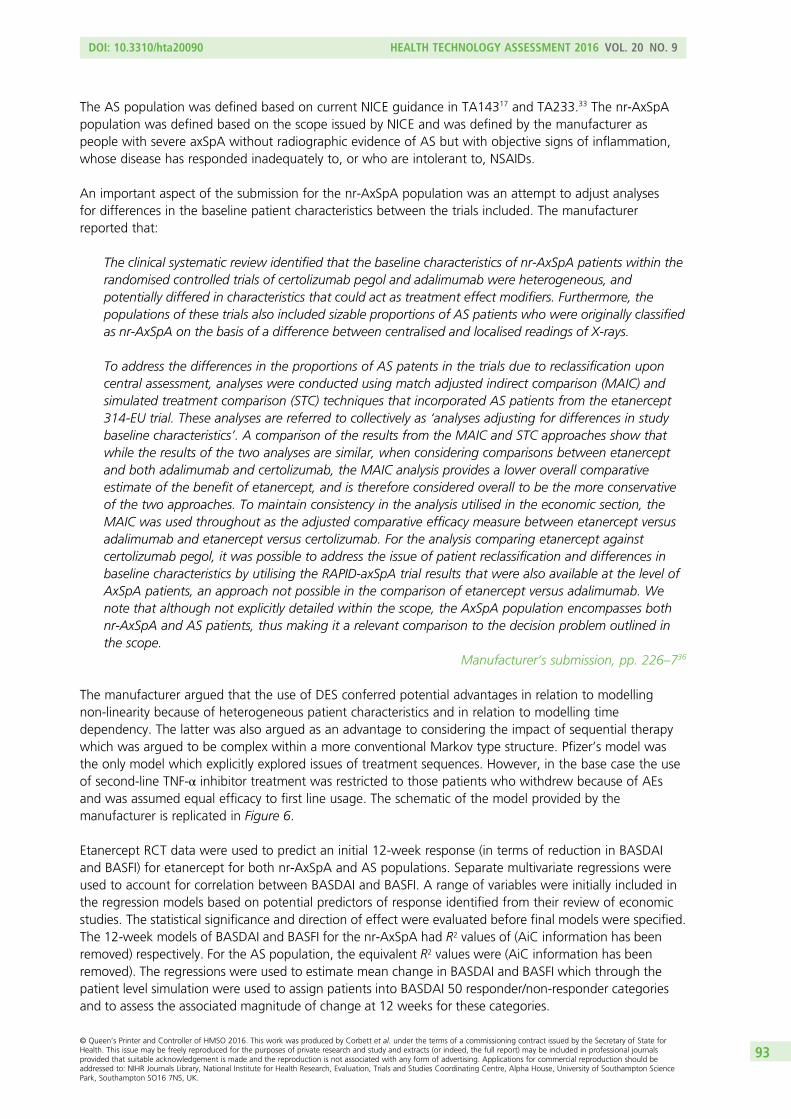
The AS population was defined based on current NICE guidance in TA14317 and TA233.33 The nr-AxSpApopulation was defined based on the scope issued by NICE and was defined by the manufacturer aspeople with severe axSpA without radiographic evidence of AS but with objective signs of inflammation,whose disease has responded inadequately to, or who are intolerant to, NSAIDs.
An important aspect of the submission for the nr-AxSpA population was an attempt to adjust analysesfor differences in the baseline patient characteristics between the trials included. The manufacturerreported that:
The clinical systematic review identified that the baseline characteristics of nr-AxSpA patients within therandomised controlled trials of certolizumab pegol and adalimumab were heterogeneous, andpotentially differed in characteristics that could act as treatment effect modifiers. Furthermore, thepopulations of these trials also included sizable proportions of AS patients who were originally classifiedas nr-AxSpA on the basis of a difference between centralised and localised readings of X-rays.
To address the differences in the proportions of AS patents in the trials due to reclassification uponcentral assessment, analyses were conducted using match adjusted indirect comparison (MAIC) andsimulated treatment comparison (STC) techniques that incorporated AS patients from the etanercept314-EU trial. These analyses are referred to collectively as ‘analyses adjusting for differences in studybaseline characteristics’. A comparison of the results from the MAIC and STC approaches show thatwhile the results of the two analyses are similar, when considering comparisons between etanerceptand both adalimumab and certolizumab, the MAIC analysis provides a lower overall comparativeestimate of the benefit of etanercept, and is therefore considered overall to be the more conservativeof the two approaches. To maintain consistency in the analysis utilised in the economic section, theMAIC was used throughout as the adjusted comparative efficacy measure between etanercept versusadalimumab and etanercept versus certolizumab. For the analysis comparing etanercept againstcertolizumab pegol, it was possible to address the issue of patient reclassification and differences inbaseline characteristics by utilising the RAPID-axSpA trial results that were also available at the level ofAxSpA patients, an approach not possible in the comparison of etanercept versus adalimumab. Wenote that although not explicitly detailed within the scope, the AxSpA population encompasses bothnr-AxSpA and AS patients, thus making it a relevant comparison to the decision problem outlined inthe scope.
Manufacturer’s submission, pp. 226–736
The manufacturer argued that the use of DES conferred potential advantages in relation to modellingnon-linearity because of heterogeneous patient characteristics and in relation to modelling timedependency. The latter was also argued as an advantage to considering the impact of sequential therapywhich was argued to be complex within a more conventional Markov type structure. Pfizer’s model wasthe only model which explicitly explored issues of treatment sequences. However, in the base case the useof second-line TNF-α inhibitor treatment was restricted to those patients who withdrew because of AEsand was assumed equal efficacy to first line usage. The schematic of the model provided by themanufacturer is replicated in Figure 6.
Etanercept RCT data were used to predict an initial 12-week response (in terms of reduction in BASDAIand BASFI) for etanercept for both nr-AxSpA and AS populations. Separate multivariate regressions wereused to account for correlation between BASDAI and BASFI. A range of variables were initially included inthe regression models based on potential predictors of response identified from their review of economicstudies. The statistical significance and direction of effect were evaluated before final models were specified.The 12-week models of BASDAI and BASFI for the nr-AxSpA had R2 values of (AiC information has beenremoved) respectively. For the AS population, the equivalent R2 values were (AiC information has beenremoved). The regressions were used to estimate mean change in BASDAI and BASFI which through thepatient level simulation were used to assign patients into BASDAI 50 responder/non-responder categoriesand to assess the associated magnitude of change at 12 weeks for these categories.
DOI: 10.3310/hta20090 HEALTH TECHNOLOGY ASSESSMENT 2016 VOL. 20 NO. 9
© Queen’s Printer and Controller of HMSO 2016. This work was produced by Corbett et al. under the terms of a commissioning contract issued by the Secretary of State forHealth. This issue may be freely reproduced for the purposes of private research and study and extracts (or indeed, the full report) may be included in professional journalsprovided that suitable acknowledgement is made and the reproduction is not associated with any form of advertising. Applications for commercial reproduction should beaddressed to: NIHR Journals Library, National Institute for Health Research, Evaluation, Trials and Studies Coordinating Centre, Alpha House, University of Southampton SciencePark, Southampton SO16 7NS, UK.
93
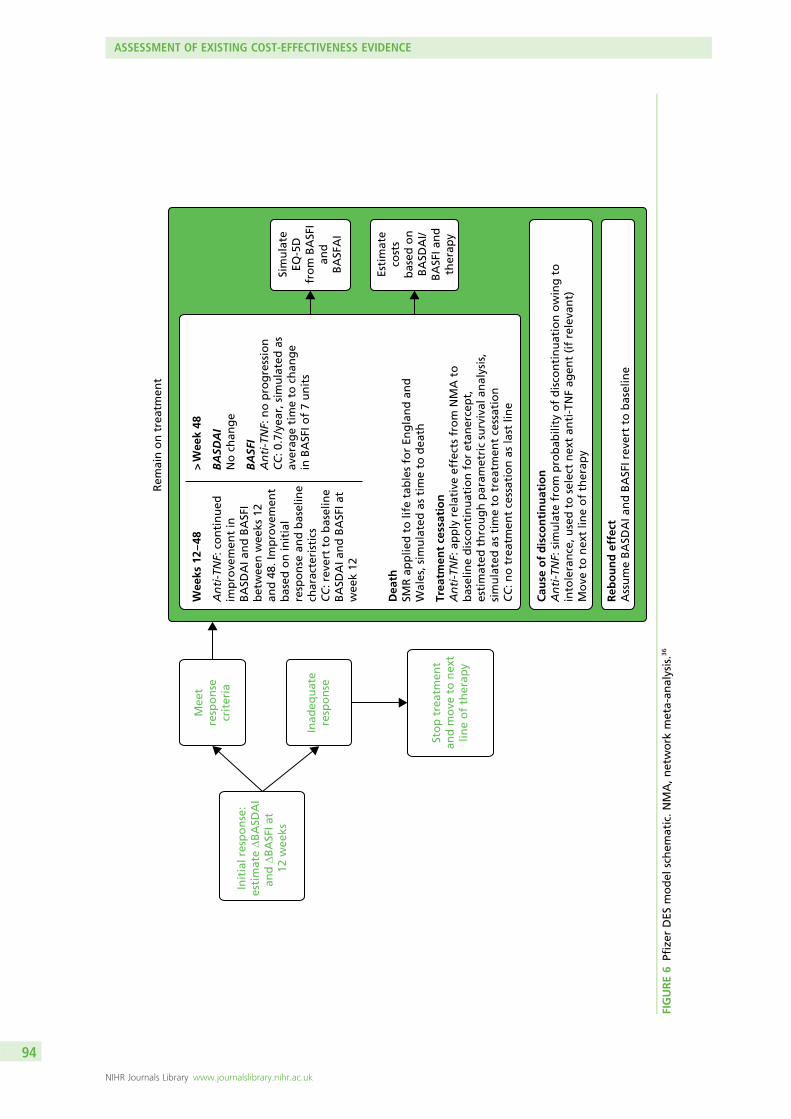
Rem
ain
on
tre
atm
ent
Init
ial r
esp
on
se:
esti
mat
e ∆B
ASD
AI
and
∆B
ASF
I at
12 w
eeks
Mee
tre
spo
nse
crit
eria
Inad
equ
ate
resp
on
se
Sim
ula
teEQ
-5D
fro
m B
ASF
Ian
dB
ASF
AI
Esti
mat
eco
sts
bas
ed o
nB
ASD
AI/
BA
SFI a
nd
ther
apy
Sto
p t
reat
men
tan
d m
ove
to
nex
tlin
e o
f th
erap
y
Cau
se o
f d
isco
nti
nu
atio
nA
nti
-TN
F: s
imu
late
fro
m p
rob
abili
ty o
f d
isco
nti
nu
atio
n o
win
g t
oin
tole
ran
ce, u
sed
to
sel
ect
nex
t an
ti-T
NF
agen
t (i
f re
leva
nt)
Mo
ve t
o n
ext
line
of
ther
apy
Reb
ou
nd
eff
ect
Ass
um
e B
ASD
AI a
nd
BA
SFI r
ever
t to
bas
elin
e
Dea
thSM
R a
pp
lied
to
life
tab
les
for
Eng
lan
d a
nd
Wal
es, s
imu
late
d a
s ti
me
to d
eath
Wee
ks 1
2 – 4
8
An
ti-T
NF:
co
nti
nu
edim
pro
vem
ent
inB
ASD
AI a
nd
BA
SFI
bet
wee
n w
eeks
12
and
48.
Imp
rove
men
tb
ased
on
init
ial
resp
on
se a
nd
bas
elin
ech
arac
teri
stic
sC
C: r
ever
t to
bas
elin
eB
ASD
AI a
nd
BA
SFI a
tw
eek
12
> W
eek
48 B
ASD
AI
No
ch
ang
e
BA
SFI
An
ti-T
NF:
no
pro
gre
ssio
nC
C: 0
.7/y
ear,
sim
ula
ted
as
aver
age
tim
e to
ch
ang
e in
BA
SFI o
f 7
un
its
Trea
tmen
t ce
ssat
ion
An
ti-T
NF:
ap
ply
rel
ativ
e ef
fect
s fr
om
NM
A t
ob
asel
ine
dis
con
tin
uat
ion
fo
r et
aner
cep
t,es
tim
ated
th
rou
gh
par
amet
ric
surv
ival
an
alys
is,
sim
ula
ted
as
tim
e to
tre
atm
ent
cess
atio
nC
C: n
o t
reat
men
t ce
ssat
ion
as
last
lin
e
FIGURE6
Pfizer
DES
model
schem
atic.N
MA,network
meta-an
alysis.36
ASSESSMENT OF EXISTING COST-EFFECTIVENESS EVIDENCE
NIHR Journals Library www.journalslibrary.nihr.ac.uk
94
Relative effects from the MTC (or MAIC in the analyses adjusting for differences in study baselinecharacteristics), in terms of mean differences in BASDAI and BASFI, were applied in order to predictequivalent response and change scores for the other anti-TNF agents and CC at 12 weeks.
From week 12, the BASFI scores for CC were assumed to increase at a rate of 0.7 units per annum(0–100 scale). The modelling of change in BASDAI and BASFI at week 48 for responders to etanercept wasconducted using the same approach used for the week 12 treatment response. However, change inBASDAI and BASFI from baseline at week 12 were included as additional covariates within the resultingmodels in order to ensure that an individual’s response at week 48 was dependent on their response atweek 12. The 48-week models of BASDAI and BASFI for the nr-AxSpA had R2 values of (AiC informationhas been removed), respectively. For the AS population, the equivalent R2 values were (AiC information hasbeen removed). In the absence of relative effect estimates at week 48 for other therapies, it was assumedthat patients who remained on TNF-α inhibitor treatment beyond week 12 (i.e. responders) wouldconverge at the BASDAI and BASFI levels predicted for etanercept by week 48. Constant BASDAI andBASFI scores for TNF-α inhibitor responders were assumed at the level observed at week 48 forsubsequent periods.
Treatment discontinuation was modelled by fitting separate parametric survival curves to long-termopen-label study data from etanercept for the AS and nr-AxSpA populations. In order to predict treatmentcessation in the population that was likely to continue treatment after 12 weeks, parametric curves werefitted only to subjects who achieved a BASDAI 50 response at week 12. Only patients who wererandomised to etanercept at baseline were retained within these survival analyses and patients who beganetanercept during open-label phases of studies were excluded. The distributions that provided the best fitwere exponential (AiC information has been removed) and log-normal (AiC information has beenremoved), based on the minimisation of the Akaike information criterion and the Bayesian informationcriterion. The exponential model was chosen based, in part, on the goodness of fit but also because theuse of hazard ratios, which were applied to estimate the effect of other anti-TNFs on the rate ofdiscontinuation, required the use of a proportional hazard survival model [to avoid making furtherassumptions when applying the hazard ratio to the log-normal (accelerated failure time) model].
The same risk of discontinuation was applied to all individuals in the model. The models of discontinuationtranslate into annual probabilities of discontinuation for etanercept, for patients who achieve a BASDAI 50response, of 5% and 11% for nr-AxSpA and AS populations, respectively. Based on data from theDANBIO registry, it was assumed that other anti-TNFs have an increased risk of discontinuation comparedwith etanercept: a hazard ratio of 1.3 is applied for infliximab and 1.12 for adalimumab. In the absenceof evidence for golimumab and certolizumab, it was assumed that the relative effect is the sameas for adalimumab on the basis that these have common molecular structure and belong tomonoclonal antibodies.
After discontinuation of the first treatment, an alternative TNF-α inhibitor was modelled as second-linetreatment for patients who discontinued due to AEs [(CiC information has been removed)% for AS and(CiC information has been removed)% for nr-AxSpA]. The same efficacy as applied for first-line treatmentswas assumed for second-line treatments for patients switching because of AEs. For patients whodiscontinued because of loss of efficacy, no further TNF-α treatment was modelled. These assumptionswere considered by the manufacturer to be consistent with current NICE guidance. For the base-casemodel, it was assumed that following discontinuation from anti-TNFs, patients would rebound back totheir baseline BASDAI and BASFI scores and that the rebound takes 6 months based on the approach usedwithin the TA23333 submission to NICE.
In the absence of previously published studies reporting the relationship between BASDAI/BASFI and EQ-5Dutility scores in the nr-AxSpA population, a de novo relationship was estimated from the 1031 study;166
variables included age, sex, baseline BASDAI and BASFI. Ordinary least squares regression models wereused, with SEs clustered around each subject to account for repeated observations. For consistency, a
DOI: 10.3310/hta20090 HEALTH TECHNOLOGY ASSESSMENT 2016 VOL. 20 NO. 9
© Queen’s Printer and Controller of HMSO 2016. This work was produced by Corbett et al. under the terms of a commissioning contract issued by the Secretary of State forHealth. This issue may be freely reproduced for the purposes of private research and study and extracts (or indeed, the full report) may be included in professional journalsprovided that suitable acknowledgement is made and the reproduction is not associated with any form of advertising. Applications for commercial reproduction should beaddressed to: NIHR Journals Library, National Institute for Health Research, Evaluation, Trials and Studies Coordinating Centre, Alpha House, University of Southampton SciencePark, Southampton SO16 7NS, UK.
95
similar relationship was estimated for the AS population using the 314-EU study.167 Alternative linear andnon-linear relationships were evaluated and final model selection based on Akaike information criterionstatistics. In the nr-AxSpA population, the final model included squared terms for BASDAI and BASFI andan interaction between BASDAI and BASFI, while in the AS population, the covariates for the interactionterm, age and male were not included. Scenario analyses considered using alternative model specificationsfor mapping. The manufacturer reported that according to visual inspection, the estimated models werevery similar between populations and reported a high degree of similarity between the results of thede novo estimated models and those published previously.
Figures 7 and 8 replicate the relationships reported by the manufacturer between EQ-5D, BASDAI andBASFI in the nr-AxSpA and AS populations, respectively. Additional figures were also presented by themanufacturer for predicted versus observed EQ-5D in each of the populations. The manufacturerconcluded that the models overpredicted EQ-5D at low observed EQ-5D and underpredicted at higherobserved EQ-5D values. The manufacturer argued that this was a common feature of mapping algorithmsand argued that the approach would be conservative towards the use of anti-TNFs.
The manufacturer included the acquisition, administration and pre-treatment monitoring costs of TNF-αinhibitors. Subsequent monitoring costs were not included in order to avoid potential double counting ofthe costs which were estimated as a function of BASDAI and BASFI. In the base-case analysis themanufacturer used data from Rafia et al.168 based on BASDAI scores only. A categorical approach wasapplied to BASDAI scores based on the following annual costs: BASDAI score of < 40= £151.96; 40≤ BASDAI score < 60= £311.08; and BASDAI score of ≥ 60= £1039.16. The manufacturer justified the useof this source as it provides the most recent UK specific data reported and permitted separation ofparticular cost items. The costs and HRQoL of AEs (serious infections only) were included in the base-caseanalysis (none observed in the nr-AxSpA trial 1031 study;166 however, serious infections were observed inthe AS trial 314-EU study167). A separate sensitivity analysis included the costs of serious infections.
A SMR of 1 for the nr-AxSpA population and 1.5 for the AS population were applied to generalpopulation life-tables.
Results of Pfizer (etanercept) modelThe main base-case ICER results from the manufacturer36 are summarised in Table 50 for the ASpopulation, together with a fully incremental comparison of ICERs in Table 51. The ICERs versus CCranged from £19,586 per QALY (certolizumab) and £37,741 per QALY (infliximab). In common with the
FIGURE 8 AiC information has been removed.36
FIGURE 7 AiC information has been removed.36
TABLE 50 Tumour necrosis factor-α inhibitors compared with CC for AS: Pfizer (base case)36
Technology Total costs (£) Total QALYs Incremental costs (£) Incremental QALYs ICER (£)
CC 18,122 7.318 – – –
Adalimumab 57,535 9.203 39,413 1.885 20,909
Certolizumab 51,843 9.040 33,721 1.722 19,586
Etanercept 60,338 9.334 42,216 2.016 20,938
Golimumab 62,698 9.412 44,576 2.094 21,288
Infliximab 98,340 9.443 80,218 2.125 37,741
ASSESSMENT OF EXISTING COST-EFFECTIVENESS EVIDENCE
NIHR Journals Library www.journalslibrary.nihr.ac.uk
96
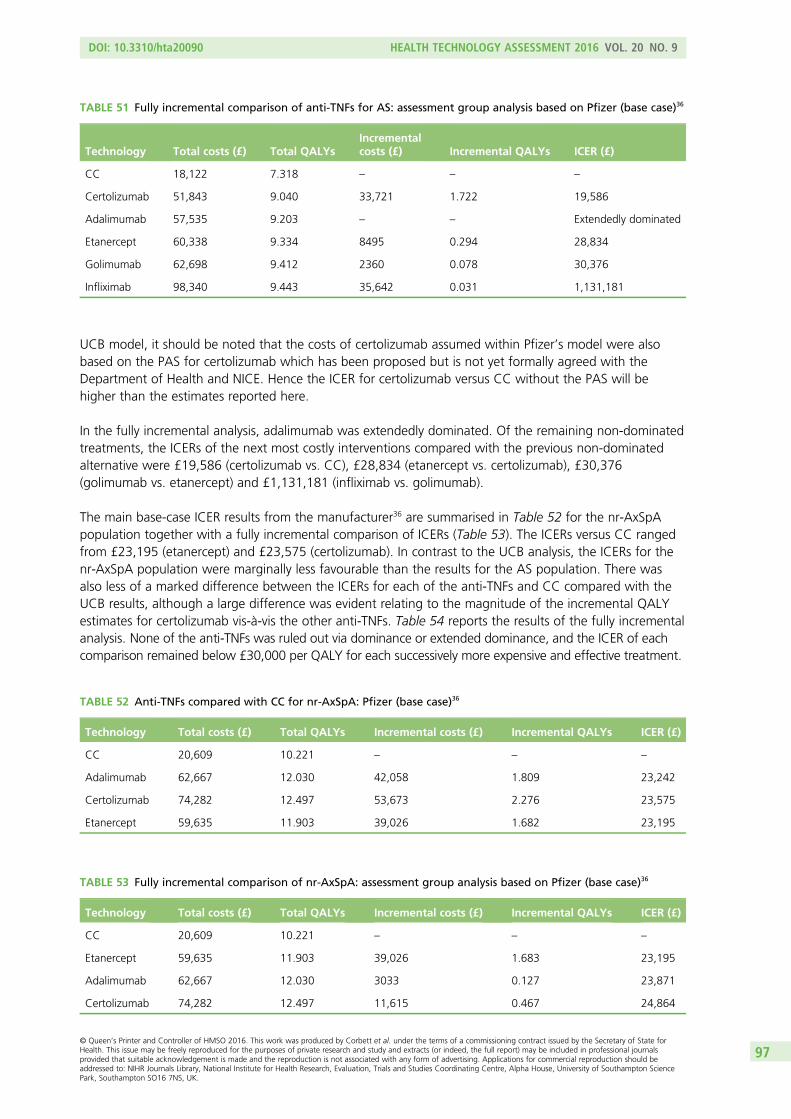
UCB model, it should be noted that the costs of certolizumab assumed within Pfizer’s model were alsobased on the PAS for certolizumab which has been proposed but is not yet formally agreed with theDepartment of Health and NICE. Hence the ICER for certolizumab versus CC without the PAS will behigher than the estimates reported here.
In the fully incremental analysis, adalimumab was extendedly dominated. Of the remaining non-dominatedtreatments, the ICERs of the next most costly interventions compared with the previous non-dominatedalternative were £19,586 (certolizumab vs. CC), £28,834 (etanercept vs. certolizumab), £30,376(golimumab vs. etanercept) and £1,131,181 (infliximab vs. golimumab).
The main base-case ICER results from the manufacturer36 are summarised in Table 52 for the nr-AxSpApopulation together with a fully incremental comparison of ICERs (Table 53). The ICERs versus CC rangedfrom £23,195 (etanercept) and £23,575 (certolizumab). In contrast to the UCB analysis, the ICERs for thenr-AxSpA population were marginally less favourable than the results for the AS population. There wasalso less of a marked difference between the ICERs for each of the anti-TNFs and CC compared with theUCB results, although a large difference was evident relating to the magnitude of the incremental QALYestimates for certolizumab vis-à-vis the other anti-TNFs. Table 54 reports the results of the fully incrementalanalysis. None of the anti-TNFs was ruled out via dominance or extended dominance, and the ICER of eachcomparison remained below £30,000 per QALY for each successively more expensive and effective treatment.
TABLE 51 Fully incremental comparison of anti-TNFs for AS: assessment group analysis based on Pfizer (base case)36
Technology Total costs (£) Total QALYsIncrementalcosts (£) Incremental QALYs ICER (£)
CC 18,122 7.318 – – –
Certolizumab 51,843 9.040 33,721 1.722 19,586
Adalimumab 57,535 9.203 – – Extendedly dominated
Etanercept 60,338 9.334 8495 0.294 28,834
Golimumab 62,698 9.412 2360 0.078 30,376
Infliximab 98,340 9.443 35,642 0.031 1,131,181
TABLE 52 Anti-TNFs compared with CC for nr-AxSpA: Pfizer (base case)36
Technology Total costs (£) Total QALYs Incremental costs (£) Incremental QALYs ICER (£)
CC 20,609 10.221 – – –
Adalimumab 62,667 12.030 42,058 1.809 23,242
Certolizumab 74,282 12.497 53,673 2.276 23,575
Etanercept 59,635 11.903 39,026 1.682 23,195
TABLE 53 Fully incremental comparison of nr-AxSpA: assessment group analysis based on Pfizer (base case)36
Technology Total costs (£) Total QALYs Incremental costs (£) Incremental QALYs ICER (£)
CC 20,609 10.221 – – –
Etanercept 59,635 11.903 39,026 1.683 23,195
Adalimumab 62,667 12.030 3033 0.127 23,871
Certolizumab 74,282 12.497 11,615 0.467 24,864
DOI: 10.3310/hta20090 HEALTH TECHNOLOGY ASSESSMENT 2016 VOL. 20 NO. 9
© Queen’s Printer and Controller of HMSO 2016. This work was produced by Corbett et al. under the terms of a commissioning contract issued by the Secretary of State forHealth. This issue may be freely reproduced for the purposes of private research and study and extracts (or indeed, the full report) may be included in professional journalsprovided that suitable acknowledgement is made and the reproduction is not associated with any form of advertising. Applications for commercial reproduction should beaddressed to: NIHR Journals Library, National Institute for Health Research, Evaluation, Trials and Studies Coordinating Centre, Alpha House, University of Southampton SciencePark, Southampton SO16 7NS, UK.
97
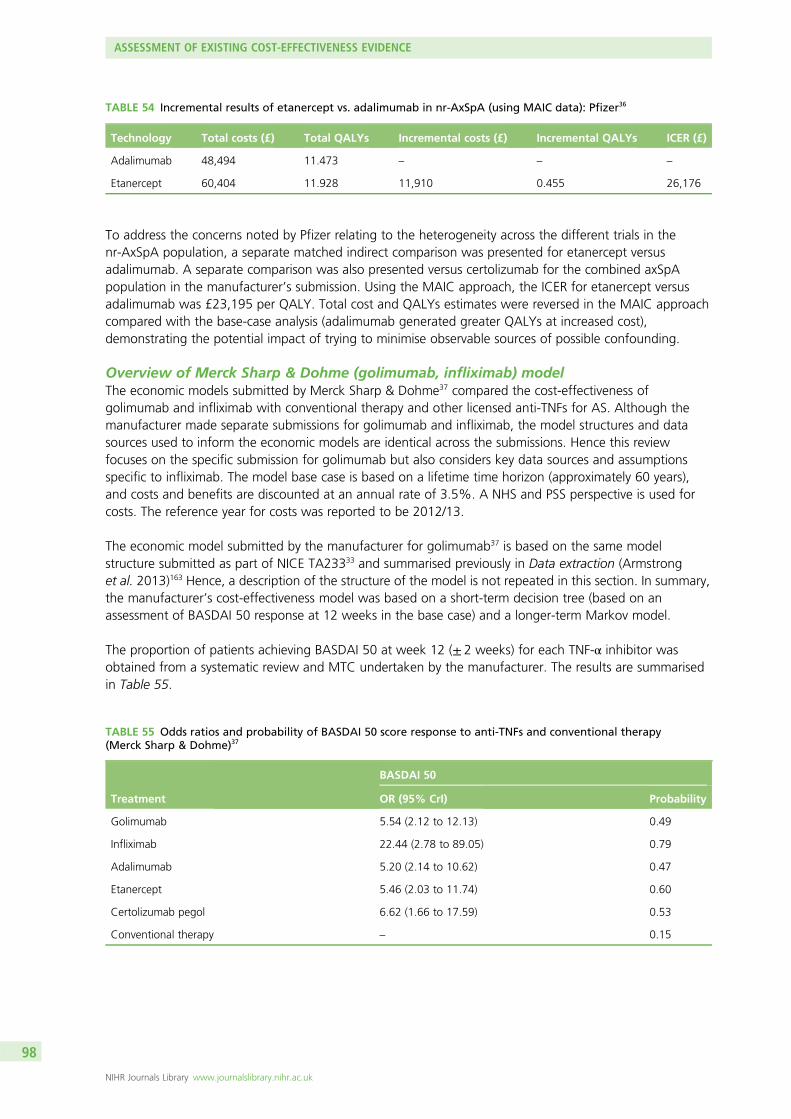
To address the concerns noted by Pfizer relating to the heterogeneity across the different trials in thenr-AxSpA population, a separate matched indirect comparison was presented for etanercept versusadalimumab. A separate comparison was also presented versus certolizumab for the combined axSpApopulation in the manufacturer’s submission. Using the MAIC approach, the ICER for etanercept versusadalimumab was £23,195 per QALY. Total cost and QALYs estimates were reversed in the MAIC approachcompared with the base-case analysis (adalimumab generated greater QALYs at increased cost),demonstrating the potential impact of trying to minimise observable sources of possible confounding.
Overview of Merck Sharp & Dohme (golimumab, infliximab) modelThe economic models submitted by Merck Sharp & Dohme37 compared the cost-effectiveness ofgolimumab and infliximab with conventional therapy and other licensed anti-TNFs for AS. Although themanufacturer made separate submissions for golimumab and infliximab, the model structures and datasources used to inform the economic models are identical across the submissions. Hence this reviewfocuses on the specific submission for golimumab but also considers key data sources and assumptionsspecific to infliximab. The model base case is based on a lifetime time horizon (approximately 60 years),and costs and benefits are discounted at an annual rate of 3.5%. A NHS and PSS perspective is used forcosts. The reference year for costs was reported to be 2012/13.
The economic model submitted by the manufacturer for golimumab37 is based on the same modelstructure submitted as part of NICE TA23333 and summarised previously in Data extraction (Armstronget al. 2013)163 Hence, a description of the structure of the model is not repeated in this section. In summary,the manufacturer’s cost-effectiveness model was based on a short-term decision tree (based on anassessment of BASDAI 50 response at 12 weeks in the base case) and a longer-term Markov model.
The proportion of patients achieving BASDAI 50 at week 12 (± 2 weeks) for each TNF-α inhibitor wasobtained from a systematic review and MTC undertaken by the manufacturer. The results are summarisedin Table 55.
TABLE 54 Incremental results of etanercept vs. adalimumab in nr-AxSpA (using MAIC data): Pfizer36
Technology Total costs (£) Total QALYs Incremental costs (£) Incremental QALYs ICER (£)
Adalimumab 48,494 11.473 – – –
Etanercept 60,404 11.928 11,910 0.455 26,176
TABLE 55 Odds ratios and probability of BASDAI 50 score response to anti-TNFs and conventional therapy(Merck Sharp & Dohme)37
Treatment
BASDAI 50
OR (95% CrI) Probability
Golimumab 5.54 (2.12 to 12.13) 0.49
Infliximab 22.44 (2.78 to 89.05) 0.79
Adalimumab 5.20 (2.14 to 10.62) 0.47
Etanercept 5.46 (2.03 to 11.74) 0.60
Certolizumab pegol 6.62 (1.66 to 17.59) 0.53
Conventional therapy – 0.15
ASSESSMENT OF EXISTING COST-EFFECTIVENESS EVIDENCE
NIHR Journals Library www.journalslibrary.nihr.ac.uk
98
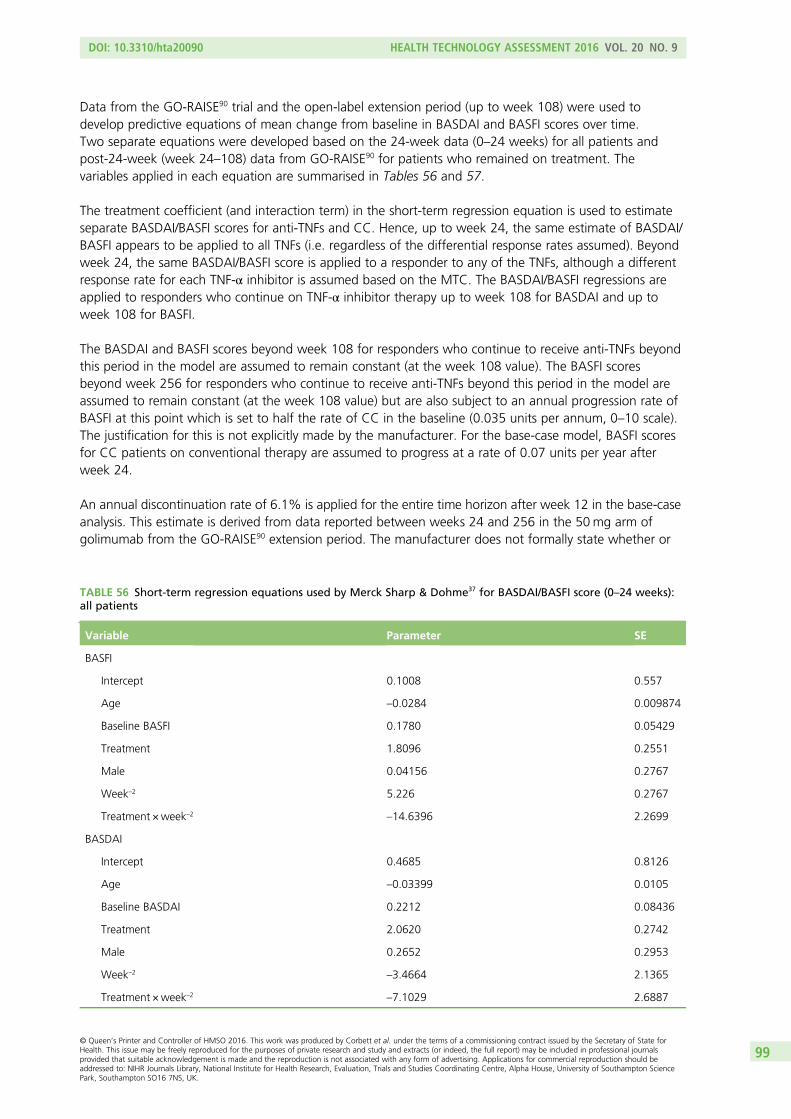
Data from the GO-RAISE90 trial and the open-label extension period (up to week 108) were used todevelop predictive equations of mean change from baseline in BASDAI and BASFI scores over time.Two separate equations were developed based on the 24-week data (0–24 weeks) for all patients andpost-24-week (week 24–108) data from GO-RAISE90 for patients who remained on treatment. Thevariables applied in each equation are summarised in Tables 56 and 57.
The treatment coefficient (and interaction term) in the short-term regression equation is used to estimateseparate BASDAI/BASFI scores for anti-TNFs and CC. Hence, up to week 24, the same estimate of BASDAI/BASFI appears to be applied to all TNFs (i.e. regardless of the differential response rates assumed). Beyondweek 24, the same BASDAI/BASFI score is applied to a responder to any of the TNFs, although a differentresponse rate for each TNF-α inhibitor is assumed based on the MTC. The BASDAI/BASFI regressions areapplied to responders who continue on TNF-α inhibitor therapy up to week 108 for BASDAI and up toweek 108 for BASFI.
The BASDAI and BASFI scores beyond week 108 for responders who continue to receive anti-TNFs beyondthis period in the model are assumed to remain constant (at the week 108 value). The BASFI scoresbeyond week 256 for responders who continue to receive anti-TNFs beyond this period in the model areassumed to remain constant (at the week 108 value) but are also subject to an annual progression rate ofBASFI at this point which is set to half the rate of CC in the baseline (0.035 units per annum, 0–10 scale).The justification for this is not explicitly made by the manufacturer. For the base-case model, BASFI scoresfor CC patients on conventional therapy are assumed to progress at a rate of 0.07 units per year afterweek 24.
An annual discontinuation rate of 6.1% is applied for the entire time horizon after week 12 in the base-caseanalysis. This estimate is derived from data reported between weeks 24 and 256 in the 50mg arm ofgolimumab from the GO-RAISE90 extension period. The manufacturer does not formally state whether or
TABLE 56 Short-term regression equations used by Merck Sharp & Dohme37 for BASDAI/BASFI score (0–24 weeks):all patients
Variable Parameter SE
BASFI
Intercept 0.1008 0.557
Age –0.0284 0.009874
Baseline BASFI 0.1780 0.05429
Treatment 1.8096 0.2551
Male 0.04156 0.2767
Week–2 5.226 0.2767
Treatment ×week–2 –14.6396 2.2699
BASDAI
Intercept 0.4685 0.8126
Age –0.03399 0.0105
Baseline BASDAI 0.2212 0.08436
Treatment 2.0620 0.2742
Male 0.2652 0.2953
Week–2 –3.4664 2.1365
Treatment ×week–2 –7.1029 2.6887
DOI: 10.3310/hta20090 HEALTH TECHNOLOGY ASSESSMENT 2016 VOL. 20 NO. 9
© Queen’s Printer and Controller of HMSO 2016. This work was produced by Corbett et al. under the terms of a commissioning contract issued by the Secretary of State forHealth. This issue may be freely reproduced for the purposes of private research and study and extracts (or indeed, the full report) may be included in professional journalsprovided that suitable acknowledgement is made and the reproduction is not associated with any form of advertising. Applications for commercial reproduction should beaddressed to: NIHR Journals Library, National Institute for Health Research, Evaluation, Trials and Studies Coordinating Centre, Alpha House, University of Southampton SciencePark, Southampton SO16 7NS, UK.
99
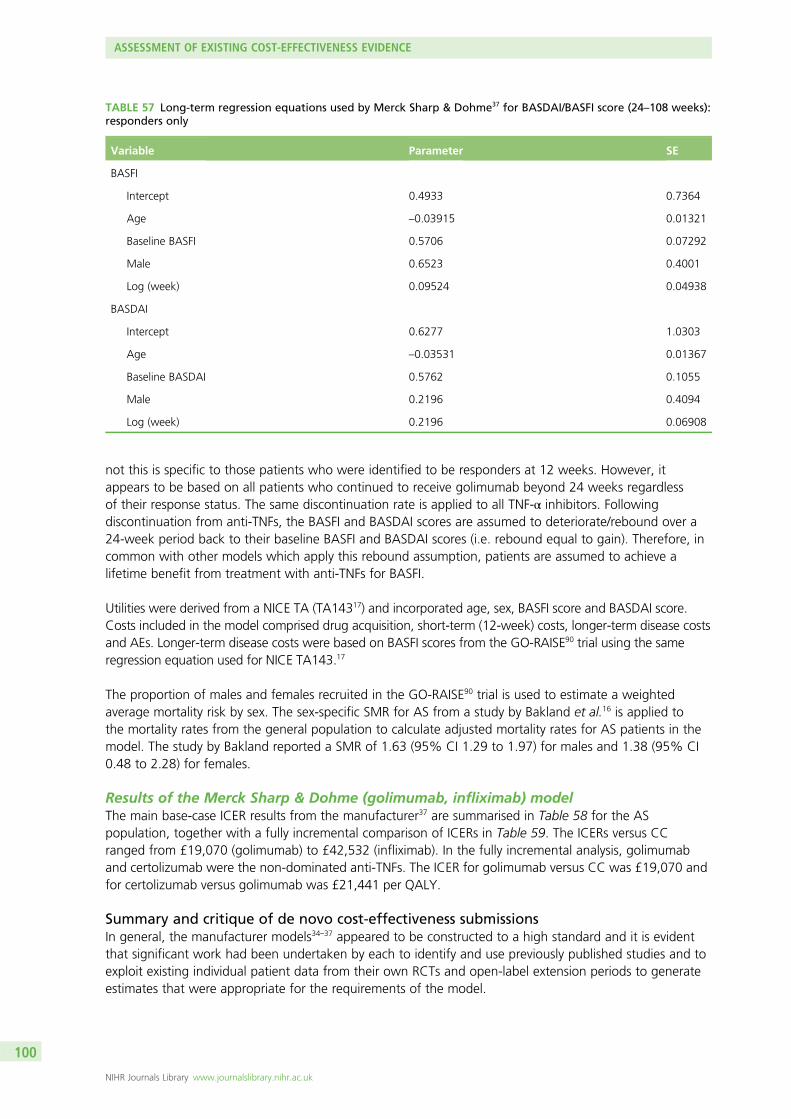
not this is specific to those patients who were identified to be responders at 12 weeks. However, itappears to be based on all patients who continued to receive golimumab beyond 24 weeks regardlessof their response status. The same discontinuation rate is applied to all TNF-α inhibitors. Followingdiscontinuation from anti-TNFs, the BASFI and BASDAI scores are assumed to deteriorate/rebound over a24-week period back to their baseline BASFI and BASDAI scores (i.e. rebound equal to gain). Therefore, incommon with other models which apply this rebound assumption, patients are assumed to achieve alifetime benefit from treatment with anti-TNFs for BASFI.
Utilities were derived from a NICE TA (TA14317) and incorporated age, sex, BASFI score and BASDAI score.Costs included in the model comprised drug acquisition, short-term (12-week) costs, longer-term disease costsand AEs. Longer-term disease costs were based on BASFI scores from the GO-RAISE90 trial using the sameregression equation used for NICE TA143.17
The proportion of males and females recruited in the GO-RAISE90 trial is used to estimate a weightedaverage mortality risk by sex. The sex-specific SMR for AS from a study by Bakland et al.16 is applied tothe mortality rates from the general population to calculate adjusted mortality rates for AS patients in themodel. The study by Bakland reported a SMR of 1.63 (95% CI 1.29 to 1.97) for males and 1.38 (95% CI0.48 to 2.28) for females.
Results of the Merck Sharp & Dohme (golimumab, infliximab) modelThe main base-case ICER results from the manufacturer37 are summarised in Table 58 for the ASpopulation, together with a fully incremental comparison of ICERs in Table 59. The ICERs versus CCranged from £19,070 (golimumab) to £42,532 (infliximab). In the fully incremental analysis, golimumaband certolizumab were the non-dominated anti-TNFs. The ICER for golimumab versus CC was £19,070 andfor certolizumab versus golimumab was £21,441 per QALY.
Summary and critique of de novo cost-effectiveness submissionsIn general, the manufacturer models34–37 appeared to be constructed to a high standard and it is evidentthat significant work had been undertaken by each to identify and use previously published studies and toexploit existing individual patient data from their own RCTs and open-label extension periods to generateestimates that were appropriate for the requirements of the model.
TABLE 57 Long-term regression equations used by Merck Sharp & Dohme37 for BASDAI/BASFI score (24–108 weeks):responders only
Variable Parameter SE
BASFI
Intercept 0.4933 0.7364
Age –0.03915 0.01321
Baseline BASFI 0.5706 0.07292
Male 0.6523 0.4001
Log (week) 0.09524 0.04938
BASDAI
Intercept 0.6277 1.0303
Age –0.03531 0.01367
Baseline BASDAI 0.5762 0.1055
Male 0.2196 0.4094
Log (week) 0.2196 0.06908
ASSESSMENT OF EXISTING COST-EFFECTIVENESS EVIDENCE
NIHR Journals Library www.journalslibrary.nihr.ac.uk
100
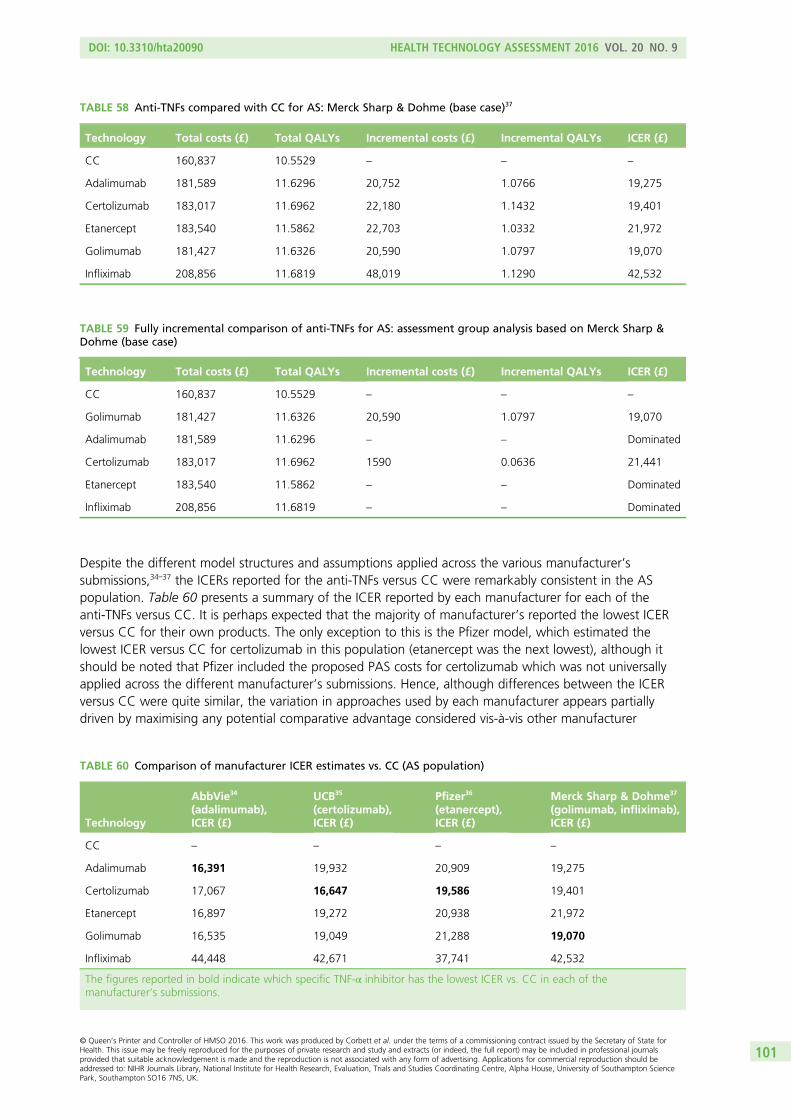
Despite the different model structures and assumptions applied across the various manufacturer’ssubmissions,34–37 the ICERs reported for the anti-TNFs versus CC were remarkably consistent in the ASpopulation. Table 60 presents a summary of the ICER reported by each manufacturer for each of theanti-TNFs versus CC. It is perhaps expected that the majority of manufacturer’s reported the lowest ICERversus CC for their own products. The only exception to this is the Pfizer model, which estimated thelowest ICER versus CC for certolizumab in this population (etanercept was the next lowest), although itshould be noted that Pfizer included the proposed PAS costs for certolizumab which was not universallyapplied across the different manufacturer’s submissions. Hence, although differences between the ICERversus CC were quite similar, the variation in approaches used by each manufacturer appears partiallydriven by maximising any potential comparative advantage considered vis-à-vis other manufacturer
TABLE 58 Anti-TNFs compared with CC for AS: Merck Sharp & Dohme (base case)37
Technology Total costs (£) Total QALYs Incremental costs (£) Incremental QALYs ICER (£)
CC 160,837 10.5529 – – –
Adalimumab 181,589 11.6296 20,752 1.0766 19,275
Certolizumab 183,017 11.6962 22,180 1.1432 19,401
Etanercept 183,540 11.5862 22,703 1.0332 21,972
Golimumab 181,427 11.6326 20,590 1.0797 19,070
Infliximab 208,856 11.6819 48,019 1.1290 42,532
TABLE 59 Fully incremental comparison of anti-TNFs for AS: assessment group analysis based on Merck Sharp &Dohme (base case)
Technology Total costs (£) Total QALYs Incremental costs (£) Incremental QALYs ICER (£)
CC 160,837 10.5529 – – –
Golimumab 181,427 11.6326 20,590 1.0797 19,070
Adalimumab 181,589 11.6296 – – Dominated
Certolizumab 183,017 11.6962 1590 0.0636 21,441
Etanercept 183,540 11.5862 – – Dominated
Infliximab 208,856 11.6819 – – Dominated
TABLE 60 Comparison of manufacturer ICER estimates vs. CC (AS population)
Technology
AbbVie34
(adalimumab),ICER (£)
UCB35
(certolizumab),ICER (£)
Pfizer36
(etanercept),ICER (£)
Merck Sharp & Dohme37
(golimumab, infliximab),ICER (£)
CC – – – –
Adalimumab 16,391 19,932 20,909 19,275
Certolizumab 17,067 16,647 19,586 19,401
Etanercept 16,897 19,272 20,938 21,972
Golimumab 16,535 19,049 21,288 19,070
Infliximab 44,448 42,671 37,741 42,532
The figures reported in bold indicate which specific TNF-α inhibitor has the lowest ICER vs. CC in each of themanufacturer’s submissions.
DOI: 10.3310/hta20090 HEALTH TECHNOLOGY ASSESSMENT 2016 VOL. 20 NO. 9
© Queen’s Printer and Controller of HMSO 2016. This work was produced by Corbett et al. under the terms of a commissioning contract issued by the Secretary of State forHealth. This issue may be freely reproduced for the purposes of private research and study and extracts (or indeed, the full report) may be included in professional journalsprovided that suitable acknowledgement is made and the reproduction is not associated with any form of advertising. Applications for commercial reproduction should beaddressed to: NIHR Journals Library, National Institute for Health Research, Evaluation, Trials and Studies Coordinating Centre, Alpha House, University of Southampton SciencePark, Southampton SO16 7NS, UK.
101
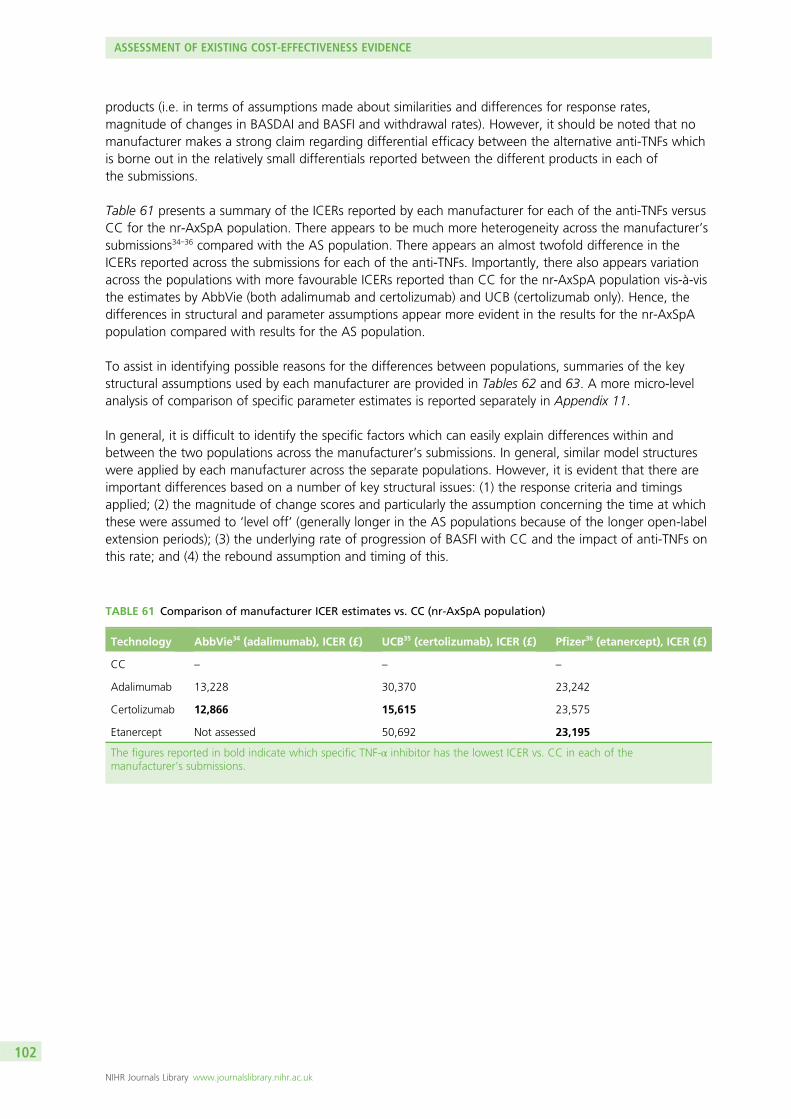
products (i.e. in terms of assumptions made about similarities and differences for response rates,magnitude of changes in BASDAI and BASFI and withdrawal rates). However, it should be noted that nomanufacturer makes a strong claim regarding differential efficacy between the alternative anti-TNFs whichis borne out in the relatively small differentials reported between the different products in each ofthe submissions.
Table 61 presents a summary of the ICERs reported by each manufacturer for each of the anti-TNFs versusCC for the nr-AxSpA population. There appears to be much more heterogeneity across the manufacturer’ssubmissions34–36 compared with the AS population. There appears an almost twofold difference in theICERs reported across the submissions for each of the anti-TNFs. Importantly, there also appears variationacross the populations with more favourable ICERs reported than CC for the nr-AxSpA population vis-à-visthe estimates by AbbVie (both adalimumab and certolizumab) and UCB (certolizumab only). Hence, thedifferences in structural and parameter assumptions appear more evident in the results for the nr-AxSpApopulation compared with results for the AS population.
To assist in identifying possible reasons for the differences between populations, summaries of the keystructural assumptions used by each manufacturer are provided in Tables 62 and 63. A more micro-levelanalysis of comparison of specific parameter estimates is reported separately in Appendix 11.
In general, it is difficult to identify the specific factors which can easily explain differences within andbetween the two populations across the manufacturer’s submissions. In general, similar model structureswere applied by each manufacturer across the separate populations. However, it is evident that there areimportant differences based on a number of key structural issues: (1) the response criteria and timingsapplied; (2) the magnitude of change scores and particularly the assumption concerning the time at whichthese were assumed to ‘level off’ (generally longer in the AS populations because of the longer open-labelextension periods); (3) the underlying rate of progression of BASFI with CC and the impact of anti-TNFs onthis rate; and (4) the rebound assumption and timing of this.
TABLE 61 Comparison of manufacturer ICER estimates vs. CC (nr-AxSpA population)
Technology AbbVie34 (adalimumab), ICER (£) UCB35 (certolizumab), ICER (£) Pfizer36 (etanercept), ICER (£)
CC – – –
Adalimumab 13,228 30,370 23,242
Certolizumab 12,866 15,615 23,575
Etanercept Not assessed 50,692 23,195
The figures reported in bold indicate which specific TNF-α inhibitor has the lowest ICER vs. CC in each of themanufacturer’s submissions.
ASSESSMENT OF EXISTING COST-EFFECTIVENESS EVIDENCE
NIHR Journals Library www.journalslibrary.nihr.ac.uk
102
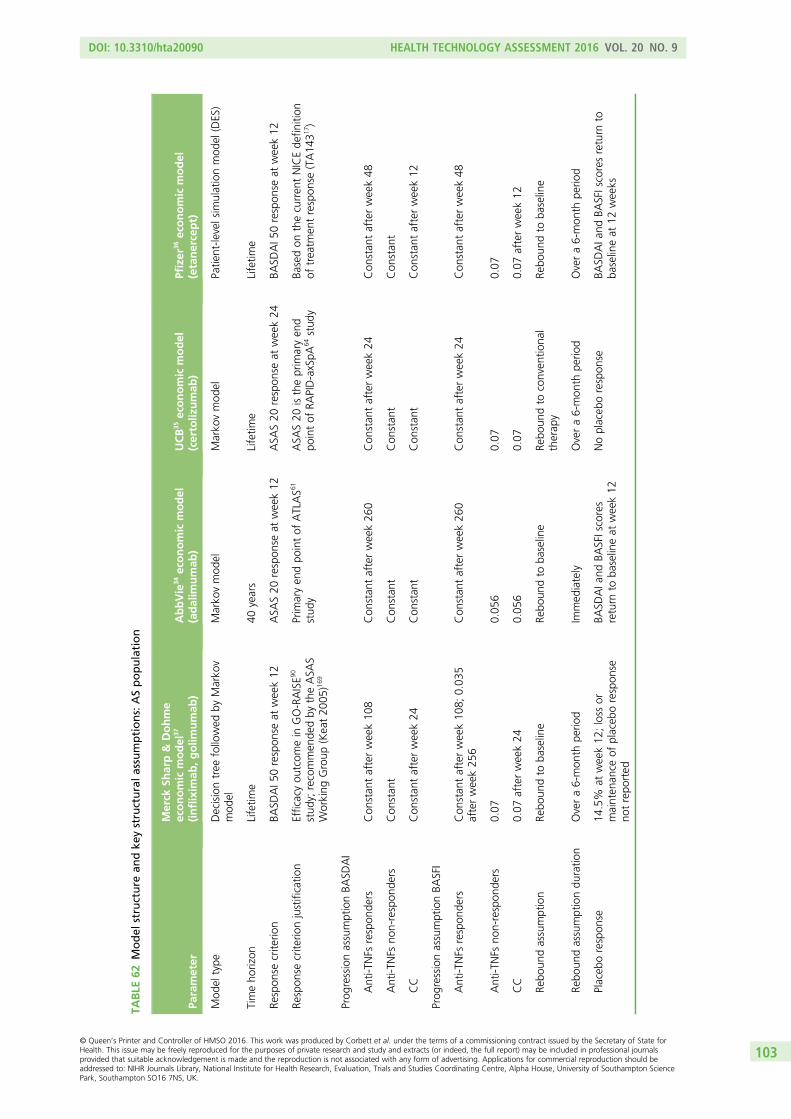
TABLE
62Model
structure
andke
ystructuralassumptions:ASpopulation
Parameter
Merck
Sharp&
Dohme
economic
model
37
(inflixim
ab,golim
umab
)AbbVie
34economic
model
(adalim
umab
)UCB
35economic
model
(certoliz
umab
)Pfizer
36economic
model
(etanercept)
Mod
eltype
Decisiontree
followed
byMarko
vmod
elMarko
vmod
elMarko
vmod
elPatie
nt-le
velsim
ulationmod
el(DES)
Timeho
rizon
Lifetim
e40
years
Lifetim
eLifetim
e
Respon
secrite
rion
BASD
AI5
0respon
seat
week12
ASA
S20
respon
seat
week12
ASA
S20
respon
seat
week24
BASD
AI5
0respon
seat
week12
Respon
secrite
rionjustificatio
nEfficacyou
tcom
ein
GO-RAISE9
0
stud
y;recommen
dedby
theASA
SWorking
Group
(Keat20
05)1
69
Prim
aryen
dpo
intof
ATLAS6
1
stud
yASA
S20
istheprim
aryen
dpo
intof
RAPID-axSpA
64stud
yBa
sedon
thecurren
tNICEde
finition
oftreatm
entrespon
se(TA14
317 )
Prog
ressionassumptionBA
SDAI
Anti-T
NFs
respon
ders
Con
stan
tafterweek10
8Con
stan
tafterweek26
0Con
stan
tafterweek24
Con
stan
tafterweek48
Anti-T
NFs
non-respon
ders
Con
stan
tCon
stan
tCon
stan
tCon
stan
t
CC
Con
stan
tafterweek24
Con
stan
tCon
stan
tCon
stan
tafterweek12
Prog
ressionassumptionBA
SFI
Anti-T
NFs
respon
ders
Con
stan
tafterweek10
8;0.03
5afterweek25
6Con
stan
tafterweek26
0Con
stan
tafterweek24
Con
stan
tafterweek48
Anti-T
NFs
non-respon
ders
0.07
0.05
60.07
0.07
CC
0.07
afterweek24
0.05
60.07
0.07
afterweek12
Rebo
undassumption
Rebo
undto
baseline
Rebo
undto
baseline
Rebo
undto
conven
tiona
ltherap
yRe
boun
dto
baseline
Rebo
undassumptiondu
ratio
nOvera6-mon
thpe
riod
Immed
iately
Overa6-mon
thpe
riod
Overa6-mon
thpe
riod
Placeb
orespon
se14
.5%
atweek12
;loss
ormainten
ance
ofplaceb
orespon
seno
trepo
rted
BASD
AIa
ndBA
SFIscores
return
toba
selineat
week12
Noplaceb
orespon
seBA
SDAIa
ndBA
SFIscoresreturn
toba
selineat
12weeks
DOI: 10.3310/hta20090 HEALTH TECHNOLOGY ASSESSMENT 2016 VOL. 20 NO. 9
© Queen’s Printer and Controller of HMSO 2016. This work was produced by Corbett et al. under the terms of a commissioning contract issued by the Secretary of State forHealth. This issue may be freely reproduced for the purposes of private research and study and extracts (or indeed, the full report) may be included in professional journalsprovided that suitable acknowledgement is made and the reproduction is not associated with any form of advertising. Applications for commercial reproduction should beaddressed to: NIHR Journals Library, National Institute for Health Research, Evaluation, Trials and Studies Coordinating Centre, Alpha House, University of Southampton SciencePark, Southampton SO16 7NS, UK.
103
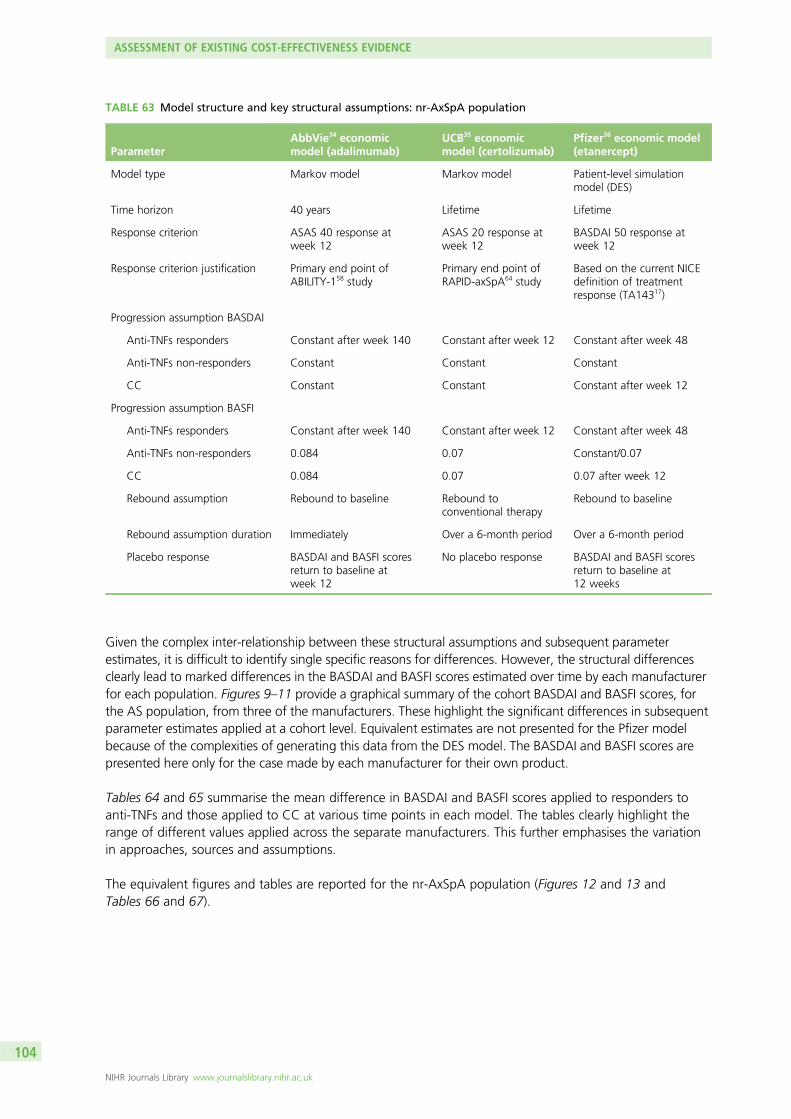
Given the complex inter-relationship between these structural assumptions and subsequent parameterestimates, it is difficult to identify single specific reasons for differences. However, the structural differencesclearly lead to marked differences in the BASDAI and BASFI scores estimated over time by each manufacturerfor each population. Figures 9–11 provide a graphical summary of the cohort BASDAI and BASFI scores, forthe AS population, from three of the manufacturers. These highlight the significant differences in subsequentparameter estimates applied at a cohort level. Equivalent estimates are not presented for the Pfizer modelbecause of the complexities of generating this data from the DES model. The BASDAI and BASFI scores arepresented here only for the case made by each manufacturer for their own product.
Tables 64 and 65 summarise the mean difference in BASDAI and BASFI scores applied to responders toanti-TNFs and those applied to CC at various time points in each model. The tables clearly highlight therange of different values applied across the separate manufacturers. This further emphasises the variationin approaches, sources and assumptions.
The equivalent figures and tables are reported for the nr-AxSpA population (Figures 12 and 13 andTables 66 and 67).
TABLE 63 Model structure and key structural assumptions: nr-AxSpA population
ParameterAbbVie34 economicmodel (adalimumab)
UCB35 economicmodel (certolizumab)
Pfizer36 economic model(etanercept)
Model type Markov model Markov model Patient-level simulationmodel (DES)
Time horizon 40 years Lifetime Lifetime
Response criterion ASAS 40 response atweek 12
ASAS 20 response atweek 12
BASDAI 50 response atweek 12
Response criterion justification Primary end point ofABILITY-158 study
Primary end point ofRAPID-axSpA64 study
Based on the current NICEdefinition of treatmentresponse (TA14317)
Progression assumption BASDAI
Anti-TNFs responders Constant after week 140 Constant after week 12 Constant after week 48
Anti-TNFs non-responders Constant Constant Constant
CC Constant Constant Constant after week 12
Progression assumption BASFI
Anti-TNFs responders Constant after week 140 Constant after week 12 Constant after week 48
Anti-TNFs non-responders 0.084 0.07 Constant/0.07
CC 0.084 0.07 0.07 after week 12
Rebound assumption Rebound to baseline Rebound toconventional therapy
Rebound to baseline
Rebound assumption duration Immediately Over a 6-month period Over a 6-month period
Placebo response BASDAI and BASFI scoresreturn to baseline atweek 12
No placebo response BASDAI and BASFI scoresreturn to baseline at12 weeks
ASSESSMENT OF EXISTING COST-EFFECTIVENESS EVIDENCE
NIHR Journals Library www.journalslibrary.nihr.ac.uk
104
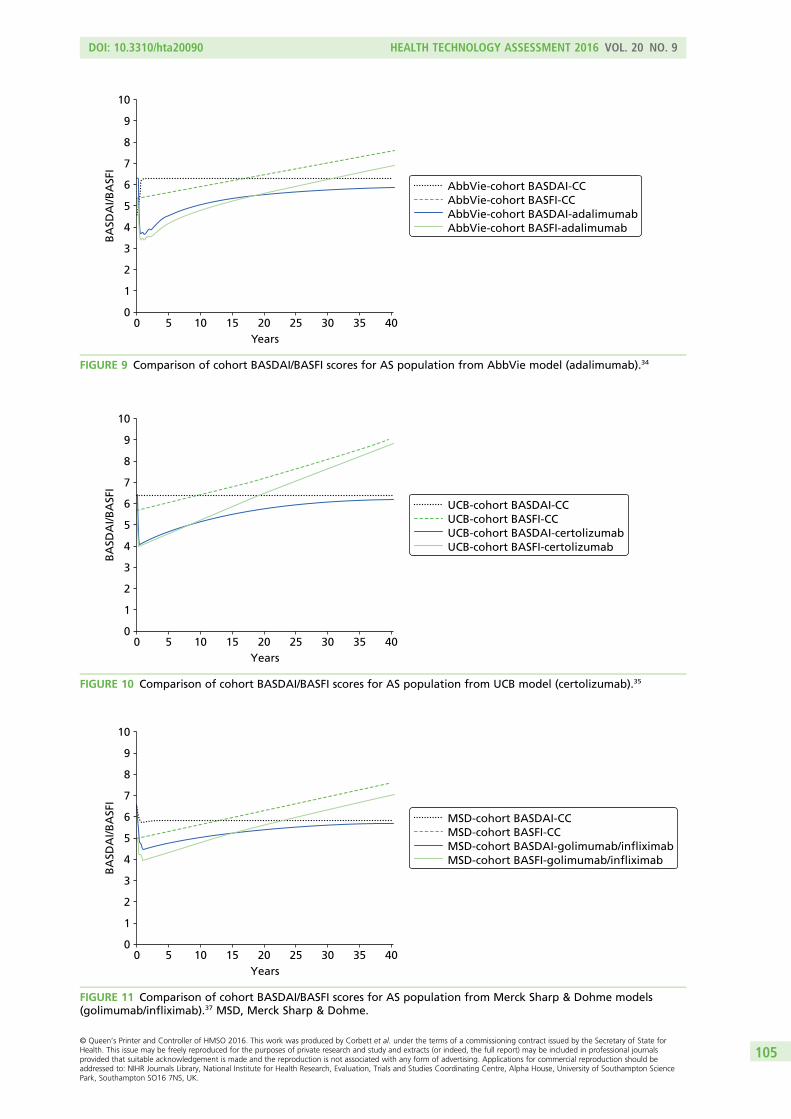
00
1
2
3
4
5
6
7
8
9
10
5 10 15 20 25 30 35 40Years
BA
SDA
I/BA
SFI
MSD-cohort BASDAI-CCMSD-cohort BASFI-CCMSD-cohort BASDAI-golimumab/infliximabMSD-cohort BASFI-golimumab/infliximab
FIGURE 11 Comparison of cohort BASDAI/BASFI scores for AS population from Merck Sharp & Dohme models(golimumab/infliximab).37 MSD, Merck Sharp & Dohme.
00
1
2
3
4
5
6
7
8
9
10
5 10 15 20 25 30 35 40Years
BA
SDA
I/BA
SFI
AbbVie-cohort BASDAI-CCAbbVie-cohort BASFI-CCAbbVie-cohort BASDAI-adalimumabAbbVie-cohort BASFI-adalimumab
FIGURE 9 Comparison of cohort BASDAI/BASFI scores for AS population from AbbVie model (adalimumab).34
00
1
2
3
4
5
6
7
8
9
10
5 10 15 20 25 30 35 40Years
BA
SDA
I/BA
SFI
UCB-cohort BASDAI-CCUCB-cohort BASFI-CCUCB-cohort BASDAI-certolizumabUCB-cohort BASFI-certolizumab
FIGURE 10 Comparison of cohort BASDAI/BASFI scores for AS population from UCB model (certolizumab).35
DOI: 10.3310/hta20090 HEALTH TECHNOLOGY ASSESSMENT 2016 VOL. 20 NO. 9
© Queen’s Printer and Controller of HMSO 2016. This work was produced by Corbett et al. under the terms of a commissioning contract issued by the Secretary of State forHealth. This issue may be freely reproduced for the purposes of private research and study and extracts (or indeed, the full report) may be included in professional journalsprovided that suitable acknowledgement is made and the reproduction is not associated with any form of advertising. Applications for commercial reproduction should beaddressed to: NIHR Journals Library, National Institute for Health Research, Evaluation, Trials and Studies Coordinating Centre, Alpha House, University of Southampton SciencePark, Southampton SO16 7NS, UK.
105
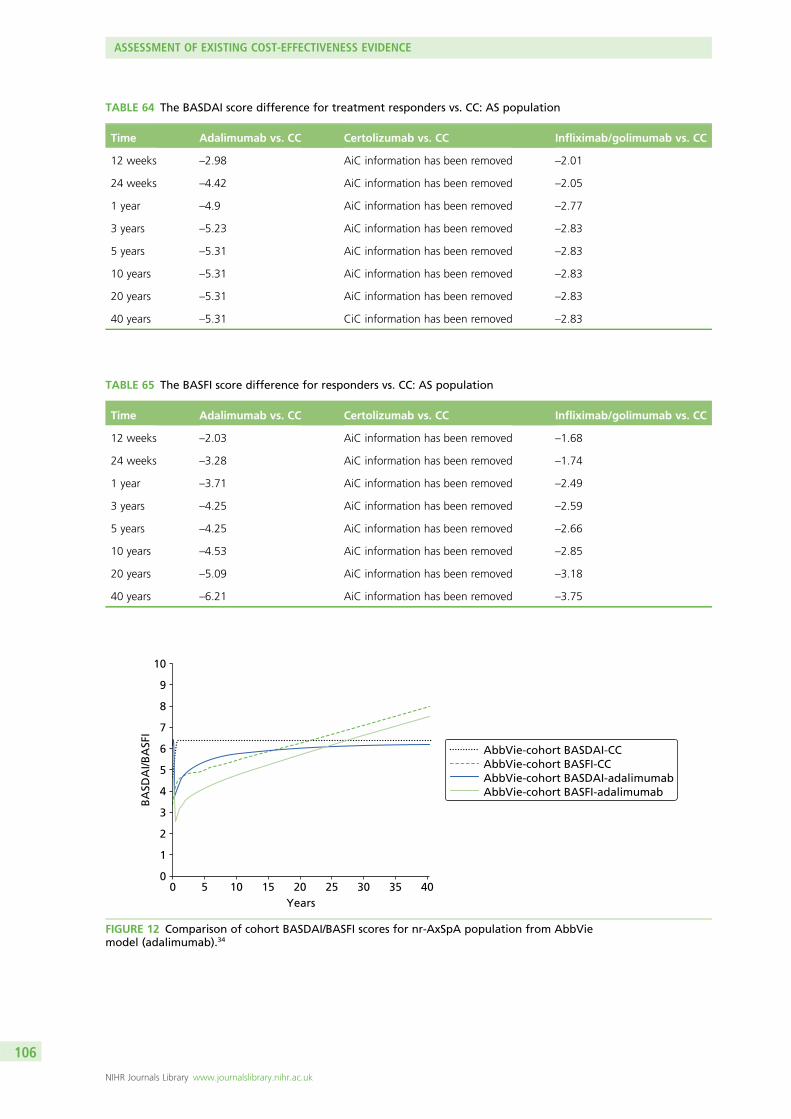
TABLE 65 The BASFI score difference for responders vs. CC: AS population
Time Adalimumab vs. CC Certolizumab vs. CC Infliximab/golimumab vs. CC
12 weeks –2.03 AiC information has been removed –1.68
24 weeks –3.28 AiC information has been removed –1.74
1 year –3.71 AiC information has been removed –2.49
3 years –4.25 AiC information has been removed –2.59
5 years –4.25 AiC information has been removed –2.66
10 years –4.53 AiC information has been removed –2.85
20 years –5.09 AiC information has been removed –3.18
40 years –6.21 AiC information has been removed –3.75
TABLE 64 The BASDAI score difference for treatment responders vs. CC: AS population
Time Adalimumab vs. CC Certolizumab vs. CC Infliximab/golimumab vs. CC
12 weeks –2.98 AiC information has been removed –2.01
24 weeks –4.42 AiC information has been removed –2.05
1 year –4.9 AiC information has been removed –2.77
3 years –5.23 AiC information has been removed –2.83
5 years –5.31 AiC information has been removed –2.83
10 years –5.31 AiC information has been removed –2.83
20 years –5.31 AiC information has been removed –2.83
40 years –5.31 CiC information has been removed –2.83
00
1
2
3
4
5
6
7
8
9
10
5 10 15 20 25 30 35 40Years
BA
SDA
I/BA
SFI
AbbVie-cohort BASDAI-CCAbbVie-cohort BASFI-CCAbbVie-cohort BASDAI-adalimumabAbbVie-cohort BASFI-adalimumab
FIGURE 12 Comparison of cohort BASDAI/BASFI scores for nr-AxSpA population from AbbViemodel (adalimumab).34
ASSESSMENT OF EXISTING COST-EFFECTIVENESS EVIDENCE
NIHR Journals Library www.journalslibrary.nihr.ac.uk
106
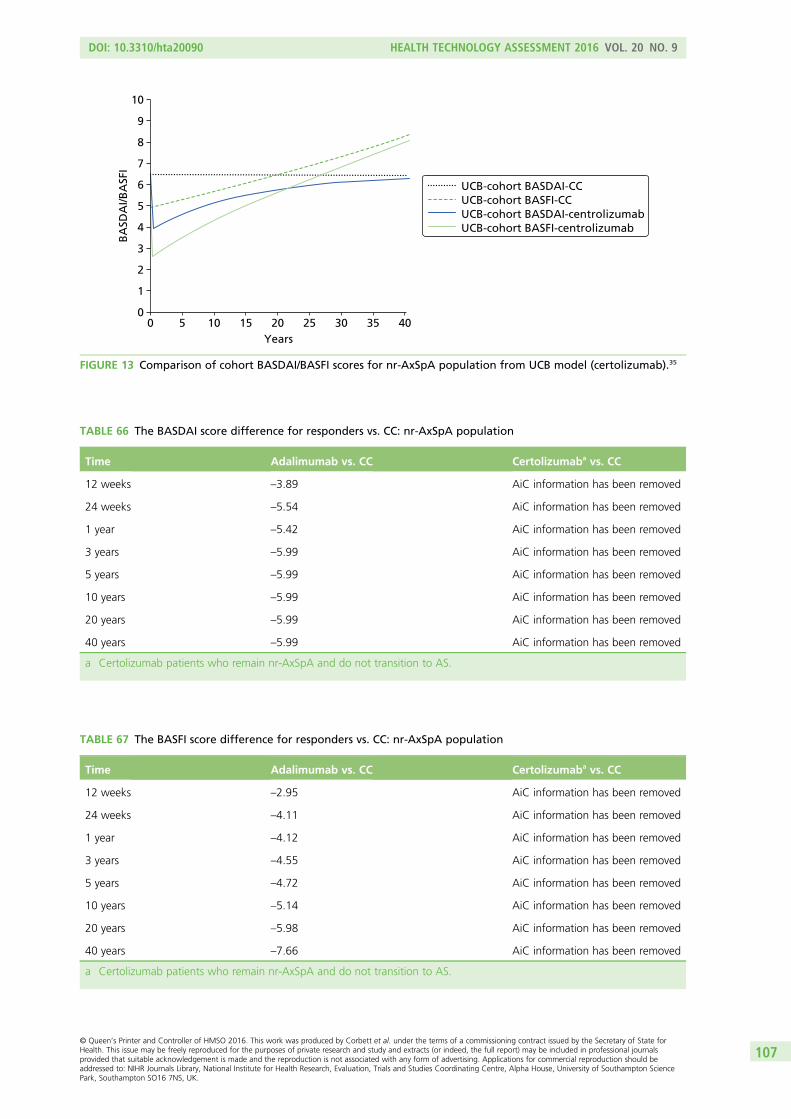
00
1
2
3
4
5
6
7
8
9
10
5 10 15 20 25 30 35 40Years
BA
SDA
I/BA
SFI
UCB-cohort BASDAI-CCUCB-cohort BASFI-CCUCB-cohort BASDAI-centrolizumabUCB-cohort BASFI-centrolizumab
FIGURE 13 Comparison of cohort BASDAI/BASFI scores for nr-AxSpA population from UCB model (certolizumab).35
TABLE 66 The BASDAI score difference for responders vs. CC: nr-AxSpA population
Time Adalimumab vs. CC Certolizumaba vs. CC
12 weeks –3.89 AiC information has been removed
24 weeks –5.54 AiC information has been removed
1 year –5.42 AiC information has been removed
3 years –5.99 AiC information has been removed
5 years –5.99 AiC information has been removed
10 years –5.99 AiC information has been removed
20 years –5.99 AiC information has been removed
40 years –5.99 AiC information has been removed
a Certolizumab patients who remain nr-AxSpA and do not transition to AS.
TABLE 67 The BASFI score difference for responders vs. CC: nr-AxSpA population
Time Adalimumab vs. CC Certolizumaba vs. CC
12 weeks –2.95 AiC information has been removed
24 weeks –4.11 AiC information has been removed
1 year –4.12 AiC information has been removed
3 years –4.55 AiC information has been removed
5 years –4.72 AiC information has been removed
10 years –5.14 AiC information has been removed
20 years –5.98 AiC information has been removed
40 years –7.66 AiC information has been removed
a Certolizumab patients who remain nr-AxSpA and do not transition to AS.
DOI: 10.3310/hta20090 HEALTH TECHNOLOGY ASSESSMENT 2016 VOL. 20 NO. 9
© Queen’s Printer and Controller of HMSO 2016. This work was produced by Corbett et al. under the terms of a commissioning contract issued by the Secretary of State forHealth. This issue may be freely reproduced for the purposes of private research and study and extracts (or indeed, the full report) may be included in professional journalsprovided that suitable acknowledgement is made and the reproduction is not associated with any form of advertising. Applications for commercial reproduction should beaddressed to: NIHR Journals Library, National Institute for Health Research, Evaluation, Trials and Studies Coordinating Centre, Alpha House, University of Southampton SciencePark, Southampton SO16 7NS, UK.
107
The differences across manufacturers and between the populations are further illustrated by the summaryof key parameter inputs reported in Appendix 11. As well as reporting the main parameter inputs,Appendix 11 also explores differences in approaches at a parameter level for key inputs (e.g. withdrawal,costs, etc.).
It is evident from these comparisons that there are significant differences across the manufacturers interms of key structural and parameter estimates. While it might appear reassuring that these differencesdo not appear to lead to significant differences across the ICER estimates reported for the AS population,the greater heterogeneity reported in the ICER estimates for the nr-AxSpA is clearly an issue. However,even within the AS population, any reassurance that one might have regarding the robustness andappropriateness that these estimates have for informing NHS practice needs to be carefully considered inrelation to the key conceptual issues and concerns highlighted in Summary and critique of publishedcost-effectiveness studies for previously published cost-effectiveness studies. Despite significant workundertaken by each manufacturer in support of existing and new indications for their products, it isparticularly concerning that many of the key conceptual issues and concerns appear to have not beenfully addressed. Indeed, many of these issues seem to have not been addressed at all, such that manymodels still seem reliant on the use of open-label extension data (and even more so with the extendedfollow-up reported in the AS population) without any formal consideration of the potential issues withselection that the use of these studies inevitably are subject to. Consequently, the benefits of anti-TNFsare being projected over significant periods of time without any evidence on the counterfactual (i.e. whathappens to patients who do not enter into the open-label extension periods? What happens to patientswho subsequently withdraw from anti-TNFs? And what would have happened to patients over alonger-time horizon who did not receive anti-TNFs?).
It appears that much of the case being made concerning the cost-effectiveness of the anti-TNFs rests oncomparison of single-arm studies (the subject of open-label data) and retrospective comparisons againsthistorical cohorts (as the counterfactual, for patients not on treatment, is unknown). While such acomparison may be necessitated by the short-term nature of the double-blind periods, the lack of a moredetailed consideration of the appropriateness of the comparisons being made in relation to sources ofnatural history data (and subsequent assumptions made concerning the BASDAI/BASFI trajectoriesof the different patient categories) is concerning and, hence, current ICER estimates reported by themanufacturers must be considered to be both speculative and highly uncertain.
Many of these problems can be associated with whether or not BASDAI and BASFI scores provide anappropriate conceptual basis for modelling the chronic and progressive nature of AS and nr-AxSpA. Hencecurrent models appear largely driven by data availability (i.e. the extensive evidence which has beengenerated and continues to be generated investigating the relationship between BASDAI/BASFI andcosts/utilities) rather than trying to develop a clearer underlying biological or clinical process which maybetter characterise the disease and subsequent progression across the separate populations.
Until such time that sufficient data-linking costs and utilities to other measures are reported, it seemsinevitable that models will continue to be driven largely by BASDAI and BASFI scores over time togetherwith assumptions concerning the longer-term effect of anti-TNFs. However, given the nature of existingmodels and the reliance on uncontrolled longer-term follow-up of anti-TNFs, and comparison withhistorical ‘controls’ (particularly in relation to BASFI progression over time and the assumptions being madeconcerning the potential disease modification properties of anti-TNFs in both AS and nr-AxSpA populations),it is surprising that greater efforts have not been made by the manufacturers to try to more formally link to theincreasing evidence base being generated in relation to radiographic progression in the AS population.
ASSESSMENT OF EXISTING COST-EFFECTIVENESS EVIDENCE
NIHR Journals Library www.journalslibrary.nihr.ac.uk
108
It is also surprising that more thought has also not been given to characterising the potential difference inBASFI progression across the separate populations and how generalisable assumptions may be betweenthese. The result is that many of the key assumptions concerning whether the anti-TNFs are primarilysymptom control treatments or whether they are also potential disease modifiers remains implicitly dealtwith within existing submissions. The result is that several manufacturers use identical assumptions acrosspopulations with respect to BASFI progression and the effect of the anti-TNFs. Interestingly, only onemanufacturer appears to use differential rates of BASFI progression across the populations (AbbVie),although the same structural assumption concerning the effect of anti-TNFs is still made. Interestingly,this manufacturer applies a higher rate of change in BASFI for patients receiving CC in the nr-AxSpApopulation vis-à-vis the AS population. However, while such a difference is interesting, the basis of andimplication for this differential is not fully explained or justified by the manufacturer.
The issue of intermittent and sequential use of anti-TNFs remain important clinical questions but theexisting models do not provide a robust basis for informing these decisions. The cost-effectiveness ofintermittent therapy versus continuous therapy was not formally considered in any model identified.However, it could be argued that such a comparison might be deemed outside the scope of a NICEappraisal. Although one manufacturer (Pfizer36) explored the potential cost-effectiveness of sequentialtherapy, much of this has been done via assumptions (e.g. assuming equal efficacy second line in patientswho discontinue first line as a result of an AE) or via adjustments applied to first-line efficacy estimatesbased on ‘real-world’ evidence reported from large-scale registries (which typically show anti-TNFs to beclinically effective but with lower response rates than reported in naive patients). Consequently, existingattempts to model sequential therapy are largely based on applying adjustments to first-line efficacy datausing observational evidence which are clearly subject to potential confounding. In large part, thelimitations of existing cost-effectiveness models for informing these clinical questions appears less afunction of the models themselves but rather that robust clinical data to date has not been generated toinform unbiased estimates of relative efficacy of alternative strategies for using the anti-TNFs.
The following sections report the development of a de novo model to address some of the key issues anduncertainties which have been identified in this review. Chapter 5 reports the results of an extendedsynthesis which has been developed to provide a more generalisable framework for synthesising clinicalefficacy data ensuring that appropriate estimates are generated for the model which make use of allrelevant and available evidence. This is followed in Chapter 6 by a description of the de novo model (Yorkmodel) which attempts to link this framework to a more coherent conceptual model of the chronic andprogressive nature of AS and nr-AxSpA.
DOI: 10.3310/hta20090 HEALTH TECHNOLOGY ASSESSMENT 2016 VOL. 20 NO. 9
© Queen’s Printer and Controller of HMSO 2016. This work was produced by Corbett et al. under the terms of a commissioning contract issued by the Secretary of State forHealth. This issue may be freely reproduced for the purposes of private research and study and extracts (or indeed, the full report) may be included in professional journalsprovided that suitable acknowledgement is made and the reproduction is not associated with any form of advertising. Applications for commercial reproduction should beaddressed to: NIHR Journals Library, National Institute for Health Research, Evaluation, Trials and Studies Coordinating Centre, Alpha House, University of Southampton SciencePark, Southampton SO16 7NS, UK.
109

Chapter 5 Independent economic assessment:extended synthesis
Existing evidence on the short-term clinical effectiveness of anti-TNF drugs has been presented anddiscussed in Chapter 3. The methods of evidence synthesis are extended in this section to more directly
address the decision problem and the parameter inputs required for the economic model. There were twospecific aims to these analyses. Firstly, we aimed to more formally explore the differences betweenindividual anti-TNF treatments to inform the most appropriate assumption for the economic model (i.e.equivalence or drug-specific differences). Within Chapter 3 of this report, the assumption of independenttreatment effects was evaluated alongside the assumption of a common (equal) treatment effect acrossanti-TNFs, for every outcome of interest. While there is no evidence that supports differences in theeffectiveness of these drugs, assuming equal effectiveness means that the trials are pooled as if the samedrug had been trialled; this leads to an arguably overly precise estimate of effect for the class of drugs.For this reason, we explore an additional scenario in which treatments are assumed to have a similar,but not equal, effectiveness, that is there are differences between the effectiveness of treatments that wemay not be able to explain but that we should consider.
The second aim was to generate appropriate effect-size estimates and their associated uncertainty toinform the main input parameters of the economic model by synthesising together evidence on BASDAIand BASFI outcomes jointly. Initially, we considered the two related BASDAI outcomes relevant to thedecision model reported in the effectiveness evidence available: changes in BASDAI scores over a certainperiod of time and a probability of response to BASDAI 50 (that is, a 50% change in the BASDAI score inrelation to baseline). The BASDAI 50 is important, as patients are expected to discontinue anti-TNFs if, at12 weeks, they have not been able to achieve response to this criterion (according to NICE guidance).17,33
Changes in BASDAI scores observed at this same time point determine the magnitude of initial response totreatment and have often been used in economic modelling as the basis for extrapolating treatmenteffects. Given that these outcomes are both central to informing effect parameters in the decision model,a synthesis model that considers the relation between these two outcomes provides a more consistent andcoherent basis for informing these parameters.
We developed a synthesis model that pools evidence on the change in BASDAI score by considering boththose studies that report this measure directly and also those that report the proportion of patientsachieving a BASDAI 50 response. We expressed BASDAI 50 as a function of the absolute change inBASDAI and we use this relationship in the extended synthesis. We also aim to simultaneously synthesiseinformation on BASFI score, a measure that is used together with BASDAI score to determine thelong-term QALY and cost burden of the disease in the economic model. Treatments improving AS symptomsare expected to affect both disease activity and function, and thus we expect a reduction in both BASDAIand BASFI scores, this means that we expect the changes to these two measures to be correlated.Extending the synthesis modelling to consider BASFI scores not only allows all relevant evidence tocontribute to the synthesis but also ensures that all measures are synthesised together to reflect theexpected correlations between the two outcomes. Uncertainty is also more appropriately quantified thansynthesising each outcome separately.
In the decision model, prognosis, costs and QALYs are determined by absolute BASDAI and BASFI scores.Given that treatment continuation is determined by response to BASDAI 50 at 12 weeks, it is important forthe economic model to estimate the absolute change in BASDAI and BASFI separately for responders andnon-responders, that is the conditional scores. However, the published clinical effectiveness evidence doesnot report the conditional scores. Consequently, we requested the conditional data from the pivotal trialsin both the AS and nr-AxSpA indications from each manufacturer. These data were subsequently providedby the manufacturers for their four pivotal trials. However, this information was not available for the othertrials in the evidence-base (there were 15 trials in the evidence base and conditional scores were only
DOI: 10.3310/hta20090 HEALTH TECHNOLOGY ASSESSMENT 2016 VOL. 20 NO. 9
© Queen’s Printer and Controller of HMSO 2016. This work was produced by Corbett et al. under the terms of a commissioning contract issued by the Secretary of State forHealth. This issue may be freely reproduced for the purposes of private research and study and extracts (or indeed, the full report) may be included in professional journalsprovided that suitable acknowledgement is made and the reproduction is not associated with any form of advertising. Applications for commercial reproduction should beaddressed to: NIHR Journals Library, National Institute for Health Research, Evaluation, Trials and Studies Coordinating Centre, Alpha House, University of Southampton SciencePark, Southampton SO16 7NS, UK.
111
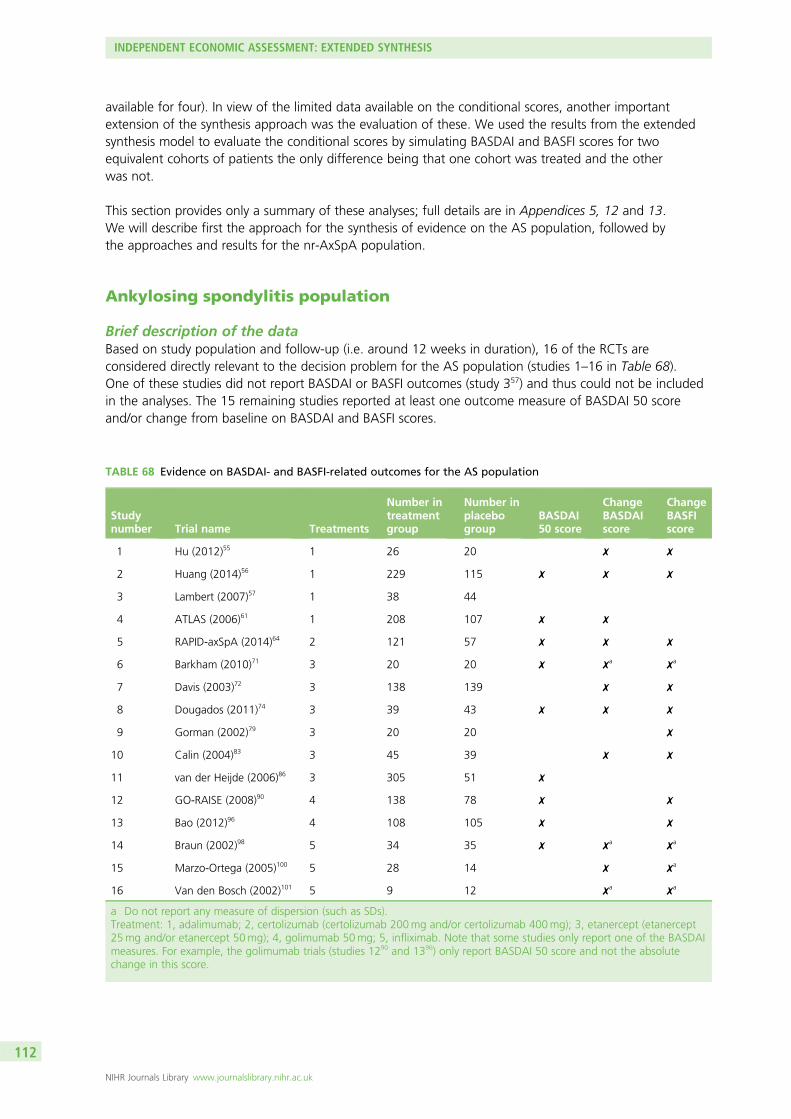
available for four). In view of the limited data available on the conditional scores, another importantextension of the synthesis approach was the evaluation of these. We used the results from the extendedsynthesis model to evaluate the conditional scores by simulating BASDAI and BASFI scores for twoequivalent cohorts of patients the only difference being that one cohort was treated and the otherwas not.
This section provides only a summary of these analyses; full details are in Appendices 5, 12 and 13.We will describe first the approach for the synthesis of evidence on the AS population, followed bythe approaches and results for the nr-AxSpA population.
Ankylosing spondylitis population
Brief description of the dataBased on study population and follow-up (i.e. around 12 weeks in duration), 16 of the RCTs areconsidered directly relevant to the decision problem for the AS population (studies 1–16 in Table 68).One of these studies did not report BASDAI or BASFI outcomes (study 357) and thus could not be includedin the analyses. The 15 remaining studies reported at least one outcome measure of BASDAI 50 scoreand/or change from baseline on BASDAI and BASFI scores.
TABLE 68 Evidence on BASDAI- and BASFI-related outcomes for the AS population
Studynumber Trial name Treatments
Number intreatmentgroup
Number inplacebogroup
BASDAI50 score
ChangeBASDAIscore
ChangeBASFIscore
1 Hu (2012)55 1 26 20 ✗ ✗
2 Huang (2014)56 1 229 115 ✗ ✗ ✗
3 Lambert (2007)57 1 38 44
4 ATLAS (2006)61 1 208 107 ✗ ✗
5 RAPID-axSpA (2014)64 2 121 57 ✗ ✗ ✗
6 Barkham (2010)71 3 20 20 ✗ ✗a ✗a
7 Davis (2003)72 3 138 139 ✗ ✗
8 Dougados (2011)74 3 39 43 ✗ ✗ ✗
9 Gorman (2002)79 3 20 20 ✗
10 Calin (2004)83 3 45 39 ✗ ✗
11 van der Heijde (2006)86 3 305 51 ✗
12 GO-RAISE (2008)90 4 138 78 ✗ ✗
13 Bao (2012)96 4 108 105 ✗ ✗
14 Braun (2002)98 5 34 35 ✗ ✗a ✗a
15 Marzo-Ortega (2005)100 5 28 14 ✗ ✗a
16 Van den Bosch (2002)101 5 9 12 ✗a ✗a
a Do not report any measure of dispersion (such as SDs).Treatment: 1, adalimumab; 2, certolizumab (certolizumab 200mg and/or certolizumab 400mg); 3, etanercept (etanercept25mg and/or etanercept 50mg); 4, golimumab 50mg; 5, infliximab. Note that some studies only report one of the BASDAImeasures. For example, the golimumab trials (studies 1290 and 1396) only report BASDAI 50 score and not the absolutechange in this score.
INDEPENDENT ECONOMIC ASSESSMENT: EXTENDED SYNTHESIS
NIHR Journals Library www.journalslibrary.nihr.ac.uk
112
General aspects of implementation and softwareThe synthesis was conducted from a Bayesian perspective, using WinBUGS [a Markov chain Monte Carlo(MCMC) simulation-based software for Bayesian inference]. For burn-in, we ran 100,000 simulations andanother 100,000 were used in inferences. Convergence was assessed by running two chains andconvergence was assumed if the Gelman–Rubin statistic was equal to 1. Goodness of fit was assessedusing the DIC, a criterion developed by Spiegelhalter et al.170 based on the trade-off between the fit of thedata to the model and the complexity of the model. Fit is measured using the deviance, and complexity isincluded using a measure of the ‘effective number of parameters’ (i.e. posterior mean deviance minusdeviance evaluated at the posterior mean of the parameters). Models with smaller DIC are bettersupported by the data: that is, the lower the DIC, the better the data fit the model. In the presence ofautocorrelation, the MCMC simulation for inference was increased to 200,000 and a thin of 20 wasapplied (yielding a sample for inference of 10,000 for each chain).
The main synthesis models (approaches B and C described next) pooled differences between treatmentand control in change in scores from baseline (BASDAI and BASFI). The treatment associated with thelowest (most negative) mean change score is expected to be best. However, it is important to quantify theuncertainty around the estimates and for this reason SDs were reported alongside expected values.When averaged ORs were presented median values instead of means were used, as ORs tend to follow askewed distribution.
Relative effectiveness estimates for models assuming exchangeability across treatments are based on thepredictive distribution, representing the distribution of the data averaged over all possible parametervalues. This summary statistic best reflects the impact of uncertainty in the parameters of the model and ishere judged as a more appropriate basis to be used in the decision model.171
When possible, meta-regression analyses were conducted to evaluate potential treatment effect modifiers.Meta-regression is a tool aimed at examining the impact of variables on effect size using regression-basedtechniques. In these explorations, the following baseline characteristics were considered: BASDAI score,BASFI score, age, sex, duration of symptoms (years) and CRP level.
Exploring assumptions for the relative effectiveness of individual anti-tumournecrosis factor treatments (modelling approach A)In AS, pivotal trials for the licensed anti-TNFs do not perform head-to-head comparisons with other agentsbut instead compare the effect of treatments against standard care. These trials show anti-TNFs to beeffective in relation to standard care. In view of the available evidence, previous NICE guidance (TA14317
and TA23333) concluded that there was no compelling evidence on which it could reliably distinguishbetween the anti-TNFs on the basis of clinical effectiveness when making recommendations.
Our analysis, based on the most up-to-date evidence base, aimed to evaluate anti-TNF drugs using indirectcomparisons across trials. Within this subsection, alternative assumptions of equivalence in theeffectiveness of anti-TNF treatments will be more formally assessed. Note that at this stage each outcomewas synthesised independently.
Brief description of synthesis methodsIn brief, the synthesis model directly aggregates relative treatment effects, that is log OR for BASDAI 50response and the difference between treatment and placebo in change in BASDAI from baseline (the dataset analysed is shown in Appendix 12). In common with the approach implemented in Chapter 3, alloutcomes are here assumed normally distributed. We implemented alternative models that differ in theway treatment effects are considered; a summary of each is presented below.
Model A1 (treatments: independent; studies: fixed effect): This model considers treatments to beindependent: that is, it assumes the effects to differ between treatments. This is a fixed-effect model inthat multiple studies evaluating the same treatment are considered to measure the same treatment effect.
DOI: 10.3310/hta20090 HEALTH TECHNOLOGY ASSESSMENT 2016 VOL. 20 NO. 9
© Queen’s Printer and Controller of HMSO 2016. This work was produced by Corbett et al. under the terms of a commissioning contract issued by the Secretary of State forHealth. This issue may be freely reproduced for the purposes of private research and study and extracts (or indeed, the full report) may be included in professional journalsprovided that suitable acknowledgement is made and the reproduction is not associated with any form of advertising. Applications for commercial reproduction should beaddressed to: NIHR Journals Library, National Institute for Health Research, Evaluation, Trials and Studies Coordinating Centre, Alpha House, University of Southampton SciencePark, Southampton SO16 7NS, UK.
113
Model A2 (treatments: independent; studies: random effects): This model differs from model A1 in that arandom effect is assumed to describe the findings of multiple studies evaluating the same treatment.
Model A3 (treatments: equal; studies: fixed effect): This model differs from model A1 in that treatmentsare not assumed to differ. The model thus evaluates a common relative effectiveness for all anti-TNFs.
Model A4 (treatments: equal; studies: random effects): This model differs from model A3 in that a randomeffect is assumed to describe the findings of multiple studies evaluating the same treatment.
Model A5 (treatments: exchangeable; studies: fixed effect): This model differs from model A1 in that arandom effect is used to describe any differences between treatments (exchangeability is assumed). Thismodel thus assumes the treatments to have a similar, but not equal, effectiveness: there are differencesbetween the effectiveness of treatments that we may not be able to explain but that we should consider.
There is some evidence that health outcomes may depend on patients’ characteristics such as age, BASFIscore, enthesitis, therapy, CRP level and HLA-B27 genotype.172 There is, however, no evidence on whichfactors may modify the effects of treatment with anti-TNFs (note that Lord et al. 2010173 studied predictorsof BASDAI 50 response in patients receiving anti-TNFs, but by not including a placebo arm this study wasnot able to evaluate treatment effect modifiers). To our knowledge, previous meta-analyses of studies inAS have not explored how the effect of treatment may depend on characteristics of the patients or of theirdisease. Within this modelling approach we explored potential heterogeneity in treatment effects usingmeta-regression (i.e. potential treatment effect modifiers). We did so by extending the modelling approachin A1 to include treatment effect interactions with baseline characteristics (centred on their means whererelevant). We have explored the inclusion of alternative covariates by evaluating the DIC associated withalternative models.
Results of modelling approach AAll models implemented synthesise results on each of the outcomes separately. The results of eachmodelling approach are shown in Table 69.
Models A1 and A2 consider that anti-TNF have distinct relative effects. Applying the assumptions of modelA1, adalimumab is expected to be the least effective of the set of treatments analysed in terms of BASDAI50 (the expected OR is 4.71), but in terms of the differences in change scores it is certolizumab that isexpected to be the least effective, with differences of –1.45 and –1.10 in BASDAI and BASFI scores,respectively. It should be noted that studies on golimumab (studies 1290 and 1396 in Table 68) do notreport absolute changes in BASDAI scores, and thus using this modelling approach we were unable toestimate a treatment effect for this outcome measure. Model A2 reports similar results to model A1, butthe SE of the estimates is slightly higher, reflecting increased uncertainty because of the use of the randomeffects to characterise between study results. The DIC is lower in model A1 (52 vs. 57), indicating thatmodel A1 is preferable to model A2.
Outcome 1 is OR for BASDAI 50; outcome 2 is the difference between treatment and placebo on changein BASDAI from baseline; and outcome 3 is the difference between treatment and placebo on change inBASFI from baseline.
Models A3 and A4 consider the treatments as equal in terms of their effectiveness in each of the threeoutcomes. This means drugs are assumed equally effective and results from trials are pooled together as ifthese trials evaluated the same drug, which will return more precise estimates (i.e. less uncertainty) andinterpretations of this evidence may thus be overly confident. The DIC of these models is substantiallylower than that of models A1 and A2, indicating that the data supports the assumption of equivalence,rather than one of independence. As with models A1 and A2, the random-effect assumption was also notdeemed worthwhile.
INDEPENDENT ECONOMIC ASSESSMENT: EXTENDED SYNTHESIS
NIHR Journals Library www.journalslibrary.nihr.ac.uk
114
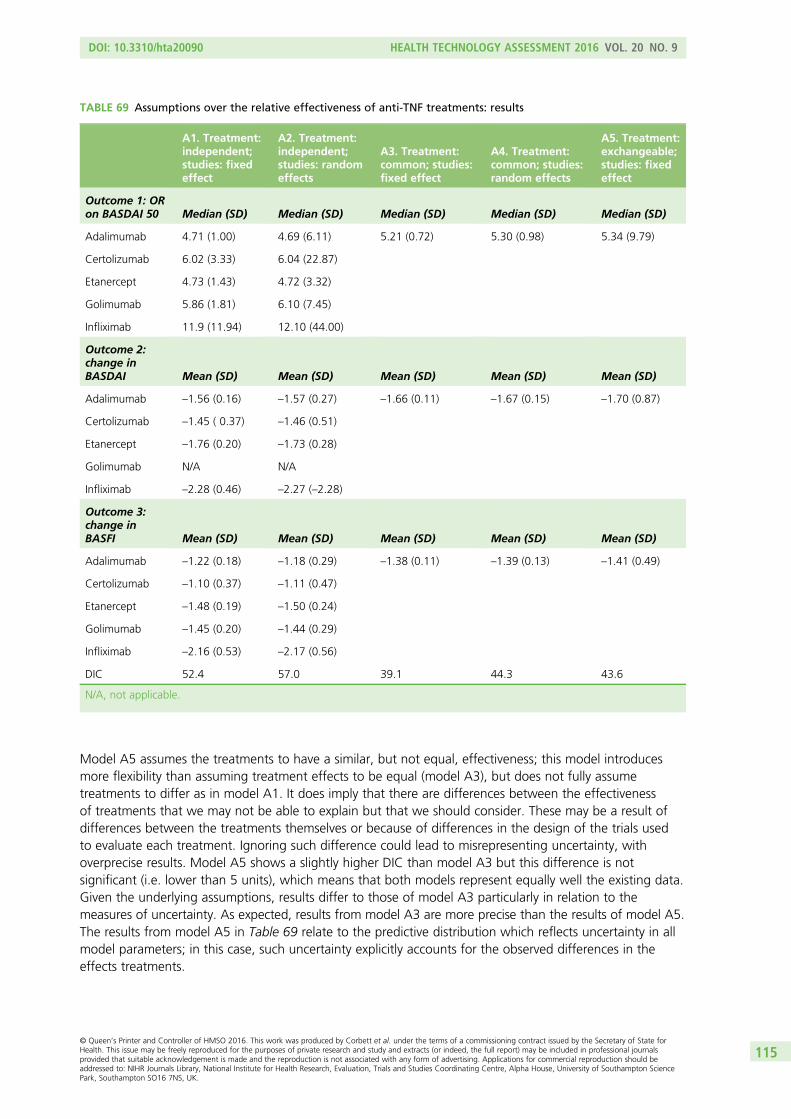
Model A5 assumes the treatments to have a similar, but not equal, effectiveness; this model introducesmore flexibility than assuming treatment effects to be equal (model A3), but does not fully assumetreatments to differ as in model A1. It does imply that there are differences between the effectivenessof treatments that we may not be able to explain but that we should consider. These may be a result ofdifferences between the treatments themselves or because of differences in the design of the trials usedto evaluate each treatment. Ignoring such difference could lead to misrepresenting uncertainty, withoverprecise results. Model A5 shows a slightly higher DIC than model A3 but this difference is notsignificant (i.e. lower than 5 units), which means that both models represent equally well the existing data.Given the underlying assumptions, results differ to those of model A3 particularly in relation to themeasures of uncertainty. As expected, results from model A3 are more precise than the results of model A5.The results from model A5 in Table 69 relate to the predictive distribution which reflects uncertainty in allmodel parameters; in this case, such uncertainty explicitly accounts for the observed differences in theeffects treatments.
TABLE 69 Assumptions over the relative effectiveness of anti-TNF treatments: results
A1. Treatment:independent;studies: fixedeffect
A2. Treatment:independent;studies: randomeffects
A3. Treatment:common; studies:fixed effect
A4. Treatment:common; studies:random effects
A5. Treatment:exchangeable;studies: fixedeffect
Outcome 1: ORon BASDAI 50 Median (SD) Median (SD) Median (SD) Median (SD) Median (SD)
Adalimumab 4.71 (1.00) 4.69 (6.11) 5.21 (0.72) 5.30 (0.98) 5.34 (9.79)
Certolizumab 6.02 (3.33) 6.04 (22.87)
Etanercept 4.73 (1.43) 4.72 (3.32)
Golimumab 5.86 (1.81) 6.10 (7.45)
Infliximab 11.9 (11.94) 12.10 (44.00)
Outcome 2:change inBASDAI Mean (SD) Mean (SD) Mean (SD) Mean (SD) Mean (SD)
Adalimumab –1.56 (0.16) –1.57 (0.27) –1.66 (0.11) –1.67 (0.15) –1.70 (0.87)
Certolizumab –1.45 ( 0.37) –1.46 (0.51)
Etanercept –1.76 (0.20) –1.73 (0.28)
Golimumab N/A N/A
Infliximab –2.28 (0.46) –2.27 (–2.28)
Outcome 3:change inBASFI Mean (SD) Mean (SD) Mean (SD) Mean (SD) Mean (SD)
Adalimumab –1.22 (0.18) –1.18 (0.29) –1.38 (0.11) –1.39 (0.13) –1.41 (0.49)
Certolizumab –1.10 (0.37) –1.11 (0.47)
Etanercept –1.48 (0.19) –1.50 (0.24)
Golimumab –1.45 (0.20) –1.44 (0.29)
Infliximab –2.16 (0.53) –2.17 (0.56)
DIC 52.4 57.0 39.1 44.3 43.6
N/A, not applicable.
DOI: 10.3310/hta20090 HEALTH TECHNOLOGY ASSESSMENT 2016 VOL. 20 NO. 9
© Queen’s Printer and Controller of HMSO 2016. This work was produced by Corbett et al. under the terms of a commissioning contract issued by the Secretary of State forHealth. This issue may be freely reproduced for the purposes of private research and study and extracts (or indeed, the full report) may be included in professional journalsprovided that suitable acknowledgement is made and the reproduction is not associated with any form of advertising. Applications for commercial reproduction should beaddressed to: NIHR Journals Library, National Institute for Health Research, Evaluation, Trials and Studies Coordinating Centre, Alpha House, University of Southampton SciencePark, Southampton SO16 7NS, UK.
115
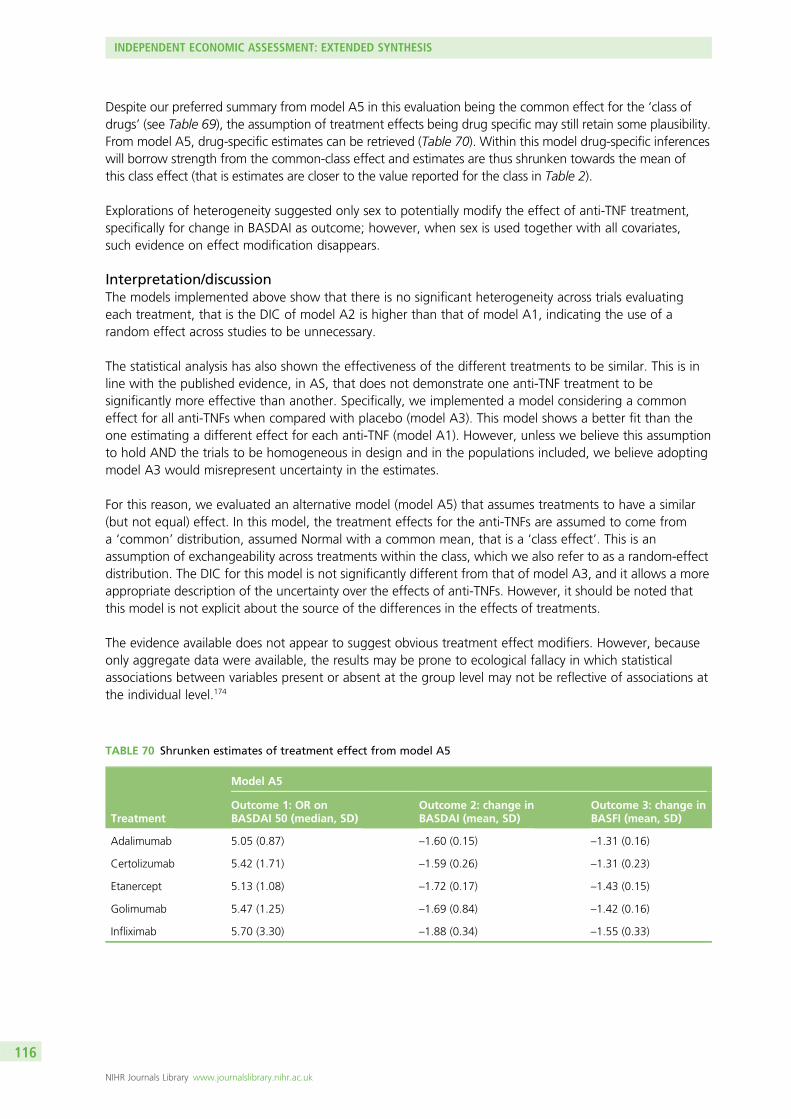
Despite our preferred summary from model A5 in this evaluation being the common effect for the ‘class ofdrugs’ (see Table 69), the assumption of treatment effects being drug specific may still retain some plausibility.From model A5, drug-specific estimates can be retrieved (Table 70). Within this model drug-specific inferenceswill borrow strength from the common-class effect and estimates are thus shrunken towards the mean ofthis class effect (that is estimates are closer to the value reported for the class in Table 2).
Explorations of heterogeneity suggested only sex to potentially modify the effect of anti-TNF treatment,specifically for change in BASDAI as outcome; however, when sex is used together with all covariates,such evidence on effect modification disappears.
Interpretation/discussionThe models implemented above show that there is no significant heterogeneity across trials evaluatingeach treatment, that is the DIC of model A2 is higher than that of model A1, indicating the use of arandom effect across studies to be unnecessary.
The statistical analysis has also shown the effectiveness of the different treatments to be similar. This is inline with the published evidence, in AS, that does not demonstrate one anti-TNF treatment to besignificantly more effective than another. Specifically, we implemented a model considering a commoneffect for all anti-TNFs when compared with placebo (model A3). This model shows a better fit than theone estimating a different effect for each anti-TNF (model A1). However, unless we believe this assumptionto hold AND the trials to be homogeneous in design and in the populations included, we believe adoptingmodel A3 would misrepresent uncertainty in the estimates.
For this reason, we evaluated an alternative model (model A5) that assumes treatments to have a similar(but not equal) effect. In this model, the treatment effects for the anti-TNFs are assumed to come froma ‘common’ distribution, assumed Normal with a common mean, that is a ‘class effect’. This is anassumption of exchangeability across treatments within the class, which we also refer to as a random-effectdistribution. The DIC for this model is not significantly different from that of model A3, and it allows a moreappropriate description of the uncertainty over the effects of anti-TNFs. However, it should be noted thatthis model is not explicit about the source of the differences in the effects of treatments.
The evidence available does not appear to suggest obvious treatment effect modifiers. However, becauseonly aggregate data were available, the results may be prone to ecological fallacy in which statisticalassociations between variables present or absent at the group level may not be reflective of associations atthe individual level.174
TABLE 70 Shrunken estimates of treatment effect from model A5
Treatment
Model A5
Outcome 1: OR onBASDAI 50 (median, SD)
Outcome 2: change inBASDAI (mean, SD)
Outcome 3: change inBASFI (mean, SD)
Adalimumab 5.05 (0.87) –1.60 (0.15) –1.31 (0.16)
Certolizumab 5.42 (1.71) –1.59 (0.26) –1.31 (0.23)
Etanercept 5.13 (1.08) –1.72 (0.17) –1.43 (0.15)
Golimumab 5.47 (1.25) –1.69 (0.84) –1.42 (0.16)
Infliximab 5.70 (3.30) –1.88 (0.34) –1.55 (0.33)
INDEPENDENT ECONOMIC ASSESSMENT: EXTENDED SYNTHESIS
NIHR Journals Library www.journalslibrary.nihr.ac.uk
116
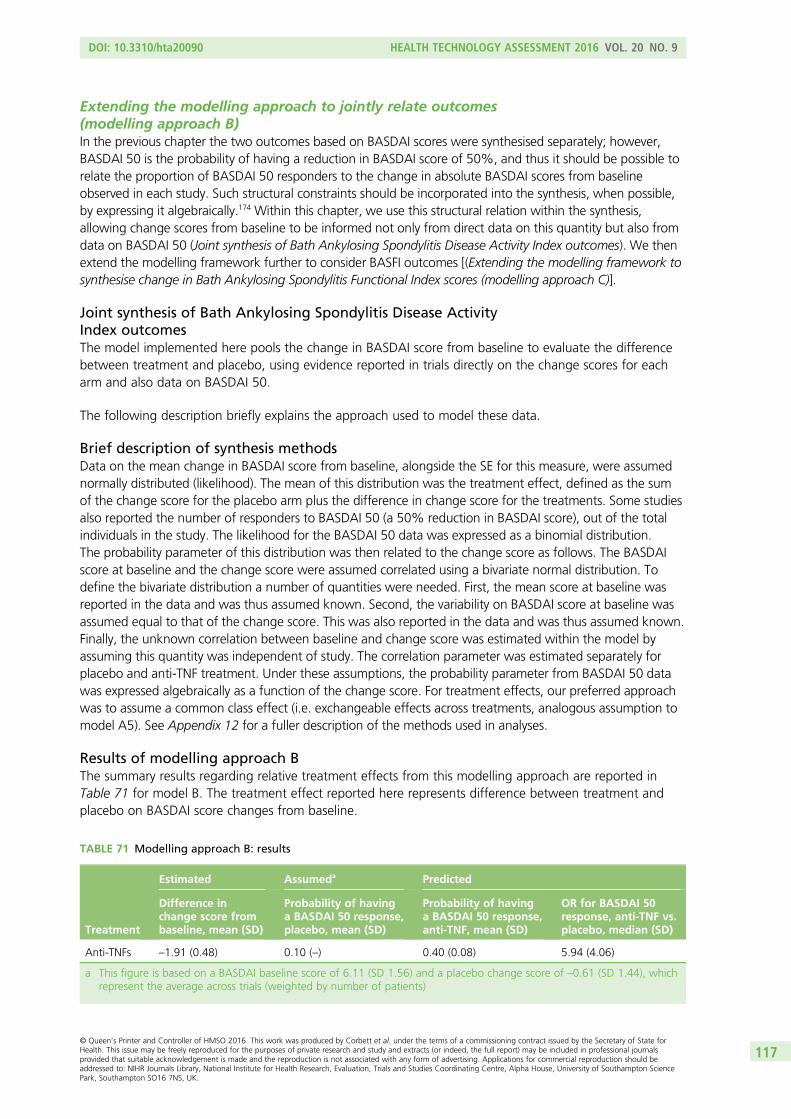
Extending the modelling approach to jointly relate outcomes(modelling approach B)In the previous chapter the two outcomes based on BASDAI scores were synthesised separately; however,BASDAI 50 is the probability of having a reduction in BASDAI score of 50%, and thus it should be possible torelate the proportion of BASDAI 50 responders to the change in absolute BASDAI scores from baselineobserved in each study. Such structural constraints should be incorporated into the synthesis, when possible,by expressing it algebraically.174 Within this chapter, we use this structural relation within the synthesis,allowing change scores from baseline to be informed not only from direct data on this quantity but also fromdata on BASDAI 50 (Joint synthesis of Bath Ankylosing Spondylitis Disease Activity Index outcomes). We thenextend the modelling framework further to consider BASFI outcomes [(Extending the modelling framework tosynthesise change in Bath Ankylosing Spondylitis Functional Index scores (modelling approach C)].
Joint synthesis of Bath Ankylosing Spondylitis Disease ActivityIndex outcomesThe model implemented here pools the change in BASDAI score from baseline to evaluate the differencebetween treatment and placebo, using evidence reported in trials directly on the change scores for eacharm and also data on BASDAI 50.
The following description briefly explains the approach used to model these data.
Brief description of synthesis methodsData on the mean change in BASDAI score from baseline, alongside the SE for this measure, were assumednormally distributed (likelihood). The mean of this distribution was the treatment effect, defined as the sumof the change score for the placebo arm plus the difference in change score for the treatments. Some studiesalso reported the number of responders to BASDAI 50 (a 50% reduction in BASDAI score), out of the totalindividuals in the study. The likelihood for the BASDAI 50 data was expressed as a binomial distribution.The probability parameter of this distribution was then related to the change score as follows. The BASDAIscore at baseline and the change score were assumed correlated using a bivariate normal distribution. Todefine the bivariate distribution a number of quantities were needed. First, the mean score at baseline wasreported in the data and was thus assumed known. Second, the variability on BASDAI score at baseline wasassumed equal to that of the change score. This was also reported in the data and was thus assumed known.Finally, the unknown correlation between baseline and change score was estimated within the model byassuming this quantity was independent of study. The correlation parameter was estimated separately forplacebo and anti-TNF treatment. Under these assumptions, the probability parameter from BASDAI 50 datawas expressed algebraically as a function of the change score. For treatment effects, our preferred approachwas to assume a common class effect (i.e. exchangeable effects across treatments, analogous assumption tomodel A5). See Appendix 12 for a fuller description of the methods used in analyses.
Results of modelling approach BThe summary results regarding relative treatment effects from this modelling approach are reported inTable 71 for model B. The treatment effect reported here represents difference between treatment andplacebo on BASDAI score changes from baseline.
TABLE 71 Modelling approach B: results
Treatment
Estimated Assumeda Predicted
Difference inchange score frombaseline, mean (SD)
Probability of havinga BASDAI 50 response,placebo, mean (SD)
Probability of havinga BASDAI 50 response,anti-TNF, mean (SD)
OR for BASDAI 50response, anti-TNF vs.placebo, median (SD)
Anti-TNFs –1.91 (0.48) 0.10 (–) 0.40 (0.08) 5.94 (4.06)
a This figure is based on a BASDAI baseline score of 6.11 (SD 1.56) and a placebo change score of –0.61 (SD 1.44), whichrepresent the average across trials (weighted by number of patients)
DOI: 10.3310/hta20090 HEALTH TECHNOLOGY ASSESSMENT 2016 VOL. 20 NO. 9
© Queen’s Printer and Controller of HMSO 2016. This work was produced by Corbett et al. under the terms of a commissioning contract issued by the Secretary of State forHealth. This issue may be freely reproduced for the purposes of private research and study and extracts (or indeed, the full report) may be included in professional journalsprovided that suitable acknowledgement is made and the reproduction is not associated with any form of advertising. Applications for commercial reproduction should beaddressed to: NIHR Journals Library, National Institute for Health Research, Evaluation, Trials and Studies Coordinating Centre, Alpha House, University of Southampton SciencePark, Southampton SO16 7NS, UK.
117
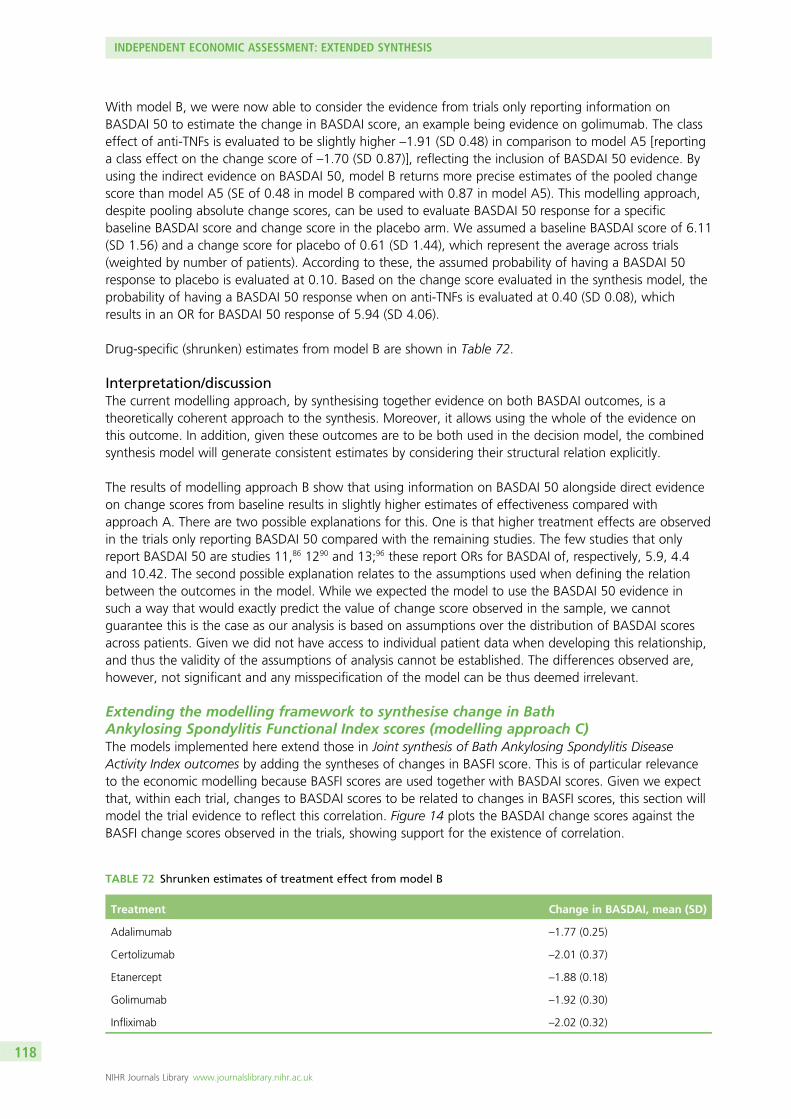
With model B, we were now able to consider the evidence from trials only reporting information onBASDAI 50 to estimate the change in BASDAI score, an example being evidence on golimumab. The classeffect of anti-TNFs is evaluated to be slightly higher –1.91 (SD 0.48) in comparison to model A5 [reportinga class effect on the change score of –1.70 (SD 0.87)], reflecting the inclusion of BASDAI 50 evidence. Byusing the indirect evidence on BASDAI 50, model B returns more precise estimates of the pooled changescore than model A5 (SE of 0.48 in model B compared with 0.87 in model A5). This modelling approach,despite pooling absolute change scores, can be used to evaluate BASDAI 50 response for a specificbaseline BASDAI score and change score in the placebo arm. We assumed a baseline BASDAI score of 6.11(SD 1.56) and a change score for placebo of 0.61 (SD 1.44), which represent the average across trials(weighted by number of patients). According to these, the assumed probability of having a BASDAI 50response to placebo is evaluated at 0.10. Based on the change score evaluated in the synthesis model, theprobability of having a BASDAI 50 response when on anti-TNFs is evaluated at 0.40 (SD 0.08), whichresults in an OR for BASDAI 50 response of 5.94 (SD 4.06).
Drug-specific (shrunken) estimates from model B are shown in Table 72.
Interpretation/discussionThe current modelling approach, by synthesising together evidence on both BASDAI outcomes, is atheoretically coherent approach to the synthesis. Moreover, it allows using the whole of the evidence onthis outcome. In addition, given these outcomes are to be both used in the decision model, the combinedsynthesis model will generate consistent estimates by considering their structural relation explicitly.
The results of modelling approach B show that using information on BASDAI 50 alongside direct evidenceon change scores from baseline results in slightly higher estimates of effectiveness compared withapproach A. There are two possible explanations for this. One is that higher treatment effects are observedin the trials only reporting BASDAI 50 compared with the remaining studies. The few studies that onlyreport BASDAI 50 are studies 11,86 1290 and 13;96 these report ORs for BASDAI of, respectively, 5.9, 4.4and 10.42. The second possible explanation relates to the assumptions used when defining the relationbetween the outcomes in the model. While we expected the model to use the BASDAI 50 evidence insuch a way that would exactly predict the value of change score observed in the sample, we cannotguarantee this is the case as our analysis is based on assumptions over the distribution of BASDAI scoresacross patients. Given we did not have access to individual patient data when developing this relationship,and thus the validity of the assumptions of analysis cannot be established. The differences observed are,however, not significant and any misspecification of the model can be thus deemed irrelevant.
Extending the modelling framework to synthesise change in BathAnkylosing Spondylitis Functional Index scores (modelling approach C)The models implemented here extend those in Joint synthesis of Bath Ankylosing Spondylitis DiseaseActivity Index outcomes by adding the syntheses of changes in BASFI score. This is of particular relevanceto the economic modelling because BASFI scores are used together with BASDAI scores. Given we expectthat, within each trial, changes to BASDAI scores to be related to changes in BASFI scores, this section willmodel the trial evidence to reflect this correlation. Figure 14 plots the BASDAI change scores against theBASFI change scores observed in the trials, showing support for the existence of correlation.
TABLE 72 Shrunken estimates of treatment effect from model B
Treatment Change in BASDAI, mean (SD)
Adalimumab –1.77 (0.25)
Certolizumab –2.01 (0.37)
Etanercept –1.88 (0.18)
Golimumab –1.92 (0.30)
Infliximab –2.02 (0.32)
INDEPENDENT ECONOMIC ASSESSMENT: EXTENDED SYNTHESIS
NIHR Journals Library www.journalslibrary.nihr.ac.uk
118
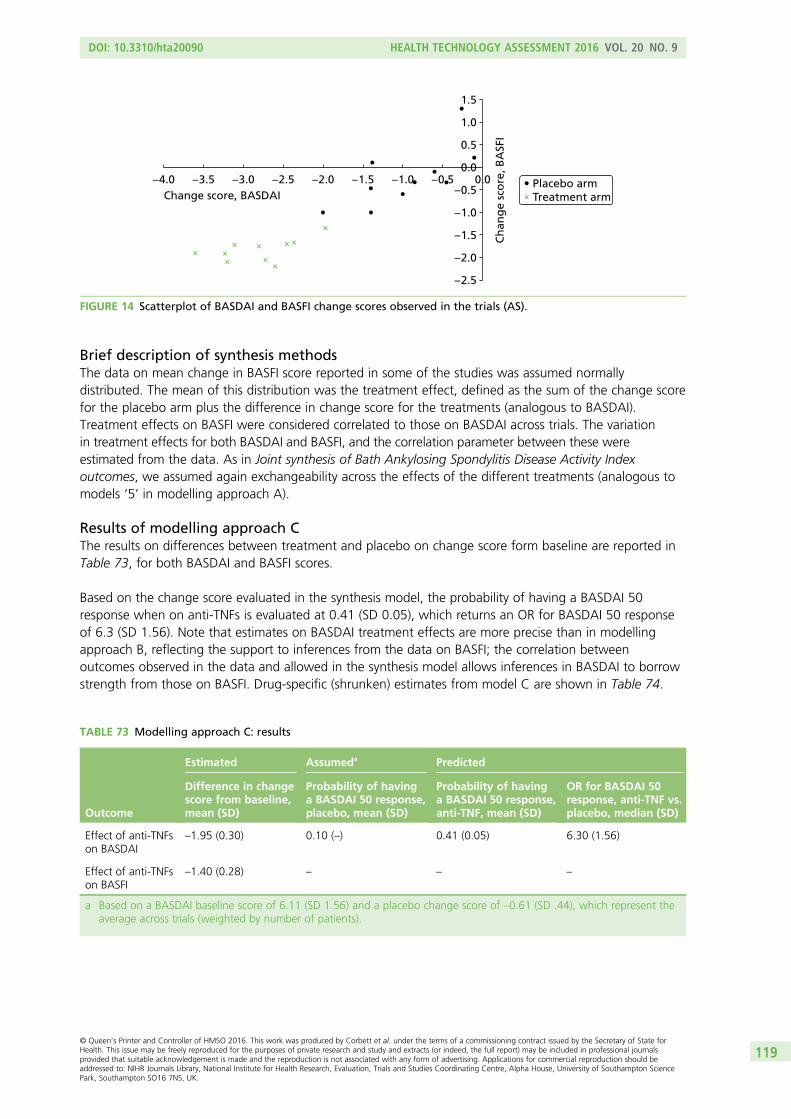
Brief description of synthesis methodsThe data on mean change in BASFI score reported in some of the studies was assumed normallydistributed. The mean of this distribution was the treatment effect, defined as the sum of the change scorefor the placebo arm plus the difference in change score for the treatments (analogous to BASDAI).Treatment effects on BASFI were considered correlated to those on BASDAI across trials. The variationin treatment effects for both BASDAI and BASFI, and the correlation parameter between these wereestimated from the data. As in Joint synthesis of Bath Ankylosing Spondylitis Disease Activity Indexoutcomes, we assumed again exchangeability across the effects of the different treatments (analogous tomodels ‘5’ in modelling approach A).
Results of modelling approach CThe results on differences between treatment and placebo on change score form baseline are reported inTable 73, for both BASDAI and BASFI scores.
Based on the change score evaluated in the synthesis model, the probability of having a BASDAI 50response when on anti-TNFs is evaluated at 0.41 (SD 0.05), which returns an OR for BASDAI 50 responseof 6.3 (SD 1.56). Note that estimates on BASDAI treatment effects are more precise than in modellingapproach B, reflecting the support to inferences from the data on BASFI; the correlation betweenoutcomes observed in the data and allowed in the synthesis model allows inferences in BASDAI to borrowstrength from those on BASFI. Drug-specific (shrunken) estimates from model C are shown in Table 74.
TABLE 73 Modelling approach C: results
Outcome
Estimated Assumeda Predicted
Difference in changescore from baseline,mean (SD)
Probability of havinga BASDAI 50 response,placebo, mean (SD)
Probability of havinga BASDAI 50 response,anti-TNF, mean (SD)
OR for BASDAI 50response, anti-TNF vs.placebo, median (SD)
Effect of anti-TNFson BASDAI
–1.95 (0.30) 0.10 (–) 0.41 (0.05) 6.30 (1.56)
Effect of anti-TNFson BASFI
–1.40 (0.28) – – –
a Based on a BASDAI baseline score of 6.11 (SD 1.56) and a placebo change score of –0.61 (SD .44), which represent theaverage across trials (weighted by number of patients).
1.5
1.0
0.5
0.0
– 0.5
– 1.0
– 1.5
– 2.0
– 2.5
– 4.0 – 3.5 – 3.0 – 2.5 – 2.0 – 1.5 – 1.0 – 0.5 0.0
Ch
ang
e sc
ore
, BA
SFI
Change score, BASDAIPlacebo armTreatment arm
FIGURE 14 Scatterplot of BASDAI and BASFI change scores observed in the trials (AS).
DOI: 10.3310/hta20090 HEALTH TECHNOLOGY ASSESSMENT 2016 VOL. 20 NO. 9
© Queen’s Printer and Controller of HMSO 2016. This work was produced by Corbett et al. under the terms of a commissioning contract issued by the Secretary of State forHealth. This issue may be freely reproduced for the purposes of private research and study and extracts (or indeed, the full report) may be included in professional journalsprovided that suitable acknowledgement is made and the reproduction is not associated with any form of advertising. Applications for commercial reproduction should beaddressed to: NIHR Journals Library, National Institute for Health Research, Evaluation, Trials and Studies Coordinating Centre, Alpha House, University of Southampton SciencePark, Southampton SO16 7NS, UK.
119
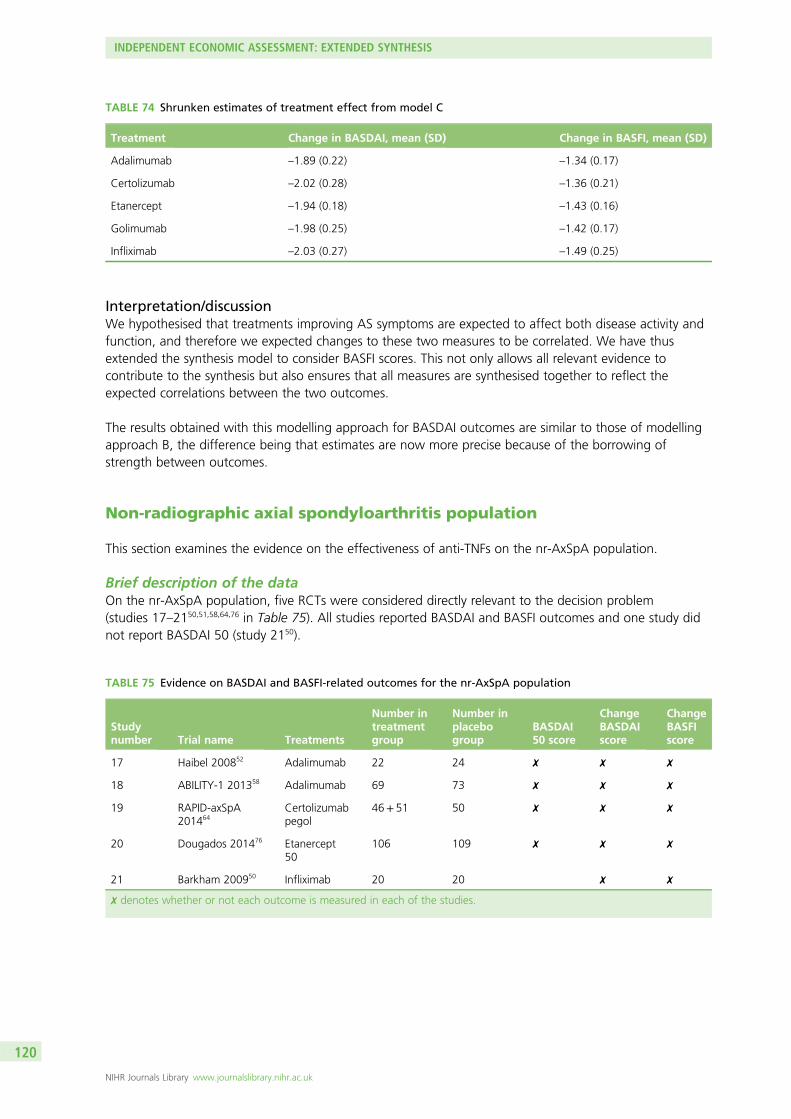
Interpretation/discussionWe hypothesised that treatments improving AS symptoms are expected to affect both disease activity andfunction, and therefore we expected changes to these two measures to be correlated. We have thusextended the synthesis model to consider BASFI scores. This not only allows all relevant evidence tocontribute to the synthesis but also ensures that all measures are synthesised together to reflect theexpected correlations between the two outcomes.
The results obtained with this modelling approach for BASDAI outcomes are similar to those of modellingapproach B, the difference being that estimates are now more precise because of the borrowing ofstrength between outcomes.
Non-radiographic axial spondyloarthritis population
This section examines the evidence on the effectiveness of anti-TNFs on the nr-AxSpA population.
Brief description of the dataOn the nr-AxSpA population, five RCTs were considered directly relevant to the decision problem(studies 17–2150,51,58,64,76 in Table 75). All studies reported BASDAI and BASFI outcomes and one study didnot report BASDAI 50 (study 2150).
TABLE 74 Shrunken estimates of treatment effect from model C
Treatment Change in BASDAI, mean (SD) Change in BASFI, mean (SD)
Adalimumab –1.89 (0.22) –1.34 (0.17)
Certolizumab –2.02 (0.28) –1.36 (0.21)
Etanercept –1.94 (0.18) –1.43 (0.16)
Golimumab –1.98 (0.25) –1.42 (0.17)
Infliximab –2.03 (0.27) –1.49 (0.25)
TABLE 75 Evidence on BASDAI and BASFI-related outcomes for the nr-AxSpA population
Studynumber Trial name Treatments
Number intreatmentgroup
Number inplacebogroup
BASDAI50 score
ChangeBASDAIscore
ChangeBASFIscore
17 Haibel 200852 Adalimumab 22 24 ✗ ✗ ✗
18 ABILITY-1 201358 Adalimumab 69 73 ✗ ✗ ✗
19 RAPID-axSpA201464
Certolizumabpegol
46+ 51 50 ✗ ✗ ✗
20 Dougados 201476 Etanercept50
106 109 ✗ ✗ ✗
21 Barkham 200950 Infliximab 20 20 ✗ ✗
✗ denotes whether or not each outcome is measured in each of the studies.
INDEPENDENT ECONOMIC ASSESSMENT: EXTENDED SYNTHESIS
NIHR Journals Library www.journalslibrary.nihr.ac.uk
120
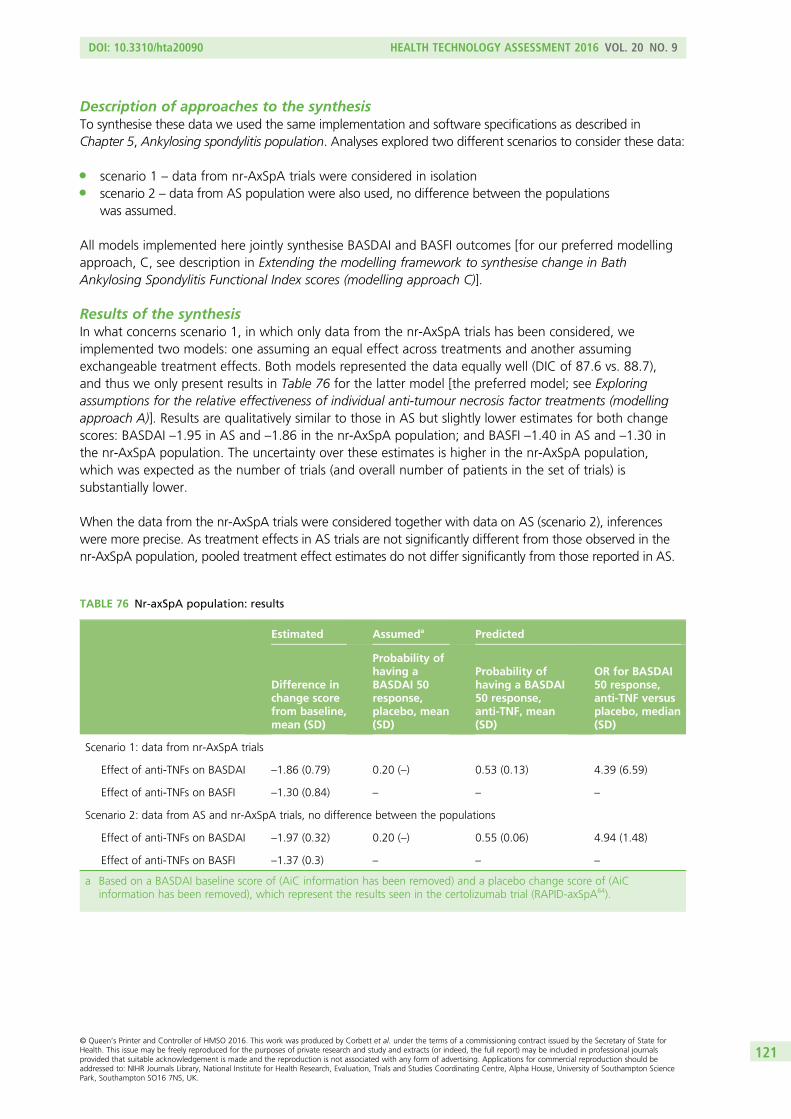
Description of approaches to the synthesisTo synthesise these data we used the same implementation and software specifications as described inChapter 5, Ankylosing spondylitis population. Analyses explored two different scenarios to consider these data:
l scenario 1 – data from nr-AxSpA trials were considered in isolationl scenario 2 – data from AS population were also used, no difference between the populations
was assumed.
All models implemented here jointly synthesise BASDAI and BASFI outcomes [for our preferred modellingapproach, C, see description in Extending the modelling framework to synthesise change in BathAnkylosing Spondylitis Functional Index scores (modelling approach C)].
Results of the synthesisIn what concerns scenario 1, in which only data from the nr-AxSpA trials has been considered, weimplemented two models: one assuming an equal effect across treatments and another assumingexchangeable treatment effects. Both models represented the data equally well (DIC of 87.6 vs. 88.7),and thus we only present results in Table 76 for the latter model [the preferred model; see Exploringassumptions for the relative effectiveness of individual anti-tumour necrosis factor treatments (modellingapproach A)]. Results are qualitatively similar to those in AS but slightly lower estimates for both changescores: BASDAI –1.95 in AS and –1.86 in the nr-AxSpA population; and BASFI –1.40 in AS and –1.30 inthe nr-AxSpA population. The uncertainty over these estimates is higher in the nr-AxSpA population,which was expected as the number of trials (and overall number of patients in the set of trials) issubstantially lower.
When the data from the nr-AxSpA trials were considered together with data on AS (scenario 2), inferenceswere more precise. As treatment effects in AS trials are not significantly different from those observed in thenr-AxSpA population, pooled treatment effect estimates do not differ significantly from those reported in AS.
TABLE 76 Nr-axSpA population: results
Estimated Assumeda Predicted
Difference inchange scorefrom baseline,mean (SD)
Probability ofhaving aBASDAI 50response,placebo, mean(SD)
Probability ofhaving a BASDAI50 response,anti-TNF, mean(SD)
OR for BASDAI50 response,anti-TNF versusplacebo, median(SD)
Scenario 1: data from nr-AxSpA trials
Effect of anti-TNFs on BASDAI –1.86 (0.79) 0.20 (–) 0.53 (0.13) 4.39 (6.59)
Effect of anti-TNFs on BASFI –1.30 (0.84) – – –
Scenario 2: data from AS and nr-AxSpA trials, no difference between the populations
Effect of anti-TNFs on BASDAI –1.97 (0.32) 0.20 (–) 0.55 (0.06) 4.94 (1.48)
Effect of anti-TNFs on BASFI –1.37 (0.3) – – –
a Based on a BASDAI baseline score of (AiC information has been removed) and a placebo change score of (AiCinformation has been removed), which represent the results seen in the certolizumab trial (RAPID-axSpA64).
DOI: 10.3310/hta20090 HEALTH TECHNOLOGY ASSESSMENT 2016 VOL. 20 NO. 9
© Queen’s Printer and Controller of HMSO 2016. This work was produced by Corbett et al. under the terms of a commissioning contract issued by the Secretary of State forHealth. This issue may be freely reproduced for the purposes of private research and study and extracts (or indeed, the full report) may be included in professional journalsprovided that suitable acknowledgement is made and the reproduction is not associated with any form of advertising. Applications for commercial reproduction should beaddressed to: NIHR Journals Library, National Institute for Health Research, Evaluation, Trials and Studies Coordinating Centre, Alpha House, University of Southampton SciencePark, Southampton SO16 7NS, UK.
121
Interpretation/discussionThe evidence base of the effect of anti-TNFs in the nr-AxSpA population consists of five trials that observedfour treatments and CC in a total of 590 patients. The effect measures pooled across the five trials werenot significantly different from the outcomes expected in the AS population. Thus, it may be reasonable toconsider the evidence in nr-AxSpA and AS together for inferences over treatment effects.
Bath Ankylosing Spondylitis Disease Activity Index and BathAnkylosing Spondylitis Functional Index scores conditional onBath Ankylosing Spondylitis Disease Activity Index response
We previously highlighted that NICE guidance determines that BASDAI 50 at 12 weeks defines treatmentcontinuation with anti-TNFs in clinical practice. Given much of the evidence on prognosis, costs and utilityscores links to the absolute values of BASDAI and BASFI scores, it is important to consider absolutechanges in BASDAI and BASFI separately for responders and non-responders, that is the conditional scores.However, the published clinical effectiveness evidence does not report the conditional scores. In thissection we use the results from the extended synthesis model to evaluate the conditional scores bysimulating BASDAI and BASFI scores for two equivalent cohorts of patients, one treated with an anti-TNFand the other with conventional therapy.
Brief description of methodsFrom the inferences obtained using the synthesis model above, it is possible to derive the conditionalchange score in responders and non-responders using simulation. While the synthesis focuses on thepooling of mean estimates of change scores and proportion of responders to BASDAI 50, to deriveconditional mean scores there is the need to consider the distributions at the individual patient level.Hence, conditional scores could not directly be derived from the synthesis, but through a simulationprocedure based on the assumptions and results of the synthesis model. The simulation procedure isdescribed in detail in Appendix 5. Briefly, we used a simulation sample size of 10,000 patients. Givenresults depend on the baseline distributions of BASDAI and BASFI scores and on the change scores frombaseline for placebo, we used the averages across trials (weighted by the number of patients in each trial)in AS. Baseline BASDAI scores were thus assumed normally distributed with mean 6.11 and SD 1.56; thechange from baseline for placebo was simulated from a normal distribution with mean –0.61 and SD 1.44.For BASFI, the baseline was assumed to have a mean of 5.27 and a SD 1.79 and the change from baselinefor placebo a mean of –0.19 and a SD 0.22. The correlation between baseline BASFI and BASDAI scoreswas valued at (AiC information has been removed). This value was based on the sample correlation onBASDAI and BASFI at baseline from etanercept studies [the individual patient data were available inthe Microsoft Excel® (Microsoft Corporation, Redmond, WA, USA) file for the etanercept submission]; theSpearman’s rank correlation coefficient was (AiC information has been removed) in 314-EU study167 in ASand (AiC information has been removed) in 1031 study166 in nr-AxSpA.
Results for ankylosing spondylitisThe conditional change scores derived from the synthesis model (and underlying assumptions) are reportedin Table 77. While it is natural to consider that conditional change in BASDAI scores differ betweenrespondents and non-respondents, differences in the baseline of respondents and non-respondents maybe less intuitive. These are, however, natural. If we consider two patients that obtained the same changescore in BASDAI from anti-TNF treatment, for example –2 units, but one started with a baseline of 4 andanother with a baseline of 5, the first would be considered a responder and the second would not. For thisreason, respondents are expected to have a lower BASDAI than non-responders. Results of the predictionof conditional scores using the synthesis model are presented in Table 77.
INDEPENDENT ECONOMIC ASSESSMENT: EXTENDED SYNTHESIS
NIHR Journals Library www.journalslibrary.nihr.ac.uk
122
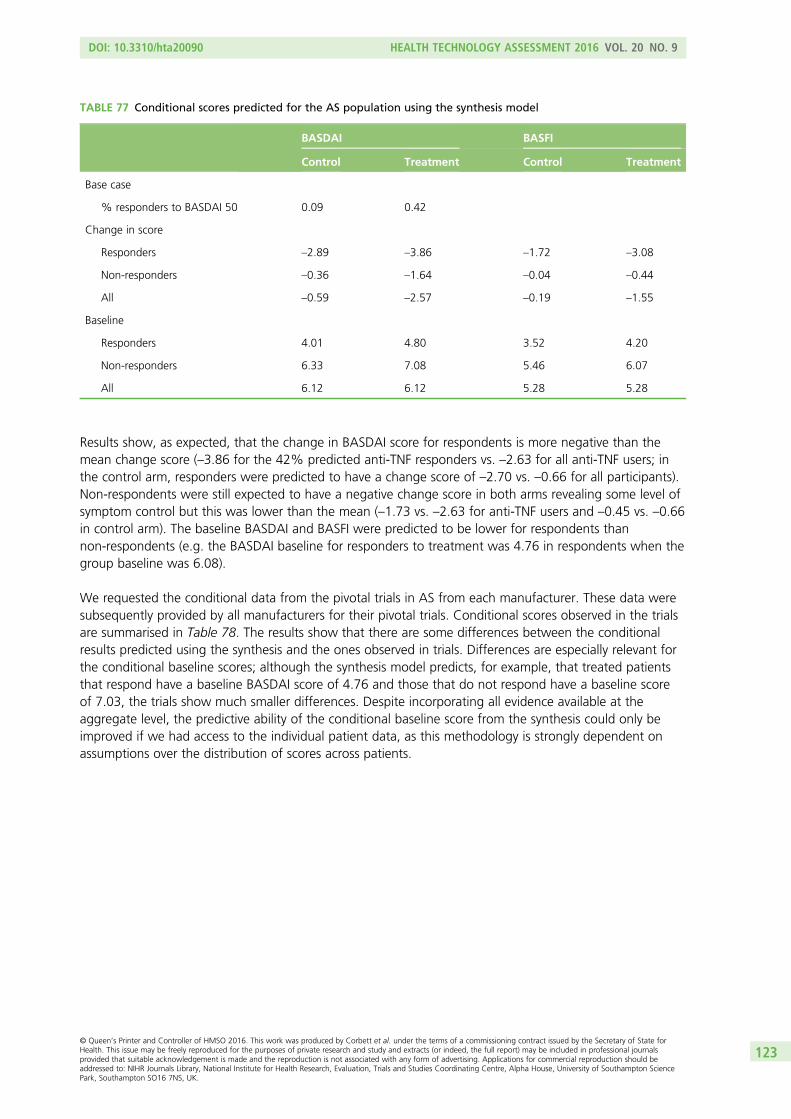
Results show, as expected, that the change in BASDAI score for respondents is more negative than themean change score (–3.86 for the 42% predicted anti-TNF responders vs. –2.63 for all anti-TNF users; inthe control arm, responders were predicted to have a change score of –2.70 vs. –0.66 for all participants).Non-respondents were still expected to have a negative change score in both arms revealing some level ofsymptom control but this was lower than the mean (–1.73 vs. –2.63 for anti-TNF users and –0.45 vs. –0.66in control arm). The baseline BASDAI and BASFI were predicted to be lower for respondents thannon-respondents (e.g. the BASDAI baseline for responders to treatment was 4.76 in respondents when thegroup baseline was 6.08).
We requested the conditional data from the pivotal trials in AS from each manufacturer. These data weresubsequently provided by all manufacturers for their pivotal trials. Conditional scores observed in the trialsare summarised in Table 78. The results show that there are some differences between the conditionalresults predicted using the synthesis and the ones observed in trials. Differences are especially relevant forthe conditional baseline scores; although the synthesis model predicts, for example, that treated patientsthat respond have a baseline BASDAI score of 4.76 and those that do not respond have a baseline scoreof 7.03, the trials show much smaller differences. Despite incorporating all evidence available at theaggregate level, the predictive ability of the conditional baseline score from the synthesis could only beimproved if we had access to the individual patient data, as this methodology is strongly dependent onassumptions over the distribution of scores across patients.
TABLE 77 Conditional scores predicted for the AS population using the synthesis model
BASDAI BASFI
Control Treatment Control Treatment
Base case
% responders to BASDAI 50 0.09 0.42
Change in score
Responders –2.89 –3.86 –1.72 –3.08
Non-responders –0.36 –1.64 –0.04 –0.44
All –0.59 –2.57 –0.19 –1.55
Baseline
Responders 4.01 4.80 3.52 4.20
Non-responders 6.33 7.08 5.46 6.07
All 6.12 6.12 5.28 5.28
DOI: 10.3310/hta20090 HEALTH TECHNOLOGY ASSESSMENT 2016 VOL. 20 NO. 9
© Queen’s Printer and Controller of HMSO 2016. This work was produced by Corbett et al. under the terms of a commissioning contract issued by the Secretary of State forHealth. This issue may be freely reproduced for the purposes of private research and study and extracts (or indeed, the full report) may be included in professional journalsprovided that suitable acknowledgement is made and the reproduction is not associated with any form of advertising. Applications for commercial reproduction should beaddressed to: NIHR Journals Library, National Institute for Health Research, Evaluation, Trials and Studies Coordinating Centre, Alpha House, University of Southampton SciencePark, Southampton SO16 7NS, UK.
123
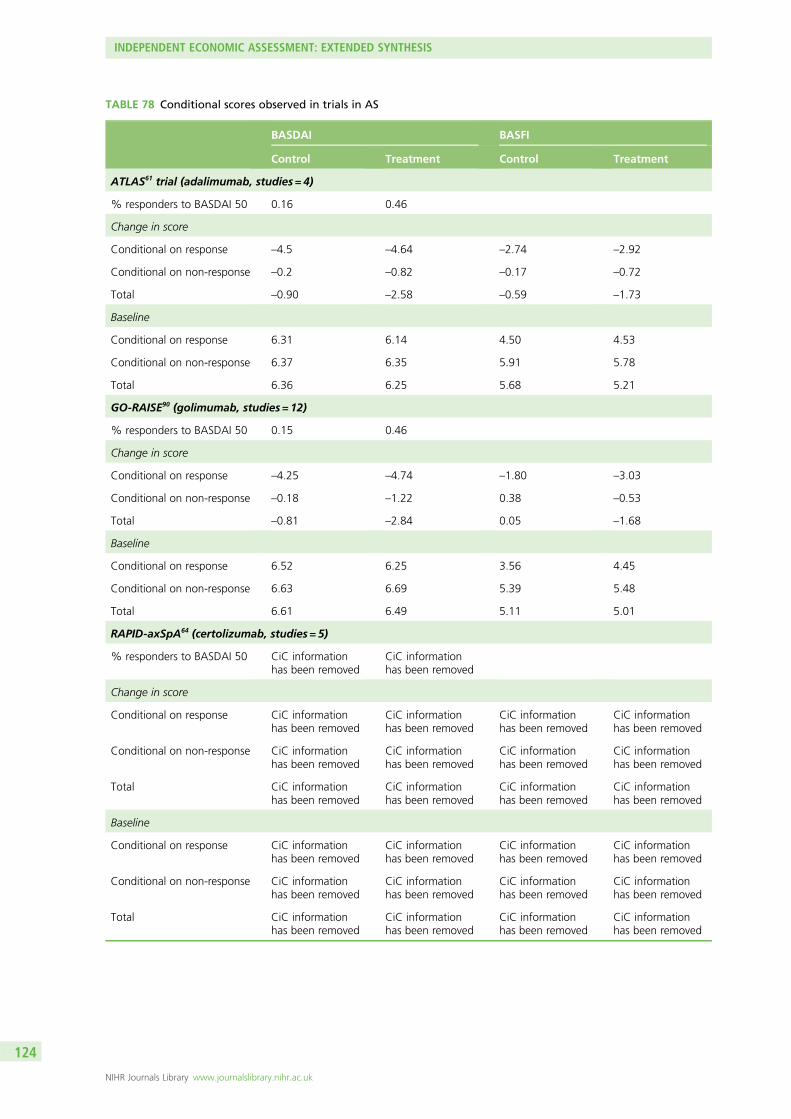
TABLE 78 Conditional scores observed in trials in AS
BASDAI BASFI
Control Treatment Control Treatment
ATLAS61 trial (adalimumab, studies = 4)
% responders to BASDAI 50 0.16 0.46
Change in score
Conditional on response –4.5 –4.64 –2.74 –2.92
Conditional on non-response –0.2 –0.82 –0.17 –0.72
Total –0.90 –2.58 –0.59 –1.73
Baseline
Conditional on response 6.31 6.14 4.50 4.53
Conditional on non-response 6.37 6.35 5.91 5.78
Total 6.36 6.25 5.68 5.21
GO-RAISE90 (golimumab, studies = 12)
% responders to BASDAI 50 0.15 0.46
Change in score
Conditional on response –4.25 –4.74 –1.80 –3.03
Conditional on non-response –0.18 –1.22 0.38 –0.53
Total –0.81 –2.84 0.05 –1.68
Baseline
Conditional on response 6.52 6.25 3.56 4.45
Conditional on non-response 6.63 6.69 5.39 5.48
Total 6.61 6.49 5.11 5.01
RAPID-axSpA64 (certolizumab, studies = 5)
% responders to BASDAI 50 CiC informationhas been removed
CiC informationhas been removed
Change in score
Conditional on response CiC informationhas been removed
CiC informationhas been removed
CiC informationhas been removed
CiC informationhas been removed
Conditional on non-response CiC informationhas been removed
CiC informationhas been removed
CiC informationhas been removed
CiC informationhas been removed
Total CiC informationhas been removed
CiC informationhas been removed
CiC informationhas been removed
CiC informationhas been removed
Baseline
Conditional on response CiC informationhas been removed
CiC informationhas been removed
CiC informationhas been removed
CiC informationhas been removed
Conditional on non-response CiC informationhas been removed
CiC informationhas been removed
CiC informationhas been removed
CiC informationhas been removed
Total CiC informationhas been removed
CiC informationhas been removed
CiC informationhas been removed
CiC informationhas been removed
INDEPENDENT ECONOMIC ASSESSMENT: EXTENDED SYNTHESIS
NIHR Journals Library www.journalslibrary.nihr.ac.uk
124
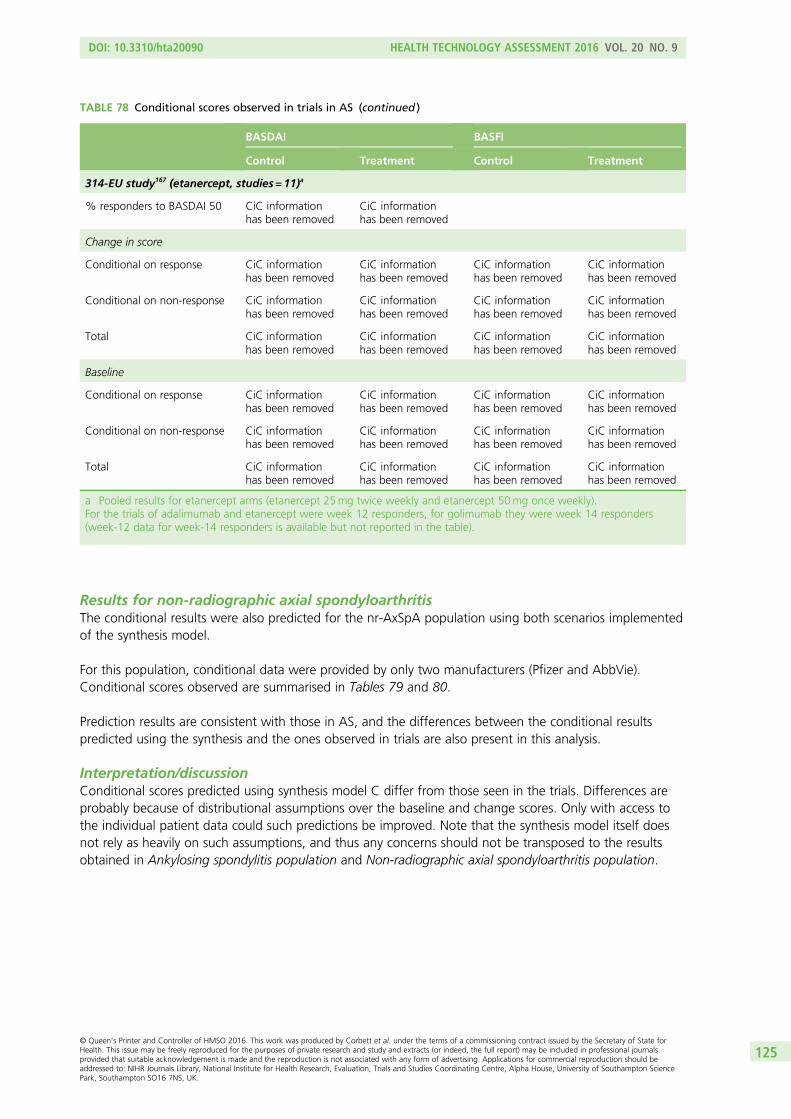
Results for non-radiographic axial spondyloarthritisThe conditional results were also predicted for the nr-AxSpA population using both scenarios implementedof the synthesis model.
For this population, conditional data were provided by only two manufacturers (Pfizer and AbbVie).Conditional scores observed are summarised in Tables 79 and 80.
Prediction results are consistent with those in AS, and the differences between the conditional resultspredicted using the synthesis and the ones observed in trials are also present in this analysis.
Interpretation/discussionConditional scores predicted using synthesis model C differ from those seen in the trials. Differences areprobably because of distributional assumptions over the baseline and change scores. Only with access tothe individual patient data could such predictions be improved. Note that the synthesis model itself doesnot rely as heavily on such assumptions, and thus any concerns should not be transposed to the resultsobtained in Ankylosing spondylitis population and Non-radiographic axial spondyloarthritis population.
TABLE 78 Conditional scores observed in trials in AS (continued )
BASDAI BASFI
Control Treatment Control Treatment
314-EU study167 (etanercept, studies = 11)a
% responders to BASDAI 50 CiC informationhas been removed
CiC informationhas been removed
Change in score
Conditional on response CiC informationhas been removed
CiC informationhas been removed
CiC informationhas been removed
CiC informationhas been removed
Conditional on non-response CiC informationhas been removed
CiC informationhas been removed
CiC informationhas been removed
CiC informationhas been removed
Total CiC informationhas been removed
CiC informationhas been removed
CiC informationhas been removed
CiC informationhas been removed
Baseline
Conditional on response CiC informationhas been removed
CiC informationhas been removed
CiC informationhas been removed
CiC informationhas been removed
Conditional on non-response CiC informationhas been removed
CiC informationhas been removed
CiC informationhas been removed
CiC informationhas been removed
Total CiC informationhas been removed
CiC informationhas been removed
CiC informationhas been removed
CiC informationhas been removed
a Pooled results for etanercept arms (etanercept 25mg twice weekly and etanercept 50mg once weekly).For the trials of adalimumab and etanercept were week 12 responders, for golimumab they were week 14 responders(week-12 data for week-14 responders is available but not reported in the table).
DOI: 10.3310/hta20090 HEALTH TECHNOLOGY ASSESSMENT 2016 VOL. 20 NO. 9
© Queen’s Printer and Controller of HMSO 2016. This work was produced by Corbett et al. under the terms of a commissioning contract issued by the Secretary of State forHealth. This issue may be freely reproduced for the purposes of private research and study and extracts (or indeed, the full report) may be included in professional journalsprovided that suitable acknowledgement is made and the reproduction is not associated with any form of advertising. Applications for commercial reproduction should beaddressed to: NIHR Journals Library, National Institute for Health Research, Evaluation, Trials and Studies Coordinating Centre, Alpha House, University of Southampton SciencePark, Southampton SO16 7NS, UK.
125
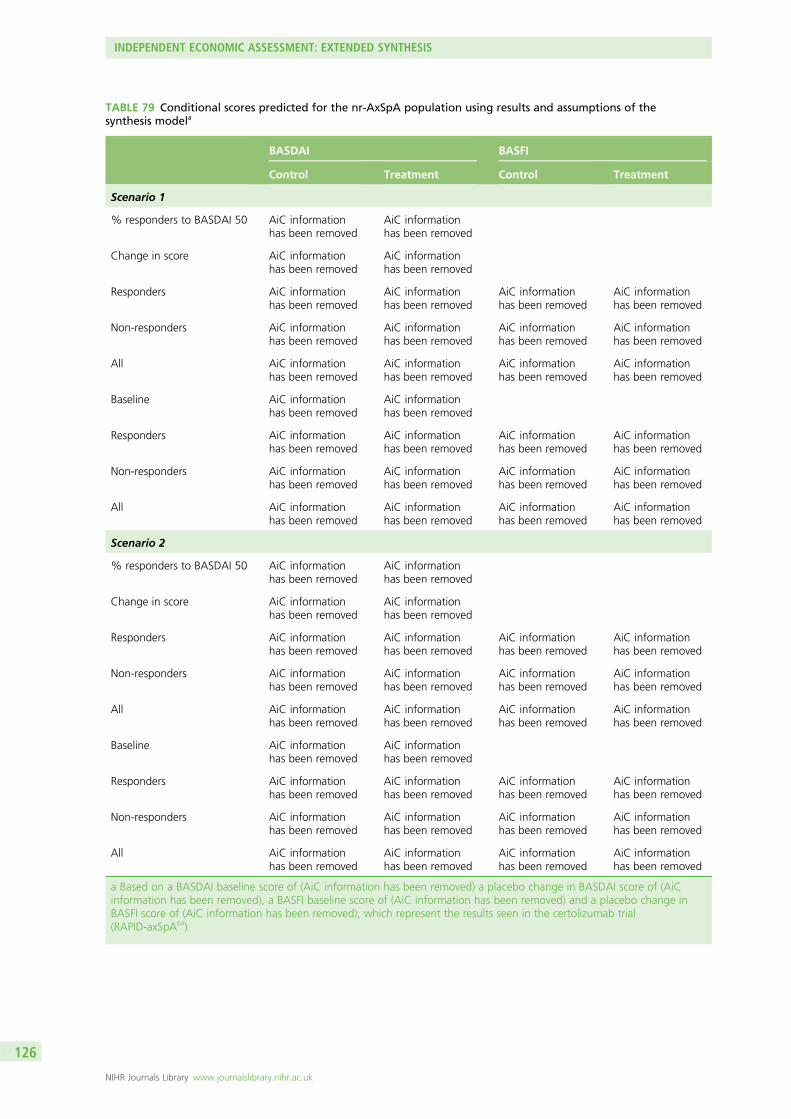
TABLE 79 Conditional scores predicted for the nr-AxSpA population using results and assumptions of thesynthesis modela
BASDAI BASFI
Control Treatment Control Treatment
Scenario 1
% responders to BASDAI 50 AiC informationhas been removed
AiC informationhas been removed
Change in score AiC informationhas been removed
AiC informationhas been removed
Responders AiC informationhas been removed
AiC informationhas been removed
AiC informationhas been removed
AiC informationhas been removed
Non-responders AiC informationhas been removed
AiC informationhas been removed
AiC informationhas been removed
AiC informationhas been removed
All AiC informationhas been removed
AiC informationhas been removed
AiC informationhas been removed
AiC informationhas been removed
Baseline AiC informationhas been removed
AiC informationhas been removed
Responders AiC informationhas been removed
AiC informationhas been removed
AiC informationhas been removed
AiC informationhas been removed
Non-responders AiC informationhas been removed
AiC informationhas been removed
AiC informationhas been removed
AiC informationhas been removed
All AiC informationhas been removed
AiC informationhas been removed
AiC informationhas been removed
AiC informationhas been removed
Scenario 2
% responders to BASDAI 50 AiC informationhas been removed
AiC informationhas been removed
Change in score AiC informationhas been removed
AiC informationhas been removed
Responders AiC informationhas been removed
AiC informationhas been removed
AiC informationhas been removed
AiC informationhas been removed
Non-responders AiC informationhas been removed
AiC informationhas been removed
AiC informationhas been removed
AiC informationhas been removed
All AiC informationhas been removed
AiC informationhas been removed
AiC informationhas been removed
AiC informationhas been removed
Baseline AiC informationhas been removed
AiC informationhas been removed
Responders AiC informationhas been removed
AiC informationhas been removed
AiC informationhas been removed
AiC informationhas been removed
Non-responders AiC informationhas been removed
AiC informationhas been removed
AiC informationhas been removed
AiC informationhas been removed
All AiC informationhas been removed
AiC informationhas been removed
AiC informationhas been removed
AiC informationhas been removed
a Based on a BASDAI baseline score of (AiC information has been removed) a placebo change in BASDAI score of (AiCinformation has been removed), a BASFI baseline score of (AiC information has been removed) and a placebo change inBASFI score of (AiC information has been removed), which represent the results seen in the certolizumab trial(RAPID-axSpA64).
INDEPENDENT ECONOMIC ASSESSMENT: EXTENDED SYNTHESIS
NIHR Journals Library www.journalslibrary.nihr.ac.uk
126
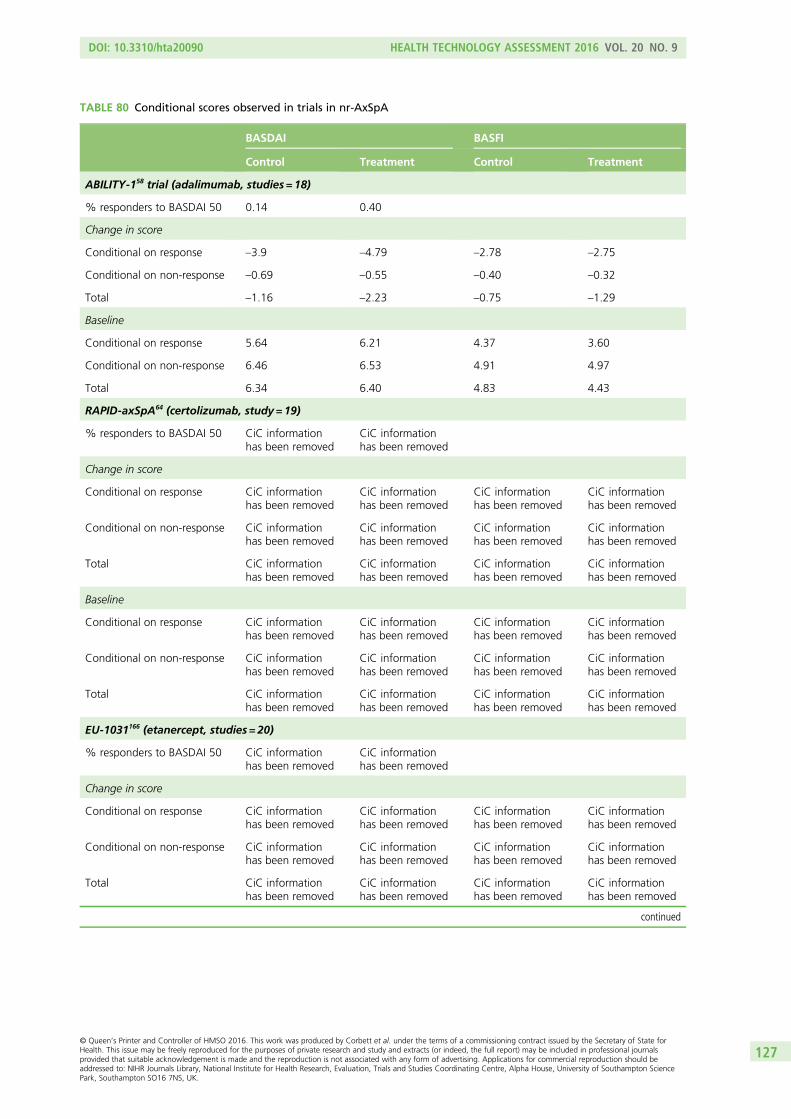
TABLE 80 Conditional scores observed in trials in nr-AxSpA
BASDAI BASFI
Control Treatment Control Treatment
ABILITY-158 trial (adalimumab, studies = 18)
% responders to BASDAI 50 0.14 0.40
Change in score
Conditional on response –3.9 –4.79 –2.78 –2.75
Conditional on non-response –0.69 –0.55 –0.40 –0.32
Total –1.16 –2.23 –0.75 –1.29
Baseline
Conditional on response 5.64 6.21 4.37 3.60
Conditional on non-response 6.46 6.53 4.91 4.97
Total 6.34 6.40 4.83 4.43
RAPID-axSpA64 (certolizumab, study = 19)
% responders to BASDAI 50 CiC informationhas been removed
CiC informationhas been removed
Change in score
Conditional on response CiC informationhas been removed
CiC informationhas been removed
CiC informationhas been removed
CiC informationhas been removed
Conditional on non-response CiC informationhas been removed
CiC informationhas been removed
CiC informationhas been removed
CiC informationhas been removed
Total CiC informationhas been removed
CiC informationhas been removed
CiC informationhas been removed
CiC informationhas been removed
Baseline
Conditional on response CiC informationhas been removed
CiC informationhas been removed
CiC informationhas been removed
CiC informationhas been removed
Conditional on non-response CiC informationhas been removed
CiC informationhas been removed
CiC informationhas been removed
CiC informationhas been removed
Total CiC informationhas been removed
CiC informationhas been removed
CiC informationhas been removed
CiC informationhas been removed
EU-1031166 (etanercept, studies = 20)
% responders to BASDAI 50 CiC informationhas been removed
CiC informationhas been removed
Change in score
Conditional on response CiC informationhas been removed
CiC informationhas been removed
CiC informationhas been removed
CiC informationhas been removed
Conditional on non-response CiC informationhas been removed
CiC informationhas been removed
CiC informationhas been removed
CiC informationhas been removed
Total CiC informationhas been removed
CiC informationhas been removed
CiC informationhas been removed
CiC informationhas been removed
continued
DOI: 10.3310/hta20090 HEALTH TECHNOLOGY ASSESSMENT 2016 VOL. 20 NO. 9
© Queen’s Printer and Controller of HMSO 2016. This work was produced by Corbett et al. under the terms of a commissioning contract issued by the Secretary of State forHealth. This issue may be freely reproduced for the purposes of private research and study and extracts (or indeed, the full report) may be included in professional journalsprovided that suitable acknowledgement is made and the reproduction is not associated with any form of advertising. Applications for commercial reproduction should beaddressed to: NIHR Journals Library, National Institute for Health Research, Evaluation, Trials and Studies Coordinating Centre, Alpha House, University of Southampton SciencePark, Southampton SO16 7NS, UK.
127
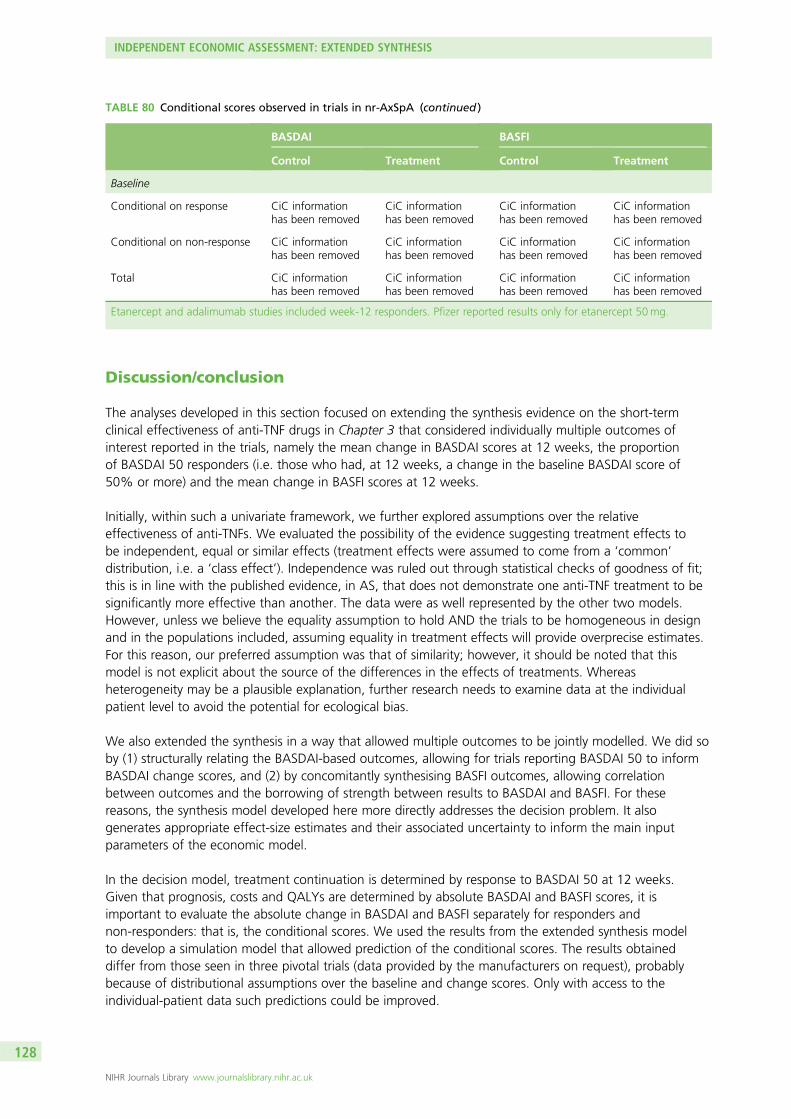
Discussion/conclusion
The analyses developed in this section focused on extending the synthesis evidence on the short-termclinical effectiveness of anti-TNF drugs in Chapter 3 that considered individually multiple outcomes ofinterest reported in the trials, namely the mean change in BASDAI scores at 12 weeks, the proportionof BASDAI 50 responders (i.e. those who had, at 12 weeks, a change in the baseline BASDAI score of50% or more) and the mean change in BASFI scores at 12 weeks.
Initially, within such a univariate framework, we further explored assumptions over the relativeeffectiveness of anti-TNFs. We evaluated the possibility of the evidence suggesting treatment effects tobe independent, equal or similar effects (treatment effects were assumed to come from a ‘common’distribution, i.e. a ‘class effect’). Independence was ruled out through statistical checks of goodness of fit;this is in line with the published evidence, in AS, that does not demonstrate one anti-TNF treatment to besignificantly more effective than another. The data were as well represented by the other two models.However, unless we believe the equality assumption to hold AND the trials to be homogeneous in designand in the populations included, assuming equality in treatment effects will provide overprecise estimates.For this reason, our preferred assumption was that of similarity; however, it should be noted that thismodel is not explicit about the source of the differences in the effects of treatments. Whereasheterogeneity may be a plausible explanation, further research needs to examine data at the individualpatient level to avoid the potential for ecological bias.
We also extended the synthesis in a way that allowed multiple outcomes to be jointly modelled. We did soby (1) structurally relating the BASDAI-based outcomes, allowing for trials reporting BASDAI 50 to informBASDAI change scores, and (2) by concomitantly synthesising BASFI outcomes, allowing correlationbetween outcomes and the borrowing of strength between results to BASDAI and BASFI. For thesereasons, the synthesis model developed here more directly addresses the decision problem. It alsogenerates appropriate effect-size estimates and their associated uncertainty to inform the main inputparameters of the economic model.
In the decision model, treatment continuation is determined by response to BASDAI 50 at 12 weeks.Given that prognosis, costs and QALYs are determined by absolute BASDAI and BASFI scores, it isimportant to evaluate the absolute change in BASDAI and BASFI separately for responders andnon-responders: that is, the conditional scores. We used the results from the extended synthesis modelto develop a simulation model that allowed prediction of the conditional scores. The results obtaineddiffer from those seen in three pivotal trials (data provided by the manufacturers on request), probablybecause of distributional assumptions over the baseline and change scores. Only with access to theindividual-patient data such predictions could be improved.
TABLE 80 Conditional scores observed in trials in nr-AxSpA (continued )
BASDAI BASFI
Control Treatment Control Treatment
Baseline
Conditional on response CiC informationhas been removed
CiC informationhas been removed
CiC informationhas been removed
CiC informationhas been removed
Conditional on non-response CiC informationhas been removed
CiC informationhas been removed
CiC informationhas been removed
CiC informationhas been removed
Total CiC informationhas been removed
CiC informationhas been removed
CiC informationhas been removed
CiC informationhas been removed
Etanercept and adalimumab studies included week-12 responders. Pfizer reported results only for etanercept 50mg.
INDEPENDENT ECONOMIC ASSESSMENT: EXTENDED SYNTHESIS
NIHR Journals Library www.journalslibrary.nihr.ac.uk
128
Chapter 6 Independent economic assessment:York model
Overview
Chapter 4 indicates that there are significant conceptual concerns and uncertainties arising from previouslypublished studies and the submissions made by manufacturers. For this reason, it has been necessary todevelop a de novo model (hereafter referred to as the ‘York model’). Although it shares some of theassumptions and parameter estimates from the manufacturer models, it has a different conceptualstructure and applies a more generalised framework for the synthesis of data from the double-blindperiods of existing RCTs, combined with a more explicit approach to modelling the progressive nature ofAS and nr-AxSpA and the potential impact of the anti-TNFs.
The aim of the York model is to assess the cost-effectiveness of adalimumab, certolizumab, etanercept,golimumab and infliximab, in accordance with their respective licences, for the treatment of AS andnr-AxSpA. The model uses short-term trial data, based on the extended evidence synthesis, to model theresponse of patients to TNF-α inhibitor therapy at 12 weeks based on BASDAI 50 measured in the trials.In contrast to the models submitted by the manufacturers, the York model is based on an assumption ofsimilar (but not identical) effects for the alternative biologics based on the results of the extended synthesisreported in Chapter 5.
In common with all existing cost-effectiveness studies, measures of disease activity (BASDAI) andfunctioning (BASFI) are used to characterise the chronic, progressive nature of AS and nr-AxSpA and theeffect of anti-TNFs. However, the York model uses an alternative conceptual model applied to estimatelonger-term BASFI scores. The effect of response to TNF-α therapy is modelled in terms of the short- andlonger-term impact on BASDAI and BASFI scores.
The NHS and PSS costs are based on the cost of the TNF-α therapies (acquisition, administration andmonitoring) and disease costs linked to BASFI scores. HRQoL, in terms of utility, is based on both BASDAIand BASFI scores. Health effects are subsequently expressed in terms of QALYs. Both costs and QALYs arediscounted at 3.5% per annum. Costs are presented based on current prices.
The model is developed in accordance with the NICE reference case. The model has a lifetime horizon(60 years) and considers costs from the perspective of the NHS and PSS.
Contribution of the York model
Although the York model shares some of the assumptions and parameters from existing studies andmanufacturer’s submissions, it also provides a number of significant developments to existing cost-effectivenessanalyses. First, the short-term clinical effectiveness inputs are based on an evidence-synthesis approach whichis based on all available trial data for each biological therapy and which jointly synthesises ‘related’parameters ensuring uncertainty is more appropriately characterised. Second, the evidence-synthesisapproach is more explicitly linked to the decision problem and the requirements of the economic model,that is the model requires estimates of response and the impact on BASDAI/BASFI conditional upon this.As the conditional response scores are not conventionally reported in existing publications, existing modelshave largely been based on selective approaches (i.e. using conditional scores from single studies or
DOI: 10.3310/hta20090 HEALTH TECHNOLOGY ASSESSMENT 2016 VOL. 20 NO. 9
© Queen’s Printer and Controller of HMSO 2016. This work was produced by Corbett et al. under the terms of a commissioning contract issued by the Secretary of State forHealth. This issue may be freely reproduced for the purposes of private research and study and extracts (or indeed, the full report) may be included in professional journalsprovided that suitable acknowledgement is made and the reproduction is not associated with any form of advertising. Applications for commercial reproduction should beaddressed to: NIHR Journals Library, National Institute for Health Research, Evaluation, Trials and Studies Coordinating Centre, Alpha House, University of Southampton SciencePark, Southampton SO16 7NS, UK.
129
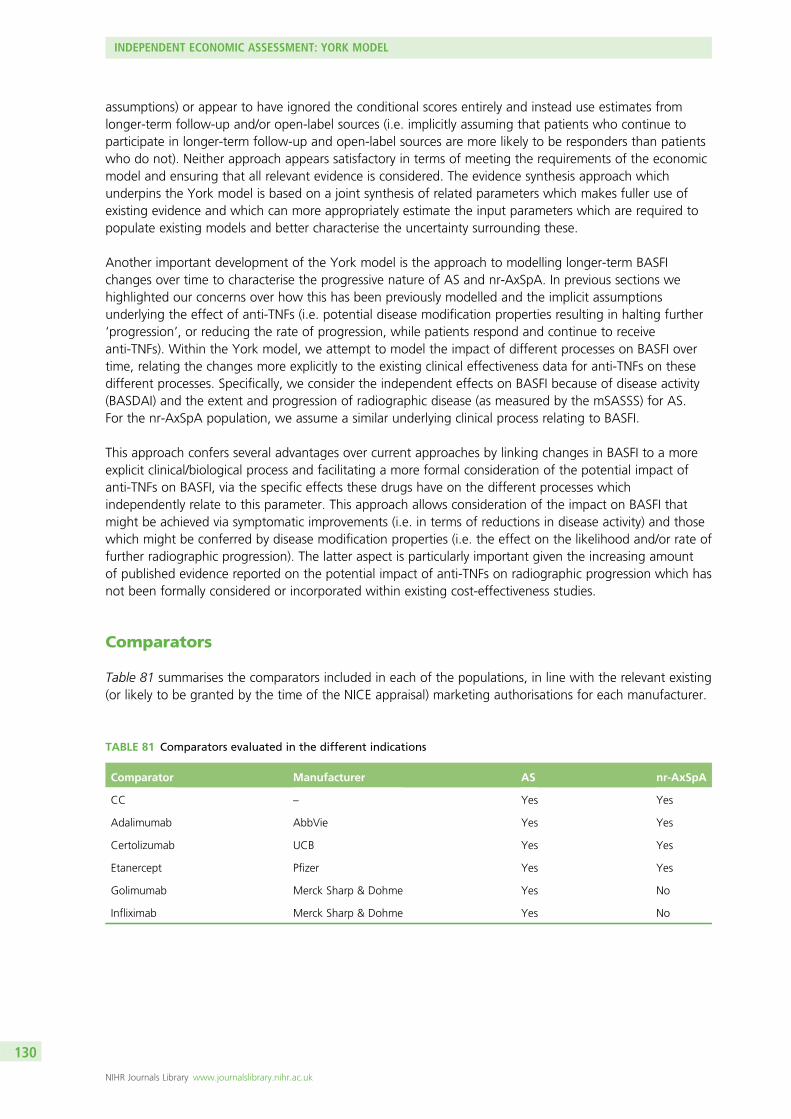
assumptions) or appear to have ignored the conditional scores entirely and instead use estimates fromlonger-term follow-up and/or open-label sources (i.e. implicitly assuming that patients who continue toparticipate in longer-term follow-up and open-label sources are more likely to be responders than patientswho do not). Neither approach appears satisfactory in terms of meeting the requirements of the economicmodel and ensuring that all relevant evidence is considered. The evidence synthesis approach whichunderpins the York model is based on a joint synthesis of related parameters which makes fuller use ofexisting evidence and which can more appropriately estimate the input parameters which are required topopulate existing models and better characterise the uncertainty surrounding these.
Another important development of the York model is the approach to modelling longer-term BASFIchanges over time to characterise the progressive nature of AS and nr-AxSpA. In previous sections wehighlighted our concerns over how this has been previously modelled and the implicit assumptionsunderlying the effect of anti-TNFs (i.e. potential disease modification properties resulting in halting further‘progression’, or reducing the rate of progression, while patients respond and continue to receiveanti-TNFs). Within the York model, we attempt to model the impact of different processes on BASFI overtime, relating the changes more explicitly to the existing clinical effectiveness data for anti-TNFs on thesedifferent processes. Specifically, we consider the independent effects on BASFI because of disease activity(BASDAI) and the extent and progression of radiographic disease (as measured by the mSASSS) for AS.For the nr-AxSpA population, we assume a similar underlying clinical process relating to BASFI.
This approach confers several advantages over current approaches by linking changes in BASFI to a moreexplicit clinical/biological process and facilitating a more formal consideration of the potential impact ofanti-TNFs on BASFI, via the specific effects these drugs have on the different processes whichindependently relate to this parameter. This approach allows consideration of the impact on BASFI thatmight be achieved via symptomatic improvements (i.e. in terms of reductions in disease activity) and thosewhich might be conferred by disease modification properties (i.e. the effect on the likelihood and/or rate offurther radiographic progression). The latter aspect is particularly important given the increasing amountof published evidence reported on the potential impact of anti-TNFs on radiographic progression which hasnot been formally considered or incorporated within existing cost-effectiveness studies.
Comparators
Table 81 summarises the comparators included in each of the populations, in line with the relevant existing(or likely to be granted by the time of the NICE appraisal) marketing authorisations for each manufacturer.
TABLE 81 Comparators evaluated in the different indications
Comparator Manufacturer AS nr-AxSpA
CC – Yes Yes
Adalimumab AbbVie Yes Yes
Certolizumab UCB Yes Yes
Etanercept Pfizer Yes Yes
Golimumab Merck Sharp & Dohme Yes No
Infliximab Merck Sharp & Dohme Yes No
INDEPENDENT ECONOMIC ASSESSMENT: YORK MODEL
NIHR Journals Library www.journalslibrary.nihr.ac.uk
130
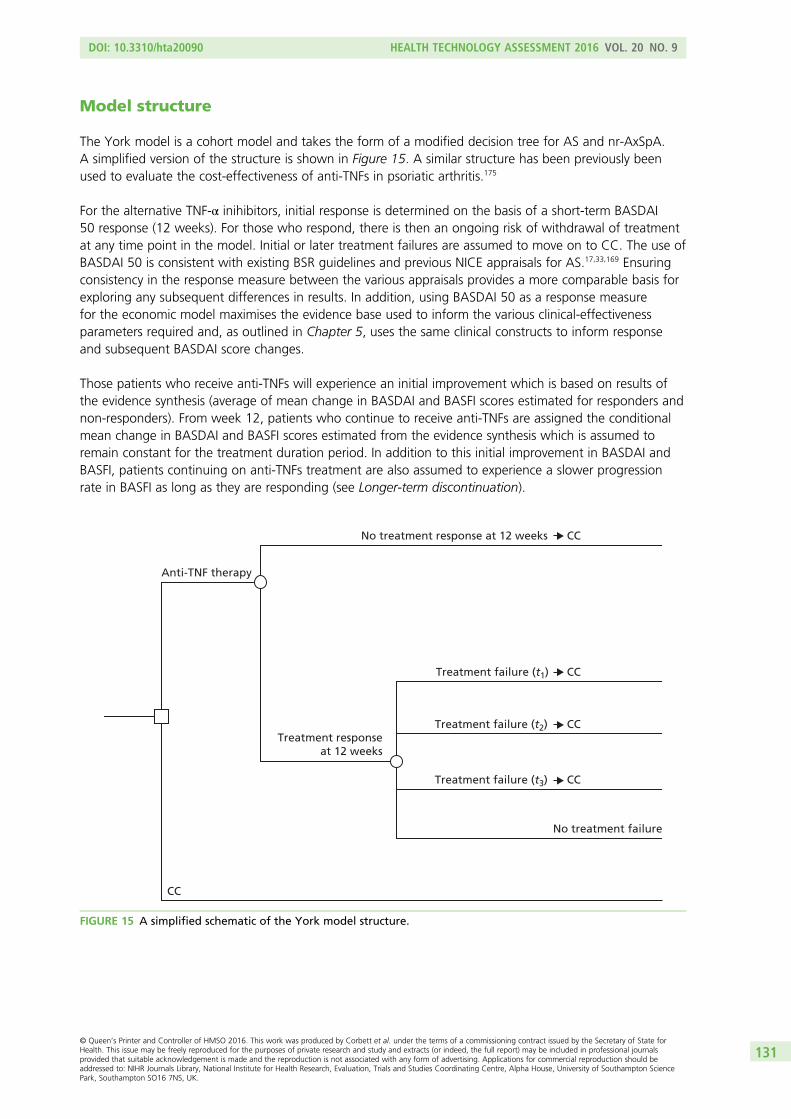
Model structure
The York model is a cohort model and takes the form of a modified decision tree for AS and nr-AxSpA.A simplified version of the structure is shown in Figure 15. A similar structure has been previously beenused to evaluate the cost-effectiveness of anti-TNFs in psoriatic arthritis.175
For the alternative TNF-α inihibitors, initial response is determined on the basis of a short-term BASDAI50 response (12 weeks). For those who respond, there is then an ongoing risk of withdrawal of treatmentat any time point in the model. Initial or later treatment failures are assumed to move on to CC. The use ofBASDAI 50 is consistent with existing BSR guidelines and previous NICE appraisals for AS.17,33,169 Ensuringconsistency in the response measure between the various appraisals provides a more comparable basis forexploring any subsequent differences in results. In addition, using BASDAI 50 as a response measurefor the economic model maximises the evidence base used to inform the various clinical-effectivenessparameters required and, as outlined in Chapter 5, uses the same clinical constructs to inform responseand subsequent BASDAI score changes.
Those patients who receive anti-TNFs will experience an initial improvement which is based on results ofthe evidence synthesis (average of mean change in BASDAI and BASFI scores estimated for responders andnon-responders). From week 12, patients who continue to receive anti-TNFs are assigned the conditionalmean change in BASDAI and BASFI scores estimated from the evidence synthesis which is assumed toremain constant for the treatment duration period. In addition to this initial improvement in BASDAI andBASFI, patients continuing on anti-TNFs treatment are also assumed to experience a slower progressionrate in BASFI as long as they are responding (see Longer-term discontinuation).
Anti-TNF therapy
CC
No treatment failure
CC
CC
CC
CC
Treatment failure (t3)
Treatment failure (t2)
Treatment failure (t1)
No treatment response at 12 weeks
Treatment responseat 12 weeks
FIGURE 15 A simplified schematic of the York model structure.
DOI: 10.3310/hta20090 HEALTH TECHNOLOGY ASSESSMENT 2016 VOL. 20 NO. 9
© Queen’s Printer and Controller of HMSO 2016. This work was produced by Corbett et al. under the terms of a commissioning contract issued by the Secretary of State forHealth. This issue may be freely reproduced for the purposes of private research and study and extracts (or indeed, the full report) may be included in professional journalsprovided that suitable acknowledgement is made and the reproduction is not associated with any form of advertising. Applications for commercial reproduction should beaddressed to: NIHR Journals Library, National Institute for Health Research, Evaluation, Trials and Studies Coordinating Centre, Alpha House, University of Southampton SciencePark, Southampton SO16 7NS, UK.
131
Patients who fail on TNF-α inhibitor therapy after the initial (12-week) period will experience some form ofrebound in terms of BASDAI/BASFI score, but the trial data are too short term to be able to characterisethis accurately. The model, therefore, considers two rebound scenarios:
1. Rebound equal to gain (BASDAI and BASFI). When patients fail therapy (after initially responding), theirBASDAI and BASFI deteriorates by the same amount by which it improves when they respondedto therapy.
2. Rebound back to natural history/CC (BASFI only). When patients fail therapy (after initially responding),their BASFI deteriorates to the level and subsequent trajectory it would have been had they not initiallyresponded to therapy. As BASDAI is not assumed to progress over time on CC, the same assumptionsare applied to BASDAI in both scenarios.
Given the absence of evidence on rebound, both scenarios (rebound equal to gain and rebound back tonatural history) are presented as the ‘best-case’ and ‘worst-case’ scenarios possible. In other words, thereality regarding rebound is likely to be somewhere between these two scenarios which should, therefore,be seen as the limits.
Importantly, the York model explores the impact of assuming different baseline BASDAI and BASFI scoresfor responders and non-responders. Hence, in contrast to existing models, the York model assumes thatresponse is unlikely to be independent of baseline patient characteristics and hence the baselinecharacteristics of responders/non-responders to anti-TNFs may be systematically different from each other.Importantly, the results from the extended synthesis model estimated higher baseline BASDAI and BASFIscores for non-responders vis-à-vis responders and a similar relationship was also reported by thosemanufacturers who provided conditional response data requested by the assessment group. Consequently,assuming that non-responders revert back to the ‘average’ of the baseline BASDAI/BASFI score of allpatients randomised to receive TNF-α inhibitor treatment, or the ‘average’ of patients receiving CC, is likelyto be overly optimistic towards the subsequent cost-effectiveness of anti-TNFs. The model thus usedifferent baselines for responders and non-responders (at 12 weeks) and at the point of discontinutationpatients are assumed to revert to their respective baseline BASDAI and BASFI scores (i.e. at 12 weeksnon-responders revert back to the non-responder baseline and after 12 weeks patients who subsequentlydiscontinue from their TNF-α therapy revert back to their responder baseline). The impact of using thesedata is explored as part of the sensitivity analysis.
Patients are at risk of all-cause mortality at every time point in the model but no differential mortalityrisk between the therapies being evaluated. Aside from the cost of the TNF-α therapies themselves(i.e. acquisition, administration, monitoring and AEs), all other costs of AS and nr-AxSpA are assumed tovary according to BASFI score. Costs are presented based on current prices. HRQoL (in terms of utility) isimplemented as a function of BASDAI and BASFI scores.
Model input parameters
The parameter estimates used in the York model, together with their sources, are detailed in Tables 82and 83.
Baseline patient characteristicsBaseline characteristics applied to the AS and nr-AxSpA populations are summarised in Tables 82 and83, respectively.
INDEPENDENT ECONOMIC ASSESSMENT: YORK MODEL
NIHR Journals Library www.journalslibrary.nihr.ac.uk
132
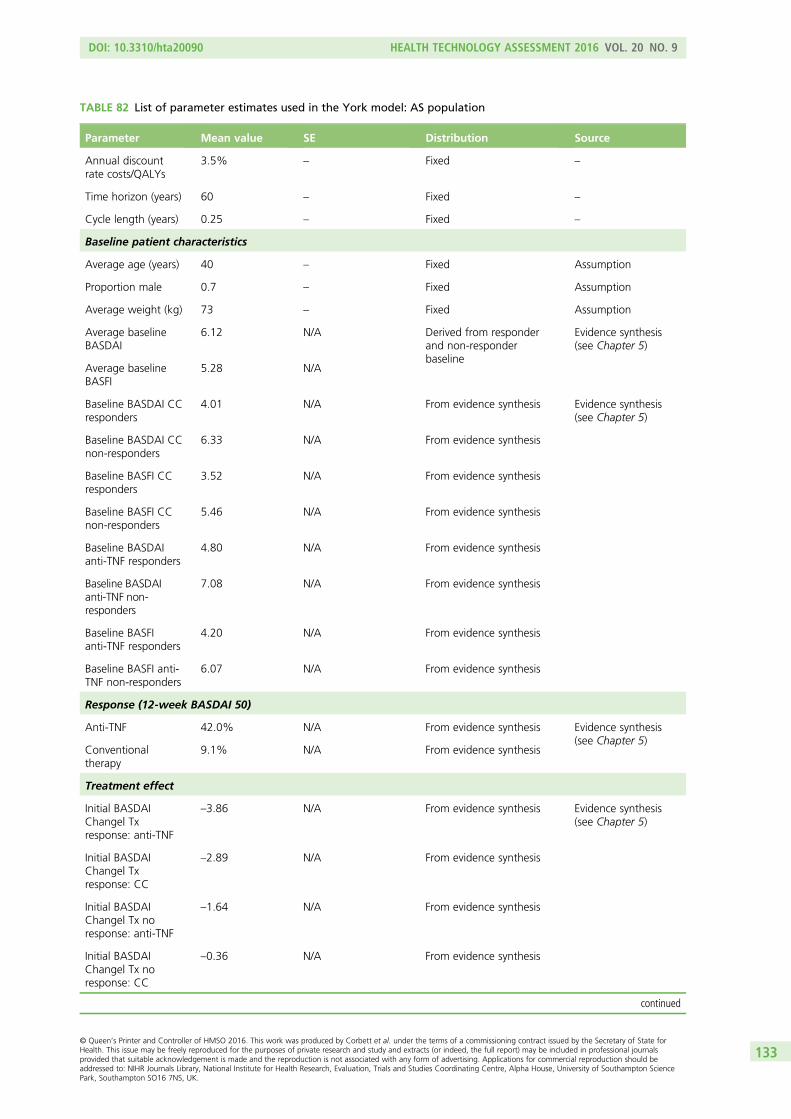
TABLE 82 List of parameter estimates used in the York model: AS population
Parameter Mean value SE Distribution Source
Annual discountrate costs/QALYs
3.5% – Fixed –
Time horizon (years) 60 – Fixed –
Cycle length (years) 0.25 – Fixed –
Baseline patient characteristics
Average age (years) 40 – Fixed Assumption
Proportion male 0.7 – Fixed Assumption
Average weight (kg) 73 – Fixed Assumption
Average baselineBASDAI
6.12 N/A Derived from responderand non-responderbaseline
Evidence synthesis(see Chapter 5)
Average baselineBASFI
5.28 N/A
Baseline BASDAI CCresponders
4.01 N/A From evidence synthesis Evidence synthesis(see Chapter 5)
Baseline BASDAI CCnon-responders
6.33 N/A From evidence synthesis
Baseline BASFI CCresponders
3.52 N/A From evidence synthesis
Baseline BASFI CCnon-responders
5.46 N/A From evidence synthesis
Baseline BASDAIanti-TNF responders
4.80 N/A From evidence synthesis
Baseline BASDAIanti-TNF non-responders
7.08 N/A From evidence synthesis
Baseline BASFIanti-TNF responders
4.20 N/A From evidence synthesis
Baseline BASFI anti-TNF non-responders
6.07 N/A From evidence synthesis
Response (12-week BASDAI 50)
Anti-TNF 42.0% N/A From evidence synthesis Evidence synthesis(see Chapter 5)
Conventionaltherapy
9.1% N/A From evidence synthesis
Treatment effect
Initial BASDAIChange| Txresponse: anti-TNF
–3.86 N/A From evidence synthesis Evidence synthesis(see Chapter 5)
Initial BASDAIChange| Txresponse: CC
–2.89 N/A From evidence synthesis
Initial BASDAIChange| Tx noresponse: anti-TNF
–1.64 N/A From evidence synthesis
Initial BASDAIChange| Tx noresponse: CC
–0.36 N/A From evidence synthesis
continued
DOI: 10.3310/hta20090 HEALTH TECHNOLOGY ASSESSMENT 2016 VOL. 20 NO. 9
© Queen’s Printer and Controller of HMSO 2016. This work was produced by Corbett et al. under the terms of a commissioning contract issued by the Secretary of State forHealth. This issue may be freely reproduced for the purposes of private research and study and extracts (or indeed, the full report) may be included in professional journalsprovided that suitable acknowledgement is made and the reproduction is not associated with any form of advertising. Applications for commercial reproduction should beaddressed to: NIHR Journals Library, National Institute for Health Research, Evaluation, Trials and Studies Coordinating Centre, Alpha House, University of Southampton SciencePark, Southampton SO16 7NS, UK.
133
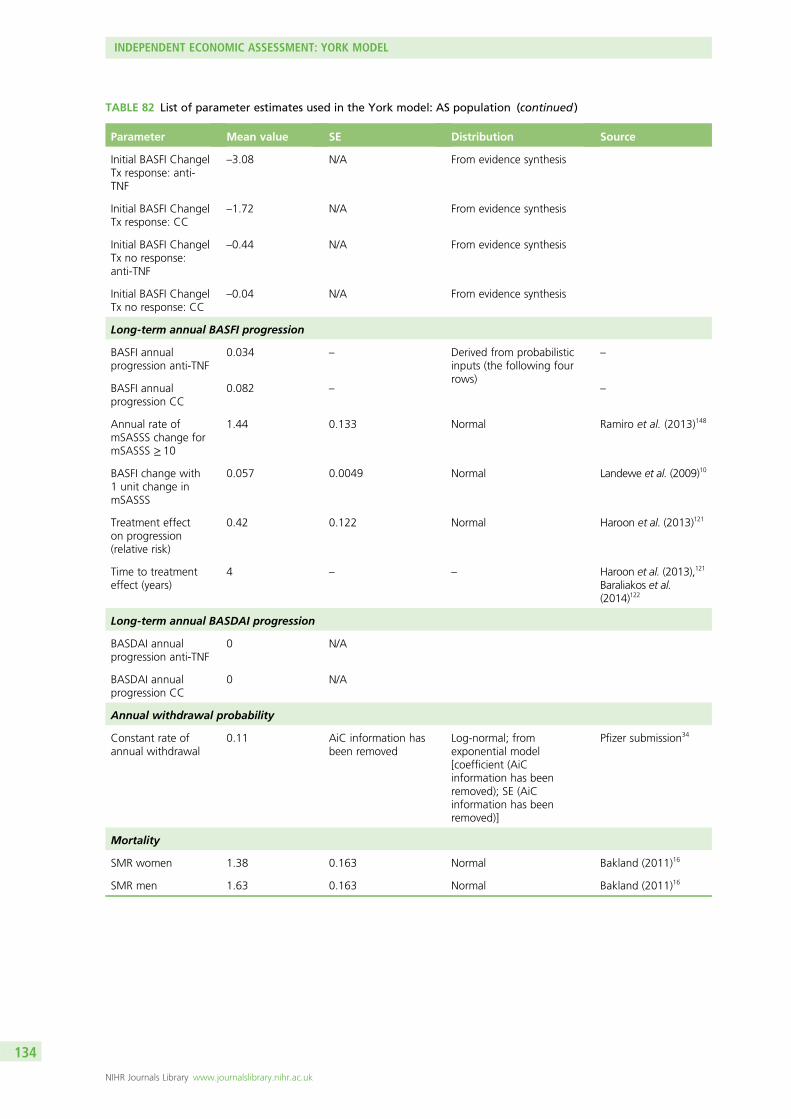
TABLE 82 List of parameter estimates used in the York model: AS population (continued )
Parameter Mean value SE Distribution Source
Initial BASFI Change|Tx response: anti-TNF
–3.08 N/A From evidence synthesis
Initial BASFI Change|Tx response: CC
–1.72 N/A From evidence synthesis
Initial BASFI Change|Tx no response:anti-TNF
–0.44 N/A From evidence synthesis
Initial BASFI Change|Tx no response: CC
–0.04 N/A From evidence synthesis
Long-term annual BASFI progression
BASFI annualprogression anti-TNF
0.034 – Derived from probabilisticinputs (the following fourrows)
–
BASFI annualprogression CC
0.082 – –
Annual rate ofmSASSS change formSASSS ≥ 10
1.44 0.133 Normal Ramiro et al. (2013)148
BASFI change with1 unit change inmSASSS
0.057 0.0049 Normal Landewe et al. (2009)10
Treatment effecton progression(relative risk)
0.42 0.122 Normal Haroon et al. (2013)121
Time to treatmenteffect (years)
4 – – Haroon et al. (2013),121
Baraliakos et al.(2014)122
Long-term annual BASDAI progression
BASDAI annualprogression anti-TNF
0 N/A
BASDAI annualprogression CC
0 N/A
Annual withdrawal probability
Constant rate ofannual withdrawal
0.11 AiC information hasbeen removed
Log-normal; fromexponential model[coefficient (AiCinformation has beenremoved); SE (AiCinformation has beenremoved)]
Pfizer submission34
Mortality
SMR women 1.38 0.163 Normal Bakland (2011)16
SMR men 1.63 0.163 Normal Bakland (2011)16
INDEPENDENT ECONOMIC ASSESSMENT: YORK MODEL
NIHR Journals Library www.journalslibrary.nihr.ac.uk
134
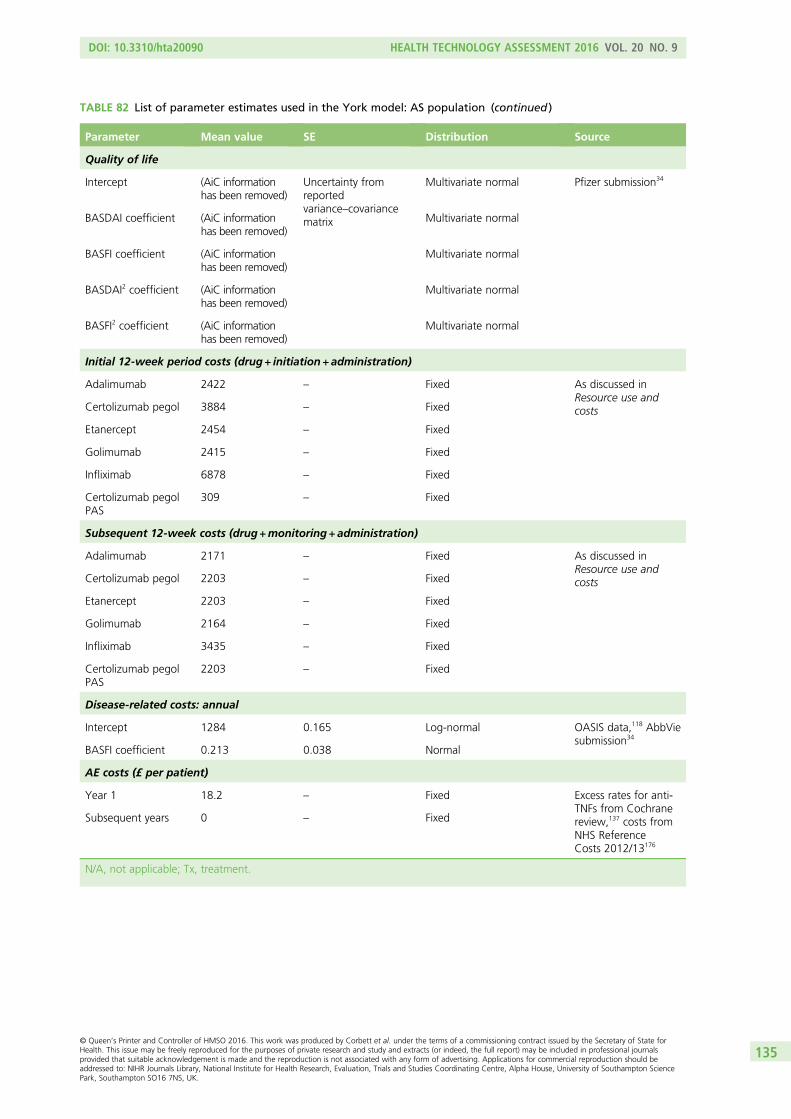
TABLE 82 List of parameter estimates used in the York model: AS population (continued )
Parameter Mean value SE Distribution Source
Quality of life
Intercept (AiC informationhas been removed)
Uncertainty fromreportedvariance–covariancematrix
Multivariate normal Pfizer submission34
BASDAI coefficient (AiC informationhas been removed)
Multivariate normal
BASFI coefficient (AiC informationhas been removed)
Multivariate normal
BASDAI2 coefficient (AiC informationhas been removed)
Multivariate normal
BASFI2 coefficient (AiC informationhas been removed)
Multivariate normal
Initial 12-week period costs (drug + initiation + administration)
Adalimumab 2422 – Fixed As discussed inResource use andcostsCertolizumab pegol 3884 – Fixed
Etanercept 2454 – Fixed
Golimumab 2415 – Fixed
Infliximab 6878 – Fixed
Certolizumab pegolPAS
309 – Fixed
Subsequent 12-week costs (drug +monitoring + administration)
Adalimumab 2171 – Fixed As discussed inResource use andcostsCertolizumab pegol 2203 – Fixed
Etanercept 2203 – Fixed
Golimumab 2164 – Fixed
Infliximab 3435 – Fixed
Certolizumab pegolPAS
2203 – Fixed
Disease-related costs: annual
Intercept 1284 0.165 Log-normal OASIS data,118 AbbViesubmission34
BASFI coefficient 0.213 0.038 Normal
AE costs (£ per patient)
Year 1 18.2 – Fixed Excess rates for anti-TNFs from Cochranereview,137 costs fromNHS ReferenceCosts 2012/13176
Subsequent years 0 – Fixed
N/A, not applicable; Tx, treatment.
DOI: 10.3310/hta20090 HEALTH TECHNOLOGY ASSESSMENT 2016 VOL. 20 NO. 9
© Queen’s Printer and Controller of HMSO 2016. This work was produced by Corbett et al. under the terms of a commissioning contract issued by the Secretary of State forHealth. This issue may be freely reproduced for the purposes of private research and study and extracts (or indeed, the full report) may be included in professional journalsprovided that suitable acknowledgement is made and the reproduction is not associated with any form of advertising. Applications for commercial reproduction should beaddressed to: NIHR Journals Library, National Institute for Health Research, Evaluation, Trials and Studies Coordinating Centre, Alpha House, University of Southampton SciencePark, Southampton SO16 7NS, UK.
135
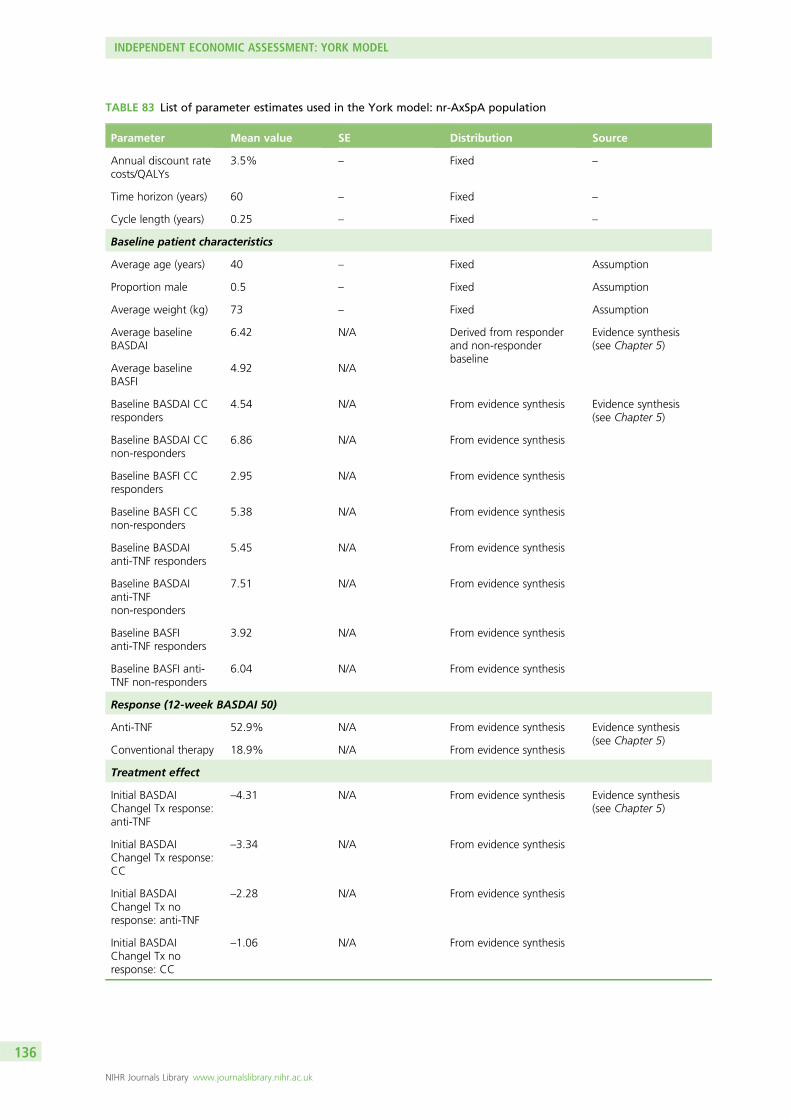
TABLE 83 List of parameter estimates used in the York model: nr-AxSpA population
Parameter Mean value SE Distribution Source
Annual discount ratecosts/QALYs
3.5% – Fixed –
Time horizon (years) 60 – Fixed –
Cycle length (years) 0.25 – Fixed –
Baseline patient characteristics
Average age (years) 40 – Fixed Assumption
Proportion male 0.5 – Fixed Assumption
Average weight (kg) 73 – Fixed Assumption
Average baselineBASDAI
6.42 N/A Derived from responderand non-responderbaseline
Evidence synthesis(see Chapter 5)
Average baselineBASFI
4.92 N/A
Baseline BASDAI CCresponders
4.54 N/A From evidence synthesis Evidence synthesis(see Chapter 5)
Baseline BASDAI CCnon-responders
6.86 N/A From evidence synthesis
Baseline BASFI CCresponders
2.95 N/A From evidence synthesis
Baseline BASFI CCnon-responders
5.38 N/A From evidence synthesis
Baseline BASDAIanti-TNF responders
5.45 N/A From evidence synthesis
Baseline BASDAIanti-TNFnon-responders
7.51 N/A From evidence synthesis
Baseline BASFIanti-TNF responders
3.92 N/A From evidence synthesis
Baseline BASFI anti-TNF non-responders
6.04 N/A From evidence synthesis
Response (12-week BASDAI 50)
Anti-TNF 52.9% N/A From evidence synthesis Evidence synthesis(see Chapter 5)
Conventional therapy 18.9% N/A From evidence synthesis
Treatment effect
Initial BASDAIChange| Tx response:anti-TNF
–4.31 N/A From evidence synthesis Evidence synthesis(see Chapter 5)
Initial BASDAIChange| Tx response:CC
–3.34 N/A From evidence synthesis
Initial BASDAIChange| Tx noresponse: anti-TNF
–2.28 N/A From evidence synthesis
Initial BASDAIChange| Tx noresponse: CC
–1.06 N/A From evidence synthesis
INDEPENDENT ECONOMIC ASSESSMENT: YORK MODEL
NIHR Journals Library www.journalslibrary.nihr.ac.uk
136
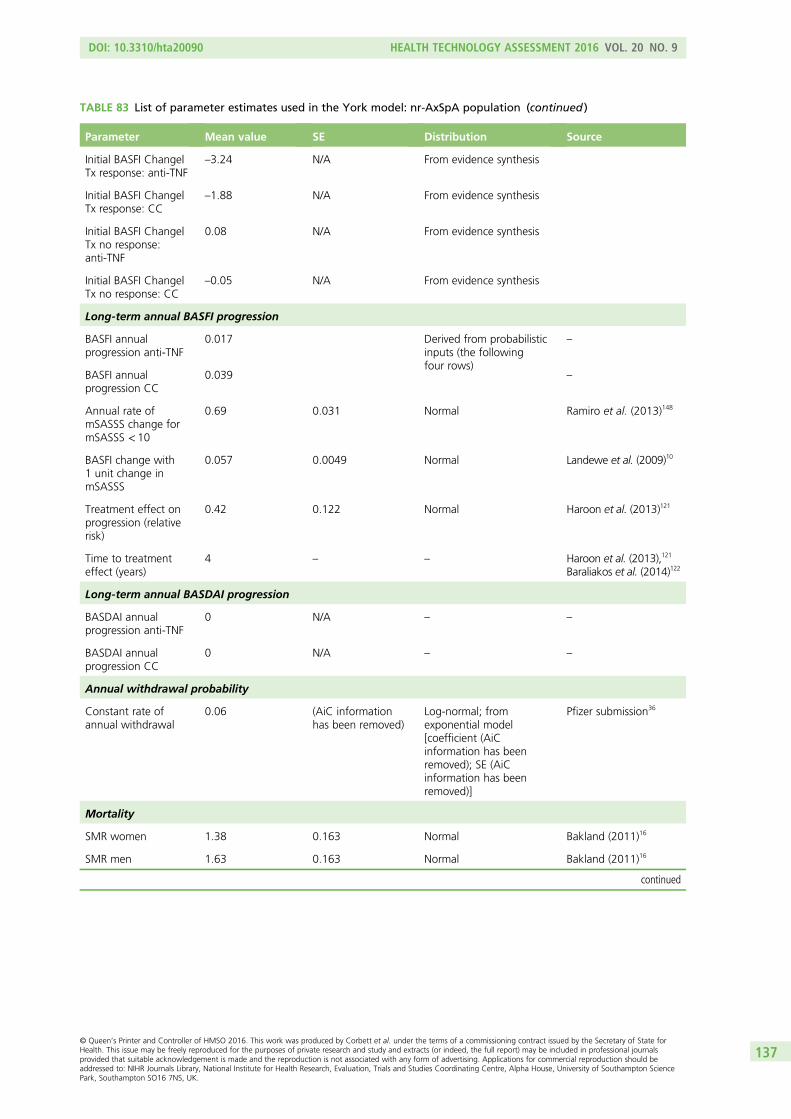
TABLE 83 List of parameter estimates used in the York model: nr-AxSpA population (continued )
Parameter Mean value SE Distribution Source
Initial BASFI Change|Tx response: anti-TNF
–3.24 N/A From evidence synthesis
Initial BASFI Change|Tx response: CC
–1.88 N/A From evidence synthesis
Initial BASFI Change|Tx no response:anti-TNF
0.08 N/A From evidence synthesis
Initial BASFI Change|Tx no response: CC
–0.05 N/A From evidence synthesis
Long-term annual BASFI progression
BASFI annualprogression anti-TNF
0.017 Derived from probabilisticinputs (the followingfour rows)
–
BASFI annualprogression CC
0.039 –
Annual rate ofmSASSS change formSASSS < 10
0.69 0.031 Normal Ramiro et al. (2013)148
BASFI change with1 unit change inmSASSS
0.057 0.0049 Normal Landewe et al. (2009)10
Treatment effect onprogression (relativerisk)
0.42 0.122 Normal Haroon et al. (2013)121
Time to treatmenteffect (years)
4 – – Haroon et al. (2013),121
Baraliakos et al. (2014)122
Long-term annual BASDAI progression
BASDAI annualprogression anti-TNF
0 N/A – –
BASDAI annualprogression CC
0 N/A – –
Annual withdrawal probability
Constant rate ofannual withdrawal
0.06 (AiC informationhas been removed)
Log-normal; fromexponential model[coefficient (AiCinformation has beenremoved); SE (AiCinformation has beenremoved)]
Pfizer submission36
Mortality
SMR women 1.38 0.163 Normal Bakland (2011)16
SMR men 1.63 0.163 Normal Bakland (2011)16
continued
DOI: 10.3310/hta20090 HEALTH TECHNOLOGY ASSESSMENT 2016 VOL. 20 NO. 9
© Queen’s Printer and Controller of HMSO 2016. This work was produced by Corbett et al. under the terms of a commissioning contract issued by the Secretary of State forHealth. This issue may be freely reproduced for the purposes of private research and study and extracts (or indeed, the full report) may be included in professional journalsprovided that suitable acknowledgement is made and the reproduction is not associated with any form of advertising. Applications for commercial reproduction should beaddressed to: NIHR Journals Library, National Institute for Health Research, Evaluation, Trials and Studies Coordinating Centre, Alpha House, University of Southampton SciencePark, Southampton SO16 7NS, UK.
137
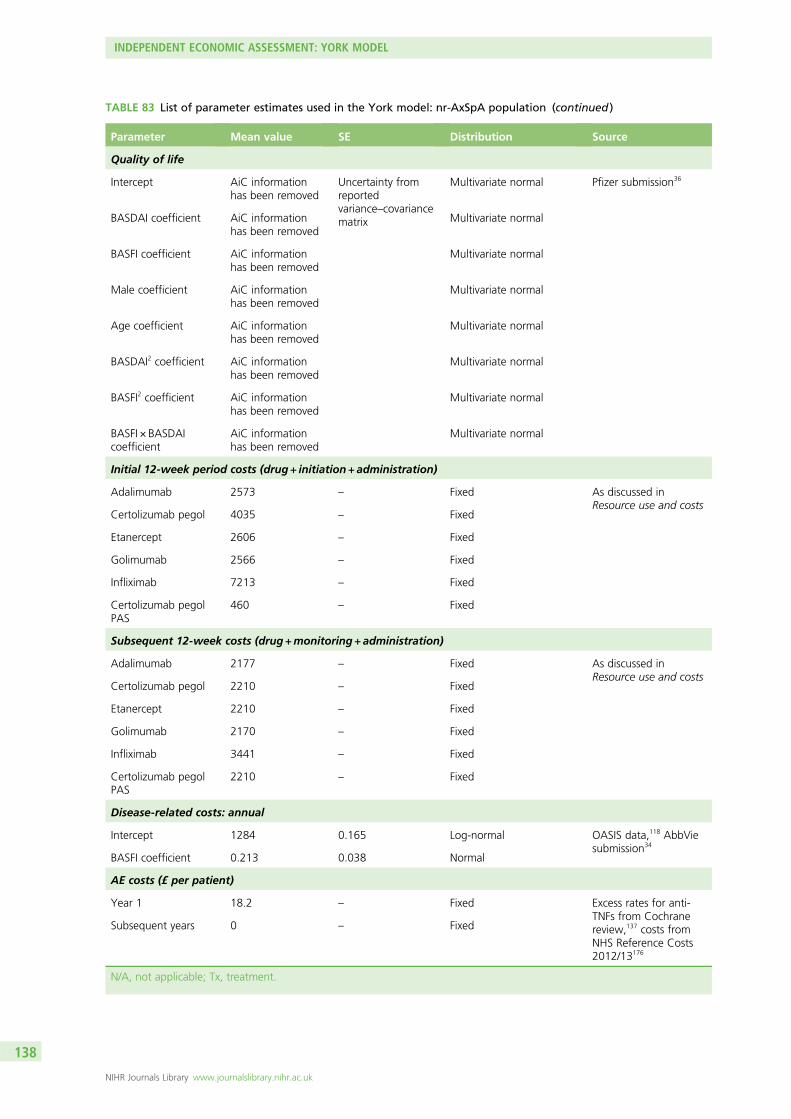
TABLE 83 List of parameter estimates used in the York model: nr-AxSpA population (continued )
Parameter Mean value SE Distribution Source
Quality of life
Intercept AiC informationhas been removed
Uncertainty fromreportedvariance–covariancematrix
Multivariate normal Pfizer submission36
BASDAI coefficient AiC informationhas been removed
Multivariate normal
BASFI coefficient AiC informationhas been removed
Multivariate normal
Male coefficient AiC informationhas been removed
Multivariate normal
Age coefficient AiC informationhas been removed
Multivariate normal
BASDAI2 coefficient AiC informationhas been removed
Multivariate normal
BASFI2 coefficient AiC informationhas been removed
Multivariate normal
BASFI × BASDAIcoefficient
AiC informationhas been removed
Multivariate normal
Initial 12-week period costs (drug + initiation + administration)
Adalimumab 2573 – Fixed As discussed inResource use and costs
Certolizumab pegol 4035 – Fixed
Etanercept 2606 – Fixed
Golimumab 2566 – Fixed
Infliximab 7213 – Fixed
Certolizumab pegolPAS
460 – Fixed
Subsequent 12-week costs (drug +monitoring + administration)
Adalimumab 2177 – Fixed As discussed inResource use and costs
Certolizumab pegol 2210 – Fixed
Etanercept 2210 – Fixed
Golimumab 2170 – Fixed
Infliximab 3441 – Fixed
Certolizumab pegolPAS
2210 – Fixed
Disease-related costs: annual
Intercept 1284 0.165 Log-normal OASIS data,118 AbbViesubmission34
BASFI coefficient 0.213 0.038 Normal
AE costs (£ per patient)
Year 1 18.2 – Fixed Excess rates for anti-TNFs from Cochranereview,137 costs fromNHS Reference Costs2012/13176
Subsequent years 0 – Fixed
N/A, not applicable; Tx, treatment.
INDEPENDENT ECONOMIC ASSESSMENT: YORK MODEL
NIHR Journals Library www.journalslibrary.nihr.ac.uk
138
Response, change in Bath Ankylosing Spondylitis Disease Activity Index/BathAnkylosing Spondylitis Functional Index and conditional baselinesThe BASDAI 50 response, the conditional change scores for BASDAI and BASFI at 12 weeks and theseparate conditional baselines estimated for BASDAI and BASFI (responders vs. non-responders) werederived directly from the results of the extended synthesis model reported in Chapter 5. In the base case,it was assumed that the percentage of BASDAI 50 responders, change in BASDAI/BASFI and conditionalbaselines were the same for all anti-TNFs. The outputs [CODA (Convergence Diagnostic and OutputAnalysis) file format] from the simulations were incorporated directly into the model to maintain correlationand to avoid any additional distributional assumptions.
Longer-term Bath Ankylosing Spondylitis Functional Index progressionAs previously highlighted in the overview section, the York model attempts to address some of theconceptual concerns outlined in Chapter 4 surrounding the assumptions applied within existing models inrelation to modelling BASFI progression over time. Specifically, we assume that BASFI is a function ofseparate processes which are independently related to disease severity/activity (BASDAI) and to the extentand subsequent progression of radiographic disease (mSASSS). The rationale for this is that the associationbetween BASDAI and BASFI is already accounted for in the separate mean change scores applied to bothBASDAI and BASFI for responders versus non-responders/CC patients. Differences in BASDAI are assumedto remain constant over the longer-term horizon (an assumption which is common across all models).Hence any additional changes which might affect BASFI need to be more explicitly related to a separateclinical process (or processes). Based on the studies included in the reviews reported in Chapter 3 fornatural history (see Review of natural history of ankylosing spondylitis and non-radiographic axialspondyloarthritis) and the effect on anti-TNFs on radiographic progression (see Effect of anti-tumournecrosis factors on radiographic progression), we modelled longer-term changes in BASFI (for CC andanti-TNFs) as a function of mSASSS scores.
The approach applied in the AS population is based on the following studies and assumptions:
1. The multivariate relationship reported in Landewe et al.,10 based on longitudinal assessments of BASFI,BASDAI and mSASSS, was used to estimate the independent effect of a 1-unit change in mSASSS onBASFI scores (mean 0.057 units, SE 0.0049 units).
2. Data from a 12-year prospective follow-up of the OASIS study was used to estimate the annual rate ofchange in mSASSS. Although at the individual level progression of mSASSS is highly variable, the studyby Ramiro et al.124 demonstrated that at a group level (i.e. akin to the cohort approach applied in theYork model) changes in mSASSS were stable, progressing at an annual rate of 0.98 mSASSS units peryear.125 Combining the estimates reported across the studies implies a change in BASFI of 0.056 unitsper annum (0–10 scale). However, as the population included in the study by Ramiro et al.124 includedpatients who would not be eligible to receive anti-TNFs, we used data in the subgroup of patients withbaseline mSASSS ≥ 10 units. The annual rate of mSASSS progression in this subgroup was 1.44 units(95% CI 1.18 to 1.70 units) per year with an implied annual BASFI score change of 0.082 units peryear. This compares with an annual change of BASFI score of between 0.056 and 0.07 units assumedacross the manufacturer’s submissions. The specific subgroup (mSASSS ≥ 10 units) was chosen toreflect that AS patients eligible to receive anti-TNFs are likely to be more similar to this subgroup thanthe entire cohort reported by Ramiro et al.124 This also provided a basis for differentiating between theAS and nr-AxSpA populations which is discussed in the following section.
Given the uncertainties noted in Chapter 3 (see Effect of anti-tumour necrosis factors on radiographicprogression), surrounding the effect of anti-TNFs on radiographic progression, we explored alternativescenarios in the decision model. In the base case, we assumed that the effect was related to theduration of therapy which has been reported in recent studies by Haroon et al.121 and Baraliakoset al.122 Both studies consistently reported evidence that the difference in mSASSS between patientswho received anti-TNFs and historical controls became different only in patients who had received
DOI: 10.3310/hta20090 HEALTH TECHNOLOGY ASSESSMENT 2016 VOL. 20 NO. 9
© Queen’s Printer and Controller of HMSO 2016. This work was produced by Corbett et al. under the terms of a commissioning contract issued by the Secretary of State forHealth. This issue may be freely reproduced for the purposes of private research and study and extracts (or indeed, the full report) may be included in professional journalsprovided that suitable acknowledgement is made and the reproduction is not associated with any form of advertising. Applications for commercial reproduction should beaddressed to: NIHR Journals Library, National Institute for Health Research, Evaluation, Trials and Studies Coordinating Centre, Alpha House, University of Southampton SciencePark, Southampton SO16 7NS, UK.
139
treatment for approximately 4 years or more. In the absence of any relative-effect measure reportedby Baraliakos et al.,122 we used results reported by Haroon et al.121 applying a zero-inflated binomialmodel with a relative rate of mSASSS change of 0.42 units (95% CI 0.18 to 0.98 units). Hence, in themodel, no effect on mSASSS was assumed until year 4 of the model and then only applied to patientswho continued to receive therapy beyond this period.
3. Given the inherent uncertainties regarding the effect of anti-TNFs on radiographic progression weexplored alternative scenarios based on (1) an assumption of no impact on radiographic progression;and (2) an immediate effect, applying the estimate of 0.42 from the outset.
For the nr-AxSpA population, we assume a similar underlying clinical process relating to BASFI but modelseparate BASFI processes for patients depending upon the probability of developing radiographic diseaseover time and thereafter modelling the extent and progression of radiographic disease via mSASSSchanges. Hence, our intention in the nr-AxSpA model was to employ a constant BASFI score (on andoff treatment) until a patient develops radiographic progression. At the time point of ‘progression’ anincreasing BASFI would be assumed using a similar approach applied to the AS population. However,programming the additional transition to allow separate BASFI progression estimates based on the time ofprogression (and time since progression for patients who had previously progressed) proved more complexthan anticipated. Consequently, a more simplified assumption was made such that all patients wereassumed to incur progression in BASFI albeit at a lower rate relative to the AS population.
The approach we intended to apply in the nr-AxSpA population was based on the following studiesand assumptions:
1. Poddubnyy et al.155 is used to estimate the probability of nr-AxSpA patients progressing to radiographicdisease based on the outcome ‘% progressed by ≥ 2 mSASSS over 2 years’ (7.4%) reported. Theseestimates are converted into a rate to estimate the cycle-specific probability.Following progression, the mSASSS scores of patients are subsequently assumed to increase at a rate of0.69 units (95% CI 0.63 to 0.75 units) per year, based on the subgroup of patients with baselinemSASSS < 10 reported by Ramiro et al.148 BASFI is assumed to remain constant for patients who do notprogress in each cycle of the model.The same results reported by Haroon et al.,121 applying a zero-inflated binomial model with a relativerate of mSASSS change of 0.42 units (95% CI 0.18 to 0.98 units), were applied to the mSASSS scoresfor patients who progressed to estimate the treatment effect of anti-TNFs. Hence, in common with theAS model, no effect on mSASSS was assumed until year 4 and then it was only applied to patients whocontinued to receive therapy beyond this period.
2. Given the inherent uncertainties regarding the effect of anti-TNFs on radiographic progression weexplored alternative scenarios based on (1) an assumption of no impact on radiographic progressionand (2) an immediate effect – applying the estimate of 0.42 from the outset. We also considered anexploratory scenario where we assumed no radiographic progression for nr-AxSpA for patients receivinganti-TNFs, to investigate the untested hypothesis that early intervention in patients, prior to establishedradiographic disease, might halt subsequent progression.
Given the additional programming challenges that could not be overcome within the remaining time andfunding constraints, the mSASSS scores of all nr-AxSpA patients were assumed to increase at the rate of0.69 units per year. Hence the subsequent results reported for the nr-AxSpA population are potentiallyoptimistic, as not all patients will develop radiographic progression. However, the use of mSASSS in thiscontext inevitably represents an uncertain proxy process for BASFI changes. Further, it should also be notedthat the BASFI trajectory of nr-AxSpA patients has been reported in publications to be similar to early ASpatients.177 Consequently, applying the change in mSASSS reported in the subgroup of patients withbaseline mSASSS < 10 reported by Ramiro et al.148 may not be an unreasonable proxy for the purposes ofpredicting future changes in BASFI over longer periods.
INDEPENDENT ECONOMIC ASSESSMENT: YORK MODEL
NIHR Journals Library www.journalslibrary.nihr.ac.uk
140
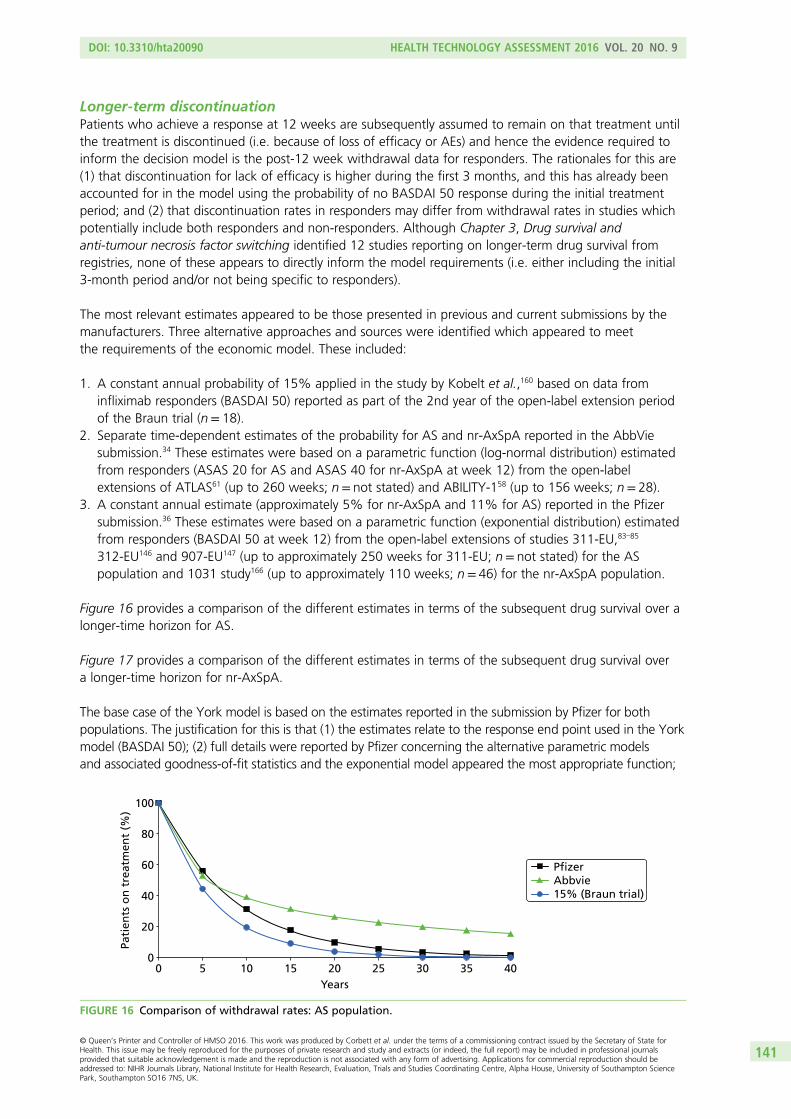
Longer-term discontinuationPatients who achieve a response at 12 weeks are subsequently assumed to remain on that treatment untilthe treatment is discontinued (i.e. because of loss of efficacy or AEs) and hence the evidence required toinform the decision model is the post-12 week withdrawal data for responders. The rationales for this are(1) that discontinuation for lack of efficacy is higher during the first 3 months, and this has already beenaccounted for in the model using the probability of no BASDAI 50 response during the initial treatmentperiod; and (2) that discontinuation rates in responders may differ from withdrawal rates in studies whichpotentially include both responders and non-responders. Although Chapter 3, Drug survival andanti-tumour necrosis factor switching identified 12 studies reporting on longer-term drug survival fromregistries, none of these appears to directly inform the model requirements (i.e. either including the initial3-month period and/or not being specific to responders).
The most relevant estimates appeared to be those presented in previous and current submissions by themanufacturers. Three alternative approaches and sources were identified which appeared to meetthe requirements of the economic model. These included:
1. A constant annual probability of 15% applied in the study by Kobelt et al.,160 based on data frominfliximab responders (BASDAI 50) reported as part of the 2nd year of the open-label extension periodof the Braun trial (n= 18).
2. Separate time-dependent estimates of the probability for AS and nr-AxSpA reported in the AbbViesubmission.34 These estimates were based on a parametric function (log-normal distribution) estimatedfrom responders (ASAS 20 for AS and ASAS 40 for nr-AxSpA at week 12) from the open-labelextensions of ATLAS61 (up to 260 weeks; n= not stated) and ABILITY-158 (up to 156 weeks; n= 28).
3. A constant annual estimate (approximately 5% for nr-AxSpA and 11% for AS) reported in the Pfizersubmission.36 These estimates were based on a parametric function (exponential distribution) estimatedfrom responders (BASDAI 50 at week 12) from the open-label extensions of studies 311-EU,83–85
312-EU146 and 907-EU147 (up to approximately 250 weeks for 311-EU; n= not stated) for the ASpopulation and 1031 study166 (up to approximately 110 weeks; n= 46) for the nr-AxSpA population.
Figure 16 provides a comparison of the different estimates in terms of the subsequent drug survival over alonger-time horizon for AS.
Figure 17 provides a comparison of the different estimates in terms of the subsequent drug survival overa longer-time horizon for nr-AxSpA.
The base case of the York model is based on the estimates reported in the submission by Pfizer for bothpopulations. The justification for this is that (1) the estimates relate to the response end point used in the Yorkmodel (BASDAI 50); (2) full details were reported by Pfizer concerning the alternative parametric modelsand associated goodness-of-fit statistics and the exponential model appeared the most appropriate function;
00
20
40
60
80
100
5 10 15 20 25 30 35 40Years
Pati
ents
on
tre
atm
ent
(%)
PfizerAbbvie15% (Braun trial)
FIGURE 16 Comparison of withdrawal rates: AS population.
DOI: 10.3310/hta20090 HEALTH TECHNOLOGY ASSESSMENT 2016 VOL. 20 NO. 9
© Queen’s Printer and Controller of HMSO 2016. This work was produced by Corbett et al. under the terms of a commissioning contract issued by the Secretary of State forHealth. This issue may be freely reproduced for the purposes of private research and study and extracts (or indeed, the full report) may be included in professional journalsprovided that suitable acknowledgement is made and the reproduction is not associated with any form of advertising. Applications for commercial reproduction should beaddressed to: NIHR Journals Library, National Institute for Health Research, Evaluation, Trials and Studies Coordinating Centre, Alpha House, University of Southampton SciencePark, Southampton SO16 7NS, UK.
141
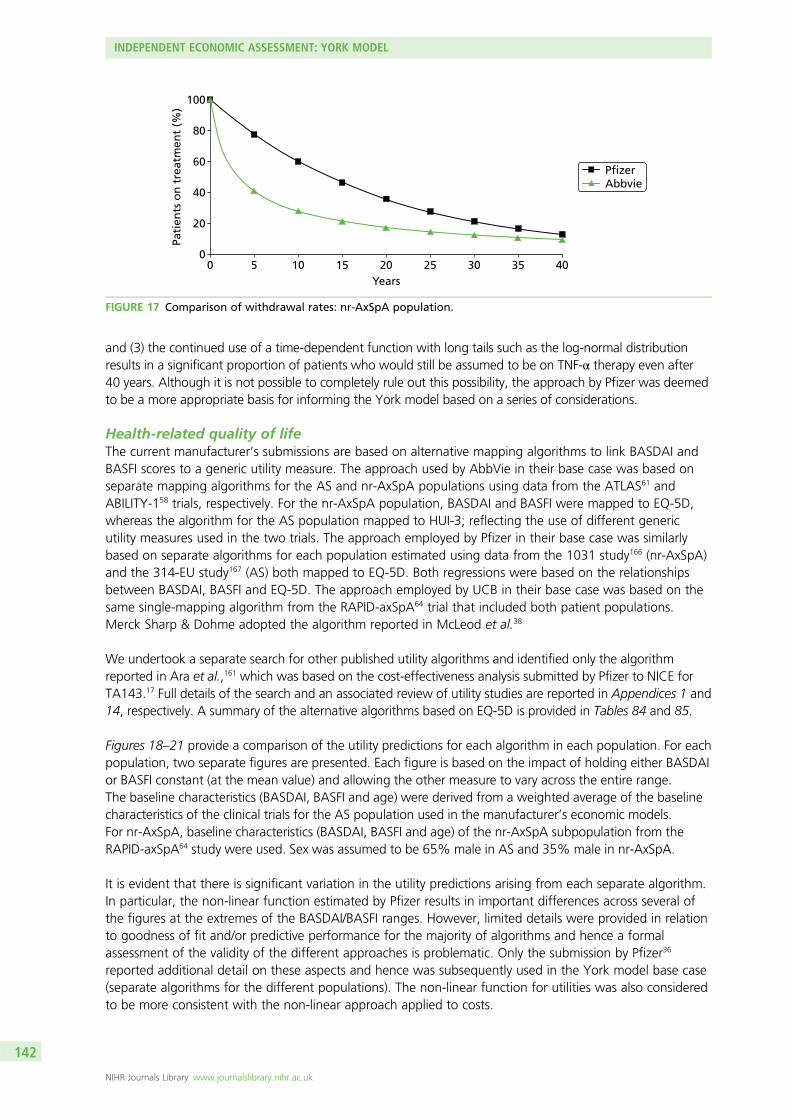
and (3) the continued use of a time-dependent function with long tails such as the log-normal distributionresults in a significant proportion of patients who would still be assumed to be on TNF-α therapy even after40 years. Although it is not possible to completely rule out this possibility, the approach by Pfizer was deemedto be a more appropriate basis for informing the York model based on a series of considerations.
Health-related quality of lifeThe current manufacturer’s submissions are based on alternative mapping algorithms to link BASDAI andBASFI scores to a generic utility measure. The approach used by AbbVie in their base case was based onseparate mapping algorithms for the AS and nr-AxSpA populations using data from the ATLAS61 andABILITY-158 trials, respectively. For the nr-AxSpA population, BASDAI and BASFI were mapped to EQ-5D,whereas the algorithm for the AS population mapped to HUI-3; reflecting the use of different genericutility measures used in the two trials. The approach employed by Pfizer in their base case was similarlybased on separate algorithms for each population estimated using data from the 1031 study166 (nr-AxSpA)and the 314-EU study167 (AS) both mapped to EQ-5D. Both regressions were based on the relationshipsbetween BASDAI, BASFI and EQ-5D. The approach employed by UCB in their base case was based on thesame single-mapping algorithm from the RAPID-axSpA64 trial that included both patient populations.Merck Sharp & Dohme adopted the algorithm reported in McLeod et al.38
We undertook a separate search for other published utility algorithms and identified only the algorithmreported in Ara et al.,161 which was based on the cost-effectiveness analysis submitted by Pfizer to NICE forTA143.17 Full details of the search and an associated review of utility studies are reported in Appendices 1 and14, respectively. A summary of the alternative algorithms based on EQ-5D is provided in Tables 84 and 85.
Figures 18–21 provide a comparison of the utility predictions for each algorithm in each population. For eachpopulation, two separate figures are presented. Each figure is based on the impact of holding either BASDAIor BASFI constant (at the mean value) and allowing the other measure to vary across the entire range.The baseline characteristics (BASDAI, BASFI and age) were derived from a weighted average of the baselinecharacteristics of the clinical trials for the AS population used in the manufacturer’s economic models.For nr-AxSpA, baseline characteristics (BASDAI, BASFI and age) of the nr-AxSpA subpopulation from theRAPID-axSpA64 study were used. Sex was assumed to be 65% male in AS and 35% male in nr-AxSpA.
It is evident that there is significant variation in the utility predictions arising from each separate algorithm.In particular, the non-linear function estimated by Pfizer results in important differences across several ofthe figures at the extremes of the BASDAI/BASFI ranges. However, limited details were provided in relationto goodness of fit and/or predictive performance for the majority of algorithms and hence a formalassessment of the validity of the different approaches is problematic. Only the submission by Pfizer36
reported additional detail on these aspects and hence was subsequently used in the York model base case(separate algorithms for the different populations). The non-linear function for utilities was also consideredto be more consistent with the non-linear approach applied to costs.
00
20
40
60
80
100
5 10 15 20 25 30 35 40Years
Pati
ents
on
tre
atm
ent
(%)
PfizerAbbvie
FIGURE 17 Comparison of withdrawal rates: nr-AxSpA population.
INDEPENDENT ECONOMIC ASSESSMENT: YORK MODEL
NIHR Journals Library www.journalslibrary.nihr.ac.uk
142
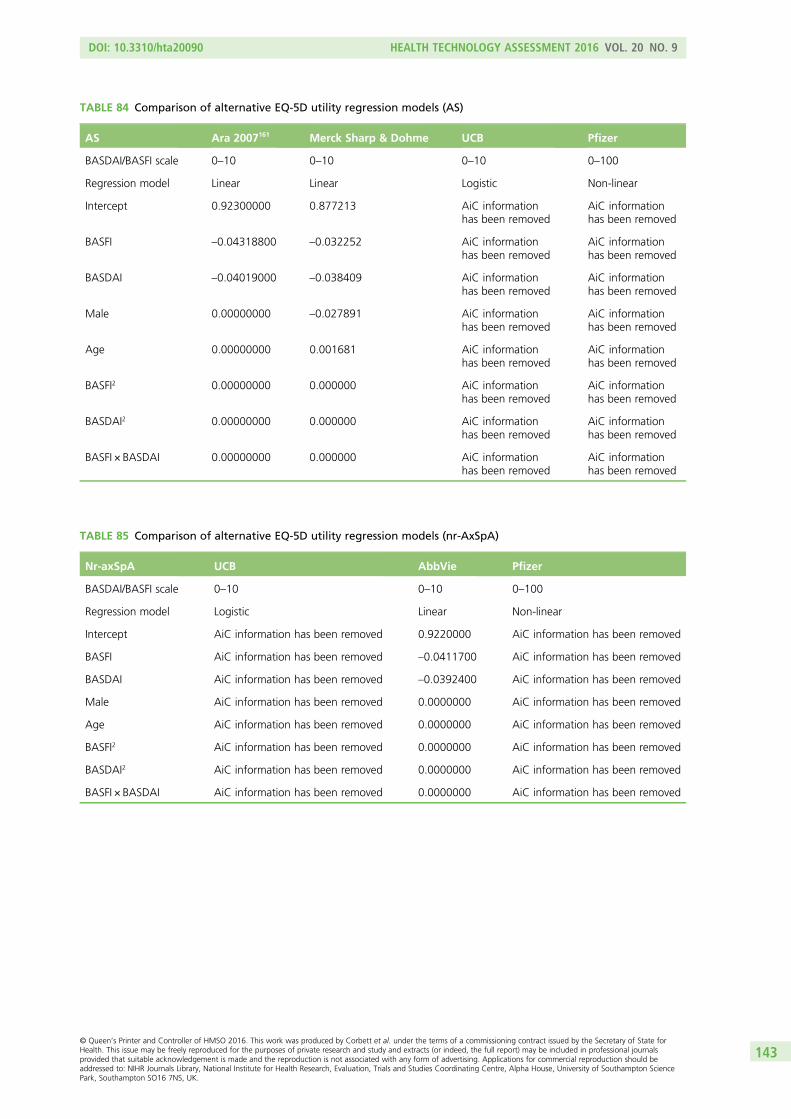
TABLE 84 Comparison of alternative EQ-5D utility regression models (AS)
AS Ara 2007161 Merck Sharp & Dohme UCB Pfizer
BASDAI/BASFI scale 0–10 0–10 0–10 0–100
Regression model Linear Linear Logistic Non-linear
Intercept 0.92300000 0.877213 AiC informationhas been removed
AiC informationhas been removed
BASFI –0.04318800 –0.032252 AiC informationhas been removed
AiC informationhas been removed
BASDAI –0.04019000 –0.038409 AiC informationhas been removed
AiC informationhas been removed
Male 0.00000000 –0.027891 AiC informationhas been removed
AiC informationhas been removed
Age 0.00000000 0.001681 AiC informationhas been removed
AiC informationhas been removed
BASFI2 0.00000000 0.000000 AiC informationhas been removed
AiC informationhas been removed
BASDAI2 0.00000000 0.000000 AiC informationhas been removed
AiC informationhas been removed
BASFI × BASDAI 0.00000000 0.000000 AiC informationhas been removed
AiC informationhas been removed
TABLE 85 Comparison of alternative EQ-5D utility regression models (nr-AxSpA)
Nr-axSpA UCB AbbVie Pfizer
BASDAI/BASFI scale 0–10 0–10 0–100
Regression model Logistic Linear Non-linear
Intercept AiC information has been removed 0.9220000 AiC information has been removed
BASFI AiC information has been removed –0.0411700 AiC information has been removed
BASDAI AiC information has been removed –0.0392400 AiC information has been removed
Male AiC information has been removed 0.0000000 AiC information has been removed
Age AiC information has been removed 0.0000000 AiC information has been removed
BASFI2 AiC information has been removed 0.0000000 AiC information has been removed
BASDAI2 AiC information has been removed 0.0000000 AiC information has been removed
BASFI × BASDAI AiC information has been removed 0.0000000 AiC information has been removed
DOI: 10.3310/hta20090 HEALTH TECHNOLOGY ASSESSMENT 2016 VOL. 20 NO. 9
© Queen’s Printer and Controller of HMSO 2016. This work was produced by Corbett et al. under the terms of a commissioning contract issued by the Secretary of State forHealth. This issue may be freely reproduced for the purposes of private research and study and extracts (or indeed, the full report) may be included in professional journalsprovided that suitable acknowledgement is made and the reproduction is not associated with any form of advertising. Applications for commercial reproduction should beaddressed to: NIHR Journals Library, National Institute for Health Research, Evaluation, Trials and Studies Coordinating Centre, Alpha House, University of Southampton SciencePark, Southampton SO16 7NS, UK.
143
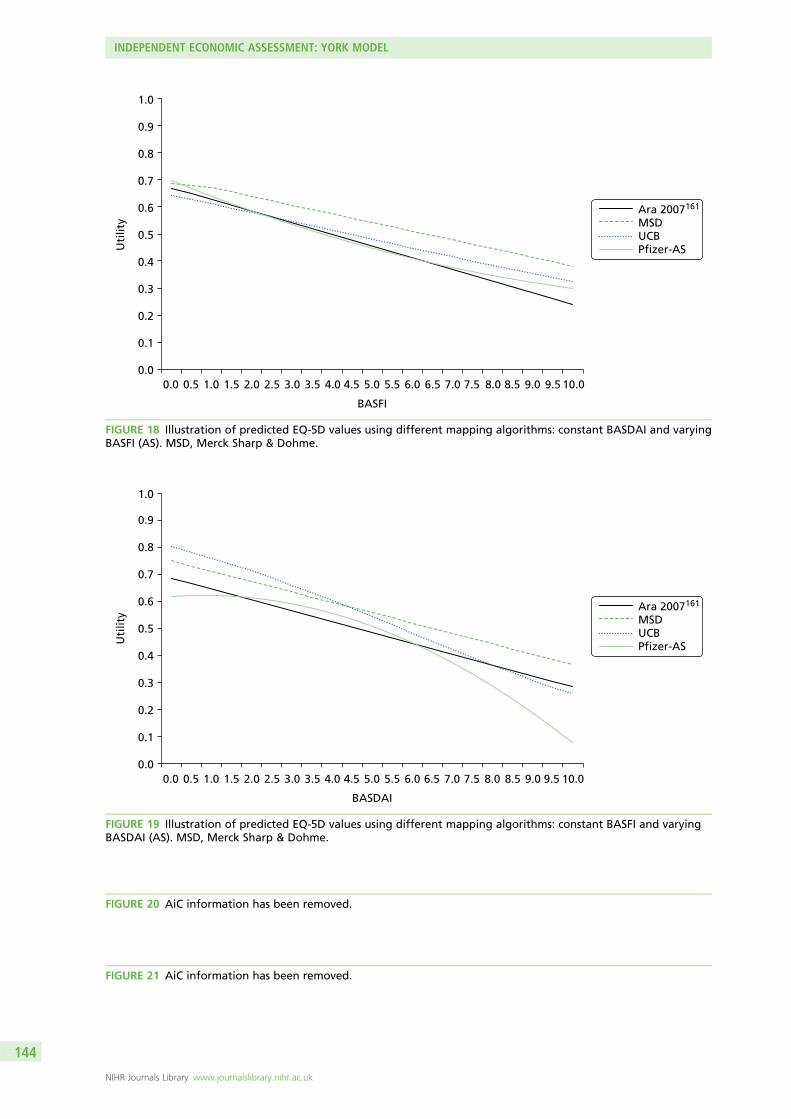
0.0
0.1
0.2
0.3
0.4
0.5
0.6
0.7
0.8
0.9
1.0
0.0 0.5 1.0 1.5 2.0 2.5 3.0 3.5 4.0 4.5 5.0 5.5 6.0 6.5 7.0 7.5 8.0 8.5 9.0 9.5 10.0
Uti
lity
BASFI
Ara 2007161
MSDUCBPfizer-AS
FIGURE 18 Illustration of predicted EQ-5D values using different mapping algorithms: constant BASDAI and varyingBASFI (AS). MSD, Merck Sharp & Dohme.
0.0 0.5 1.0 1.5 2.0 2.5 3.0 3.5 4.0 4.5 5.0 5.5 6.0 6.5 7.0 7.5 8.0 8.5 9.0 9.5 10.0
BASDAI
0.0
0.1
0.2
0.3
0.4
0.5
0.6
0.7
0.8
0.9
1.0
Uti
lity
Ara 2007161
MSDUCBPfizer-AS
FIGURE 19 Illustration of predicted EQ-5D values using different mapping algorithms: constant BASFI and varyingBASDAI (AS). MSD, Merck Sharp & Dohme.
FIGURE 20 AiC information has been removed.
FIGURE 21 AiC information has been removed.
INDEPENDENT ECONOMIC ASSESSMENT: YORK MODEL
NIHR Journals Library www.journalslibrary.nihr.ac.uk
144
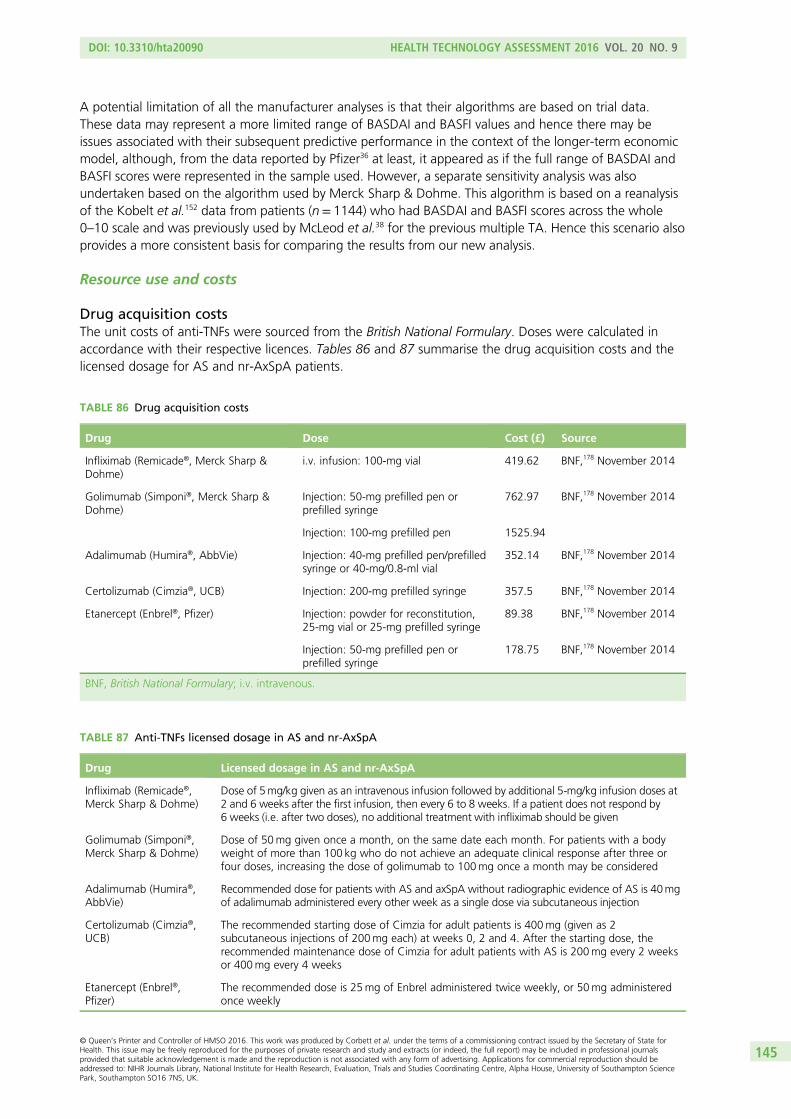
A potential limitation of all the manufacturer analyses is that their algorithms are based on trial data.These data may represent a more limited range of BASDAI and BASFI values and hence there may beissues associated with their subsequent predictive performance in the context of the longer-term economicmodel, although, from the data reported by Pfizer36 at least, it appeared as if the full range of BASDAI andBASFI scores were represented in the sample used. However, a separate sensitivity analysis was alsoundertaken based on the algorithm used by Merck Sharp & Dohme. This algorithm is based on a reanalysisof the Kobelt et al.152 data from patients (n= 1144) who had BASDAI and BASFI scores across the whole0–10 scale and was previously used by McLeod et al.38 for the previous multiple TA. Hence this scenario alsoprovides a more consistent basis for comparing the results from our new analysis.
Resource use and costs
Drug acquisition costsThe unit costs of anti-TNFs were sourced from the British National Formulary. Doses were calculated inaccordance with their respective licences. Tables 86 and 87 summarise the drug acquisition costs and thelicensed dosage for AS and nr-AxSpA patients.
TABLE 87 Anti-TNFs licensed dosage in AS and nr-AxSpA
Drug Licensed dosage in AS and nr-AxSpA
Infliximab (Remicade®,Merck Sharp & Dohme)
Dose of 5mg/kg given as an intravenous infusion followed by additional 5-mg/kg infusion doses at2 and 6 weeks after the first infusion, then every 6 to 8 weeks. If a patient does not respond by6 weeks (i.e. after two doses), no additional treatment with infliximab should be given
Golimumab (Simponi®,Merck Sharp & Dohme)
Dose of 50mg given once a month, on the same date each month. For patients with a bodyweight of more than 100 kg who do not achieve an adequate clinical response after three orfour doses, increasing the dose of golimumab to 100mg once a month may be considered
Adalimumab (Humira®,AbbVie)
Recommended dose for patients with AS and axSpA without radiographic evidence of AS is 40mgof adalimumab administered every other week as a single dose via subcutaneous injection
Certolizumab (Cimzia®,UCB)
The recommended starting dose of Cimzia for adult patients is 400mg (given as 2subcutaneous injections of 200mg each) at weeks 0, 2 and 4. After the starting dose, therecommended maintenance dose of Cimzia for adult patients with AS is 200mg every 2 weeksor 400mg every 4 weeks
Etanercept (Enbrel®,Pfizer)
The recommended dose is 25mg of Enbrel administered twice weekly, or 50mg administeredonce weekly
TABLE 86 Drug acquisition costs
Drug Dose Cost (£) Source
Infliximab (Remicade®, Merck Sharp &Dohme)
i.v. infusion: 100-mg vial 419.62 BNF,178 November 2014
Golimumab (Simponi®, Merck Sharp &Dohme)
Injection: 50-mg prefilled pen orprefilled syringe
762.97 BNF,178 November 2014
Injection: 100-mg prefilled pen 1525.94
Adalimumab (Humira®, AbbVie) Injection: 40-mg prefilled pen/prefilledsyringe or 40-mg/0.8-ml vial
352.14 BNF,178 November 2014
Certolizumab (Cimzia®, UCB) Injection: 200-mg prefilled syringe 357.5 BNF,178 November 2014
Etanercept (Enbrel®, Pfizer) Injection: powder for reconstitution,25-mg vial or 25-mg prefilled syringe
89.38 BNF,178 November 2014
Injection: 50-mg prefilled pen orprefilled syringe
178.75 BNF,178 November 2014
BNF, British National Formulary; i.v. intravenous.
DOI: 10.3310/hta20090 HEALTH TECHNOLOGY ASSESSMENT 2016 VOL. 20 NO. 9
© Queen’s Printer and Controller of HMSO 2016. This work was produced by Corbett et al. under the terms of a commissioning contract issued by the Secretary of State forHealth. This issue may be freely reproduced for the purposes of private research and study and extracts (or indeed, the full report) may be included in professional journalsprovided that suitable acknowledgement is made and the reproduction is not associated with any form of advertising. Applications for commercial reproduction should beaddressed to: NIHR Journals Library, National Institute for Health Research, Evaluation, Trials and Studies Coordinating Centre, Alpha House, University of Southampton SciencePark, Southampton SO16 7NS, UK.
145
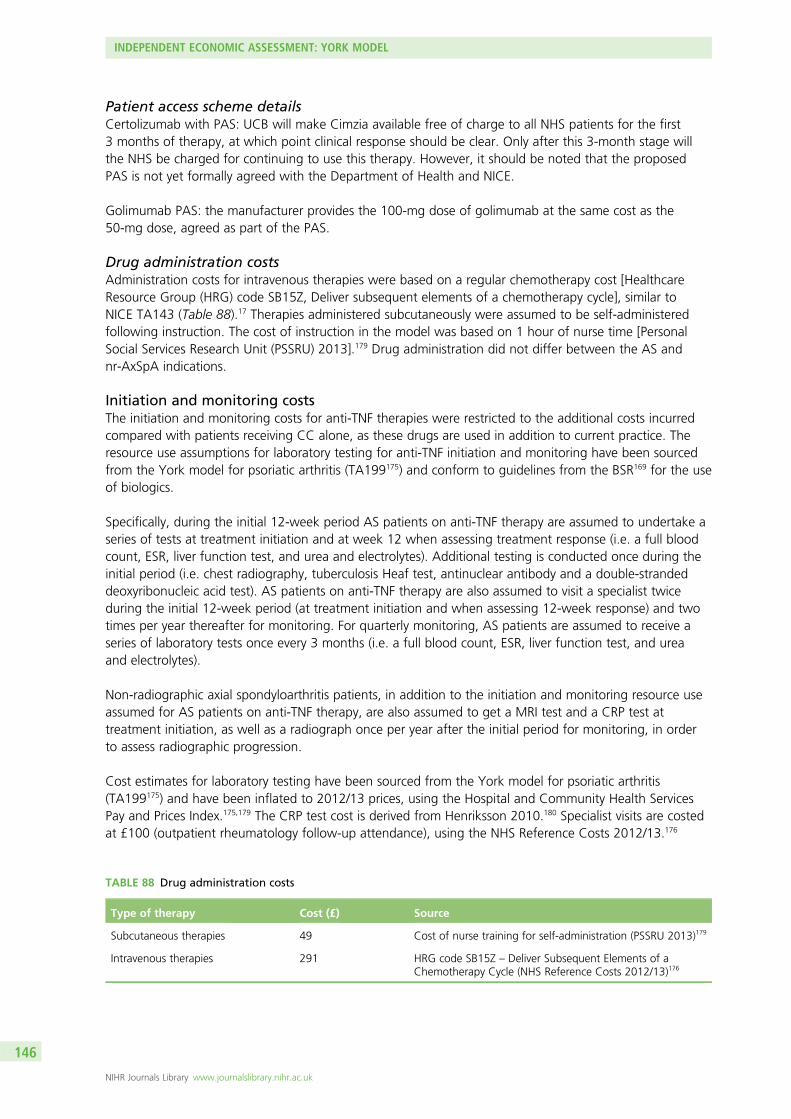
Patient access scheme detailsCertolizumab with PAS: UCB will make Cimzia available free of charge to all NHS patients for the first3 months of therapy, at which point clinical response should be clear. Only after this 3-month stage willthe NHS be charged for continuing to use this therapy. However, it should be noted that the proposedPAS is not yet formally agreed with the Department of Health and NICE.
Golimumab PAS: the manufacturer provides the 100-mg dose of golimumab at the same cost as the50-mg dose, agreed as part of the PAS.
Drug administration costsAdministration costs for intravenous therapies were based on a regular chemotherapy cost [HealthcareResource Group (HRG) code SB15Z, Deliver subsequent elements of a chemotherapy cycle], similar toNICE TA143 (Table 88).17 Therapies administered subcutaneously were assumed to be self-administeredfollowing instruction. The cost of instruction in the model was based on 1 hour of nurse time [PersonalSocial Services Research Unit (PSSRU) 2013].179 Drug administration did not differ between the AS andnr-AxSpA indications.
Initiation and monitoring costsThe initiation and monitoring costs for anti-TNF therapies were restricted to the additional costs incurredcompared with patients receiving CC alone, as these drugs are used in addition to current practice. Theresource use assumptions for laboratory testing for anti-TNF initiation and monitoring have been sourcedfrom the York model for psoriatic arthritis (TA199175) and conform to guidelines from the BSR169 for the useof biologics.
Specifically, during the initial 12-week period AS patients on anti-TNF therapy are assumed to undertake aseries of tests at treatment initiation and at week 12 when assessing treatment response (i.e. a full bloodcount, ESR, liver function test, and urea and electrolytes). Additional testing is conducted once during theinitial period (i.e. chest radiography, tuberculosis Heaf test, antinuclear antibody and a double-strandeddeoxyribonucleic acid test). AS patients on anti-TNF therapy are also assumed to visit a specialist twiceduring the initial 12-week period (at treatment initiation and when assessing 12-week response) and twotimes per year thereafter for monitoring. For quarterly monitoring, AS patients are assumed to receive aseries of laboratory tests once every 3 months (i.e. a full blood count, ESR, liver function test, and ureaand electrolytes).
Non-radiographic axial spondyloarthritis patients, in addition to the initiation and monitoring resource useassumed for AS patients on anti-TNF therapy, are also assumed to get a MRI test and a CRP test attreatment initiation, as well as a radiograph once per year after the initial period for monitoring, in orderto assess radiographic progression.
Cost estimates for laboratory testing have been sourced from the York model for psoriatic arthritis(TA199175) and have been inflated to 2012/13 prices, using the Hospital and Community Health ServicesPay and Prices Index.175,179 The CRP test cost is derived from Henriksson 2010.180 Specialist visits are costedat £100 (outpatient rheumatology follow-up attendance), using the NHS Reference Costs 2012/13.176
TABLE 88 Drug administration costs
Type of therapy Cost (£) Source
Subcutaneous therapies 49 Cost of nurse training for self-administration (PSSRU 2013)179
Intravenous therapies 291 HRG code SB15Z – Deliver Subsequent Elements of aChemotherapy Cycle (NHS Reference Costs 2012/13)176
INDEPENDENT ECONOMIC ASSESSMENT: YORK MODEL
NIHR Journals Library www.journalslibrary.nihr.ac.uk
146
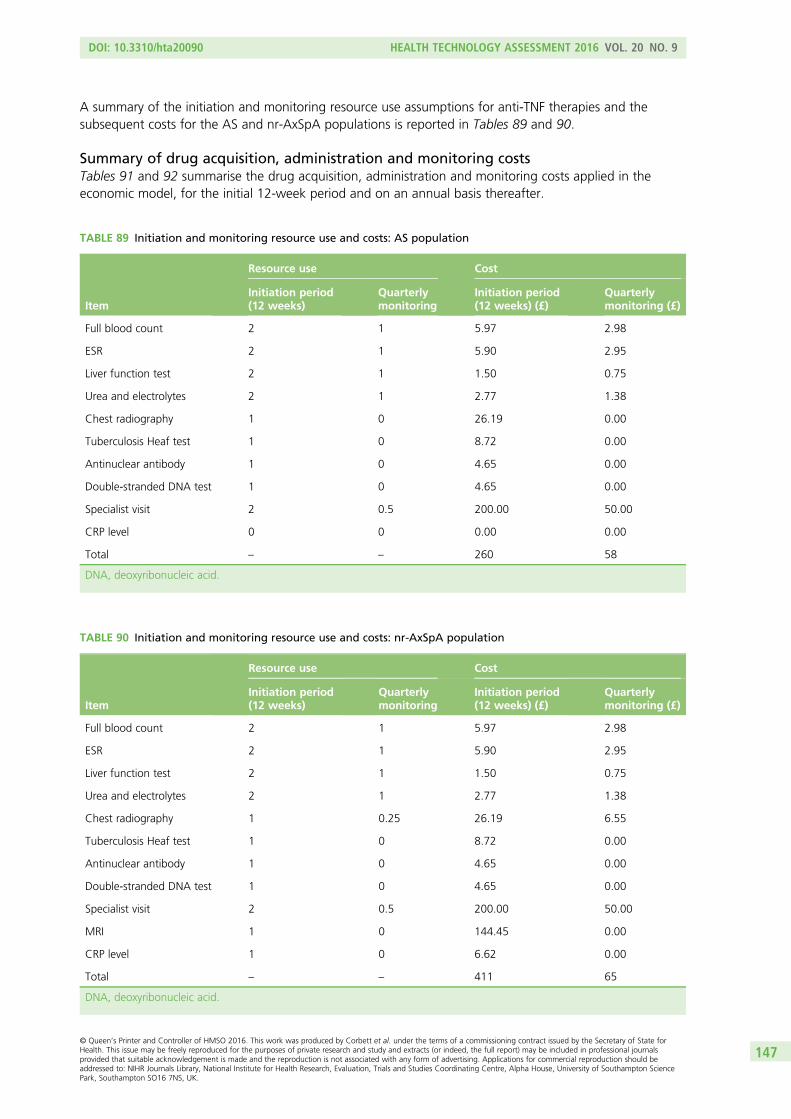
A summary of the initiation and monitoring resource use assumptions for anti-TNF therapies and thesubsequent costs for the AS and nr-AxSpA populations is reported in Tables 89 and 90.
Summary of drug acquisition, administration and monitoring costsTables 91 and 92 summarise the drug acquisition, administration and monitoring costs applied in theeconomic model, for the initial 12-week period and on an annual basis thereafter.
TABLE 90 Initiation and monitoring resource use and costs: nr-AxSpA population
Item
Resource use Cost
Initiation period(12 weeks)
Quarterlymonitoring
Initiation period(12 weeks) (£)
Quarterlymonitoring (£)
Full blood count 2 1 5.97 2.98
ESR 2 1 5.90 2.95
Liver function test 2 1 1.50 0.75
Urea and electrolytes 2 1 2.77 1.38
Chest radiography 1 0.25 26.19 6.55
Tuberculosis Heaf test 1 0 8.72 0.00
Antinuclear antibody 1 0 4.65 0.00
Double-stranded DNA test 1 0 4.65 0.00
Specialist visit 2 0.5 200.00 50.00
MRI 1 0 144.45 0.00
CRP level 1 0 6.62 0.00
Total – – 411 65
DNA, deoxyribonucleic acid.
TABLE 89 Initiation and monitoring resource use and costs: AS population
Item
Resource use Cost
Initiation period(12 weeks)
Quarterlymonitoring
Initiation period(12 weeks) (£)
Quarterlymonitoring (£)
Full blood count 2 1 5.97 2.98
ESR 2 1 5.90 2.95
Liver function test 2 1 1.50 0.75
Urea and electrolytes 2 1 2.77 1.38
Chest radiography 1 0 26.19 0.00
Tuberculosis Heaf test 1 0 8.72 0.00
Antinuclear antibody 1 0 4.65 0.00
Double-stranded DNA test 1 0 4.65 0.00
Specialist visit 2 0.5 200.00 50.00
CRP level 0 0 0.00 0.00
Total – – 260 58
DNA, deoxyribonucleic acid.
DOI: 10.3310/hta20090 HEALTH TECHNOLOGY ASSESSMENT 2016 VOL. 20 NO. 9
© Queen’s Printer and Controller of HMSO 2016. This work was produced by Corbett et al. under the terms of a commissioning contract issued by the Secretary of State forHealth. This issue may be freely reproduced for the purposes of private research and study and extracts (or indeed, the full report) may be included in professional journalsprovided that suitable acknowledgement is made and the reproduction is not associated with any form of advertising. Applications for commercial reproduction should beaddressed to: NIHR Journals Library, National Institute for Health Research, Evaluation, Trials and Studies Coordinating Centre, Alpha House, University of Southampton SciencePark, Southampton SO16 7NS, UK.
147
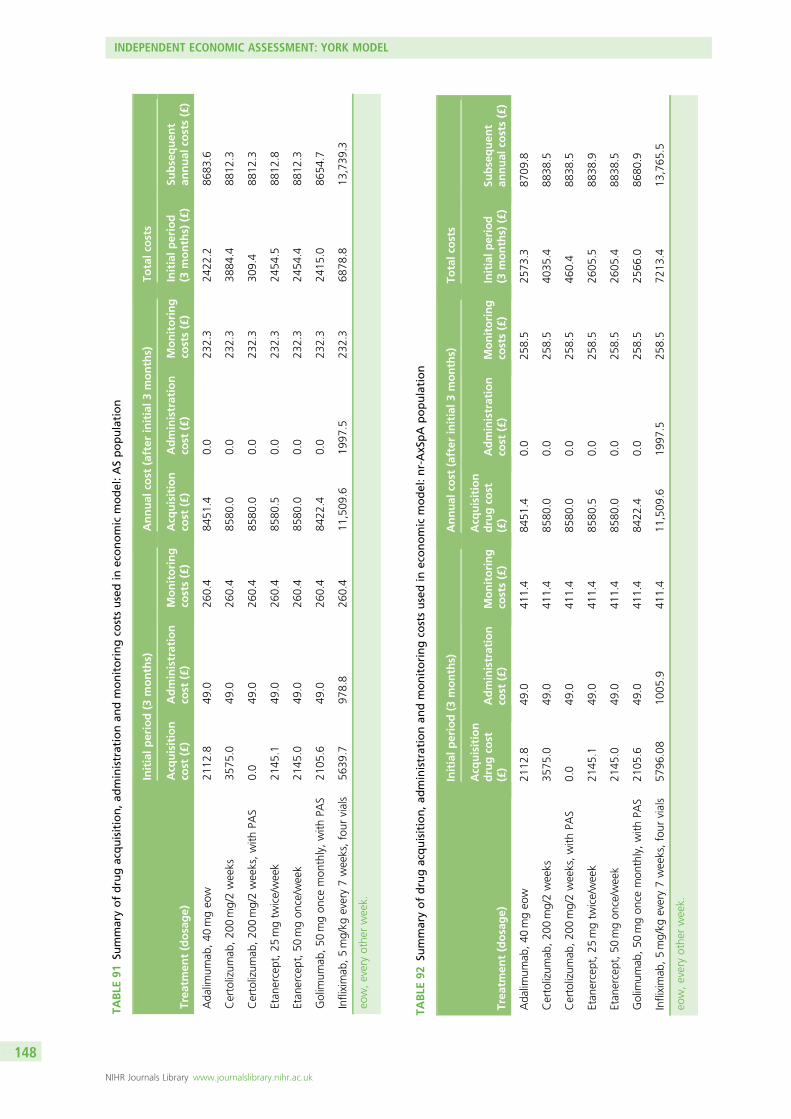
TABLE
91Su
mmaryofdrugacquisition,a
dministrationan
dmonitoringco
stsusedin
economic
model:ASpopulation
Trea
tmen
t(dosage)
Initialp
eriod(3
months)
Annual
cost
(after
initial3
months)
Totalc
osts
Acq
uisition
cost
(£)
Administration
cost
(£)
Monitoring
costs(£)
Acq
uisition
cost
(£)
Administration
cost
(£)
Monitoring
costs(£)
Initialp
eriod
(3months)
(£)
Subsequen
tan
nual
costs(£)
Ada
limum
ab,40
mgeo
w21
12.8
49.0
260.4
8451
.40.0
232.3
2422
.286
83.6
Certolizum
ab,20
0mg/2weeks
3575
.049
.026
0.4
8580
.00.0
232.3
3884
.488
12.3
Certolizum
ab,20
0mg/2weeks,with
PAS
0.0
49.0
260.4
8580
.00.0
232.3
309.4
8812
.3
Etan
ercept,25
mgtw
ice/week
2145
.149
.026
0.4
8580
.50.0
232.3
2454
.588
12.8
Etan
ercept,50
mgon
ce/w
eek
2145
.049
.026
0.4
8580
.00.0
232.3
2454
.488
12.3
Golim
umab
,50
mgon
cemon
thly,with
PAS
2105
.649
.026
0.4
8422
.40.0
232.3
2415
.086
54.7
Infliximab
,5mg/kg
every7weeks,four
vials
5639
.797
8.8
260.4
11,509
.619
97.5
232.3
6878
.813
,739
.3
eow,everyothe
rweek.
TABLE
92Su
mmaryofdrugacquisition,ad
ministrationan
dmonitoringco
stsusedin
economic
model:nr-AxSpA
population
Trea
tmen
t(dosage)
Initialperiod(3
months)
Annual
cost
(after
initial3
months)
Totalc
osts
Acq
uisition
drugco
st(£)
Administration
cost
(£)
Monitoring
costs(£)
Acq
uisition
drugco
st(£)
Administration
cost
(£)
Monitoring
costs(£)
Initialp
eriod
(3months)
(£)
Subsequen
tan
nual
costs(£)
Ada
limum
ab,40
mgeo
w21
12.8
49.0
411.4
8451
.40.0
258.5
2573
.387
09.8
Certolizum
ab,20
0mg/2weeks
3575
.049
.041
1.4
8580
.00.0
258.5
4035
.488
38.5
Certolizum
ab,20
0mg/2weeks,with
PAS
0.0
49.0
411.4
8580
.00.0
258.5
460.4
8838
.5
Etan
ercept,25
mgtw
ice/week
2145
.149
.041
1.4
8580
.50.0
258.5
2605
.588
38.9
Etan
ercept,50
mgon
ce/w
eek
2145
.049
.041
1.4
8580
.00.0
258.5
2605
.488
38.5
Golim
umab
,50
mgon
cemon
thly,with
PAS
2105
.649
.041
1.4
8422
.40.0
258.5
2566
.086
80.9
Infliximab
,5mg/kg
every7weeks,four
vials
5796
.08
1005
.941
1.4
11,509
.619
97.5
258.5
7213
.413
,765
.5
eow,everyothe
rweek.
INDEPENDENT ECONOMIC ASSESSMENT: YORK MODEL
NIHR Journals Library www.journalslibrary.nihr.ac.uk
148
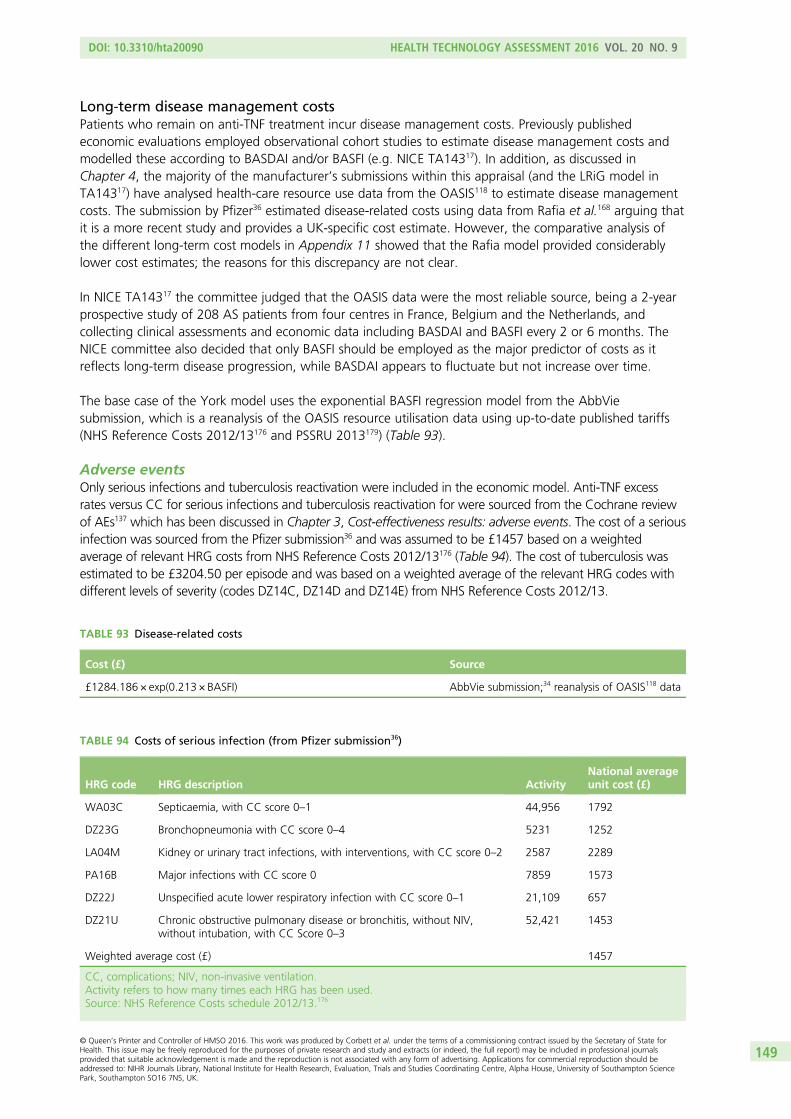
Long-term disease management costsPatients who remain on anti-TNF treatment incur disease management costs. Previously publishedeconomic evaluations employed observational cohort studies to estimate disease management costs andmodelled these according to BASDAI and/or BASFI (e.g. NICE TA14317). In addition, as discussed inChapter 4, the majority of the manufacturer’s submissions within this appraisal (and the LRiG model inTA14317) have analysed health-care resource use data from the OASIS118 to estimate disease managementcosts. The submission by Pfizer36 estimated disease-related costs using data from Rafia et al.168 arguing thatit is a more recent study and provides a UK-specific cost estimate. However, the comparative analysis ofthe different long-term cost models in Appendix 11 showed that the Rafia model provided considerablylower cost estimates; the reasons for this discrepancy are not clear.
In NICE TA14317 the committee judged that the OASIS data were the most reliable source, being a 2-yearprospective study of 208 AS patients from four centres in France, Belgium and the Netherlands, andcollecting clinical assessments and economic data including BASDAI and BASFI every 2 or 6 months. TheNICE committee also decided that only BASFI should be employed as the major predictor of costs as itreflects long-term disease progression, while BASDAI appears to fluctuate but not increase over time.
The base case of the York model uses the exponential BASFI regression model from the AbbViesubmission, which is a reanalysis of the OASIS resource utilisation data using up-to-date published tariffs(NHS Reference Costs 2012/13176 and PSSRU 2013179) (Table 93).
Adverse eventsOnly serious infections and tuberculosis reactivation were included in the economic model. Anti-TNF excessrates versus CC for serious infections and tuberculosis reactivation for were sourced from the Cochrane reviewof AEs137 which has been discussed in Chapter 3, Cost-effectiveness results: adverse events. The cost of a seriousinfection was sourced from the Pfizer submission36 and was assumed to be £1457 based on a weightedaverage of relevant HRG costs from NHS Reference Costs 2012/13176 (Table 94). The cost of tuberculosis wasestimated to be £3204.50 per episode and was based on a weighted average of the relevant HRG codes withdifferent levels of severity (codes DZ14C, DZ14D and DZ14E) from NHS Reference Costs 2012/13.
TABLE 94 Costs of serious infection (from Pfizer submission36)
HRG code HRG description ActivityNational averageunit cost (£)
WA03C Septicaemia, with CC score 0–1 44,956 1792
DZ23G Bronchopneumonia with CC score 0–4 5231 1252
LA04M Kidney or urinary tract infections, with interventions, with CC score 0–2 2587 2289
PA16B Major infections with CC score 0 7859 1573
DZ22J Unspecified acute lower respiratory infection with CC score 0–1 21,109 657
DZ21U Chronic obstructive pulmonary disease or bronchitis, without NIV,without intubation, with CC Score 0–3
52,421 1453
Weighted average cost (£) 1457
CC, complications; NIV, non-invasive ventilation.Activity refers to how many times each HRG has been used.Source: NHS Reference Costs schedule 2012/13.176
TABLE 93 Disease-related costs
Cost (£) Source
£1284.186 × exp(0.213 × BASFI) AbbVie submission;34 reanalysis of OASIS118 data
DOI: 10.3310/hta20090 HEALTH TECHNOLOGY ASSESSMENT 2016 VOL. 20 NO. 9
© Queen’s Printer and Controller of HMSO 2016. This work was produced by Corbett et al. under the terms of a commissioning contract issued by the Secretary of State forHealth. This issue may be freely reproduced for the purposes of private research and study and extracts (or indeed, the full report) may be included in professional journalsprovided that suitable acknowledgement is made and the reproduction is not associated with any form of advertising. Applications for commercial reproduction should beaddressed to: NIHR Journals Library, National Institute for Health Research, Evaluation, Trials and Studies Coordinating Centre, Alpha House, University of Southampton SciencePark, Southampton SO16 7NS, UK.
149
MortalitySex-specific SMRs are applied to the mortality rates from the general population to calculate separateadjusted mortality rates for AS and nr-AxSpA populations in the model.16
Analytic methods
The expected costs and QALYs of the alternative anti-TNFs are estimated and cost-effectiveness assessedbased on the incremental cost per additional QALY gained. As an assumption is made concerning thesimilarity in terms of clinical effect between the alternative anti-TNFs, the differences between each of thetreatments are driven entirely by their respective acquisition, administration and monitoring costs. Underthis assumption, inevitably the lowest cost TNF-α inhibitor would clearly dominate (i.e. lower cost andequal effect) in a fully incremental comparison of cost-effectiveness. Consequently, each TNF-α inhibitor iscompared separately versus CC alone. This provides a more consistent basis for assessing the impact thatthe different drug costs have across each separate scenario.
Probabilistic sensitivity analysis is used to assess the implications of parameter uncertainty (the imprecisionwith which input parameters are estimated). The mean costs and QALY reported in the tables are derivedfrom the PSA and the probabilities that each TNF-α inhibitor is more cost-effective than CC alone arereported at thresholds of £20,000 and £30,000 per QALY.
Sensitivity analysesA number of separate scenarios are presented to assess the implications of key parameter assumptions andsources of structural uncertainty in the model. These include the following.
Scenario 1: no response to conventional care assumed at 12 weeksThe base-case model incorporates the probability of response to CC at 12 weeks and assigns separatebaselines to responders and non-responders. Although the changes in BASDAI/BASFI estimated at12 weeks for CC are assumed to disappear in the following 12-week cycle, the separate baselinesestimated for responders and non-responders are retained for the remainder of the model horizon. Givenuncertainties surrounding the nature of the ‘placebo’ response assumed to apply to CC and whether ornot this would be evident in actual clinical practice, a separate scenario was modelled which assumed thatno patients receiving CC would achieve a BASDAI 50 response. This scenario was based on a separatesimulation using the extended synthesis model where the magnitude of ‘placebo’ effect was assumed tobe 0. Hence, employing this scenario, the impact of the ‘placebo’ effect is effectively netted out of themodel for both CC and the anti-TNFs. Hence, although the difference in response rates and BASDAI/BASFIscores for responders to anti-TNFs remains similar to the base-case model, the absolute response rate foranti-TNFs and the absolute BASDAI/BASFI scores are lower when the adjustment is applied. In addition, asno response is assumed for CC, a single baseline BASDAI and BASFI score is applied to CC patients.
Scenario 2: different baselines assumed for responders and non-respondersIn the base-case analysis, the extended synthesis model is used to estimate both changes in BASDAI andBASFI conditional upon BASDAI 50 response as well as different baseline BASDAI/BASFI scores forresponder and non-responders. It was noted in Chapter 5 that there appeared a disparity in the magnitudeof the difference in the conditional baseline scores estimated from the extended synthesis model comparedwith the differences reported by those manufacturers who provided additional data on request.Specifically, the difference between responders and non-responders appeared higher in our extendedsynthesis compared with the direct data reported by manufacturers. To explore the potential impact of thisdifference on the cost-effectiveness results, a separate scenario was undertaken wherein the difference inthe conditional baselines was based on a pooled estimate of the differences across the trials provided bymanufacturers rather than those estimated by the extended synthesis model.
INDEPENDENT ECONOMIC ASSESSMENT: YORK MODEL
NIHR Journals Library www.journalslibrary.nihr.ac.uk
150
In addition to exploring the impact of assuming different baselines, this scenario also included a pooledestimate of the change in BASDAI/BASFI scores for responders and non-responders reported bymanufacturers. Hence, in this scenario, the extended synthesis model is used only to predict the responseto BASDAI 50, the differences in the conditional baselines and change scores being derived from pooledestimates from the data reported by manufacturers.
Scenario 3: no effect of anti-tumour necrosis factors on Bath AnkylosingSpondylitis Functional Index progressionIn the base-case model, a treatment effect is applied from year 4 of the model on the rate of further BASFIprogression for patients who continue to receive TNF-α inhibitors beyond this time point. Given theuncertainty reported in Chapter 3 surrounding existing evidence for anti-TNFs in relation to diseasemodification, a separate scenario was explored which assumed that the rate of BASFI progression wouldbe the same for patients receiving anti-TNFs and CC alone.
Scenario 4: treatment effect of anti-tumour necrosis factors applied fromstart of model (Bath Ankylosing Spondylitis Functional Index progression)A separate scenario was also undertaken assuming that the treatment effect on further BASFI progressionwould be incurred from the start of the model, as opposed to year 4. This scenario assumes that any diseasemodification would be achieved immediately compared with the delayed effect assumed in the base case.
Scenario 5: utilities – linear Bath Ankylosing Spondylitis Disease ActivityIndex/Bath Ankylosing Spondylitis Functional Index modelThe base-case analysis in both the AS and nr-AxSpA populations are based on the non-linear mappingalgorithms reported in the submission by Pfizer. A separate scenario was run in both populations using analternative linear model which has been applied in previous NICE appraisals (referred to as the ‘MerckSharp & Dohme’ algorithm in Health-related quality of life). This scenario was incorporated to explore theimpact of using a linear model and to provide results which are more consistent with the utility approachapplied in previous NICE appraisals (TA14317 and TA23333).
Scenario 6 (non-radiographic axial spondyloarthritis only): trials innon-radiographic axial spondyloarthritis and ankylosing spondylitispopulations combinedThe base-case analysis for the nr-AxSpA population is based on the extended synthesis model using onlythe trials reporting in this population. A separate scenario was undertaken based on the results from theextended synthesis model which combined the AS and nr-AxSpA trials.
Following the consultation process to the NICE appraisal, additional analyses were undertaken to addresscomments received on Chapters 5 and 6. These focused on the conditional baseline BASDAI scores used inChapter 5 and on the existence of a biosimilar product for infliximab with a lower list price. Further detailson these analyses and their results are shown in Appendix 15.
Model validationThe conceptualisation of the model and related structural assumptions were informed by the review ofexisting models and discussions with two clinical advisors. The face validity of the model structure, datasources and key assumptions were addressed using inputs based on systematic reviews, targeted searchingand clinical input. Verification of the model and the associated inputs was undertaken using a stagedprocess. One researcher developed the initial model structure and the preliminary coding. This was thenchecked and extended for the final model by a second researcher. Both researchers were subsequentlyinvolved in the subsequent quality-assurance process entailing detailed cross-checks of input data againsttheir sources and undertook extensive logical checks and scenarios to assess the performance of themodel. Two other researchers were involved in further checks of key aspects including the integration ofthe results from the extended synthesis within the Excel model. A fifth researcher was involved in all stageswith preparing and checking parameter inputs for the model. Cross-validation was assessed by comparingthe results with existing models and identifying differences and their causes.
DOI: 10.3310/hta20090 HEALTH TECHNOLOGY ASSESSMENT 2016 VOL. 20 NO. 9
© Queen’s Printer and Controller of HMSO 2016. This work was produced by Corbett et al. under the terms of a commissioning contract issued by the Secretary of State forHealth. This issue may be freely reproduced for the purposes of private research and study and extracts (or indeed, the full report) may be included in professional journalsprovided that suitable acknowledgement is made and the reproduction is not associated with any form of advertising. Applications for commercial reproduction should beaddressed to: NIHR Journals Library, National Institute for Health Research, Evaluation, Trials and Studies Coordinating Centre, Alpha House, University of Southampton SciencePark, Southampton SO16 7NS, UK.
151
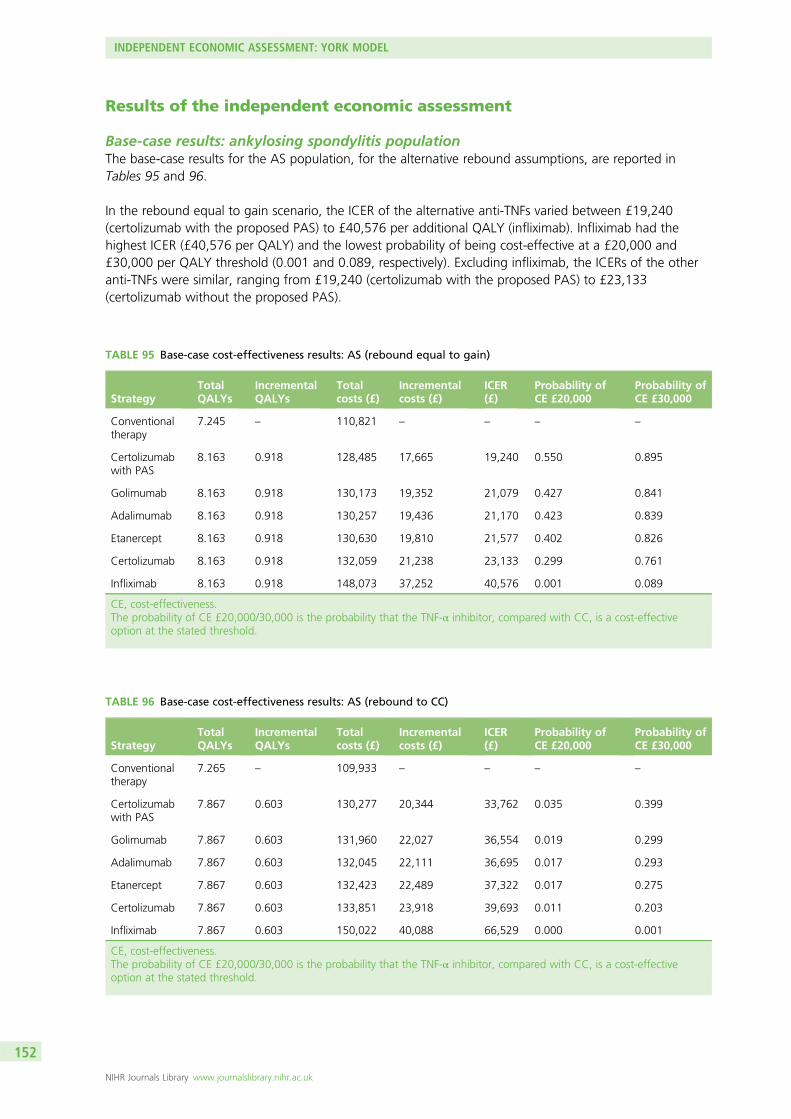
Results of the independent economic assessment
Base-case results: ankylosing spondylitis populationThe base-case results for the AS population, for the alternative rebound assumptions, are reported inTables 95 and 96.
In the rebound equal to gain scenario, the ICER of the alternative anti-TNFs varied between £19,240(certolizumab with the proposed PAS) to £40,576 per additional QALY (infliximab). Infliximab had thehighest ICER (£40,576 per QALY) and the lowest probability of being cost-effective at a £20,000 and£30,000 per QALY threshold (0.001 and 0.089, respectively). Excluding infliximab, the ICERs of the otheranti-TNFs were similar, ranging from £19,240 (certolizumab with the proposed PAS) to £23,133(certolizumab without the proposed PAS).
TABLE 95 Base-case cost-effectiveness results: AS (rebound equal to gain)
StrategyTotalQALYs
IncrementalQALYs
Totalcosts (£)
Incrementalcosts (£)
ICER(£)
Probability ofCE £20,000
Probability ofCE £30,000
Conventionaltherapy
7.245 – 110,821 – – – –
Certolizumabwith PAS
8.163 0.918 128,485 17,665 19,240 0.550 0.895
Golimumab 8.163 0.918 130,173 19,352 21,079 0.427 0.841
Adalimumab 8.163 0.918 130,257 19,436 21,170 0.423 0.839
Etanercept 8.163 0.918 130,630 19,810 21,577 0.402 0.826
Certolizumab 8.163 0.918 132,059 21,238 23,133 0.299 0.761
Infliximab 8.163 0.918 148,073 37,252 40,576 0.001 0.089
CE, cost-effectiveness.The probability of CE £20,000/30,000 is the probability that the TNF-α inhibitor, compared with CC, is a cost-effectiveoption at the stated threshold.
TABLE 96 Base-case cost-effectiveness results: AS (rebound to CC)
StrategyTotalQALYs
IncrementalQALYs
Totalcosts (£)
Incrementalcosts (£)
ICER(£)
Probability ofCE £20,000
Probability ofCE £30,000
Conventionaltherapy
7.265 – 109,933 – – – –
Certolizumabwith PAS
7.867 0.603 130,277 20,344 33,762 0.035 0.399
Golimumab 7.867 0.603 131,960 22,027 36,554 0.019 0.299
Adalimumab 7.867 0.603 132,045 22,111 36,695 0.017 0.293
Etanercept 7.867 0.603 132,423 22,489 37,322 0.017 0.275
Certolizumab 7.867 0.603 133,851 23,918 39,693 0.011 0.203
Infliximab 7.867 0.603 150,022 40,088 66,529 0.000 0.001
CE, cost-effectiveness.The probability of CE £20,000/30,000 is the probability that the TNF-α inhibitor, compared with CC, is a cost-effectiveoption at the stated threshold.
INDEPENDENT ECONOMIC ASSESSMENT: YORK MODEL
NIHR Journals Library www.journalslibrary.nihr.ac.uk
152
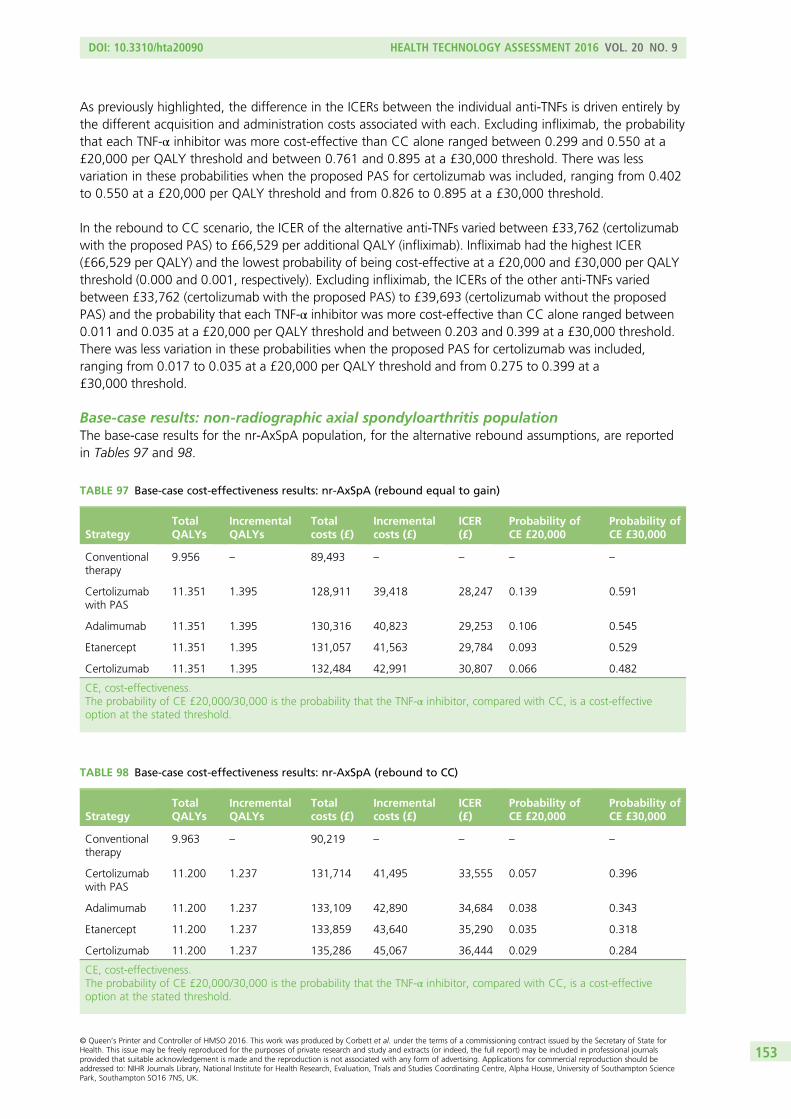
As previously highlighted, the difference in the ICERs between the individual anti-TNFs is driven entirely bythe different acquisition and administration costs associated with each. Excluding infliximab, the probabilitythat each TNF-α inhibitor was more cost-effective than CC alone ranged between 0.299 and 0.550 at a£20,000 per QALY threshold and between 0.761 and 0.895 at a £30,000 threshold. There was lessvariation in these probabilities when the proposed PAS for certolizumab was included, ranging from 0.402to 0.550 at a £20,000 per QALY threshold and from 0.826 to 0.895 at a £30,000 threshold.
In the rebound to CC scenario, the ICER of the alternative anti-TNFs varied between £33,762 (certolizumabwith the proposed PAS) to £66,529 per additional QALY (infliximab). Infliximab had the highest ICER(£66,529 per QALY) and the lowest probability of being cost-effective at a £20,000 and £30,000 per QALYthreshold (0.000 and 0.001, respectively). Excluding infliximab, the ICERs of the other anti-TNFs variedbetween £33,762 (certolizumab with the proposed PAS) to £39,693 (certolizumab without the proposedPAS) and the probability that each TNF-α inhibitor was more cost-effective than CC alone ranged between0.011 and 0.035 at a £20,000 per QALY threshold and between 0.203 and 0.399 at a £30,000 threshold.There was less variation in these probabilities when the proposed PAS for certolizumab was included,ranging from 0.017 to 0.035 at a £20,000 per QALY threshold and from 0.275 to 0.399 at a£30,000 threshold.
Base-case results: non-radiographic axial spondyloarthritis populationThe base-case results for the nr-AxSpA population, for the alternative rebound assumptions, are reportedin Tables 97 and 98.
TABLE 98 Base-case cost-effectiveness results: nr-AxSpA (rebound to CC)
StrategyTotalQALYs
IncrementalQALYs
Totalcosts (£)
Incrementalcosts (£)
ICER(£)
Probability ofCE £20,000
Probability ofCE £30,000
Conventionaltherapy
9.963 – 90,219 – – – –
Certolizumabwith PAS
11.200 1.237 131,714 41,495 33,555 0.057 0.396
Adalimumab 11.200 1.237 133,109 42,890 34,684 0.038 0.343
Etanercept 11.200 1.237 133,859 43,640 35,290 0.035 0.318
Certolizumab 11.200 1.237 135,286 45,067 36,444 0.029 0.284
CE, cost-effectiveness.The probability of CE £20,000/30,000 is the probability that the TNF-α inhibitor, compared with CC, is a cost-effectiveoption at the stated threshold.
TABLE 97 Base-case cost-effectiveness results: nr-AxSpA (rebound equal to gain)
StrategyTotalQALYs
IncrementalQALYs
Totalcosts (£)
Incrementalcosts (£)
ICER(£)
Probability ofCE £20,000
Probability ofCE £30,000
Conventionaltherapy
9.956 – 89,493 – – – –
Certolizumabwith PAS
11.351 1.395 128,911 39,418 28,247 0.139 0.591
Adalimumab 11.351 1.395 130,316 40,823 29,253 0.106 0.545
Etanercept 11.351 1.395 131,057 41,563 29,784 0.093 0.529
Certolizumab 11.351 1.395 132,484 42,991 30,807 0.066 0.482
CE, cost-effectiveness.The probability of CE £20,000/30,000 is the probability that the TNF-α inhibitor, compared with CC, is a cost-effectiveoption at the stated threshold.
DOI: 10.3310/hta20090 HEALTH TECHNOLOGY ASSESSMENT 2016 VOL. 20 NO. 9
© Queen’s Printer and Controller of HMSO 2016. This work was produced by Corbett et al. under the terms of a commissioning contract issued by the Secretary of State forHealth. This issue may be freely reproduced for the purposes of private research and study and extracts (or indeed, the full report) may be included in professional journalsprovided that suitable acknowledgement is made and the reproduction is not associated with any form of advertising. Applications for commercial reproduction should beaddressed to: NIHR Journals Library, National Institute for Health Research, Evaluation, Trials and Studies Coordinating Centre, Alpha House, University of Southampton SciencePark, Southampton SO16 7NS, UK.
153
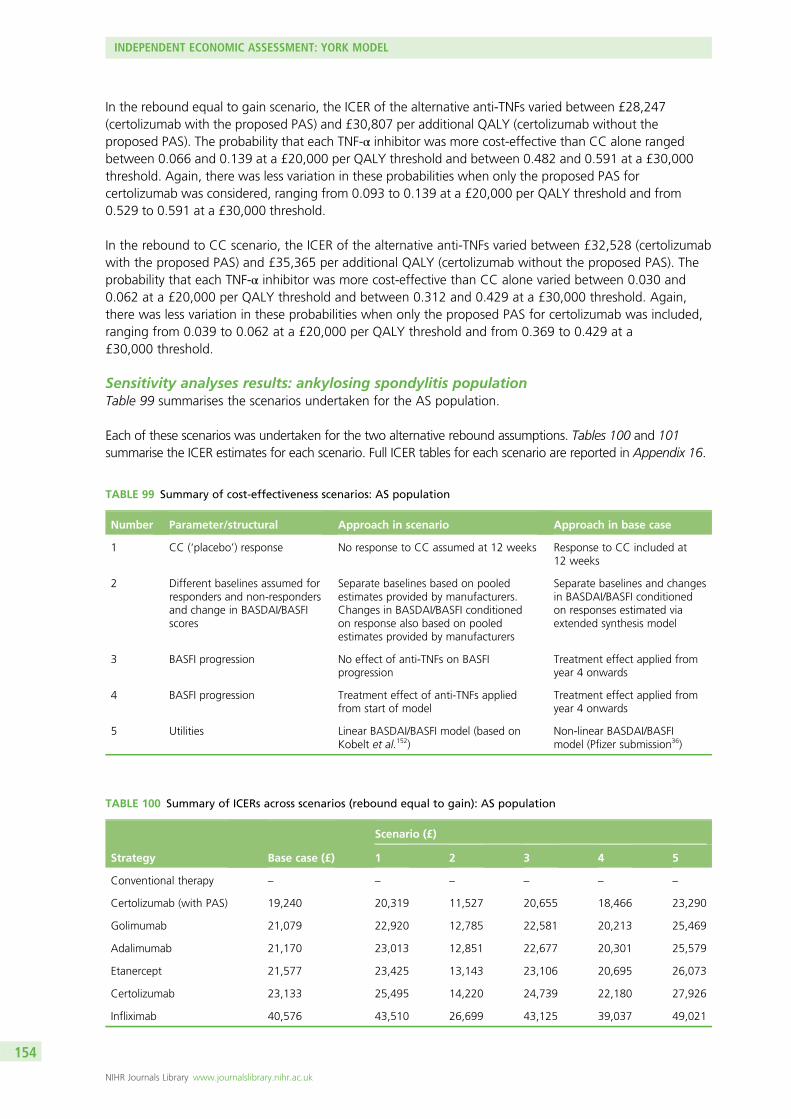
In the rebound equal to gain scenario, the ICER of the alternative anti-TNFs varied between £28,247(certolizumab with the proposed PAS) and £30,807 per additional QALY (certolizumab without theproposed PAS). The probability that each TNF-α inhibitor was more cost-effective than CC alone rangedbetween 0.066 and 0.139 at a £20,000 per QALY threshold and between 0.482 and 0.591 at a £30,000threshold. Again, there was less variation in these probabilities when only the proposed PAS forcertolizumab was considered, ranging from 0.093 to 0.139 at a £20,000 per QALY threshold and from0.529 to 0.591 at a £30,000 threshold.
In the rebound to CC scenario, the ICER of the alternative anti-TNFs varied between £32,528 (certolizumabwith the proposed PAS) and £35,365 per additional QALY (certolizumab without the proposed PAS). Theprobability that each TNF-α inhibitor was more cost-effective than CC alone varied between 0.030 and0.062 at a £20,000 per QALY threshold and between 0.312 and 0.429 at a £30,000 threshold. Again,there was less variation in these probabilities when only the proposed PAS for certolizumab was included,ranging from 0.039 to 0.062 at a £20,000 per QALY threshold and from 0.369 to 0.429 at a£30,000 threshold.
Sensitivity analyses results: ankylosing spondylitis populationTable 99 summarises the scenarios undertaken for the AS population.
Each of these scenarios was undertaken for the two alternative rebound assumptions. Tables 100 and 101summarise the ICER estimates for each scenario. Full ICER tables for each scenario are reported in Appendix 16.
TABLE 99 Summary of cost-effectiveness scenarios: AS population
Number Parameter/structural Approach in scenario Approach in base case
1 CC (‘placebo’) response No response to CC assumed at 12 weeks Response to CC included at12 weeks
2 Different baselines assumed forresponders and non-respondersand change in BASDAI/BASFIscores
Separate baselines based on pooledestimates provided by manufacturers.Changes in BASDAI/BASFI conditionedon response also based on pooledestimates provided by manufacturers
Separate baselines and changesin BASDAI/BASFI conditionedon responses estimated viaextended synthesis model
3 BASFI progression No effect of anti-TNFs on BASFIprogression
Treatment effect applied fromyear 4 onwards
4 BASFI progression Treatment effect of anti-TNFs appliedfrom start of model
Treatment effect applied fromyear 4 onwards
5 Utilities Linear BASDAI/BASFI model (based onKobelt et al.152)
Non-linear BASDAI/BASFImodel (Pfizer submission36)
TABLE 100 Summary of ICERs across scenarios (rebound equal to gain): AS population
Strategy Base case (£)
Scenario (£)
1 2 3 4 5
Conventional therapy – – – – – –
Certolizumab (with PAS) 19,240 20,319 11,527 20,655 18,466 23,290
Golimumab 21,079 22,920 12,785 22,581 20,213 25,469
Adalimumab 21,170 23,013 12,851 22,677 20,301 25,579
Etanercept 21,577 23,425 13,143 23,106 20,695 26,073
Certolizumab 23,133 25,495 14,220 24,739 22,180 27,926
Infliximab 40,576 43,510 26,699 43,125 39,037 49,021
INDEPENDENT ECONOMIC ASSESSMENT: YORK MODEL
NIHR Journals Library www.journalslibrary.nihr.ac.uk
154
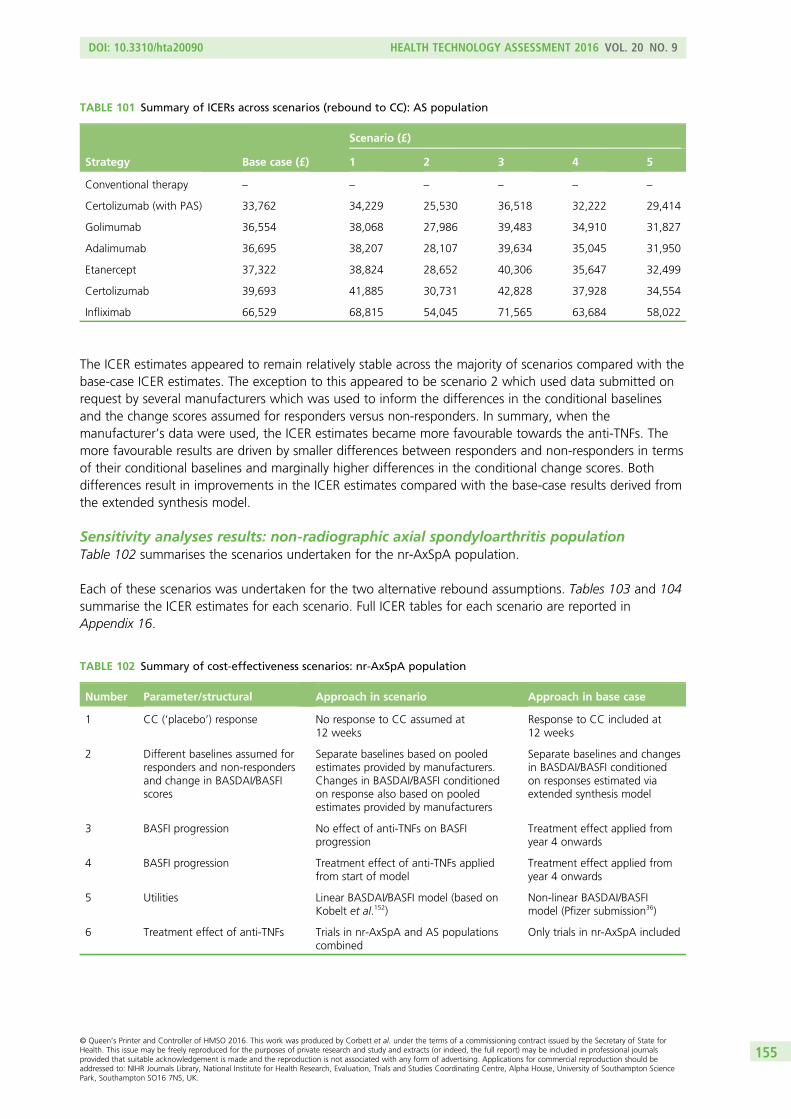
The ICER estimates appeared to remain relatively stable across the majority of scenarios compared with thebase-case ICER estimates. The exception to this appeared to be scenario 2 which used data submitted onrequest by several manufacturers which was used to inform the differences in the conditional baselinesand the change scores assumed for responders versus non-responders. In summary, when themanufacturer’s data were used, the ICER estimates became more favourable towards the anti-TNFs. Themore favourable results are driven by smaller differences between responders and non-responders in termsof their conditional baselines and marginally higher differences in the conditional change scores. Bothdifferences result in improvements in the ICER estimates compared with the base-case results derived fromthe extended synthesis model.
Sensitivity analyses results: non-radiographic axial spondyloarthritis populationTable 102 summarises the scenarios undertaken for the nr-AxSpA population.
Each of these scenarios was undertaken for the two alternative rebound assumptions. Tables 103 and 104summarise the ICER estimates for each scenario. Full ICER tables for each scenario are reported inAppendix 16.
TABLE 101 Summary of ICERs across scenarios (rebound to CC): AS population
Strategy Base case (£)
Scenario (£)
1 2 3 4 5
Conventional therapy – – – – – –
Certolizumab (with PAS) 33,762 34,229 25,530 36,518 32,222 29,414
Golimumab 36,554 38,068 27,986 39,483 34,910 31,827
Adalimumab 36,695 38,207 28,107 39,634 35,045 31,950
Etanercept 37,322 38,824 28,652 40,306 35,647 32,499
Certolizumab 39,693 41,885 30,731 42,828 37,928 34,554
Infliximab 66,529 68,815 54,045 71,565 63,684 58,022
TABLE 102 Summary of cost-effectiveness scenarios: nr-AxSpA population
Number Parameter/structural Approach in scenario Approach in base case
1 CC (‘placebo’) response No response to CC assumed at12 weeks
Response to CC included at12 weeks
2 Different baselines assumed forresponders and non-respondersand change in BASDAI/BASFIscores
Separate baselines based on pooledestimates provided by manufacturers.Changes in BASDAI/BASFI conditionedon response also based on pooledestimates provided by manufacturers
Separate baselines and changesin BASDAI/BASFI conditionedon responses estimated viaextended synthesis model
3 BASFI progression No effect of anti-TNFs on BASFIprogression
Treatment effect applied fromyear 4 onwards
4 BASFI progression Treatment effect of anti-TNFs appliedfrom start of model
Treatment effect applied fromyear 4 onwards
5 Utilities Linear BASDAI/BASFI model (based onKobelt et al.152)
Non-linear BASDAI/BASFImodel (Pfizer submission36)
6 Treatment effect of anti-TNFs Trials in nr-AxSpA and AS populationscombined
Only trials in nr-AxSpA included
DOI: 10.3310/hta20090 HEALTH TECHNOLOGY ASSESSMENT 2016 VOL. 20 NO. 9
© Queen’s Printer and Controller of HMSO 2016. This work was produced by Corbett et al. under the terms of a commissioning contract issued by the Secretary of State forHealth. This issue may be freely reproduced for the purposes of private research and study and extracts (or indeed, the full report) may be included in professional journalsprovided that suitable acknowledgement is made and the reproduction is not associated with any form of advertising. Applications for commercial reproduction should beaddressed to: NIHR Journals Library, National Institute for Health Research, Evaluation, Trials and Studies Coordinating Centre, Alpha House, University of Southampton SciencePark, Southampton SO16 7NS, UK.
155
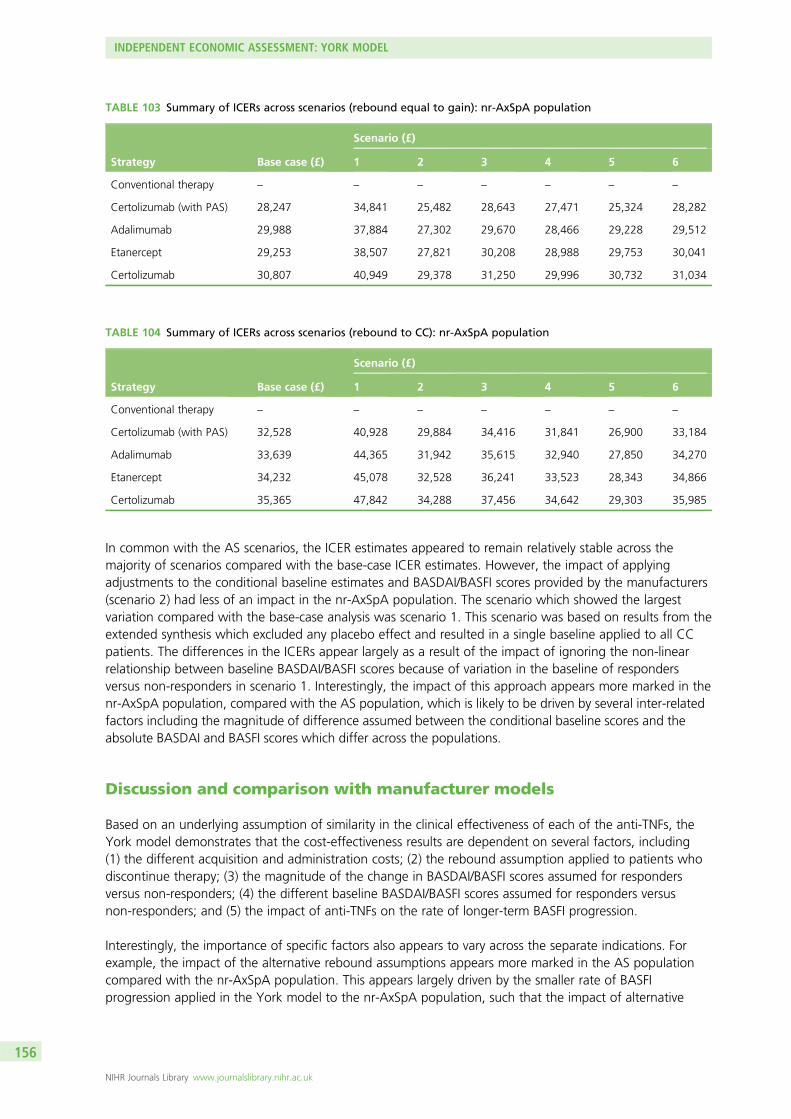
In common with the AS scenarios, the ICER estimates appeared to remain relatively stable across themajority of scenarios compared with the base-case ICER estimates. However, the impact of applyingadjustments to the conditional baseline estimates and BASDAI/BASFI scores provided by the manufacturers(scenario 2) had less of an impact in the nr-AxSpA population. The scenario which showed the largestvariation compared with the base-case analysis was scenario 1. This scenario was based on results from theextended synthesis which excluded any placebo effect and resulted in a single baseline applied to all CCpatients. The differences in the ICERs appear largely as a result of the impact of ignoring the non-linearrelationship between baseline BASDAI/BASFI scores because of variation in the baseline of respondersversus non-responders in scenario 1. Interestingly, the impact of this approach appears more marked in thenr-AxSpA population, compared with the AS population, which is likely to be driven by several inter-relatedfactors including the magnitude of difference assumed between the conditional baseline scores and theabsolute BASDAI and BASFI scores which differ across the populations.
Discussion and comparison with manufacturer models
Based on an underlying assumption of similarity in the clinical effectiveness of each of the anti-TNFs, theYork model demonstrates that the cost-effectiveness results are dependent on several factors, including(1) the different acquisition and administration costs; (2) the rebound assumption applied to patients whodiscontinue therapy; (3) the magnitude of the change in BASDAI/BASFI scores assumed for respondersversus non-responders; (4) the different baseline BASDAI/BASFI scores assumed for responders versusnon-responders; and (5) the impact of anti-TNFs on the rate of longer-term BASFI progression.
Interestingly, the importance of specific factors also appears to vary across the separate indications. Forexample, the impact of the alternative rebound assumptions appears more marked in the AS populationcompared with the nr-AxSpA population. This appears largely driven by the smaller rate of BASFIprogression applied in the York model to the nr-AxSpA population, such that the impact of alternative
TABLE 103 Summary of ICERs across scenarios (rebound equal to gain): nr-AxSpA population
Strategy Base case (£)
Scenario (£)
1 2 3 4 5 6
Conventional therapy – – – – – – –
Certolizumab (with PAS) 28,247 34,841 25,482 28,643 27,471 25,324 28,282
Adalimumab 29,988 37,884 27,302 29,670 28,466 29,228 29,512
Etanercept 29,253 38,507 27,821 30,208 28,988 29,753 30,041
Certolizumab 30,807 40,949 29,378 31,250 29,996 30,732 31,034
TABLE 104 Summary of ICERs across scenarios (rebound to CC): nr-AxSpA population
Strategy Base case (£)
Scenario (£)
1 2 3 4 5 6
Conventional therapy – – – – – – –
Certolizumab (with PAS) 32,528 40,928 29,884 34,416 31,841 26,900 33,184
Adalimumab 33,639 44,365 31,942 35,615 32,940 27,850 34,270
Etanercept 34,232 45,078 32,528 36,241 33,523 28,343 34,866
Certolizumab 35,365 47,842 34,288 37,456 34,642 29,303 35,985
INDEPENDENT ECONOMIC ASSESSMENT: YORK MODEL
NIHR Journals Library www.journalslibrary.nihr.ac.uk
156
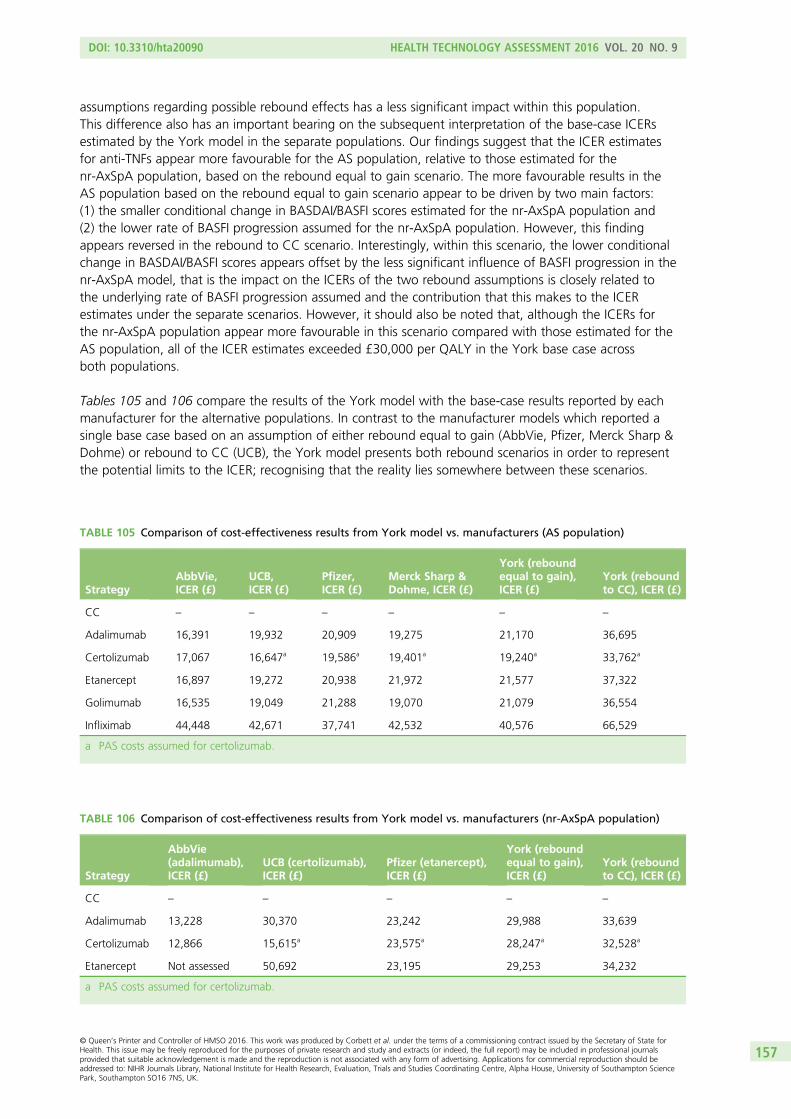
assumptions regarding possible rebound effects has a less significant impact within this population.This difference also has an important bearing on the subsequent interpretation of the base-case ICERsestimated by the York model in the separate populations. Our findings suggest that the ICER estimatesfor anti-TNFs appear more favourable for the AS population, relative to those estimated for thenr-AxSpA population, based on the rebound equal to gain scenario. The more favourable results in theAS population based on the rebound equal to gain scenario appear to be driven by two main factors:(1) the smaller conditional change in BASDAI/BASFI scores estimated for the nr-AxSpA population and(2) the lower rate of BASFI progression assumed for the nr-AxSpA population. However, this findingappears reversed in the rebound to CC scenario. Interestingly, within this scenario, the lower conditionalchange in BASDAI/BASFI scores appears offset by the less significant influence of BASFI progression in thenr-AxSpA model, that is the impact on the ICERs of the two rebound assumptions is closely related tothe underlying rate of BASFI progression assumed and the contribution that this makes to the ICERestimates under the separate scenarios. However, it should also be noted that, although the ICERs forthe nr-AxSpA population appear more favourable in this scenario compared with those estimated for theAS population, all of the ICER estimates exceeded £30,000 per QALY in the York base case acrossboth populations.
Tables 105 and 106 compare the results of the York model with the base-case results reported by eachmanufacturer for the alternative populations. In contrast to the manufacturer models which reported asingle base case based on an assumption of either rebound equal to gain (AbbVie, Pfizer, Merck Sharp &Dohme) or rebound to CC (UCB), the York model presents both rebound scenarios in order to representthe potential limits to the ICER; recognising that the reality lies somewhere between these scenarios.
TABLE 106 Comparison of cost-effectiveness results from York model vs. manufacturers (nr-AxSpA population)
Strategy
AbbVie(adalimumab),ICER (£)
UCB (certolizumab),ICER (£)
Pfizer (etanercept),ICER (£)
York (reboundequal to gain),ICER (£)
York (reboundto CC), ICER (£)
CC – – – – –
Adalimumab 13,228 30,370 23,242 29,988 33,639
Certolizumab 12,866 15,615a 23,575a 28,247a 32,528a
Etanercept Not assessed 50,692 23,195 29,253 34,232
a PAS costs assumed for certolizumab.
TABLE 105 Comparison of cost-effectiveness results from York model vs. manufacturers (AS population)
StrategyAbbVie,ICER (£)
UCB,ICER (£)
Pfizer,ICER (£)
Merck Sharp &Dohme, ICER (£)
York (reboundequal to gain),ICER (£)
York (reboundto CC), ICER (£)
CC – – – – – –
Adalimumab 16,391 19,932 20,909 19,275 21,170 36,695
Certolizumab 17,067 16,647a 19,586a 19,401a 19,240a 33,762a
Etanercept 16,897 19,272 20,938 21,972 21,577 37,322
Golimumab 16,535 19,049 21,288 19,070 21,079 36,554
Infliximab 44,448 42,671 37,741 42,532 40,576 66,529
a PAS costs assumed for certolizumab.
DOI: 10.3310/hta20090 HEALTH TECHNOLOGY ASSESSMENT 2016 VOL. 20 NO. 9
© Queen’s Printer and Controller of HMSO 2016. This work was produced by Corbett et al. under the terms of a commissioning contract issued by the Secretary of State forHealth. This issue may be freely reproduced for the purposes of private research and study and extracts (or indeed, the full report) may be included in professional journalsprovided that suitable acknowledgement is made and the reproduction is not associated with any form of advertising. Applications for commercial reproduction should beaddressed to: NIHR Journals Library, National Institute for Health Research, Evaluation, Trials and Studies Coordinating Centre, Alpha House, University of Southampton SciencePark, Southampton SO16 7NS, UK.
157
Although there are a number of important differences in approaches both among the differentmanufacturer models and compared with the York model, the comparison of ICERs based on the Yorkrebound equal to gain scenario appear broadly consistent in the AS population. This might appearsurprising given that the York model is based on two key assumptions that appear less favourable thanthose used by manufacturers, specifically: (1) incorporating separate baseline BASDAI/BASFI scores forresponders and non-responders which assume that responders are likely to be less severe in terms of theirbaseline BASDAI and BASFI scores than non-responders; and (2) only incorporating an effect of anti-TNFson disease progression for patients remaining on therapy for at least 4-years. However, these appearcounterbalanced by the higher rate of BASFI progression applied to AS patients [0.082 (0–10 scale) unitsper annum compared with estimates between 0.056 and 0.07 assumed by the manufacturers]. As wehighlighted at the start of this section, it is our view that the York model has a more coherent basis formodelling longer-term BASFI progression.
Another important counterbalancing effect is the use of the conditional scores for responders andnon-responders obtained via the extended synthesis within the York model. This contrasts with theselective approaches (i.e. using conditional scores from single studies or assumptions) or use of longer-termfollow-up and/or open-label sources (i.e. implicitly assuming that patients who continue to participate inlonger-term follow-up and open label sources are more likely to be responders than patients who do not).Consequently, the change scores assumed in the York model for BASDAI 50 responders appear higherthan those assumed by several of the manufacturers. The approach applied within the York model is basedon a more generalised framework for synthesis and hence utilises more evidence than considered by themanufacturers. This approach directly informs the conditional change scores which are fundamental to anappropriate assessment of the cost-effectiveness when a response-based assessment is incorporated todetermine eligibility for continued treatment.
In Chapter 4 it was noted that there appeared more variation in the ICER estimates reported acrossthe manufacturer’s submissions in the nr-AxSpA population compared with those reported in the ASpopulation. Again, the ICER estimates reported by the York model in the nr-AxSpA population do notappear inconsistent with the range of ICERs reported across the separate manufacturers. However,any attempt to formally cross-validate the results from the York model with those reported by themanufacturers is difficult given the contrasting approaches and assumptions employed. As the York modeluses several of the key parameter inputs reported in the submission by Pfizer,36 a comparison may be moreusefully made by comparing the results of the York model and those reported by Pfizer. In general, theICER estimates appear less favourable in the York model compared with those reported by Pfizer. Onepossible explanation for these differences is that the York model uses a lower rate of BASFI progressionand only assumes that anti-TNFs affect this rate after at least 4 years of treatment. However, our resultshave also shown that the impact of progression appears less of a driver of cost-effectiveness in thenr-AxSpA model. Another possible explanation is the use of different baselines assumed for responders andnon-responders assumed in the York model, that is the York model assumes that responders and typicallyless severe in terms of baseline BASDAI/BASFI scores compared with non-responders. Consequently, anadditional scenario was undertaken using the York model to further assist in cross-validation. For thisscenario, an assumption was made that the responders and non-responders did not differ in terms ofbaseline BASDAI/BASFI scores.
The results of the additional validation scenario are reported in Table 107. The ICERs in this scenarioappeared closer to those reported by Pfizer.36 Hence this additional validation scenario is important inhelping to identify potential drivers of difference between the results of the York model and thosereported by the manufacturers. The scenario also demonstrates that the assumption made concerningpotential differences (and the magnitude of any difference) between the baseline BASDAI/BASFI scores ofresponders and non-responders has an important impact on the cost-effectiveness results. Hence, studieswhich are based on similar baselines are likely to be potentially overly optimistic in the subsequent ICERestimates reported for anti-TNFs. Equally, it might be argued that the results from the York base-casemodel may be conservative towards the anti-TNFs because the magnitude of differences in the baseline
INDEPENDENT ECONOMIC ASSESSMENT: YORK MODEL
NIHR Journals Library www.journalslibrary.nihr.ac.uk
158
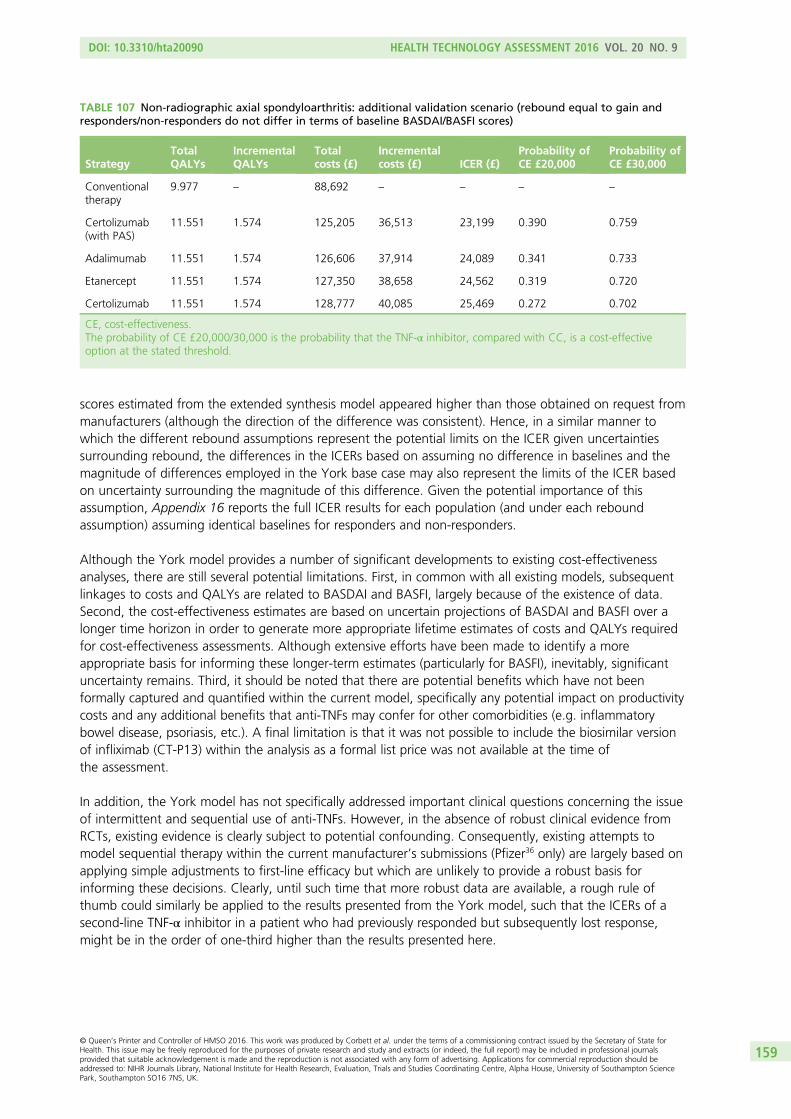
scores estimated from the extended synthesis model appeared higher than those obtained on request frommanufacturers (although the direction of the difference was consistent). Hence, in a similar manner towhich the different rebound assumptions represent the potential limits on the ICER given uncertaintiessurrounding rebound, the differences in the ICERs based on assuming no difference in baselines and themagnitude of differences employed in the York base case may also represent the limits of the ICER basedon uncertainty surrounding the magnitude of this difference. Given the potential importance of thisassumption, Appendix 16 reports the full ICER results for each population (and under each reboundassumption) assuming identical baselines for responders and non-responders.
Although the York model provides a number of significant developments to existing cost-effectivenessanalyses, there are still several potential limitations. First, in common with all existing models, subsequentlinkages to costs and QALYs are related to BASDAI and BASFI, largely because of the existence of data.Second, the cost-effectiveness estimates are based on uncertain projections of BASDAI and BASFI over alonger time horizon in order to generate more appropriate lifetime estimates of costs and QALYs requiredfor cost-effectiveness assessments. Although extensive efforts have been made to identify a moreappropriate basis for informing these longer-term estimates (particularly for BASFI), inevitably, significantuncertainty remains. Third, it should be noted that there are potential benefits which have not beenformally captured and quantified within the current model, specifically any potential impact on productivitycosts and any additional benefits that anti-TNFs may confer for other comorbidities (e.g. inflammatorybowel disease, psoriasis, etc.). A final limitation is that it was not possible to include the biosimilar versionof infliximab (CT-P13) within the analysis as a formal list price was not available at the time ofthe assessment.
In addition, the York model has not specifically addressed important clinical questions concerning the issueof intermittent and sequential use of anti-TNFs. However, in the absence of robust clinical evidence fromRCTs, existing evidence is clearly subject to potential confounding. Consequently, existing attempts tomodel sequential therapy within the current manufacturer’s submissions (Pfizer36 only) are largely based onapplying simple adjustments to first-line efficacy but which are unlikely to provide a robust basis forinforming these decisions. Clearly, until such time that more robust data are available, a rough rule ofthumb could similarly be applied to the results presented from the York model, such that the ICERs of asecond-line TNF-α inhibitor in a patient who had previously responded but subsequently lost response,might be in the order of one-third higher than the results presented here.
TABLE 107 Non-radiographic axial spondyloarthritis: additional validation scenario (rebound equal to gain andresponders/non-responders do not differ in terms of baseline BASDAI/BASFI scores)
StrategyTotalQALYs
IncrementalQALYs
Totalcosts (£)
Incrementalcosts (£) ICER (£)
Probability ofCE £20,000
Probability ofCE £30,000
Conventionaltherapy
9.977 – 88,692 – – – –
Certolizumab(with PAS)
11.551 1.574 125,205 36,513 23,199 0.390 0.759
Adalimumab 11.551 1.574 126,606 37,914 24,089 0.341 0.733
Etanercept 11.551 1.574 127,350 38,658 24,562 0.319 0.720
Certolizumab 11.551 1.574 128,777 40,085 25,469 0.272 0.702
CE, cost-effectiveness.The probability of CE £20,000/30,000 is the probability that the TNF-α inhibitor, compared with CC, is a cost-effectiveoption at the stated threshold.
DOI: 10.3310/hta20090 HEALTH TECHNOLOGY ASSESSMENT 2016 VOL. 20 NO. 9
© Queen’s Printer and Controller of HMSO 2016. This work was produced by Corbett et al. under the terms of a commissioning contract issued by the Secretary of State forHealth. This issue may be freely reproduced for the purposes of private research and study and extracts (or indeed, the full report) may be included in professional journalsprovided that suitable acknowledgement is made and the reproduction is not associated with any form of advertising. Applications for commercial reproduction should beaddressed to: NIHR Journals Library, National Institute for Health Research, Evaluation, Trials and Studies Coordinating Centre, Alpha House, University of Southampton SciencePark, Southampton SO16 7NS, UK.
159
Finally, it is important to appreciate that the assessments of cost-effectiveness reported in the York modelare based on a normative approach, that is they are based on the assumption that 12-week continuationrules (and ongoing monitoring of response) would be fully adhered to in clinical practice. Hence, they donot necessarily reflect the cost-effectiveness of how anti-TNFs are currently used in the management of ASwithin the NHS or how they might be used, in the event of positive guidance from the NICE in nr-AxSpA.The findings of West Midland Rheumatology Audit from 2010 give some grounds for potential concern.181
This regional audit was undertaken to assess compliance with the NICE guidelines (TA14317) in 17rheumatology centres across the East and West Midlands. The findings from this audit revealed that (1) theproportion of patients being assessed at 12 weeks after treatment initiation was suboptimal; (2) fewerthan 20% of patients with an inadequate response at 12 weeks had their treatment discontinued; and(3) fewer than half of the patients received regular 12-weekly assessments. During the course of ourassessment we contacted the British Society for Rheumatology Biologics Register (BSRBR) AnkylosingSpondylitis Register to assess the feasibility of obtaining access to data which has been collected since theregister was set up in 2012. Although our request was positively received, it was clear during ongoingdiscussions that the data and analyses requested could not be undertaken within the time frame ofour assessment.
INDEPENDENT ECONOMIC ASSESSMENT: YORK MODEL
NIHR Journals Library www.journalslibrary.nihr.ac.uk
160
Chapter 7 Assessment of factors relevant to theNHS and other parties
The results of this technology assessment have some implications for clinical practice. Existing NICEguidance recommends adalimumab, certolizumab, etanercept and golimumab for the treatment of AS
and therefore the use of these drugs is already widespread in the NHS. However, in the light of theadditional evidence presented here, the use of these agents in AS may increase further.
Furthermore, the available clinical evidence indicates that adalimumab, certolizumab and etanercept areeffective in patients with nr-AxSpA, although there is some uncertainty regarding the definition of thenr-AxSpA patient population who would benefit most from these anti-TNFs. The effectivenessdemonstrated in the nr-AxSpA population suggests that early treatment of AS/nr-AxSpA patients iswarranted. A key study on flares in AS suggested that the 12-week period required to confirm sustainedactive spinal disease in AS patients commencing an anti-TNF may be too long. The findings suggest thatshorter time periods may therefore be considered in future guidance, which would minimise the delay instarting treatment and the discomfort experienced by patients.
The potential extra cost to the NHS of providing anti-TNFs for patients with nr-AxSpA in addition to ASpatients is unclear because the prevalence of nr-AxSpA in the UK is somewhat uncertain. The potentiallylarge volume of new patients to be assessed for eligibility for anti-TNF treatment could add a large burdento existing services. NICE guidance recommending the use of adalimumab, certolizumab and etanercept innr-AxSpA would further increase the impact of these agents on the NHS budget.
DOI: 10.3310/hta20090 HEALTH TECHNOLOGY ASSESSMENT 2016 VOL. 20 NO. 9
© Queen’s Printer and Controller of HMSO 2016. This work was produced by Corbett et al. under the terms of a commissioning contract issued by the Secretary of State forHealth. This issue may be freely reproduced for the purposes of private research and study and extracts (or indeed, the full report) may be included in professional journalsprovided that suitable acknowledgement is made and the reproduction is not associated with any form of advertising. Applications for commercial reproduction should beaddressed to: NIHR Journals Library, National Institute for Health Research, Evaluation, Trials and Studies Coordinating Centre, Alpha House, University of Southampton SciencePark, Southampton SO16 7NS, UK.
161

Chapter 8 Discussion
Statement of principal findings
The systematic review of clinical efficacy identified a substantial and, generally, high-quality evidence baseon the efficacy and safety of anti-TNFs in patients with AS, either as individual treatments or as a commonclass; there was limited evidence to suggest meaningful differences between the therapies in termsof efficacy, other than infliximab providing more rapid improvements during the first few months oftreatment. The results of our meta-analyses demonstrated that anti-TNFs (when compared with placebo)produce statistically significant and clinically important benefits in patients with AS in terms of improvingfunction and reducing disease activity over a 3- to 6-month period (none of the trials maintainedrandomised treatment allocations across groups beyond 6 months). Of the limited number of trials whichreported quality-of-life outcomes, significant improvements were found following anti-TNF therapy but veryfew data were available on efficacy relating to any peripheral symptoms (other than enthesitis) or otherpossible symptoms such as uveitis, inflammatory bowel disease and psoriasis.
Although far fewer trials have been performed in the nr-AxSpA population, similar, although slightlysmaller, benefits were achieved. The smaller benefit was most noticeable for the function (BASFI) anddisease-activity (BASDAI 50) outcomes. However, in the nr-AxSpA trials, both clinical and statisticalheterogeneity were evident, bringing into question both the reliability of the nr-AxSpA meta-analysisresults and their true relevance to patients seen in clinical practice. This heterogeneity may have beencompounded by the inclusion criteria applied in previous nr-AxSpA trials. For example, ABILITY-158
recruited patients who fulfilled the ASAS classification criteria and relied on the expertise of the localclinicians and/or radiologists to read sacroiliac joint radiographs and MRI images, as happens in real clinicalpractice. RAPID-axSpA64 selected its population carefully by requiring objective evidence of disease activityat study entry by either a positive MRI showing signs of sacroiliac joint inflammation according to theASAS/OMERACT definition or an elevated than normal CRP level. The difficulty of identifying whichnr-AxSpA patients should receive anti-TNFs remains.
Results from open-label trial extension studies suggested that across all the anti-TNFs around half ofpatients still achieve a good level of response after around 2 years of treatment. The data also suggest thatat 5 years around 60% of golimumab patients, 50% of etanercept patients and 30% of adalimumabpatients still achieve a good treatment response. However, these longer-term studies were not aswell-reported as the RCTs, and their results were derived from less reliable data; it is therefore unknownif these are true treatment differences or if they are a result of differences in the follow-up protocols(e.g. stopping rules) and/or methods used to impute missing data.
Evidence for an effect of anti-TNFs on radiographic disease progression was limited; the relativelyshort-term follow-up available to date and the insensitivity of radiography as an imaging tool precludedthe drawing of firm conclusions regarding the role of anti-TNFs in preventing or delaying the progressionof AS. There are some data to suggest an identifiable benefit from around 4 years but results fromongoing long-term studies should help to clarify this issue.
The results from studies based on registry data demonstrated that sequential treatment with anti-TNFs canbe worthwhile in patients with AS. However, the drug survival, response rates and benefits were reducedwith second and third anti-TNFs, with the proportion of BASDAI 50 responders falling approximately10% with each subsequent anti-TNF and the median BASDAIs and BASFIs achieved increasing (worsening).
DOI: 10.3310/hta20090 HEALTH TECHNOLOGY ASSESSMENT 2016 VOL. 20 NO. 9
© Queen’s Printer and Controller of HMSO 2016. This work was produced by Corbett et al. under the terms of a commissioning contract issued by the Secretary of State forHealth. This issue may be freely reproduced for the purposes of private research and study and extracts (or indeed, the full report) may be included in professional journalsprovided that suitable acknowledgement is made and the reproduction is not associated with any form of advertising. Applications for commercial reproduction should beaddressed to: NIHR Journals Library, National Institute for Health Research, Evaluation, Trials and Studies Coordinating Centre, Alpha House, University of Southampton SciencePark, Southampton SO16 7NS, UK.
163
Data from large systematic reviews, which included patients with a wide range of diseases, suggest that,in the short-term, anti-TNFs as a group are associated with significantly higher rates of serious infections,tuberculosis reactivation, non-melanoma skin cancer, total AEs and withdrawals because of AEs thancontrol treatments. Specifically, infliximab is associated with significantly higher rates of total AEs andwithdrawals because of AEs, and certolizumab pegol is associated with significantly higher rates of seriousinfections and SAEs. Evaluations of longer-term data are more scarce and are limited by small sample sizesand uncontrolled designs. They suggest similar safety profiles across anti-TNFs, other than a higherincidence of injection site reactions following treatment with etanercept.
The systematic review of cost-effectiveness studies revealed significant conceptual issues and uncertaintiesarising from previously published studies and the submissions made by manufacturers. For this reason, ade novo model (‘York model’) was developed. Although it shared some of the assumptions and parameterestimates from the manufacturer models, it was based on a different conceptual structure and applies amore generalised framework for the synthesis of data from the double-blind periods of existing RCTs,combined with a more explicit approach to modelling the progressive nature of AS and nr-AxSpA and thepotential impact of the TNF-α inhibitors.
Based on an underlying assumption of similarity in the clinical effectiveness of each of the TNF-α inhibitors,the York model demonstrates that the cost-effectiveness results are dependent on several factors, including(1) the different acquisition and administration costs; (2) the rebound assumption applied to patients whodiscontinue therapy; (3) the magnitude of the change in BASDAI/BASFI scores assumed for respondersversus non-responders; (4) the different baseline BASDAI/BASFI scores assumed for responders versusnon-responders; and (5) the impact of TNF-α inhibitors on the rate of longer-term BASFI progression.
Although there are a number of important differences in approaches both among the differentmanufacturer models and compared with the York model, the comparison of ICERs based on the Yorkrebound equal to gain scenario appear broadly consistent with those reported by the manufacturers inboth populations.
Strengths and limitations of the assessment
StrengthsThrough our comprehensive searches we sought to identify all relevant published and unpublished trials,which minimised the possibility of publication or language biases affecting the review results. A fullevaluation of the risk of bias in each RCT was performed, which incorporated an additional assessment ofkey baseline characteristics to allow firmer judgements to be made on the risk of selection bias. The useof multiple-treatment meta-analyses allowed for greater precision in random-effect models, and thecalculation of relative risks was based on the population risk across all the trials. A key further strength ofour review lies in the extensive breadth of other types of study we included, such as non-randomised trialextension studies, registry studies of patients taking anti-TNFs, systematic reviews and other large studiesof adverse effects of anti-TNFs and a review of the natural history of AS and nr-AxSpA. Our review ofAEs incorporated a wealth of data from RCTs in patients on anti-TNFs with diseases other than AS andnr-AxSpA, although the results only relate to short-term use. Our review was performed according toCentre for Reviews and Dissemination guidance, so the potential for reviewer errors and biases wasminimised. Our review was reported according to the PRISMA (Preferred Reporting Items for SystematicReviews and Meta-Analyses) statement.
The York model confers several advantages over current cost-effectiveness studies by linking changes inBASFI to a more explicit clinical/biological process and facilitating a more formal consideration of thepotential impact of TNF-α inhibitors on BASFI, via the specific effects these drugs have on the differentprocesses which independently relate to this parameter. This approach allows consideration of the impacton BASFI that might be achieved via symptomatic improvements (i.e. in terms of reductions in disease
DISCUSSION
NIHR Journals Library www.journalslibrary.nihr.ac.uk
164
activity) and those which might be conferred by disease modification properties (i.e. the effect on thelikelihood and/or rate of further radiographic progression). The latter aspect is particularly importantgiven the increasing amount of published evidence reported on the potential impact of TNF-α inhibitorson radiographic progression that has not been formally considered or incorporated within existingcost-effectiveness studies. In addition, the evidence synthesis approach which underpins the York model isbased on a joint synthesis of related parameters which makes fuller use of existing evidence and which canmore appropriately estimate the input parameters and better characterise the uncertainty surrounding these.
LimitationsA key limitation of the systematic review was the variation in the reporting of outcomes across trials. ASAS20 was the most commonly reported responder outcome, but its value in determining efficacy wassomewhat limited by the relatively high rates of ‘placebo’ response associated with the 20% threshold.Results for 40%, 50% and 70% improvements (i.e. ASAS 40, ASAS 50 and ASAS 70) were reported lessfrequently, despite the fact that trial investigators would have had the data available to do so. Many trialsdid not report HRQoL outcomes and most trials were also limited in their assessment (or reporting) ofimprovement in any peripheral symptoms or symptoms of extra-articular manifestations. Although largelyfree of important biases, most RCTs had quite short durations (generally around 3 months) and severalwere limited by their small sample sizes (increasing the possibility of chance results for some outcomes).
Although we sought data beyond those available from RCTs, much of the data reported in studiesusing other designs may have been affected by biases or confounding; furthermore, key method details(e.g. imputation methods, or anti-TNF stopping rules) were often absent from publications. Much lessreliability and certainty could therefore be ascribed to the results obtained from these other studies.
The York model did not directly address important clinical questions concerning the issue of intermittentand sequential use of anti-TNFs because of the lack of robust clinical evidence from RCTs.
Uncertainties
l The magnitude of treatment effect of anti-TNFs in patients with nr-AxSpA remains uncertain becauseof the heterogeneous nature of the trials performed to date.
l The limited design and reporting of the studies looking at the long-term use of anti-TNFs means thereis uncertainty whether or not there are differences in efficacy between the different anti-TNFs in thelong term.
l The evidence on the long-term risk of AEs is uncertain because of small study sample sizes and thestudy designs used.
l The long-term impact of anti-TNFs on other important outcomes in AS and nr-AxSpA remain uncertain,such as AS-related causes of death (cardiac valvular disease, amyloidosis and fractures), andextra-articular symptoms such as uveitis, inflammatory bowel disease and psoriasis. Studies based onongoing anti-TNF registries (e.g. BSRBR) that record such data should inform this.
l With the patents of some anti-TNFs studied in this assessment due to expire shortly, biosimilars arelikely to become available in the next few years (CT-P13 became available early in 2015). As they aredifficult to produce, the number of biosimilars which will become available, and their price, is uncertain.
DOI: 10.3310/hta20090 HEALTH TECHNOLOGY ASSESSMENT 2016 VOL. 20 NO. 9
© Queen’s Printer and Controller of HMSO 2016. This work was produced by Corbett et al. under the terms of a commissioning contract issued by the Secretary of State forHealth. This issue may be freely reproduced for the purposes of private research and study and extracts (or indeed, the full report) may be included in professional journalsprovided that suitable acknowledgement is made and the reproduction is not associated with any form of advertising. Applications for commercial reproduction should beaddressed to: NIHR Journals Library, National Institute for Health Research, Evaluation, Trials and Studies Coordinating Centre, Alpha House, University of Southampton SciencePark, Southampton SO16 7NS, UK.
165

Chapter 9 Conclusions
Meta-analysis results derived from a substantial and, generally, high-quality evidence base on theefficacy of anti-TNFs in patients with AS (considered either as individual treatments or as a common
class) show statistically significant and clinically important benefits in terms of improved function andreduced disease activity following around 3 months of treatment with an anti-TNF. Smaller benefits wereseen across outcomes in patients with nr-AxSpA, being most noticeably smaller for the function anddisease-activity outcomes. However, in the light of the clinical and statistical heterogeneity seen across thenr-AxSpA trials, both the reliability of the nr-AxSpA-pooled estimates and their true relevance to patientsseen in clinical practice are questionable. Data from (less robust) observational studies suggest that goodlevels of treatment response are maintain in around 50% of patients after around 2 years of treatment.Evidence for an effect of anti-TNFs on radiographic disease progression is limited, although results fromongoing studies should clarify whether or not progression rates are reduced in the longer term. The resultsfrom studies based on registry data demonstrated that sequential treatment with anti-TNFs can beworthwhile in patients with AS, although drug survival, response rates and benefits were reduced withsecond and third anti-TNFs. Data from large systematic reviews, which included patients with a wide rangeof diseases, suggested that, in the short term, anti-TNFs as a group were associated with significantlyhigher rates of serious infections, tuberculosis reactivation, non-melanoma skin cancer, total AEs andwithdrawals because of AEs than control treatments. Longer-term data on AEs were limited.
Implications for service provision
l From our review of natural history a key study on flares suggested that the 12-week period requiredto confirm sustained active spinal disease in AS patients commencing an anti-TNF may be too long.The findings suggest that shorter time periods might therefore be considered in future guidance,which would minimise the delay in starting treatment and the discomfort experienced by patients.
Suggested research priorities
l Randomised trials are needed to identify the nr-AxSpA population that will benefit the most fromTNF-inhibitors; trials using stratified randomisation and pre-planned analyses by stratified group shouldinform this issue. Groups could be stratified according to their imaging status (i.e. MRI positive or not)and their CRP level; both the cut-off points to be used for CRP level elevation, and the eligibility criteriaused for CRP level elevation, should be given careful consideration, given the variation evident inprevious trials. These studies should help to inform clearer guidance as to what ASAS and the anti-TNFlicences mean when referring to ‘elevated CRP level’ in patients with nr-AxSpA. There is also a clearneed for more accurate biomarkers, or other measures of disease activity, to be developed. In theprevious nr-AxSpA trials the placebo-controlled phases typically lasted around 3 months; aplacebo-controlled follow-up period of at least 6 months in future trials would therefore be useful forstudying persistence of response.
l Long-term longitudinal studies are needed on the natural history of nr-AxSpA to help clarify thecharacteristics of patients who do (or do not) eventually develop AS. Similar to the RCT recommendations,these studies should include analyses stratified by how patients were diagnosed; a comparison of patientswith imaging (MRI) evidence of nr-AxSpA versus patients who are diagnosed with only clinical criteriaevidence, would be particularly useful, albeit difficult to perform.
DOI: 10.3310/hta20090 HEALTH TECHNOLOGY ASSESSMENT 2016 VOL. 20 NO. 9
© Queen’s Printer and Controller of HMSO 2016. This work was produced by Corbett et al. under the terms of a commissioning contract issued by the Secretary of State forHealth. This issue may be freely reproduced for the purposes of private research and study and extracts (or indeed, the full report) may be included in professional journalsprovided that suitable acknowledgement is made and the reproduction is not associated with any form of advertising. Applications for commercial reproduction should beaddressed to: NIHR Journals Library, National Institute for Health Research, Evaluation, Trials and Studies Coordinating Centre, Alpha House, University of Southampton SciencePark, Southampton SO16 7NS, UK.
167
l Large, long-term longitudinal, cohort studies are needed to clarify the effect of anti-TNFs on theprogression of structural damage in AS. In the absence of a gold standard imaging tool across thespectrum from nr-AxSpA to AS, sequential MRI and radiography assessment should be used atpre-defined end points to ascertain the true sensitivity and specificity of these tools in the diagnosisand assessment of neo-formation, and ankyloses characteristic of structural progression in the spineand sacroiliac joints of these patients.
Studies are also needed to better inform the efficacy estimates relating to sequential use of anti-TNFs.An ongoing study is looking at comparing the effect of intermittent versus standard use of anti-TNFs inpatients with stable (low-active) disease.182
CONCLUSIONS
NIHR Journals Library www.journalslibrary.nihr.ac.uk
168
Acknowledgements
We acknowledge Nicky Welton, Reader in Evidence Synthesis, School of Social and CommunityMedicine, University of Bristol, for the guidance provided in the development of the synthesis model.
Rider on responsibility for report
The views expressed in this report are those of the authors and not necessarily those of the NIHR HTAprogramme. Any errors are the responsibility of the authors.
Contributions of authors
Mark Corbett contributed to the protocol, study selection, data extraction, validity assessment, synthesisof the included studies, interpretation of the results and the writing of the report.
Marta Soares developed the extended synthesis model and undertook the evidence synthesis for thepurposes of the economic model. She also contributed to the development of the economic model andthe writing of the report.
Gurleen Jhuti contributed to the protocol, the development of the economic model, the review ofeconomic analyses, the interpretation of the results and the writing of the report.
Stephen Rice contributed to data extraction, validity assessment, undertook synthesis of the includedstudies for the clinical effectiveness section, contributed to the interpretation of the results and the writingof the report.
Eldon Spackman contributed to the development of the economic model, performed the economicanalyses and contributed to the interpretation of the results.
Eleftherios Sideris contributed to the review of economic evaluations, the development of the economicmodel and the writing of the report.
Thirimon Moe-Byrne contributed to the protocol, study selection, data extraction and validity assessmentof the included studies.
Dave Fox contributed to the protocol development, developed the search strategies, conducted a rangeof searches to locate studies and wrote the sections of the report relating to the searches.
Helena Marzo-Ortega provided expert clinical advice, contributed to the protocol, interpretation of theresults and commented on drafts of the report.
Lesley Kay provided expert clinical advice, contributed to the protocol, interpretation of the results andcommented on drafts of the report.
Nerys Woolacott contributed to the protocol, study selection, data extraction, validity assessment,synthesis of the included studies, interpretation of the results and the writing of the report, and tookoverall responsibility for the clinical effectiveness section.
Stephen Palmer had overall responsibility for the cost-effectiveness sections. He contributed to theprotocol development and to all aspects of the cost-effectiveness work including the writing of the report.
DOI: 10.3310/hta20090 HEALTH TECHNOLOGY ASSESSMENT 2016 VOL. 20 NO. 9
© Queen’s Printer and Controller of HMSO 2016. This work was produced by Corbett et al. under the terms of a commissioning contract issued by the Secretary of State forHealth. This issue may be freely reproduced for the purposes of private research and study and extracts (or indeed, the full report) may be included in professional journalsprovided that suitable acknowledgement is made and the reproduction is not associated with any form of advertising. Applications for commercial reproduction should beaddressed to: NIHR Journals Library, National Institute for Health Research, Evaluation, Trials and Studies Coordinating Centre, Alpha House, University of Southampton SciencePark, Southampton SO16 7NS, UK.
169
Data sharing statement
All available data are either included within the main report or available in the appendices.
ACKNOWLEDGEMENTS
NIHR Journals Library www.journalslibrary.nihr.ac.uk
170
References
1. Lipton S, Deodhar A. The new ASAS classification criteria for axial and peripheral spondyloarthritis.Int J Clin Rheumatol 2012;7:675–82. http://dx.doi.org/10.2217/ijr.12.61
2. Vanderlinden S, Valkenburg HA, Cats A. Evaluation of diagnostic-criteria for ankylosing-spondylitis – a proposal for modification of the New York criteria. Arthritis Rheum1984;27:361–8. http://dx.doi.org/10.1002/art.1780270401
3. Sieper J, Rudwaleit M, Baraliakos X, Brandt J, Braun J, Burgos-Vargas R, et al. The Assessment ofSpondyloArthritis international Society (ASAS) handbook: a guide to assess spondyloarthritis.Ann Rheum Dis 2009;68:1–44. http://dx.doi.org/10.1136/ard.2008.104018
4. Rudwaleit M, van der Heijde D, Landewe R, Listing J, Akkoc N, Brandt J, et al. The developmentof Assessment of SpondyloArthritis International Society classification criteria for axialspondyloarthritis (part II): validation and final selection. Ann Rheum Dis 2009;68:777–83.http://dx.doi.org/10.1136/ard.2009.108233
5. Goh L, Samanta A. Update on biologic therapies in ankylosing spondylitis: a literature review.Int J Rheum Dis 2012;15:445–54. http://dx.doi.org/10.1111/j.1756-185X.2012.01765.x
6. Robinson PC, Wordsworth BP, Reveille JD, Brown MA. Viewpoint axial spondyloarthritis: a newdisease entity, not necessarily early ankylosing spondylitis. Ann Rheum Dis 2013;72:162–4.http://dx.doi.org/10.1136/annrheumdis-2012-202073
7. van Tubergen A, Weber U. Diagnosis and classification in spondyloarthritis: identifying achameleon. Nat Rev Rheumatol 2012;8:253–61. http://dx.doi.org/10.1038/nrrheum.2012.33
8. Deodhar A. Rheumatologists Make Progress Defining Spectrum of Axial Spondyloarthritis.The Rheumatologist, May 2014. URL: www.the-rheumatologist.org/issue/may-2014(accessed 1 December 2015).
9. National Ankylosing Spondylitis Society. National Ankylosing Spondylitis Society (NASS) Website.URL: http://nass.co.uk/ (accessed 11 December 2014).
10. Landewe R, Dougados M, Mielants H, van der Tempel H, van der Heijde D. Physical function inankylosing spondylitis is independently determined by both disease activity and radiographicdamage of the spine. Ann Rheum Dis 2009;68:863–7. http://dx.doi.org/10.1136/ard.2008.091793
11. Braun J, Sieper J. Ankylosing spondylitis. Lancet 2007;369:1379–90. http://dx.doi.org/10.1016/S0140-6736(07)60635-7
12. Baraliakos X, Listing J, von der Recke A, Braun J. The natural course of radiographic progression inankylosing spondylitis – evidence for major individual variations in a large proportion of patients.J Rheumatol 2009;36:997–1002. http://dx.doi.org/10.3899/jrheum.080871
13. Healey EL, Haywood KL, Jordan KP, Garratt AM, Packham JC. Disease severity in ankylosingspondylitis: variation by region and local area deprivation. J Rheumatol 2010;37:633–8.http://dx.doi.org/10.3899/jrheum.090899
14. Healey EL, Haywood KL, Jordan KP, Garratt AM, Packham JC. Patients with well-establishedankylosing spondylitis show limited deterioration in a ten-year prospective cohort study.Clin Rheumatol 2013;32:67–72. http://dx.doi.org/10.1007/s10067-012-2092-3
15. Callhoff J, Sieper J, Weiss A, Zink A, Listing J. Efficacy of TNFα blockers in patients with ankylosingspondylitis and non-radiographic axial spondyloarthritis: a meta-analysis. Ann Rheum Dis2015;74:1241–8. http://dx.doi.org/10.1136/annrheumdis-2014-205322
DOI: 10.3310/hta20090 HEALTH TECHNOLOGY ASSESSMENT 2016 VOL. 20 NO. 9
© Queen’s Printer and Controller of HMSO 2016. This work was produced by Corbett et al. under the terms of a commissioning contract issued by the Secretary of State forHealth. This issue may be freely reproduced for the purposes of private research and study and extracts (or indeed, the full report) may be included in professional journalsprovided that suitable acknowledgement is made and the reproduction is not associated with any form of advertising. Applications for commercial reproduction should beaddressed to: NIHR Journals Library, National Institute for Health Research, Evaluation, Trials and Studies Coordinating Centre, Alpha House, University of Southampton SciencePark, Southampton SO16 7NS, UK.
171
16. Bakland G, Gran JT, Nossent JC. Increased mortality in ankylosing spondylitis is related to diseaseactivity. Ann Rheum Dis 2011;70:1921–5. http://dx.doi.org/10.1136/ard.2011.151191
17. National Institute for Health and Care Excellence. Technology Appraisal TA143: AnkylosingSpondylitis – Adalimumab, Etanercept and Infliximab. London: NICE; 2008.
18. Rudwaleit M, Haibel H, Baraliakos X, Listing J, Marker-Hermann E, Zeidler H, et al. The earlydisease stage in axial spondylarthritis results from the German Spondyloarthritis Inception Cohort.Arthritis Rheum 2009;60:717–27. http://dx.doi.org/10.1002/art.24483
19. Reveille JD, Sims A-M, Danoy P, Evans DM, Leo P, Pointon JJ, et al. Genome-wide associationstudy of ankylosing spondylitis identifies non-MHC susceptibility loci. Nat Genet 2010;42:123–7.http://dx.doi.org/10.1038/ng.513
20. NHS Choices. Ankylosing Spondylitis. NHS Choices. URL: www.nhs.uk/conditions/Ankylosing-spondylitis/Pages/Introduction.aspx (accessed 29 April 2014).
21. Reveille JD, Weisman MH. The epidemiology of back pain, axial spondyloarthritis and HLA-B27in the United States. Am J Med Sci 2013;345:431–6. http://dx.doi.org/10.1097/MAJ.0b013e318294457f
22. Sieper J, van der Heijde D. Review: nonradiographic axial spondyloarthritis: new definition of anold disease? Arthritis Rheum 2013;65:543–51. http://dx.doi.org/10.1002/art.37803
23. National Institute for Health and Care Excellence. Ankylosing Spondylitis: Prevalence. London:NICE; 2013. URL: http://cks.nice.org.uk/ankylosing-spondylitis#!backgroundsub:2 (accessed29 April 2014).
24. Machado P, Landewe R, Braun J, Hermann KG, Baraliakos X, Baker D, et al. A stratified model forhealth outcomes in ankylosing spondylitis. Ann Rheum Dis 2011;70:1758–64. http://dx.doi.org/10.1136/ard.2011.150037
25. Wanders AJB, Landewe RBM, Spoorenberg A, Dougados M, van der Linden S, Mielants H, et al.What is the most appropriate radiologic scoring method for ankylosing spondylitis? ArthritisRheum 2004;50:2622–32. http://dx.doi.org/10.1002/art.20446
26. Hróbjartsson A. What are the main methodological problems in the estimation of placeboeffects? J Clin Epidemiol 2002;55:430–5. http://dx.doi.org/10.1016/S0895-4356(01)00496-6
27. Hawkins N, Scott DA. Cost-effectiveness analysis: discount the placebo at your peril. Med DecisMaking 2010;30:536–43. http://dx.doi.org/10.1177/0272989X10362106
28. Cooksey R, Brophy S, Gravenor MB, Brooks CJ, Burrows CL, Siebert S. Frequency andcharacteristics of disease flares in ankylosing spondylitis. Rheumatology 2010;49:929–32.http://dx.doi.org/10.1093/rheumatology/kep435
29. Hróbjartsson A, Gøtzsche PC. Placebo interventions for all clinical conditions. Cochrane DatabaseSys Rev 2010;1:CD003974. http://dx.doi.org/10.1002/14651858.cd003974.pub3
30. Braun J, van den Berg R, Baraliakos X, Boehm H, Burgos-Vargas R, Collantes-Estevez E, et al.2010 update of the ASAS/EULAR recommendations for the management of ankylosingspondylitis. Ann Rheum Dis 2011;70:896–904. http://dx.doi.org/10.1136/ard.2011.151027
31. Dagfinrud H, Hagen KB, Kvien TK. Physiotherapy interventions for ankylosing spondylitis.Cochrane Database Sys Rev 2008;1:CD002822. http://dx.doi.org/10.1002/14651858.cd002822.pub3
32. National Ankylosing Spondylitis Society (NASS). Looking Ahead: Best Practice for the Care ofPeople with Ankylosing Spondylitis (AS). Richmond: NASS; 2013.
REFERENCES
NIHR Journals Library www.journalslibrary.nihr.ac.uk
172
33. National Institute for Health and Care Excellence. Technology Appraisal TA233: AnkylosingSpondylitis – Golimumab. London: NICE; 2011.
34. AbbVie. National Institute for Health and Care Excellence (NICE) Multiple Technology Appraisal:TNF-alpha Inhibitors for Severe Active Ankylosing Spondylitis and Severe Axial Spondyloarthritiswithout Radiographic Evidence of Ankylosing Spondylitis. Submission by AbbVie, manufacturer ofadalimumab (HUMIRA®), September 2014.
35. UCB. National Institute for Health and Care Excellence (NICE) Multiple Technology Appraisal:Certolizumab Pegol for the Treatment of Ankylosing Spondylitis and Axial Spondyloarthritiswithout Radiographic Evidence of Ankylosing Spondylitis. Submission by UCB, manufacturer ofcertolizumab pegol, September 2014.
36. Pfizer. National Institute for Health and Care Excellence (NICE) Multiple Technology Appraisal:Ankylosing Spondylitis and Axial Spondyloarthritis (Non-radiographic) – Adalimumab, EtanerceptInfliximab and Golimumab. Submission by Pfizer, manufacturer of etanercept (Enbrel®),September 2014.
37. Merck Sharp & Dohme. National Institute for Health and Care Excellence (NICE) MultipleTechnology Appraisal: TNF-alpha Inhibitors for Ankylosing Spondylitis and Axial Spondyloarthritiswithout Radiographic Evidence of Ankylosing Spondylitis (Including a Review of TA143 and TA233).Submission by Merck Sharp & Dohme, manufacturer of golimumab (Simponi®), September 2014.
38. McLeod C, Bagust A, Boland A, Dagenais P, Dickson R, Dundar Y, et al. Adalimumab, etanerceptand infliximab for the treatment of ankylosing spondylitis: a systematic review and economicevaluation. Health Technol Assess 2007;11(28). http://dx.doi.org/10.3310/hta11280
39. Higgins JPT, Altman DG, Gotzsche PC, Jueni P, Moher D, Oxman AD, et al. The CochraneCollaboration’s tool for assessing risk of bias in randomised trials. BMJ 2011;343:d5928.http://dx.doi.org/10.1136/bmj.d5928
40. Corbett MS, Higgins JPT, Woolacott NF. Assessing baseline imbalance in randomised trials:implications for the Cochrane risk of bias tool. JRSM 2014;5:79–85. http://dx.doi.org/10.1002/jrsm.1090
41. Pedersen SJ, Sorensen IJ, Loft AG, Hindrup JS, Thamsborg G, Asmussen K, et al. Efficacy ofAdalimumab in Patients with Axial Spondyloarthritis: Results of an Investigator-Initiated 12-WeeksRandomized Double-Blind Placebo Controlled Trial with a 12 Weeks Open-Label Extension Phase.Annual European Congress of Rheumatology of the European League Against Rheumatism,EULAR, Madrid, 12–15 June 2013.
42. Sieper J, Lenaerts J, Wollenhaupt J, Rudwaleit M, Mazurov VI, Myasoutova L, et al. Efficacy andsafety of infliximab plus naproxen versus naproxen alone in patients with early, active axialspondyloarthritis: results from the double-blind, placebo-controlled INFAST study, Part 1.Ann Rheum Dis 2014;73:101–7. http://dx.doi.org/10.1136/annrheumdis-2012-203201
43. Dougados M, Wood E, Combe B, Schaeverbeke T, Miceli-Richard C, Berenbaum F, et al.Evaluation of the nonsteroidal anti-inflammatory drug-sparing effect of etanercept in axialspondyloarthritis: results of the multicenter, randomized, double-blind, placebo-controlled SPARSEstudy. Arthritis Res Ther 2014;16:481. http://dx.doi.org/10.1186/s13075-014-0481-5
44. ClinicalTrials.gov. Danish Multicenter Study of Adalimumab in Spondyloarthritis. URL:http://ClinicalTrials.gov/show/NCT00477893 (accessed 1 December 2014).
45. ClinicalTrials.gov. Effect of Golimumab in Participants with Active Axial Spondyloarthritis(P07642 AM2). URL: http://ClinicalTrials.gov/show/NCT01453725 (accessed 1 December 2014).
DOI: 10.3310/hta20090 HEALTH TECHNOLOGY ASSESSMENT 2016 VOL. 20 NO. 9
© Queen’s Printer and Controller of HMSO 2016. This work was produced by Corbett et al. under the terms of a commissioning contract issued by the Secretary of State forHealth. This issue may be freely reproduced for the purposes of private research and study and extracts (or indeed, the full report) may be included in professional journalsprovided that suitable acknowledgement is made and the reproduction is not associated with any form of advertising. Applications for commercial reproduction should beaddressed to: NIHR Journals Library, National Institute for Health Research, Evaluation, Trials and Studies Coordinating Centre, Alpha House, University of Southampton SciencePark, Southampton SO16 7NS, UK.
173
46. Brandt J, Khariouzov A, Listing J, Haibel H, Sorensen H, Grassnickel L, et al. Six-month results of adouble-blind, placebo-controlled trial of etanercept treatment in patients with active ankylosingspondylitis. Arthritis Rheum 2003;48:1667–75. http://dx.doi.org/10.1002/art.11017
47. Zhang J, Huang F, Chen SL, Gu JR, Li ZG, Wu DH, et al. A multicenter, double-blind,placebo-controlled, randomized III clinical study of etanercept in the treatment of Chinesesubjects with active ankylosing spondylitis. Int J Rheum Dis 2010;13:151.
48. Zhang J, Zhang YM, Zhang JL, Deng XH, Huang F. [Efficacy of etanercept in patients withankylosing spondylitis: a double-blind, randomized, placebo controlled trial.] Chin J New Drugs2009;18:1846–9.
49. Inman RD, Maksymowych WP, Candle Study Group. A double-blind, placebo-controlled trial oflow dose infliximab in ankylosing spondylitis. J Rheumatol 2010;37:1203–10. http://dx.doi.org/10.3899/jrheum.091042
50. Barkham N, Keen HI, Coates LC, O’Connor P, Hensor E, Fraser AD, et al. Clinical and imagingefficacy of infliximab in HLA-B27-positive patients with magnetic resonance imaging-determinedearly sacroiliitis. Arthritis Rheum 2009;60:946–54. [Erratum published in Arthritis Rheum2010;62:3005.] http://dx.doi.org/10.1002/art.24408
51. Barkham N, Keen HI, Coates LC, O’Connor P, Hensor EMA, Fraser A, et al. A randomizedcontrolled trial of infliximab shows clinical and MRI efficacy in HLA B27 positive very earlyankylosing spondylitis. Clin Exp Rheumatol 2008;26:745.
52. Haibel H, Rudwaleit M, Listing J, Heldmann F, Wong RL, Kupper H, et al. Efficacy of adalimumabin the treatment of axial spondylarthritis without radiographically defined sacroiliitis: results of atwelve-week randomized, double-blind, placebo-controlled trial followed by an open-labelextension up to week fifty-two. Arthritis Rheum 2008;58:1981–91. http://dx.doi.org/10.1002/art.23606
53. Haibel H, Rudwaleit M, Heldmann F, Listing J, Wong R, Kupper H, et al. Adalimumab is effectivein patients with preradiographic axial spondyloarthritis: results of a 12-week, randomizedcontrolled trial. Rheumatology 2007;46(Suppl. 1):i52.
54. Haibel H, Rudwaleit M, Heldmann F, Listing J, Wong R, Kupper H, et al. Efficacy of adalimumabin the treatment of preradiographic axial spondyloarthritis: results of a 12-week, randomizedcontrolled trial. Arthritis Rheum 2006;54:4044–5. http://dx.doi.org/10.1002/art.23606
55. Hu Z, Xu M, Li Q, Lin Z, Liao Z, Cao S, et al. Adalimumab significantly reduces inflammation andserum DKK-1 level but increases fatty deposition in lumbar spine in active ankylosing spondylitis.Int J Rheum Dis 2012;15:358–65. [Erratum published in Int J Rheum Dis 2012;15:564.]http://dx.doi.org/10.1111/j.1756-185X.2012.01734.x
56. Huang F, Gu J, Zhu P, Bao C, Xu J, Xu H, et al. Efficacy and safety of adalimumab in Chineseadults with active ankylosing spondylitis: results of a randomised, controlled trial. Ann Rheum Dis2014;73:587–94. http://dx.doi.org/10.1136/annrheumdis-2012-202533
57. Lambert RG, Salonen D, Rahman P, Inman RD, Wong RL, Einstein SG, et al. Adalimumabsignificantly reduces both spinal and sacroiliac joint inflammation in patients with ankylosingspondylitis: a multicenter, randomized, double-blind, placebo-controlled study. Arthritis Rheum2007;56:4005–14. http://dx.doi.org/10.1002/art.23044
58. Sieper J, van der Heijde D, Dougados M, Mease PJ, Maksymowych WP, Brown MA, et al. Efficacyand safety of adalimumab in patients with non-radiographic axial spondyloarthritis: results of arandomised placebo-controlled trial (ABILITY-1). Ann Rheum Dis 2013;72:815–22. http://dx.doi.org/10.1136/annrheumdis-2012-201766
REFERENCES
NIHR Journals Library www.journalslibrary.nihr.ac.uk
174
59. Sieper J, Van Der Heijde D, Dougados M, Mease PJ, Brown LS, Pangan A. Efficacy and safetyof adalimumab in patients with non-radiographic axial spondyloarthritis results from aphase 3 study. Arthritis Rheum 2011;63(Suppl. 10):2486A. http://dx.doi.org/10.1136/annrheumdis-2012-201766
60. Maksymowych WP, Mease PJ, Rao S, Pangan A, Brown LS, Arora V, et al. Effect of adalimumabon function, health-related quality of life, work productivity, and daily activities in patients withnon-radiographic axial spondyloarthritis. Arthritis Rheum 2011;63(Suppl. 10):1312.
61. van der Heijde D, Kivitz A, Schiff MH, Sieper J, Dijkmans BA, Braun J, et al. Efficacy and safetyof adalimumab in patients with ankylosing spondylitis: results of a multicenter, randomized,double-blind, placebo-controlled trial. Arthritis Rheum 2006;54:2136–46. http://dx.doi.org/10.1002/art.21913
62. Davis JC Jr, Revicki D, van der Heijde DM, Rentz AM, Wong RL, Kupper H, et al. Health-relatedquality of life outcomes in patients with active ankylosing spondylitis treated with adalimumab:results from a randomized controlled study. Arthritis Rheum 2007;57:1050–7. http://dx.doi.org/10.1002/art.22887
63. Davis J, Kivitz A, Schiff M, Sieper J, Dijkmans B, Braun J, et al. Major clinical response and partialremission in ankylosing spondylitis subjects treated with adalimumab: the ATLAS trial. ArthritisRheum 2005;52:S208–9.
64. Landewe R, Braun J, Deodhar A, Dougados M, Maksymowych WP, Mease PJ, et al. Efficacy ofcertolizumab pegol on signs and symptoms of axial spondyloarthritis including ankylosingspondylitis: 24-week results of a double-blind randomised placebo-controlled Phase 3 study.Ann Rheum Dis 2014;73:39–47. http://dx.doi.org/10.1136/annrheumdis-2013-204231
65. van der Heijde D, Maksymowych WP, Landewe R, Stach C, Hoepken B, Fichtner A, et al. Effectof certolizumab pegol on inflammation of spine and sacroiliac joints in patients with axialspondyloarthritis: 12-week magnetic resonance imaging results of rapid-axSpA study. Ann RheumDis 2013;72:A515–16. http://dx.doi.org/10.1136/annrheumdis-2013-eular.1546
66. Sieper J, Kivitz A, Van Tubergen A, Deodhar A, Coteur G, Woltering F, et al. Rapid improvementsin patient-reported outcomes with certolizumab pegol in patients with axial spondyloarthritis,including ankylosing spondylitis: 24-week results of rapid-axSpA study. Ann Rheum Dis2013;72(Suppl. 3):A287. http://dx.doi.org/10.1136/annrheumdis-2013-eular.888
67. Landewe R, Rudwaleit M, van der Heijde D, Dougados M, Maksymowych WP, Braun J, et al. Effectof certolizumab pegol on signs and symptoms of axial spondyloarthritis, including ankylosingspondylitis and non-radiographic axial spondyloarthritis: 24-week results of rapid-axSpA study.Ann Rheum Dis 2013;72:A86–7. http://dx.doi.org/10.1136/annrheumdis-2013-eular.311
68. Sieper J, Kivitz A, Van Tubergen A, Deodhar A, Coteur G, Woltering F, et al. Rapid improvementsin patient-reported outcomes with certolizumab pegol in patients with axial spondyloarthritis,including ankylosing spondylitis and non-radiographic axial spondyloarthritis: 24-week results ofa phase 3 double blind randomized placebo-controlled study. Value Health 2013;16:A227.http://dx.doi.org/10.1016/j.jval.2013.03.1150
69. Landewe RBM, Rudwaleit M, van der Heijde D, Dougados M, Maksymowych WP, Braun J, et al.Effect of certolizumab pegol on signs and symptoms of ankylosing spondylitis and non-radiographicaxial spondyloarthritis: 24 week results of a double blind randomized placebo-controlled phase 3axial spondyloarthritis study. Arthritis Rheum 2012;64:S336–7.
DOI: 10.3310/hta20090 HEALTH TECHNOLOGY ASSESSMENT 2016 VOL. 20 NO. 9
© Queen’s Printer and Controller of HMSO 2016. This work was produced by Corbett et al. under the terms of a commissioning contract issued by the Secretary of State forHealth. This issue may be freely reproduced for the purposes of private research and study and extracts (or indeed, the full report) may be included in professional journalsprovided that suitable acknowledgement is made and the reproduction is not associated with any form of advertising. Applications for commercial reproduction should beaddressed to: NIHR Journals Library, National Institute for Health Research, Evaluation, Trials and Studies Coordinating Centre, Alpha House, University of Southampton SciencePark, Southampton SO16 7NS, UK.
175
70. Sieper J, Kivitz AJ, Van Tubergen AM, Deodhar AA, Coteur G, Woltering F, et al. Rapidimprovements in patient reported outcomes with certolizumab pegol in patients with axialspondyloarthritis, including ankylosing spondylitis and non-radiographic axial spondyloarthritis:24 week results of a phase 3 double blind randomized placebo-controlled study. Arthritis Rheum2012;64:S243.
71. Barkham N, Coates LC, Keen H, Hensor E, Fraser A, Redmond A, et al. Double-blind placebo-controlledtrial of etanercept in the prevention of work disability in ankylosing spondylitis. Ann Rheum Dis2010;69:1926–8. [Erratum published in Ann Rheum Dis2011;70:151.] http://dx.doi.org/10.1136/ard.2009.121327
72. Davis JC Jr, Van Der Heijde D, Braun J, Dougados M, Cush J, Clegg DO, et al. Recombinant humantumor necrosis factor receptor (etanercept) for treating ankylosing spondylitis: a randomized,controlled trial. Arthritis Rheum 2003;48:3230–6. http://dx.doi.org/10.1002/art.11325
73. Davis JC, van der Heijde D, Braun J, Dougados M, Cush JJ, Clegg DO, et al. Etanercept (Enbrel®)improves signs and symptoms of ankylosing spondylitis: Results of a phase 3 multicenter clinicaltrial. Ann Rheum Dis 2003;62(Suppl. 1):65.
74. Dougados M, Braun J, Szanto S, Combe B, Elbaz M, Geher P, et al. Efficacy of etanercept onrheumatic signs and pulmonary function tests in advanced ankylosing spondylitis: results of arandomised double-blind placebo-controlled study (SPINE). Ann Rheum Dis 2011;70:799–804.[Erratum appears in Ann Rheum Dis 2011;70:1349]. http://dx.doi.org/10.1136/ard.2010.139261
75. Dougados M, Braun J, Szanto S, Combe B, Elbaz M, Geher P, et al. Efficacy of etanercept onrheumatic signs and pulmonary function tests in advanced ankylosing spondylitis. Results of arandomized double blind placebo-controlled study (SPINE). Arthritis Rheum 2009;60:524.http://dx.doi.org/10.1136/ard.2010.139261
76. Dougados M. Symptomatic efficacy of etanercept and its effects on objective signs of inflammationin early nonradiographic axial spondyloarthritis: a multicenter, randomized, double-blind,placebo-controlled trial. Arthritis Rheum 2014;66:2091–102. http://dx.doi.org/10.1002/art.38721
77. Dougados M, van der Heijde D, Sieper J, Braun J, Maksymowych WP, Citera G, et al. Clinical andimaging efficacy of etanercept in early non-radiographic axial spondyloarthritis: a 12-week,randomized, double-blind, placebo-controlled trial. Ann Rheum Dis 2013;72:A87–8. http://dx.doi.org/10.1136/annrheumdis-2013-eular.313
78. Dougados M, Tsai WC, Saaibi DL, Bonin R, Bukowski J, Pedersen R, et al. Patient-reportedoutcomes of etanercept in early non-radiographic axial spondyloarthritis: a 12-week, randomized,double-blind, placebo-controlled trial. Arthritis Rheum 2013;65:S656–7.
79. Gorman JD, Sack KE, Davis JC Jr. Treatment of ankylosing spondylitis by inhibition of tumor necrosisfactor alpha. N Engl J Med 2002;346:1349–56. http://dx.doi.org/10.1056/NEJMoa012664
80. Gorman JD, Sack KE, Davis JC. Efficacy of etanercept (Enbrel®) in the treatment of ankylosingspondylitis: a randomized, placebo-controlled, double-blind study. Arthritis Rheum 2001;44:2947.
81. Gorman JD, Sack KE, Davis JC. A randomized, double-blind, placebo-controlled trial of (Enbrel®)in the treatment of ankylosing spondylitis. Arthritis Rheum 2001;44:S90.
82. Gorman JD, Sack KE, Davis JC. Etanercept in the treatment of ankylosing spondylitis: arandomized, double-blind, placebo-controlled study. Arthritis Rheum 2000;43:S403.
83. Calin A, Dijkmans BA, Emery P, Hakala M, Kalden J, Leirisalo-Repo M, et al. Outcomes of amulticentre randomised clinical trial of etanercept to treat ankylosing spondylitis. Ann Rheum Dis2004;63:1594–600. http://dx.doi.org/10.1136/ard.2004.020875
REFERENCES
NIHR Journals Library www.journalslibrary.nihr.ac.uk
176
84. Calin A, Dijkmans B, Emery P, Hakala M, Kalden J, Leirisalo-Repo M, et al. Assessments of diseaseactivity and functionality by Enbrel-treated ankylosing spondylitis patients in a multicenter,placebo-controlled trial. Arthritis Rheum 2003;48:S172.
85. Calin A, Dijkmans B, Emery P, Hakala M, Kalden J, Leirisalo-Repo M, et al. A multicentre,placebo-controlled trial of enbrel in ankylosing spondylitis. Ann Rheum Dis 2003;62:95.
86. van der Heijde D, Da Silva JC, Dougados M, Geher P, van der Horst-Bruinsma I, Juanola X, et al.Etanercept 50mg once weekly is as effective as 25mg twice weekly in patients with ankylosingspondylitis. Ann Rheum Dis 2006;65:1572–7. http://dx.doi.org/10.1136/ard.2006.056747
87. Braun J, McHugh N, Singh A, Wajdula JS, Sato R. Improvement in patient-reported outcomes forpatients with ankylosing spondylitis treated with etanercept 50mg once-weekly and 25mgtwice-weekly. Rheumatology 2007;46:999–1004. http://dx.doi.org/10.1093/rheumatology/kem069
88. Giardina AR, Ferrante A, Ciccia F, Impastato R, Miceli MC, Principato A, et al. A 2-yearcomparative open label randomized study of efficacy and safety of etanercept and infliximab inpatients with ankylosing spondylitis. Rheumatol Int 2010;30:1437–40. http://dx.doi.org/10.1007/s00296-009-1157-3
89. Impastato R, Ciccia F, Ferrante A, Principato A, Giardina A, Cadelo M, et al. Infliximab andetanercept are both effective and safe in patients with ankylosing spondylitis. A two-yearrandomised study. Ann Rheum Dis 2007;66:399. http://dx.doi.org/10.1007/s00296-009-1157-3
90. Inman RD, Davis JC Jr, van der Heijde D, Diekman L, Sieper J, Kim SI, et al. Efficacy and safety ofgolimumab in patients with ankylosing spondylitis: results of a randomized, double-blind,placebo-controlled, phase III trial. Arthritis Rheum 2008;58:3402–12. http://dx.doi.org/10.1002/art.23969
91. Braun J, Davis J, Van Der Heijde D, Deodhar A, Diekman L, Sieper J, et al. Golimumab, a new,human, TNFA antibody, in ankylosing spondylitis: 24-week efficacy and safety results of thegolimumab, a new, human, a antibody, in ankylosing spondylitis: 24-week efficacy and safetyresults of the GO-RAISE study. Intern Med J 2009;39:A56.
92. Braun J, Davis J, Van Der Heijde D, Deodhar A, Diekman L, Sieper J, et al. Golimumab, a new,human, TNFalpha antibody, in ankylosing spondylitis (AS): 24-week efficacy and safety results ofthe go-raise study. Rheumatology 2009;48:i57.
93. Braun J, Davis JC, van der Heijde D, Diekman L, Sieper J, Kim SI, et al. Golimumab, a new,human, TNF-alpha antibody administered subcutaneously every 4 weeks, in ankylosing spondylitis:24-week efficacy and safety results of the randomized, placebo-controlled GO-RAISE study.Clin Exp Rheumatol 2008;26:747.
94. Braun J, Davis JC, Van der Heijde D, Diekman L, Sieper J, Kim SI, et al. Golimumab, a new,human, TNF-alpha antibody administered as a monthly subcutaneous injection in ankylosingspondylitis (AS): 24-week efficacy and safety results of the randomized, placebo-controlledGO-RAISE study. Arthritis Rheum 2007;56:4236–7.
95. Bao C, Huang F, Khan MA, Fei K, Wu Z, Han C, et al. Safety and efficacy of golimumab inChinese patients with active ankylosing spondylitis: 1-year results of a multicentre, randomized,double-blind, placebo-controlled phase III trial. Rheumatology 2014;53:1654–63. http://dx.doi.org/10.1093/rheumatology/keu132
96. Bao C, Huang F, Khan MA, Fei K, Wu Z, Hsia EC. Golimumab administered subcutaneously every4 weeks in Chinese patients with active ankylosing spondylitis: week 24 safety and efficacy resultsfrom a randomized, placebo-controlled study. Arthritis Rheum 2012;64:S589.
DOI: 10.3310/hta20090 HEALTH TECHNOLOGY ASSESSMENT 2016 VOL. 20 NO. 9
© Queen’s Printer and Controller of HMSO 2016. This work was produced by Corbett et al. under the terms of a commissioning contract issued by the Secretary of State forHealth. This issue may be freely reproduced for the purposes of private research and study and extracts (or indeed, the full report) may be included in professional journalsprovided that suitable acknowledgement is made and the reproduction is not associated with any form of advertising. Applications for commercial reproduction should beaddressed to: NIHR Journals Library, National Institute for Health Research, Evaluation, Trials and Studies Coordinating Centre, Alpha House, University of Southampton SciencePark, Southampton SO16 7NS, UK.
177
97. Tam L-S, Shang Q, Kun EW, Lee K-L, Yip M-L, Li M, et al. The effects of golimumab on subclinicalatherosclerosis and arterial stiffness in ankylosing spondylitis – a randomized, placebo-controlledpilot trial. Rheumatology 2014;53:1065–74. http://dx.doi.org/10.1093/rheumatology/ket469
98. Braun J, Brandt J, Listing J, Zink A, Alten R, Golder W, et al. Treatment of active ankylosingspondylitis with infliximab: a randomised controlled multicentre trial. Lancet 2002;359:1187–93.http://dx.doi.org/10.1016/S0140-6736(02)08215-6
99. Brandt J, Listing I, Alten R, Krause A, Gromnica-Ihle E, Kellner H, et al. Quality of life improvementin patients with severe ankylosing spondylitis upon treatment with the anti-TNF alpha antibodyinfliximab in a placebo controlled multicenter trial. Arthritis Rheum 2001;44:S89.
100. Marzo-Ortega H, McGonagle D, Jarrett S, Haugeberg G, Hensor E, O’Connor P, et al. Infliximabin combination with methotrexate in active ankylosing spondylitis: a clinical and imaging study.Ann Rheum Dis 2005;64:1568–75. http://dx.doi.org/10.1136/ard.2004.022582
101. Van den Bosch F, Kruithof E, Baeten D, Herssens A, de Keyser F, Mielants H, et al. Randomizeddouble-blind comparison of chimeric monoclonal antibody to tumor necrosis factor alpha(infliximab) versus placebo in active spondylarthropathy. Arthritis Rheum 2002;46:755–65.http://dx.doi.org/10.1002/art.511
102. van der Heijde D, Dijkmans B, Geusens P, Sieper J, DeWoody K, Williamson P, et al. Efficacy andsafety of infliximab in patients with ankylosing spondylitis: results of a randomized, placebo-controlled trial (ASSERT). Arthritis Rheum 2005;52:582–91. http://dx.doi.org/10.1002/art.20852
103. van der Heijde D, Landewe R, Baraliakos X, Houben H, van Tubergen A, Williamson P, et al.Radiographic findings following two years of infliximab therapy in patients with ankylosingspondylitis. Arthritis Rheum 2008;58:3063–70. http://dx.doi.org/10.1002/art.23901
104. van der Heijde D, Han C, DeVlam K, Burmester G, van den Bosch F, Williamson P, et al. Infliximabimproves productivity and reduces workday loss in patients with ankylosing spondylitis: resultsfrom a randomized, placebo-controlled trial. Arthritis Rheum 2006;55:569–74. http://dx.doi.org/10.1002/art.22097
105. van der Heijde D, Landewe R, Hermann K, Han J, Williamson P, Braun J. The effect of infliximabtherapy on spinal inflammation assessed by magnetic resonance imaging in a randomized,placebo-controlled trial of 279 patients with ankylosing spondylitis. Ann Rheum Dis 2005;64:317.
106. van der Heijde D, Han C, Bala M, Williamson P, Han J, Braun J. Infliximab improves fatigue andpain in patients with ankylosing spondylitis: results of a randomized, placebo-controlled trial(ASSERT). Ann Rheum Dis 2005;64:318–19.
107. Braun J, Maksymowych WP, Dougados M, Steinfeld S, Dewoody K, Williamson P, et al. Efficacyof infliximab in subgroups of patients with ankylosing spondylitis: results from the ankylosingspondylitis study for the evaluation of recombinant infliximab therapy (ASSERT). Ann Rheum Dis2004;63:402.
108. Braun J, Kellner H, Deodhar A, Inman R, Han C, DeWoody K, et al. Infliximab improves quality oflife in patients with ankylosing spondylitis: results of a randomized, placebo-controlled trial(ASSERT). Ann Rheum Dis 2004;63:402.
109. van der Heijde D, Dijkmans B, Geusens P, Sieper J, DeWoody K, Williamson R, et al. Efficacy andsafety of infliximab in patients with ankylosing spondylitis: results of a 24-week randomized,placebo-controlled trial (ASSERT). Arthritis Rheum 2005;52:582–91.
110. Park W, Hrycaj P, Jeka S, Kovalenko V, Lysenko G, Miranda P, et al. A randomised, double-blind,multicentre, parallel-group, prospective study comparing the pharmacokinetics, safety, andefficacy of CT-P13 and innovator infliximab in patients with ankylosing spondylitis: the PLANETASstudy. Ann Rheum Dis 2013;72:1605–12. http://dx.doi.org/10.1136/annrheumdis-2012-203091
REFERENCES
NIHR Journals Library www.journalslibrary.nihr.ac.uk
178
111. Park W, Hrycaj P, Kovalenko V, Miranda P, Gutierrez-Urena S, Lee Y, et al. A randomized,double-blind, phase 1 study demonstrates equivalence in pharmacokinetics, safety, and efficacy ofCT-P13 and infliximab in patients with ankylosing spondylitis. Ann Rheum Dis 2013;71:111.
112. Glintborg B, Ostergaard M, Krogh NS, Dreyer L, Kristensen HL, Hetland ML. Predictors oftreatment response and drug continuation in 842 patients with ankylosing spondylitis treatedwith anti-tumor necrosis factor: results from 8 years’ surveillance in the Danish nationwideDANBIO registry. Ann Rheum Dis 2010;69:2002–8. http://dx.doi.org/10.1136/ard.2009.124446
113. Pavy S, Brophy S, Calin A. Establishment of the minimum clinically important difference for thebath ankylosing spondylitis indices: a prospective study. J Rheumatol 2005;32:80–5.
114. US Food and Drug Administration (FDA). Summary Minutes of the Arthritis Advisory CommitteeMeeting July 23, 2013. Silver Spring, MD: FDA; 2013.
115. US Food and Drug Administration (FDA). FDA Briefing Package: sBLA 125160/215: Cimzia®
(Certolizumab) for the Treatment of Active Axial Spondyloarthritis, Including Patients withAnkylosing Spondylitis. Silver Spring, MD: FDA; 2013.
116. US Food and Drug Administration (FDA). FDA Briefing Package: sBLA 125057/323: Adalimumabfor the Treatment of Active Non-Radiographic Axial Spondyloarthritis in Adults with ObjectiveSigns of Inflammation by Elevated C-reactive Protein (CRP) or Magnetic Resonance Imaging (MRI),Who Have Had an Inadequate Response to, or are Intolerant to, a Nonsteroidal Anti-InflammatoryDrug. Silver Spring, MD: FDA; 2013.
117. van der Heijde D, Salonen D, Weissman BN, Landewe R, Maksymowych WP, Kupper H, et al.Assessment of radiographic progression in the spines of patients with ankylosing spondylitistreated with adalimumab for up to 2 years. Arthritis Res Ther 2009;11:R127. http://dx.doi.org/10.1186/ar2794
118. Boonen A, van der Heijde D, Landewe R, Guillemin F, Rutten-van Molken M, Dougados M, et al.Direct costs of ankylosing spondylitis and its determinants: an analysis among three Europeancountries. Ann Rheum Dis 2003;62:732–40. http://dx.doi.org/10.1136/ard.62.8.732
119. van der Heijde D, Landewe R, Einstein S, Ory P, Vosse D, Ni L, et al. Radiographic progression ofankylosing spondylitis after up to two years of treatment with etanercept. Arthritis Rheum2008;58:1324–31. http://dx.doi.org/10.1002/art.23471
120. Braun J, Baraliakos X, Hermann KG, Deodhar A, van der Heijde D, Inman R, et al. The effect oftwo golimumab doses on radiographic progression in ankylosing spondylitis: results through4 years of the GO-RAISE trial. Ann Rheum Dis 2014;73:1107–13. http://dx.doi.org/10.1136/annrheumdis-2012-203075
121. Haroon N, Inman RD, Learch TJ, Weisman MH, Lee M, Rahbar MH, et al. The impact of tumornecrosis factor alpha inhibitors on radiographic progression in ankylosing spondylitis. ArthritisRheum 2013;65:2645–54. http://dx.doi.org/10.1002/art.38070
122. Baraliakos X, Haibel H, Listing J, Sieper J, Braun J. Continuous long-term anti-TNF therapy doesnot lead to an increase in the rate of new bone formation over 8 years in patients withankylosing spondylitis. Ann Rheum Dis 2014;73:710–15. http://dx.doi.org/10.1136/annrheumdis-2012-202698
123. Baraliakos X, Listing J, Brandt J, Haibel H, Rudwaleit M, Sieper J, et al. Radiographic progression inpatients with ankylosing spondylitis after 4 yrs of treatment with the anti-TNF-alpha antibodyinfliximab. Rheumatology 2007;46:1450–3. http://dx.doi.org/10.1093/rheumatology/kem166
DOI: 10.3310/hta20090 HEALTH TECHNOLOGY ASSESSMENT 2016 VOL. 20 NO. 9
© Queen’s Printer and Controller of HMSO 2016. This work was produced by Corbett et al. under the terms of a commissioning contract issued by the Secretary of State forHealth. This issue may be freely reproduced for the purposes of private research and study and extracts (or indeed, the full report) may be included in professional journalsprovided that suitable acknowledgement is made and the reproduction is not associated with any form of advertising. Applications for commercial reproduction should beaddressed to: NIHR Journals Library, National Institute for Health Research, Evaluation, Trials and Studies Coordinating Centre, Alpha House, University of Southampton SciencePark, Southampton SO16 7NS, UK.
179
124. Ramiro S, van der Heijde D, van Tubergen A, Stolwijk C, Dougados M, van den Bosch F, et al.Higher disease activity leads to more structural damage in the spine in ankylosing spondylitis:12-year longitudinal data from the OASIS cohort. Ann Rheum Dis 2014;73:1455–61.http://dx.doi.org/10.1136/annrheumdis-2014-205178
125. Ramiro S, Stolwijk C, van Tubergen A, van der Heijde D, Dougados M, van den Bosch F, et al.Evolution of radiographic damage in ankylosing spondylitis over 12 years of follow-up.Ann Rheum Dis 2013;72:665–6. http://dx.doi.org/10.1136/annrheumdis-2013-eular.1973
126. Bonafede M, Fox KM, Watson C, Princic N, Gandra SR. Treatment patterns in the first year afterinitiating tumor necrosis factor blockers in real-world settings. Adv Ther 2012;29:664–74.http://dx.doi.org/10.1007/s12325-012-0037-5
127. Choquette D, Sauvageau D, Raynauld JP. Retention rate of adalimumab, etanercept andinfliximab at 5 years in patients with ankylosing spondylitis: report from the rhumadatacomputerized database. Ann Rheum Dis 2013;71:647.
128. Gulfe A, Kapetanovic ML, Kristensen E. Efficacy and drug survival of anti-tumor necrosisfactor-alpha therapies in patients with non-radiographic axial spondyloarthritis: an observationalcohort study from Southern Sweden. Scand J Rheumatol 2014;43:493–7. http://dx.doi.org/10.3109/03009742.2014.918173
129. Nell-Duxneuner V, Schroeder Y, Reichardt B, Bucsics A. The use of TNF-inhibitors in ankylosingspondylitis in Austria from 2007 to 2009 – a retrospective analysis. Int J Clin Pharmacol Ther2012;50:867–72. http://dx.doi.org/10.5414/CP201707
130. Yeaw J, Watson C, Fox KM, Schabert VF, Goodman S, Gandra SR. Treatment patterns followingdiscontinuation of adalimumab, etanercept, and infliximab in a US managed care sample.Adv Ther 2014;31:410–25. http://dx.doi.org/10.1007/s12325-014-0110-3
131. Scire CA, Caporali R, Sarzi-Puttini P, Frediani B, Di Franco M, Tincani A, et al. Drug survivalof the first course of anti-TNF agents in patients with rheumatoid arthritis and seronegativespondyloarthritis: analysis from the MonitorNet database. Clin Exp Rheumatol 2013;31:857–63.
132. Zufferey P, Ghosn J, Becce F, Ciurea A, Aubry-Rozier B, Finckh A, et al. Anti-tumor necrosis factordrug survival in axial spondyloarthritis is independent of the classification criteria. Rheumatol Int2014;35:295–302. http://dx.doi.org/10.1007/s00296-014-3094-z
133. Pavelka K, Forejtova S, Stolfa J, Chroust K, Buresova L, Mann H, et al. Anti-TNF therapy ofankylosing spondylitis in clinical practice. Results from the Czech national registry ATTRA.Clin Exp Rheumatol 2009;27:958–63.
134. Lie E, van der Heijde D, Uhlig T, Mikkelsen K, Rødevand E, Koldingsnes W, et al. Effectiveness ofswitching between TNF inhibitors in ankylosing spondylitis: data from the NOR-DMARD register.Ann Rheum Dis 2011;70:157–63. http://dx.doi.org/10.1136/ard.2010.131797
135. Glintborg B, Ostergaard M, Krogh NS, Tarp U, Manilo N, Loft AGR, et al. Clinical response, drugsurvival and predictors thereof in 432 ankylosing spondylitis patients after switching tumournecrosis factor alpha inhibitor therapy: results from the Danish nationwide DANBIO registry.Ann Rheum Dis 2013;72:1149–55. http://dx.doi.org/10.1136/annrheumdis-2012-201933
136. Rudwaleit M, Claudepierre P, Wordsworth P, Cortina EL, Sieper J, Kron M, et al. Effectiveness,safety, and predictors of good clinical response in 1250 patients treated with adalimumab foractive ankylosing spondylitis. J Rheumatol 2009;36:801–8. http://dx.doi.org/10.3899/jrheum.081048
137. Singh JA, Wells GA, Christensen R, Ghogomu TE, Maxwell L, MacDonald JK, et al. Adverse effectsof biologics: a network meta-analysis and Cochrane overview. Cochrane Database Syst Rev2011;2:CD008794. http://dx.doi.org/10.1002/14651858.cd008794.pub2
REFERENCES
NIHR Journals Library www.journalslibrary.nihr.ac.uk
180
138. Askling J, Fahrbach K, Nordstrom B, Ross S, Schmid CH, Symmons D. Cancer risk with tumornecrosis factor alpha (TNF) inhibitors: meta-analysis of randomized controlled trials ofadalimumab, etanercept, and infliximab using patient level data. Pharmacoepidemiol Drug Saf2011;20:119–30. http://dx.doi.org/10.1002/pds.2046
139. Rodgers M, Epstein D, Bojke L, Yang H, Craig D, Fonseca T, et al. Etanercept, infliximab andadalimumab for the treatment of psoriatic arthritis: a systematic review and economic evaluation.Health Technol Assess 2011;15(10). http://dx.doi.org/10.3310/hta15100
140. van der Heijde D, Schiff MH, Sieper J, Kivitz AJ, Wong RL, Kupper H, et al. Adalimumabeffectiveness for the treatment of ankylosing spondylitis is maintained for up to 2 years: long-termresults from the ATLAS trial. Ann Rheum Dis 2009;68:922–9. http://dx.doi.org/10.1136/ard.2007.087270
141. Sieper J, van der Heijde D, Dougados M, Brown LS, Lavie F, Pangan AL. Early response toadalimumab predicts long-term remission through 5 years of treatment in patients with ankylosingspondylitis. Ann Rheum Dis 2012;71:700–6. http://dx.doi.org/10.1136/annrheumdis-2011-200358
142. Braun J, Deodhar A, Inman RD, van der Heijde D, Mack M, Xu S, et al. Golimumab administeredsubcutaneously every 4 weeks in ankylosing spondylitis: 104-week results of the GO-RAISE study.Ann Rheum Dis 2012;71:661–7. http://dx.doi.org/10.1136/ard.2011.154799
143. Deodhar A, Braun J, Inman RD, van der Heijde D, Zhou Y, Xu S, et al. Golimumab administeredsubcutaneously every 4 weeks in ankylosing spondylitis: 5-year results of the GO-RAISE study.Ann Rheum Dis 2015;74:757–61. http://dx.doi.org/10.1136/annrheumdis-2014-205862
144. Davis JC Jr, van der Heijde DM, Braun J, Dougados M, Clegg DO, Kivitz AJ, et al. Efficacy andsafety of up to 192 weeks of etanercept therapy in patients with ankylosing spondylitis.Ann Rheum Dis 2008;67:346–52. http://dx.doi.org/10.1136/ard.2007.078139
145. Davis JC, van der Heijde DM, Braun J, Dougados M, Cush J, Clegg D, et al. Sustained durabilityand tolerability of etanercept in ankylosing spondylitis for 96 weeks. Ann Rheum Dis2005;64:1557–62. http://dx.doi.org/10.1136/ard.2004.035105
146. Dijkmans B, Emery P, Hakala M, Leirisalo-Repo M, Mola EM, Paolozzi L, et al. Etanercept in thelongterm treatment of patients with ankylosing spondylitis. J Rheumatol 2009;36:1256–64.[Erratum published in J Rheumatol 2010;37:2198.] http://dx.doi.org/10.3899/jrheum.081033
147. Martin-Mola E, Sieper J, Leirisalo-Repo M, Dijkmans BA, Vlahos B, Pedersen R, et al. Sustainedefficacy and safety, including patient-reported outcomes, with etanercept treatment over 5 yearsin patients with ankylosing spondylitis. Clin Exp Rheumatol 2010;28:238–45.
148. Baraliakos X, Listing J, Fritz C, Haibel H, Alten R, Burmester GR, et al. Persistent clinical efficacyand safety of infliximab in ankylosing spondylitis after 8 years – early clinical responsepredicts long-term outcome. Rheumatology 2011;50:1690–9. http://dx.doi.org/10.1093/rheumatology/ker194
149. Dean LE, Macfarlane GJ, MacDonald AG. The Natural History of Ankylosing Spondylitis – Resultsfrom the Scotland and Ireland Registry for Ankylosing Spondylitis (SIRAS). British Society forRheumatology Annual Scientific Meeting. Liverpool: University of Aberdeen; 2013.
150. Stone MA, Sengupta R, Gordon D, Pomeroy E, Mogg R, Keat A. Longitudinal analyses of diseaseoutcomes in ankylosing spondylitis yield insight into the natural history of AS. Ann Rheum Dis2007;66:410.
151. Machado P, Landewe R, Braun J, Hermann KG, Baker D, van der Heijde D. Both structural damageand inflammation of the spine contribute to impairment of spinal mobility in patients with ankylosingspondylitis. Ann Rheum Dis 2010;69:1465–70. http://dx.doi.org/10.1136/ard.2009.124206
DOI: 10.3310/hta20090 HEALTH TECHNOLOGY ASSESSMENT 2016 VOL. 20 NO. 9
© Queen’s Printer and Controller of HMSO 2016. This work was produced by Corbett et al. under the terms of a commissioning contract issued by the Secretary of State forHealth. This issue may be freely reproduced for the purposes of private research and study and extracts (or indeed, the full report) may be included in professional journalsprovided that suitable acknowledgement is made and the reproduction is not associated with any form of advertising. Applications for commercial reproduction should beaddressed to: NIHR Journals Library, National Institute for Health Research, Evaluation, Trials and Studies Coordinating Centre, Alpha House, University of Southampton SciencePark, Southampton SO16 7NS, UK.
181
152. Kobelt G, Andlin-Sobocki P, Brophy S, Jonsson L, Calin A, Braun J. The burden of ankylosingspondylitis and the cost-effectiveness of treatment with infliximab (Remicade®). Rheumatology2004;43:1158–66. http://dx.doi.org/10.1093/rheumatology/keh271
153. Kiltz U, Baraliakos X, Karakostas P, Igelmann M, Kalthoff L, Klink C, et al. Do patients withnon-radiographic axial spondylarthritis differ from patients with ankylosing spondylitis?Arthritis Care Res 2012;64:1415–22. http://dx.doi.org/10.1002/acr.21688
154. Poddubnyy D, Rudwaleit M, Haibel H, Listing J, Maerker-Hermann E, Zeidler H, et al. Ratesand predictors of radiographic sacroiliitis progression over 2 years in patients with axialspondyloarthritis. Ann Rheum Dis 2011;70:1369–74. http://dx.doi.org/10.1136/ard.2010.145995
155. Poddubnyy D, Haibel H, Listing J, Marker-Hermann E, Zeidler H, Braun J, et al. Baselineradiographic damage, elevated acute-phase reactant levels, and cigarette smoking status predictspinal radiographic progression in early axial spondylarthritis. Arthritis Rheum 2012;64:1388–98.http://dx.doi.org/10.1002/art.33465
156. Stone MA, Pomeroy E, Keat A, Sengupta R, Hickey S, Dieppe P, et al. Assessment of the impactof flares in ankylosing spondylitis disease activity using the Flare Illustration. Rheumatology2008;47:1213–18. http://dx.doi.org/10.1093/rheumatology/ken176
157. Sampaio-Barros PD, Bortoluzzo AB, Conde RA, Costallat LTL, Samara AM, Bertolo MB.Undifferentiated spondyloarthritis: a longterm followup. J Rheumatol 2010;37:1195–9.http://dx.doi.org/10.3899/jrheum.090625
158. Sampaio-Barros PD, Bertolo MB, Kraemer MHS, Marques-Neto JF, Samara AM. Undifferentiatedspondyloarthropathies: a 2-year follow-up study. Clin Rheumatol 2001;20:201–6. http://dx.doi.org/10.1007/s100670170066
159. Boonen A, Sieper J, van der Heijde D, Dougados M, Bukowski JF, Valluri S, et al. The burden ofnon-radiographic axial spondyloarthritis. Semin Arthritis Rheum 2015;44:556–62. http://dx.doi.org/10.1016/j.semarthrit.2014.10.009
160. Kobelt G, Sobocki P, Sieper J, Braun J. Comparison of the cost-effectiveness of infliximab in thetreatment of ankylosing spondylitis in the United Kingdom based on two different clinical trials.Int J Technol Assess Health Care 2007;23:368–75. http://dx.doi.org/10.1017/S0266462307070432
161. Ara RM, Reynolds AV, Conway P. The cost-effectiveness of etanercept in patients with severeankylosing spondylitis in the UK. Rheumatology 2007;46:1338–44. http://dx.doi.org/10.1093/rheumatology/kem133
162. Botteman MF, Hay JW, Luo MP, Curry AS, Wong RL, Hout BA. Cost effectiveness of adalimumabfor the treatment of ankylosing spondylitis in the United Kingdom. Rheumatology 2007;46:1320–8.http://dx.doi.org/10.1093/rheumatology/kem031
163. Armstrong N, Joore M, van Asselt T, Misso K, Manning N, Tomini F, et al. Golimumab for thetreatment of ankylosing spondylitis: a NICE single technology appraisal. Pharmacoeconomics2013;31:415–25. http://dx.doi.org/10.1007/s40273-013-0049-2
164. ClinicalTrials.gov. Study Comparing Etanercept (ETN) Against a Placebo for Etanercept on aBackground Nonsteroidal Anti Inflammatory Drug (NSAIDs) in the Treatment of EarlySpondyloarthritis (SpA) Patients who do not Have X-ray Structural Changes (AS EARLY).ClinicalTrials.gov Identifier: NCT01258738.
165. ClinicalTrials.gov. Study Comparing Etanercept 50 mg Once Weekly to 25 mg Twice Weekly inPatients With Ankylosing Spondylitis. ClinicalTrials.gov Identifier: NCT00418548.
166. Braun J, Brandt J, Listing J, Zink A, Alten R, Burmester G, et al. Two year maintenance ofefficacy and safety of infliximab in the treatment of ankylosing spondylitis. Ann Rheum Dis2005;64:229–34. http://dx.doi.org/10.1136/ard.2004.025130
REFERENCES
NIHR Journals Library www.journalslibrary.nihr.ac.uk
182
167. Ara RM, Packham J, Haywood K. The direct healthcare resource costs associated with ankylosingspondylitis patients attending a UK secondary care rheumatology unit. Ann Rheum Dis2006;65:273.
168. Rafia R, Ara R, Packham J, Haywood K, Healey E. Healthcare costs and productivity losses directlyattributable to ankylosing spondylitis. Clin Exp Rheumatol 2012;30:246–53.
169. Keat A, Barkham N, Bhalla A, Gaffney K, Marzo-Ortega H, Paul S, et al. BSR guidelines forprescribing TNF-alpha blockers in adults with ankylosing spondylitis. Report of a working party ofthe British Society for Rheumatology. Rheumatology 2005;44:939–47. http://dx.doi.org/10.1093/rheumatology/keh669
170. Spiegelhalter DJ, Best NG, Carlin BR, van der Linde A. Bayesian measures of model complexityand fit. J R Stat Soc Ser B 2002;64:583–616. http://dx.doi.org/10.1111/1467-9868.00353
171. Welton N, Ades AE. Research decisions in the face of heterogeneity: what can a new study tellus? Health Econ 2012;21:1196–200. http://dx.doi.org/10.1002/hec.1797
172. Vastesaeger N, van der Heijde D, Inman RD, Wang YX, Deodhar A, Hsu B, et al. Predicting theoutcome of ankylosing spondylitis therapy. Ann Rheum Dis 2011;70:973–81. http://dx.doi.org/10.1136/ard.2010.147744
173. Lord PA, Farragher TM, Lunt M, Watson KD, Symmons DP, Hyrich KL, et al. Predictors ofresponse to anti-TNF therapy in ankylosing spondylitis: results from the British Society forRheumatology Biologics Register. Rheumatology 2010;49:563–70. http://dx.doi.org/10.1093/rheumatology/kep422
174. Dias S, Sutton AJ, Welton NJ, Ades AE. Evidence synthesis for decision making 3: heterogeneity –subgroups, meta-regression, bias, and bias-adjustment. Med Decis Making 2013;33:618–40.http://dx.doi.org/10.1177/0272989X13485157
175. National Institute for Health and Care Excellence. Technology Appraisal TA199: Etanercept,Infliximab and Adalimumab for the Treatment of Psoriatic Arthritis. London: NICE; 2010.
176. Department of Health. NHS Reference Costs 2012/13. London: Department of Health; 2013.
177. Poddubnyy D, Haibel H, Braun J, Rudwaleit M, Sieper J. Patients with non-radiographic axialspondyloarthritis and ankylosing spondylitis demonstrate the same clinical disease course over twoyears: results from the GESPIC cohort. Ann Rheum Dis 2014;73(Suppl. 2):201. http://dx.doi.org/10.1136/annrheumdis-2014-eular.3599
178. Joint Formulary Committee. British National Formulary (Online). London: BMJ Group andPharmaceutical Press. URL: www.medicinescomplete.com (accessed 8 December 2014).
179. Curtis L. Unit Costs of Health and Social Care 2013. Canterbury: PSSRU, University of Kent; 2013.
180. Henriksson M, Palmer S, Chen R, Damant J, Fitzpatrick NK, Abrams K, et al. Assessing the costeffectiveness of using prognostic biomarkers with decision models: case study in prioritisingpatients waiting for coronary artery surgery. BMJ 2010;340:b5606. http://dx.doi.org/10.1136/bmj.b5606
181. Rees F, Peffers G, Bell C, Obrenovic K, Sandhu R, Packham J, et al. Compliance with NICE guidanceon the use of anti-TNF alpha agents in ankylosing spondylitis: an east and west Midlands regionalaudit. Clin Med 2012;12:324–7. http://dx.doi.org/10.7861/clinmedicine.12-4-324
182. University Hospital Montpellier. Effect of Spacing of Anti-TNF Drugs in Ankylosing Spondylitis withLow Disease Activity (SPACING). ClinicalTrials.gov; 2012. URL: http://ClinicalTrials.gov/show/NCT01610947 (accessed 11 December 2014).
183. Higgins JPT, Green S. Cochrane Handbook for Systematic Reviews of Interventions. Version 5.1.0(updated March 2011). The Cochrane Collaboration; 2011.
DOI: 10.3310/hta20090 HEALTH TECHNOLOGY ASSESSMENT 2016 VOL. 20 NO. 9
© Queen’s Printer and Controller of HMSO 2016. This work was produced by Corbett et al. under the terms of a commissioning contract issued by the Secretary of State forHealth. This issue may be freely reproduced for the purposes of private research and study and extracts (or indeed, the full report) may be included in professional journalsprovided that suitable acknowledgement is made and the reproduction is not associated with any form of advertising. Applications for commercial reproduction should beaddressed to: NIHR Journals Library, National Institute for Health Research, Evaluation, Trials and Studies Coordinating Centre, Alpha House, University of Southampton SciencePark, Southampton SO16 7NS, UK.
183
184. Higgins JPT, Thompson SG. Quantifying heterogeneity in a meta-analysis. Stat Med2002;21:1539–58. http://dx.doi.org/10.1002/sim.1186
185. Haibel H, Rios V, Hermann KG, Althoff C, Rudwaleit M, Kupper H, et al. No progression ofchronic sacroiliac changes in patients with active, non-radiographic axial spondyloarthritis treatedwith adalimumab over 52 weeks. Arthritis Rheum 2009;60:1798.
186. Haibel H, Rudwaleit M, Amtenbrink A, Heldmann F, Listing J, Wong R, et al. Adalimumab iseffective in patients with preradiographic axial spondyloarthritis (PRSPA): results of a 12-week,randomised controlled trial with a 40-week open-label extension (OLE). Rheumatology2008;47:iI80.
187. Haibel H, Rudwaleit M, Amtenbrink A, Heldmann F, Listing J, Kupper H, et al. Efficacy ofadalimumab in the treatment of preradiographic axial spondyloarthritis: results of a 20-week,randomized controlled trial with an open-label extension phase. Z Rheumatol 2007;66:14.
188. Haibel H, Rudwaleit M, Amtenbrink A, Heldmann F, Listing J, Wong R, et al. Efficacy ofadalimumab in the treatment of preiradiographic axial spondyloarthritis: results of a 20-week,randomized controlled trial with an open-label extension phase. Ann Rheum Dis 2007;66:64.http://dx.doi.org/10.1002/art.23606
189. van der Heijde D, Maksymowych W, Sieper J, Lambert R, Brown MA, Rathmann S, et al. Relationshipbetween MRI and clinical remission in patients with non-radiographic axial spondyloarthritis aftertwo years of adalimumab therapy. Ann Rheum Dis 2013;72:A287. http://dx.doi.org/10.1136/annrheumdis-2013-eular.889
190. Sieper J, Baeten DL, Van Den Bosch F, Rathmann SS, Anderson J, Pangan AL. Sustained clinicalremission in patients with non-radiographic axial spondyloarthritis after two years of adalimumabtreatment. Ann Rheum Dis 2013;72:i140. http://dx.doi.org/10.1136/annrheumdis-2013-eular.314
191. Sieper J, Van Der Heijde D, Dougados M, Van Den Bosch F, Goupille P, Sarkar S, et al. Sustainedefficacy of adalimumab in patients with non-radiographic axial spondyloarthritis: week 68 resultsfrom ability 1. Ann Rheum Dis 2013;71(Suppl. 3):248.
192. van der Heijde DM, Mease PJ, Pangan AL, Rao SA, Chen N, Cifaldi M. Improvement in physicalfunction, health-related quality of life, and work productivity with adalimumab treatment innon-radiographic axial spondyloarthritis. Arthritis Rheum 2013;65:S1052.
193. Sieper J, Van Der Heijde D, Dougados M, Van Den Bosch F, Goupille P, Rathmann SS, et al.Sustained efficacy of adalimumab in patients with non-radiographic axial spondyloarthritis withpositive MRI of the sacroiliac joints or spine or elevated C-reactive protein at baseline.Rheumatology 2013;52:i52–3.
194. van der Heijde D, Mease P, Pangan AL, Rao S, Chen N, Cifaldi MA. Improvement in physicalfunction, health-related quality of life, and work productivity with adalimumab treatment innonradiographic axial SPA: WK-52 results from ability-1. Arthritis Rheum 2012;64:S583.
195. Kimel M, Revicki D, Rao S, Fryback D, Feeny D, Harnam N, et al. Norms-based assessment ofpatient-reported outcomes associated with adalimumab monotherapy in patients with ankylosingspondylitis. Clin Exp Rheumatol 2011;29:624–32.
196. van der Heijde DM, Revicki DA, Gooch KL, Wong RL, Kupper H, Harnam N, et al. Physicalfunction, disease activity, and health-related quality-of-life outcomes after 3 years of adalimumabtreatment in patients with ankylosing spondylitis. Arthritis Res Ther 2009;11:R124. http://dx.doi.org/10.1186/ar2790
REFERENCES
NIHR Journals Library www.journalslibrary.nihr.ac.uk
184
197. Revicki DA, Luo MP, Wordsworth P, Wong RL, Chen N, Davis JC Jr, et al. Adalimumab reducespain, fatigue, and stiffness in patients with ankylosing spondylitis: results from the adalimumabtrial evaluating long-term safety and efficacy for ankylosing spondylitis (ATLAS). J Rheumatol2008;35:1346–53. [Erratum published in J Rheumatol 2011;38:788.]
198. van der Heijde D, Breban MA, Halter DG, DiVittorio G, Bratt J, Cantini F, et al. Sustainedimprovement of spinal mobility, physical function, and quality of life in patients with ankylosingspondylitis: 5-year results. Arthritis Rheum 2011;63(Suppl. 10):535. http://dx.doi.org/10.1093/rheumatology/keu438
199. Maksymowych W, Van Der Heijde D, Landewe R, Pangan A, Brown S, Lavie F. Predictors ofradiographic progression in adalimumab-treated patients with Ankylosing Spondylitis. ArthritisRheum 2010;62:1949. http://dx.doi.org/10.1186/ar2794
200. van der Heijde D, Emery P, Patra K, Lavie F. Relationship between bone formation in patients withankylosing spondylitis and clinical signs and symptoms. Rheumatology 2010;49:i18.
201. Scott DG, Van Der Heijde D, Schiff MH, Sieper J, Kivitz A, Dijkmans BA, et al. Improvement inlong-term spinal mobility in patients with ankylosing spondylitis (AS) is sustained during up to3 years of adalimumab treatment: 3-year atlas results. Rheumatology 2009;48:i56. http://dx.doi.org/10.1136/ard.2007.087270
202. Landewe RBM, Rudwaleit M, Van Der Heijde DM, Dougados M, Mease PJ, Reveille JD, et al.Effect of certolizumab pegol over 48 weeks in patients with axial spondyloarthritis, includingankylosing spondylitis and non-radiographic axial spondyloarthritis. Arthritis Rheum 2013;65:S767.http://dx.doi.org/10.1136/annrheumdis-2013-204231
203. Sieper J, Kivitz A, Van Tubergen A, Deodhar A, Coteur G, Singh P, et al. Long-term maintenanceof improvements in patient-reported outcomes with certolizumab pegol in patients with axialspondyloarthritis, including ankylosing spondylitis and non-radiographic axial spondyloarthritis:48-week results of the rapid-axspa study. Value Health 2013;16:A569. http://dx.doi.org/10.1016/j.jval.2013.08.1523
204. Maksymowych W, Landewe R, Rudwaleit M, van der Heijde D, Dougados M, Mease P, et al.Effect of certolizumab pegol over 48 weeks in patients with axial spondyloarthritis, includingankylosing spondylitis and non-radiographic axial spondyloarthritis. J Rheumatol 2014;41:1496–7.
205. Boonen A, Patel V, Traina S, Chiou CF, Maetzel A, Tsuji W. Rapid and sustained improvementin health-related quality of life and utility for 72 weeks in patients with ankylosing spondylitisreceiving etanercept. J Rheumatol 2008;35:662–7.
206. Davis JC, van der Heijde D, Dougados M, Woolley JM. Reductions in health-related quality of lifein patients with ankylosing spondylitis and improvements with etanercept therapy. ArthritisRheum 2005;53:494–501. http://dx.doi.org/10.1002/art.21330
207. Dougados M, Van Der Heijde D, Sieper J, Braun J, Maksymowych WP, Citera G, et al. Safetyand efficacy of etanercept in early non-radiographic axial spondyloarthritis: a randomized,double-blind, placebo-controlled trial at 24 weeks. Arthritis Rheum 2013;65:S642–3.
208. Davis J Jr, Webb A, Lund S, Sack K. Results from an open-label extension study of etanercept inankylosing spondylitis. Arthritis Rheum 2004;51:302–4. http://dx.doi.org/10.1002/art.20241
209. Bao C, Huang F, Khan MA, Fei K, Wu Z, Zhuang Y, et al. Safety and efficacy of golimumab,a human anti-TNF monoclonal antibody injected subcutaneously every 4 weeks, in Chinesepatients with active ankylosing spondylitis: one-year results of a phase 3, randomized,placebo-controlled study. Ann Rheum Dis 2013;72(Suppl. 3):945. http://dx.doi.org/10.1136/annrheumdis-2013-eular.2835
DOI: 10.3310/hta20090 HEALTH TECHNOLOGY ASSESSMENT 2016 VOL. 20 NO. 9
© Queen’s Printer and Controller of HMSO 2016. This work was produced by Corbett et al. under the terms of a commissioning contract issued by the Secretary of State forHealth. This issue may be freely reproduced for the purposes of private research and study and extracts (or indeed, the full report) may be included in professional journalsprovided that suitable acknowledgement is made and the reproduction is not associated with any form of advertising. Applications for commercial reproduction should beaddressed to: NIHR Journals Library, National Institute for Health Research, Evaluation, Trials and Studies Coordinating Centre, Alpha House, University of Southampton SciencePark, Southampton SO16 7NS, UK.
185
210. Bao C, Huang F, Khan A, Fei K, Wu Z, Zhuang Y, et al. Safety and efficacy of golimumab, ahuman anti-tumor necrosis factor monoclonal antibody injected subcutaneously every 4 weeks,in Chinese patients with active ankylosing spondylitis: 1-year results of a phase 3, randomized,placebo-controlled study. Arthritis Rheum 2013;65:S651.
211. van der Heijde D, Braun J, Deodhar A, Inman RD, Xu S, Mack ME, et al. Comparison of threeenthesitis indices in a multicentre, randomized, placebo-controlled trial of golimumab inankylosing spondylitis (GO-RAISE). Rheumatology 2013;52:321–5. http://dx.doi.org/10.1093/rheumatology/kes251
212. Deodhar A, Braun J, Inman R, Van Der Heijde D, Zhou Y, Hsu B. Long-term safety and efficacy ofgolimumab in the treatment of ankylosing spondylitis: results through 5 years of the go-raise trial.Ann Rheum Dis 2013;72:283. http://dx.doi.org/10.1136/annrheumdis-2013-eular.880
213. Braun J, Van Der Heijde D, Hermann KG, Baraliakos X, Deodhar A, Beutler A, et al. The effect ofanti-tumor necrosis factor therapy with golimumab on radiographic progression in definiteankylosing spondylitis: 4-year results. Ann Rheum Dis 2013;71(Suppl. 3):249. http://dx.doi.org/10.1136/annrheumdis-2012-eular.2243
214. van der Heijde D, Deodhar A, Braun J, Mack M, Hsu B, Gathany T, et al. Achieving ASDAS-CRPmajor improvement and inactive disease in patients with ankylosing spondylitis after treatmentwith golimumab is associated with normalized health related quality of life: two-year resultsfrom the go-raise trial. Ann Rheum Dis 2013;71(Suppl. 3):112. http://dx.doi.org/10.1136/annrheumdis-2012-eular.1853
215. van der Heijde D, Deodhar A, Braun J, Mack M, Hsu B, Gathany T, et al. Achieving ankylosingspondylitis disease activity score c-reactive protein major improvement and inactive disease inpatients with ankylosing spondylitis after treatment with golimumab is associated with normalizedhealth-related quality of life: 2-year results from go-raise. Rheumatology 2013;52:i161–2.
216. Braun J, Beutler A, Deodhar A, Hsu B, Van Der Heijde D, Hermann KG, et al. The effect ofanti-tumor necrosis factor therapy with golimumab on radiographic progression in definiteankylosing spondylitis: 4-year results. Int J Rheum Dis 2012;15:91. http://dx.doi.org/10.1136/annrheumdis-2012-eular.2243
217. Braun J, Van Der Heijde D, Hermann KG, Baraliakos X, Deodhar A, Beutler A, et al. The effect ofanti-tumor necrosis factor therapy with two different doses of golimumab on radiographicprogression in definite ankylosing spondylitis: 4-year results. Arthritis Rheum 2011;1:423.http://dx.doi.org/10.1136/annrheumdis-2012-203075
218. Braun J, Van Der Heijde D, Deodhar A, Beutler A, Mack M, Hsu B, et al. Sustained clinicalresponse with golimumab administered subcutaneously every 4 weeks in ankylosing spondylitis:104-week results of a randomized, placebo-controlled study. Arthritis Rheum 2011;1:1227.
219. Braun J, Van Der Heijde D, Deodhar A, Diekman L, Sieper J, Kim SI, et al. Golimumab, a new,human, TNF-alpha antibody administered subcutaneously every 4 weeks, in ankylosing spondylitis:104-week efficacy and safety results of the randomized, placebo-controlled go-raise study. ScandJ Rheumatol 2010;39:24.
220. Kim SI, Braun J, Van Der Heijde D, Deodhar A, Dieckman L, Sieper J, et al. Golimumab, a new,human, TNF-alpha antibody administered subcutaneously every 4 weeks, in ankylosing spondylitis:104 week efficacy and safety results of the randomized, placebo-controlled GO-RAISE study.Int J Rheum Dis 2010;13:152–3.
221. Braun J, Van Der Heijde DMFM, Deodhar AA, Diekman L, Sieper J, Kim SI, et al. Golimumab,a new, human, TNF-antibody administered subcutaneously every 4 weeks, in ankylosingspondylitis (AS): 104-week efficacy and safety results of the randomized, placebo-controlledGO-RAISE study. Arthritis Rheum 2009;60:1259.
REFERENCES
NIHR Journals Library www.journalslibrary.nihr.ac.uk
186
222. Braun J, van der Heijde D, Deodhar A, Diekman L, Sieper J, Kim SI, et al. Golimumab, a new,human, TNF-alpha antibody administered subcutaneously every 4 weeks, in ankylosing spondylitis:104-week efficacy and safety results of the randomized, placebo controlled GO-RAISE study.Clin Exp Rheumatol 2010;28:618.
223. Park W, Miranda P, Brzosko M, Wiland P, Gutierrez-Urena S, Mikazane H, et al. Efficacy andsafety of CT-P13 (infliximab biosimilar) over two years in patients with ankylosing spondylitis:comparison between continuing with CT-P13 and switching from infliximab to CT-P13.Arthritis Rheum 2013;65:3326.
224. Braun J, Baraliakos X, Listing J, Fritz C, Alten R, Burmester G, et al. Persistent clinical efficacy andsafety of anti-tumour necrosis factor alpha therapy with infliximab in patients with ankylosingspondylitis over 5 years: evidence for different types of response. Ann Rheum Dis 2008;67:340–5.http://dx.doi.org/10.1136/ard.2007.075879
225. Braun J, Baraliakos X, Brandt J, Listing J, Zink A, Alten R, et al. Persistent clinical response tothe anti-TNF-alpha antibody infliximab in patients with ankylosing spondylitis over 3 years.Rheumatology 2005;44:670–6. http://dx.doi.org/10.1093/rheumatology/keh584
226. Braun J, Brandt J, Listing J, Zink A, Alten R, Burmester G, et al. Long-term efficacy and safety ofinfliximab in the treatment of ankylosing spondylitis: an open, observational, extension studyof a three-month, randomized, placebo-controlled trial. Arthritis Rheum 2003;48:2224–33.http://dx.doi.org/10.1002/art.11104
227. Baraliakos X, Brandt J, Listing J, Rudwaleit M, Sieper J, Braun J. Clinical response to long-termtherapy with infliximab in patients with ankylosing spondylitis – results after 3 years. Ann RheumDis 2004;63:412.
228. Baraliakos X, Brandt J, Listing J, Rudwaleit M, Sieper J, Braun J. Clinical response to withdrawal ofanti-TNF therapy in patients with ankylosing spondylitis (AS) after 3 years of continuous treatmentwith infliximab. Ann Rheum Dis 2004;63:413.
229. Brandt J, Listing J, Alten R, Bumester G, Gromnica-Ihle E, Kellner H, et al. Two year follow upresults of a controlled trial of the anti-TNF alpha antibody infliximab in active ankylosingspondylitis. Arthritis Rheum 2003;48:S172–3.
230. Brandt J, Listing J, Alten R, Burmester G, Gromnica-Ihle E, Schneider M, et al. One year results ofa double-blind placebo controlled, phase-III clinical trial of infliximab in active ankylosingspondylitis. Arthritis Rheum 2002;46:S429.
231. Heldmann F, Brandt J, van der Horst-Bruinsma IE, Landewe R, Sieper J, Burmester GR, et al. TheEuropean ankylosing spondylitis infliximab cohort (EASIC): a European multicentre study of longterm outcomes in patients with ankylosing spondylitis treated with infliximab. Clin Exp Rheumatol2011;29:672–80.
232. Braun J, Deodhar A, Dijkmans B, Geusens P, Sieper J, Williamson P, et al. Efficacy and safety ofinfliximab in patients with ankylosing spondylitis over a two-year period. Arthritis Rheum2008;59:1270–8. http://dx.doi.org/10.1002/art.24001
233. Machado P, Landewe R, Braun J, Baraliakos X, Hermann KGA, Hsu B, et al. MRI inflammation andits relation with measures of clinical disease activity and different treatment responses in patientswith ankylosing spondylitis treated with a TNF inhibitor. Ann Rheum Dis 2013;71.
234. Heldmann F, Brandt J, Braun J. European ankylosing spondylitis infliximab cohort (EASIC):long-term (5 years) efficacy of infliximab on disease activity and function: a real life experienceafter the end of ASSERT. Arthritis Rheum 2009;60:520.
DOI: 10.3310/hta20090 HEALTH TECHNOLOGY ASSESSMENT 2016 VOL. 20 NO. 9
© Queen’s Printer and Controller of HMSO 2016. This work was produced by Corbett et al. under the terms of a commissioning contract issued by the Secretary of State forHealth. This issue may be freely reproduced for the purposes of private research and study and extracts (or indeed, the full report) may be included in professional journalsprovided that suitable acknowledgement is made and the reproduction is not associated with any form of advertising. Applications for commercial reproduction should beaddressed to: NIHR Journals Library, National Institute for Health Research, Evaluation, Trials and Studies Coordinating Centre, Alpha House, University of Southampton SciencePark, Southampton SO16 7NS, UK.
187
235. Braun J, Han C, Kellner H, Deodhar A, Inman R, Xu W, et al. Infliximab improves spinal mobility inpatients with ankylosing spondylitis: two-year findings from the assert clinical trial. Rheumatology2008;47(Suppl. 1):iI72.
236. Braun J, Han C, Kellner H, Deodhar A, Inman R, Xu W, et al. Infliximab improves spinal mobility inpatients with ankylosing spondylitis: two-year findings from the assert clinical trial. Ann RheumDis 2007;66:390–1.
237. Drummond MF, Sculpher MJ, Torrance GW, O’Brien BJ, Stoddart GL. Methods for the EconomicEvaluation of Health Care Programmes. 3rd edn. Oxford: Oxford University Press; 2005.
238. National Institute for Health and Care Excellence. Guide to the Methods of Technology Appraisal.London: NICE; 2013.
239. Pumford N, Wade A, Crawford G, McConnachie A. Sensitivity of PRO’s to detect changes in qualityof life in patients treated with a biologic agent. Value Health 2011;14:A314. http://dx.doi.org/10.1016/j.jval.2011.08.450
240. Wade AG, Crawford GM, Pumford N, Koscielny V, Maycock S, McConnachie A. Baselinecharacteristics and patient reported outcome data of patients prescribed etanercept: web-basedand telephone evaluation. BMC Med Res Methodol 2011;11:91. http://dx.doi.org/10.1186/1471-2288-11-91
241. Lee TJ, Park BH, Son HK, Kim JW, Shin K, Lee EB, et al. Differences in cost-of-illness and qualityof life between rheumatoid arthritis and ankylosing spondylitis in South Korea. Value Health2011;14:A306. http://dx.doi.org/10.1016/j.jval.2011.08.407
242. Lee T-J, Park B-H, Kim JW, Shin K, Lee EB, Song Y-W. Cost-of-illness and quality of life in patientswith ankylosing spondylitis at a tertiary hospital in Korea. J Korean Med Sci 2014;29:190–7.http://dx.doi.org/10.3346/jkms.2014.29.2.190
243. Joore M, Brunenberg D, Nelemans P, Wouters E, Kuijpers P, Honig A, et al. The impact ofdifferences in EQ-5D and SF-6D utility scores on the acceptability of cost–utility ratios: resultsacross five trial-based cost-utility studies. Value Health 2010;13:222–9. http://dx.doi.org/10.1111/j.1524-4733.2009.00669.x
244. Van Tubergen A, Boonen A, Landewe R, Rutten-Van Molken M, Van der Heijde D, Hidding A,et al. Cost effectiveness of combined spa-exercise therapy in ankylosing spondylitis: a randomizedcontrolled trial. Arthritis Rheum-Arthritis Care Res 2002;47:459–67. http://dx.doi.org/10.1002/art.10658
245. Kobelt G, Andlin-Sobocki P, Collantes-Estevez E, Gratacos-Masmitja J, Pocovi A, Mulero-Mendoza J.The cost effectiveness of infliximab in the treatment of ankylosing spondylitis in Spain. Comparison ofclinical trial and clinical practice data. Ann Rheum Dis 2006;65:282–3. http://dx.doi.org/10.1080/03009740701607224
246. Kobelt G, Sobocki P, Mulero J, Gratacos J, Collantes-Estevez E, Braun J. The cost-effectiveness ofinfliximab in the treatment of ankylosing spondylitis in Spain: comparison of clinical trial andclinical practice data. Scand J Rheumatol 2008;37:62–71. http://dx.doi.org/10.1080/03009740701607224
247. Boonen A, van der Heijde D, Landewe R, Spoorenberg A, Schouten H, Rutten-van Molken M, et al.Work status and productivity costs due to ankylosing spondylitis: comparison of three Europeancountries. Ann Rheum Dis 2002;61:429–37. http://dx.doi.org/10.1136/ard.61.5.429
248. Boonen A, van der Heijde D, Landewe R, Guillemin F, Spoorenberg A, Schouten H, et al. Costs ofankylosing spondylitis in three European countries: the patient’s perspective. Ann Rheum Dis2003;62:741–7. http://dx.doi.org/10.1136/ard.62.8.741
REFERENCES
NIHR Journals Library www.journalslibrary.nihr.ac.uk
188
249. Dolan P. Modeling valuations for EuroQol health states. Med Care 1997;35:1095–108.http://dx.doi.org/10.1097/00005650-199711000-00002
250. Boonen A, van der Heijde D, Landewe R, van Tubergen A, Mielants H, Dougados M, et al.How do the EQ-5D, SF-6D and the well-being rating scale compare in patients with ankylosingspondylitis? Ann Rheum Dis 2007;66:771–7. http://dx.doi.org/10.1136/ard.2006.060384
251. Gordeev VS, Maksymowych WP, Evers SM, Ament A, Schachna L, Boonen A. Role of contextualfactors in health-related quality of life in ankylosing spondylitis. Ann Rheum Dis 2010;69:108–12.http://dx.doi.org/10.1136/ard.2008.100164
252. Haywood KL, Garratt AM, Dziedzic K, Dawes PT. Generic measures of health-related quality of lifein ankylosing spondylitis: reliability, validity and responsiveness. Rheumatology 2002;41:1380–7.http://dx.doi.org/10.1093/rheumatology/41.12.1380
253. Kind P, Dolan P, Gudex C, Williams A. Variations in population health status: results from aUnited Kingdom national questionnaire survey. BMJ 1998;316:736–41. http://dx.doi.org/10.1136/bmj.316.7133.736
254. Dolan P, Gudex C, Kind P, Williams A. A Social Tariff for EuroQol: Results from a UK GeneralPopulation Survey. York: University of York Centre for Health Economics; 1995.
255. Dolan P, Gudex C, Kind P, Williams A. The time trade-off method: results from a generalpopulation study. Health Econ 1996;5:141–54. http://dx.doi.org/10.1002/(SICI)1099-1050(199603)5:2<141::AID-HEC189>3.0.CO;2-N
256. Haywood KL, Garratt AM, Jordan KP, Healey EL, Packham JC. Evaluation of ankylosing spondylitisquality of life (EASi-QoL): reliability and validity of a new patient-reported outcome measure.J Rheumatol 2010;37:2100–9. http://dx.doi.org/10.3899/jrheum.091359
257. Kvamme MK, Kristiansen IS, Lie E, Kvien TK. Identification of cutpoints for acceptable healthstatus and important improvement in patient-reported outcomes, in rheumatoid arthritis, psoriaticarthritis, and ankylosing spondylitis. J Rheumatol 2010;37:26–31. http://dx.doi.org/10.3899/jrheum.090449
258. Osnes-Ringen H, Kvamme MK, Kristiansen IS, Thingstad M, Henriksen JE, Kvien TK, et al.Cost-effectiveness analyses of elective orthopaedic surgical procedures in patients withinflammatory arthropathies. Scand J Rheumatol 2011;40:108–15. http://dx.doi.org/10.3109/03009742.2010.503661
259. Lindstrom U, Bremander A, Bergman S, Haglund E, Petersson IF, Jacobsson LT. Patients withnon-as axial SPA have similar prevalence compared to as, but worse perceived health. Resultsfrom a population based study. Ann Rheum Dis 2013;72(Suppl. 3):A667–8. http://dx.doi.org/10.1136/annrheumdis-2013-eular.1978
DOI: 10.3310/hta20090 HEALTH TECHNOLOGY ASSESSMENT 2016 VOL. 20 NO. 9
© Queen’s Printer and Controller of HMSO 2016. This work was produced by Corbett et al. under the terms of a commissioning contract issued by the Secretary of State forHealth. This issue may be freely reproduced for the purposes of private research and study and extracts (or indeed, the full report) may be included in professional journalsprovided that suitable acknowledgement is made and the reproduction is not associated with any form of advertising. Applications for commercial reproduction should beaddressed to: NIHR Journals Library, National Institute for Health Research, Evaluation, Trials and Studies Coordinating Centre, Alpha House, University of Southampton SciencePark, Southampton SO16 7NS, UK.
189

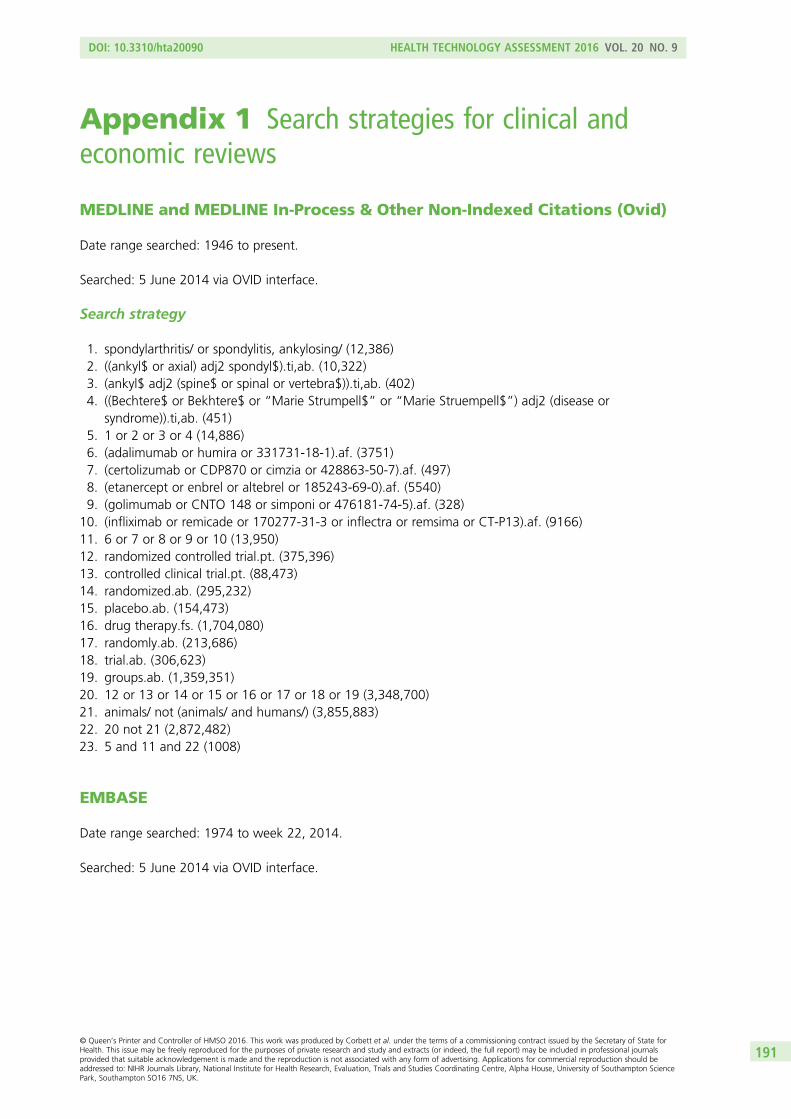
Appendix 1 Search strategies for clinical andeconomic reviews
MEDLINE and MEDLINE In-Process & Other Non-Indexed Citations (Ovid)
Date range searched: 1946 to present.
Searched: 5 June 2014 via OVID interface.
Search strategy
1. spondylarthritis/ or spondylitis, ankylosing/ (12,386)2. ((ankyl$ or axial) adj2 spondyl$).ti,ab. (10,322)3. (ankyl$ adj2 (spine$ or spinal or vertebra$)).ti,ab. (402)4. ((Bechtere$ or Bekhtere$ or “Marie Strumpell$” or “Marie Struempell$”) adj2 (disease or
syndrome)).ti,ab. (451)5. 1 or 2 or 3 or 4 (14,886)6. (adalimumab or humira or 331731-18-1).af. (3751)7. (certolizumab or CDP870 or cimzia or 428863-50-7).af. (497)8. (etanercept or enbrel or altebrel or 185243-69-0).af. (5540)9. (golimumab or CNTO 148 or simponi or 476181-74-5).af. (328)
10. (infliximab or remicade or 170277-31-3 or inflectra or remsima or CT-P13).af. (9166)11. 6 or 7 or 8 or 9 or 10 (13,950)12. randomized controlled trial.pt. (375,396)13. controlled clinical trial.pt. (88,473)14. randomized.ab. (295,232)15. placebo.ab. (154,473)16. drug therapy.fs. (1,704,080)17. randomly.ab. (213,686)18. trial.ab. (306,623)19. groups.ab. (1,359,351)20. 12 or 13 or 14 or 15 or 16 or 17 or 18 or 19 (3,348,700)21. animals/ not (animals/ and humans/) (3,855,883)22. 20 not 21 (2,872,482)23. 5 and 11 and 22 (1008)
EMBASE
Date range searched: 1974 to week 22, 2014.
Searched: 5 June 2014 via OVID interface.
DOI: 10.3310/hta20090 HEALTH TECHNOLOGY ASSESSMENT 2016 VOL. 20 NO. 9
© Queen’s Printer and Controller of HMSO 2016. This work was produced by Corbett et al. under the terms of a commissioning contract issued by the Secretary of State forHealth. This issue may be freely reproduced for the purposes of private research and study and extracts (or indeed, the full report) may be included in professional journalsprovided that suitable acknowledgement is made and the reproduction is not associated with any form of advertising. Applications for commercial reproduction should beaddressed to: NIHR Journals Library, National Institute for Health Research, Evaluation, Trials and Studies Coordinating Centre, Alpha House, University of Southampton SciencePark, Southampton SO16 7NS, UK.
191
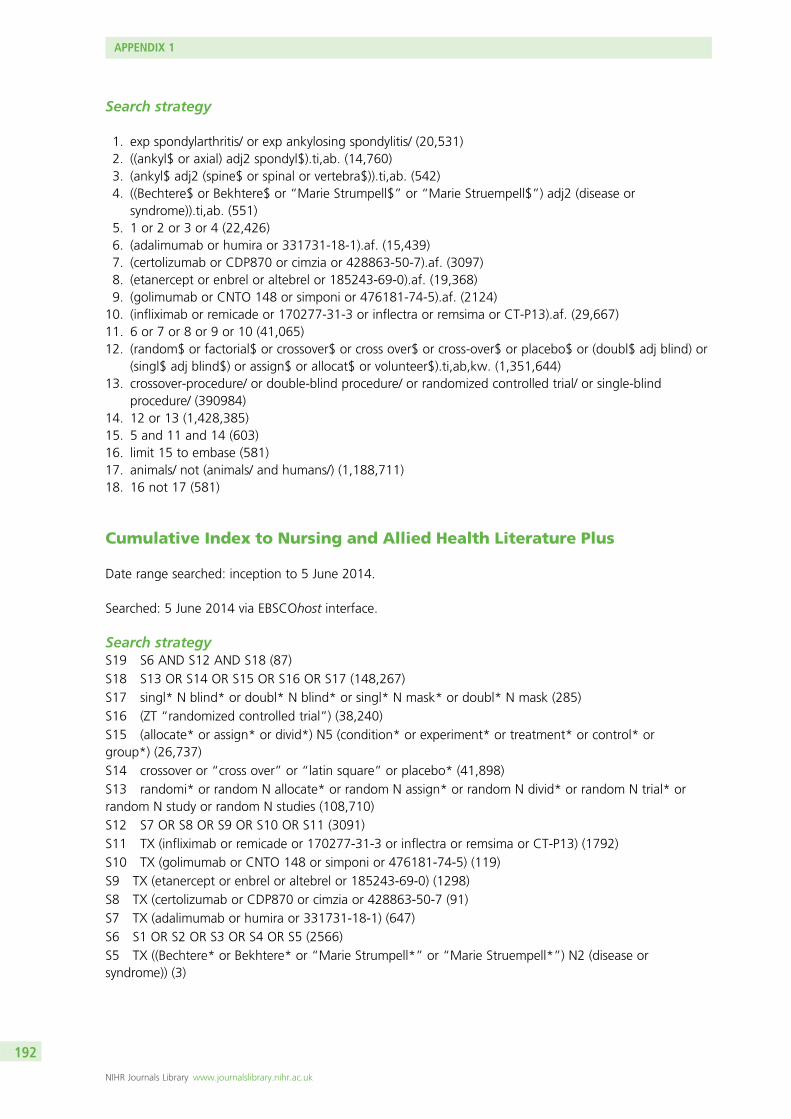
Search strategy
1. exp spondylarthritis/ or exp ankylosing spondylitis/ (20,531)2. ((ankyl$ or axial) adj2 spondyl$).ti,ab. (14,760)3. (ankyl$ adj2 (spine$ or spinal or vertebra$)).ti,ab. (542)4. ((Bechtere$ or Bekhtere$ or “Marie Strumpell$” or “Marie Struempell$”) adj2 (disease or
syndrome)).ti,ab. (551)5. 1 or 2 or 3 or 4 (22,426)6. (adalimumab or humira or 331731-18-1).af. (15,439)7. (certolizumab or CDP870 or cimzia or 428863-50-7).af. (3097)8. (etanercept or enbrel or altebrel or 185243-69-0).af. (19,368)9. (golimumab or CNTO 148 or simponi or 476181-74-5).af. (2124)
10. (infliximab or remicade or 170277-31-3 or inflectra or remsima or CT-P13).af. (29,667)11. 6 or 7 or 8 or 9 or 10 (41,065)12. (random$ or factorial$ or crossover$ or cross over$ or cross-over$ or placebo$ or (doubl$ adj blind) or
(singl$ adj blind$) or assign$ or allocat$ or volunteer$).ti,ab,kw. (1,351,644)13. crossover-procedure/ or double-blind procedure/ or randomized controlled trial/ or single-blind
procedure/ (390984)14. 12 or 13 (1,428,385)15. 5 and 11 and 14 (603)16. limit 15 to embase (581)17. animals/ not (animals/ and humans/) (1,188,711)18. 16 not 17 (581)
Cumulative Index to Nursing and Allied Health Literature Plus
Date range searched: inception to 5 June 2014.
Searched: 5 June 2014 via EBSCOhost interface.
Search strategyS19 S6 AND S12 AND S18 (87)
S18 S13 OR S14 OR S15 OR S16 OR S17 (148,267)
S17 singl* N blind* or doubl* N blind* or singl* N mask* or doubl* N mask (285)
S16 (ZT “randomized controlled trial”) (38,240)
S15 (allocate* or assign* or divid*) N5 (condition* or experiment* or treatment* or control* orgroup*) (26,737)
S14 crossover or “cross over” or “latin square” or placebo* (41,898)
S13 randomi* or random N allocate* or random N assign* or random N divid* or random N trial* orrandom N study or random N studies (108,710)
S12 S7 OR S8 OR S9 OR S10 OR S11 (3091)
S11 TX (infliximab or remicade or 170277-31-3 or inflectra or remsima or CT-P13) (1792)
S10 TX (golimumab or CNTO 148 or simponi or 476181-74-5) (119)
S9 TX (etanercept or enbrel or altebrel or 185243-69-0) (1298)
S8 TX (certolizumab or CDP870 or cimzia or 428863-50-7 (91)
S7 TX (adalimumab or humira or 331731-18-1) (647)
S6 S1 OR S2 OR S3 OR S4 OR S5 (2566)
S5 TX ((Bechtere* or Bekhtere* or “Marie Strumpell*” or “Marie Struempell*”) N2 (disease orsyndrome)) (3)
APPENDIX 1
NIHR Journals Library www.journalslibrary.nihr.ac.uk
192
S4 TX (ankyl* N2 (spine* or spinal or vertebra*)) (91)
S3 TX ((ankyl* or axial) N2 spondyl*) (2277)
S2 MH spondylitis, ankylosing (1803)
S1 MH spondylarthritis (500)
Science Citation Index
Date range searched: 1900 to 2014.
Searched: 16 June 2014 via Web of Science.
Indexes=SCI-EXPANDED Timespan=1900-2014.
Search strategy#13 #12 AND #11 AND #5 (1001)
#12 TS= clinical trial* OR TS=research design OR TS=comparative stud* OR TS=evaluation stud* ORTS=controlled trial* OR TS=follow-up stud* OR TS=prospective stud* OR TS=random* OR TS=placebo*OR TS=(single blind*) OR TS=(double blind*) (2,435,907)
#11 #10 OR #9 OR #8 OR #7 OR #6 (20,446)
#10 TOPIC: ((infliximab or remicade or 170277-31-3 or inflectra or remsima or CT-P13)) (13,285)
#9 TOPIC: ((golimumab or CNTO 148 or simponi or 476181-74-5)) (494)
#8 TOPIC: ((etanercept or enbrel or altebrel or 185243-69-0)) (7138)
#7 TOPIC: ((certolizumab or CDP870 or cimzia or 428863-50-7)) (916)
#6 TOPIC: ((adalimumab or humira or 331731-18-1)) (4754)
#5 #4 OR #3 OR #2 OR #1 (14,918)
#4 TOPIC: (((Bechtere* or Bekhtere* or “Marie Strumpell*” or “Marie Struempell*”) NEAR/2 (disease orsyndrome))) (191)
#3 TOPIC: ((ankyl* NEAR/2 (spine* or spinal or vertebra*))) (644)
#2 TOPIC: (((ankyl* or axial) NEAR/2 spondyl*)) (13,854)
#1 TOPIC: (spondylarthritis OR spondyloarthritis) (2394)
National Institutes of Health ClinicalTrials.gov register
Searched: 23 July 2014 online at http://clinicaltrials.gov/ct2/search.
Search strategy((spondylarthritis OR spondyloarthritis OR spondylitis) AND (infliximab OR remicade OR inflectra ORremsima OR golimumab OR simponi OR etanercept OR enbrel OR altebrel OR certolizumab OR cimzia ORadalimumab OR humira))
160 results.
DOI: 10.3310/hta20090 HEALTH TECHNOLOGY ASSESSMENT 2016 VOL. 20 NO. 9
© Queen’s Printer and Controller of HMSO 2016. This work was produced by Corbett et al. under the terms of a commissioning contract issued by the Secretary of State forHealth. This issue may be freely reproduced for the purposes of private research and study and extracts (or indeed, the full report) may be included in professional journalsprovided that suitable acknowledgement is made and the reproduction is not associated with any form of advertising. Applications for commercial reproduction should beaddressed to: NIHR Journals Library, National Institute for Health Research, Evaluation, Trials and Studies Coordinating Centre, Alpha House, University of Southampton SciencePark, Southampton SO16 7NS, UK.
193
Cochrane Library (includes Cochrane Database of SystematicReviews, Database of Abstracts of Reviews of Effects, HealthTechnology Assessment Database, Cochrane Central Register ofControlled Trials and NHS Economic Evaluation Database)
Searched: 5 June 2014 online at http://onlinelibrary.wiley.com/o/cochrane/cochrane_search_fs.html.
Search strategy#1 MeSH descriptor: [Spondylitis, Ankylosing] explode all trees
#2 MeSH descriptor: [Spondylarthritis] explode all trees
#3 ((ankyl* or axial) near/2 spondyl*):ti,ab,kw (Word variations have been searched)
#4 (ankyl* near/2 (spine* or spinal or vertebra*)):ti,ab,kw (Word variations have been searched)
#5 ((Bechtere* or Bekhtere* or “Marie Strumpell*” or “Marie Struempell*”) near/2 (disease orsyndrome)):ti,ab,kw
#6 #1 or #2 or #3 or #4 or #5
#7 (adalimumab or humira or 331731-18-1):ti,ab,kw
#8 (certolizumab or CDP870 or cimzia or 428863-50-7):ti,ab,kw
#9 (etanercept or enbrel or altebrel or 185243-69-0):ti,ab,kw
#10 (golimumab or CNTO 148 or simponi or 476181-74-5):ti,ab,kw
#11 (infliximab or remicade or 170277-31-3 or inflectra or remsima or CT-P13):ti,ab,kw
#12 #7 or #8 or #9 or #10 or #11
#13 #6 and #12
284 total results comprised two Cochrane Database of Systematic Reviews, five Database of Abstracts ofReviews of Effects, 21 HTA, 233 Cochrane Central Register of Controlled Trials and 14 NHS EconomicEvaluation Database.
Conference Proceedings Citation Index – Science
Searched: 2 September 2014 via Wiley Web of Science interface.
Indexes=CPCI-S Timespan=1900-2014.
Search strategy#12 #11 AND #5 (341)
#11 #10 OR #9 OR #8 OR #7 OR #6 (4745)
#10 TOPIC: ((infliximab or remicade or 170277-31-3 or inflectra or remsima or CT-P13)) (2537)
#9 TOPIC: ((golimumab or CNTO 148 or simponi or 476181-74-5)) (141)
#8 TOPIC: ((etanercept or enbrel or altebrel or 185243-69-0)) (1221)
#7 TOPIC: ((certolizumab or CDP870 or cimzia or 428863-50-7)) (291)
#6 TOPIC: ((adalimumab or humira or 331731-18-1)) (1140)
#5 #4 OR #3 OR #2 OR #1 (2117)
#4 TOPIC: (((Bechtere* or Bekhtere* or “Marie Strumpell*” or “Marie Struempell*”) NEAR/2 (disease orsyndrome))) (4)
#3 TOPIC: ((ankyl* NEAR/2 (spine* or spinal or vertebra*))) (55)
#2 TOPIC: (((ankyl* or axial) NEAR/2 spondyl*)) (1906)
#1 TS=(spondylarthritis OR spondyloarthritis) (393)
APPENDIX 1
NIHR Journals Library www.journalslibrary.nihr.ac.uk
194
International Prospective Register of SystematicReviews (PROSPERO)
Searched: 7 October 2014 online at www.crd.york.ac.uk/prospero/search.asp.
Search strategyspondylitis [In All Fields]
OR
spondylarthritis [In All Fields]
OR
spondyloarthritis [In All Fields]
6 results.
National Guideline Clearinghouse
Searched: 7 October 2014 online at www.guideline.gov.
Search strategyspondylitis OR spondylarthritis OR spondyloarthritis
15 results.
NHS Evidence
Searched 27 October 2014 online at www.evidence.nhs.uk.
Search strategy((((ankyl* or axial) near/2 spondyl*) OR (ankyl* near/2 (spine* or spinal or vertebra*)) AND (adalimumab orhumira or certolizumab or CDP870 or cimzia or etanercept or enbrel or altebrel or golimumab or CNTO148 or simponi or infliximab or remicade or inflectra or remsima or CT-P13))
350 results.
NHS Clinical Knowledge Summaries
Searched: 27 October 2014 online at http://cks.nice.org.uk/#?char=A.
1 result for ankylosing spondylitis.
DOI: 10.3310/hta20090 HEALTH TECHNOLOGY ASSESSMENT 2016 VOL. 20 NO. 9
© Queen’s Printer and Controller of HMSO 2016. This work was produced by Corbett et al. under the terms of a commissioning contract issued by the Secretary of State forHealth. This issue may be freely reproduced for the purposes of private research and study and extracts (or indeed, the full report) may be included in professional journalsprovided that suitable acknowledgement is made and the reproduction is not associated with any form of advertising. Applications for commercial reproduction should beaddressed to: NIHR Journals Library, National Institute for Health Research, Evaluation, Trials and Studies Coordinating Centre, Alpha House, University of Southampton SciencePark, Southampton SO16 7NS, UK.
195
Searches for economic review
NHS Economic Evaluation DatabaseSearched: 5 June 2014 online at http://onlinelibrary.wiley.com/o/cochrane/cochrane_search_fs.html.
Search strategy#1 MeSH descriptor: [Spondylitis, Ankylosing] explode all trees
#2 MeSH descriptor: [Spondylarthritis] explode all trees
#3 ((ankyl* or axial) near/2 spondyl*):ti,ab,kw (Word variations have been searched)
#4 (ankyl* near/2 (spine* or spinal or vertebra*)):ti,ab,kw (Word variations have been searched)
#5 ((Bechtere* or Bekhtere* or “Marie Strumpell*” or “Marie Struempell*”) near/2 (disease orsyndrome)):ti,ab,kw
#6 #1 or #2 or #3 or #4 or #5
#7 (adalimumab or humira or 331731-18-1):ti,ab,kw
#8 (certolizumab or CDP870 or cimzia or 428863-50-7):ti,ab,kw
#9 (etanercept or enbrel or altebrel or 185243-69-0):ti,ab,kw
#10 (golimumab or CNTO 148 or simponi or 476181-74-5):ti,ab,kw
#11 (infliximab or remicade or 170277-31-3 or inflectra or remsima or CT-P13):ti,ab,kw
#12 #7 or #8 or #9 or #10 or #11
#13 #6 and #12
14 results.
Searches for European Quality of Life-5 Dimensions
MEDLINE and MEDLINE In-Process & Other Non-Indexed Citations (Ovid)Date range searched: 1946 to present.
Searched: 16 June 2014 via OVID interface.
Search strategy
1. spondylarthritis/ or spondylitis, ankylosing/ (12,394)2. ((ankyl$ or axial) adj2 spondyl$).ti,ab. (10,334)3. (ankyl$ adj2 (spine$ or spinal or vertebra$)).ti,ab. (402)4. ((Bechtere$ or Bekhtere$ or “Marie Strumpell$” or “Marie Struempell$”) adj2 (disease or syndrome)).ti,
ab. (451)5. 1 or 2 or 3 or 4 (14,899)6. (5d or 5-d or 5 dimension or eq-5d or eq5d or eq 5d).ti,ab. (13,976)7. 5 and 6 (27)
APPENDIX 1
NIHR Journals Library www.journalslibrary.nihr.ac.uk
196
EMBASE (June 2014)Searched: 16 June 2014 via OVID interface.
Search strategy
1. exp spondylarthritis/ or exp ankylosing spondylitis/ (20,653)2. ((ankyl$ or axial) adj2 spondyl$).ti,ab. (14,855)3. (ankyl$ adj2 (spine$ or spinal or vertebra$)).ti,ab. (545)4. ((Bechtere$ or Bekhtere$ or “Marie Strumpell$” or “Marie Struempell$”) adj2 (disease or syndrome)).ti,
ab. (552)5. 1 or 2 or 3 or 4 (22,550)6. (5d or 5-d or 5 dimension or eq-5d or eq5d or eq 5d).ti,ab. (17,019)7. 5 and 6 (60)8. limit 7 to embase (55)
Searches for economic models
MEDLINE and MEDLINE In-Process & Other Non-Indexed Citations (Ovid)Date range searched: 1946 to present.
Searched: 25 July 2014 via OVID interface.
Search strategy
1. spondylarthritis/ or spondylitis, ankylosing/ (12,505)2. ((ankyl$ or axial) adj2 spondyl$).ti,ab. (10,436)3. (ankyl$ adj2 (spine$ or spinal or vertebra$)).ti,ab. (407)4. ((Bechtere$ or Bekhtere$ or “Marie Strumpell$” or “Marie Struempell$”) adj2 (disease or syndrome)).ti,
ab. (455)5. 1 or 2 or 3 or 4 (15,038)6. exp models, economic/ (10,268)7. ((economic$ or cost$ or pric$ or value or statistic$) and model$).ti,ab. (245,686)8. 6 or 7 (250,668)9. 5 and 8 (107)
EMBASEDate range searched: 1974 to 24 July 2014.
Searched: 25 July 2014 via OVID interface.
Search strategy
1. exp spondylarthritis/ or exp ankylosing spondylitis/ (20,858)2. ((ankyl$ or axial) adj2 spondyl$).ti,ab. (14,996)3. (ankyl$ adj2 (spine$ or spinal or vertebra$)).ti,ab. (553)4. ((Bechtere$ or Bekhtere$ or “Marie Strumpell$” or “Marie Struempell$”) adj2 (disease or
syndrome)).ti,ab. (553)5. 1 or 2 or 3 or 4 (22,760)6. statistical model/ (102,203)7. ((economic$ or cost$ or pric$ or value or statistic$) adj2 model$).ti,ab. (24,642)8. 6 or 7 (119,366)9. 5 and 8 (63)
10. limit 9 to embase (55)
DOI: 10.3310/hta20090 HEALTH TECHNOLOGY ASSESSMENT 2016 VOL. 20 NO. 9
© Queen’s Printer and Controller of HMSO 2016. This work was produced by Corbett et al. under the terms of a commissioning contract issued by the Secretary of State forHealth. This issue may be freely reproduced for the purposes of private research and study and extracts (or indeed, the full report) may be included in professional journalsprovided that suitable acknowledgement is made and the reproduction is not associated with any form of advertising. Applications for commercial reproduction should beaddressed to: NIHR Journals Library, National Institute for Health Research, Evaluation, Trials and Studies Coordinating Centre, Alpha House, University of Southampton SciencePark, Southampton SO16 7NS, UK.
197

Appendix 2 Synthesis methods for clinicalefficacy network meta-analyses
Estimating standard deviations from interquartile ranges
Where Q1 is the lower quartile, Q3 is the upper quartile and σ is the SD, then the SD was estimated as:
σ =(Q3 + Q1)2 × 0:67
. (3)
Calculating change from baseline outcomes andstandard deviations
Given baseline and final values and their SDs, the change from baseline values and SDs can be calculated ifthe within-study correlation between baseline and final values is known. Similarly, the final values canbe computed.
The within-study correlation ρ between baseline and final values can be calculated as follows, as stated inthe Cochrane Handbook,183 where
ρ =SD2
baseline + SD2f inal−SD
2change
2 × SDfinal × SDbaseline
. (4)
The SD of the change from baseline can be found by rearranging the above equation. The SD of the finalvalue can be found by rearranging the above equation which produces a quadratic. As a range ofcorrelation estimates were obtained from the studies available, we tested 0.3 and 0.7 correlation estimatesin our analyses. In calculating the SD of final values, this sometimes resulted in complex roots. In thesecases, the lowest correlation estimate that allowed a real root was used in the calculation.
Prior distribution for the between-study standard deviation forthe placebo absolute risk
In running fixed-effect and random-effect models to estimate the placebo absolute risk, the random-effectmodels had better fit. For ASAS 70 response, there were insufficient trials to run a random-effects model,so a prior distribution for the between-study SD was specified. This was derived from the between-studySD from the ASAS 40 analysis. The prior distribution was specified as a log-normal distribution, and thelog-normal distribution parameters µ and σ2 were derived from the following equations:
Mean = e µ+ σ2=2. (5)
Median = eµ. (6)
DOI: 10.3310/hta20090 HEALTH TECHNOLOGY ASSESSMENT 2016 VOL. 20 NO. 9
© Queen’s Printer and Controller of HMSO 2016. This work was produced by Corbett et al. under the terms of a commissioning contract issued by the Secretary of State forHealth. This issue may be freely reproduced for the purposes of private research and study and extracts (or indeed, the full report) may be included in professional journalsprovided that suitable acknowledgement is made and the reproduction is not associated with any form of advertising. Applications for commercial reproduction should beaddressed to: NIHR Journals Library, National Institute for Health Research, Evaluation, Trials and Studies Coordinating Centre, Alpha House, University of Southampton SciencePark, Southampton SO16 7NS, UK.
199
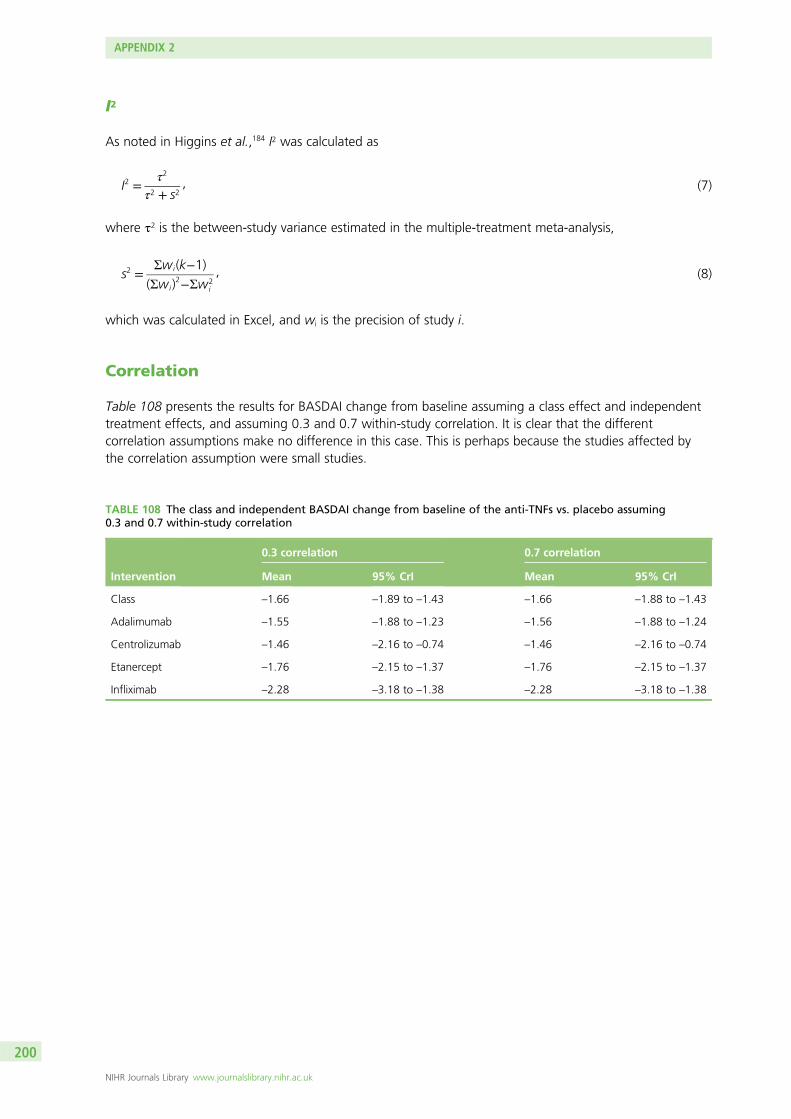
I2
As noted in Higgins et al.,184 I2 was calculated as
I2 =τ2
τ2 + s2, (7)
where τ2 is the between-study variance estimated in the multiple-treatment meta-analysis,
s2 =Σwi(k−1)
(Σwi)2−Σw2
i
, (8)
which was calculated in Excel, and wi is the precision of study i.
Correlation
Table 108 presents the results for BASDAI change from baseline assuming a class effect and independenttreatment effects, and assuming 0.3 and 0.7 within-study correlation. It is clear that the differentcorrelation assumptions make no difference in this case. This is perhaps because the studies affected bythe correlation assumption were small studies.
TABLE 108 The class and independent BASDAI change from baseline of the anti-TNFs vs. placebo assuming0.3 and 0.7 within-study correlation
Intervention
0.3 correlation 0.7 correlation
Mean 95% CrI Mean 95% CrI
Class –1.66 –1.89 to –1.43 –1.66 –1.88 to –1.43
Adalimumab –1.55 –1.88 to –1.23 –1.56 –1.88 to –1.24
Centrolizumab –1.46 –2.16 to –0.74 –1.46 –2.16 to –0.74
Etanercept –1.76 –2.15 to –1.37 –1.76 –2.15 to –1.37
Infliximab –2.28 –3.18 to –1.38 –2.28 –3.18 to –1.38
APPENDIX 2
NIHR Journals Library www.journalslibrary.nihr.ac.uk
200
Appendix 3 Risk-of-bias data
DOI: 10.3310/hta20090 HEALTH TECHNOLOGY ASSESSMENT 2016 VOL. 20 NO. 9
© Queen’s Printer and Controller of HMSO 2016. This work was produced by Corbett et al. under the terms of a commissioning contract issued by the Secretary of State forHealth. This issue may be freely reproduced for the purposes of private research and study and extracts (or indeed, the full report) may be included in professional journalsprovided that suitable acknowledgement is made and the reproduction is not associated with any form of advertising. Applications for commercial reproduction should beaddressed to: NIHR Journals Library, National Institute for Health Research, Evaluation, Trials and Studies Coordinating Centre, Alpha House, University of Southampton SciencePark, Southampton SO16 7NS, UK.
201
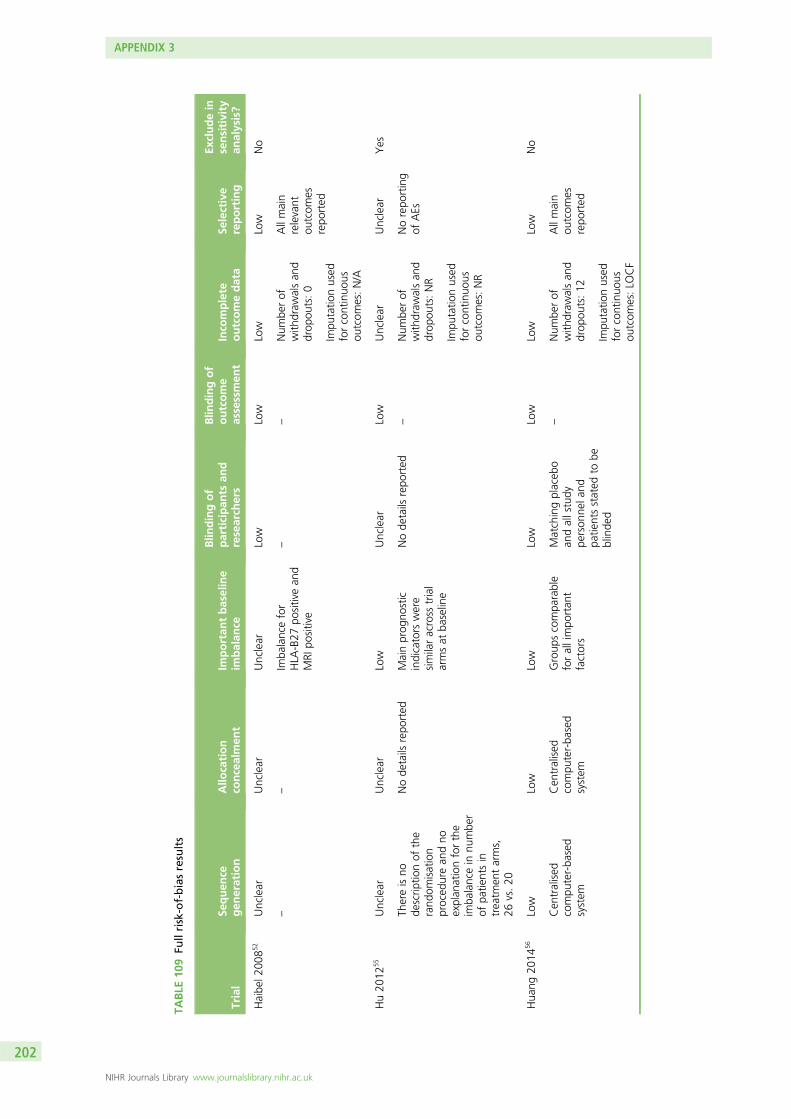
TABLE
109
Fullrisk-of-biasresults
Trial
Sequen
cegen
eration
Allo
cation
concealmen
tIm
portan
tbaseline
imbalan
ce
Blin
dingof
participan
tsan
dresearch
ers
Blin
dingof
outcome
assessmen
tInco
mplete
outcomedata
Selective
reporting
Excludein
sensitivity
analysis?
Haibe
l200
852
Unclear
Unclear
Unclear
Low
Low
Low
Low
No
––
Imba
lancefor
HLA
-B27
positivean
dMRI
positive
––
Num
berof
with
draw
alsan
ddrop
outs:0
Allmain
relevant
outcom
esrepo
rted
Impu
tatio
nused
forcontinuo
usou
tcom
es:N/A
Hu20
1255
Unclear
Unclear
Low
Unclear
Low
Unclear
Unclear
Yes
Thereisno
descrip
tionof
the
rand
omisation
proced
urean
dno
explan
ationforthe
imba
lancein
numbe
rof
patie
ntsin
treatm
entarms,
26vs.20
Node
tails
repo
rted
Mainprog
nostic
indicators
were
similaracross
trial
armsat
baseline
Node
tails
repo
rted
–Num
berof
with
draw
alsan
ddrop
outs:NR
Norepo
rting
ofAEs
Impu
tatio
nused
forcontinuo
usou
tcom
es:NR
Hua
ng20
1456
Low
Low
Low
Low
Low
Low
Low
No
Cen
tralised
compu
ter-ba
sed
system
Cen
tralised
compu
ter-ba
sed
system
Group
scompa
rable
forallimpo
rtan
tfactors
Matchingplaceb
oan
dallstudy
person
nela
ndpa
tientsstated
tobe
blinde
d
–Num
berof
with
draw
alsan
ddrop
outs:12
Allmain
outcom
esrepo
rted
Impu
tatio
nused
forcontinuo
usou
tcom
es:LO
CF
APPENDIX 3
NIHR Journals Library www.journalslibrary.nihr.ac.uk
202
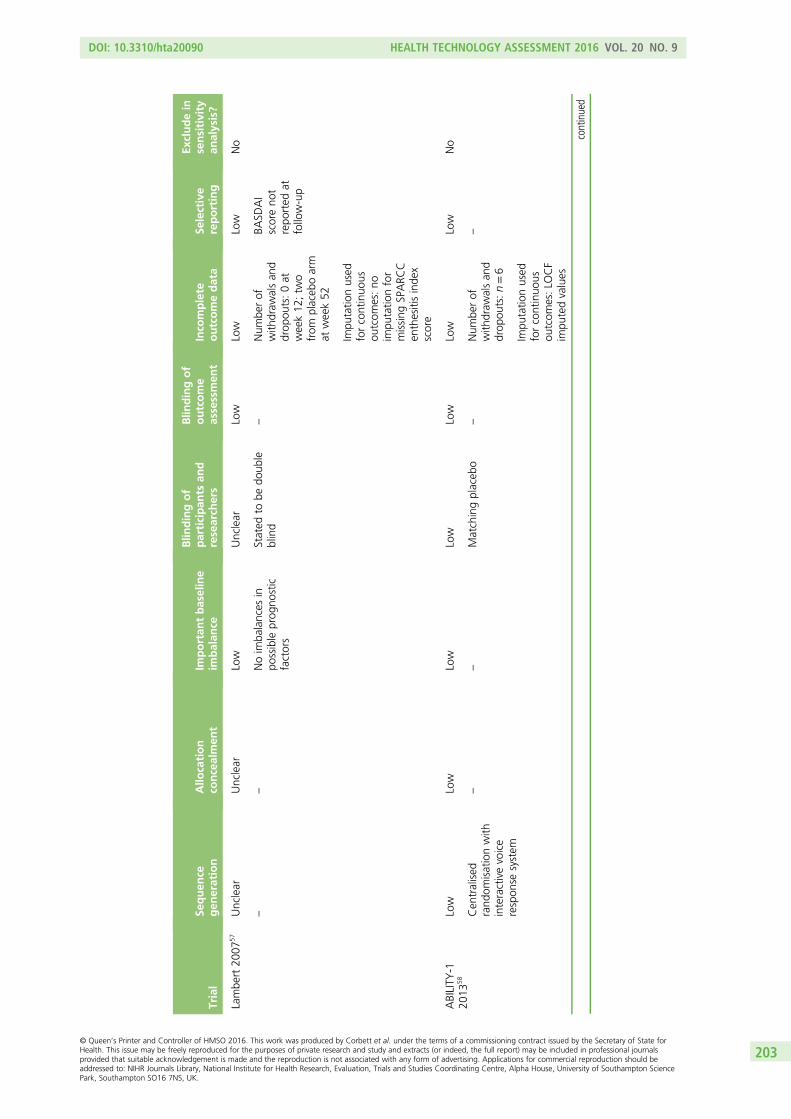
Trial
Sequen
cegen
eration
Allo
cation
concealmen
tIm
portan
tbaseline
imbalan
ce
Blin
dingof
participan
tsan
dresearch
ers
Blin
dingof
outcome
assessmen
tInco
mplete
outcomedata
Selective
reporting
Excludein
sensitivity
analysis?
Lambe
rt20
0757
Unclear
Unclear
Low
Unclear
Low
Low
Low
No
––
Noim
balances
inpo
ssible
prog
nostic
factors
Stated
tobe
doub
leblind
–Num
berof
with
draw
alsan
ddrop
outs:0at
week12
;tw
ofrom
placeb
oarm
atweek52
BASD
AI
scoreno
trepo
rted
atfollow-up
Impu
tatio
nused
forcontinuo
usou
tcom
es:no
impu
tatio
nfor
missing
SPARC
Cen
thesitisinde
xscore
ABILITY
-120
1358
Low
Low
Low
Low
Low
Low
Low
No
Cen
tralised
rand
omisationwith
interactivevoice
respon
sesystem
––
Matchingplaceb
o–
Num
berof
with
draw
alsan
ddrop
outs:n=6
–
Impu
tatio
nused
forcontinuo
usou
tcom
es:LO
CF
impu
tedvalues
continued
DOI: 10.3310/hta20090 HEALTH TECHNOLOGY ASSESSMENT 2016 VOL. 20 NO. 9
© Queen’s Printer and Controller of HMSO 2016. This work was produced by Corbett et al. under the terms of a commissioning contract issued by the Secretary of State forHealth. This issue may be freely reproduced for the purposes of private research and study and extracts (or indeed, the full report) may be included in professional journalsprovided that suitable acknowledgement is made and the reproduction is not associated with any form of advertising. Applications for commercial reproduction should beaddressed to: NIHR Journals Library, National Institute for Health Research, Evaluation, Trials and Studies Coordinating Centre, Alpha House, University of Southampton SciencePark, Southampton SO16 7NS, UK.
203
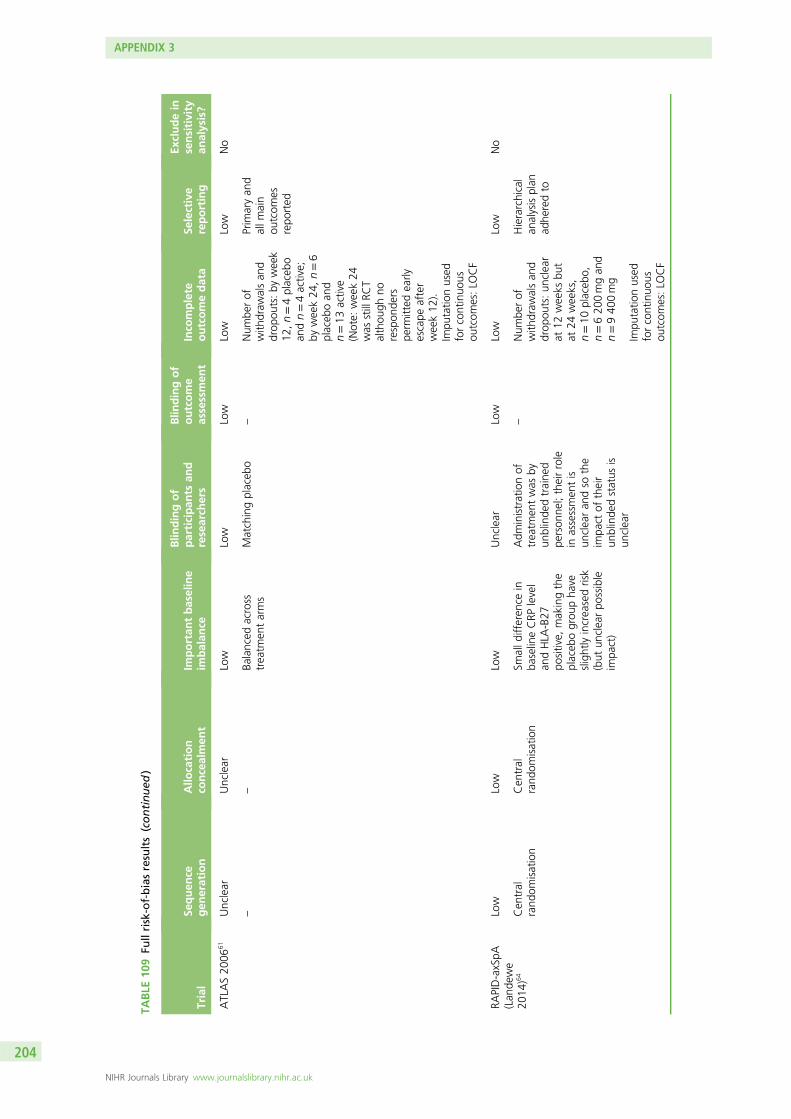
TABLE
109
Fullrisk-of-biasresults(continued
)
Trial
Sequen
cegen
eration
Allo
cation
concealmen
tIm
portan
tbaseline
imbalan
ce
Blin
dingof
participan
tsan
dresearch
ers
Blin
dingof
outcome
assessmen
tInco
mplete
outcomedata
Selective
reporting
Excludein
sensitivity
analysis?
ATLAS20
0661
Unclear
Unclear
Low
Low
Low
Low
Low
No
––
Balanced
across
treatm
entarms
Matchingplaceb
o–
Num
berof
with
draw
alsan
ddrop
outs:by
week
12,n=4placeb
oan
dn=4active;
byweek24
,n=6
placeb
oan
dn=13
active
(Note:
week24
was
stillRC
Talthou
ghno
respon
ders
perm
itted
early
escape
after
week12
).Im
putatio
nused
forcontinuo
usou
tcom
es:LO
CF
Prim
aryan
dallm
ain
outcom
esrepo
rted
RAPID-axSpA
(Lan
dewe
2014
)64
Low
Low
Low
Unclear
Low
Low
Low
No
Cen
tral
rand
omisation
Cen
tral
rand
omisation
Smalld
ifferen
cein
baselineCRP
level
andHLA
-B27
positive,
makingthe
placeb
ogrou
pha
veslightlyincreasedrisk
(but
unclearpo
ssible
impa
ct)
Adm
inistrationof
treatm
entwas
byun
blinde
dtraine
dpe
rson
nel;theirrole
inassessmen
tis
unclearan
dso
the
impa
ctof
their
unblinde
dstatus
isun
clear
–Num
berof
with
draw
alsan
ddrop
outs:un
clear
at12
weeks
but
at24
weeks,
n=10
placeb
o,n=620
0mgan
dn=940
0mg
Hierarchical
analysisplan
adhe
redto
Impu
tatio
nused
forcontinuo
usou
tcom
es:LO
CF
APPENDIX 3
NIHR Journals Library www.journalslibrary.nihr.ac.uk
204
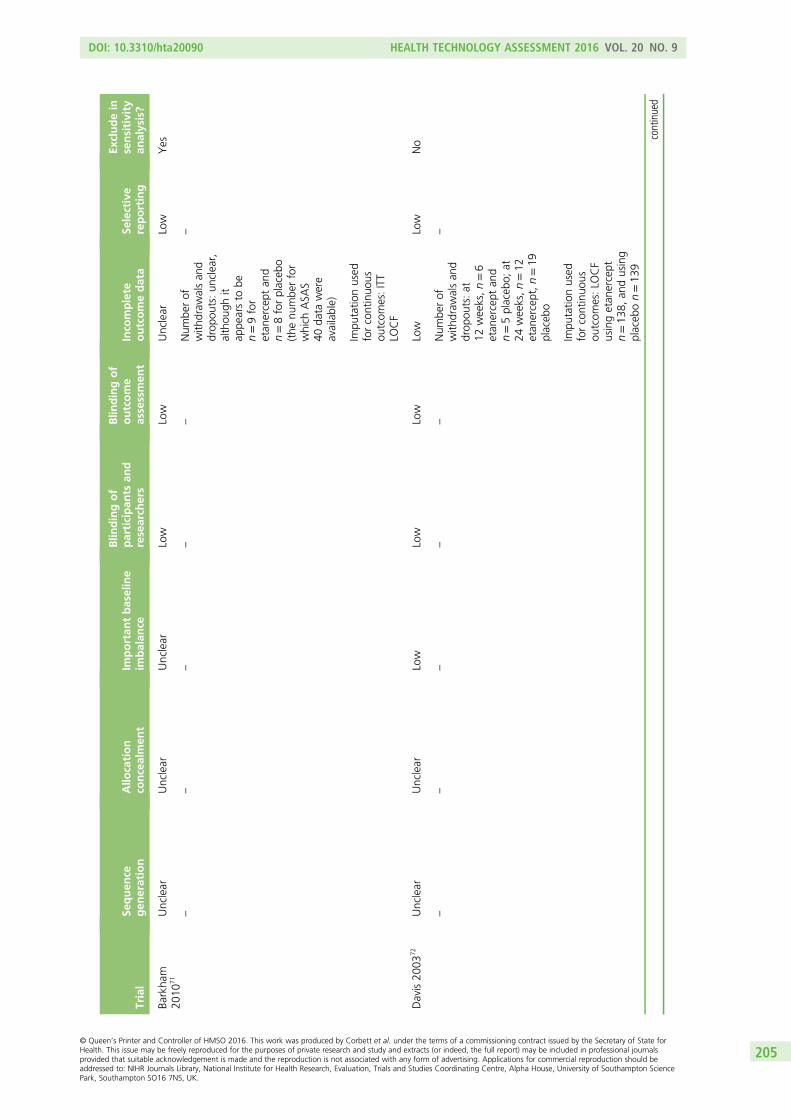
Trial
Sequen
cegen
eration
Allo
cation
concealmen
tIm
portan
tbaseline
imbalan
ce
Blin
dingof
participan
tsan
dresearch
ers
Blin
dingof
outcome
assessmen
tInco
mplete
outcomedata
Selective
reporting
Excludein
sensitivity
analysis?
Barkha
m20
1071
Unclear
Unclear
Unclear
Low
Low
Unclear
Low
Yes
––
––
–Num
berof
with
draw
alsan
ddrop
outs:un
clear,
althou
ghit
appe
arsto
ben=9for
etan
ercept
and
n=8forplaceb
o(the
numbe
rfor
which
ASA
S40
data
were
available)
–
Impu
tatio
nused
forcontinuo
usou
tcom
es:ITT
LOCF
Davis20
0372
Unclear
Unclear
Low
Low
Low
Low
Low
No
––
––
–Num
berof
with
draw
alsan
ddrop
outs:at
12weeks,n=6
etan
ercept
and
n=5placeb
o;at
24weeks,n=12
etan
ercept,n=19
placeb
o
–
Impu
tatio
nused
forcontinuo
usou
tcom
es:LO
CF
usingetan
ercept
n=13
8,an
dusing
placeb
on=13
9
continued
DOI: 10.3310/hta20090 HEALTH TECHNOLOGY ASSESSMENT 2016 VOL. 20 NO. 9
© Queen’s Printer and Controller of HMSO 2016. This work was produced by Corbett et al. under the terms of a commissioning contract issued by the Secretary of State forHealth. This issue may be freely reproduced for the purposes of private research and study and extracts (or indeed, the full report) may be included in professional journalsprovided that suitable acknowledgement is made and the reproduction is not associated with any form of advertising. Applications for commercial reproduction should beaddressed to: NIHR Journals Library, National Institute for Health Research, Evaluation, Trials and Studies Coordinating Centre, Alpha House, University of Southampton SciencePark, Southampton SO16 7NS, UK.
205
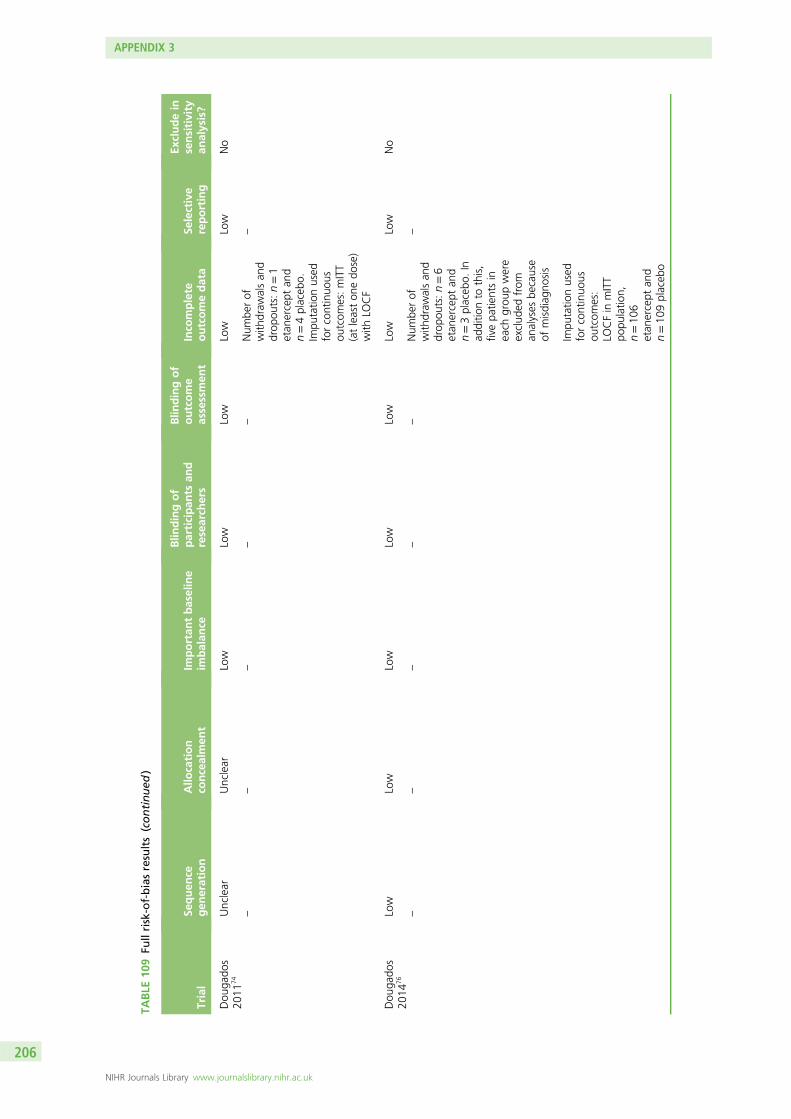
TABLE
109
Fullrisk-of-biasresults(continued
)
Trial
Sequen
cegen
eration
Allo
cation
concealmen
tIm
portan
tbaseline
imbalan
ce
Blin
dingof
participan
tsan
dresearch
ers
Blin
dingof
outcome
assessmen
tInco
mplete
outcomedata
Selective
reporting
Excludein
sensitivity
analysis?
Dou
gado
s20
1174
Unclear
Unclear
Low
Low
Low
Low
Low
No
––
––
–Num
berof
with
draw
alsan
ddrop
outs:n=1
etan
ercept
and
n=4placeb
o.Im
putatio
nused
forcontinuo
usou
tcom
es:mITT
(atleaston
edo
se)
with
LOCF
–
Dou
gado
s20
1476
Low
Low
Low
Low
Low
Low
Low
No
––
––
–Num
berof
with
draw
alsan
ddrop
outs:n=6
etan
ercept
and
n=3placeb
o.In
additio
nto
this,
fivepa
tientsin
each
grou
pwere
exclud
edfrom
analyses
because
ofmisdiag
nosis
–
Impu
tatio
nused
forcontinuo
usou
tcom
es:
LOCFin
mITT
popu
latio
n,n=10
6etan
ercept
and
n=10
9placeb
o
APPENDIX 3
NIHR Journals Library www.journalslibrary.nihr.ac.uk
206
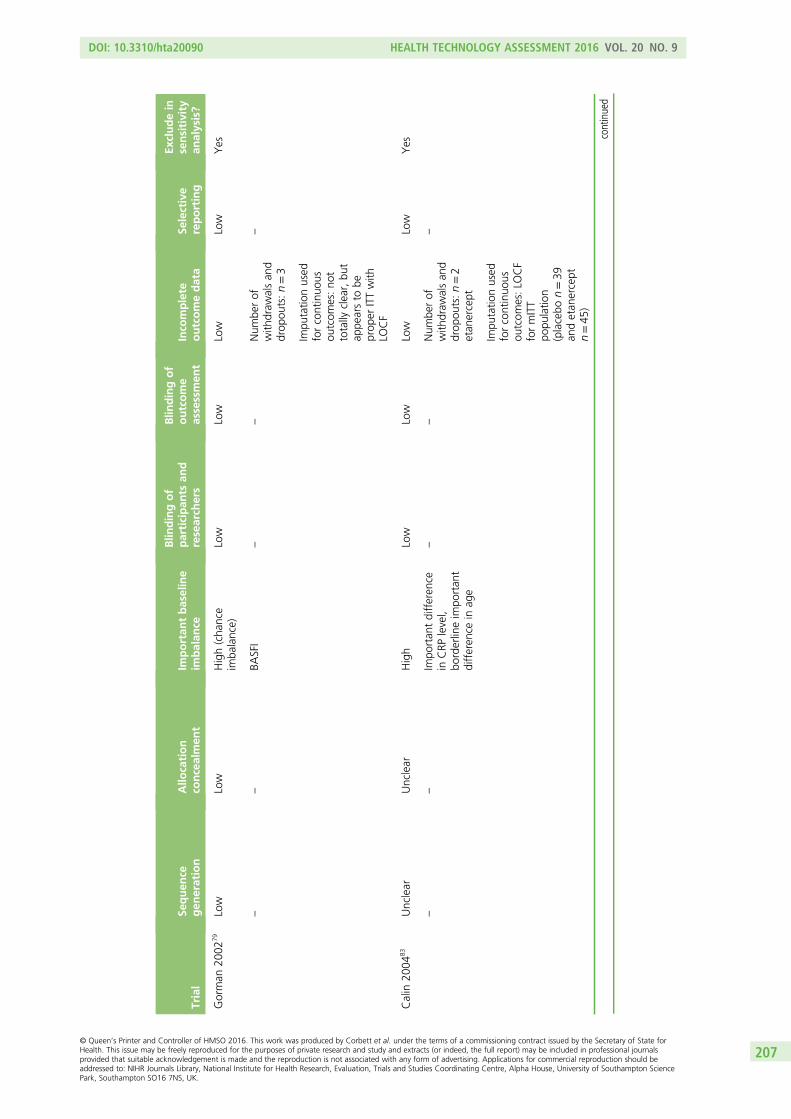
Trial
Sequen
cegen
eration
Allo
cation
concealmen
tIm
portan
tbaseline
imbalan
ce
Blin
dingof
participan
tsan
dresearch
ers
Blin
dingof
outcome
assessmen
tInco
mplete
outcomedata
Selective
reporting
Excludein
sensitivity
analysis?
Gorman
2002
79Low
Low
High(cha
nce
imba
lance)
Low
Low
Low
Low
Yes
––
BASFI
––
Num
berof
with
draw
alsan
ddrop
outs:n=3
–
Impu
tatio
nused
forcontinuo
usou
tcom
es:no
ttotally
clear,bu
tap
pearsto
beprop
erITTwith
LOCF
Calin
2004
83Unclear
Unclear
High
Low
Low
Low
Low
Yes
––
Impo
rtan
tdifferen
cein
CRP
level,
borderlineim
portan
tdifferen
cein
age
––
Num
berof
with
draw
alsan
ddrop
outs:n=2
etan
ercept
–
Impu
tatio
nused
forcontinuo
usou
tcom
es:LO
CF
formITT
popu
latio
n(placebo
n=39
andetan
ercept
n=45
)
continued
DOI: 10.3310/hta20090 HEALTH TECHNOLOGY ASSESSMENT 2016 VOL. 20 NO. 9
© Queen’s Printer and Controller of HMSO 2016. This work was produced by Corbett et al. under the terms of a commissioning contract issued by the Secretary of State forHealth. This issue may be freely reproduced for the purposes of private research and study and extracts (or indeed, the full report) may be included in professional journalsprovided that suitable acknowledgement is made and the reproduction is not associated with any form of advertising. Applications for commercial reproduction should beaddressed to: NIHR Journals Library, National Institute for Health Research, Evaluation, Trials and Studies Coordinating Centre, Alpha House, University of Southampton SciencePark, Southampton SO16 7NS, UK.
207
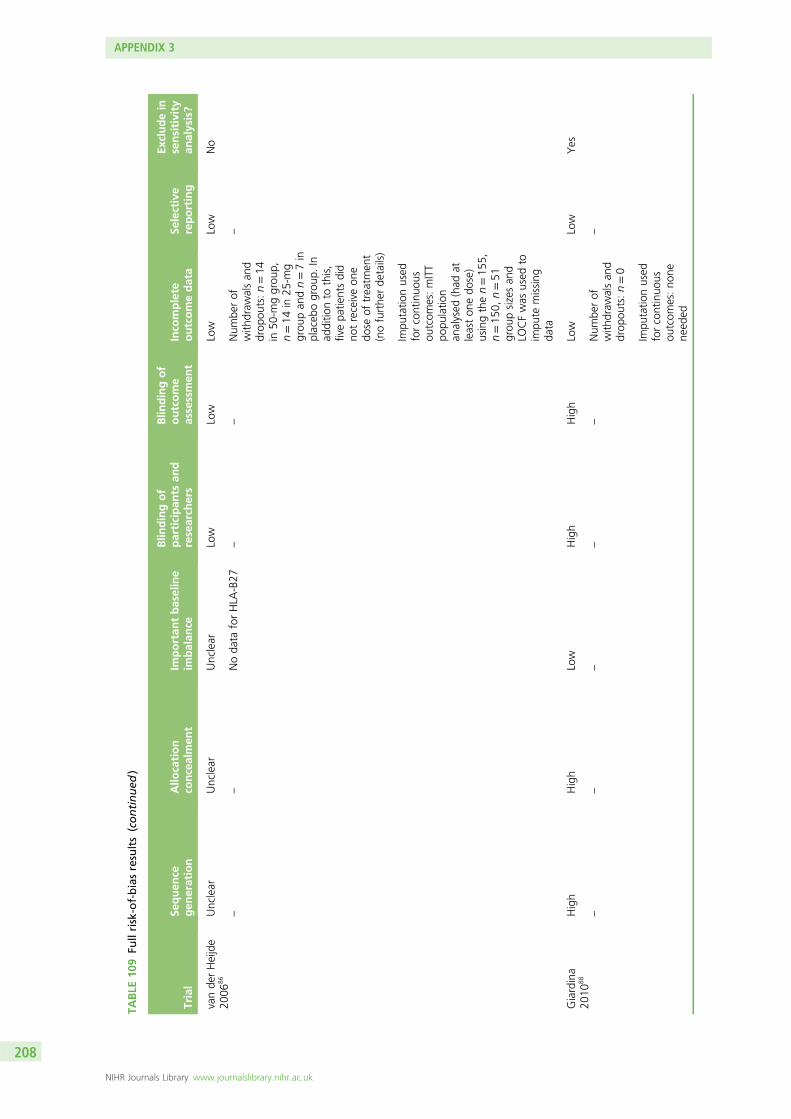
TABLE
109
Fullrisk-of-biasresults(continued
)
Trial
Sequen
cegen
eration
Allo
cation
concealmen
tIm
portan
tbaseline
imbalan
ce
Blin
dingof
participan
tsan
dresearch
ers
Blin
dingof
outcome
assessmen
tInco
mplete
outcomedata
Selective
reporting
Excludein
sensitivity
analysis?
vande
rHeijde
2006
86Unclear
Unclear
Unclear
Low
Low
Low
Low
No
––
Noda
taforHLA
-B27
––
Num
berof
with
draw
alsan
ddrop
outs:n=14
in50
-mggrou
p,n=14
in25
-mg
grou
pan
dn=7in
placeb
ogrou
p.In
additio
nto
this,
fivepa
tientsdid
notreceiveon
edo
seof
treatm
ent
(nofurthe
rde
tails)
–
Impu
tatio
nused
forcontinuo
usou
tcom
es:mITT
popu
latio
nan
alysed
(had
atleaston
edo
se)
usingthen=15
5,n=15
0,n=51
grou
psizesan
dLO
CFwas
used
toim
pute
missing
data
Giardina
2010
88High
High
Low
High
High
Low
Low
Yes
––
––
–Num
berof
with
draw
alsan
ddrop
outs:n=0
–
Impu
tatio
nused
forcontinuo
usou
tcom
es:no
nene
eded
APPENDIX 3
NIHR Journals Library www.journalslibrary.nihr.ac.uk
208
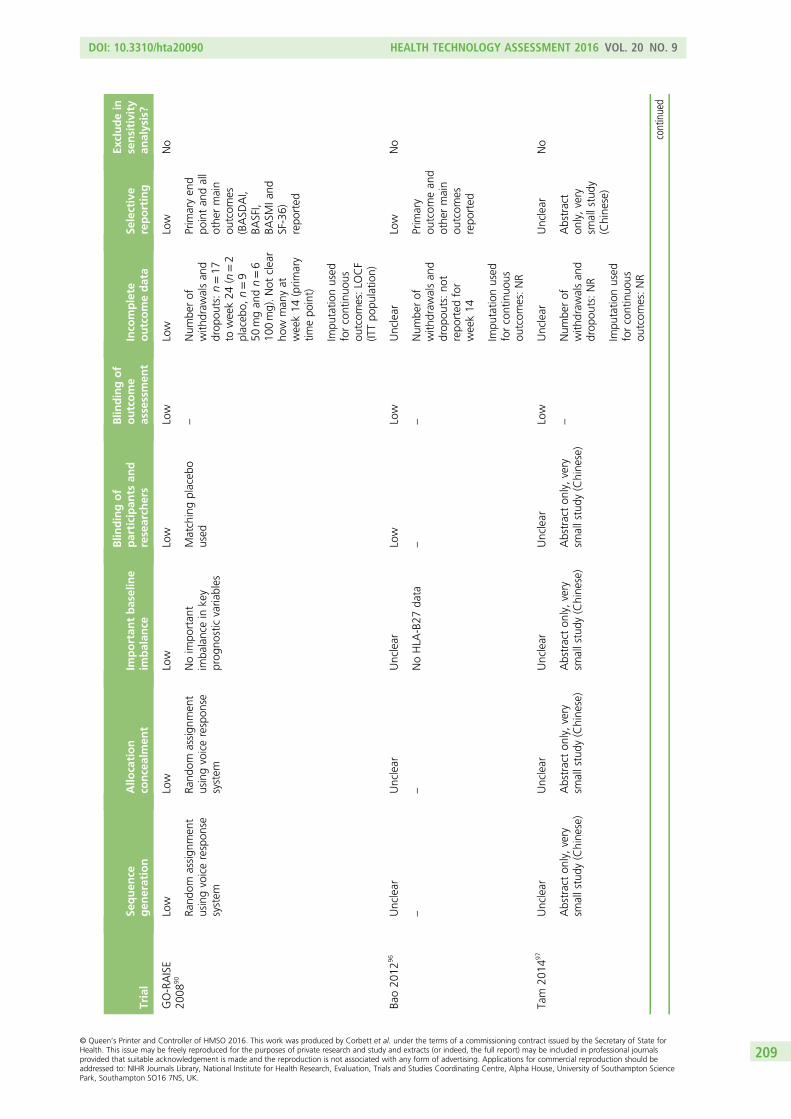
Trial
Sequen
cegen
eration
Allo
cation
concealmen
tIm
portan
tbaseline
imbalan
ce
Blin
dingof
participan
tsan
dresearch
ers
Blin
dingof
outcome
assessmen
tInco
mplete
outcomedata
Selective
reporting
Excludein
sensitivity
analysis?
GO-RAISE
2008
90Low
Low
Low
Low
Low
Low
Low
No
Rand
omassign
men
tusingvoicerespon
sesystem
Rand
omassign
men
tusingvoicerespon
sesystem
Noim
portan
tim
balancein
key
prog
nosticvaria
bles
Matchingplaceb
oused
–Num
berof
with
draw
alsan
ddrop
outs:n=17
toweek24
(n=2
placeb
o,n=9
50mgan
dn=6
100mg).Not
clear
how
man
yat
week14
(prim
ary
timepo
int)
Prim
aryen
dpo
intan
dall
othe
rmain
outcom
es(BASD
AI,
BASFI,
BASM
Iand
SF-36)
repo
rted
Impu
tatio
nused
forcontinuo
usou
tcom
es:LO
CF
(ITTpo
pulatio
n)
Bao20
1296
Unclear
Unclear
Unclear
Low
Low
Unclear
Low
No
––
NoHLA
-B27
data
––
Num
berof
with
draw
alsan
ddrop
outs:no
trepo
rted
for
week14
Prim
ary
outcom
ean
dothe
rmain
outcom
esrepo
rted
Impu
tatio
nused
forcontinuo
usou
tcom
es:NR
Tam
2014
97Unclear
Unclear
Unclear
Unclear
Low
Unclear
Unclear
No
Abstracton
ly,very
smallstudy
(Chine
se)
Abstracton
ly,very
smallstudy
(Chine
se)
Abstracton
ly,very
smallstudy
(Chine
se)
Abstracton
ly,very
smallstudy
(Chine
se)
–Num
berof
with
draw
alsan
ddrop
outs:NR
Abstract
only,very
smallstudy
(Chine
se)
Impu
tatio
nused
forcontinuo
usou
tcom
es:NR
continued
DOI: 10.3310/hta20090 HEALTH TECHNOLOGY ASSESSMENT 2016 VOL. 20 NO. 9
© Queen’s Printer and Controller of HMSO 2016. This work was produced by Corbett et al. under the terms of a commissioning contract issued by the Secretary of State forHealth. This issue may be freely reproduced for the purposes of private research and study and extracts (or indeed, the full report) may be included in professional journalsprovided that suitable acknowledgement is made and the reproduction is not associated with any form of advertising. Applications for commercial reproduction should beaddressed to: NIHR Journals Library, National Institute for Health Research, Evaluation, Trials and Studies Coordinating Centre, Alpha House, University of Southampton SciencePark, Southampton SO16 7NS, UK.
209
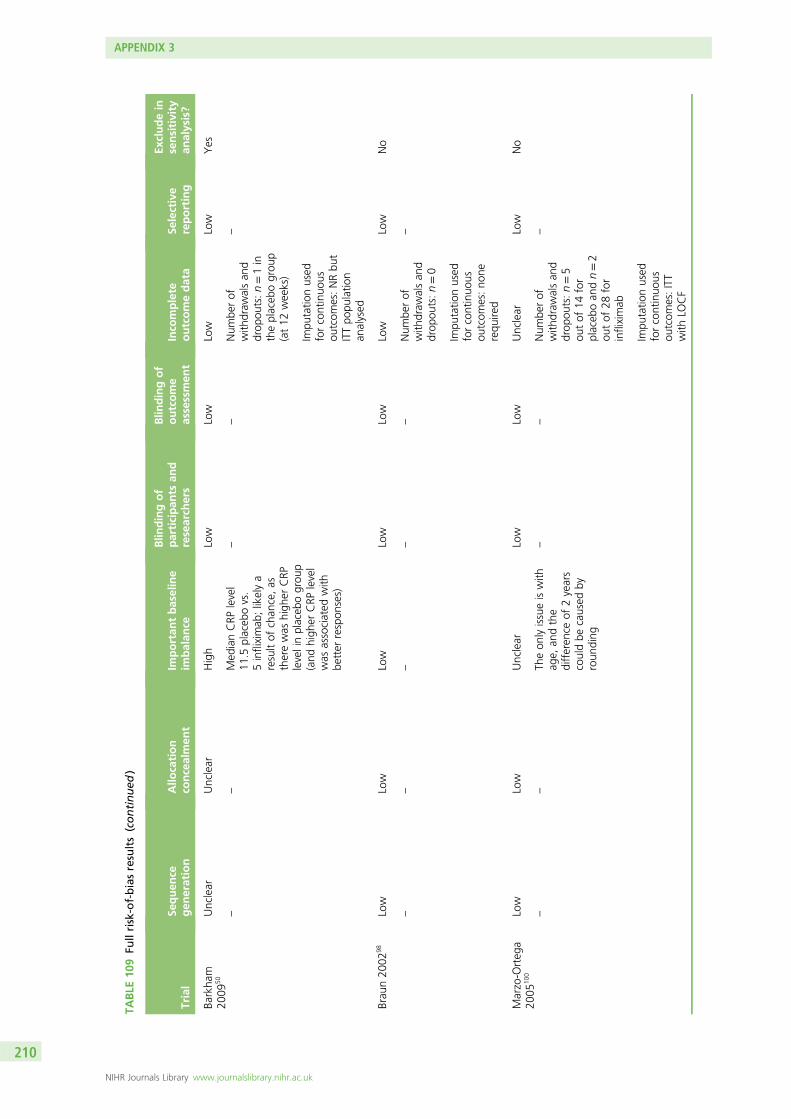
TABLE
109
Fullrisk-of-biasresults(continued
)
Trial
Sequen
cegen
eration
Allo
cation
concealmen
tIm
portan
tbaseline
imbalan
ce
Blin
dingof
participan
tsan
dresearch
ers
Blin
dingof
outcome
assessmen
tInco
mplete
outcomedata
Selective
reporting
Excludein
sensitivity
analysis?
Barkha
m20
0950
Unclear
Unclear
High
Low
Low
Low
Low
Yes
––
Med
ianCRP
level
11.5
placeb
ovs.
5infliximab
;likelya
resultof
chan
ce,as
therewas
high
erCRP
levelinplaceb
ogrou
p(and
high
erCRP
level
was
associated
with
better
respon
ses)
––
Num
berof
with
draw
alsan
ddrop
outs:n=1in
theplaceb
ogrou
p(at12
weeks)
–
Impu
tatio
nused
forcontinuo
usou
tcom
es:NRbu
tITTpo
pulatio
nan
alysed
Brau
n20
0298
Low
Low
Low
Low
Low
Low
Low
No
––
––
–Num
berof
with
draw
alsan
ddrop
outs:n=0
–
Impu
tatio
nused
forcontinuo
usou
tcom
es:no
nerequ
ired
Marzo-O
rteg
a20
0510
0Low
Low
Unclear
Low
Low
Unclear
Low
No
––
Theon
lyissueiswith
age,
andthe
differen
ceof
2years
couldbe
caused
byroun
ding
––
Num
berof
with
draw
alsan
ddrop
outs:n=5
outof
14for
placeb
oan
dn=2
outof
28for
infliximab
–
Impu
tatio
nused
forcontinuo
usou
tcom
es:ITT
with
LOCF
APPENDIX 3
NIHR Journals Library www.journalslibrary.nihr.ac.uk
210
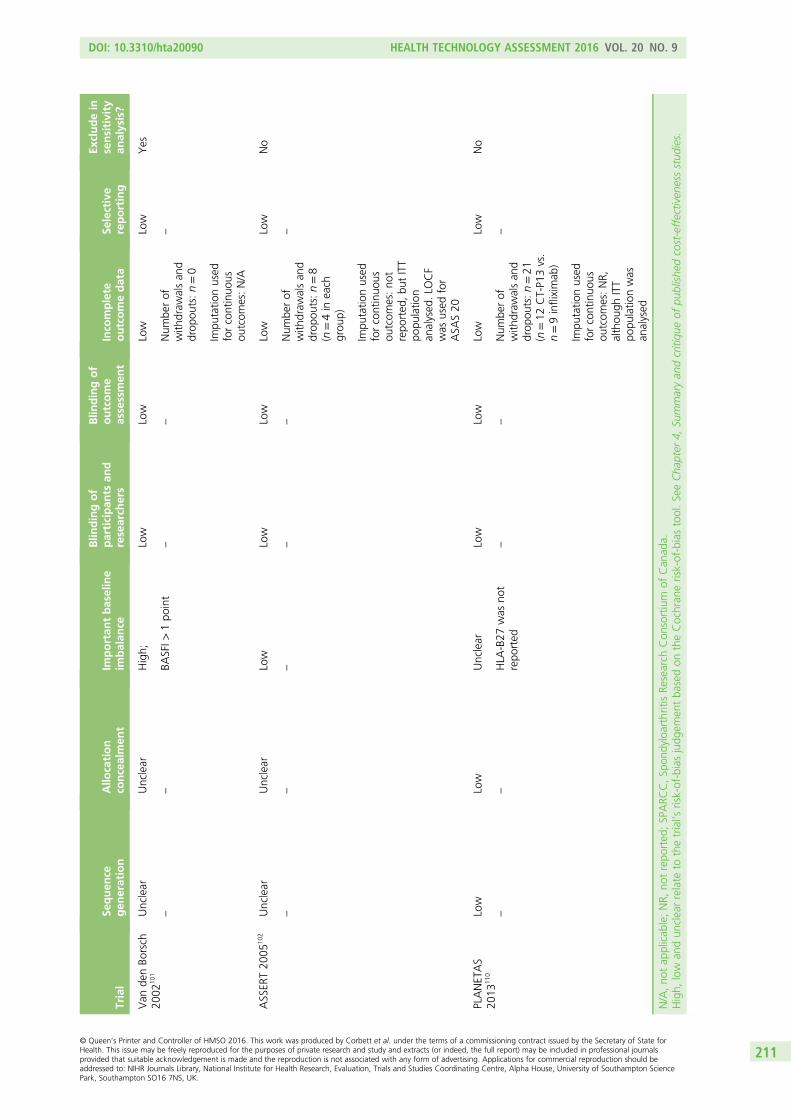
Trial
Sequen
cegen
eration
Allo
cation
concealmen
tIm
portan
tbaseline
imbalan
ce
Blin
dingof
participan
tsan
dresearch
ers
Blin
dingof
outcome
assessmen
tInco
mplete
outcomedata
Selective
reporting
Excludein
sensitivity
analysis?
Van
denBo
rsch
2002
101
Unclear
Unclear
High;
Low
Low
Low
Low
Yes
––
BASFI>
1po
int
––
Num
berof
with
draw
alsan
ddrop
outs:n=0
–
Impu
tatio
nused
forcontinuo
usou
tcom
es:N/A
ASSER
T20
0510
2Unclear
Unclear
Low
Low
Low
Low
Low
No
––
––
–Num
berof
with
draw
alsan
ddrop
outs:n=8
(n=4in
each
grou
p)
–
Impu
tatio
nused
forcontinuo
usou
tcom
es:no
trepo
rted
,bu
tITT
popu
latio
nan
alysed
.LO
CF
was
used
for
ASA
S20
PLANETAS
2013
110
Low
Low
Unclear
Low
Low
Low
Low
No
––
HLA
-B27
was
not
repo
rted
––
Num
berof
with
draw
alsan
ddrop
outs:n=21
(n=12
CT-P1
3vs.
n=9infliximab
)
–
Impu
tatio
nused
forcontinuo
usou
tcom
es:NR,
althou
ghITT
popu
latio
nwas
analysed
N/A,no
tap
plicab
le;NR,
notrepo
rted
;SPARC
C,Sp
ondyloarthritisRe
search
Con
sortium
ofCan
ada.
High,
low
andun
clearrelate
tothetrial’s
risk-of-biasjudg
emen
tba
sedon
theCochran
erisk-of-biastool.SeeCha
pter
4,Su
mmaryan
dcritiqu
eof
publishe
dcost-effectiven
essstud
ies.
DOI: 10.3310/hta20090 HEALTH TECHNOLOGY ASSESSMENT 2016 VOL. 20 NO. 9
© Queen’s Printer and Controller of HMSO 2016. This work was produced by Corbett et al. under the terms of a commissioning contract issued by the Secretary of State forHealth. This issue may be freely reproduced for the purposes of private research and study and extracts (or indeed, the full report) may be included in professional journalsprovided that suitable acknowledgement is made and the reproduction is not associated with any form of advertising. Applications for commercial reproduction should beaddressed to: NIHR Journals Library, National Institute for Health Research, Evaluation, Trials and Studies Coordinating Centre, Alpha House, University of Southampton SciencePark, Southampton SO16 7NS, UK.
211
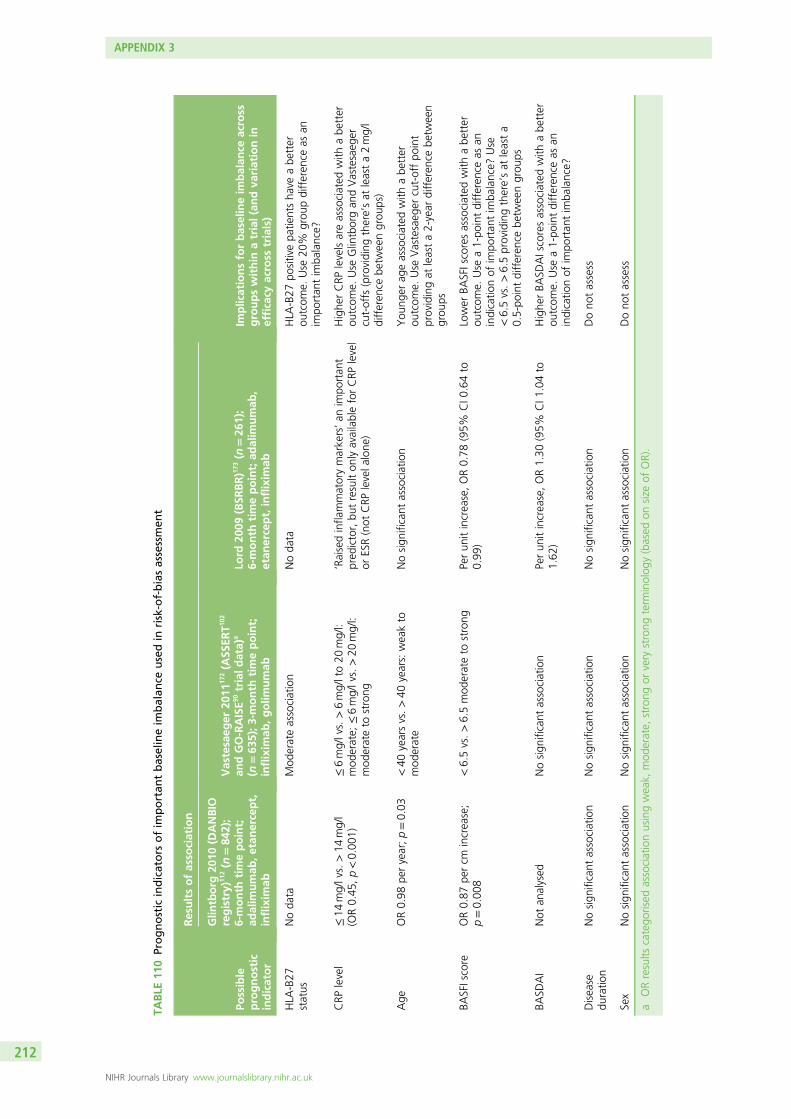
TABLE
110
Prognostic
indicators
ofim
portan
tbaselineim
balan
ceusedin
risk-of-biasassessmen
t
Possible
prognostic
indicator
Resultsofasso
ciation
Implicationsforbaselineim
balan
ceacross
groupswithin
atrial(an
dva
riationin
efficacy
across
trials)
Glin
tborg
2010
(DANBIO
registry)
112(n
=84
2);
6-month
timepoint;
adalim
umab
,etan
ercept,
inflixim
ab
Vastesaeg
er20
1117
2(A
SSER
T102
andGO-RAISE9
0trialdata)
a
(n=63
5);3
-month
timepoint;
inflixim
ab,golim
umab
Lord
2009
(BSR
BR)1
73(n
=26
1);
6-month
timepoint;ad
alim
umab
,etan
ercept,inflixim
ab
HLA
-B27
status
Noda
taMod
erateassociation
Noda
taHLA
-B27
positivepa
tientsha
veabe
tter
outcom
e.Use
20%
grou
pdifferen
ceas
anim
portan
tim
balance?
CRP
level
≤14
mg/lvs.>14
mg/l
(OR0.45
,p<0.00
1)≤6mg/lvs.>6mg/lto20
mg/l:
mod
erate;
≤6mg/lvs.>20
mg/l:
mod
erateto
strong
‘Raisedinfla
mmatorymarkers’an
impo
rtan
tpred
ictor,bu
tresulton
lyavailableforCRP
level
orESR(not
CRP
levela
lone
)
Highe
rCRP
levelsareassociated
with
abe
tter
outcom
e.Use
Glintborgan
dVastesaeg
ercut-offs
(providing
there’sat
leasta2mg/l
differen
cebe
tweengrou
ps)
Age
OR0.98
peryear;p=0.03
<40
yearsvs.>40
years:weakto
mod
erate
Nosign
ificant
association
You
nger
ageassociated
with
abe
tter
outcom
e.Use
Vastesaeg
ercut-offpo
int
providingat
leasta2-year
differen
cebe
tween
grou
ps
BASFIscore
OR0.87
percm
increase;
p=0.00
8<6.5vs.>6.5mod
erateto
strong
Perun
itincrease,OR0.78
(95%
CI0
.64to
0.99
)Lower
BASFIscoresassociated
with
abe
tter
outcom
e.Use
a1-po
intdifferen
ceas
anindicatio
nof
impo
rtan
tim
balance?
Use
<6.5vs.>6.5providingthere’sat
leasta
0.5-po
intdifferen
cebe
tweengrou
ps
BASD
AI
Not
analysed
Nosign
ificant
association
Perun
itincrease,OR1.30
(95%
CI1
.04to
1.62
)Highe
rBA
SDAIscoresassociated
with
abe
tter
outcom
e.Use
a1-po
intdifferen
ceas
anindicatio
nof
impo
rtan
tim
balance?
Disease
duratio
nNosign
ificant
association
Nosign
ificant
association
Nosign
ificant
association
Dono
tassess
Sex
Nosign
ificant
association
Nosign
ificant
association
Nosign
ificant
association
Dono
tassess
aORresults
catego
rised
associationusingweak,
mod
erate,
strong
orvery
strong
term
inolog
y(based
onsize
ofOR).
APPENDIX 3
NIHR Journals Library www.journalslibrary.nihr.ac.uk
212

Appendix 4 Trial results
DOI: 10.3310/hta20090 HEALTH TECHNOLOGY ASSESSMENT 2016 VOL. 20 NO. 9
© Queen’s Printer and Controller of HMSO 2016. This work was produced by Corbett et al. under the terms of a commissioning contract issued by the Secretary of State forHealth. This issue may be freely reproduced for the purposes of private research and study and extracts (or indeed, the full report) may be included in professional journalsprovided that suitable acknowledgement is made and the reproduction is not associated with any form of advertising. Applications for commercial reproduction should beaddressed to: NIHR Journals Library, National Institute for Health Research, Evaluation, Trials and Studies Coordinating Centre, Alpha House, University of Southampton SciencePark, Southampton SO16 7NS, UK.
213
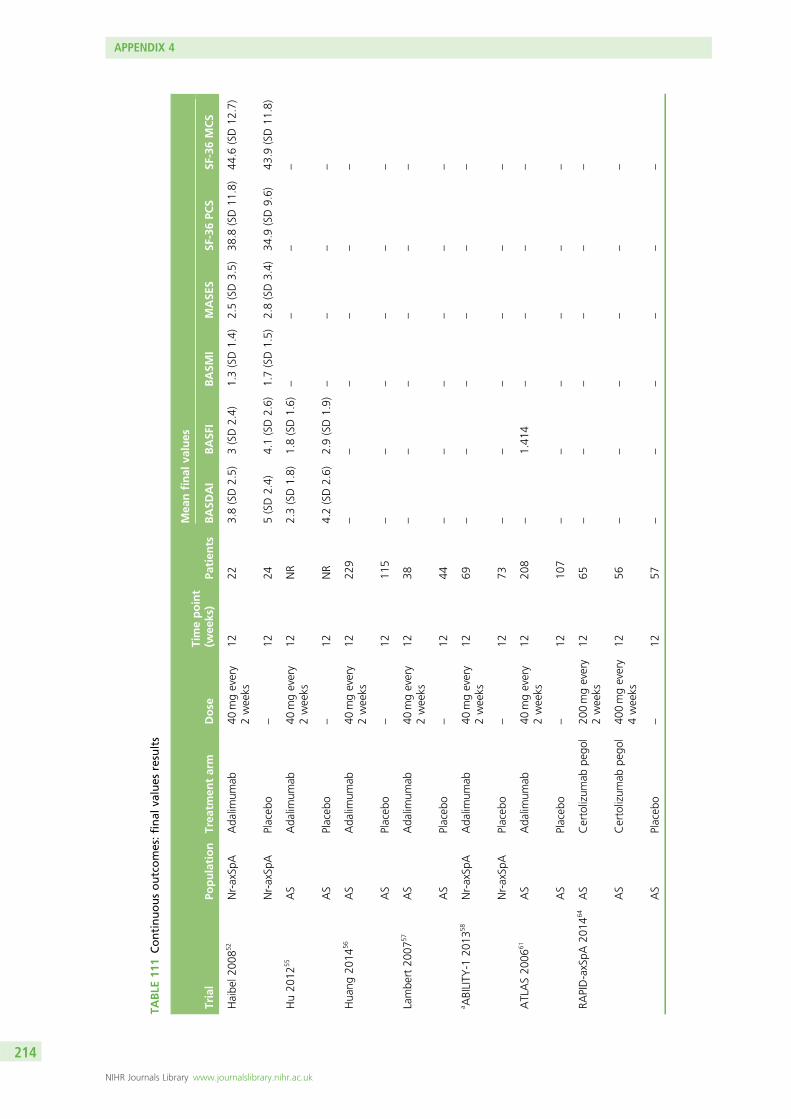
TABLE
111
Continuousoutcomes:final
values
results
Trial
Population
Trea
tmen
tarm
Dose
Timepoint
(wee
ks)
Patien
ts
Mea
nfinal
values
BASD
AI
BASF
IBASM
IMASE
SSF
-36PC
SSF
-36MCS
Haibe
l200
852
Nr-axSp
AAda
limum
ab40
mgevery
2weeks
1222
3.8(SD2.5)
3(SD2.4)
1.3(SD1.4)
2.5(SD3.5)
38.8
(SD11
.8)
44.6
(SD12
.7)
Nr-axSp
APlaceb
o–
1224
5(SD2.4)
4.1(SD2.6)
1.7(SD1.5)
2.8(SD3.4)
34.9
(SD9.6)
43.9
(SD11
.8)
Hu20
1255
AS
Ada
limum
ab40
mgevery
2weeks
12NR
2.3(SD1.8)
1.8(SD1.6)
––
––
AS
Placeb
o–
12NR
4.2(SD2.6)
2.9(SD1.9)
––
––
Hua
ng20
1456
AS
Ada
limum
ab40
mgevery
2weeks
1222
9–
––
––
–
AS
Placeb
o–
1211
5–
––
––
–
Lambe
rt20
0757
AS
Ada
limum
ab40
mgevery
2weeks
1238
––
––
––
AS
Placeb
o–
1244
––
––
––
a ABILITY
-120
1358
Nr-axSp
AAda
limum
ab40
mgevery
2weeks
1269
––
––
––
Nr-axSp
APlaceb
o–
1273
––
––
––
ATLAS20
0661
AS
Ada
limum
ab40
mgevery
2weeks
1220
8–
1.41
4–
––
–
AS
Placeb
o–
1210
7–
––
––
–
RAPID-axSpA
2014
64AS
Certolizum
abpe
gol
200mgevery
2weeks
1265
––
––
––
AS
Certolizum
abpe
gol
400mgevery
4weeks
1256
––
––
––
AS
Placeb
o–
1257
––
––
––
APPENDIX 4
NIHR Journals Library www.journalslibrary.nihr.ac.uk
214
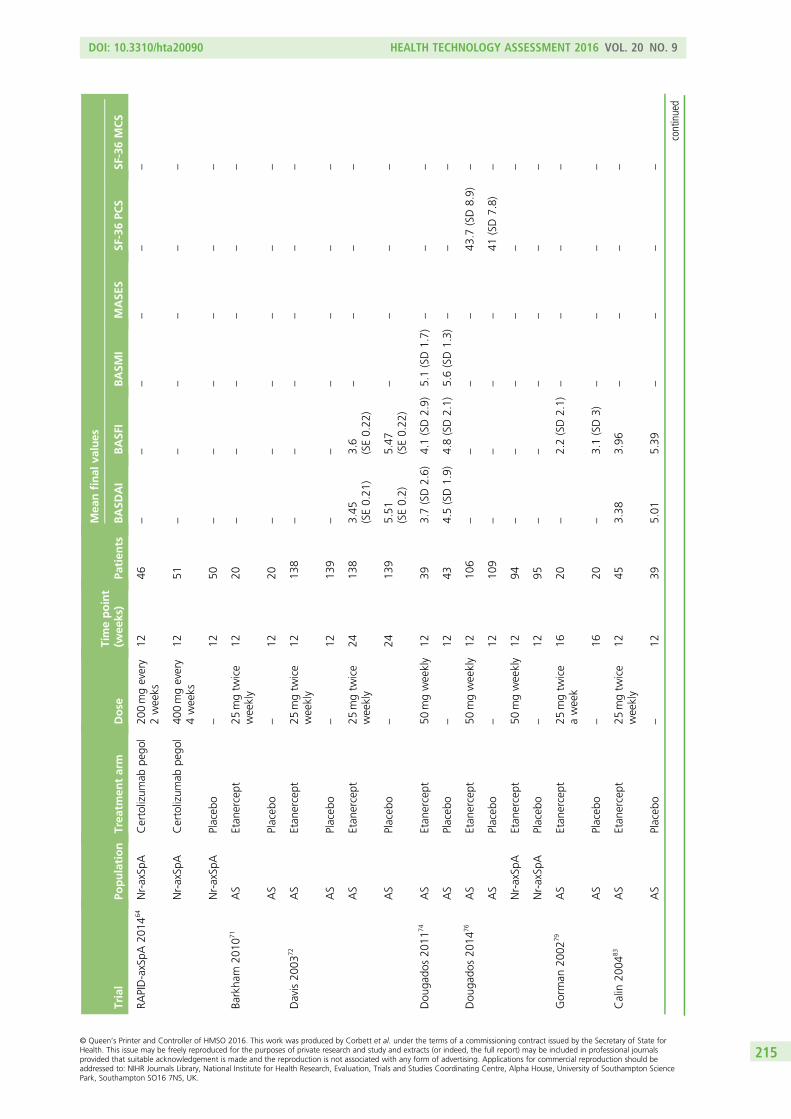
Trial
Population
Trea
tmen
tarm
Dose
Timepoint
(wee
ks)
Patien
ts
Mea
nfinal
values
BASD
AI
BASF
IBASM
IMASE
SSF
-36PC
SSF
-36MCS
RAPID-axSpA
2014
64Nr-axSp
ACertolizum
abpe
gol
200mgevery
2weeks
1246
––
––
––
Nr-axSp
ACertolizum
abpe
gol
400mgevery
4weeks
1251
––
––
––
Nr-axSp
APlaceb
o–
1250
––
––
––
Barkha
m20
1071
AS
Etan
ercept
25mgtw
ice
weekly
1220
––
––
––
AS
Placeb
o–
1220
––
––
––
Davis20
0372
AS
Etan
ercept
25mgtw
ice
weekly
1213
8–
––
––
–
AS
Placeb
o–
1213
9–
––
––
–
AS
Etan
ercept
25mgtw
ice
weekly
2413
83.45
(SE0.21
)3.6
(SE0.22
)–
––
–
AS
Placeb
o–
2413
95.51
(SE0.2)
5.47
(SE0.22
)–
––
–
Dou
gado
s20
1174
AS
Etan
ercept
50mgweekly
1239
3.7(SD2.6)
4.1(SD2.9)
5.1(SD1.7)
––
–
AS
Placeb
o–
1243
4.5(SD1.9)
4.8(SD2.1)
5.6(SD1.3)
––
–
Dou
gado
s20
1476
AS
Etan
ercept
50mgweekly
1210
6–
––
–43
.7(SD8.9)
–
AS
Placeb
o–
1210
9–
––
–41
(SD7.8)
–
Nr-axSp
AEtan
ercept
50mgweekly
1294
––
––
––
Nr-axSp
APlaceb
o–
1295
––
––
––
Gorman
2002
79AS
Etan
ercept
25mgtw
ice
aweek
1620
–2.2(SD2.1)
––
––
AS
Placeb
o–
1620
–3.1(SD3)
––
––
Calin
2004
83AS
Etan
ercept
25mgtw
ice
weekly
1245
3.38
3.96
––
––
AS
Placeb
o–
1239
5.01
5.39
––
––
continued
DOI: 10.3310/hta20090 HEALTH TECHNOLOGY ASSESSMENT 2016 VOL. 20 NO. 9
© Queen’s Printer and Controller of HMSO 2016. This work was produced by Corbett et al. under the terms of a commissioning contract issued by the Secretary of State forHealth. This issue may be freely reproduced for the purposes of private research and study and extracts (or indeed, the full report) may be included in professional journalsprovided that suitable acknowledgement is made and the reproduction is not associated with any form of advertising. Applications for commercial reproduction should beaddressed to: NIHR Journals Library, National Institute for Health Research, Evaluation, Trials and Studies Coordinating Centre, Alpha House, University of Southampton SciencePark, Southampton SO16 7NS, UK.
215
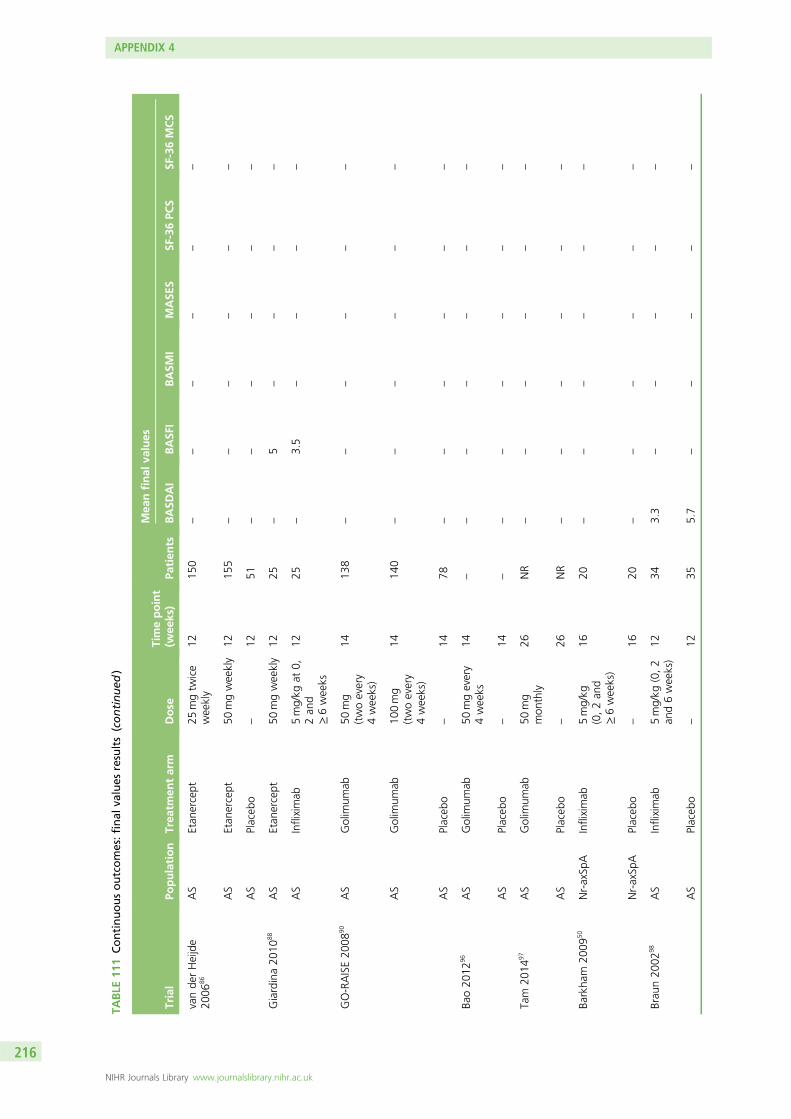
TABLE
111
Continuousoutcomes:final
values
results(continued
)
Trial
Population
Trea
tmen
tarm
Dose
Timepoint
(wee
ks)
Patien
ts
Mea
nfinal
values
BASD
AI
BASF
IBASM
IMASE
SSF
-36PC
SSF
-36MCS
vande
rHeijde
2006
86AS
Etan
ercept
25mgtw
ice
weekly
1215
0–
––
––
–
AS
Etan
ercept
50mgweekly
1215
5–
––
––
–
AS
Placeb
o–
1251
––
––
––
Giardina20
1088
AS
Etan
ercept
50mgweekly
1225
–5
––
––
AS
Infliximab
5mg/kg
at0,
2an
d≥6weeks
1225
–3.5
––
––
GO-RAISE20
0890
AS
Golim
umab
50mg
(twoevery
4weeks)
1413
8–
––
––
–
AS
Golim
umab
100mg
(twoevery
4weeks)
1414
0–
––
––
–
AS
Placeb
o–
1478
––
––
––
Bao20
1296
AS
Golim
umab
50mgevery
4weeks
14–
––
––
––
AS
Placeb
o–
14–
––
––
––
Tam
2014
97AS
Golim
umab
50mg
mon
thly
26NR
––
––
––
AS
Placeb
o–
26NR
––
––
––
Barkha
m20
0950
Nr-axSp
AInfliximab
5mg/kg
(0,2an
d≥6weeks)
1620
––
––
––
Nr-axSp
APlaceb
o–
1620
––
––
––
Brau
n20
0298
AS
Infliximab
5mg/kg
(0,2
and6weeks)
1234
3.3
––
––
–
AS
Placeb
o–
1235
5.7
––
––
–
APPENDIX 4
NIHR Journals Library www.journalslibrary.nihr.ac.uk
216
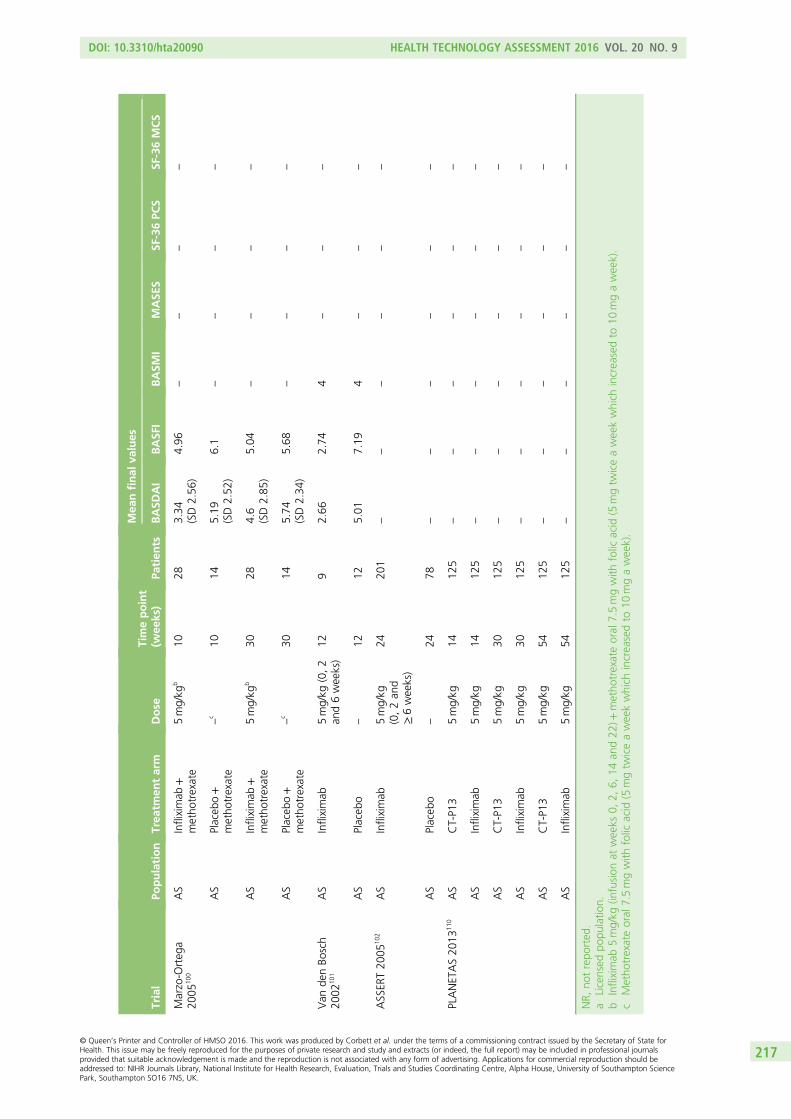
Trial
Population
Trea
tmen
tarm
Dose
Timepoint
(wee
ks)
Patien
ts
Mea
nfinal
values
BASD
AI
BASF
IBASM
IMASE
SSF
-36PC
SSF
-36MCS
Marzo-O
rteg
a20
0510
0AS
Infliximab
+metho
trexate
5mg/kg
b10
283.34
(SD2.56
)4.96
––
––
AS
Placeb
o+
metho
trexate
–c
1014
5.19
(SD2.52
)6.1
––
––
AS
Infliximab
+metho
trexate
5mg/kg
b30
284.6
(SD2.85
)5.04
––
––
AS
Placeb
o+
metho
trexate
–c
3014
5.74
(SD2.34
)5.68
––
––
Van
denBo
sch
2002
101
AS
Infliximab
5mg/kg
(0,2
and6weeks)
129
2.66
2.74
4–
––
AS
Placeb
o–
1212
5.01
7.19
4–
––
ASSER
T20
0510
2AS
Infliximab
5mg/kg
(0,2an
d≥6weeks)
2420
1–
––
––
–
AS
Placeb
o–
2478
––
––
––
PLANETAS20
1311
0AS
CT-P1
35mg/kg
1412
5–
––
––
–
AS
Infliximab
5mg/kg
1412
5–
––
––
–
AS
CT-P1
35mg/kg
3012
5–
––
––
–
AS
Infliximab
5mg/kg
3012
5–
––
––
–
AS
CT-P1
35mg/kg
5412
5–
––
––
–
AS
Infliximab
5mg/kg
5412
5–
––
––
–
NR,
notrepo
rted
.a
Licensed
popu
latio
n.b
Infliximab
5mg/kg
(infusion
atweeks
0,2,
6,14
and22
)+metho
trexateoral
7.5mgwith
folic
acid
(5mgtw
iceaweekwhich
increasedto
10mgaweek).
cMetho
trexateoral
7.5mgwith
folic
acid
(5mgtw
iceaweekwhich
increasedto
10mgaweek).
DOI: 10.3310/hta20090 HEALTH TECHNOLOGY ASSESSMENT 2016 VOL. 20 NO. 9
© Queen’s Printer and Controller of HMSO 2016. This work was produced by Corbett et al. under the terms of a commissioning contract issued by the Secretary of State forHealth. This issue may be freely reproduced for the purposes of private research and study and extracts (or indeed, the full report) may be included in professional journalsprovided that suitable acknowledgement is made and the reproduction is not associated with any form of advertising. Applications for commercial reproduction should beaddressed to: NIHR Journals Library, National Institute for Health Research, Evaluation, Trials and Studies Coordinating Centre, Alpha House, University of Southampton SciencePark, Southampton SO16 7NS, UK.
217
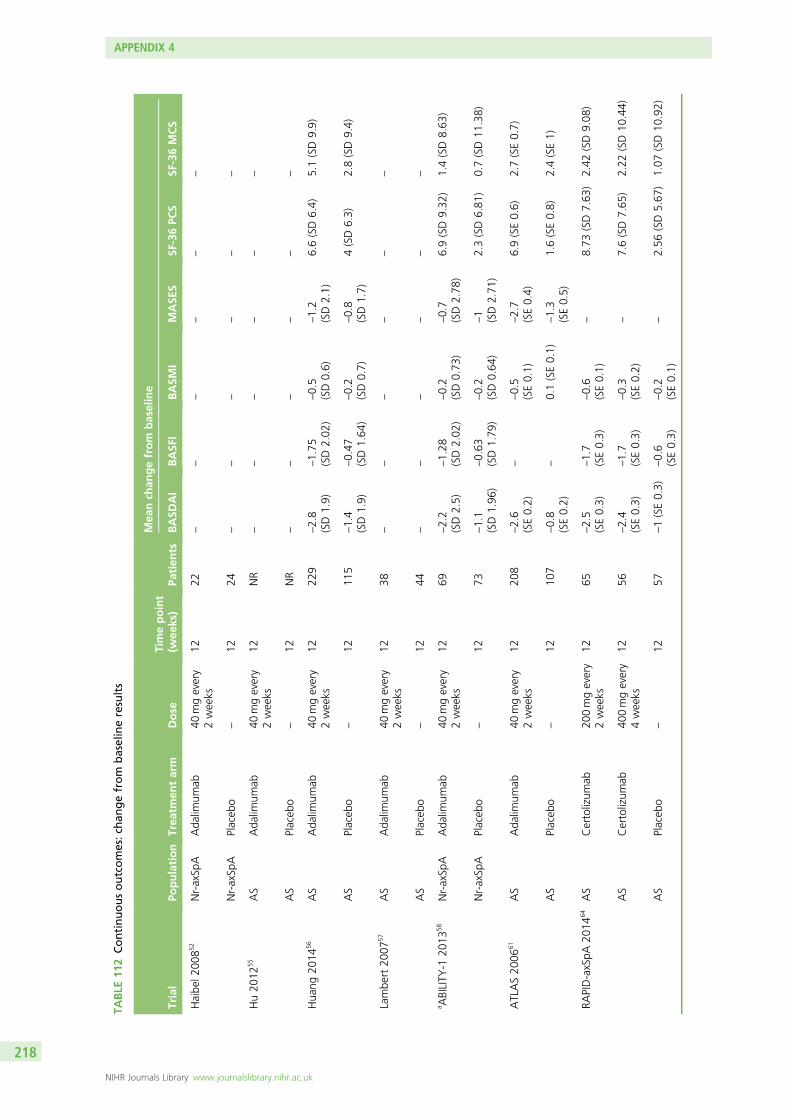
TABLE
112
Continuousoutcomes:ch
angefrom
baselineresults
Trial
Population
Trea
tmen
tarm
Dose
Timepoint
(wee
ks)
Patien
ts
Mea
nch
angefrom
baseline
BASD
AI
BASF
IBASM
IMASE
SSF
-36PC
SSF
-36MCS
Haibe
l200
852
Nr-axSp
AAda
limum
ab40
mgevery
2weeks
1222
––
––
––
Nr-axSp
APlaceb
o–
1224
––
––
––
Hu20
1255
AS
Ada
limum
ab40
mgevery
2weeks
12NR
––
––
––
AS
Placeb
o–
12NR
––
––
––
Hua
ng20
1456
AS
Ada
limum
ab40
mgevery
2weeks
1222
9–2.8
(SD1.9)
–1.75
(SD2.02
)–0.5
(SD0.6)
–1.2
(SD2.1)
6.6(SD6.4)
5.1(SD9.9)
AS
Placeb
o–
1211
5–1.4
(SD1.9)
–0.47
(SD1.64
)–0.2
(SD0.7)
–0.8
(SD1.7)
4(SD6.3)
2.8(SD9.4)
Lambe
rt20
0757
AS
Ada
limum
ab40
mgevery
2weeks
1238
––
––
––
AS
Placeb
o–
1244
––
––
––
a ABILITY
-120
1358
Nr-axSp
AAda
limum
ab40
mgevery
2weeks
1269
–2.2
(SD2.5)
–1.28
(SD2.02
)–0.2
(SD0.73
)–0.7
(SD2.78
)6.9(SD9.32
)1.4(SD8.63
)
Nr-axSp
APlaceb
o–
1273
–1.1
(SD1.96
)–0.63
(SD1.79
)–0.2
(SD0.64
)–1 (SD2.71
)2.3(SD6.81
)0.7(SD11
.38)
ATLAS20
0661
AS
Ada
limum
ab40
mgevery
2weeks
1220
8–2.6
(SE0.2)
––0.5
(SE0.1)
–2.7
(SE0.4)
6.9(SE0.6)
2.7(SE0.7)
AS
Placeb
o–
1210
7–0.8
(SE0.2)
–0.1(SE0.1)
–1.3
(SE0.5)
1.6(SE0.8)
2.4(SE1)
RAPID-axSpA
2014
64AS
Certolizum
ab20
0mgevery
2weeks
1265
–2.5
(SE0.3)
–1.7
(SE0.3)
–0.6
(SE0.1)
–8.73
(SD7.63
)2.42
(SD9.08
)
AS
Certolizum
ab40
0mgevery
4weeks
1256
–2.4
(SE0.3)
–1.7
(SE0.3)
–0.3
(SE0.2)
–7.6(SD7.65
)2.22
(SD10
.44)
AS
Placeb
o–
1257
–1(SE0.3)
–0.6
(SE0.3)
–0.2
(SE0.1)
–2.56
(SD5.67
)1.07
(SD10
.92)
APPENDIX 4
NIHR Journals Library www.journalslibrary.nihr.ac.uk
218
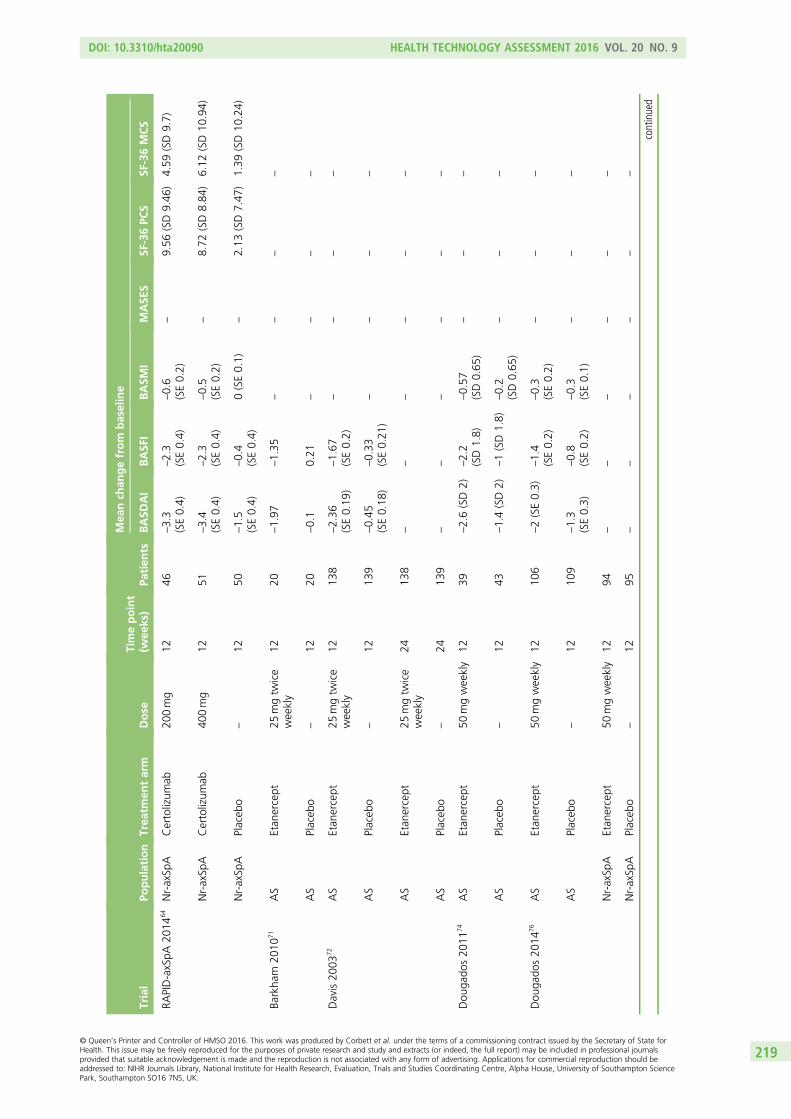
Trial
Population
Trea
tmen
tarm
Dose
Timepoint
(wee
ks)
Patien
ts
Mea
nch
angefrom
baseline
BASD
AI
BASF
IBASM
IMASE
SSF
-36PC
SSF
-36MCS
RAPID-axSpA
2014
64Nr-axSp
ACertolizum
ab20
0mg
1246
–3.3
(SE0.4)
–2.3
(SE0.4)
–0.6
(SE0.2)
–9.56
(SD9.46
)4.59
(SD9.7)
Nr-axSp
ACertolizum
ab40
0mg
1251
–3.4
(SE0.4)
–2.3
(SE0.4)
–0.5
(SE0.2)
–8.72
(SD8.84
)6.12
(SD10
.94)
Nr-axSp
APlaceb
o–
1250
–1.5
(SE0.4)
–0.4
(SE0.4)
0(SE0.1)
–2.13
(SD7.47
)1.39
(SD10
.24)
Barkha
m20
1071
AS
Etan
ercept
25mgtw
ice
weekly
1220
–1.97
–1.35
––
––
AS
Placeb
o–
1220
–0.1
0.21
––
––
Davis20
0372
AS
Etan
ercept
25mgtw
ice
weekly
1213
8–2.36
(SE0.19
)–1.67
(SE0.2)
––
––
AS
Placeb
o–
1213
9–0.45
(SE0.18
)–0.33
(SE0.21
)–
––
–
AS
Etan
ercept
25mgtw
ice
weekly
2413
8–
––
––
–
AS
Placeb
o–
2413
9–
––
––
–
Dou
gado
s20
1174
AS
Etan
ercept
50mgweekly
1239
–2.6(SD2)
–2.2
(SD1.8)
–0.57
(SD0.65
)–
––
AS
Placeb
o–
1243
–1.4(SD2)
–1(SD1.8)
–0.2
(SD0.65
)–
––
Dou
gado
s20
1476
AS
Etan
ercept
50mgweekly
1210
6–2(SE0.3)
–1.4
(SE0.2)
–0.3
(SE0.2)
––
–
AS
Placeb
o–
1210
9–1.3
(SE0.3)
–0.8
(SE0.2)
–0.3
(SE0.1)
––
–
Nr-axSp
AEtan
ercept
50mgweekly
1294
––
––
––
Nr-axSp
APlaceb
o–
1295
––
––
––
continued
DOI: 10.3310/hta20090 HEALTH TECHNOLOGY ASSESSMENT 2016 VOL. 20 NO. 9
© Queen’s Printer and Controller of HMSO 2016. This work was produced by Corbett et al. under the terms of a commissioning contract issued by the Secretary of State forHealth. This issue may be freely reproduced for the purposes of private research and study and extracts (or indeed, the full report) may be included in professional journalsprovided that suitable acknowledgement is made and the reproduction is not associated with any form of advertising. Applications for commercial reproduction should beaddressed to: NIHR Journals Library, National Institute for Health Research, Evaluation, Trials and Studies Coordinating Centre, Alpha House, University of Southampton SciencePark, Southampton SO16 7NS, UK.
219
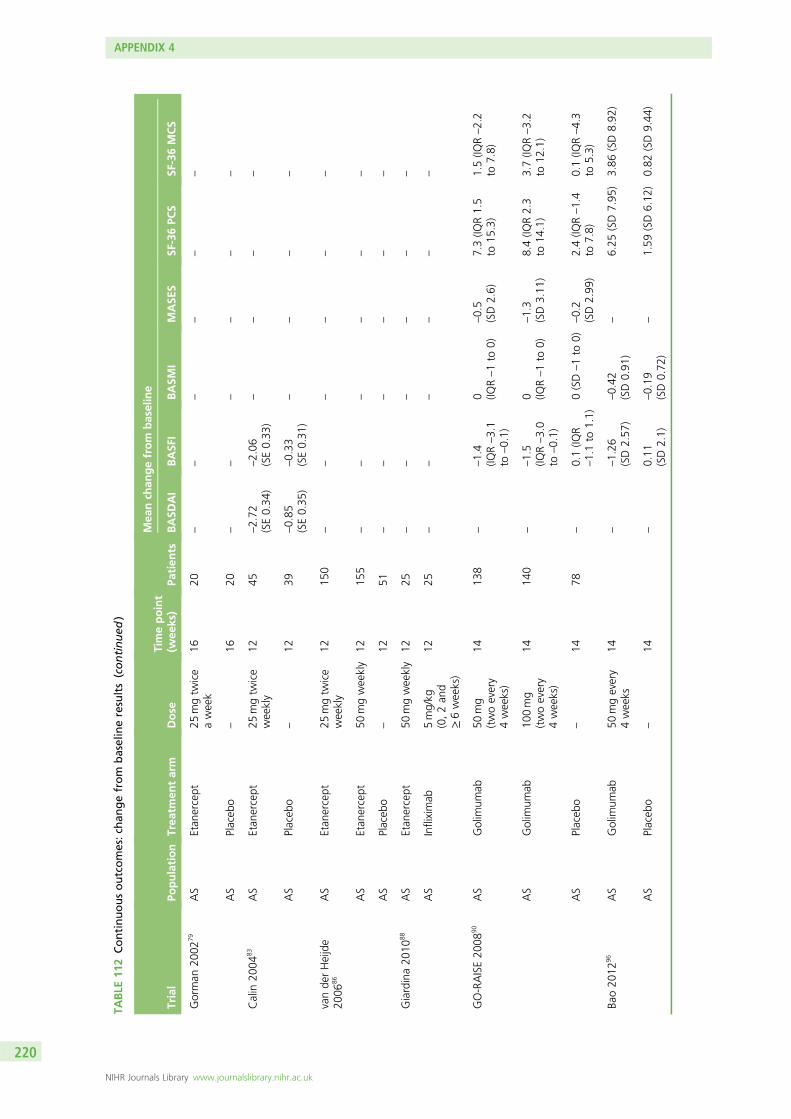
TABLE
112
Continuousoutcomes:ch
angefrom
baselineresults(continued
)
Trial
Population
Trea
tmen
tarm
Dose
Timepoint
(wee
ks)
Patien
ts
Mea
nch
angefrom
baseline
BASD
AI
BASF
IBASM
IMASE
SSF
-36PC
SSF
-36MCS
Gorman
2002
79AS
Etan
ercept
25mgtw
ice
aweek
1620
––
––
––
AS
Placeb
o–
1620
––
––
––
Calin
2004
83AS
Etan
ercept
25mgtw
ice
weekly
1245
–2.72
(SE0.34
)–2.06
(SE0.33
)–
––
–
AS
Placeb
o–
1239
–0.85
(SE0.35
)–0.33
(SE0.31
)–
––
–
vande
rHeijde
2006
86AS
Etan
ercept
25mgtw
ice
weekly
1215
0–
––
––
–
AS
Etan
ercept
50mgweekly
1215
5–
––
––
–
AS
Placeb
o–
1251
––
––
––
Giardina20
1088
AS
Etan
ercept
50mgweekly
1225
––
––
––
AS
Infliximab
5mg/kg
(0,2an
d≥6weeks)
1225
––
––
––
GO-RAISE20
0890
AS
Golim
umab
50mg
(twoevery
4weeks)
1413
8–
–1.4
(IQR–3.1
to–0.1)
0 (IQR–1to
0)–0.5
(SD2.6)
7.3(IQ
R1.5
to15
.3)
1.5(IQ
R–2.2
to7.8)
AS
Golim
umab
100mg
(twoevery
4weeks)
1414
0–
–1.5
(IQR–3.0
to–0.1)
0 (IQR–1to
0)–1.3
(SD3.11
)8.4(IQ
R2.3
to14
.1)
3.7(IQ
R–3.2
to12
.1)
AS
Placeb
o–
1478
–0.1(IQ
R–1.1to
1.1)
0(SD–1to
0)–0.2
(SD2.99
)2.4(IQ
R–1.4
to7.8)
0.1(IQ
R–4.3
to5.3)
Bao20
1296
AS
Golim
umab
50mgevery
4weeks
14–
–1.26
(SD2.57
)–0.42
(SD0.91
)–
6.25
(SD7.95
)3.86
(SD8.92
)
AS
Placeb
o–
14–
0.11
(SD2.1)
–0.19
(SD0.72
)–
1.59
(SD6.12
)0.82
(SD9.44
)
APPENDIX 4
NIHR Journals Library www.journalslibrary.nihr.ac.uk
220
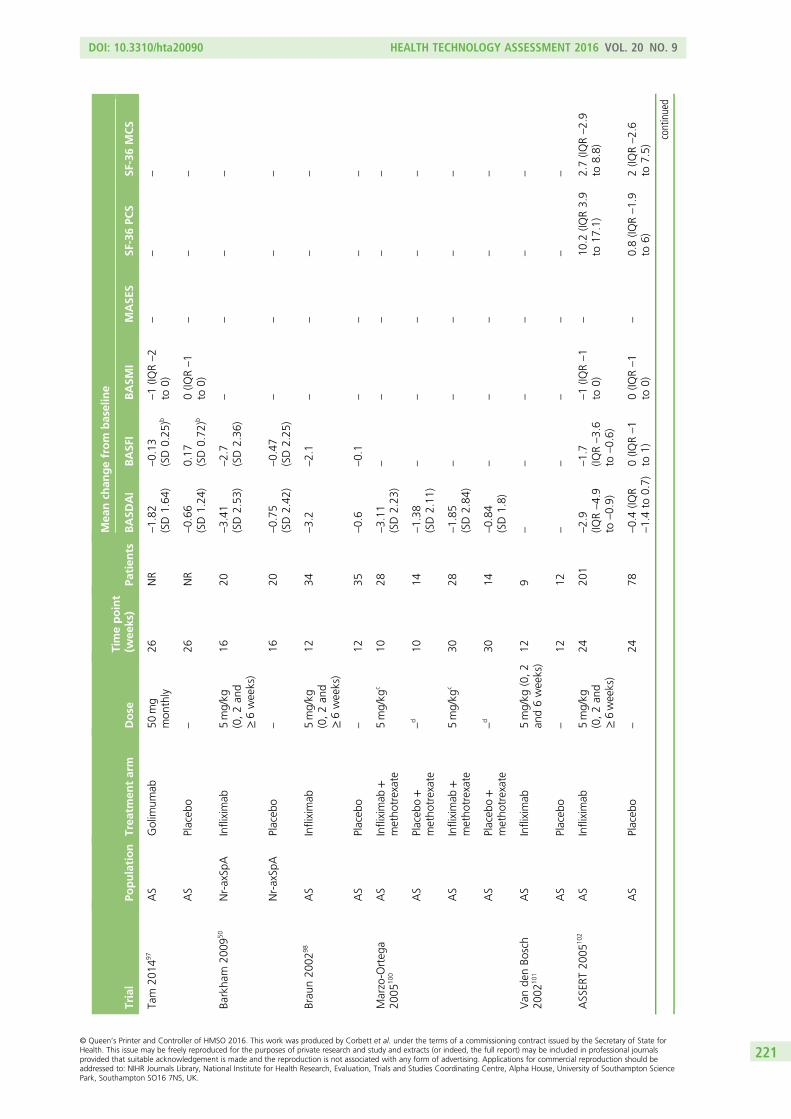
Trial
Population
Trea
tmen
tarm
Dose
Timepoint
(wee
ks)
Patien
ts
Mea
nch
angefrom
baseline
BASD
AI
BASF
IBASM
IMASE
SSF
-36PC
SSF
-36MCS
Tam
2014
97AS
Golim
umab
50mg
mon
thly
26NR
–1.82
(SD1.64
)–0.13
(SD0.25
)b–1(IQ
R–2
to0)
––
–
AS
Placeb
o–
26NR
–0.66
(SD1.24
)0.17
(SD0.72
)b0(IQ
R–1
to0)
––
–
Barkha
m20
0950
Nr-axSp
AInfliximab
5mg/kg
(0,2an
d≥6weeks)
1620
–3.41
(SD2.53
)–2.7
(SD2.36
)–
––
–
Nr-axSp
APlaceb
o–
1620
–0.75
(SD2.42
)–0.47
(SD2.25
)–
––
–
Brau
n20
0298
AS
Infliximab
5mg/kg
(0,2an
d≥6weeks)
1234
–3.2
–2.1
––
––
AS
Placeb
o–
1235
–0.6
–0.1
––
––
Marzo-O
rteg
a20
0510
0AS
Infliximab
+metho
trexate
5mg/kg
c10
28–3.11
(SD2.23
)–
––
––
AS
Placeb
o+
metho
trexate
–d
1014
–1.38
(SD2.11
)–
––
––
AS
Infliximab
+metho
trexate
5mg/kg
c30
28–1.85
(SD2.84
)–
––
––
AS
Placeb
o+
metho
trexate
–d
3014
–0.84
(SD1.8)
––
––
–
Van
denBo
sch
2002
101
AS
Infliximab
5mg/kg
(0,2
and6weeks)
129
––
––
––
AS
Placeb
o–
1212
––
––
––
ASSER
T20
0510
2AS
Infliximab
5mg/kg
(0,2an
d≥6weeks)
2420
1–2.9
(IQR–4.9
to–0.9)
–1.7
(IQR–3.6
to–0.6)
–1(IQ
R–1
to0)
–10
.2(IQ
R3.9
to17
.1)
2.7(IQ
R–2.9
to8.8)
AS
Placeb
o–
2478
–0.4(IQ
R–1.4to
0.7)
0(IQ
R–1
to1)
0(IQ
R–1
to0)
–0.8(IQ
R–1.9
to6)
2(IQ
R–2.6
to7.5)
continued
DOI: 10.3310/hta20090 HEALTH TECHNOLOGY ASSESSMENT 2016 VOL. 20 NO. 9
© Queen’s Printer and Controller of HMSO 2016. This work was produced by Corbett et al. under the terms of a commissioning contract issued by the Secretary of State forHealth. This issue may be freely reproduced for the purposes of private research and study and extracts (or indeed, the full report) may be included in professional journalsprovided that suitable acknowledgement is made and the reproduction is not associated with any form of advertising. Applications for commercial reproduction should beaddressed to: NIHR Journals Library, National Institute for Health Research, Evaluation, Trials and Studies Coordinating Centre, Alpha House, University of Southampton SciencePark, Southampton SO16 7NS, UK.
221
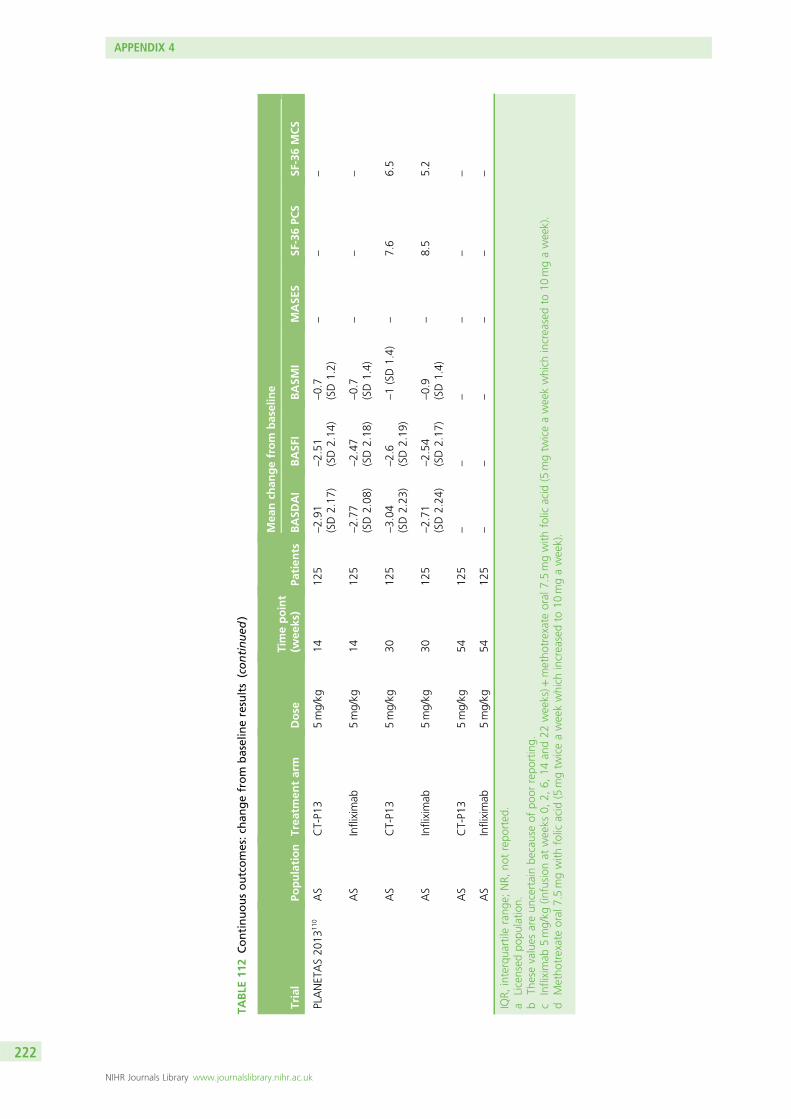
TABLE
112
Continuousoutcomes:ch
angefrom
baselineresults(continued
)
Trial
Population
Trea
tmen
tarm
Dose
Timepoint
(wee
ks)
Patien
ts
Mea
nch
angefrom
baseline
BASD
AI
BASF
IBASM
IMASE
SSF
-36PC
SSF
-36MCS
PLANETAS20
1311
0AS
CT-P1
35mg/kg
1412
5–2.91
(SD2.17
)–2.51
(SD2.14
)–0.7
(SD1.2)
––
–
AS
Infliximab
5mg/kg
1412
5–2.77
(SD2.08
)–2.47
(SD2.18
)–0.7
(SD1.4)
––
–
AS
CT-P1
35mg/kg
3012
5–3.04
(SD2.23
)–2.6
(SD2.19
)–1(SD1.4)
–7.6
6.5
AS
Infliximab
5mg/kg
3012
5–2.71
(SD2.24
)–2.54
(SD2.17
)–0.9
(SD1.4)
–8.5
5.2
AS
CT-P1
35mg/kg
5412
5–
––
––
–
AS
Infliximab
5mg/kg
5412
5–
––
––
–
IQR,
interqua
rtile
rang
e;NR,
notrepo
rted
.a
Licensed
popu
latio
n.b
Thesevalues
areun
certainbe
causeof
poor
repo
rting.
cInfliximab
5mg/kg
(infusion
atweeks
0,2,
6,14
and22
weeks)+
metho
trexateoral
7.5mgwith
folic
acid
(5mgtw
iceaweekwhich
increasedto
10mgaweek).
dMetho
trexateoral
7.5mgwith
folic
acid
(5mgtw
iceaweekwhich
increasedto
10mgaweek).
APPENDIX 4
NIHR Journals Library www.journalslibrary.nihr.ac.uk
222
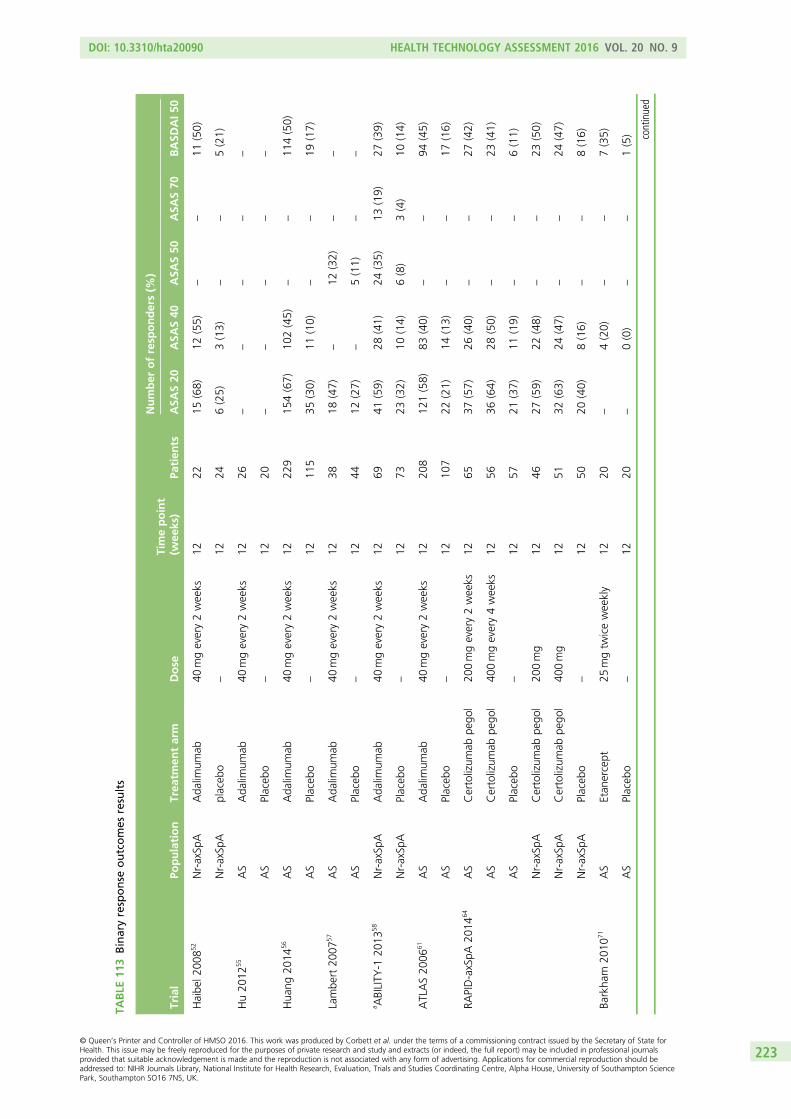
TABLE
113
Binaryresponse
outcomes
results
Trial
Population
Trea
tmen
tarm
Dose
Timepoint
(wee
ks)
Patien
ts
Number
ofresp
onders(%
)
ASA
S20
ASA
S40
ASA
S50
ASA
S70
BASD
AI5
0
Haibe
l200
852
Nr-axSp
AAda
limum
ab40
mgevery2weeks
1222
15(68)
12(55)
––
11(50)
Nr-axSp
Aplaceb
o–
1224
6(25)
3(13)
––
5(21)
Hu20
1255
AS
Ada
limum
ab40
mgevery2weeks
1226
––
––
–
AS
Placeb
o–
1220
––
––
–
Hua
ng20
1456
AS
Ada
limum
ab40
mgevery2weeks
1222
915
4(67)
102(45)
––
114(50)
AS
Placeb
o–
1211
535
(30)
11(10)
––
19(17)
Lambe
rt20
0757
AS
Ada
limum
ab40
mgevery2weeks
1238
18(47)
–12
(32)
––
AS
Placeb
o–
1244
12(27)
–5(11)
––
a ABILITY
-120
1358
Nr-axSp
AAda
limum
ab40
mgevery2weeks
1269
41(59)
28(41)
24(35)
13(19)
27(39)
Nr-axSp
APlaceb
o–
1273
23(32)
10(14)
6(8)
3(4)
10(14)
ATLAS20
0661
AS
Ada
limum
ab40
mgevery2weeks
1220
812
1(58)
83(40)
––
94(45)
AS
Placeb
o–
1210
722
(21)
14(13)
––
17(16)
RAPID-axSpA
2014
64AS
Certolizum
abpe
gol
200mgevery2weeks
1265
37(57)
26(40)
––
27(42)
AS
Certolizum
abpe
gol
400mgevery4weeks
1256
36(64)
28(50)
––
23(41)
AS
Placeb
o–
1257
21(37)
11(19)
––
6(11)
Nr-axSp
ACertolizum
abpe
gol
200mg
1246
27(59)
22(48)
––
23(50)
Nr-axSp
ACertolizum
abpe
gol
400mg
1251
32(63)
24(47)
––
24(47)
Nr-axSp
APlaceb
o–
1250
20(40)
8(16)
––
8(16)
Barkha
m20
1071
AS
Etan
ercept
25mgtw
iceweekly
1220
–4(20)
––
7(35)
AS
Placeb
o–
1220
–0(0)
––
1(5) continued
DOI: 10.3310/hta20090 HEALTH TECHNOLOGY ASSESSMENT 2016 VOL. 20 NO. 9
© Queen’s Printer and Controller of HMSO 2016. This work was produced by Corbett et al. under the terms of a commissioning contract issued by the Secretary of State forHealth. This issue may be freely reproduced for the purposes of private research and study and extracts (or indeed, the full report) may be included in professional journalsprovided that suitable acknowledgement is made and the reproduction is not associated with any form of advertising. Applications for commercial reproduction should beaddressed to: NIHR Journals Library, National Institute for Health Research, Evaluation, Trials and Studies Coordinating Centre, Alpha House, University of Southampton SciencePark, Southampton SO16 7NS, UK.
223
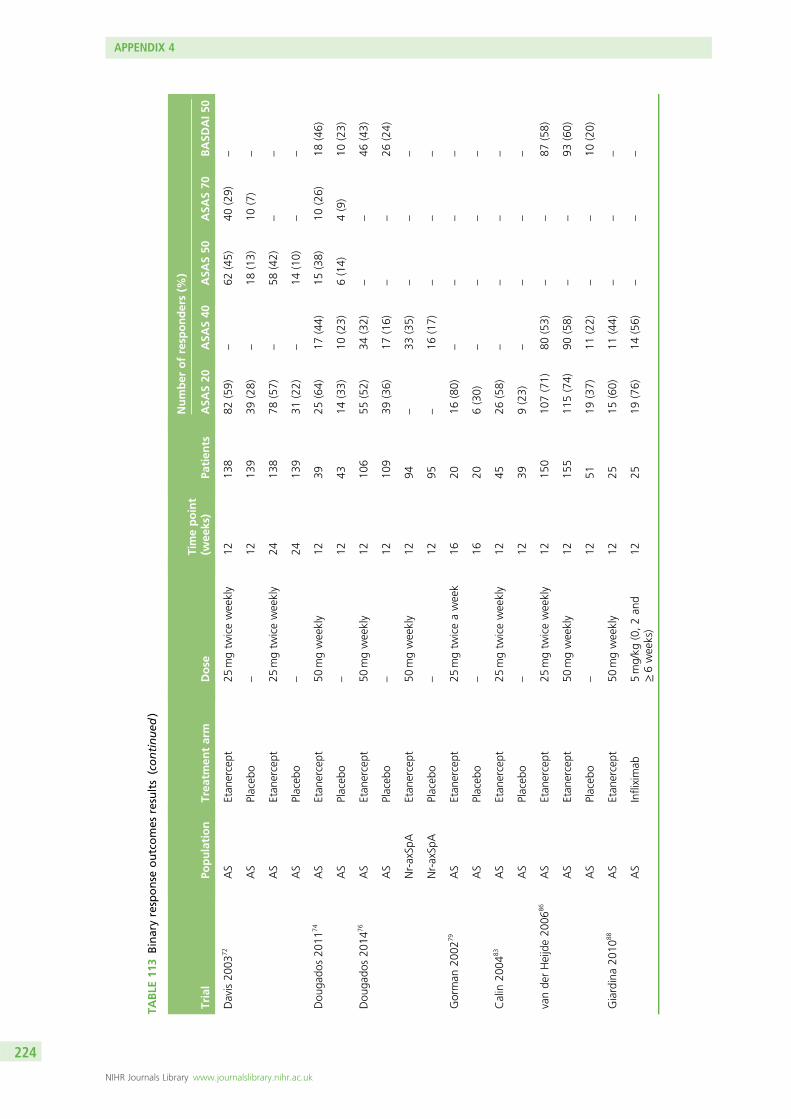
TABLE
113
Binaryresponse
outcomes
results(continued
)
Trial
Population
Trea
tmen
tarm
Dose
Timepoint
(wee
ks)
Patien
ts
Number
ofresp
onders(%
)
ASA
S20
ASA
S40
ASA
S50
ASA
S70
BASD
AI5
0
Davis20
0372
AS
Etan
ercept
25mgtw
iceweekly
1213
882
(59)
–62
(45)
40(29)
–
AS
Placeb
o–
1213
939
(28)
–18
(13)
10(7)
–
AS
Etan
ercept
25mgtw
iceweekly
2413
878
(57)
–58
(42)
––
AS
Placeb
o–
2413
931
(22)
–14
(10)
––
Dou
gado
s20
1174
AS
Etan
ercept
50mgweekly
1239
25(64)
17(44)
15(38)
10(26)
18(46)
AS
Placeb
o–
1243
14(33)
10(23)
6(14)
4(9)
10(23)
Dou
gado
s20
1476
AS
Etan
ercept
50mgweekly
1210
655
(52)
34(32)
––
46(43)
AS
Placeb
o–
1210
939
(36)
17(16)
––
26(24)
Nr-axSp
AEtan
ercept
50mgweekly
1294
–33
(35)
––
–
Nr-axSp
APlaceb
o–
1295
–16
(17)
––
–
Gorman
2002
79AS
Etan
ercept
25mgtw
iceaweek
1620
16(80)
––
––
AS
Placeb
o–
1620
6(30)
––
––
Calin
2004
83AS
Etan
ercept
25mgtw
iceweekly
1245
26(58)
––
––
AS
Placeb
o–
1239
9(23)
––
––
vande
rHeijde20
0686
AS
Etan
ercept
25mgtw
iceweekly
1215
010
7(71)
80(53)
––
87(58)
AS
Etan
ercept
50mgweekly
1215
511
5(74)
90(58)
––
93(60)
AS
Placeb
o–
1251
19(37)
11(22)
––
10(20)
Giardina20
1088
AS
Etan
ercept
50mgweekly
1225
15(60)
11(44)
––
–
AS
Infliximab
5mg/kg
(0,2an
d≥6weeks)
1225
19(76)
14(56)
––
–
APPENDIX 4
NIHR Journals Library www.journalslibrary.nihr.ac.uk
224
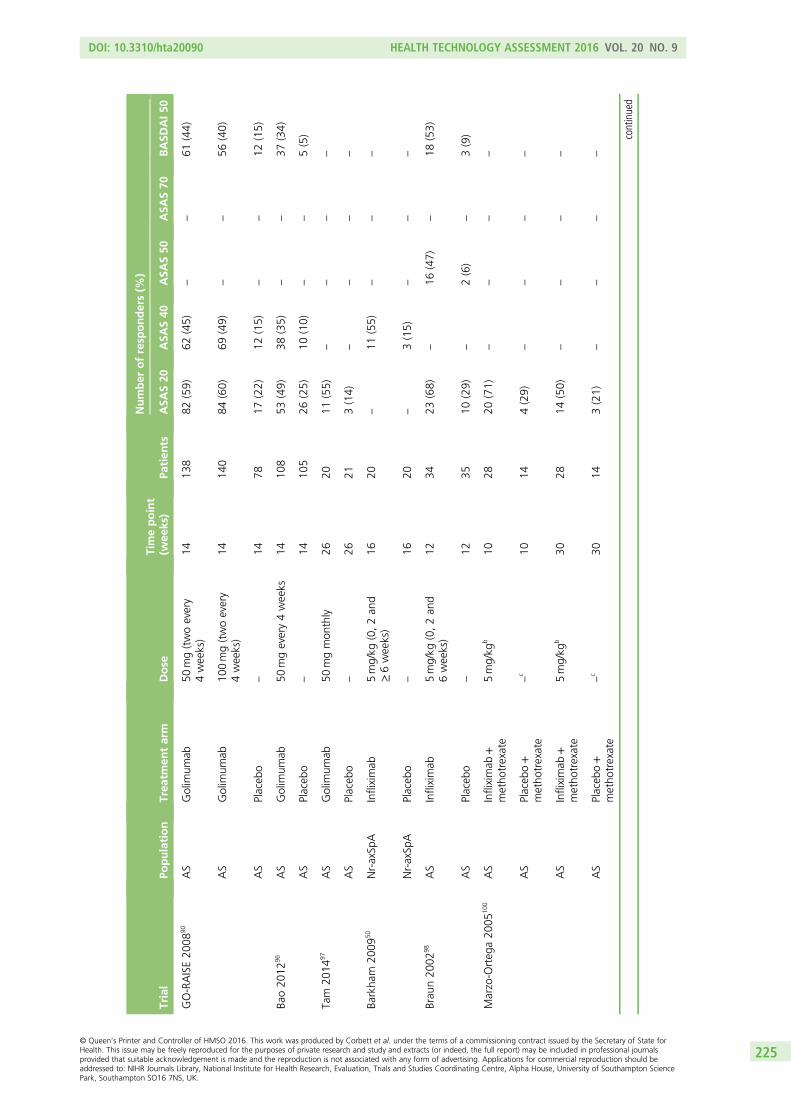
Trial
Population
Trea
tmen
tarm
Dose
Timepoint
(wee
ks)
Patien
ts
Number
ofresp
onders(%
)
ASA
S20
ASA
S40
ASA
S50
ASA
S70
BASD
AI5
0
GO-RAISE20
0890
AS
Golim
umab
50mg(twoevery
4weeks)
1413
882
(59)
62(45)
––
61(44)
AS
Golim
umab
100mg(twoevery
4weeks)
1414
084
(60)
69(49)
––
56(40)
AS
Placeb
o–
1478
17(22)
12(15)
––
12(15)
Bao20
1296
AS
Golim
umab
50mgevery4weeks
1410
853
(49)
38(35)
––
37(34)
AS
Placeb
o–
1410
526
(25)
10(10)
––
5(5)
Tam
2014
97AS
Golim
umab
50mgmon
thly
2620
11(55)
––
––
AS
Placeb
o–
2621
3(14)
––
––
Barkha
m20
0950
Nr-axSp
AInfliximab
5mg/kg
(0,2an
d≥6weeks)
1620
–11
(55)
––
–
Nr-axSp
APlaceb
o–
1620
–3(15)
––
–
Brau
n20
0298
AS
Infliximab
5mg/kg
(0,2an
d6weeks)
1234
23(68)
–16
(47)
–18
(53)
AS
Placeb
o–
1235
10(29)
–2(6)
–3(9)
Marzo-O
rteg
a20
0510
0AS
Infliximab
+metho
trexate
5mg/kg
b10
2820
(71)
––
––
AS
Placeb
o+
metho
trexate
–c
1014
4(29)
––
––
AS
Infliximab
+metho
trexate
5mg/kg
b30
2814
(50)
––
––
AS
Placeb
o+
metho
trexate
–c
3014
3(21)
––
––
continued
DOI: 10.3310/hta20090 HEALTH TECHNOLOGY ASSESSMENT 2016 VOL. 20 NO. 9
© Queen’s Printer and Controller of HMSO 2016. This work was produced by Corbett et al. under the terms of a commissioning contract issued by the Secretary of State forHealth. This issue may be freely reproduced for the purposes of private research and study and extracts (or indeed, the full report) may be included in professional journalsprovided that suitable acknowledgement is made and the reproduction is not associated with any form of advertising. Applications for commercial reproduction should beaddressed to: NIHR Journals Library, National Institute for Health Research, Evaluation, Trials and Studies Coordinating Centre, Alpha House, University of Southampton SciencePark, Southampton SO16 7NS, UK.
225
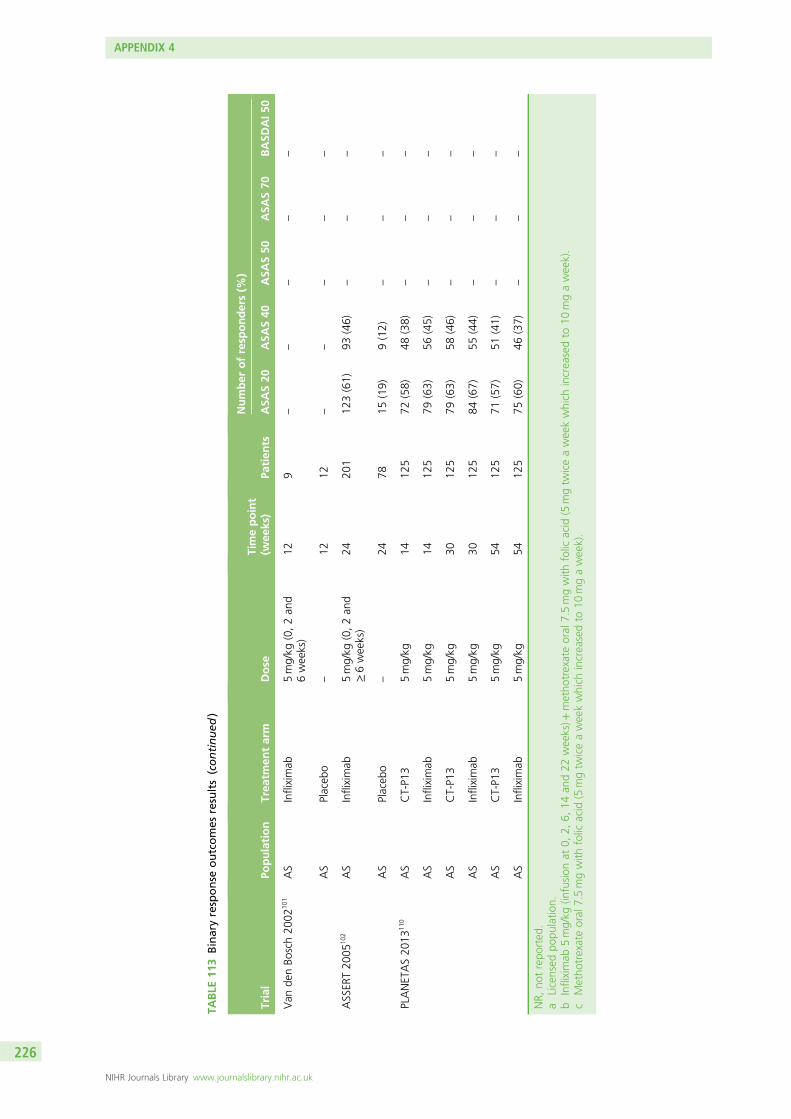
TABLE
113
Binaryresponse
outcomes
results(continued
)
Trial
Population
Trea
tmen
tarm
Dose
Timepoint
(wee
ks)
Patien
ts
Number
ofresp
onders(%
)
ASA
S20
ASA
S40
ASA
S50
ASA
S70
BASD
AI5
0
Van
denBo
sch20
0210
1AS
Infliximab
5mg/kg
(0,2an
d6weeks)
129
––
––
–
AS
Placeb
o–
1212
––
––
–
ASSER
T20
0510
2AS
Infliximab
5mg/kg
(0,2an
d≥6weeks)
2420
112
3(61)
93(46)
––
–
AS
Placeb
o–
2478
15(19)
9(12)
––
–
PLANETAS20
1311
0AS
CT-P1
35mg/kg
1412
572
(58)
48(38)
––
–
AS
Infliximab
5mg/kg
1412
579
(63)
56(45)
––
–
AS
CT-P1
35mg/kg
3012
579
(63)
58(46)
––
–
AS
Infliximab
5mg/kg
3012
584
(67)
55(44)
––
–
AS
CT-P1
35mg/kg
5412
571
(57)
51(41)
––
–
AS
Infliximab
5mg/kg
5412
575
(60)
46(37)
––
–
NR,
notrepo
rted
.a
Licensed
popu
latio
n.b
Infliximab
5mg/kg
(infusion
at0,
2,6,
14an
d22
weeks)+
metho
trexateoral
7.5mgwith
folic
acid
(5mgtw
iceaweekwhich
increasedto
10mgaweek).
cMetho
trexateoral
7.5mgwith
folic
acid
(5mgtw
iceaweekwhich
increasedto
10mgaweek).
APPENDIX 4
NIHR Journals Library www.journalslibrary.nihr.ac.uk
226
Appendix 5 Bath Ankylosing Spondylitis DiseaseActivity Index and Bath Ankylosing SpondylitisFunctional Index scores conditional on BathAnkylosing Spondylitis Disease ActivityIndex response
In this appendix we use the results from the extended synthesis model (Appendices 12 and 13) toevaluate the conditional scores by simulating BASDAI and BASFI scores for two equivalent cohorts of
patients one treated with an anti-TNF and the other with conventional therapy.
Description of methods
From the inferences obtained using the synthesis model in Appendix 13 it is possible to derive theconditional change score in responders and non-responders using simulation. Whereas the synthesisfocuses on the pooling of mean estimates of change scores and proportion of responders to BASDAI 50,to derive conditional mean scores there is the need to consider the distributions at the individual patientlevel. Hence, conditional scores could not directly be derived from the synthesis but instead were derivedthrough a simulation procedure based on the assumptions and results of the synthesis model.
The steps undertaken within the simulation procedure were:
1. Simulate baseline BASDAI scores, xBASDAI*, from beliefs over its distribution, X∼N(ν, σ)2. Simulate y∗k=1 from beliefs over the mean (µ) of this quantity considering correlation with xBASDAI*:
Yk=1jX=x∼N(µ + ρ (x−µÞ, (1−ρ 2pla )σ
2). (9)
3. Simulate y∗k=2 (where k= 2 represents treatment with anti-TNF) by considering:
Yk≠1jX=x∼N (µ + d + ρ (x−µ), (1−ρ 2anti−TNF )σ
2). (10)
4. Calculate final score for placebo and treatment separately, by summing xBASDAI∗f inal = yBASDAI∗k + xBASDAI∗
5. Compute response variables for both groups as yBASDAI�k + x∗=2 < 0
Repeat steps 1 to 4 until the desired sample size is achieved, and calculate conditional scores based onresponse variable and change in scores.
To evaluate BASFI conditional on BASDAI scores one needs to firstly consider we have availableinformation on the BASFI scores at baseline: XBASFI∼N(νBASFI, (seBASFI)2), and also on correlation with BASDAIscores, φ (at individual level). By considering xBASDAI*, one can:
6. Simulate from the distribution of the baseline BASFI score conditional on the baseline BASDAI scorebeing x*:
xBASFI jxBASDAI=x∼N(νBASFI +
σBASFI
σBASDAI
φ(xBASDAI�−νBASDAI), (1−φ2)σ2BASFI). (11)
DOI: 10.3310/hta20090 HEALTH TECHNOLOGY ASSESSMENT 2016 VOL. 20 NO. 9
© Queen’s Printer and Controller of HMSO 2016. This work was produced by Corbett et al. under the terms of a commissioning contract issued by the Secretary of State forHealth. This issue may be freely reproduced for the purposes of private research and study and extracts (or indeed, the full report) may be included in professional journalsprovided that suitable acknowledgement is made and the reproduction is not associated with any form of advertising. Applications for commercial reproduction should beaddressed to: NIHR Journals Library, National Institute for Health Research, Evaluation, Trials and Studies Coordinating Centre, Alpha House, University of Southampton SciencePark, Southampton SO16 7NS, UK.
227
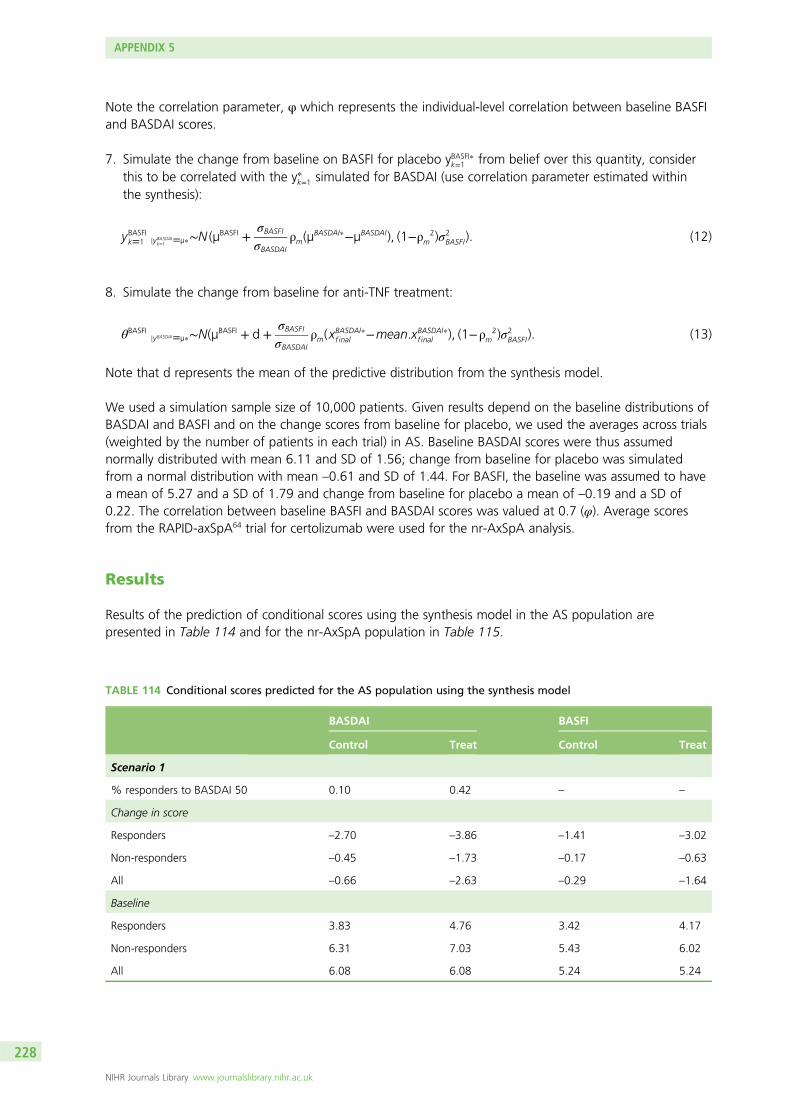
Note the correlation parameter, φ which represents the individual-level correlation between baseline BASFIand BASDAI scores.
7. Simulate the change from baseline on BASFI for placebo yBASFI�k=1 from belief over this quantity, considerthis to be correlated with the y∗k=1 simulated for BASDAI (use correlation parameter estimated withinthe synthesis):
yBASFIk=1 jyBASDAIk=1 =µ∗∼N (µBASFI +
σBASFI
σBASDAI
ρm(µBASDAI∗−µBASDAI), (1−ρ 2
m )σ2BASFI). (12)
8. Simulate the change from baseline for anti-TNF treatment:
θBASFIjyBASDAI=µ∗∼N(µBASFI + d +
σBASFI
σBASDAI
ρm(xBASDAI∗f inal −mean.xBASDAI∗f inal ), (1−ρ 2
m )σ2BASFI). (13)
Note that d represents the mean of the predictive distribution from the synthesis model.
We used a simulation sample size of 10,000 patients. Given results depend on the baseline distributions ofBASDAI and BASFI and on the change scores from baseline for placebo, we used the averages across trials(weighted by the number of patients in each trial) in AS. Baseline BASDAI scores were thus assumednormally distributed with mean 6.11 and SD of 1.56; change from baseline for placebo was simulatedfrom a normal distribution with mean –0.61 and SD of 1.44. For BASFI, the baseline was assumed to havea mean of 5.27 and a SD of 1.79 and change from baseline for placebo a mean of –0.19 and a SD of0.22. The correlation between baseline BASFI and BASDAI scores was valued at 0.7 (φ). Average scoresfrom the RAPID-axSpA64 trial for certolizumab were used for the nr-AxSpA analysis.
Results
Results of the prediction of conditional scores using the synthesis model in the AS population arepresented in Table 114 and for the nr-AxSpA population in Table 115.
TABLE 114 Conditional scores predicted for the AS population using the synthesis model
BASDAI BASFI
Control Treat Control Treat
Scenario 1
% responders to BASDAI 50 0.10 0.42 – –
Change in score
Responders –2.70 –3.86 –1.41 –3.02
Non-responders –0.45 –1.73 –0.17 –0.63
All –0.66 –2.63 –0.29 –1.64
Baseline
Responders 3.83 4.76 3.42 4.17
Non-responders 6.31 7.03 5.43 6.02
All 6.08 6.08 5.24 5.24
APPENDIX 5
NIHR Journals Library www.journalslibrary.nihr.ac.uk
228
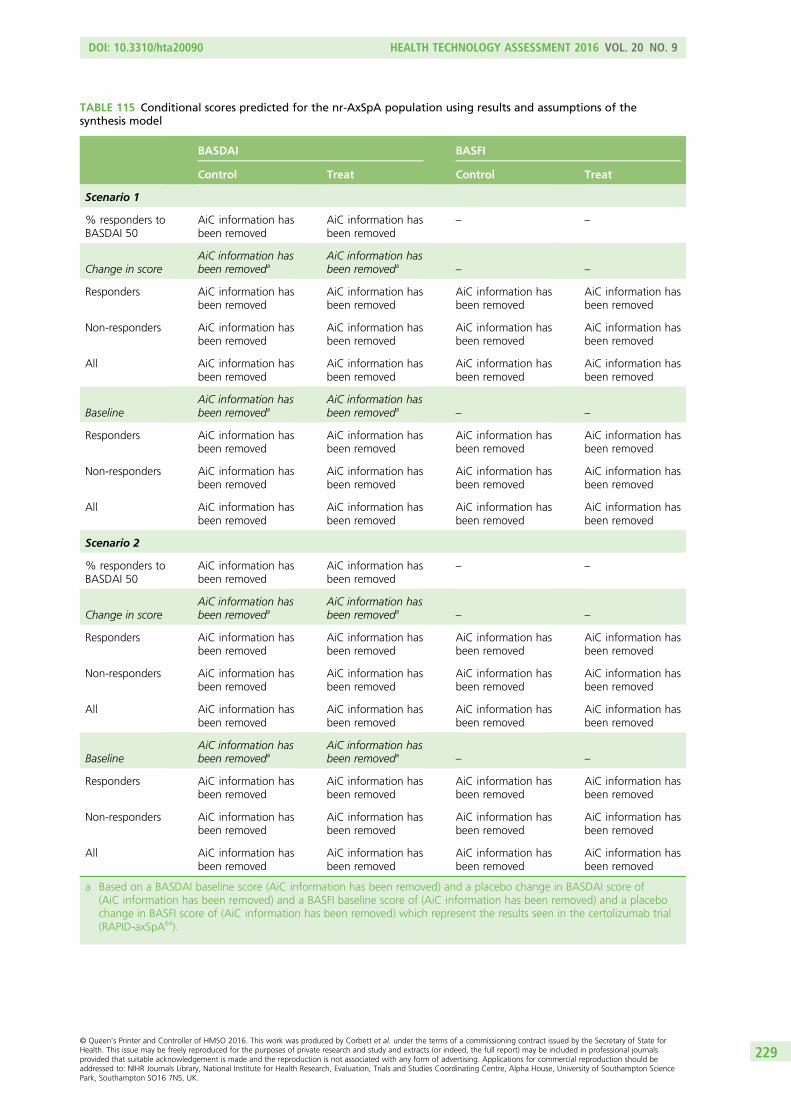
TABLE 115 Conditional scores predicted for the nr-AxSpA population using results and assumptions of thesynthesis model
BASDAI BASFI
Control Treat Control Treat
Scenario 1
% responders toBASDAI 50
AiC information hasbeen removed
AiC information hasbeen removed
– –
Change in scoreAiC information hasbeen removeda
AiC information hasbeen removeda
– –
Responders AiC information hasbeen removed
AiC information hasbeen removed
AiC information hasbeen removed
AiC information hasbeen removed
Non-responders AiC information hasbeen removed
AiC information hasbeen removed
AiC information hasbeen removed
AiC information hasbeen removed
All AiC information hasbeen removed
AiC information hasbeen removed
AiC information hasbeen removed
AiC information hasbeen removed
BaselineAiC information hasbeen removeda
AiC information hasbeen removeda
– –
Responders AiC information hasbeen removed
AiC information hasbeen removed
AiC information hasbeen removed
AiC information hasbeen removed
Non-responders AiC information hasbeen removed
AiC information hasbeen removed
AiC information hasbeen removed
AiC information hasbeen removed
All AiC information hasbeen removed
AiC information hasbeen removed
AiC information hasbeen removed
AiC information hasbeen removed
Scenario 2
% responders toBASDAI 50
AiC information hasbeen removed
AiC information hasbeen removed
– –
Change in scoreAiC information hasbeen removeda
AiC information hasbeen removeda
– –
Responders AiC information hasbeen removed
AiC information hasbeen removed
AiC information hasbeen removed
AiC information hasbeen removed
Non-responders AiC information hasbeen removed
AiC information hasbeen removed
AiC information hasbeen removed
AiC information hasbeen removed
All AiC information hasbeen removed
AiC information hasbeen removed
AiC information hasbeen removed
AiC information hasbeen removed
BaselineAiC information hasbeen removeda
AiC information hasbeen removeda
– –
Responders AiC information hasbeen removed
AiC information hasbeen removed
AiC information hasbeen removed
AiC information hasbeen removed
Non-responders AiC information hasbeen removed
AiC information hasbeen removed
AiC information hasbeen removed
AiC information hasbeen removed
All AiC information hasbeen removed
AiC information hasbeen removed
AiC information hasbeen removed
AiC information hasbeen removed
a Based on a BASDAI baseline score (AiC information has been removed) and a placebo change in BASDAI score of(AiC information has been removed) and a BASFI baseline score of (AiC information has been removed) and a placebochange in BASFI score of (AiC information has been removed) which represent the results seen in the certolizumab trial(RAPID-axSpA64).
DOI: 10.3310/hta20090 HEALTH TECHNOLOGY ASSESSMENT 2016 VOL. 20 NO. 9
© Queen’s Printer and Controller of HMSO 2016. This work was produced by Corbett et al. under the terms of a commissioning contract issued by the Secretary of State forHealth. This issue may be freely reproduced for the purposes of private research and study and extracts (or indeed, the full report) may be included in professional journalsprovided that suitable acknowledgement is made and the reproduction is not associated with any form of advertising. Applications for commercial reproduction should beaddressed to: NIHR Journals Library, National Institute for Health Research, Evaluation, Trials and Studies Coordinating Centre, Alpha House, University of Southampton SciencePark, Southampton SO16 7NS, UK.
229

Appendix 6 Bath Ankylosing Spondylitis DiseaseActivity Index and Bath Ankylosing SpondylitisFunctional Index scores conditional on response data
TABLE 116 Baseline BASDAI score according to conditional on response at week 12 (or nearest time point)
Anti-TNFPopulation(trial)
Responsecriterion Treatment Response n Mean SD
Adalimumab AS(ATLAS61)
ASAS 20 Adalimumab40mg
Non-responder 83 6.23 1.929
Responder 121 6.27 1.542
Placebo Non-responder 82 6.29 1.712
Responder 22 6.64 1.468
ASAS 40 Adalimumab40mg
Non-responder 119 6.21 1.802
Responder 85 6.32 1.568
Placebo Non-responder 89 6.37 1.714
Responder 15 6.34 1.362
BASDAI 50 Adalimumab40mg
Non-responder 119 6.21 1.802
Responder 85 6.32 1.568
Placebo Non-responder 89 6.37 1.714
Responder 15 6.34 1.362
Golimumab AS(GO-RAISE90)
ASAS 20 Golimumab50mg
Non-responder 56 6.51 1.687
Responder 82 6.49 1.494
Placebo Non-responder 61 6.65 1.622
Responder 17 6.46 1.120
ASAS 40 Golimumab50 mg
Non-responder 76 6.54 1.680
Responder 62 6.45 1.433
Placebo Non-responder 66 6.65 1.579
Responder 12 6.41 1.194
BASDAI 50 Golimumab50 mg
Non-responder 72 6.69 1.523
Responder 61 6.25 1.638
Placebo Non-responder 66 6.63 1.581
Responder 12 6.51 1.194
continued
DOI: 10.3310/hta20090 HEALTH TECHNOLOGY ASSESSMENT 2016 VOL. 20 NO. 9
© Queen’s Printer and Controller of HMSO 2016. This work was produced by Corbett et al. under the terms of a commissioning contract issued by the Secretary of State forHealth. This issue may be freely reproduced for the purposes of private research and study and extracts (or indeed, the full report) may be included in professional journalsprovided that suitable acknowledgement is made and the reproduction is not associated with any form of advertising. Applications for commercial reproduction should beaddressed to: NIHR Journals Library, National Institute for Health Research, Evaluation, Trials and Studies Coordinating Centre, Alpha House, University of Southampton SciencePark, Southampton SO16 7NS, UK.
231
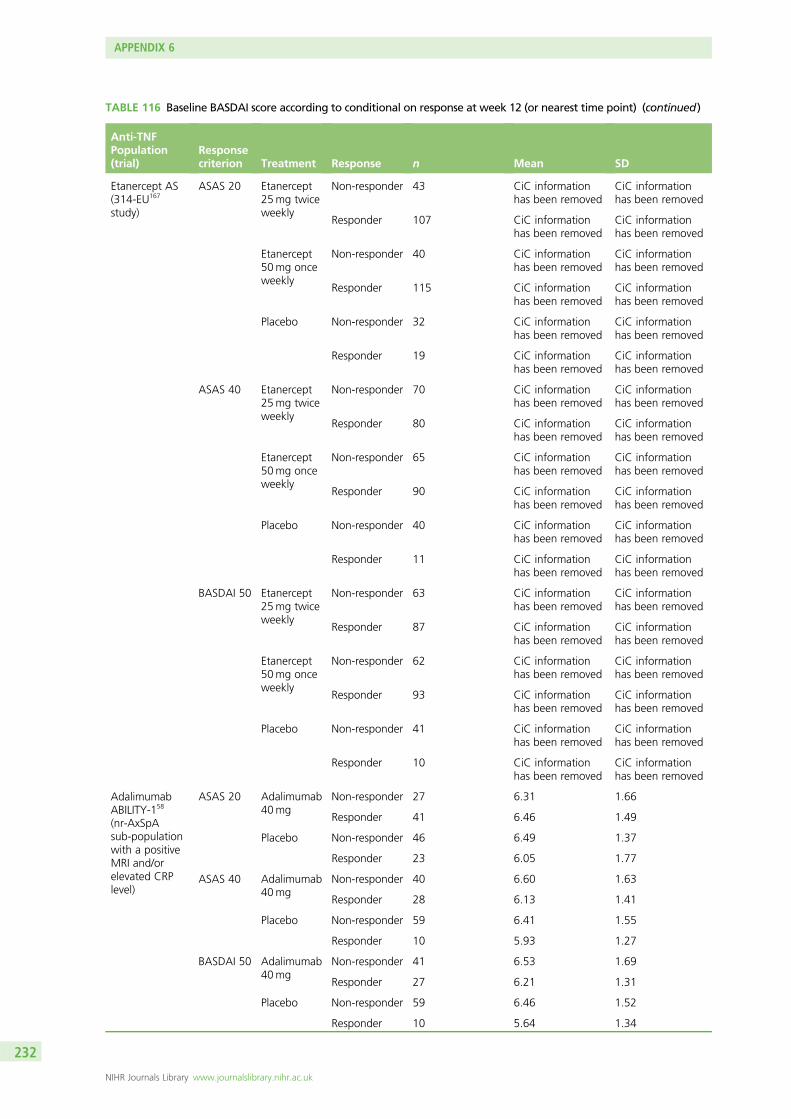
TABLE 116 Baseline BASDAI score according to conditional on response at week 12 (or nearest time point) (continued)
Anti-TNFPopulation(trial)
Responsecriterion Treatment Response n Mean SD
Etanercept AS(314-EU167
study)
ASAS 20 Etanercept25mg twiceweekly
Non-responder 43 CiC informationhas been removed
CiC informationhas been removed
Responder 107 CiC informationhas been removed
CiC informationhas been removed
Etanercept50mg onceweekly
Non-responder 40 CiC informationhas been removed
CiC informationhas been removed
Responder 115 CiC informationhas been removed
CiC informationhas been removed
Placebo Non-responder 32 CiC informationhas been removed
CiC informationhas been removed
Responder 19 CiC informationhas been removed
CiC informationhas been removed
ASAS 40 Etanercept25mg twiceweekly
Non-responder 70 CiC informationhas been removed
CiC informationhas been removed
Responder 80 CiC informationhas been removed
CiC informationhas been removed
Etanercept50mg onceweekly
Non-responder 65 CiC informationhas been removed
CiC informationhas been removed
Responder 90 CiC informationhas been removed
CiC informationhas been removed
Placebo Non-responder 40 CiC informationhas been removed
CiC informationhas been removed
Responder 11 CiC informationhas been removed
CiC informationhas been removed
BASDAI 50 Etanercept25mg twiceweekly
Non-responder 63 CiC informationhas been removed
CiC informationhas been removed
Responder 87 CiC informationhas been removed
CiC informationhas been removed
Etanercept50mg onceweekly
Non-responder 62 CiC informationhas been removed
CiC informationhas been removed
Responder 93 CiC informationhas been removed
CiC informationhas been removed
Placebo Non-responder 41 CiC informationhas been removed
CiC informationhas been removed
Responder 10 CiC informationhas been removed
CiC informationhas been removed
AdalimumabABILITY-158
(nr-AxSpAsub-populationwith a positiveMRI and/orelevated CRPlevel)
ASAS 20 Adalimumab40mg
Non-responder 27 6.31 1.66
Responder 41 6.46 1.49
Placebo Non-responder 46 6.49 1.37
Responder 23 6.05 1.77
ASAS 40 Adalimumab40mg
Non-responder 40 6.60 1.63
Responder 28 6.13 1.41
Placebo Non-responder 59 6.41 1.55
Responder 10 5.93 1.27
BASDAI 50 Adalimumab40mg
Non-responder 41 6.53 1.69
Responder 27 6.21 1.31
Placebo Non-responder 59 6.46 1.52
Responder 10 5.64 1.34
APPENDIX 6
NIHR Journals Library www.journalslibrary.nihr.ac.uk
232
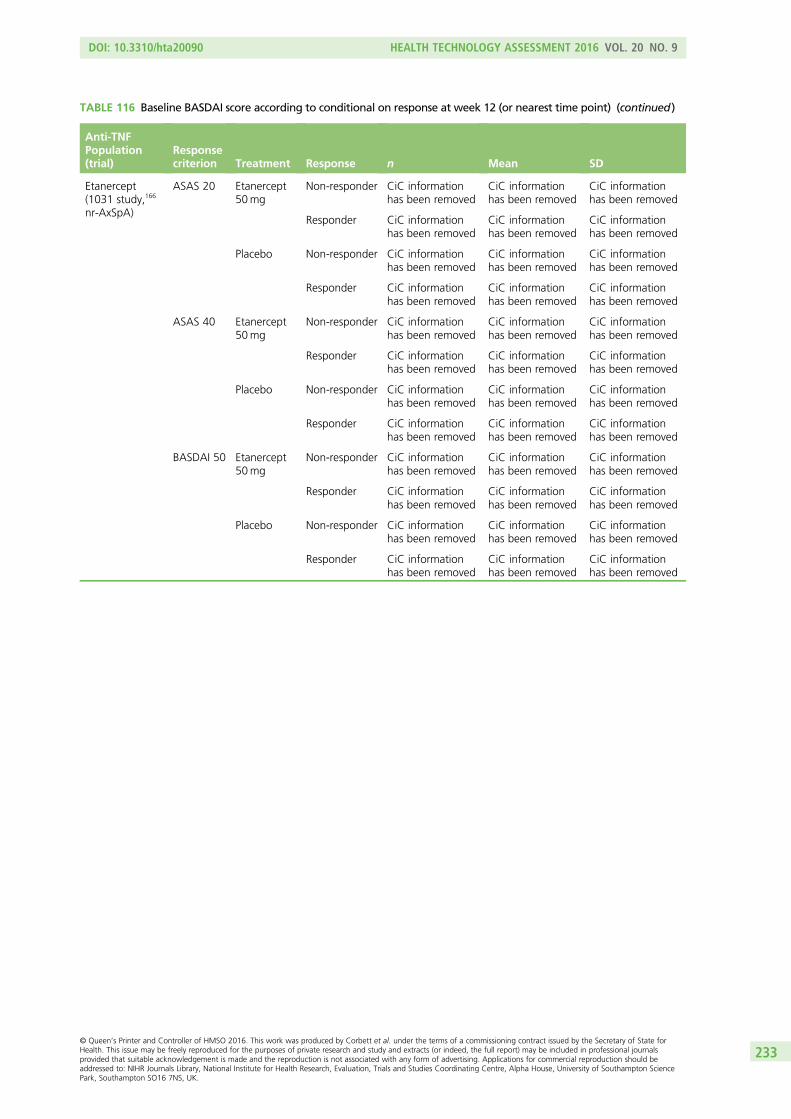
TABLE 116 Baseline BASDAI score according to conditional on response at week 12 (or nearest time point) (continued)
Anti-TNFPopulation(trial)
Responsecriterion Treatment Response n Mean SD
Etanercept(1031 study,166
nr-AxSpA)
ASAS 20 Etanercept50mg
Non-responder CiC informationhas been removed
CiC informationhas been removed
CiC informationhas been removed
Responder CiC informationhas been removed
CiC informationhas been removed
CiC informationhas been removed
Placebo Non-responder CiC informationhas been removed
CiC informationhas been removed
CiC informationhas been removed
Responder CiC informationhas been removed
CiC informationhas been removed
CiC informationhas been removed
ASAS 40 Etanercept50mg
Non-responder CiC informationhas been removed
CiC informationhas been removed
CiC informationhas been removed
Responder CiC informationhas been removed
CiC informationhas been removed
CiC informationhas been removed
Placebo Non-responder CiC informationhas been removed
CiC informationhas been removed
CiC informationhas been removed
Responder CiC informationhas been removed
CiC informationhas been removed
CiC informationhas been removed
BASDAI 50 Etanercept50mg
Non-responder CiC informationhas been removed
CiC informationhas been removed
CiC informationhas been removed
Responder CiC informationhas been removed
CiC informationhas been removed
CiC informationhas been removed
Placebo Non-responder CiC informationhas been removed
CiC informationhas been removed
CiC informationhas been removed
Responder CiC informationhas been removed
CiC informationhas been removed
CiC informationhas been removed
DOI: 10.3310/hta20090 HEALTH TECHNOLOGY ASSESSMENT 2016 VOL. 20 NO. 9
© Queen’s Printer and Controller of HMSO 2016. This work was produced by Corbett et al. under the terms of a commissioning contract issued by the Secretary of State forHealth. This issue may be freely reproduced for the purposes of private research and study and extracts (or indeed, the full report) may be included in professional journalsprovided that suitable acknowledgement is made and the reproduction is not associated with any form of advertising. Applications for commercial reproduction should beaddressed to: NIHR Journals Library, National Institute for Health Research, Evaluation, Trials and Studies Coordinating Centre, Alpha House, University of Southampton SciencePark, Southampton SO16 7NS, UK.
233
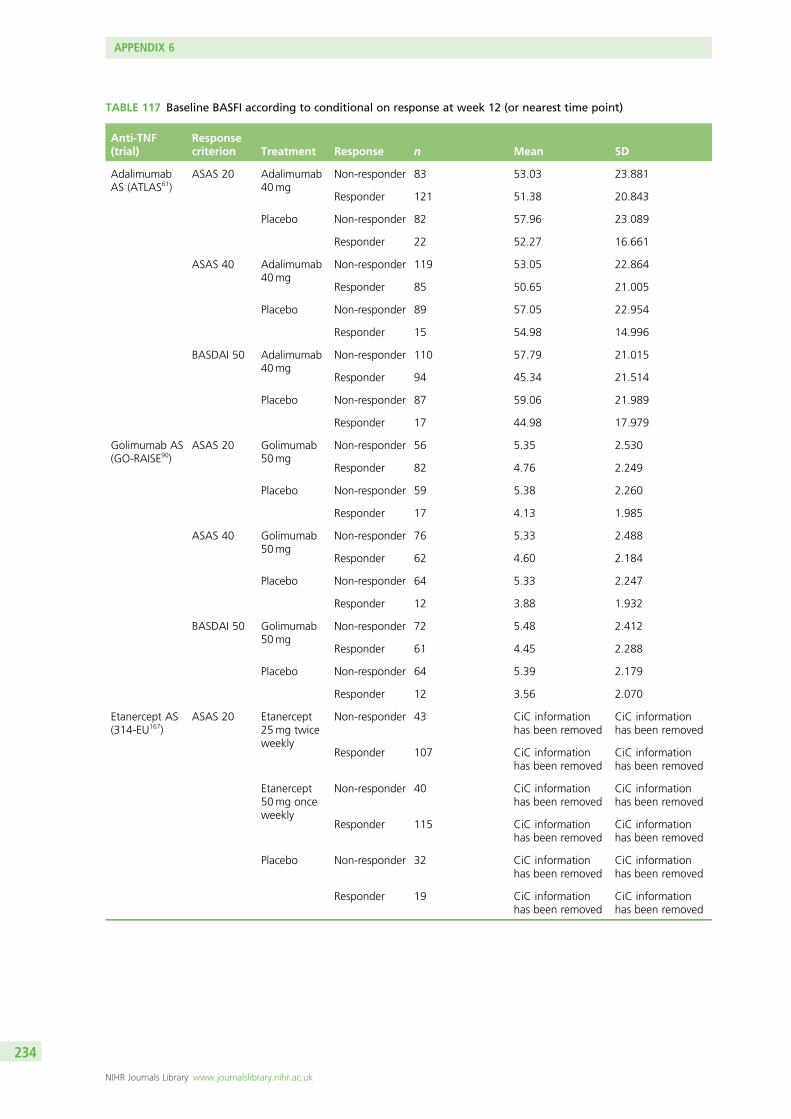
TABLE 117 Baseline BASFI according to conditional on response at week 12 (or nearest time point)
Anti-TNF(trial)
Responsecriterion Treatment Response n Mean SD
AdalimumabAS (ATLAS61)
ASAS 20 Adalimumab40mg
Non-responder 83 53.03 23.881
Responder 121 51.38 20.843
Placebo Non-responder 82 57.96 23.089
Responder 22 52.27 16.661
ASAS 40 Adalimumab40mg
Non-responder 119 53.05 22.864
Responder 85 50.65 21.005
Placebo Non-responder 89 57.05 22.954
Responder 15 54.98 14.996
BASDAI 50 Adalimumab40mg
Non-responder 110 57.79 21.015
Responder 94 45.34 21.514
Placebo Non-responder 87 59.06 21.989
Responder 17 44.98 17.979
Golimumab AS(GO-RAISE90)
ASAS 20 Golimumab50mg
Non-responder 56 5.35 2.530
Responder 82 4.76 2.249
Placebo Non-responder 59 5.38 2.260
Responder 17 4.13 1.985
ASAS 40 Golimumab50mg
Non-responder 76 5.33 2.488
Responder 62 4.60 2.184
Placebo Non-responder 64 5.33 2.247
Responder 12 3.88 1.932
BASDAI 50 Golimumab50mg
Non-responder 72 5.48 2.412
Responder 61 4.45 2.288
Placebo Non-responder 64 5.39 2.179
Responder 12 3.56 2.070
Etanercept AS(314-EU167)
ASAS 20 Etanercept25mg twiceweekly
Non-responder 43 CiC informationhas been removed
CiC informationhas been removed
Responder 107 CiC informationhas been removed
CiC informationhas been removed
Etanercept50mg onceweekly
Non-responder 40 CiC informationhas been removed
CiC informationhas been removed
Responder 115 CiC informationhas been removed
CiC informationhas been removed
Placebo Non-responder 32 CiC informationhas been removed
CiC informationhas been removed
Responder 19 CiC informationhas been removed
CiC informationhas been removed
APPENDIX 6
NIHR Journals Library www.journalslibrary.nihr.ac.uk
234
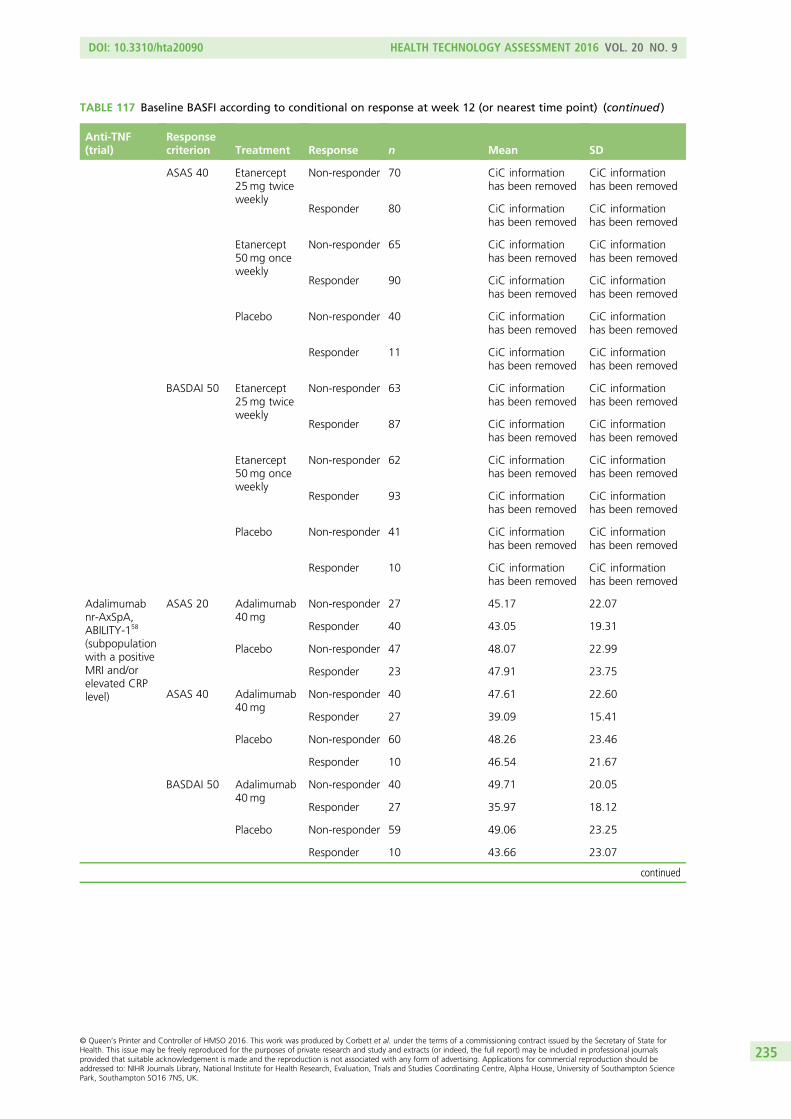
TABLE 117 Baseline BASFI according to conditional on response at week 12 (or nearest time point) (continued )
Anti-TNF(trial)
Responsecriterion Treatment Response n Mean SD
ASAS 40 Etanercept25mg twiceweekly
Non-responder 70 CiC informationhas been removed
CiC informationhas been removed
Responder 80 CiC informationhas been removed
CiC informationhas been removed
Etanercept50mg onceweekly
Non-responder 65 CiC informationhas been removed
CiC informationhas been removed
Responder 90 CiC informationhas been removed
CiC informationhas been removed
Placebo Non-responder 40 CiC informationhas been removed
CiC informationhas been removed
Responder 11 CiC informationhas been removed
CiC informationhas been removed
BASDAI 50 Etanercept25mg twiceweekly
Non-responder 63 CiC informationhas been removed
CiC informationhas been removed
Responder 87 CiC informationhas been removed
CiC informationhas been removed
Etanercept50mg onceweekly
Non-responder 62 CiC informationhas been removed
CiC informationhas been removed
Responder 93 CiC informationhas been removed
CiC informationhas been removed
Placebo Non-responder 41 CiC informationhas been removed
CiC informationhas been removed
Responder 10 CiC informationhas been removed
CiC informationhas been removed
Adalimumabnr-AxSpA,ABILITY-158
(subpopulationwith a positiveMRI and/orelevated CRPlevel)
ASAS 20 Adalimumab40mg
Non-responder 27 45.17 22.07
Responder 40 43.05 19.31
Placebo Non-responder 47 48.07 22.99
Responder 23 47.91 23.75
ASAS 40 Adalimumab40mg
Non-responder 40 47.61 22.60
Responder 27 39.09 15.41
Placebo Non-responder 60 48.26 23.46
Responder 10 46.54 21.67
BASDAI 50 Adalimumab40mg
Non-responder 40 49.71 20.05
Responder 27 35.97 18.12
Placebo Non-responder 59 49.06 23.25
Responder 10 43.66 23.07
continued
DOI: 10.3310/hta20090 HEALTH TECHNOLOGY ASSESSMENT 2016 VOL. 20 NO. 9
© Queen’s Printer and Controller of HMSO 2016. This work was produced by Corbett et al. under the terms of a commissioning contract issued by the Secretary of State forHealth. This issue may be freely reproduced for the purposes of private research and study and extracts (or indeed, the full report) may be included in professional journalsprovided that suitable acknowledgement is made and the reproduction is not associated with any form of advertising. Applications for commercial reproduction should beaddressed to: NIHR Journals Library, National Institute for Health Research, Evaluation, Trials and Studies Coordinating Centre, Alpha House, University of Southampton SciencePark, Southampton SO16 7NS, UK.
235
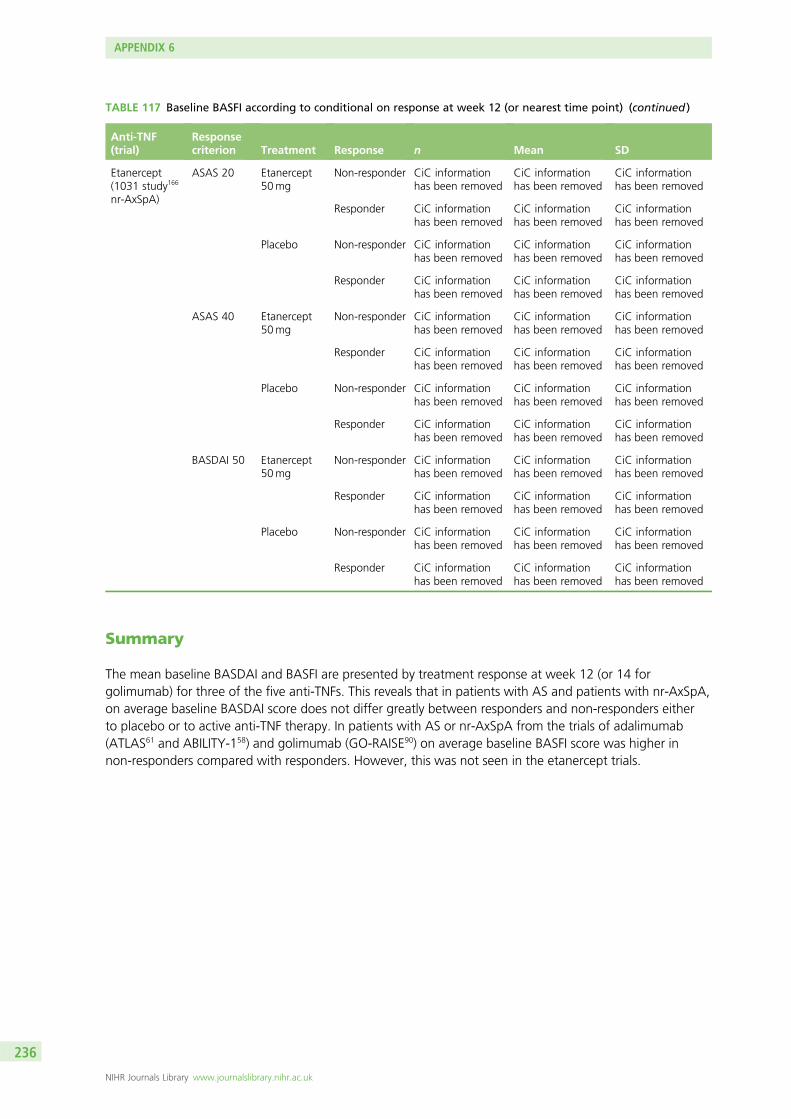
TABLE 117 Baseline BASFI according to conditional on response at week 12 (or nearest time point) (continued )
Anti-TNF(trial)
Responsecriterion Treatment Response n Mean SD
Etanercept(1031 study166
nr-AxSpA)
ASAS 20 Etanercept50mg
Non-responder CiC informationhas been removed
CiC informationhas been removed
CiC informationhas been removed
Responder CiC informationhas been removed
CiC informationhas been removed
CiC informationhas been removed
Placebo Non-responder CiC informationhas been removed
CiC informationhas been removed
CiC informationhas been removed
Responder CiC informationhas been removed
CiC informationhas been removed
CiC informationhas been removed
ASAS 40 Etanercept50mg
Non-responder CiC informationhas been removed
CiC informationhas been removed
CiC informationhas been removed
Responder CiC informationhas been removed
CiC informationhas been removed
CiC informationhas been removed
Placebo Non-responder CiC informationhas been removed
CiC informationhas been removed
CiC informationhas been removed
Responder CiC informationhas been removed
CiC informationhas been removed
CiC informationhas been removed
BASDAI 50 Etanercept50mg
Non-responder CiC informationhas been removed
CiC informationhas been removed
CiC informationhas been removed
Responder CiC informationhas been removed
CiC informationhas been removed
CiC informationhas been removed
Placebo Non-responder CiC informationhas been removed
CiC informationhas been removed
CiC informationhas been removed
Responder CiC informationhas been removed
CiC informationhas been removed
CiC informationhas been removed
Summary
The mean baseline BASDAI and BASFI are presented by treatment response at week 12 (or 14 forgolimumab) for three of the five anti-TNFs. This reveals that in patients with AS and patients with nr-AxSpA,on average baseline BASDAI score does not differ greatly between responders and non-responders eitherto placebo or to active anti-TNF therapy. In patients with AS or nr-AxSpA from the trials of adalimumab(ATLAS61 and ABILITY-158) and golimumab (GO-RAISE90) on average baseline BASFI score was higher innon-responders compared with responders. However, this was not seen in the etanercept trials.
APPENDIX 6
NIHR Journals Library www.journalslibrary.nihr.ac.uk
236
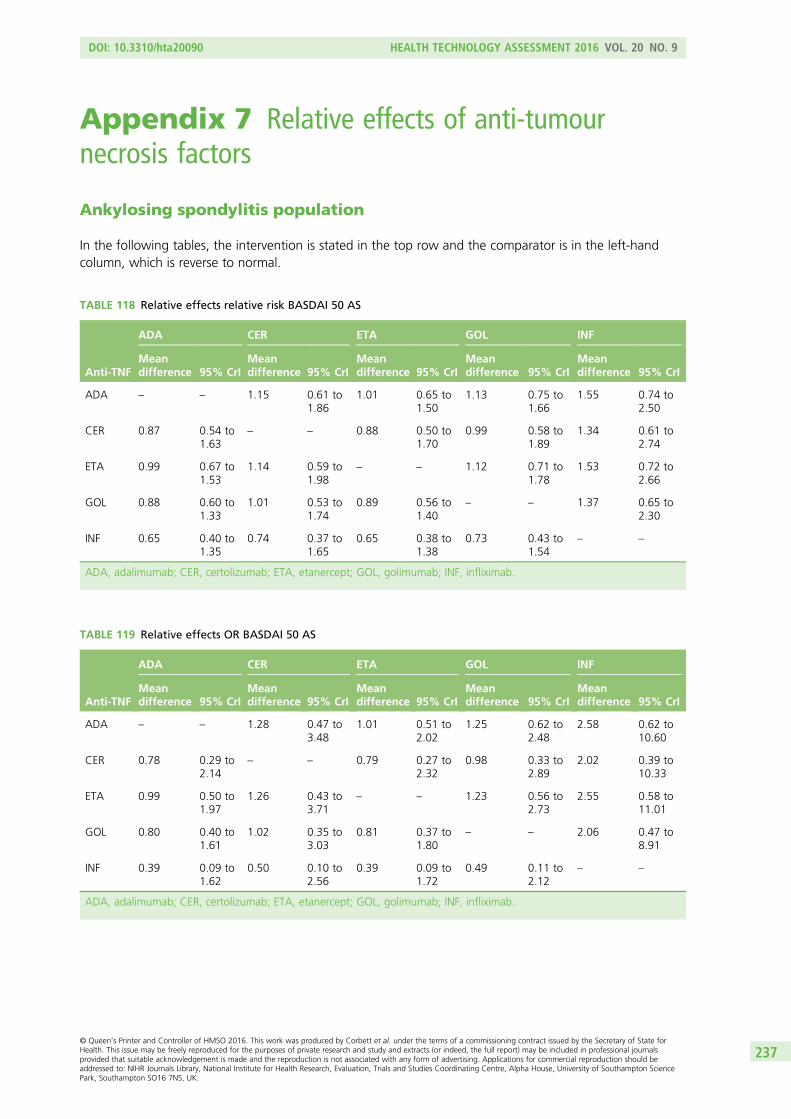
Appendix 7 Relative effects of anti-tumournecrosis factors
Ankylosing spondylitis population
In the following tables, the intervention is stated in the top row and the comparator is in the left-handcolumn, which is reverse to normal.
TABLE 118 Relative effects relative risk BASDAI 50 AS
Anti-TNF
ADA CER ETA GOL INF
Meandifference 95% CrI
Meandifference 95% CrI
Meandifference 95% CrI
Meandifference 95% CrI
Meandifference 95% CrI
ADA – – 1.15 0.61 to1.86
1.01 0.65 to1.50
1.13 0.75 to1.66
1.55 0.74 to2.50
CER 0.87 0.54 to1.63
– – 0.88 0.50 to1.70
0.99 0.58 to1.89
1.34 0.61 to2.74
ETA 0.99 0.67 to1.53
1.14 0.59 to1.98
– – 1.12 0.71 to1.78
1.53 0.72 to2.66
GOL 0.88 0.60 to1.33
1.01 0.53 to1.74
0.89 0.56 to1.40
– – 1.37 0.65 to2.30
INF 0.65 0.40 to1.35
0.74 0.37 to1.65
0.65 0.38 to1.38
0.73 0.43 to1.54
– –
ADA, adalimumab; CER, certolizumab; ETA, etanercept; GOL, golimumab; INF, infliximab.
TABLE 119 Relative effects OR BASDAI 50 AS
Anti-TNF
ADA CER ETA GOL INF
Meandifference 95% CrI
Meandifference 95% CrI
Meandifference 95% CrI
Meandifference 95% CrI
Meandifference 95% CrI
ADA – – 1.28 0.47 to3.48
1.01 0.51 to2.02
1.25 0.62 to2.48
2.58 0.62 to10.60
CER 0.78 0.29 to2.14
– – 0.79 0.27 to2.32
0.98 0.33 to2.89
2.02 0.39 to10.33
ETA 0.99 0.50 to1.97
1.26 0.43 to3.71
– – 1.23 0.56 to2.73
2.55 0.58 to11.01
GOL 0.80 0.40 to1.61
1.02 0.35 to3.03
0.81 0.37 to1.80
– – 2.06 0.47 to8.91
INF 0.39 0.09 to1.62
0.50 0.10 to2.56
0.39 0.09 to1.72
0.49 0.11 to2.12
– –
ADA, adalimumab; CER, certolizumab; ETA, etanercept; GOL, golimumab; INF, infliximab.
DOI: 10.3310/hta20090 HEALTH TECHNOLOGY ASSESSMENT 2016 VOL. 20 NO. 9
© Queen’s Printer and Controller of HMSO 2016. This work was produced by Corbett et al. under the terms of a commissioning contract issued by the Secretary of State forHealth. This issue may be freely reproduced for the purposes of private research and study and extracts (or indeed, the full report) may be included in professional journalsprovided that suitable acknowledgement is made and the reproduction is not associated with any form of advertising. Applications for commercial reproduction should beaddressed to: NIHR Journals Library, National Institute for Health Research, Evaluation, Trials and Studies Coordinating Centre, Alpha House, University of Southampton SciencePark, Southampton SO16 7NS, UK.
237
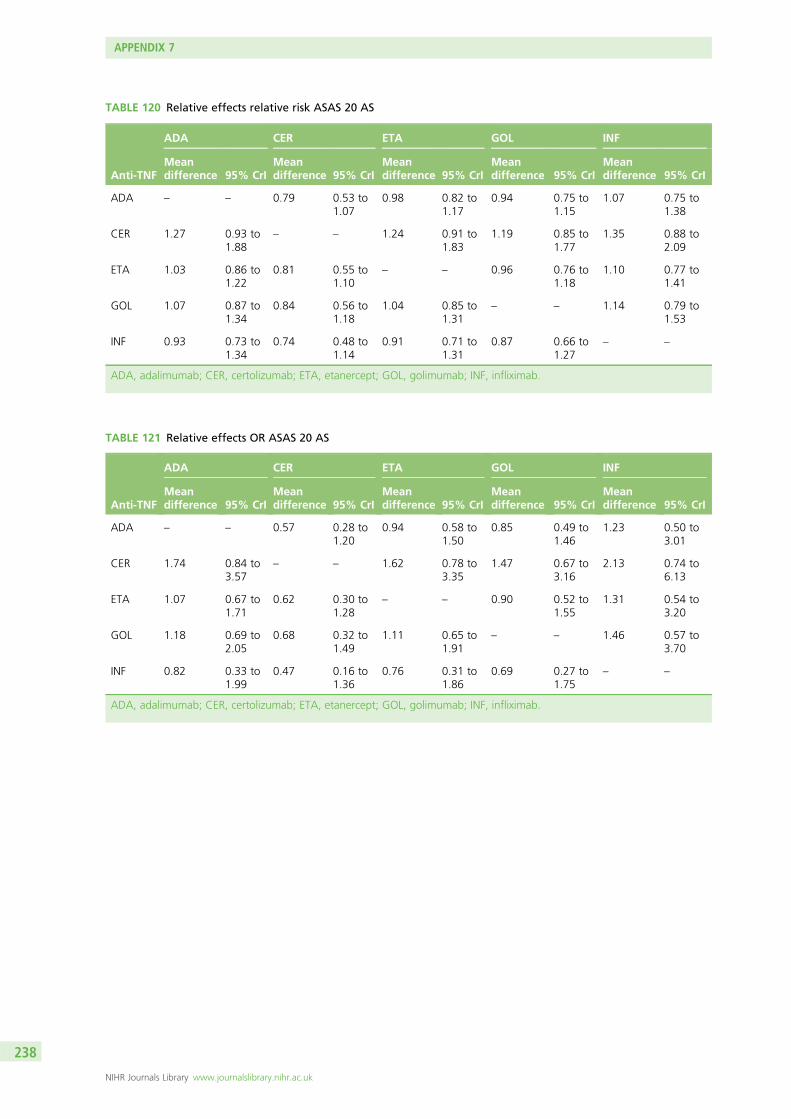
TABLE 120 Relative effects relative risk ASAS 20 AS
Anti-TNF
ADA CER ETA GOL INF
Meandifference 95% CrI
Meandifference 95% CrI
Meandifference 95% CrI
Meandifference 95% CrI
Meandifference 95% CrI
ADA – – 0.79 0.53 to1.07
0.98 0.82 to1.17
0.94 0.75 to1.15
1.07 0.75 to1.38
CER 1.27 0.93 to1.88
– – 1.24 0.91 to1.83
1.19 0.85 to1.77
1.35 0.88 to2.09
ETA 1.03 0.86 to1.22
0.81 0.55 to1.10
– – 0.96 0.76 to1.18
1.10 0.77 to1.41
GOL 1.07 0.87 to1.34
0.84 0.56 to1.18
1.04 0.85 to1.31
– – 1.14 0.79 to1.53
INF 0.93 0.73 to1.34
0.74 0.48 to1.14
0.91 0.71 to1.31
0.87 0.66 to1.27
– –
ADA, adalimumab; CER, certolizumab; ETA, etanercept; GOL, golimumab; INF, infliximab.
TABLE 121 Relative effects OR ASAS 20 AS
Anti-TNF
ADA CER ETA GOL INF
Meandifference 95% CrI
Meandifference 95% CrI
Meandifference 95% CrI
Meandifference 95% CrI
Meandifference 95% CrI
ADA – – 0.57 0.28 to1.20
0.94 0.58 to1.50
0.85 0.49 to1.46
1.23 0.50 to3.01
CER 1.74 0.84 to3.57
– – 1.62 0.78 to3.35
1.47 0.67 to3.16
2.13 0.74 to6.13
ETA 1.07 0.67 to1.71
0.62 0.30 to1.28
– – 0.90 0.52 to1.55
1.31 0.54 to3.20
GOL 1.18 0.69 to2.05
0.68 0.32 to1.49
1.11 0.65 to1.91
– – 1.46 0.57 to3.70
INF 0.82 0.33 to1.99
0.47 0.16 to1.36
0.76 0.31 to1.86
0.69 0.27 to1.75
– –
ADA, adalimumab; CER, certolizumab; ETA, etanercept; GOL, golimumab; INF, infliximab.
APPENDIX 7
NIHR Journals Library www.journalslibrary.nihr.ac.uk
238
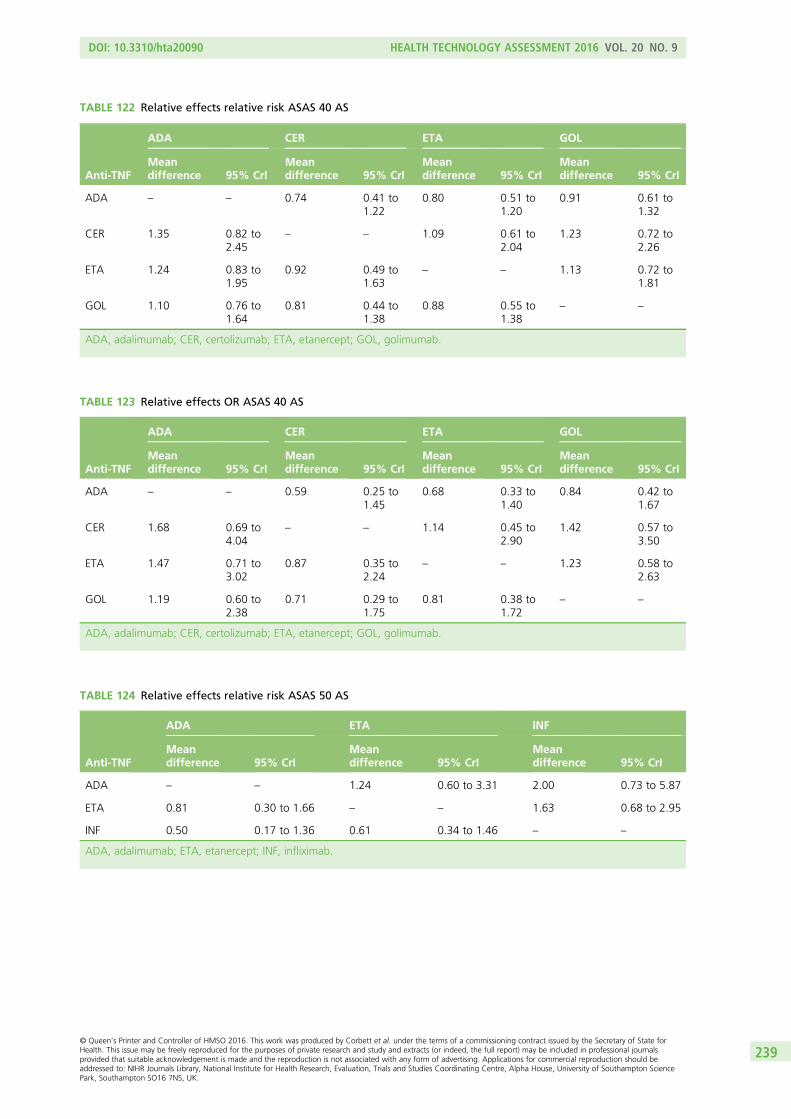
TABLE 122 Relative effects relative risk ASAS 40 AS
Anti-TNF
ADA CER ETA GOL
Meandifference 95% CrI
Meandifference 95% CrI
Meandifference 95% CrI
Meandifference 95% CrI
ADA – – 0.74 0.41 to1.22
0.80 0.51 to1.20
0.91 0.61 to1.32
CER 1.35 0.82 to2.45
– – 1.09 0.61 to2.04
1.23 0.72 to2.26
ETA 1.24 0.83 to1.95
0.92 0.49 to1.63
– – 1.13 0.72 to1.81
GOL 1.10 0.76 to1.64
0.81 0.44 to1.38
0.88 0.55 to1.38
– –
ADA, adalimumab; CER, certolizumab; ETA, etanercept; GOL, golimumab.
TABLE 123 Relative effects OR ASAS 40 AS
Anti-TNF
ADA CER ETA GOL
Meandifference 95% CrI
Meandifference 95% CrI
Meandifference 95% CrI
Meandifference 95% CrI
ADA – – 0.59 0.25 to1.45
0.68 0.33 to1.40
0.84 0.42 to1.67
CER 1.68 0.69 to4.04
– – 1.14 0.45 to2.90
1.42 0.57 to3.50
ETA 1.47 0.71 to3.02
0.87 0.35 to2.24
– – 1.23 0.58 to2.63
GOL 1.19 0.60 to2.38
0.71 0.29 to1.75
0.81 0.38 to1.72
– –
ADA, adalimumab; CER, certolizumab; ETA, etanercept; GOL, golimumab.
TABLE 124 Relative effects relative risk ASAS 50 AS
Anti-TNF
ADA ETA INF
Meandifference 95% CrI
Meandifference 95% CrI
Meandifference 95% CrI
ADA – – 1.24 0.60 to 3.31 2.00 0.73 to 5.87
ETA 0.81 0.30 to 1.66 – – 1.63 0.68 to 2.95
INF 0.50 0.17 to 1.36 0.61 0.34 to 1.46 – –
ADA, adalimumab; ETA, etanercept; INF, infliximab.
DOI: 10.3310/hta20090 HEALTH TECHNOLOGY ASSESSMENT 2016 VOL. 20 NO. 9
© Queen’s Printer and Controller of HMSO 2016. This work was produced by Corbett et al. under the terms of a commissioning contract issued by the Secretary of State forHealth. This issue may be freely reproduced for the purposes of private research and study and extracts (or indeed, the full report) may be included in professional journalsprovided that suitable acknowledgement is made and the reproduction is not associated with any form of advertising. Applications for commercial reproduction should beaddressed to: NIHR Journals Library, National Institute for Health Research, Evaluation, Trials and Studies Coordinating Centre, Alpha House, University of Southampton SciencePark, Southampton SO16 7NS, UK.
239
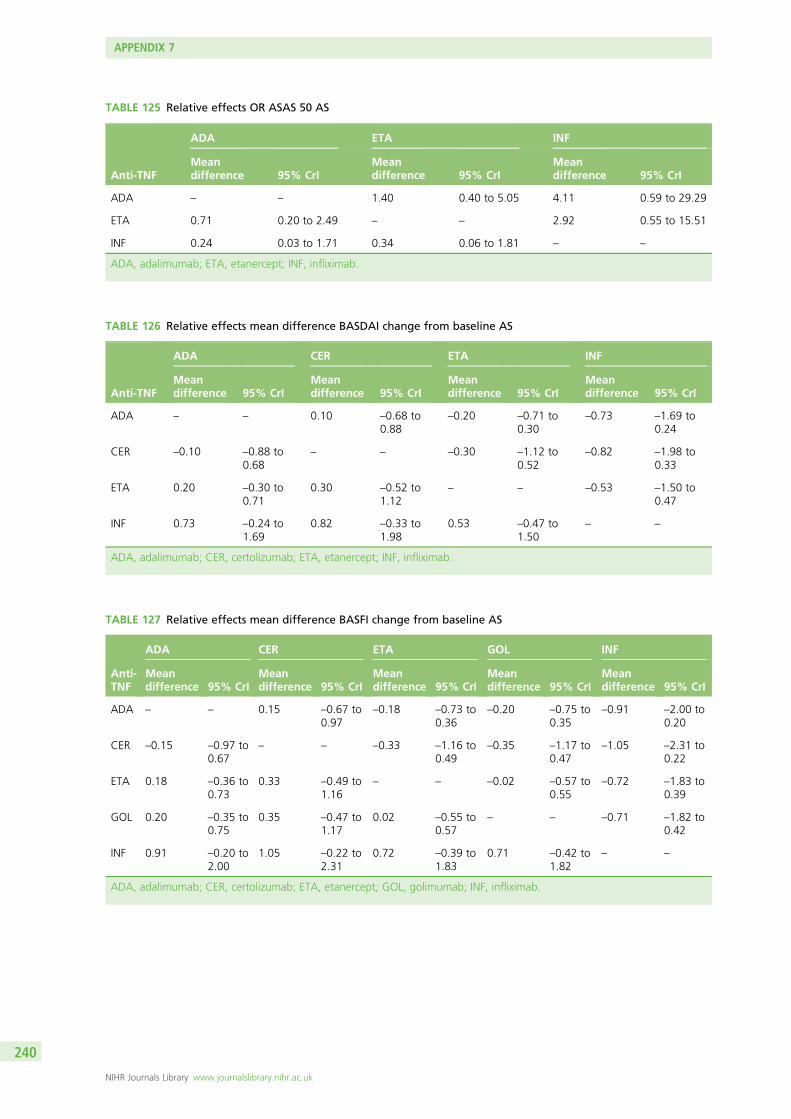
TABLE 125 Relative effects OR ASAS 50 AS
Anti-TNF
ADA ETA INF
Meandifference 95% CrI
Meandifference 95% CrI
Meandifference 95% CrI
ADA – – 1.40 0.40 to 5.05 4.11 0.59 to 29.29
ETA 0.71 0.20 to 2.49 – – 2.92 0.55 to 15.51
INF 0.24 0.03 to 1.71 0.34 0.06 to 1.81 – –
ADA, adalimumab; ETA, etanercept; INF, infliximab.
TABLE 126 Relative effects mean difference BASDAI change from baseline AS
Anti-TNF
ADA CER ETA INF
Meandifference 95% CrI
Meandifference 95% CrI
Meandifference 95% CrI
Meandifference 95% CrI
ADA – – 0.10 –0.68 to0.88
–0.20 –0.71 to0.30
–0.73 –1.69 to0.24
CER –0.10 –0.88 to0.68
– – –0.30 –1.12 to0.52
–0.82 –1.98 to0.33
ETA 0.20 –0.30 to0.71
0.30 –0.52 to1.12
– – –0.53 –1.50 to0.47
INF 0.73 –0.24 to1.69
0.82 –0.33 to1.98
0.53 –0.47 to1.50
– –
ADA, adalimumab; CER, certolizumab; ETA, etanercept; INF, infliximab.
TABLE 127 Relative effects mean difference BASFI change from baseline AS
Anti-TNF
ADA CER ETA GOL INF
Meandifference 95% CrI
Meandifference 95% CrI
Meandifference 95% CrI
Meandifference 95% CrI
Meandifference 95% CrI
ADA – – 0.15 –0.67 to0.97
–0.18 –0.73 to0.36
–0.20 –0.75 to0.35
–0.91 –2.00 to0.20
CER –0.15 –0.97 to0.67
– – –0.33 –1.16 to0.49
–0.35 –1.17 to0.47
–1.05 –2.31 to0.22
ETA 0.18 –0.36 to0.73
0.33 –0.49 to1.16
– – –0.02 –0.57 to0.55
–0.72 –1.83 to0.39
GOL 0.20 –0.35 to0.75
0.35 –0.47 to1.17
0.02 –0.55 to0.57
– – –0.71 –1.82 to0.42
INF 0.91 –0.20 to2.00
1.05 –0.22 to2.31
0.72 –0.39 to1.83
0.71 –0.42 to1.82
– –
ADA, adalimumab; CER, certolizumab; ETA, etanercept; GOL, golimumab; INF, infliximab.
APPENDIX 7
NIHR Journals Library www.journalslibrary.nihr.ac.uk
240
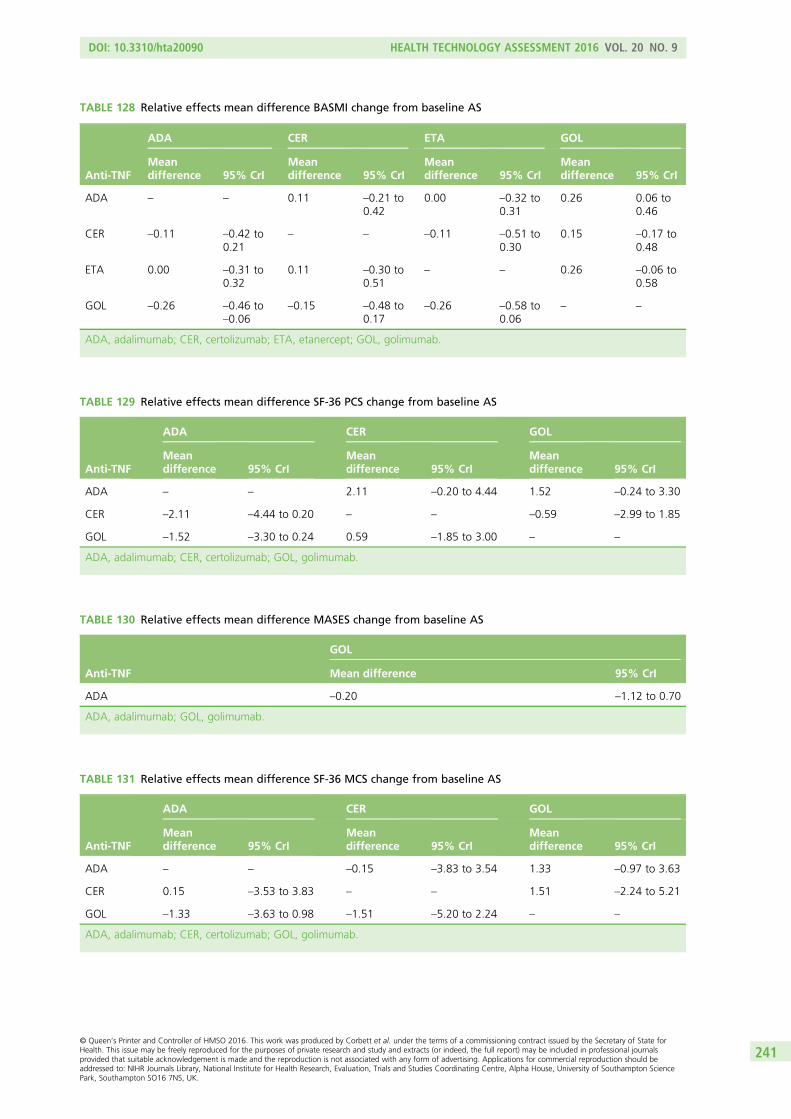
TABLE 128 Relative effects mean difference BASMI change from baseline AS
Anti-TNF
ADA CER ETA GOL
Meandifference 95% CrI
Meandifference 95% CrI
Meandifference 95% CrI
Meandifference 95% CrI
ADA – – 0.11 –0.21 to0.42
0.00 –0.32 to0.31
0.26 0.06 to0.46
CER –0.11 –0.42 to0.21
– – –0.11 –0.51 to0.30
0.15 –0.17 to0.48
ETA 0.00 –0.31 to0.32
0.11 –0.30 to0.51
– – 0.26 –0.06 to0.58
GOL –0.26 –0.46 to–0.06
–0.15 –0.48 to0.17
–0.26 –0.58 to0.06
– –
ADA, adalimumab; CER, certolizumab; ETA, etanercept; GOL, golimumab.
TABLE 129 Relative effects mean difference SF-36 PCS change from baseline AS
Anti-TNF
ADA CER GOL
Meandifference 95% CrI
Meandifference 95% CrI
Meandifference 95% CrI
ADA – – 2.11 –0.20 to 4.44 1.52 –0.24 to 3.30
CER –2.11 –4.44 to 0.20 – – –0.59 –2.99 to 1.85
GOL –1.52 –3.30 to 0.24 0.59 –1.85 to 3.00 – –
ADA, adalimumab; CER, certolizumab; GOL, golimumab.
TABLE 130 Relative effects mean difference MASES change from baseline AS
Anti-TNF
GOL
Mean difference 95% CrI
ADA –0.20 –1.12 to 0.70
ADA, adalimumab; GOL, golimumab.
TABLE 131 Relative effects mean difference SF-36 MCS change from baseline AS
Anti-TNF
ADA CER GOL
Meandifference 95% CrI
Meandifference 95% CrI
Meandifference 95% CrI
ADA – – –0.15 –3.83 to 3.54 1.33 –0.97 to 3.63
CER 0.15 –3.53 to 3.83 – – 1.51 –2.24 to 5.21
GOL –1.33 –3.63 to 0.98 –1.51 –5.20 to 2.24 – –
ADA, adalimumab; CER, certolizumab; GOL, golimumab.
DOI: 10.3310/hta20090 HEALTH TECHNOLOGY ASSESSMENT 2016 VOL. 20 NO. 9
© Queen’s Printer and Controller of HMSO 2016. This work was produced by Corbett et al. under the terms of a commissioning contract issued by the Secretary of State forHealth. This issue may be freely reproduced for the purposes of private research and study and extracts (or indeed, the full report) may be included in professional journalsprovided that suitable acknowledgement is made and the reproduction is not associated with any form of advertising. Applications for commercial reproduction should beaddressed to: NIHR Journals Library, National Institute for Health Research, Evaluation, Trials and Studies Coordinating Centre, Alpha House, University of Southampton SciencePark, Southampton SO16 7NS, UK.
241
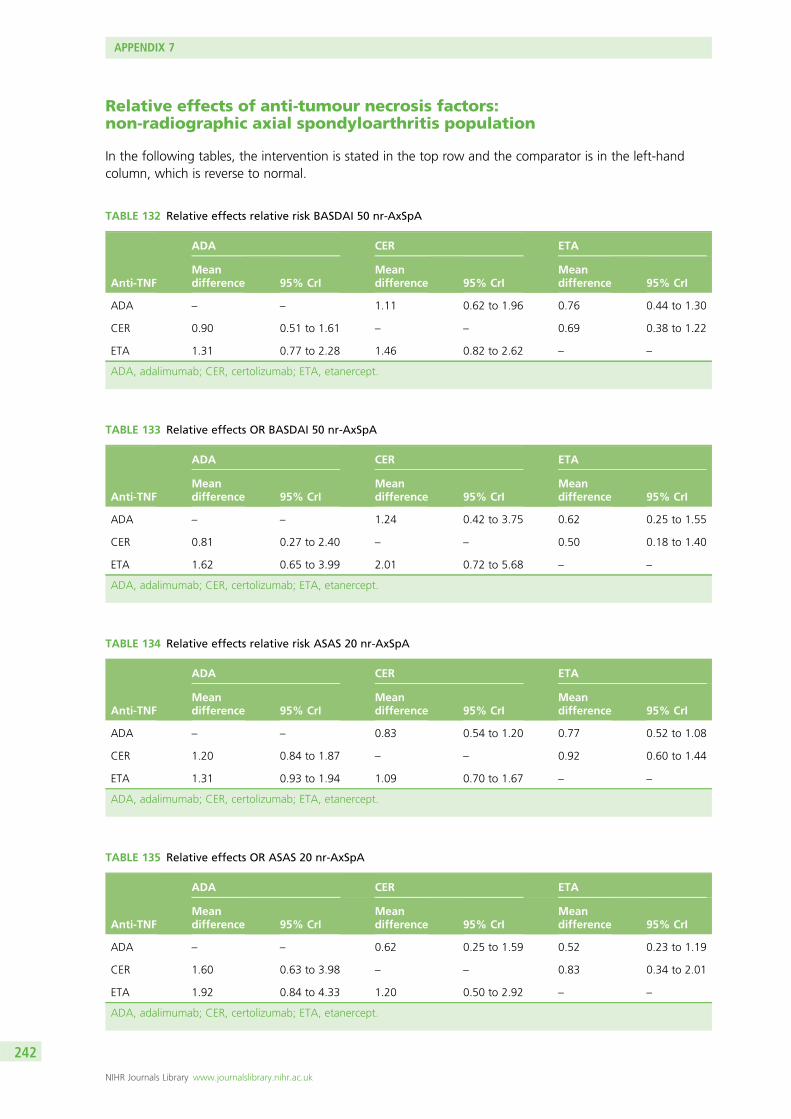
Relative effects of anti-tumour necrosis factors:non-radiographic axial spondyloarthritis population
In the following tables, the intervention is stated in the top row and the comparator is in the left-handcolumn, which is reverse to normal.
TABLE 132 Relative effects relative risk BASDAI 50 nr-AxSpA
Anti-TNF
ADA CER ETA
Meandifference 95% CrI
Meandifference 95% CrI
Meandifference 95% CrI
ADA – – 1.11 0.62 to 1.96 0.76 0.44 to 1.30
CER 0.90 0.51 to 1.61 – – 0.69 0.38 to 1.22
ETA 1.31 0.77 to 2.28 1.46 0.82 to 2.62 – –
ADA, adalimumab; CER, certolizumab; ETA, etanercept.
TABLE 133 Relative effects OR BASDAI 50 nr-AxSpA
Anti-TNF
ADA CER ETA
Meandifference 95% CrI
Meandifference 95% CrI
Meandifference 95% CrI
ADA – – 1.24 0.42 to 3.75 0.62 0.25 to 1.55
CER 0.81 0.27 to 2.40 – – 0.50 0.18 to 1.40
ETA 1.62 0.65 to 3.99 2.01 0.72 to 5.68 – –
ADA, adalimumab; CER, certolizumab; ETA, etanercept.
TABLE 134 Relative effects relative risk ASAS 20 nr-AxSpA
Anti-TNF
ADA CER ETA
Meandifference 95% CrI
Meandifference 95% CrI
Meandifference 95% CrI
ADA – – 0.83 0.54 to 1.20 0.77 0.52 to 1.08
CER 1.20 0.84 to 1.87 – – 0.92 0.60 to 1.44
ETA 1.31 0.93 to 1.94 1.09 0.70 to 1.67 – –
ADA, adalimumab; CER, certolizumab; ETA, etanercept.
TABLE 135 Relative effects OR ASAS 20 nr-AxSpA
Anti-TNF
ADA CER ETA
Meandifference 95% CrI
Meandifference 95% CrI
Meandifference 95% CrI
ADA – – 0.62 0.25 to 1.59 0.52 0.23 to 1.19
CER 1.60 0.63 to 3.98 – – 0.83 0.34 to 2.01
ETA 1.92 0.84 to 4.33 1.20 0.50 to 2.92 – –
ADA, adalimumab; CER, certolizumab; ETA, etanercept.
APPENDIX 7
NIHR Journals Library www.journalslibrary.nihr.ac.uk
242
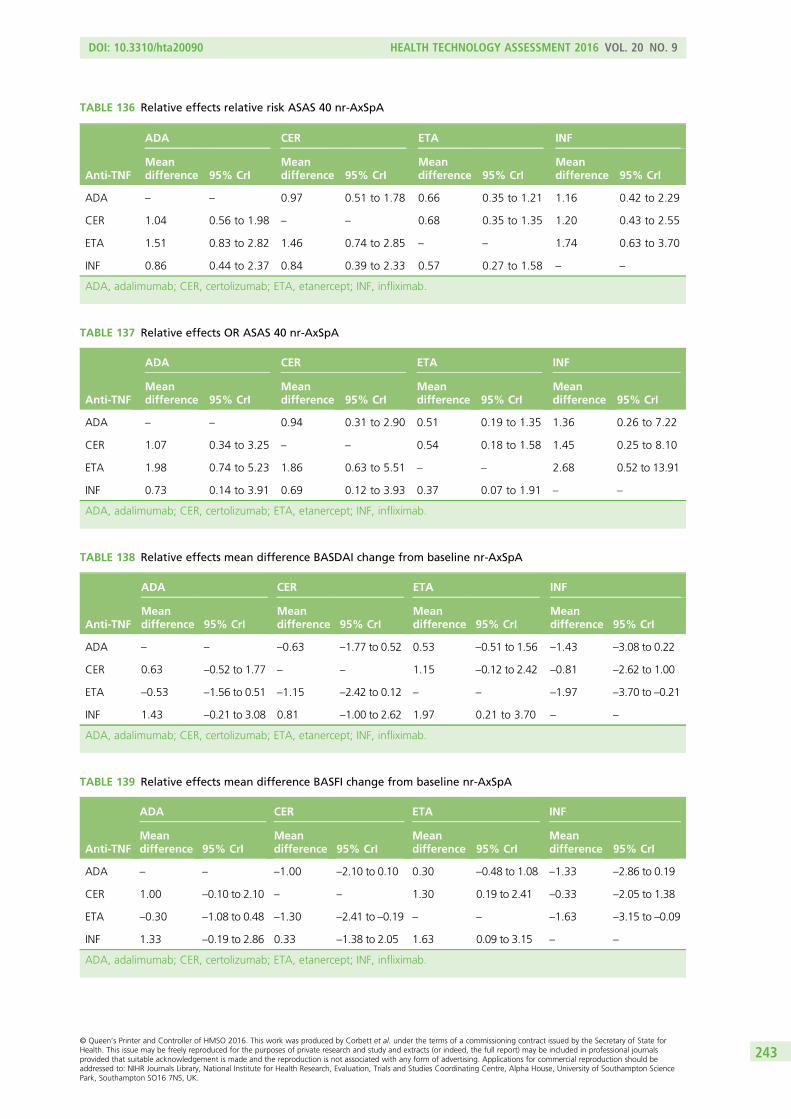
TABLE 136 Relative effects relative risk ASAS 40 nr-AxSpA
Anti-TNF
ADA CER ETA INF
Meandifference 95% CrI
Meandifference 95% CrI
Meandifference 95% CrI
Meandifference 95% CrI
ADA – – 0.97 0.51 to 1.78 0.66 0.35 to 1.21 1.16 0.42 to 2.29
CER 1.04 0.56 to 1.98 – – 0.68 0.35 to 1.35 1.20 0.43 to 2.55
ETA 1.51 0.83 to 2.82 1.46 0.74 to 2.85 – – 1.74 0.63 to 3.70
INF 0.86 0.44 to 2.37 0.84 0.39 to 2.33 0.57 0.27 to 1.58 – –
ADA, adalimumab; CER, certolizumab; ETA, etanercept; INF, infliximab.
TABLE 137 Relative effects OR ASAS 40 nr-AxSpA
Anti-TNF
ADA CER ETA INF
Meandifference 95% CrI
Meandifference 95% CrI
Meandifference 95% CrI
Meandifference 95% CrI
ADA – – 0.94 0.31 to 2.90 0.51 0.19 to 1.35 1.36 0.26 to 7.22
CER 1.07 0.34 to 3.25 – – 0.54 0.18 to 1.58 1.45 0.25 to 8.10
ETA 1.98 0.74 to 5.23 1.86 0.63 to 5.51 – – 2.68 0.52 to 13.91
INF 0.73 0.14 to 3.91 0.69 0.12 to 3.93 0.37 0.07 to 1.91 – –
ADA, adalimumab; CER, certolizumab; ETA, etanercept; INF, infliximab.
TABLE 138 Relative effects mean difference BASDAI change from baseline nr-AxSpA
Anti-TNF
ADA CER ETA INF
Meandifference 95% CrI
Meandifference 95% CrI
Meandifference 95% CrI
Meandifference 95% CrI
ADA – – –0.63 –1.77 to 0.52 0.53 –0.51 to 1.56 –1.43 –3.08 to 0.22
CER 0.63 –0.52 to 1.77 – – 1.15 –0.12 to 2.42 –0.81 –2.62 to 1.00
ETA –0.53 –1.56 to 0.51 –1.15 –2.42 to 0.12 – – –1.97 –3.70 to –0.21
INF 1.43 –0.21 to 3.08 0.81 –1.00 to 2.62 1.97 0.21 to 3.70 – –
ADA, adalimumab; CER, certolizumab; ETA, etanercept; INF, infliximab.
TABLE 139 Relative effects mean difference BASFI change from baseline nr-AxSpA
Anti-TNF
ADA CER ETA INF
Meandifference 95% CrI
Meandifference 95% CrI
Meandifference 95% CrI
Meandifference 95% CrI
ADA – – –1.00 –2.10 to 0.10 0.30 –0.48 to 1.08 –1.33 –2.86 to 0.19
CER 1.00 –0.10 to 2.10 – – 1.30 0.19 to 2.41 –0.33 –2.05 to 1.38
ETA –0.30 –1.08 to 0.48 –1.30 –2.41 to –0.19 – – –1.63 –3.15 to –0.09
INF 1.33 –0.19 to 2.86 0.33 –1.38 to 2.05 1.63 0.09 to 3.15 – –
ADA, adalimumab; CER, certolizumab; ETA, etanercept; INF, infliximab.
DOI: 10.3310/hta20090 HEALTH TECHNOLOGY ASSESSMENT 2016 VOL. 20 NO. 9
© Queen’s Printer and Controller of HMSO 2016. This work was produced by Corbett et al. under the terms of a commissioning contract issued by the Secretary of State forHealth. This issue may be freely reproduced for the purposes of private research and study and extracts (or indeed, the full report) may be included in professional journalsprovided that suitable acknowledgement is made and the reproduction is not associated with any form of advertising. Applications for commercial reproduction should beaddressed to: NIHR Journals Library, National Institute for Health Research, Evaluation, Trials and Studies Coordinating Centre, Alpha House, University of Southampton SciencePark, Southampton SO16 7NS, UK.
243
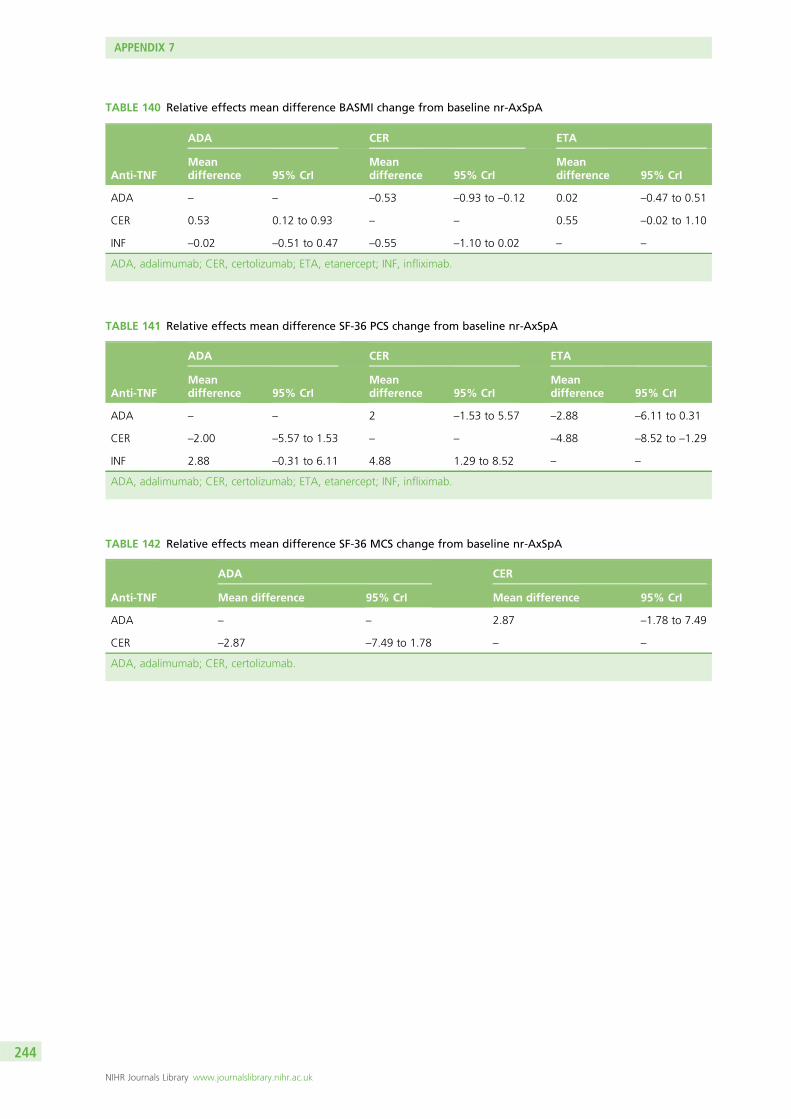
TABLE 140 Relative effects mean difference BASMI change from baseline nr-AxSpA
Anti-TNF
ADA CER ETA
Meandifference 95% CrI
Meandifference 95% CrI
Meandifference 95% CrI
ADA – – –0.53 –0.93 to –0.12 0.02 –0.47 to 0.51
CER 0.53 0.12 to 0.93 – – 0.55 –0.02 to 1.10
INF –0.02 –0.51 to 0.47 –0.55 –1.10 to 0.02 – –
ADA, adalimumab; CER, certolizumab; ETA, etanercept; INF, infliximab.
TABLE 141 Relative effects mean difference SF-36 PCS change from baseline nr-AxSpA
Anti-TNF
ADA CER ETA
Meandifference 95% CrI
Meandifference 95% CrI
Meandifference 95% CrI
ADA – – 2 –1.53 to 5.57 –2.88 –6.11 to 0.31
CER –2.00 –5.57 to 1.53 – – –4.88 –8.52 to –1.29
INF 2.88 –0.31 to 6.11 4.88 1.29 to 8.52 – –
ADA, adalimumab; CER, certolizumab; ETA, etanercept; INF, infliximab.
TABLE 142 Relative effects mean difference SF-36 MCS change from baseline nr-AxSpA
Anti-TNF
ADA CER
Mean difference 95% CrI Mean difference 95% CrI
ADA – – 2.87 –1.78 to 7.49
CER –2.87 –7.49 to 1.78 – –
ADA, adalimumab; CER, certolizumab.
APPENDIX 7
NIHR Journals Library www.journalslibrary.nihr.ac.uk
244
Appendix 8 Long-term efficacy data
DOI: 10.3310/hta20090 HEALTH TECHNOLOGY ASSESSMENT 2016 VOL. 20 NO. 9
© Queen’s Printer and Controller of HMSO 2016. This work was produced by Corbett et al. under the terms of a commissioning contract issued by the Secretary of State forHealth. This issue may be freely reproduced for the purposes of private research and study and extracts (or indeed, the full report) may be included in professional journalsprovided that suitable acknowledgement is made and the reproduction is not associated with any form of advertising. Applications for commercial reproduction should beaddressed to: NIHR Journals Library, National Institute for Health Research, Evaluation, Trials and Studies Coordinating Centre, Alpha House, University of Southampton SciencePark, Southampton SO16 7NS, UK.
245
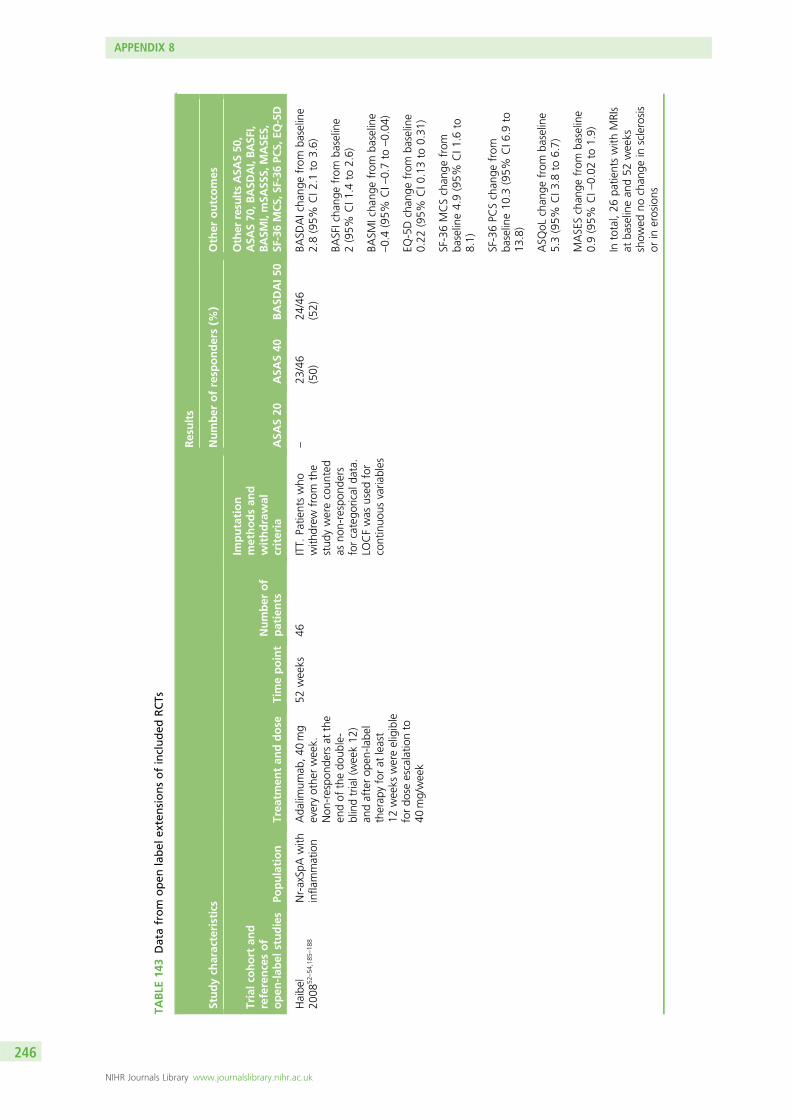
TABLE
143
Datafrom
open
label
extensionsofincluded
RCTs
Studych
aracteristics
Results
Number
ofresp
onders(%
)Other
outcomes
Trialco
hort
and
referencesof
open
-lab
elstudies
Population
Trea
tmen
tan
ddose
Timepoint
Number
of
patients
Imputation
methodsan
dwithdrawal
criteria
ASA
S20
ASA
S40
BASD
AI50
Other
resu
ltsASA
S50
,ASA
S70
,BASD
AI,BASF
I,BASM
I,mSA
SSS,
MASE
S,SF
-36MCS,
SF-36PC
S,EQ
-5D
Haibe
l20
0852
–54
,185
–18
8Nr-axSp
Awith
infla
mmation
Ada
limum
ab,4
0mg
everyothe
rweek.
Non
-respo
ndersat
the
endof
thedo
uble-
blindtrial(week12
)an
dafterop
en-la
bel
therap
yforat
least
12weeks
wereeligible
fordo
seescalatio
nto
40mg/week
52weeks
46ITT.
Patie
ntswho
with
drew
from
the
stud
ywerecoun
ted
asno
n-respon
ders
forcatego
rical
data.
LOCFwas
used
for
continuo
usvaria
bles
–23
/46
(50)
24/46
(52)
BASD
AIcha
ngefrom
baseline
2.8(95%
CI2
.1to
3.6)
BASFIcha
ngefrom
baseline
2(95%
CI1
.4to
2.6)
BASM
Icha
ngefrom
baseline
–0.4(95%
CI–
0.7to
–0.04
)
EQ-5Dchan
gefrom
baseline
0.22
(95%
CI0
.13to
0.31
)
SF-36MCSchan
gefrom
baseline4.9(95%
CI1
.6to
8.1)
SF-36PC
Schan
gefrom
baseline10
.3(95%
CI6
.9to
13.8)
ASQ
oLchan
gefrom
baseline
5.3(95%
CI3
.8to
6.7)
MASESchan
gefrom
baseline
0.9(95%
CI–
0.02
to1.9)
Intotal,26
patie
ntswith
MRIs
atba
selinean
d52
weeks
show
edno
chan
gein
sclerosis
orin
erosions
APPENDIX 8
NIHR Journals Library www.journalslibrary.nihr.ac.uk
246
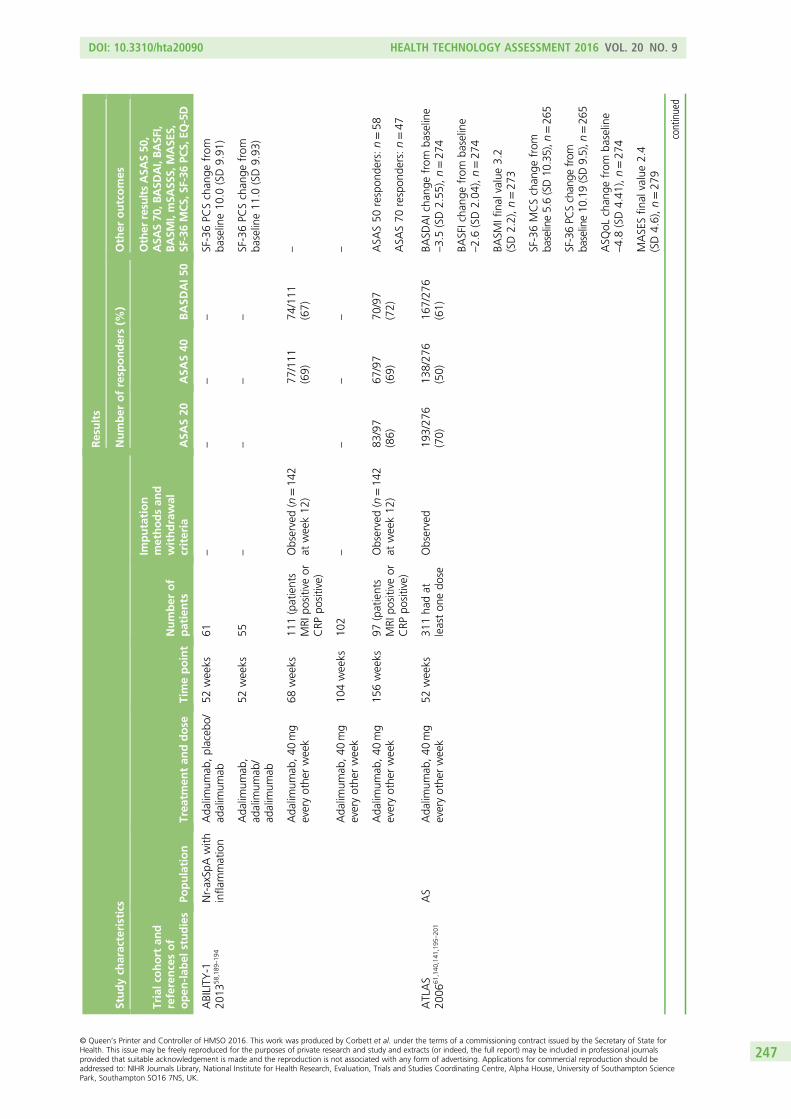
Studych
aracteristics
Results
Number
ofresp
onders(%
)Other
outcomes
Trialco
hort
and
referencesof
open
-lab
elstudies
Population
Trea
tmen
tan
ddose
Timepoint
Number
of
patients
Imputation
methodsan
dwithdrawal
criteria
ASA
S20
ASA
S40
BASD
AI50
Other
resu
ltsASA
S50
,ASA
S70
,BASD
AI,BASF
I,BASM
I,mSA
SSS,
MASE
S,SF
-36MCS,
SF-36PC
S,EQ
-5D
ABILITY
-120
1358
,189
–19
4Nr-axSp
Awith
infla
mmation
Ada
limum
ab,placeb
o/ad
alim
umab
52weeks
61–
––
–SF-36PC
Schan
gefrom
baseline10
.0(SD9.91
)
Ada
limum
ab,
adalim
umab
/ad
alim
umab
52weeks
55–
––
–SF-36PC
Schan
gefrom
baseline11
.0(SD9.93
)
Ada
limum
ab,40
mg
everyothe
rweek
68weeks
111(patients
MRI
positiveor
CRP
positive)
Observed(n
=14
2at
week12
)77
/111
(69)
74/111
(67)
–
Ada
limum
ab,40
mg
everyothe
rweek
104weeks
102
––
––
–
Ada
limum
ab,40
mg
everyothe
rweek
156weeks
97(patients
MRI
positiveor
CRP
positive)
Observed(n
=14
2at
week12
)83
/97
(86)
67/97
(69)
70/97
(72)
ASA
S50
respon
ders:n=58
ASA
S70
respon
ders:n=47
ATLAS
2006
61,140
,141
,195
–20
1AS
Ada
limum
ab,40
mg
everyothe
rweek
52weeks
311ha
dat
leaston
edo
seObserved
193/27
6(70)
138/27
6(50)
167/27
6(61)
BASD
AIcha
ngefrom
baseline
–3.5(SD2.55
),n=27
4
BASFIcha
ngefrom
baseline
–2.6(SD2.04
),n=27
4
BASM
Ifinal
value3.2
(SD2.2),n=27
3
SF-36MCSchan
gefrom
baseline5.6(SD10
.35),n
=26
5
SF-36PC
Schan
gefrom
baseline10
.19(SD9.5),n
=26
5
ASQ
oLchan
gefrom
baseline
–4.8(SD4.41
),n=27
4
MASESfin
alvalue2.4
(SD4.6),n=27
9
continued
DOI: 10.3310/hta20090 HEALTH TECHNOLOGY ASSESSMENT 2016 VOL. 20 NO. 9
© Queen’s Printer and Controller of HMSO 2016. This work was produced by Corbett et al. under the terms of a commissioning contract issued by the Secretary of State forHealth. This issue may be freely reproduced for the purposes of private research and study and extracts (or indeed, the full report) may be included in professional journalsprovided that suitable acknowledgement is made and the reproduction is not associated with any form of advertising. Applications for commercial reproduction should beaddressed to: NIHR Journals Library, National Institute for Health Research, Evaluation, Trials and Studies Coordinating Centre, Alpha House, University of Southampton SciencePark, Southampton SO16 7NS, UK.
247
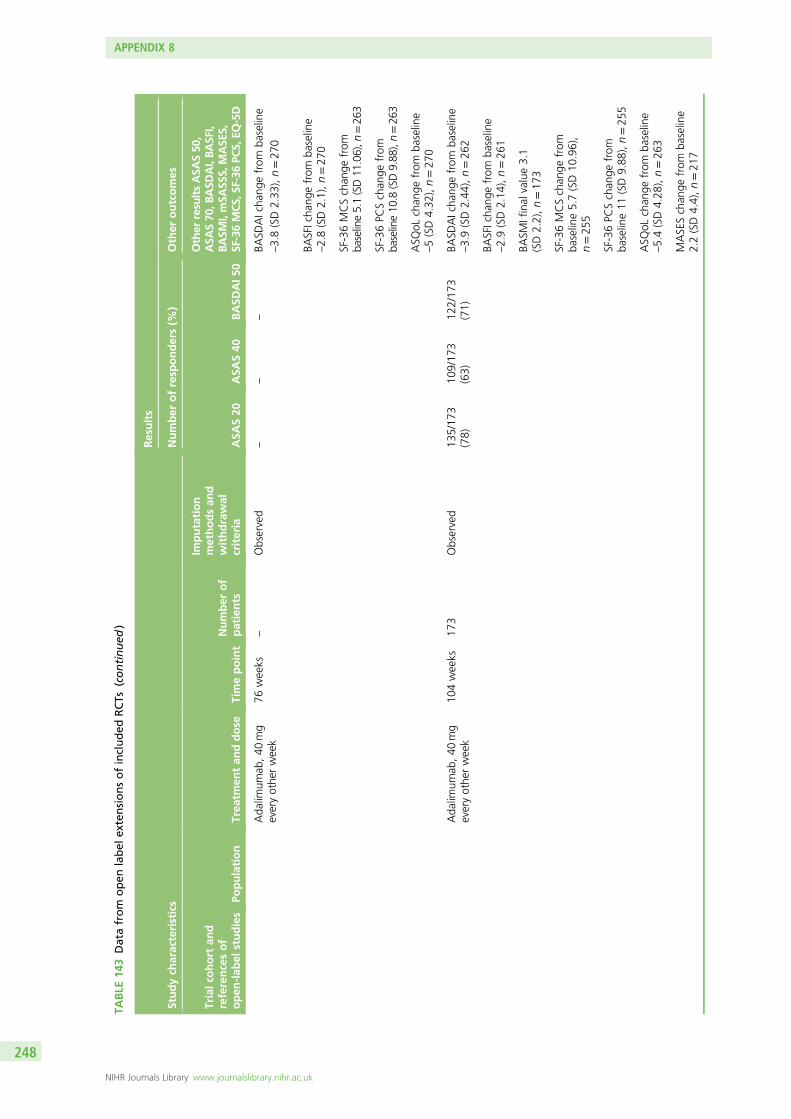
TABLE
143
Datafrom
open
label
extensionsofincluded
RCTs
(continued
)
Studych
aracteristics
Results
Number
ofresp
onders(%
)Other
outcomes
Trialco
hort
and
referencesof
open
-lab
elstudies
Population
Trea
tmen
tan
ddose
Timepoint
Number
of
patients
Imputation
methodsan
dwithdrawal
criteria
ASA
S20
ASA
S40
BASD
AI50
Other
resu
ltsASA
S50
,ASA
S70
,BASD
AI,BASF
I,BASM
I,mSA
SSS,
MASE
S,SF
-36MCS,
SF-36PC
S,EQ
-5D
Ada
limum
ab,40
mg
everyothe
rweek
76weeks
–Observed
––
–BA
SDAIcha
ngefrom
baseline
–3.8(SD2.33
),n=27
0
BASFIcha
ngefrom
baseline
–2.8(SD2.1),n=27
0
SF-36MCSchan
gefrom
baseline5.1(SD11
.06),n
=26
3
SF-36PC
Schan
gefrom
baseline10
.8(SD9.88
),n=26
3
ASQ
oLchan
gefrom
baseline
–5(SD4.32
),n=27
0
Ada
limum
ab,40
mg
everyothe
rweek
104weeks
173
Observed
135/17
3(78)
109/17
3(63)
122/17
3(71)
BASD
AIcha
ngefrom
baseline
–3.9(SD2.44
),n=26
2
BASFIcha
ngefrom
baseline
–2.9(SD2.14
),n=26
1
BASM
Ifinal
value3.1
(SD2.2),n=17
3
SF-36MCSchan
gefrom
baseline5.7(SD10
.96),
n=25
5
SF-36PC
Schan
gefrom
baseline11
(SD9.88
),n=25
5
ASQ
oLchan
gefrom
baseline
–5.4(SD4.28
),n=26
3
MASESchan
gefrom
baseline
2.2(SD4.4),n=21
7
APPENDIX 8
NIHR Journals Library www.journalslibrary.nihr.ac.uk
248
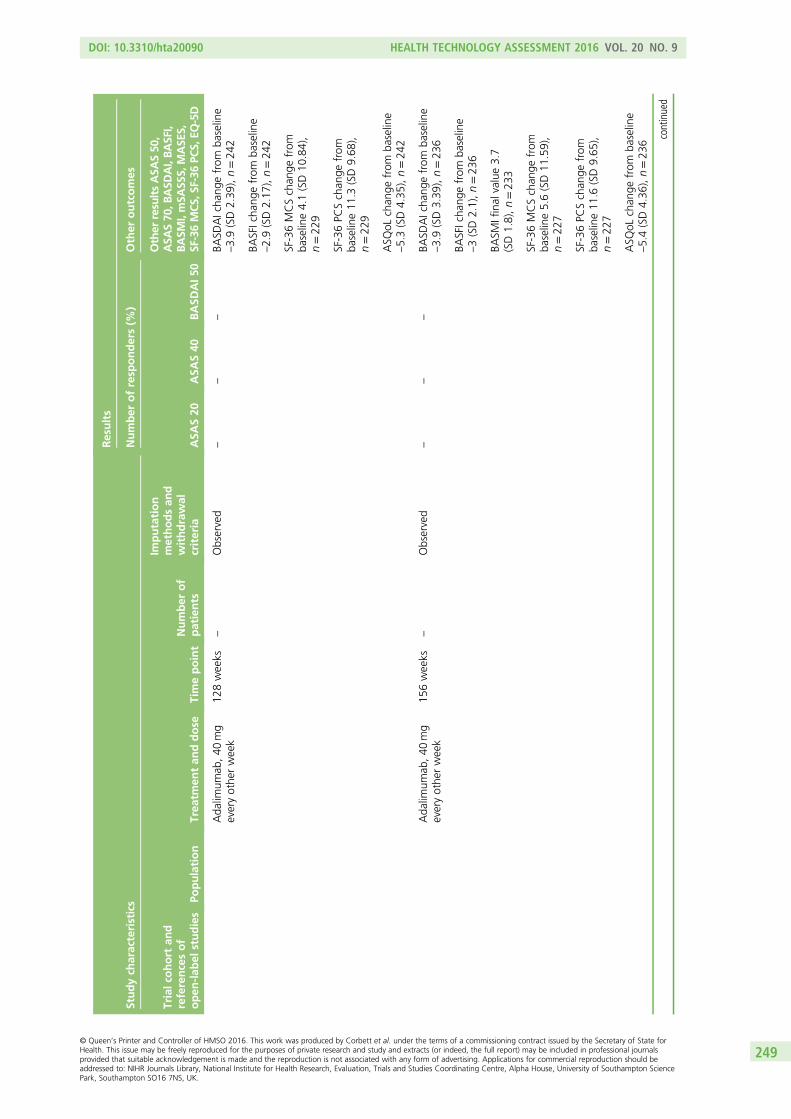
Studych
aracteristics
Results
Number
ofresp
onders(%
)Other
outcomes
Trialco
hort
and
referencesof
open
-lab
elstudies
Population
Trea
tmen
tan
ddose
Timepoint
Number
of
patients
Imputation
methodsan
dwithdrawal
criteria
ASA
S20
ASA
S40
BASD
AI50
Other
resu
ltsASA
S50
,ASA
S70
,BASD
AI,BASF
I,BASM
I,mSA
SSS,
MASE
S,SF
-36MCS,
SF-36PC
S,EQ
-5D
Ada
limum
ab,40
mg
everyothe
rweek
128weeks
–Observed
––
–BA
SDAIcha
ngefrom
baseline
–3.9(SD2.39
),n=24
2
BASFIcha
ngefrom
baseline
–2.9(SD2.17
),n=24
2
SF-36MCSchan
gefrom
baseline4.1(SD10
.84),
n=22
9
SF-36PC
Schan
gefrom
baseline11
.3(SD9.68
),n=22
9
ASQ
oLchan
gefrom
baseline
–5.3(SD4.35
),n=24
2
Ada
limum
ab,40
mg
everyothe
rweek
156weeks
–Observed
––
–BA
SDAIcha
ngefrom
baseline
–3.9(SD3.39
),n=23
6
BASFIcha
ngefrom
baseline
–3(SD2.1),n=23
6
BASM
Ifinal
value3.7
(SD1.8),n=23
3
SF-36MCSchan
gefrom
baseline5.6(SD11
.59),
n=22
7
SF-36PC
Schan
gefrom
baseline11
.6(SD9.65
),n=22
7
ASQ
oLchan
gefrom
baseline
–5.4(SD4.36
),n=23
6
continued
DOI: 10.3310/hta20090 HEALTH TECHNOLOGY ASSESSMENT 2016 VOL. 20 NO. 9
© Queen’s Printer and Controller of HMSO 2016. This work was produced by Corbett et al. under the terms of a commissioning contract issued by the Secretary of State forHealth. This issue may be freely reproduced for the purposes of private research and study and extracts (or indeed, the full report) may be included in professional journalsprovided that suitable acknowledgement is made and the reproduction is not associated with any form of advertising. Applications for commercial reproduction should beaddressed to: NIHR Journals Library, National Institute for Health Research, Evaluation, Trials and Studies Coordinating Centre, Alpha House, University of Southampton SciencePark, Southampton SO16 7NS, UK.
249
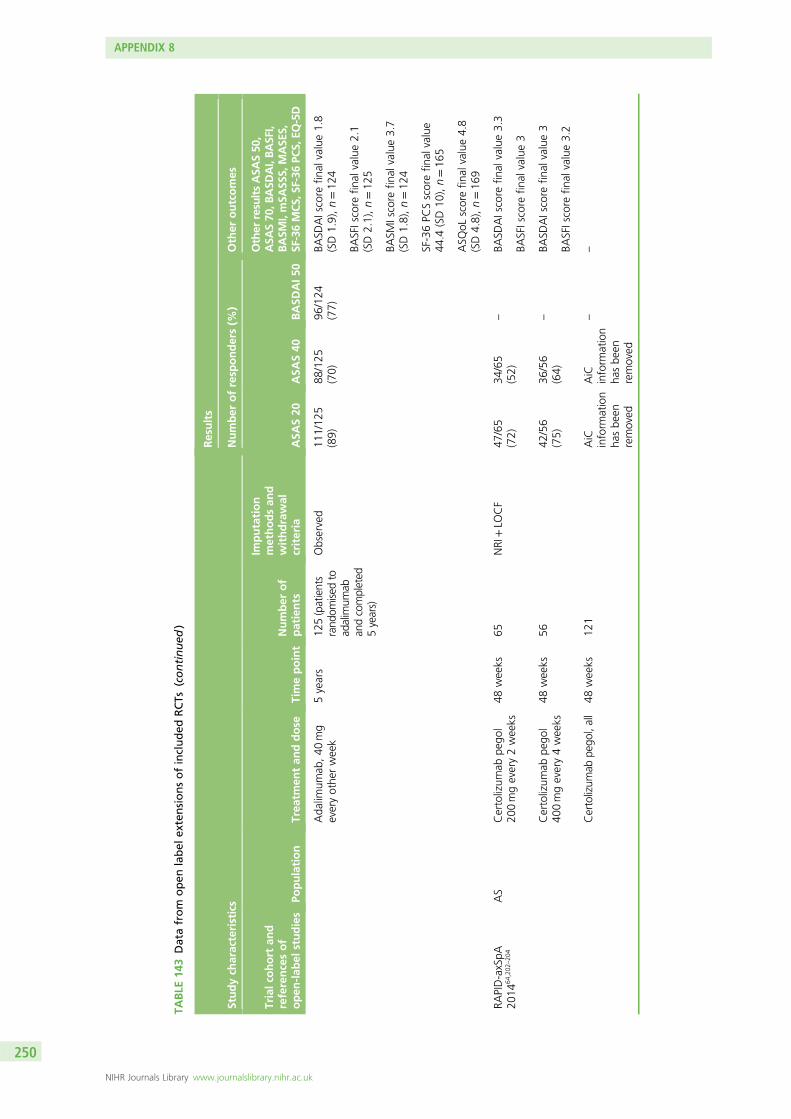
TABLE
143
Datafrom
open
label
extensionsofincluded
RCTs
(continued
)
Studych
aracteristics
Results
Number
ofresp
onders(%
)Other
outcomes
Trialco
hort
and
referencesof
open
-lab
elstudies
Population
Trea
tmen
tan
ddose
Timepoint
Number
of
patients
Imputation
methodsan
dwithdrawal
criteria
ASA
S20
ASA
S40
BASD
AI50
Other
resu
ltsASA
S50
,ASA
S70
,BASD
AI,BASF
I,BASM
I,mSA
SSS,
MASE
S,SF
-36MCS,
SF-36PC
S,EQ
-5D
Ada
limum
ab,40
mg
everyothe
rweek
5years
125(patients
rand
omised
toad
alimum
aban
dcompleted
5years)
Observed
111/12
5(89)
88/125
(70)
96/124
(77)
BASD
AIscore
final
value1.8
(SD1.9),n=12
4
BASFIscore
final
value2.1
(SD2.1),n=12
5
BASM
Iscore
final
value3.7
(SD1.8),n=12
4
SF-36PC
Sscorefin
alvalue
44.4
(SD10
),n=16
5
ASQ
oLscorefin
alvalue4.8
(SD4.8),n=16
9
RAPID-axSpA
2014
64,202
–20
4AS
Certolizum
abpe
gol
200mgevery2weeks
48weeks
65NRI+LO
CF
47/65
(72)
34/65
(52)
–BA
SDAIscore
final
value3.3
BASFIscore
final
value3
Certolizum
abpe
gol
400mgevery4weeks
48weeks
5642
/56
(75)
36/56
(64)
–BA
SDAIscore
final
value3
BASFIscore
final
value3.2
Certolizum
abpe
gol,all
48weeks
121
AiC
inform
ation
hasbe
enremoved
AiC
inform
ation
hasbe
enremoved
––
APPENDIX 8
NIHR Journals Library www.journalslibrary.nihr.ac.uk
250
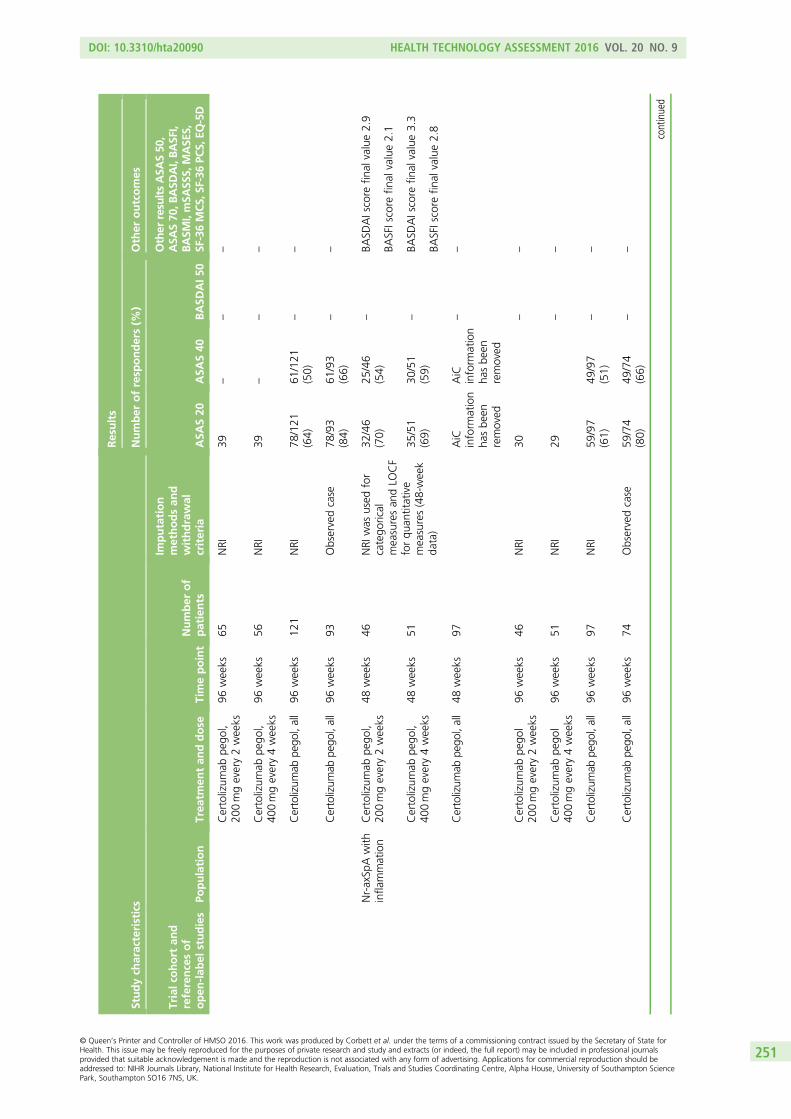
Studych
aracteristics
Results
Number
ofresp
onders(%
)Other
outcomes
Trialco
hort
and
referencesof
open
-lab
elstudies
Population
Trea
tmen
tan
ddose
Timepoint
Number
of
patients
Imputation
methodsan
dwithdrawal
criteria
ASA
S20
ASA
S40
BASD
AI50
Other
resu
ltsASA
S50
,ASA
S70
,BASD
AI,BASF
I,BASM
I,mSA
SSS,
MASE
S,SF
-36MCS,
SF-36PC
S,EQ
-5D
Certolizum
abpe
gol,
200mgevery2weeks
96weeks
65NRI
39–
––
Certolizum
abpe
gol,
400mgevery4weeks
96weeks
56NRI
39–
––
Certolizum
abpe
gol,all
96weeks
121
NRI
78/121
(64)
61/121
(50)
––
Certolizum
abpe
gol,all
96weeks
93Observedcase
78/93
(84)
61/93
(66)
––
Nr-axSp
Awith
infla
mmation
Certolizum
abpe
gol,
200mgevery2weeks
48weeks
46NRI
was
used
for
catego
rical
measuresan
dLO
CF
forqu
antitative
measures(48-week
data)
32/46
(70)
25/46
(54)
–BA
SDAIscore
final
value2.9
BASFIscore
final
value2.1
Certolizum
abpe
gol,
400mgevery4weeks
48weeks
5135
/51
(69)
30/51
(59)
–BA
SDAIscore
final
value3.3
BASFIscore
final
value2.8
Certolizum
abpe
gol,all
48weeks
97AiC
inform
ation
hasbe
enremoved
AiC
inform
ation
hasbe
enremoved
––
Certolizum
abpe
gol
200mgevery2weeks
96weeks
46NRI
30–
–
Certolizum
abpe
gol
400mgevery4weeks
96weeks
51NRI
29–
–
Certolizum
abpe
gol,all
96weeks
97NRI
59/97
(61)
49/97
(51)
––
Certolizum
abpe
gol,all
96weeks
74Observedcase
59/74
(80)
49/74
(66)
––
continued
DOI: 10.3310/hta20090 HEALTH TECHNOLOGY ASSESSMENT 2016 VOL. 20 NO. 9
© Queen’s Printer and Controller of HMSO 2016. This work was produced by Corbett et al. under the terms of a commissioning contract issued by the Secretary of State forHealth. This issue may be freely reproduced for the purposes of private research and study and extracts (or indeed, the full report) may be included in professional journalsprovided that suitable acknowledgement is made and the reproduction is not associated with any form of advertising. Applications for commercial reproduction should beaddressed to: NIHR Journals Library, National Institute for Health Research, Evaluation, Trials and Studies Coordinating Centre, Alpha House, University of Southampton SciencePark, Southampton SO16 7NS, UK.
251
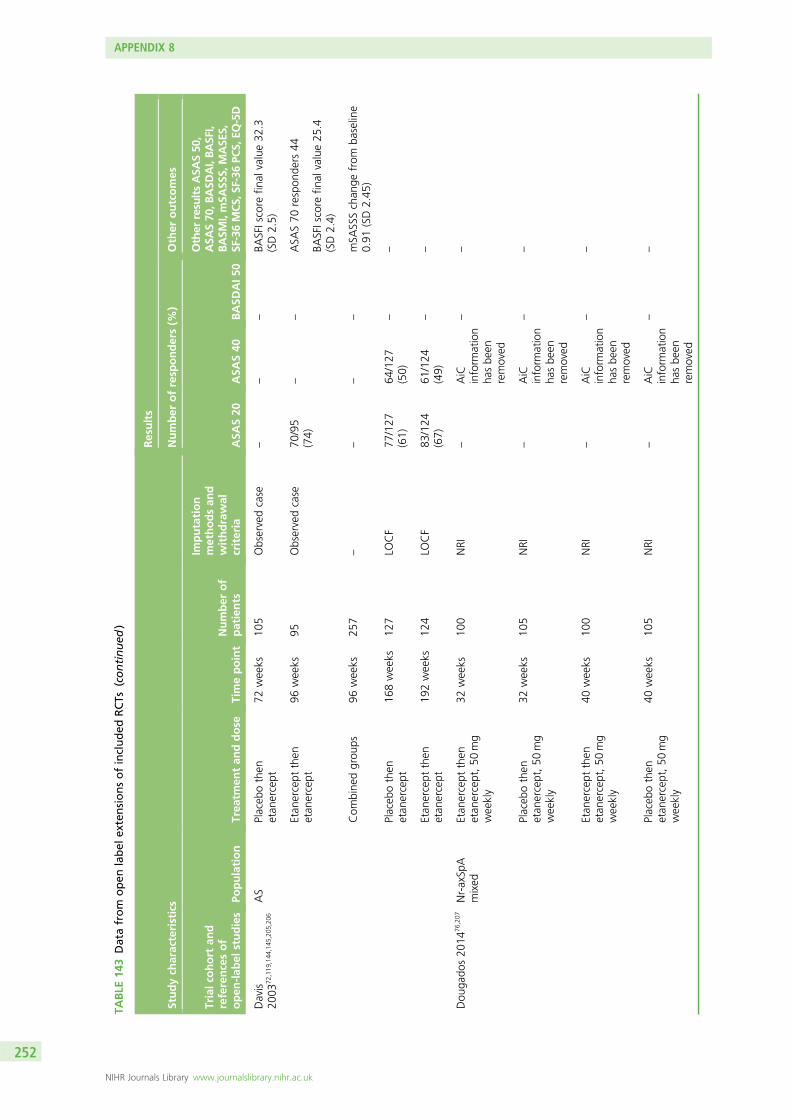
TABLE
143
Datafrom
open
label
extensionsofincluded
RCTs
(continued
)
Studych
aracteristics
Results
Number
ofresp
onders(%
)Other
outcomes
Trialco
hort
and
referencesof
open
-lab
elstudies
Population
Trea
tmen
tan
ddose
Timepoint
Number
of
patients
Imputation
methodsan
dwithdrawal
criteria
ASA
S20
ASA
S40
BASD
AI50
Other
resu
ltsASA
S50
,ASA
S70
,BASD
AI,BASF
I,BASM
I,mSA
SSS,
MASE
S,SF
-36MCS,
SF-36PC
S,EQ
-5D
Davis
2003
72,119
,144
,145
,205
,206
AS
Placeb
othen
etan
ercept
72weeks
105
Observedcase
––
–BA
SFIscore
final
value32
.3(SD2.5)
Etan
ercept
then
etan
ercept
96weeks
95Observedcase
70/95
(74)
––
ASA
S70
respon
ders
44
BASFIscore
final
value25
.4(SD2.4)
Com
bine
dgrou
ps96
weeks
257
––
––
mSA
SSSchan
gefrom
baseline
0.91
(SD2.45
)
Placeb
othen
etan
ercept
168weeks
127
LOCF
77/127
(61)
64/127
(50)
––
Etan
ercept
then
etan
ercept
192weeks
124
LOCF
83/124
(67)
61/124
(49)
––
Dou
gado
s20
1476
,207
Nr-axSp
Amixed
Etan
ercept
then
etan
ercept,50
mg
weekly
32weeks
100
NRI
–AiC
inform
ation
hasbe
enremoved
––
Placeb
othen
etan
ercept,50
mg
weekly
32weeks
105
NRI
–AiC
inform
ation
hasbe
enremoved
––
Etan
ercept
then
etan
ercept,50
mg
weekly
40weeks
100
NRI
–AiC
inform
ation
hasbe
enremoved
––
Placeb
othen
etan
ercept,50
mg
weekly
40weeks
105
NRI
–AiC
inform
ation
hasbe
enremoved
––
APPENDIX 8
NIHR Journals Library www.journalslibrary.nihr.ac.uk
252
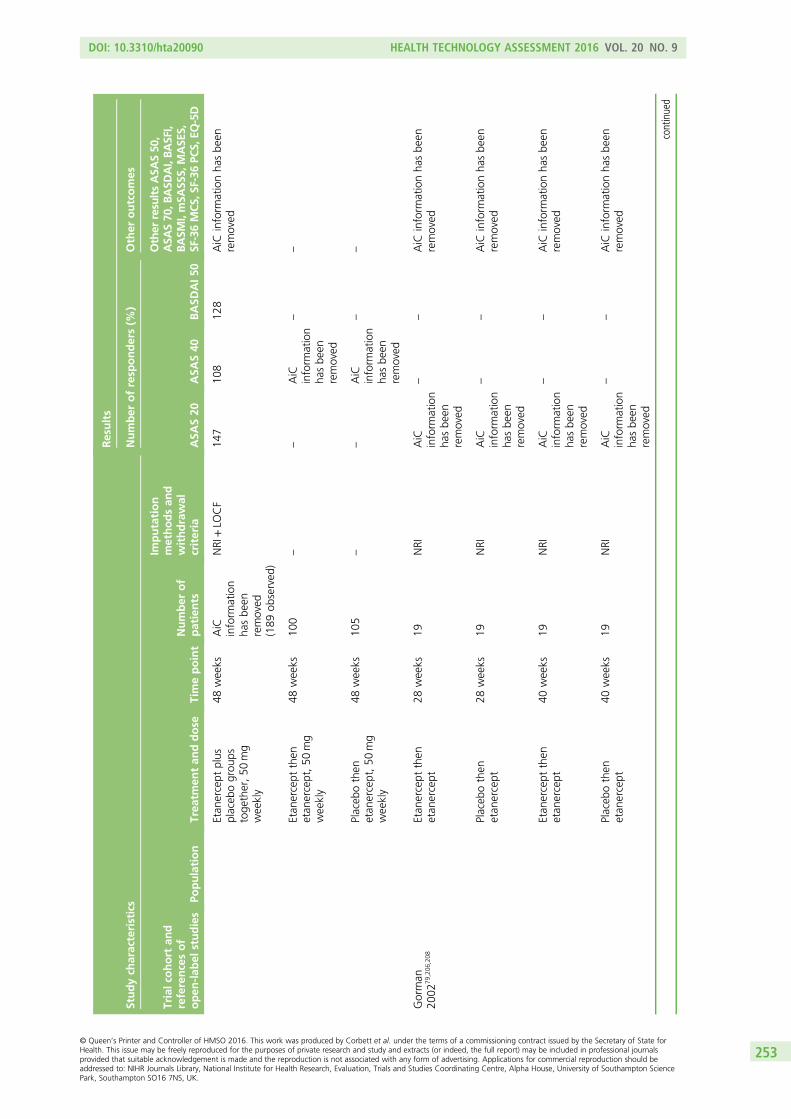
Studych
aracteristics
Results
Number
ofresp
onders(%
)Other
outcomes
Trialco
hort
and
referencesof
open
-lab
elstudies
Population
Trea
tmen
tan
ddose
Timepoint
Number
of
patients
Imputation
methodsan
dwithdrawal
criteria
ASA
S20
ASA
S40
BASD
AI50
Other
resu
ltsASA
S50
,ASA
S70
,BASD
AI,BASF
I,BASM
I,mSA
SSS,
MASE
S,SF
-36MCS,
SF-36PC
S,EQ
-5D
Etan
ercept
plus
placeb
ogrou
pstoge
ther,50
mg
weekly
48weeks
AiC
inform
ation
hasbe
enremoved
(189
observed
)
NRI+LO
CF
147
108
128
AiC
inform
ationha
sbe
enremoved
Etan
ercept
then
etan
ercept,50
mg
weekly
48weeks
100
––
AiC
inform
ation
hasbe
enremoved
––
Placeb
othen
etan
ercept,50
mg
weekly
48weeks
105
––
AiC
inform
ation
hasbe
enremoved
––
Gorman
2002
79,206
,208
Etan
ercept
then
etan
ercept
28weeks
19NRI
AiC
inform
ation
hasbe
enremoved
––
AiC
inform
ationha
sbe
enremoved
Placeb
othen
etan
ercept
28weeks
19NRI
AiC
inform
ation
hasbe
enremoved
––
AiC
inform
ationha
sbe
enremoved
Etan
ercept
then
etan
ercept
40weeks
19NRI
AiC
inform
ation
hasbe
enremoved
––
AiC
inform
ationha
sbe
enremoved
Placeb
othen
etan
ercept
40weeks
19NRI
AiC
inform
ation
hasbe
enremoved
––
AiC
inform
ationha
sbe
enremoved
continued
DOI: 10.3310/hta20090 HEALTH TECHNOLOGY ASSESSMENT 2016 VOL. 20 NO. 9
© Queen’s Printer and Controller of HMSO 2016. This work was produced by Corbett et al. under the terms of a commissioning contract issued by the Secretary of State forHealth. This issue may be freely reproduced for the purposes of private research and study and extracts (or indeed, the full report) may be included in professional journalsprovided that suitable acknowledgement is made and the reproduction is not associated with any form of advertising. Applications for commercial reproduction should beaddressed to: NIHR Journals Library, National Institute for Health Research, Evaluation, Trials and Studies Coordinating Centre, Alpha House, University of Southampton SciencePark, Southampton SO16 7NS, UK.
253
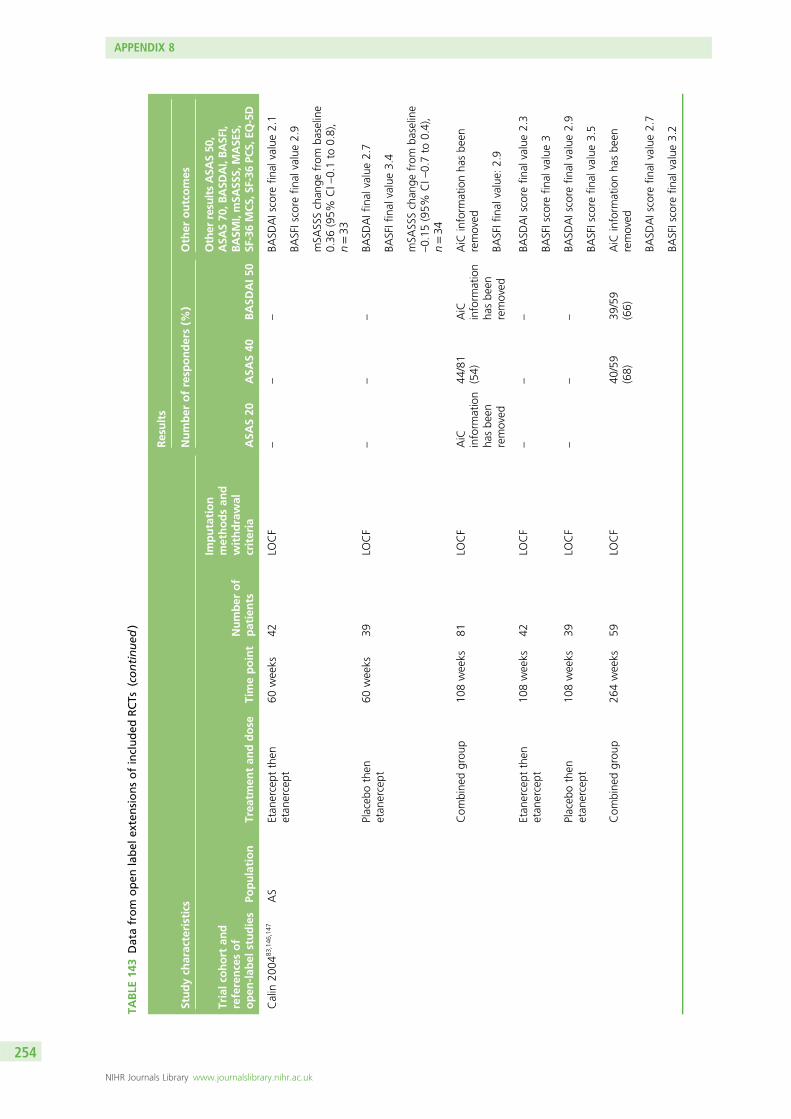
TABLE
143
Datafrom
open
label
extensionsofincluded
RCTs
(continued
)
Studych
aracteristics
Results
Number
ofresp
onders(%
)Other
outcomes
Trialco
hort
and
referencesof
open
-lab
elstudies
Population
Trea
tmen
tan
ddose
Timepoint
Number
of
patients
Imputation
methodsan
dwithdrawal
criteria
ASA
S20
ASA
S40
BASD
AI50
Other
resu
ltsASA
S50
,ASA
S70
,BASD
AI,BASF
I,BASM
I,mSA
SSS,
MASE
S,SF
-36MCS,
SF-36PC
S,EQ
-5D
Calin
2004
83,146
,147
AS
Etan
ercept
then
etan
ercept
60weeks
42LO
CF
––
–BA
SDAIscore
final
value2.1
BASFIscore
final
value2.9
mSA
SSSchan
gefrom
baseline
0.36
(95%
CI–
0.1to
0.8),
n=33
Placeb
othen
etan
ercept
60weeks
39LO
CF
––
–BA
SDAIfinal
value2.7
BASFIfinal
value3.4
mSA
SSSchan
gefrom
baseline
–0.15
(95%
CI–
0.7to
0.4),
n=34
Com
bine
dgrou
p10
8weeks
81LO
CF
AiC
inform
ation
hasbe
enremoved
44/81
(54)
AiC
inform
ation
hasbe
enremoved
AiC
inform
ationha
sbe
enremoved
BASFIfinal
value:
2.9
Etan
ercept
then
etan
ercept
108weeks
42LO
CF
––
–BA
SDAIscore
final
value2.3
BASFIscore
final
value3
Placeb
othen
etan
ercept
108weeks
39LO
CF
––
–BA
SDAIscore
final
value2.9
BASFIscore
final
value3.5
Com
bine
dgrou
p26
4weeks
59LO
CF
40/59
(68)
39/59
(66)
AiC
inform
ationha
sbe
enremoved
BASD
AIscore
final
value2.7
BASFIscore
final
value3.2
APPENDIX 8
NIHR Journals Library www.journalslibrary.nihr.ac.uk
254
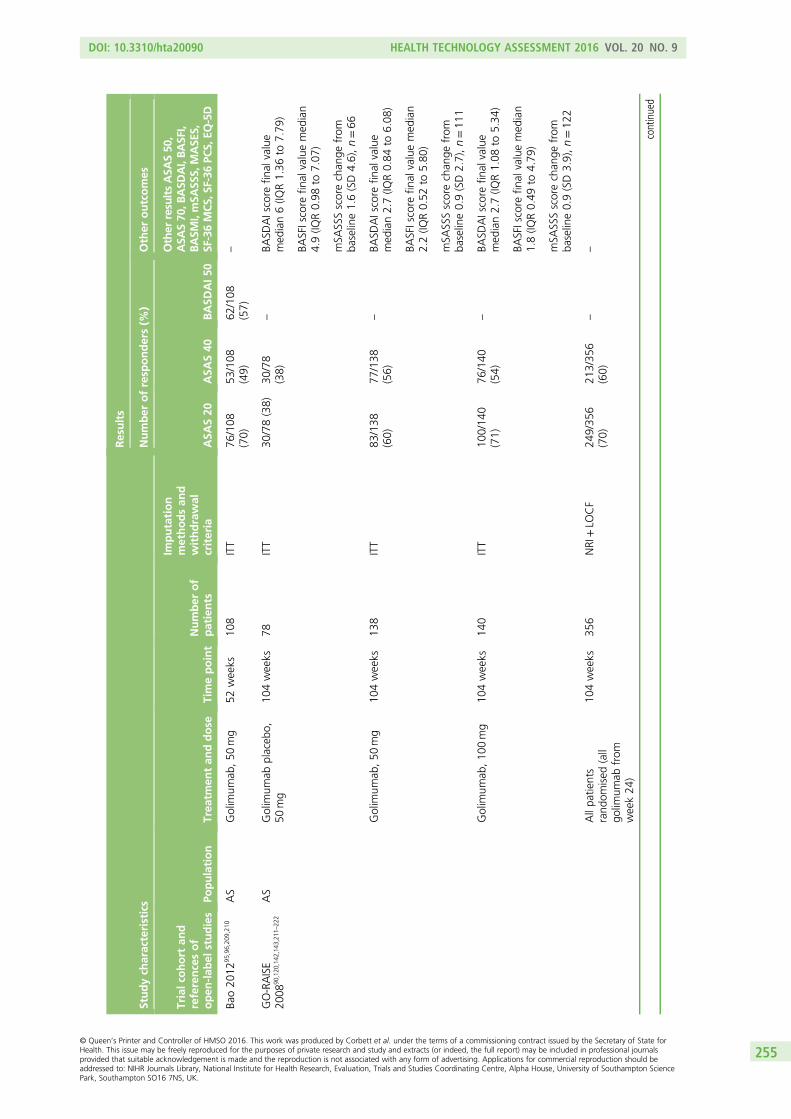
Studych
aracteristics
Results
Number
ofresp
onders(%
)Other
outcomes
Trialco
hort
and
referencesof
open
-lab
elstudies
Population
Trea
tmen
tan
ddose
Timepoint
Number
of
patients
Imputation
methodsan
dwithdrawal
criteria
ASA
S20
ASA
S40
BASD
AI50
Other
resu
ltsASA
S50
,ASA
S70
,BASD
AI,BASF
I,BASM
I,mSA
SSS,
MASE
S,SF
-36MCS,
SF-36PC
S,EQ
-5D
Bao20
1295
,96,209
,210
AS
Golim
umab
,50
mg
52weeks
108
ITT
76/108
(70)
53/108
(49)
62/108
(57)
–
GO-RAISE
2008
90,120
,142
,143
,211
–22
2AS
Golim
umab
placeb
o,50
mg
104weeks
78ITT
30/78(38)
30/78
(38)
–BA
SDAIscore
final
value
med
ian6(IQ
R1.36
to7.79
)
BASFIscore
final
valuemed
ian
4.9(IQ
R0.98
to7.07
)
mSA
SSSscorechan
gefrom
baseline1.6(SD4.6),n=66
Golim
umab
,50
mg
104weeks
138
ITT
83/138
(60)
77/138
(56)
–BA
SDAIscore
final
value
med
ian2.7(IQ
R0.84
to6.08
)
BASFIscore
final
valuemed
ian
2.2(IQ
R0.52
to5.80
)
mSA
SSSscorechan
gefrom
baseline0.9(SD2.7),n=11
1
Golim
umab
,10
0mg
104weeks
140
ITT
100/14
0(71)
76/140
(54)
–BA
SDAIscore
final
value
med
ian2.7(IQ
R1.08
to5.34
)
BASFIscore
final
valuemed
ian
1.8(IQ
R0.49
to4.79
)
mSA
SSSscorechan
gefrom
baseline0.9(SD3.9),n=12
2
Allpa
tients
rand
omised
(all
golim
umab
from
week24
)
104weeks
356
NRI+LO
CF
249/35
6(70)
213/35
6(60)
––
continued
DOI: 10.3310/hta20090 HEALTH TECHNOLOGY ASSESSMENT 2016 VOL. 20 NO. 9
© Queen’s Printer and Controller of HMSO 2016. This work was produced by Corbett et al. under the terms of a commissioning contract issued by the Secretary of State forHealth. This issue may be freely reproduced for the purposes of private research and study and extracts (or indeed, the full report) may be included in professional journalsprovided that suitable acknowledgement is made and the reproduction is not associated with any form of advertising. Applications for commercial reproduction should beaddressed to: NIHR Journals Library, National Institute for Health Research, Evaluation, Trials and Studies Coordinating Centre, Alpha House, University of Southampton SciencePark, Southampton SO16 7NS, UK.
255
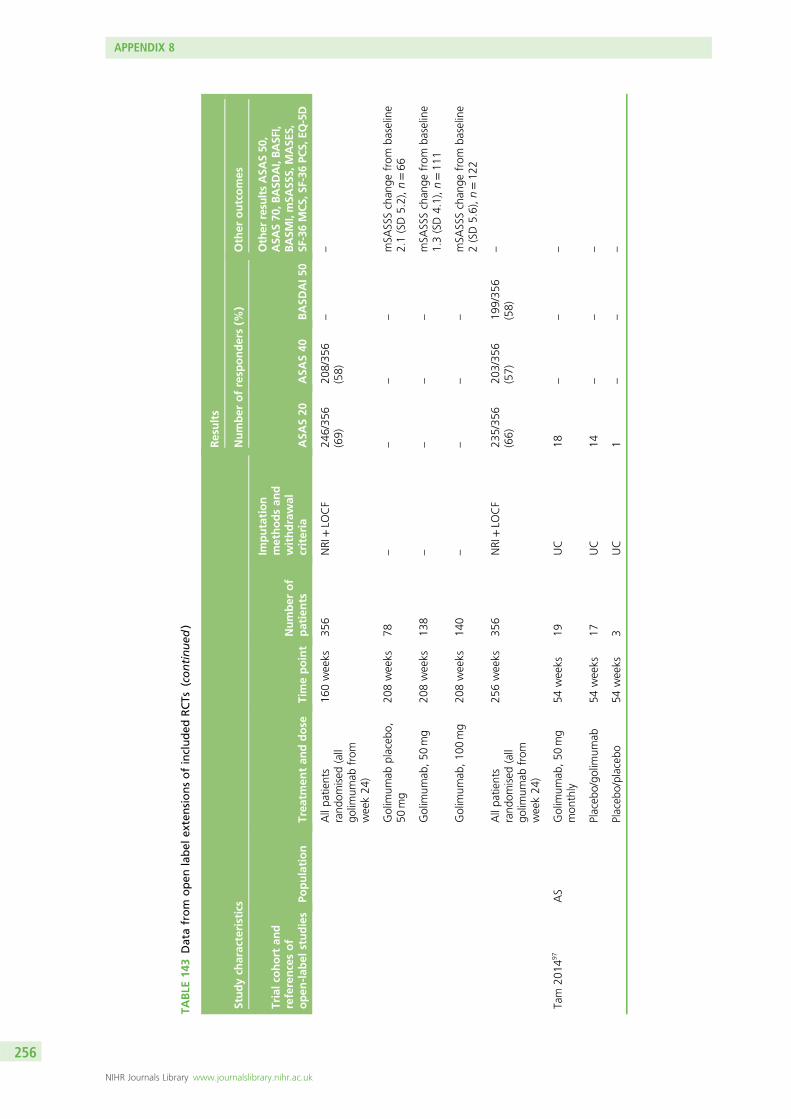
TABLE
143
Datafrom
open
label
extensionsofincluded
RCTs
(continued
)
Studych
aracteristics
Results
Number
ofresp
onders(%
)Other
outcomes
Trialco
hort
and
referencesof
open
-lab
elstudies
Population
Trea
tmen
tan
ddose
Timepoint
Number
of
patients
Imputation
methodsan
dwithdrawal
criteria
ASA
S20
ASA
S40
BASD
AI50
Other
resu
ltsASA
S50
,ASA
S70
,BASD
AI,BASF
I,BASM
I,mSA
SSS,
MASE
S,SF
-36MCS,
SF-36PC
S,EQ
-5D
Allpa
tients
rand
omised
(all
golim
umab
from
week24
)
160weeks
356
NRI+LO
CF
246/35
6(69)
208/35
6(58)
––
Golim
umab
placeb
o,50
mg
208weeks
78–
––
–mSA
SSSchan
gefrom
baseline
2.1(SD5.2),n=66
Golim
umab
,50
mg
208weeks
138
––
––
mSA
SSSchan
gefrom
baseline
1.3(SD4.1),n=11
1
Golim
umab
,10
0mg
208weeks
140
––
––
mSA
SSSchan
gefrom
baseline
2(SD5.6),n=12
2
Allpa
tients
rand
omised
(all
golim
umab
from
week24
)
256weeks
356
NRI+LO
CF
235/35
6(66)
203/35
6(57)
199/35
6(58)
–
Tam
2014
97AS
Golim
umab
,50
mg
mon
thly
54weeks
19UC
18–
––
Placeb
o/go
limum
ab54
weeks
17UC
14–
––
Placeb
o/placeb
o54
weeks
3UC
1–
––
APPENDIX 8
NIHR Journals Library www.journalslibrary.nihr.ac.uk
256
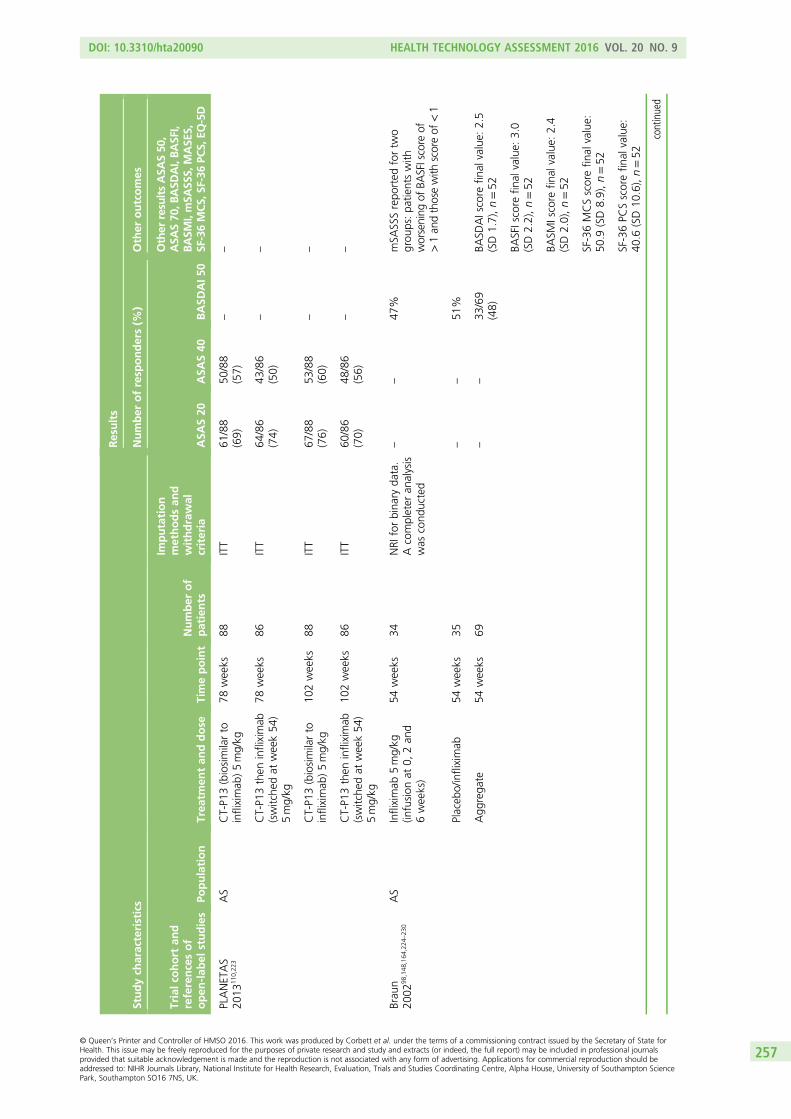
Studych
aracteristics
Results
Number
ofresp
onders(%
)Other
outcomes
Trialco
hort
and
referencesof
open
-lab
elstudies
Population
Trea
tmen
tan
ddose
Timepoint
Number
of
patients
Imputation
methodsan
dwithdrawal
criteria
ASA
S20
ASA
S40
BASD
AI50
Other
resu
ltsASA
S50
,ASA
S70
,BASD
AI,BASF
I,BASM
I,mSA
SSS,
MASE
S,SF
-36MCS,
SF-36PC
S,EQ
-5D
PLANETAS
2013
110 ,22
3AS
CT-P1
3(biosimilarto
infliximab
)5mg/kg
78weeks
88ITT
61/88
(69)
50/88
(57)
––
CT-P1
3then
infliximab
(switche
dat
week54
)5mg/kg
78weeks
86ITT
64/86
(74)
43/86
(50)
––
CT-P1
3(biosimilarto
infliximab
)5mg/kg
102weeks
88ITT
67/88
(76)
53/88
(60)
––
CT-P1
3then
infliximab
(switche
dat
week54
)5mg/kg
102weeks
86ITT
60/86
(70)
48/86
(56)
––
Brau
n20
0298
,148
,164
,224
–23
0AS
Infliximab
5mg/kg
(infusion
at0,
2an
d6weeks)
54weeks
34NRI
forbina
ryda
ta.
Acompleter
analysis
was
cond
ucted
––
47%
mSA
SSSrepo
rted
fortw
ogrou
ps:pa
tientswith
worsening
ofBA
SFIscore
of>1an
dthosewith
scoreof
<1
Placeb
o/infliximab
54weeks
35–
–51
%
Agg
rega
te54
weeks
69–
–33
/69
(48)
BASD
AIscore
final
value:
2.5
(SD1.7),n=52
BASFIscore
final
value:
3.0
(SD2.2),n=52
BASM
Iscore
final
value:
2.4
(SD2.0),n=52
SF-36MCSscorefin
alvalue:
50.9
(SD8.9),n=52
SF-36PC
Sscorefin
alvalue:
40.6
(SD10
.6),n=52
continued
DOI: 10.3310/hta20090 HEALTH TECHNOLOGY ASSESSMENT 2016 VOL. 20 NO. 9
© Queen’s Printer and Controller of HMSO 2016. This work was produced by Corbett et al. under the terms of a commissioning contract issued by the Secretary of State forHealth. This issue may be freely reproduced for the purposes of private research and study and extracts (or indeed, the full report) may be included in professional journalsprovided that suitable acknowledgement is made and the reproduction is not associated with any form of advertising. Applications for commercial reproduction should beaddressed to: NIHR Journals Library, National Institute for Health Research, Evaluation, Trials and Studies Coordinating Centre, Alpha House, University of Southampton SciencePark, Southampton SO16 7NS, UK.
257
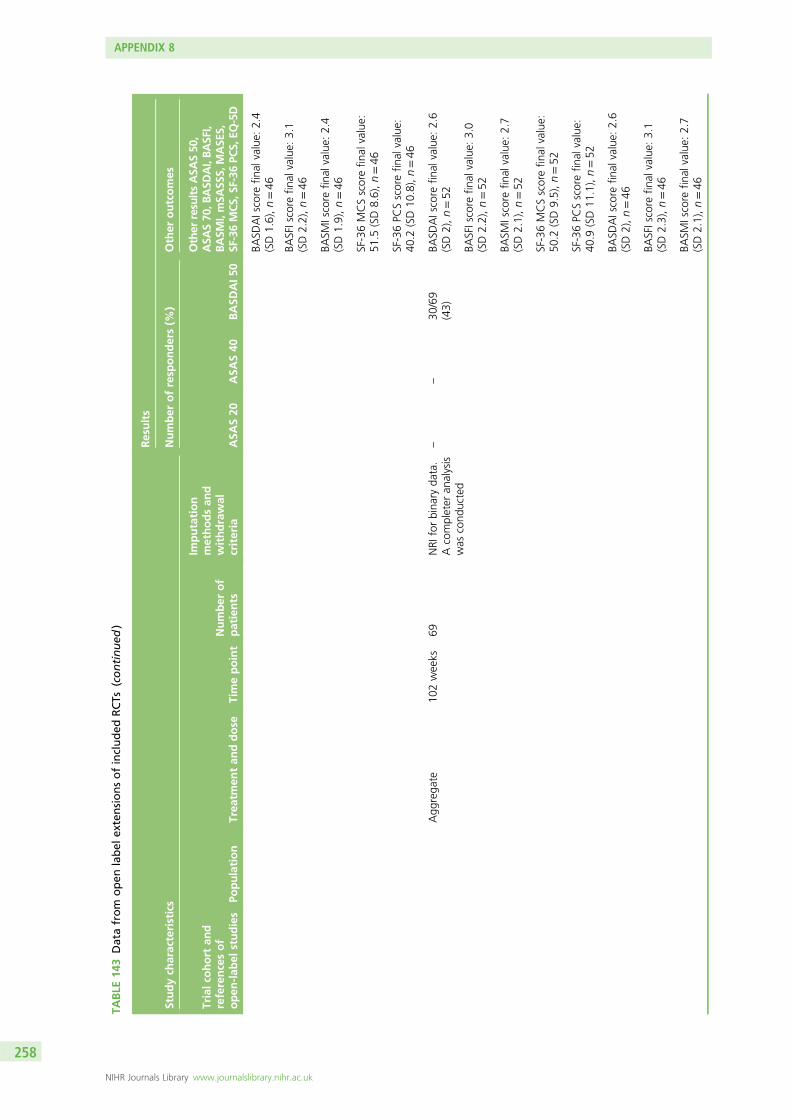
TABLE
143
Datafrom
open
label
extensionsofincluded
RCTs
(continued
)
Studych
aracteristics
Results
Number
ofresp
onders(%
)Other
outcomes
Trialco
hort
and
referencesof
open
-lab
elstudies
Population
Trea
tmen
tan
ddose
Timepoint
Number
of
patients
Imputation
methodsan
dwithdrawal
criteria
ASA
S20
ASA
S40
BASD
AI50
Other
resu
ltsASA
S50
,ASA
S70
,BASD
AI,BASF
I,BASM
I,mSA
SSS,
MASE
S,SF
-36MCS,
SF-36PC
S,EQ
-5D
BASD
AIscore
final
value:
2.4
(SD1.6),n=46
BASFIscore
final
value:
3.1
(SD2.2),n=46
BASM
Iscore
final
value:
2.4
(SD1.9),n=46
SF-36MCSscorefin
alvalue:
51.5
(SD8.6),n=46
SF-36PC
Sscorefin
alvalue:
40.2
(SD10
.8),n=46
Agg
rega
te10
2weeks
69NRI
forbina
ryda
ta.
Acompleter
analysis
was
cond
ucted
––
30/69
(43)
BASD
AIscore
final
value:
2.6
(SD2),n=52
BASFIscore
final
value:
3.0
(SD2.2),n=52
BASM
Iscore
final
value:
2.7
(SD2.1),n=52
SF-36MCSscorefin
alvalue:
50.2
(SD9.5),n=52
SF-36PC
Sscorefin
alvalue:
40.9
(SD11
.1),n=52
BASD
AIscore
final
value:
2.6
(SD2),n=46
BASFIscore
final
value:
3.1
(SD2.3),n=46
BASM
Iscore
final
value:
2.7
(SD2.1),n=46
APPENDIX 8
NIHR Journals Library www.journalslibrary.nihr.ac.uk
258
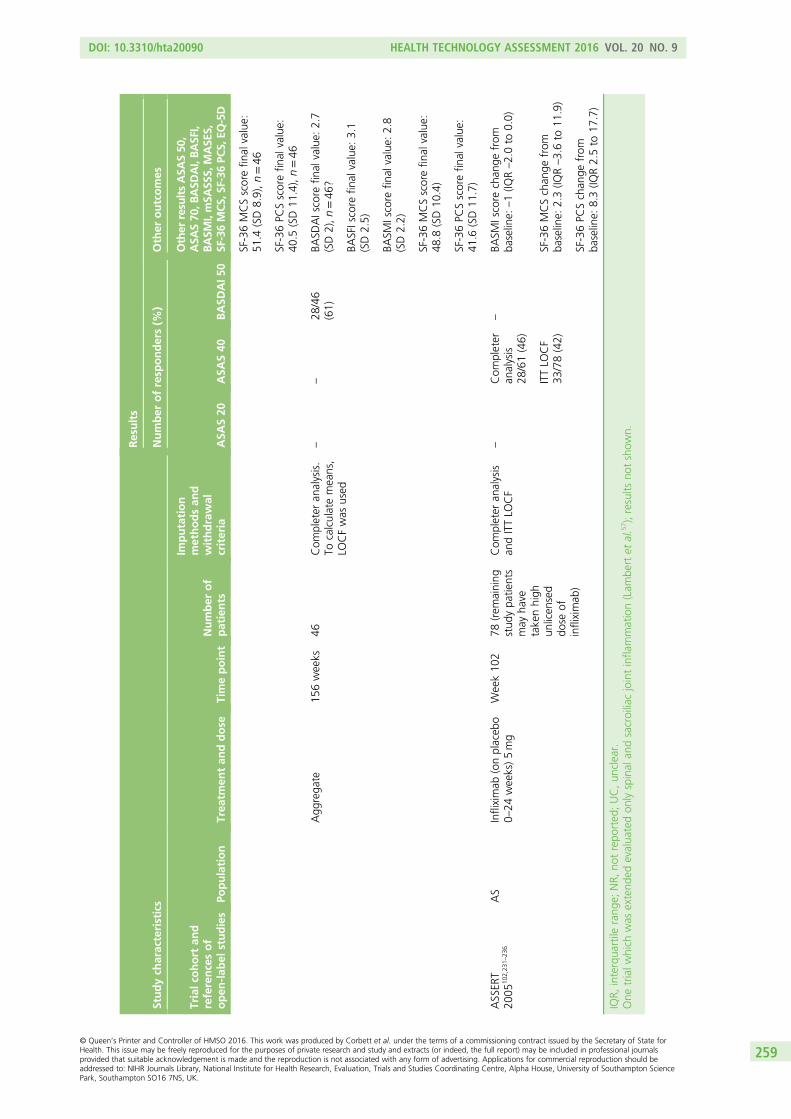
Studych
aracteristics
Results
Number
ofresp
onders(%
)Other
outcomes
Trialco
hort
and
referencesof
open
-lab
elstudies
Population
Trea
tmen
tan
ddose
Timepoint
Number
of
patients
Imputation
methodsan
dwithdrawal
criteria
ASA
S20
ASA
S40
BASD
AI50
Other
resu
ltsASA
S50
,ASA
S70
,BASD
AI,BASF
I,BASM
I,mSA
SSS,
MASE
S,SF
-36MCS,
SF-36PC
S,EQ
-5D
SF-36MCSscorefin
alvalue:
51.4
(SD8.9),n=46
SF-36PC
Sscorefin
alvalue:
40.5
(SD11
.4),n=46
Agg
rega
te15
6weeks
46Com
pleter
analysis.
Tocalculatemeans,
LOCFwas
used
––
28/46
(61)
BASD
AIscore
final
value:
2.7
(SD2),n=46
?
BASFIscore
final
value:
3.1
(SD2.5)
BASM
Iscore
final
value:
2.8
(SD2.2)
SF-36MCSscorefin
alvalue:
48.8
(SD10
.4)
SF-36PC
Sscorefin
alvalue:
41.6
(SD11
.7)
ASSER
T20
0510
2 ,23
1–23
6AS
Infliximab
(onplaceb
o0–
24weeks)5mg
Week10
278
(rem
aining
stud
ypa
tients
may
have
takenhigh
unlicen
sed
dose
ofinfliximab
)
Com
pleter
analysis
andITTLO
CF
–Com
pleter
analysis
28/61(46)
–BA
SMIscore
chan
gefrom
baseline:
–1(IQ
R–2.0to
0.0)
ITTLO
CF
33/78(42)
SF-36MCSchan
gefrom
baseline:
2.3(IQ
R–3.6to
11.9)
SF-36PC
Schan
gefrom
baseline:
8.3(IQ
R2.5to
17.7)
IQR,
interqua
rtile
rang
e;NR,
notrepo
rted
;UC,un
clear.
One
trialw
hich
was
extend
edevalua
tedon
lyspinal
andsacroiliacjointinfla
mmation(Lam
bertet
al.5
7 );results
notshow
n.
DOI: 10.3310/hta20090 HEALTH TECHNOLOGY ASSESSMENT 2016 VOL. 20 NO. 9
© Queen’s Printer and Controller of HMSO 2016. This work was produced by Corbett et al. under the terms of a commissioning contract issued by the Secretary of State forHealth. This issue may be freely reproduced for the purposes of private research and study and extracts (or indeed, the full report) may be included in professional journalsprovided that suitable acknowledgement is made and the reproduction is not associated with any form of advertising. Applications for commercial reproduction should beaddressed to: NIHR Journals Library, National Institute for Health Research, Evaluation, Trials and Studies Coordinating Centre, Alpha House, University of Southampton SciencePark, Southampton SO16 7NS, UK.
259

Appendix 9 Adverse events
DOI: 10.3310/hta20090 HEALTH TECHNOLOGY ASSESSMENT 2016 VOL. 20 NO. 9
© Queen’s Printer and Controller of HMSO 2016. This work was produced by Corbett et al. under the terms of a commissioning contract issued by the Secretary of State forHealth. This issue may be freely reproduced for the purposes of private research and study and extracts (or indeed, the full report) may be included in professional journalsprovided that suitable acknowledgement is made and the reproduction is not associated with any form of advertising. Applications for commercial reproduction should beaddressed to: NIHR Journals Library, National Institute for Health Research, Evaluation, Trials and Studies Coordinating Centre, Alpha House, University of Southampton SciencePark, Southampton SO16 7NS, UK.
261
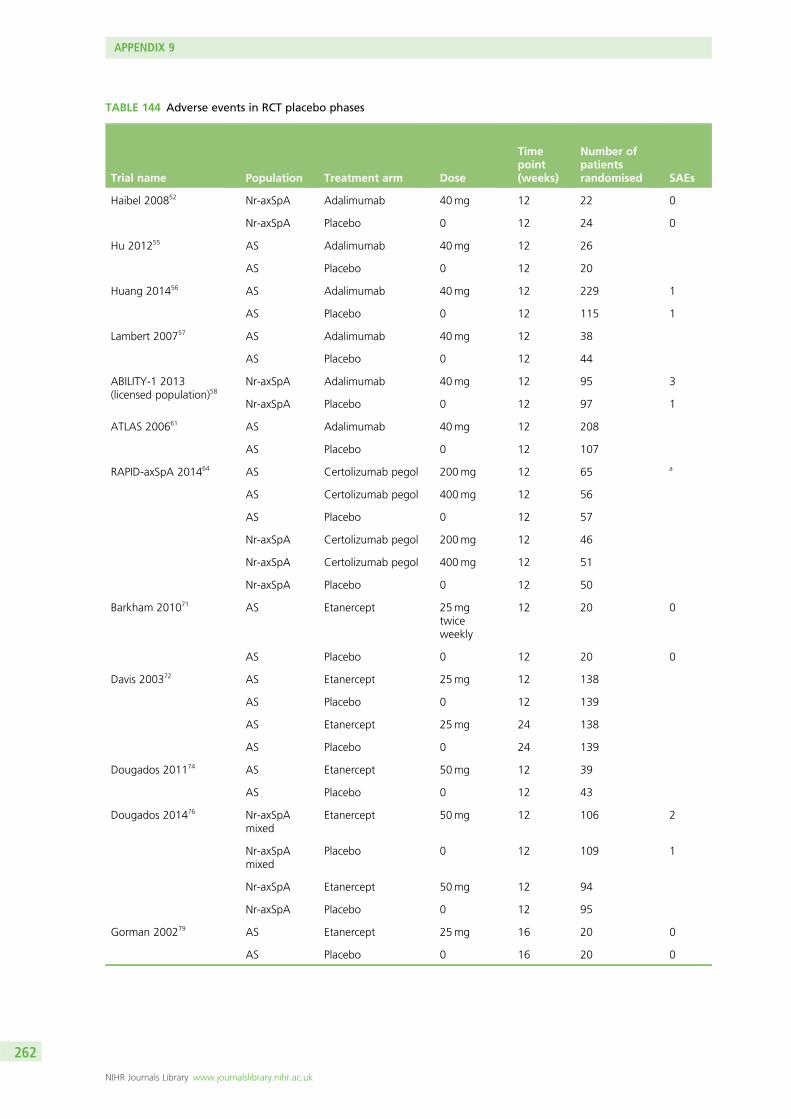
TABLE 144 Adverse events in RCT placebo phases
Trial name Population Treatment arm Dose
Timepoint(weeks)
Number ofpatientsrandomised SAEs
Haibel 200852 Nr-axSpA Adalimumab 40mg 12 22 0
Nr-axSpA Placebo 0 12 24 0
Hu 201255 AS Adalimumab 40mg 12 26
AS Placebo 0 12 20
Huang 201456 AS Adalimumab 40mg 12 229 1
AS Placebo 0 12 115 1
Lambert 200757 AS Adalimumab 40mg 12 38
AS Placebo 0 12 44
ABILITY-1 2013(licensed population)58
Nr-axSpA Adalimumab 40mg 12 95 3
Nr-axSpA Placebo 0 12 97 1
ATLAS 200661 AS Adalimumab 40mg 12 208
AS Placebo 0 12 107
RAPID-axSpA 201464 AS Certolizumab pegol 200mg 12 65 a
AS Certolizumab pegol 400mg 12 56
AS Placebo 0 12 57
Nr-axSpA Certolizumab pegol 200mg 12 46
Nr-axSpA Certolizumab pegol 400mg 12 51
Nr-axSpA Placebo 0 12 50
Barkham 201071 AS Etanercept 25mgtwiceweekly
12 20 0
AS Placebo 0 12 20 0
Davis 200372 AS Etanercept 25mg 12 138
AS Placebo 0 12 139
AS Etanercept 25mg 24 138
AS Placebo 0 24 139
Dougados 201174 AS Etanercept 50mg 12 39
AS Placebo 0 12 43
Dougados 201476 Nr-axSpAmixed
Etanercept 50mg 12 106 2
Nr-axSpAmixed
Placebo 0 12 109 1
Nr-axSpA Etanercept 50mg 12 94
Nr-axSpA Placebo 0 12 95
Gorman 200279 AS Etanercept 25mg 16 20 0
AS Placebo 0 16 20 0
APPENDIX 9
NIHR Journals Library www.journalslibrary.nihr.ac.uk
262
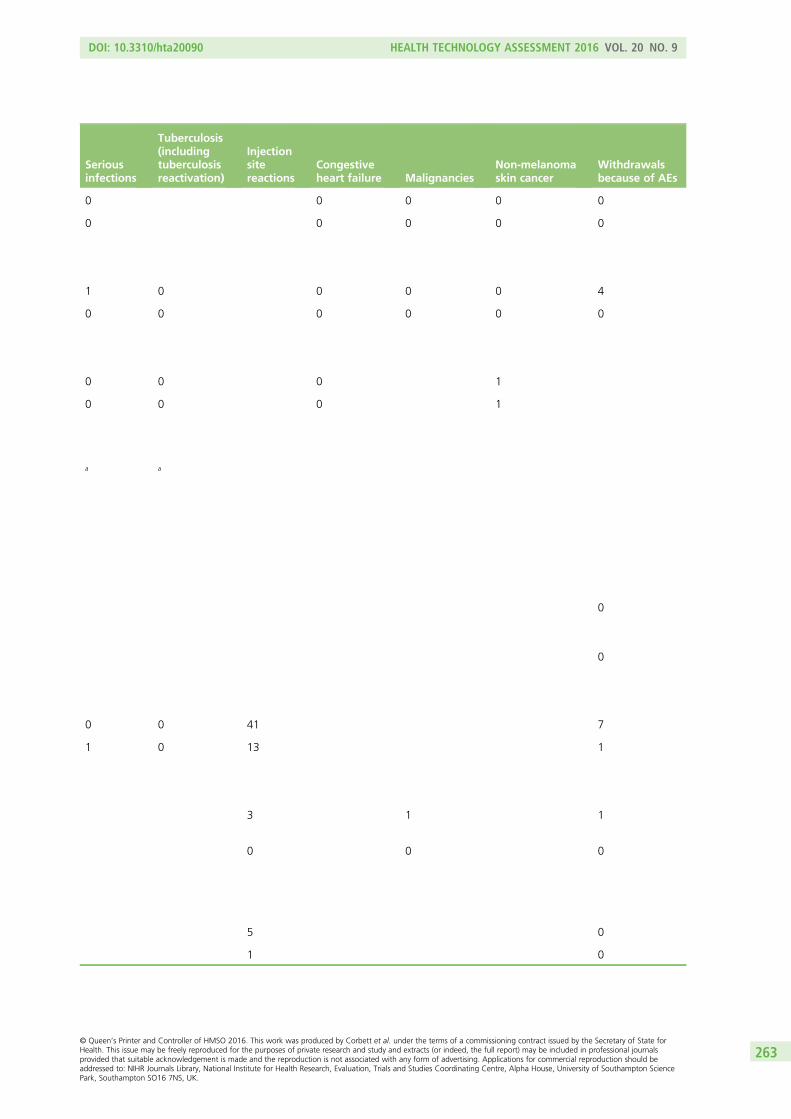
Seriousinfections
Tuberculosis(includingtuberculosisreactivation)
Injectionsitereactions
Congestiveheart failure Malignancies
Non-melanomaskin cancer
Withdrawalsbecause of AEs
0 0 0 0 0
0 0 0 0 0
1 0 0 0 0 4
0 0 0 0 0 0
0 0 0 1
0 0 0 1
a a
0
0
0 0 41 7
1 0 13 1
3 1 1
0 0 0
5 0
1 0
DOI: 10.3310/hta20090 HEALTH TECHNOLOGY ASSESSMENT 2016 VOL. 20 NO. 9
© Queen’s Printer and Controller of HMSO 2016. This work was produced by Corbett et al. under the terms of a commissioning contract issued by the Secretary of State forHealth. This issue may be freely reproduced for the purposes of private research and study and extracts (or indeed, the full report) may be included in professional journalsprovided that suitable acknowledgement is made and the reproduction is not associated with any form of advertising. Applications for commercial reproduction should beaddressed to: NIHR Journals Library, National Institute for Health Research, Evaluation, Trials and Studies Coordinating Centre, Alpha House, University of Southampton SciencePark, Southampton SO16 7NS, UK.
263
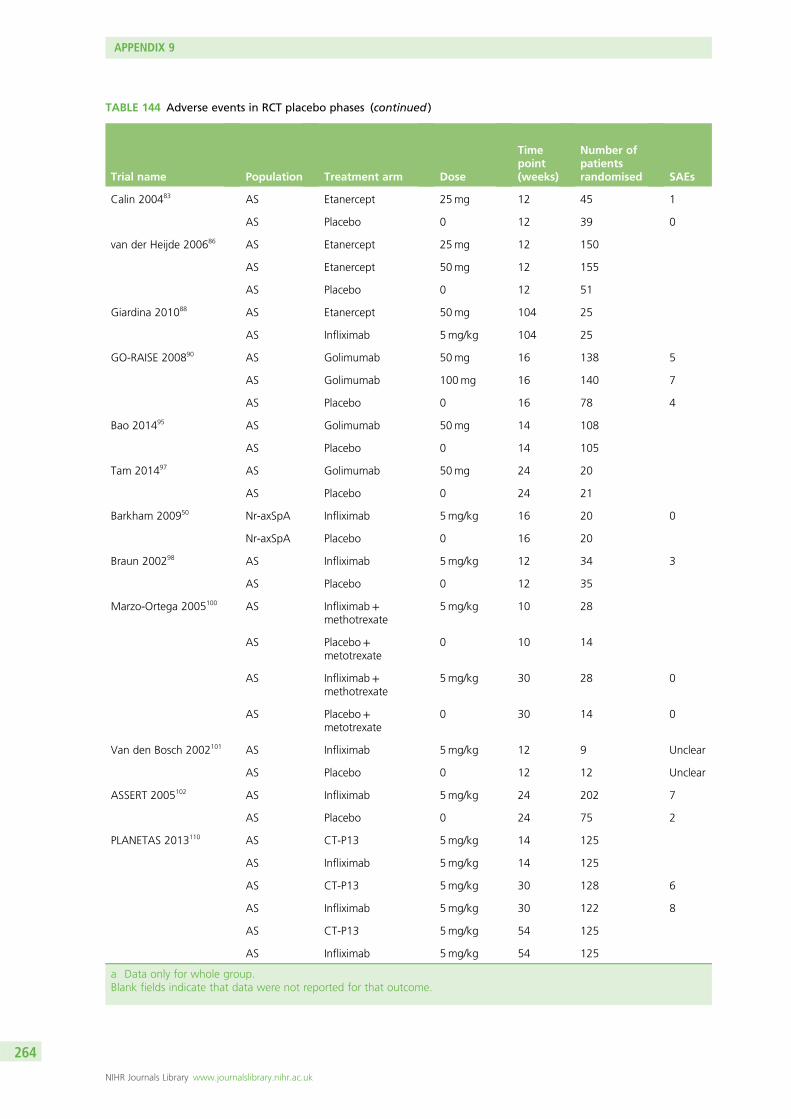
TABLE 144 Adverse events in RCT placebo phases (continued )
Trial name Population Treatment arm Dose
Timepoint(weeks)
Number ofpatientsrandomised SAEs
Calin 200483 AS Etanercept 25mg 12 45 1
AS Placebo 0 12 39 0
van der Heijde 200686 AS Etanercept 25mg 12 150
AS Etanercept 50mg 12 155
AS Placebo 0 12 51
Giardina 201088 AS Etanercept 50mg 104 25
AS Infliximab 5mg/kg 104 25
GO-RAISE 200890 AS Golimumab 50mg 16 138 5
AS Golimumab 100mg 16 140 7
AS Placebo 0 16 78 4
Bao 201495 AS Golimumab 50mg 14 108
AS Placebo 0 14 105
Tam 201497 AS Golimumab 50mg 24 20
AS Placebo 0 24 21
Barkham 200950 Nr-axSpA Infliximab 5mg/kg 16 20 0
Nr-axSpA Placebo 0 16 20
Braun 200298 AS Infliximab 5mg/kg 12 34 3
AS Placebo 0 12 35
Marzo-Ortega 2005100 AS Infliximab+methotrexate
5mg/kg 10 28
AS Placebo+metotrexate
0 10 14
AS Infliximab+methotrexate
5mg/kg 30 28 0
AS Placebo+metotrexate
0 30 14 0
Van den Bosch 2002101 AS Infliximab 5mg/kg 12 9 Unclear
AS Placebo 0 12 12 Unclear
ASSERT 2005102 AS Infliximab 5mg/kg 24 202 7
AS Placebo 0 24 75 2
PLANETAS 2013110 AS CT-P13 5mg/kg 14 125
AS Infliximab 5mg/kg 14 125
AS CT-P13 5mg/kg 30 128 6
AS Infliximab 5mg/kg 30 122 8
AS CT-P13 5mg/kg 54 125
AS Infliximab 5mg/kg 54 125
a Data only for whole group.Blank fields indicate that data were not reported for that outcome.
APPENDIX 9
NIHR Journals Library www.journalslibrary.nihr.ac.uk
264
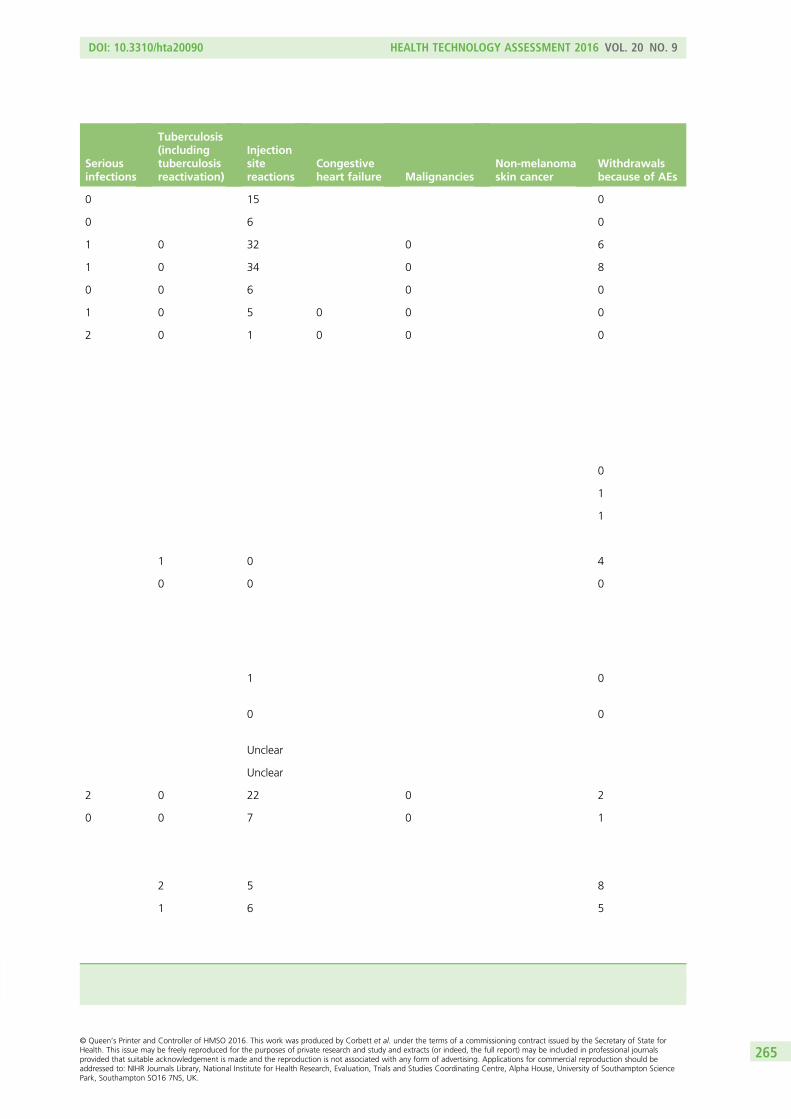
Seriousinfections
Tuberculosis(includingtuberculosisreactivation)
Injectionsitereactions
Congestiveheart failure Malignancies
Non-melanomaskin cancer
Withdrawalsbecause of AEs
0 15 0
0 6 0
1 0 32 0 6
1 0 34 0 8
0 0 6 0 0
1 0 5 0 0 0
2 0 1 0 0 0
0
1
1
1 0 4
0 0 0
1 0
0 0
Unclear
Unclear
2 0 22 0 2
0 0 7 0 1
2 5 8
1 6 5
DOI: 10.3310/hta20090 HEALTH TECHNOLOGY ASSESSMENT 2016 VOL. 20 NO. 9
© Queen’s Printer and Controller of HMSO 2016. This work was produced by Corbett et al. under the terms of a commissioning contract issued by the Secretary of State forHealth. This issue may be freely reproduced for the purposes of private research and study and extracts (or indeed, the full report) may be included in professional journalsprovided that suitable acknowledgement is made and the reproduction is not associated with any form of advertising. Applications for commercial reproduction should beaddressed to: NIHR Journals Library, National Institute for Health Research, Evaluation, Trials and Studies Coordinating Centre, Alpha House, University of Southampton SciencePark, Southampton SO16 7NS, UK.
265

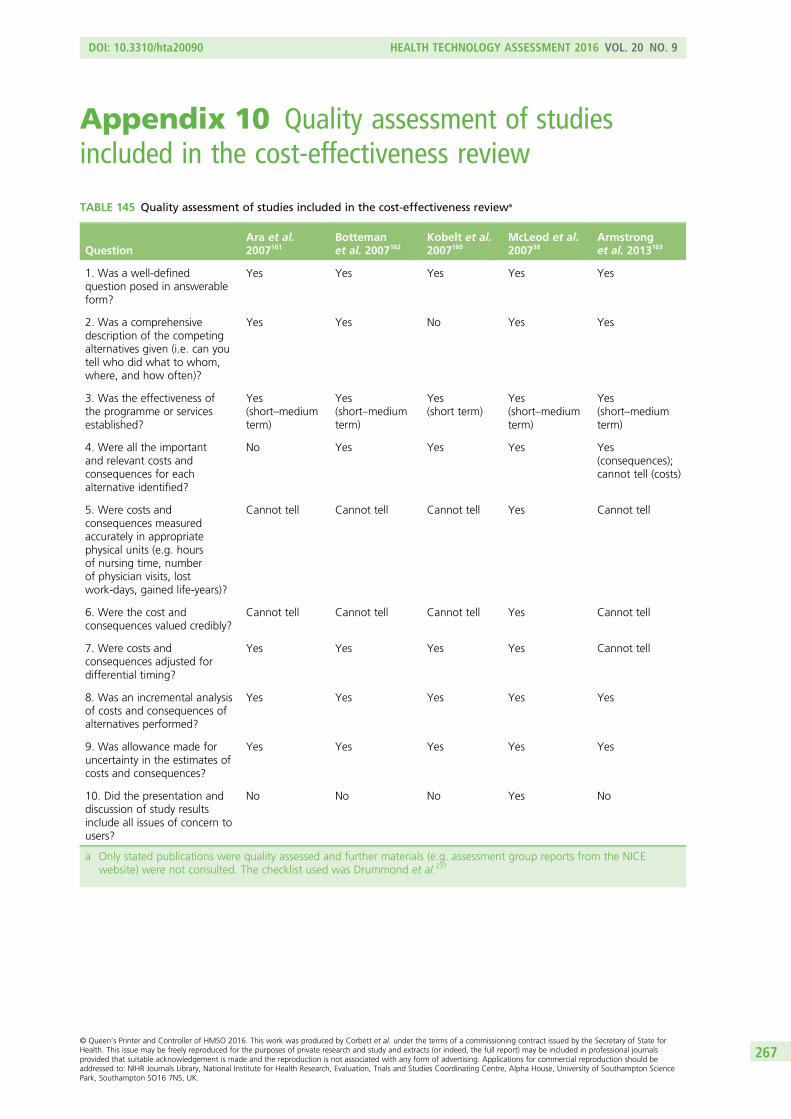
Appendix 10 Quality assessment of studiesincluded in the cost-effectiveness review
TABLE 145 Quality assessment of studies included in the cost-effectiveness reviewa
QuestionAra et al.2007161
Bottemanet al. 2007162
Kobelt et al.2007160
McLeod et al.200738
Armstronget al. 2013163
1. Was a well-definedquestion posed in answerableform?
Yes Yes Yes Yes Yes
2. Was a comprehensivedescription of the competingalternatives given (i.e. can youtell who did what to whom,where, and how often)?
Yes Yes No Yes Yes
3. Was the effectiveness ofthe programme or servicesestablished?
Yes(short–mediumterm)
Yes(short–mediumterm)
Yes(short term)
Yes(short–mediumterm)
Yes(short–mediumterm)
4. Were all the importantand relevant costs andconsequences for eachalternative identified?
No Yes Yes Yes Yes(consequences);cannot tell (costs)
5. Were costs andconsequences measuredaccurately in appropriatephysical units (e.g. hoursof nursing time, numberof physician visits, lostwork-days, gained life-years)?
Cannot tell Cannot tell Cannot tell Yes Cannot tell
6. Were the cost andconsequences valued credibly?
Cannot tell Cannot tell Cannot tell Yes Cannot tell
7. Were costs andconsequences adjusted fordifferential timing?
Yes Yes Yes Yes Cannot tell
8. Was an incremental analysisof costs and consequences ofalternatives performed?
Yes Yes Yes Yes Yes
9. Was allowance made foruncertainty in the estimates ofcosts and consequences?
Yes Yes Yes Yes Yes
10. Did the presentation anddiscussion of study resultsinclude all issues of concern tousers?
No No No Yes No
a Only stated publications were quality assessed and further materials (e.g. assessment group reports from the NICEwebsite) were not consulted. The checklist used was Drummond et al.237
DOI: 10.3310/hta20090 HEALTH TECHNOLOGY ASSESSMENT 2016 VOL. 20 NO. 9
© Queen’s Printer and Controller of HMSO 2016. This work was produced by Corbett et al. under the terms of a commissioning contract issued by the Secretary of State forHealth. This issue may be freely reproduced for the purposes of private research and study and extracts (or indeed, the full report) may be included in professional journalsprovided that suitable acknowledgement is made and the reproduction is not associated with any form of advertising. Applications for commercial reproduction should beaddressed to: NIHR Journals Library, National Institute for Health Research, Evaluation, Trials and Studies Coordinating Centre, Alpha House, University of Southampton SciencePark, Southampton SO16 7NS, UK.
267

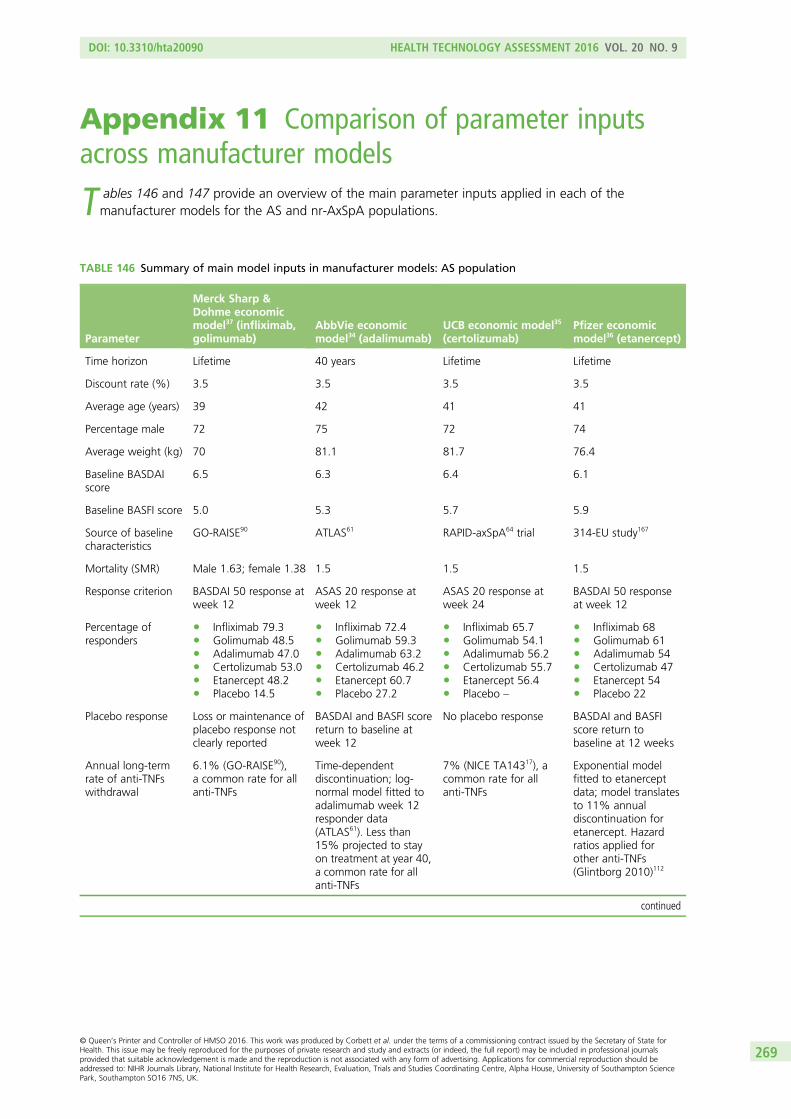
Appendix 11 Comparison of parameter inputsacross manufacturer models
T ables 146 and 147 provide an overview of the main parameter inputs applied in each of themanufacturer models for the AS and nr-AxSpA populations.
TABLE 146 Summary of main model inputs in manufacturer models: AS population
Parameter
Merck Sharp &Dohme economicmodel37 (infliximab,golimumab)
AbbVie economicmodel34 (adalimumab)
UCB economic model35
(certolizumab)Pfizer economicmodel36 (etanercept)
Time horizon Lifetime 40 years Lifetime Lifetime
Discount rate (%) 3.5 3.5 3.5 3.5
Average age (years) 39 42 41 41
Percentage male 72 75 72 74
Average weight (kg) 70 81.1 81.7 76.4
Baseline BASDAIscore
6.5 6.3 6.4 6.1
Baseline BASFI score 5.0 5.3 5.7 5.9
Source of baselinecharacteristics
GO-RAISE90 ATLAS61 RAPID-axSpA64 trial 314-EU study167
Mortality (SMR) Male 1.63; female 1.38 1.5 1.5 1.5
Response criterion BASDAI 50 response atweek 12
ASAS 20 response atweek 12
ASAS 20 response atweek 24
BASDAI 50 responseat week 12
Percentage ofresponders
l Infliximab 79.3l Golimumab 48.5l Adalimumab 47.0l Certolizumab 53.0l Etanercept 48.2l Placebo 14.5
l Infliximab 72.4l Golimumab 59.3l Adalimumab 63.2l Certolizumab 46.2l Etanercept 60.7l Placebo 27.2
l Infliximab 65.7l Golimumab 54.1l Adalimumab 56.2l Certolizumab 55.7l Etanercept 56.4l Placebo –
l Infliximab 68l Golimumab 61l Adalimumab 54l Certolizumab 47l Etanercept 54l Placebo 22
Placebo response Loss or maintenance ofplacebo response notclearly reported
BASDAI and BASFI scorereturn to baseline atweek 12
No placebo response BASDAI and BASFIscore return tobaseline at 12 weeks
Annual long-termrate of anti-TNFswithdrawal
6.1% (GO-RAISE90),a common rate for allanti-TNFs
Time-dependentdiscontinuation; log-normal model fitted toadalimumab week 12responder data(ATLAS61). Less than15% projected to stayon treatment at year 40,a common rate for allanti-TNFs
7% (NICE TA14317), acommon rate for allanti-TNFs
Exponential modelfitted to etanerceptdata; model translatesto 11% annualdiscontinuation foretanercept. Hazardratios applied forother anti-TNFs(Glintborg 2010)112
continued
DOI: 10.3310/hta20090 HEALTH TECHNOLOGY ASSESSMENT 2016 VOL. 20 NO. 9
© Queen’s Printer and Controller of HMSO 2016. This work was produced by Corbett et al. under the terms of a commissioning contract issued by the Secretary of State forHealth. This issue may be freely reproduced for the purposes of private research and study and extracts (or indeed, the full report) may be included in professional journalsprovided that suitable acknowledgement is made and the reproduction is not associated with any form of advertising. Applications for commercial reproduction should beaddressed to: NIHR Journals Library, National Institute for Health Research, Evaluation, Trials and Studies Coordinating Centre, Alpha House, University of Southampton SciencePark, Southampton SO16 7NS, UK.
269
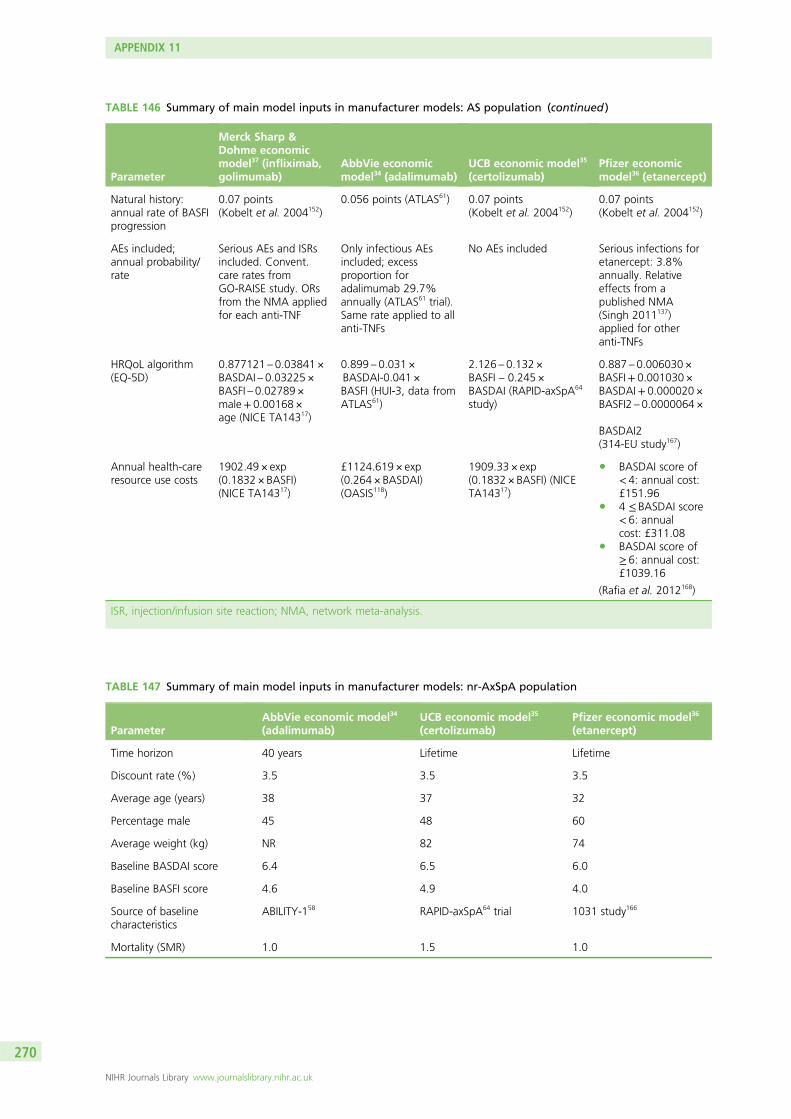
TABLE 146 Summary of main model inputs in manufacturer models: AS population (continued )
Parameter
Merck Sharp &Dohme economicmodel37 (infliximab,golimumab)
AbbVie economicmodel34 (adalimumab)
UCB economic model35
(certolizumab)Pfizer economicmodel36 (etanercept)
Natural history:annual rate of BASFIprogression
0.07 points(Kobelt et al. 2004152)
0.056 points (ATLAS61) 0.07 points(Kobelt et al. 2004152)
0.07 points(Kobelt et al. 2004152)
AEs included;annual probability/rate
Serious AEs and ISRsincluded. Convent.care rates fromGO-RAISE study. ORsfrom the NMA appliedfor each anti-TNF
Only infectious AEsincluded; excessproportion foradalimumab 29.7%annually (ATLAS61 trial).Same rate applied to allanti-TNFs
No AEs included Serious infections foretanercept: 3.8%annually. Relativeeffects from apublished NMA(Singh 2011137)applied for otheranti-TNFs
HRQoL algorithm(EQ-5D)
0.877121 – 0.03841 ×BASDAI – 0.03225 ×BASFI – 0.02789 ×male+ 0.00168 ×age (NICE TA14317)
0.899 – 0.031 ×BASDAI-0.041 ×BASFI (HUI-3, data fromATLAS61)
2.126 – 0.132 ×BASFI – 0.245 ×BASDAI (RAPID-axSpA64
study)
0.887 – 0.006030 ×BASFI+ 0.001030 ×BASDAI+ 0.000020 ×BASFI2 – 0.0000064 ×
BASDAI2(314-EU study167)
Annual health-careresource use costs
1902.49 × exp(0.1832 × BASFI)(NICE TA14317)
£1124.619 × exp(0.264 × BASDAI)(OASIS118)
1909.33 × exp(0.1832 × BASFI) (NICETA14317)
l BASDAI score of< 4: annual cost:£151.96
l 4 ≤ BASDAI score< 6: annualcost: £311.08
l BASDAI score of≥ 6: annual cost:£1039.16
(Rafia et al. 2012168)
ISR, injection/infusion site reaction; NMA, network meta-analysis.
TABLE 147 Summary of main model inputs in manufacturer models: nr-AxSpA population
ParameterAbbVie economic model34
(adalimumab)UCB economic model35
(certolizumab)Pfizer economic model36
(etanercept)
Time horizon 40 years Lifetime Lifetime
Discount rate (%) 3.5 3.5 3.5
Average age (years) 38 37 32
Percentage male 45 48 60
Average weight (kg) NR 82 74
Baseline BASDAI score 6.4 6.5 6.0
Baseline BASFI score 4.6 4.9 4.0
Source of baselinecharacteristics
ABILITY-158 RAPID-axSpA64 trial 1031 study166
Mortality (SMR) 1.0 1.5 1.0
APPENDIX 11
NIHR Journals Library www.journalslibrary.nihr.ac.uk
270
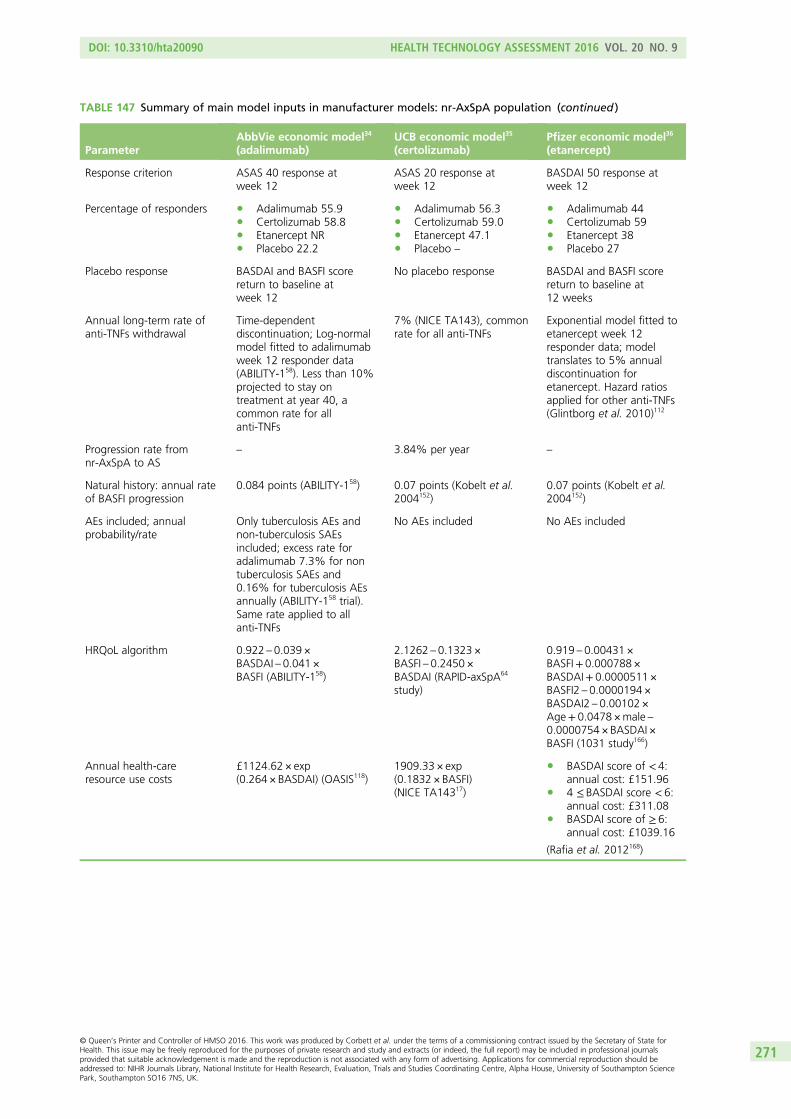
TABLE 147 Summary of main model inputs in manufacturer models: nr-AxSpA population (continued )
ParameterAbbVie economic model34
(adalimumab)UCB economic model35
(certolizumab)Pfizer economic model36
(etanercept)
Response criterion ASAS 40 response atweek 12
ASAS 20 response atweek 12
BASDAI 50 response atweek 12
Percentage of responders l Adalimumab 55.9l Certolizumab 58.8l Etanercept NRl Placebo 22.2
l Adalimumab 56.3l Certolizumab 59.0l Etanercept 47.1l Placebo –
l Adalimumab 44l Certolizumab 59l Etanercept 38l Placebo 27
Placebo response BASDAI and BASFI scorereturn to baseline atweek 12
No placebo response BASDAI and BASFI scorereturn to baseline at12 weeks
Annual long-term rate ofanti-TNFs withdrawal
Time-dependentdiscontinuation; Log-normalmodel fitted to adalimumabweek 12 responder data(ABILITY-158). Less than 10%projected to stay ontreatment at year 40, acommon rate for allanti-TNFs
7% (NICE TA143), commonrate for all anti-TNFs
Exponential model fitted toetanercept week 12responder data; modeltranslates to 5% annualdiscontinuation foretanercept. Hazard ratiosapplied for other anti-TNFs(Glintborg et al. 2010)112
Progression rate fromnr-AxSpA to AS
– 3.84% per year –
Natural history: annual rateof BASFI progression
0.084 points (ABILITY-158) 0.07 points (Kobelt et al.2004152)
0.07 points (Kobelt et al.2004152)
AEs included; annualprobability/rate
Only tuberculosis AEs andnon-tuberculosis SAEsincluded; excess rate foradalimumab 7.3% for nontuberculosis SAEs and0.16% for tuberculosis AEsannually (ABILITY-158 trial).Same rate applied to allanti-TNFs
No AEs included No AEs included
HRQoL algorithm 0.922 – 0.039 ×BASDAI – 0.041 ×BASFI (ABILITY-158)
2.1262 – 0.1323 ×BASFI – 0.2450 ×BASDAI (RAPID-axSpA64
study)
0.919 – 0.00431 ×BASFI+ 0.000788 ×BASDAI+ 0.0000511×BASFI2 – 0.0000194 ×BASDAI2 – 0.00102 ×Age+ 0.0478 ×male –0.0000754 × BASDAI ×BASFI (1031 study166)
Annual health-careresource use costs
£1124.62 × exp(0.264 × BASDAI) (OASIS118)
1909.33 × exp(0.1832 × BASFI)(NICE TA14317)
l BASDAI score of < 4:annual cost: £151.96
l 4 ≤ BASDAI score < 6:annual cost: £311.08
l BASDAI score of ≥ 6:annual cost: £1039.16
(Rafia et al. 2012168)
DOI: 10.3310/hta20090 HEALTH TECHNOLOGY ASSESSMENT 2016 VOL. 20 NO. 9
© Queen’s Printer and Controller of HMSO 2016. This work was produced by Corbett et al. under the terms of a commissioning contract issued by the Secretary of State forHealth. This issue may be freely reproduced for the purposes of private research and study and extracts (or indeed, the full report) may be included in professional journalsprovided that suitable acknowledgement is made and the reproduction is not associated with any form of advertising. Applications for commercial reproduction should beaddressed to: NIHR Journals Library, National Institute for Health Research, Evaluation, Trials and Studies Coordinating Centre, Alpha House, University of Southampton SciencePark, Southampton SO16 7NS, UK.
271
Comparison of disease costs assumed for the ankylosingspondylitis and non-radiographic axialspondyloarthritis populations
A variety of alternative regressions were applied across the submissions to estimate the annual diseasecosts associated with BASDAI and BASFI scores. Merck Sharp & Dohme37 and UCB35 used the sameexponential regression function estimated by LRiG, uprated to current prices, as part of NICE TA14317
based on the OASIS study.118
Regression in NICE TA14317 based on OASIS data and cost element uprated to current prices:£1902.492 × exp(0.1832 × BASFI).
AbbVie undertook their own reanalysis of the OASIS data set based on current prices. In their base-caseregression an exponential model based on BASDAI was assumed. However, results from separate linearand exponential models were also presented.
Base-case regression used by AbbVie:34
Exp BASDAI: £1124:619 × exp(0:264×BASDAI). (14)
Alternative regressions presented by AbbVie:
Linear BASFI : £520:32102 + £804:64642 × BASFI (15)
BASDAI : £118:47088 + £943:21394 × BASDAI (16)
Exp BASFI: £1284:186 × exp(0:213 × BASFI). (17)
The submission by Pfizer36 was based on a recent UK study by Rafia et al.168 Rather than employing aregression approach, the manufacturer used results based on a categorical analysis of the annual costs forBASDAI: BASDAI score of < 4= £151.96, 4 ≤ BASDAI score < 6= £311.08; and BASDAI scoreof ≥ 6= £1039.16.
However, the paper by Rafia et al.170 also specified a separate two-part regression function which was notincluded within the Pfizer submission36 but is used in the subsequent comparisons of regressions to providea more comparable approach to assessing the alternative costs sources used across the manufacturer’ssubmissions and the predictions across a range of different BASDAI and BASFI scores.
Two-part model in Rafia et al.168:
Logistic regression model to derive probability of incurring costs:
2:71795 + 0:16716 × BASFI + 0:37053 × BASDAI−0:02468 × BASFI × BASDAI+ 0:33778×Male−0:04389 × Age− 0:01373 × Disease Duration (18)
Generalised linear model to obtain 3-month costs:
6:79876+ 0:27548 × BASFI + 0:13265 × BASDAI−0:01602 × BASFI × BASDAI+ 0:46458×Male− 0:01656 × Age+ 0:00381 × Disease Duration (19)
APPENDIX 11
NIHR Journals Library www.journalslibrary.nihr.ac.uk
272
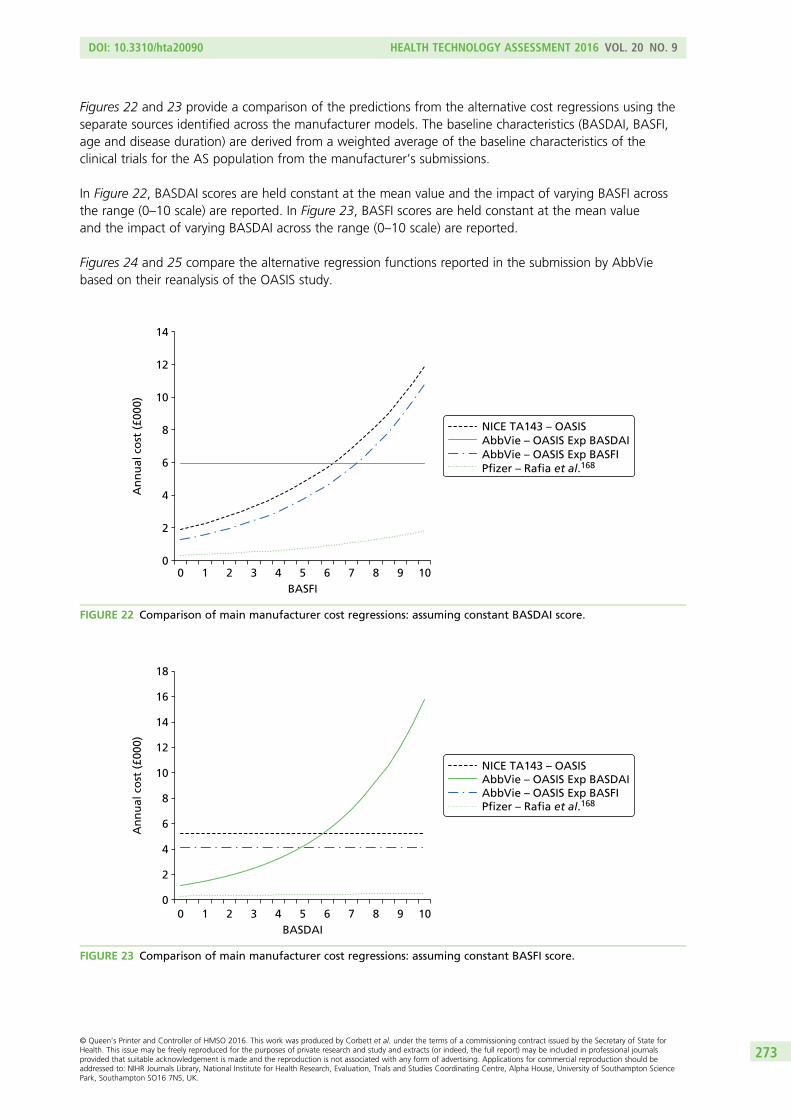
Figures 22 and 23 provide a comparison of the predictions from the alternative cost regressions using theseparate sources identified across the manufacturer models. The baseline characteristics (BASDAI, BASFI,age and disease duration) are derived from a weighted average of the baseline characteristics of theclinical trials for the AS population from the manufacturer’s submissions.
In Figure 22, BASDAI scores are held constant at the mean value and the impact of varying BASFI acrossthe range (0–10 scale) are reported. In Figure 23, BASFI scores are held constant at the mean valueand the impact of varying BASDAI across the range (0–10 scale) are reported.
Figures 24 and 25 compare the alternative regression functions reported in the submission by AbbViebased on their reanalysis of the OASIS study.
0
2
4
6
8
10
12
14
0 1 2 3 4 5 6 7 8 9 10
An
nu
al c
ost
(£0
00)
BASFI
NICE TA143 – OASISAbbVie – OASIS Exp BASDAIAbbVie – OASIS Exp BASFIPfizer – Rafia et al.168
FIGURE 22 Comparison of main manufacturer cost regressions: assuming constant BASDAI score.
0 1 2 3 4 5 6 7 8 9 100
2
4
6
8
10
12
14
16
18
An
nu
al c
ost
(£0
00)
BASDAI
NICE TA143 – OASISAbbVie – OASIS Exp BASDAI AbbVie – OASIS Exp BASFIPfizer – Rafia et al.168
FIGURE 23 Comparison of main manufacturer cost regressions: assuming constant BASFI score.
DOI: 10.3310/hta20090 HEALTH TECHNOLOGY ASSESSMENT 2016 VOL. 20 NO. 9
© Queen’s Printer and Controller of HMSO 2016. This work was produced by Corbett et al. under the terms of a commissioning contract issued by the Secretary of State forHealth. This issue may be freely reproduced for the purposes of private research and study and extracts (or indeed, the full report) may be included in professional journalsprovided that suitable acknowledgement is made and the reproduction is not associated with any form of advertising. Applications for commercial reproduction should beaddressed to: NIHR Journals Library, National Institute for Health Research, Evaluation, Trials and Studies Coordinating Centre, Alpha House, University of Southampton SciencePark, Southampton SO16 7NS, UK.
273
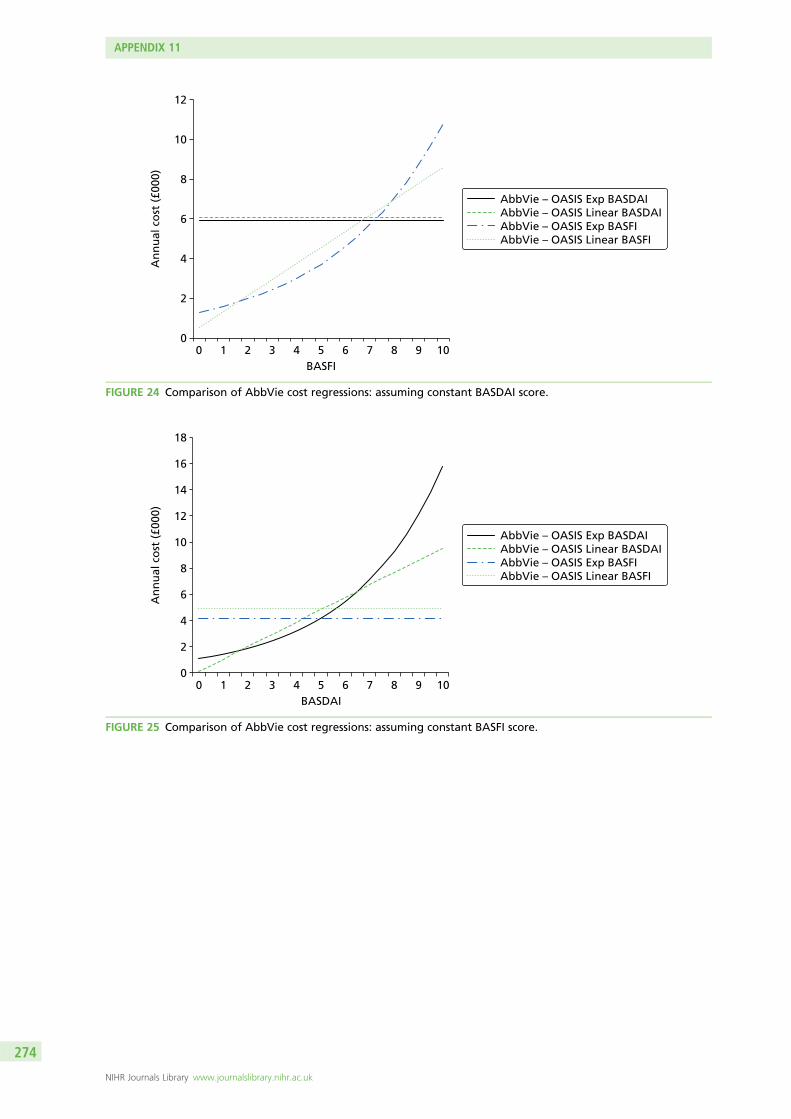
0 1 2 3 4 5 6 7 8 9 100
2
4
6
8
10
12
14
16
18
An
nu
al c
ost
(£0
00)
BASDAI
AbbVie – OASIS Exp BASDAIAbbVie – OASIS Linear BASDAIAbbVie – OASIS Exp BASFIAbbVie – OASIS Linear BASFI
FIGURE 25 Comparison of AbbVie cost regressions: assuming constant BASFI score.
0 1 2 3 4 5 6 7 8 9 100
2
4
6
8
10
12
An
nu
al c
ost
(£0
00)
BASFI
AbbVie – OASIS Exp BASDAIAbbVie – OASIS Linear BASDAIAbbVie – OASIS Exp BASFIAbbVie – OASIS Linear BASFI
FIGURE 24 Comparison of AbbVie cost regressions: assuming constant BASDAI score.
APPENDIX 11
NIHR Journals Library www.journalslibrary.nihr.ac.uk
274
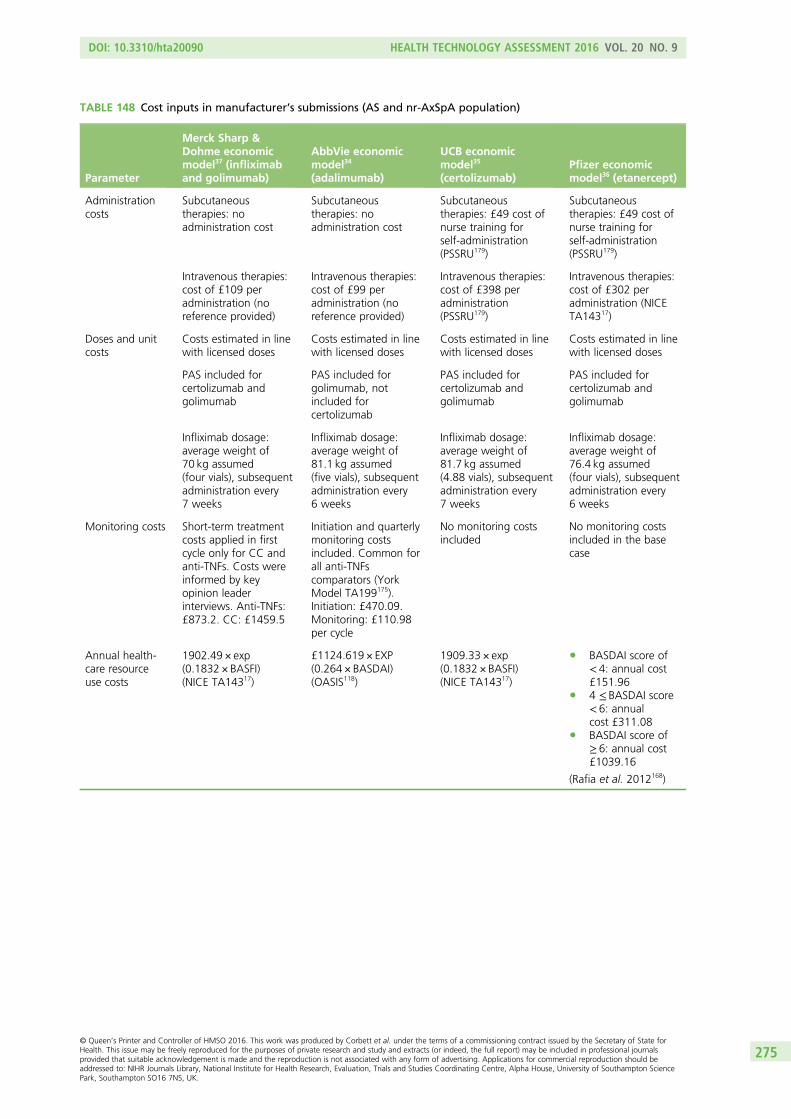
TABLE 148 Cost inputs in manufacturer’s submissions (AS and nr-AxSpA population)
Parameter
Merck Sharp &Dohme economicmodel37 (infliximaband golimumab)
AbbVie economicmodel34
(adalimumab)
UCB economicmodel35
(certolizumab)Pfizer economicmodel36 (etanercept)
Administrationcosts
Subcutaneoustherapies: noadministration cost
Subcutaneoustherapies: noadministration cost
Subcutaneoustherapies: £49 cost ofnurse training forself-administration(PSSRU179)
Subcutaneoustherapies: £49 cost ofnurse training forself-administration(PSSRU179)
Intravenous therapies:cost of £109 peradministration (noreference provided)
Intravenous therapies:cost of £99 peradministration (noreference provided)
Intravenous therapies:cost of £398 peradministration(PSSRU179)
Intravenous therapies:cost of £302 peradministration (NICETA14317)
Doses and unitcosts
Costs estimated in linewith licensed doses
Costs estimated in linewith licensed doses
Costs estimated in linewith licensed doses
Costs estimated in linewith licensed doses
PAS included forcertolizumab andgolimumab
PAS included forgolimumab, notincluded forcertolizumab
PAS included forcertolizumab andgolimumab
PAS included forcertolizumab andgolimumab
Infliximab dosage:average weight of70 kg assumed(four vials), subsequentadministration every7 weeks
Infliximab dosage:average weight of81.1 kg assumed(five vials), subsequentadministration every6 weeks
Infliximab dosage:average weight of81.7 kg assumed(4.88 vials), subsequentadministration every7 weeks
Infliximab dosage:average weight of76.4 kg assumed(four vials), subsequentadministration every6 weeks
Monitoring costs Short-term treatmentcosts applied in firstcycle only for CC andanti-TNFs. Costs wereinformed by keyopinion leaderinterviews. Anti-TNFs:£873.2. CC: £1459.5
Initiation and quarterlymonitoring costsincluded. Common forall anti-TNFscomparators (YorkModel TA199175).Initiation: £470.09.Monitoring: £110.98per cycle
No monitoring costsincluded
No monitoring costsincluded in the basecase
Annual health-care resourceuse costs
1902.49 × exp(0.1832 × BASFI)(NICE TA14317)
£1124.619 × EXP(0.264 × BASDAI)(OASIS118)
1909.33 × exp(0.1832 × BASFI)(NICE TA14317)
l BASDAI score of< 4: annual cost£151.96
l 4 ≤ BASDAI score< 6: annualcost £311.08
l BASDAI score of≥ 6: annual cost£1039.16
(Rafia et al. 2012168)
DOI: 10.3310/hta20090 HEALTH TECHNOLOGY ASSESSMENT 2016 VOL. 20 NO. 9
© Queen’s Printer and Controller of HMSO 2016. This work was produced by Corbett et al. under the terms of a commissioning contract issued by the Secretary of State forHealth. This issue may be freely reproduced for the purposes of private research and study and extracts (or indeed, the full report) may be included in professional journalsprovided that suitable acknowledgement is made and the reproduction is not associated with any form of advertising. Applications for commercial reproduction should beaddressed to: NIHR Journals Library, National Institute for Health Research, Evaluation, Trials and Studies Coordinating Centre, Alpha House, University of Southampton SciencePark, Southampton SO16 7NS, UK.
275
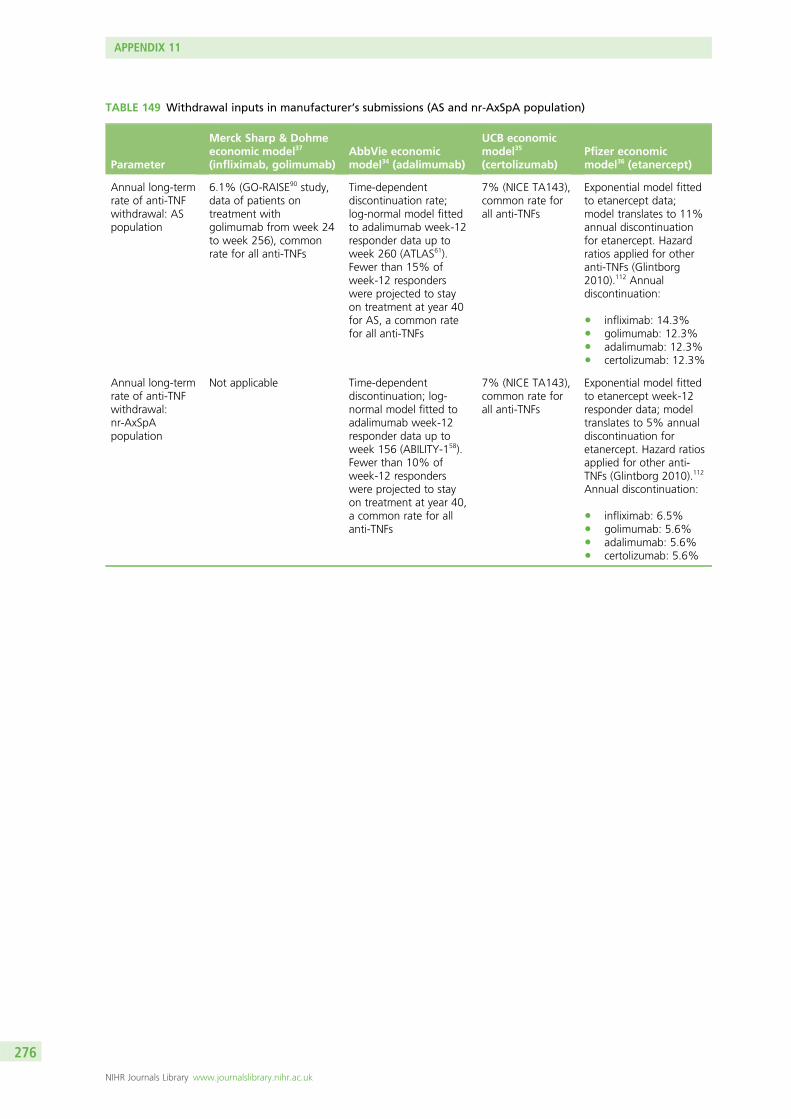
TABLE 149 Withdrawal inputs in manufacturer’s submissions (AS and nr-AxSpA population)
Parameter
Merck Sharp & Dohmeeconomic model37
(infliximab, golimumab)AbbVie economicmodel34 (adalimumab)
UCB economicmodel35
(certolizumab)Pfizer economicmodel36 (etanercept)
Annual long-termrate of anti-TNFwithdrawal: ASpopulation
6.1% (GO-RAISE90 study,data of patients ontreatment withgolimumab from week 24to week 256), commonrate for all anti-TNFs
Time-dependentdiscontinuation rate;log-normal model fittedto adalimumab week-12responder data up toweek 260 (ATLAS61).Fewer than 15% ofweek-12 responderswere projected to stayon treatment at year 40for AS, a common ratefor all anti-TNFs
7% (NICE TA143),common rate forall anti-TNFs
Exponential model fittedto etanercept data;model translates to 11%annual discontinuationfor etanercept. Hazardratios applied for otheranti-TNFs (Glintborg2010).112 Annualdiscontinuation:
l infliximab: 14.3%l golimumab: 12.3%l adalimumab: 12.3%l certolizumab: 12.3%
Annual long-termrate of anti-TNFwithdrawal:nr-AxSpApopulation
Not applicable Time-dependentdiscontinuation; log-normal model fitted toadalimumab week-12responder data up toweek 156 (ABILITY-158).Fewer than 10% ofweek-12 responderswere projected to stayon treatment at year 40,a common rate for allanti-TNFs
7% (NICE TA143),common rate forall anti-TNFs
Exponential model fittedto etanercept week-12responder data; modeltranslates to 5% annualdiscontinuation foretanercept. Hazard ratiosapplied for other anti-TNFs (Glintborg 2010).112
Annual discontinuation:
l infliximab: 6.5%l golimumab: 5.6%l adalimumab: 5.6%l certolizumab: 5.6%
APPENDIX 11
NIHR Journals Library www.journalslibrary.nihr.ac.uk
276
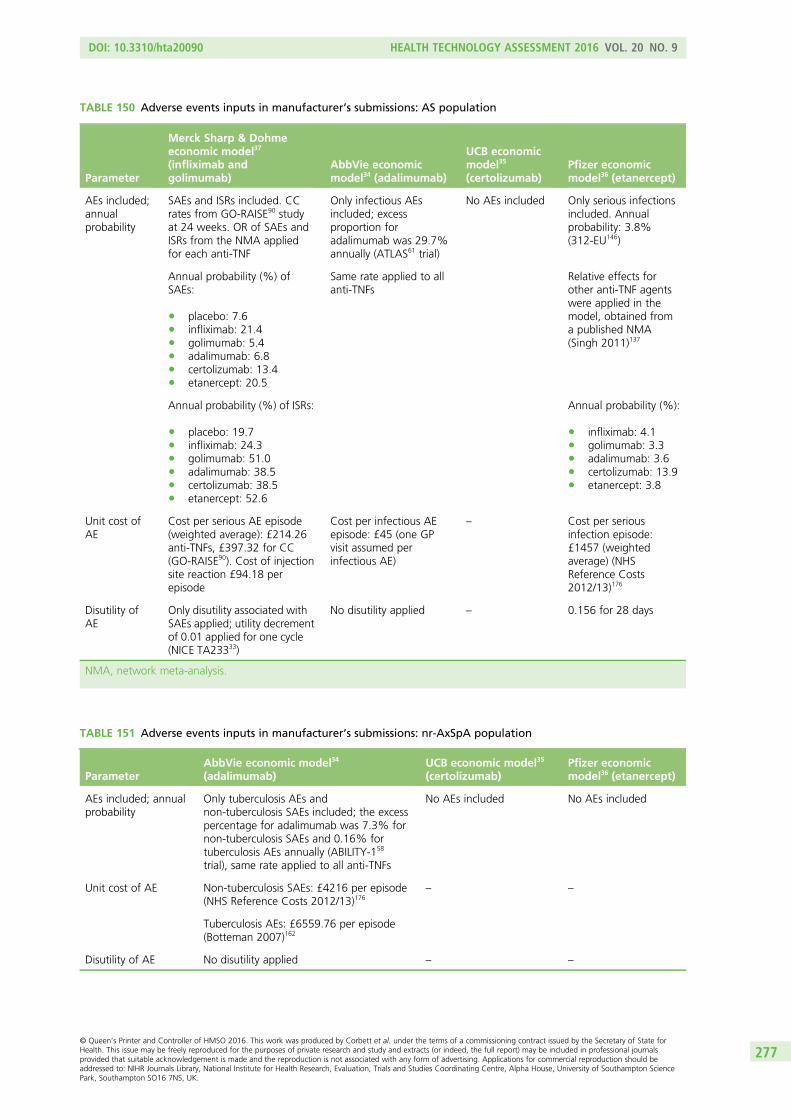
TABLE 150 Adverse events inputs in manufacturer’s submissions: AS population
Parameter
Merck Sharp & Dohmeeconomic model37
(infliximab andgolimumab)
AbbVie economicmodel34 (adalimumab)
UCB economicmodel35
(certolizumab)Pfizer economicmodel36 (etanercept)
AEs included;annualprobability
SAEs and ISRs included. CCrates from GO-RAISE90 studyat 24 weeks. OR of SAEs andISRs from the NMA appliedfor each anti-TNF
Only infectious AEsincluded; excessproportion foradalimumab was 29.7%annually (ATLAS61 trial)
No AEs included Only serious infectionsincluded. Annualprobability: 3.8%(312-EU146)
Annual probability (%) ofSAEs:
l placebo: 7.6l infliximab: 21.4l golimumab: 5.4l adalimumab: 6.8l certolizumab: 13.4l etanercept: 20.5
Same rate applied to allanti-TNFs
Relative effects forother anti-TNF agentswere applied in themodel, obtained froma published NMA(Singh 2011)137
Annual probability (%) of ISRs:
l placebo: 19.7l infliximab: 24.3l golimumab: 51.0l adalimumab: 38.5l certolizumab: 38.5l etanercept: 52.6
Annual probability (%):
l infliximab: 4.1l golimumab: 3.3l adalimumab: 3.6l certolizumab: 13.9l etanercept: 3.8
Unit cost ofAE
Cost per serious AE episode(weighted average): £214.26anti-TNFs, £397.32 for CC(GO-RAISE90). Cost of injectionsite reaction £94.18 perepisode
Cost per infectious AEepisode: £45 (one GPvisit assumed perinfectious AE)
– Cost per seriousinfection episode:£1457 (weightedaverage) (NHSReference Costs2012/13)176
Disutility ofAE
Only disutility associated withSAEs applied; utility decrementof 0.01 applied for one cycle(NICE TA23333)
No disutility applied – 0.156 for 28 days
NMA, network meta-analysis.
TABLE 151 Adverse events inputs in manufacturer’s submissions: nr-AxSpA population
ParameterAbbVie economic model34
(adalimumab)UCB economic model35
(certolizumab)Pfizer economicmodel36 (etanercept)
AEs included; annualprobability
Only tuberculosis AEs andnon-tuberculosis SAEs included; the excesspercentage for adalimumab was 7.3% fornon-tuberculosis SAEs and 0.16% fortuberculosis AEs annually (ABILITY-158
trial), same rate applied to all anti-TNFs
No AEs included No AEs included
Unit cost of AE Non-tuberculosis SAEs: £4216 per episode(NHS Reference Costs 2012/13)176
– –
Tuberculosis AEs: £6559.76 per episode(Botteman 2007)162
Disutility of AE No disutility applied – –
DOI: 10.3310/hta20090 HEALTH TECHNOLOGY ASSESSMENT 2016 VOL. 20 NO. 9
© Queen’s Printer and Controller of HMSO 2016. This work was produced by Corbett et al. under the terms of a commissioning contract issued by the Secretary of State forHealth. This issue may be freely reproduced for the purposes of private research and study and extracts (or indeed, the full report) may be included in professional journalsprovided that suitable acknowledgement is made and the reproduction is not associated with any form of advertising. Applications for commercial reproduction should beaddressed to: NIHR Journals Library, National Institute for Health Research, Evaluation, Trials and Studies Coordinating Centre, Alpha House, University of Southampton SciencePark, Southampton SO16 7NS, UK.
277

Appendix 12 Extended synthesis models
In this appendix we describe in more detail the data and modelling approaches implemented in Chapter 5.Note that while this appendix aims to provide a methodological description of methods, a full description
of findings and its interpretations are in Chapter 5.
General aspects of implementation and software
The synthesis was conducted from a Bayesian perspective, using WinBUGS (a MCMC simulation basedsoftware for Bayesian inference). For burn-in, we ran 100,000 simulations and another 100,000 were usedin inferences. Convergence was assessed by running two chains and convergence was assumed if theGelman–Rubin statistic was equal to 1. Goodness of fit was assessed using the DIC.170 Models with smallerDIC are better supported by the data. In the presence of autocorrelation, the MCMC simulation forinference was increased to 200,000 and a thin of 20 was applied (yielding a sample for inference of10,000 for each chain).
The main synthesis models will pool differences between treatment and control in change scores frombaseline (BASDAI and BASFI). The treatment associated with the lowest (most negative) mean changescore is expected to be best. However, it is important to quantify the uncertainty around the estimates andfor this reason SDs will be reported alongside expected values. When ORs are presented, median valuesinstead of means were used to summarise inferences.
When possible, meta-regression analyses were conducted to evaluate potential treatment effect modifiers.Meta-regression is a tool aimed at examining the impact of variables on effect size using regression-basedtechniques. In these explorations, the following baseline characteristics were considered: BASDAI score,BASFI score, age, sex, duration of symptoms (years) and CRP level.
Relative effectiveness estimates for models assuming exchangeability across treatments (model A5) arebased on the predictive distribution, representing the distribution of the data averaged over all possibleparameter values. This summary statistic best reflects the impact of uncertainty in the parameters of themodel and is here judged as a more appropriate basis to be used in the decision model.171
Modelling approach A
Brief description of the dataBased on study populations and follow-up (i.e. around 12 weeks in duration), 16 of the RCTs areconsidered directly relevant to the decision problem for the AS population (studies 1 to 16 in Table 152).One of these studies did not report BASDAI or BASFI outcomes (study 3) and thus could not be included inanalyses. The 15 remaining studies reported at least one outcome measure: BASDAI 50 score and/orchange from baseline on BASDAI and BASFI scores.
This modelling approach directly evaluates relative treatment effects, that is log OR for BASDAI 50response and the difference between treatment and placebo in change in BASDAI and BASFI scores frombaseline. The data set analysed is shown in Table 153.
DOI: 10.3310/hta20090 HEALTH TECHNOLOGY ASSESSMENT 2016 VOL. 20 NO. 9
© Queen’s Printer and Controller of HMSO 2016. This work was produced by Corbett et al. under the terms of a commissioning contract issued by the Secretary of State forHealth. This issue may be freely reproduced for the purposes of private research and study and extracts (or indeed, the full report) may be included in professional journalsprovided that suitable acknowledgement is made and the reproduction is not associated with any form of advertising. Applications for commercial reproduction should beaddressed to: NIHR Journals Library, National Institute for Health Research, Evaluation, Trials and Studies Coordinating Centre, Alpha House, University of Southampton SciencePark, Southampton SO16 7NS, UK.
279
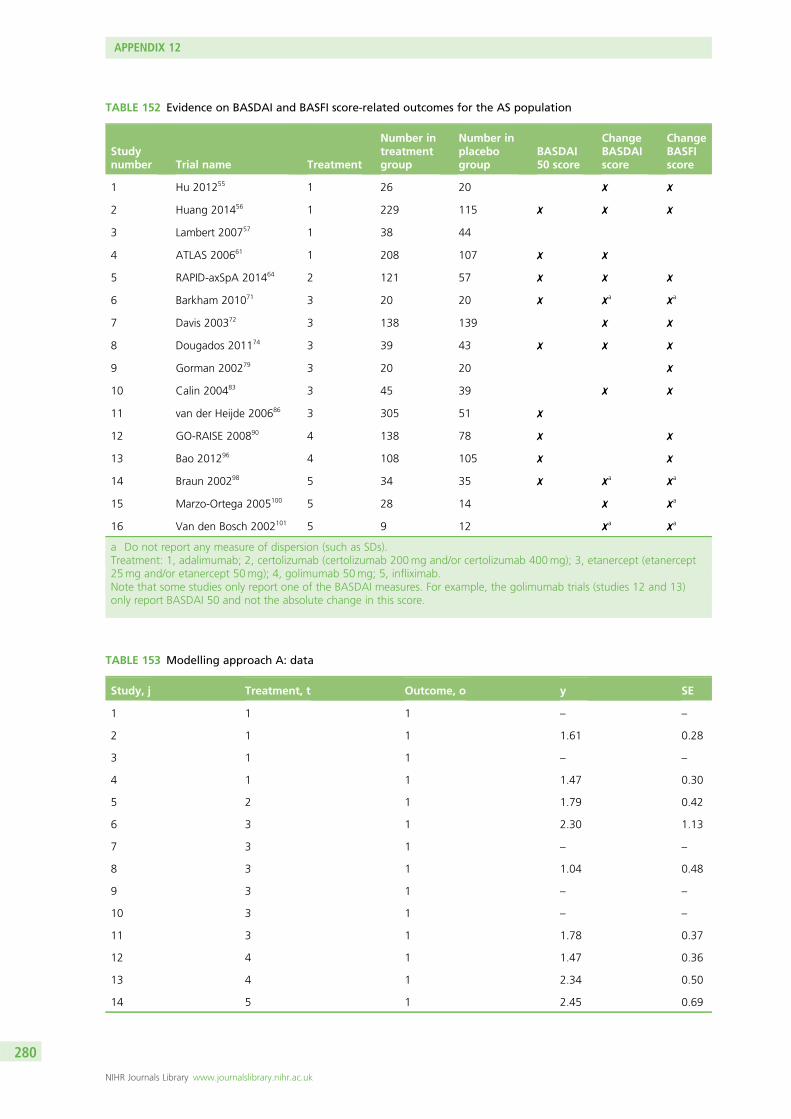
TABLE 152 Evidence on BASDAI and BASFI score-related outcomes for the AS population
Studynumber Trial name Treatment
Number intreatmentgroup
Number inplacebogroup
BASDAI50 score
ChangeBASDAIscore
ChangeBASFIscore
1 Hu 201255 1 26 20 ✗ ✗
2 Huang 201456 1 229 115 ✗ ✗ ✗
3 Lambert 200757 1 38 44
4 ATLAS 200661 1 208 107 ✗ ✗
5 RAPID-axSpA 201464 2 121 57 ✗ ✗ ✗
6 Barkham 201071 3 20 20 ✗ ✗a ✗a
7 Davis 200372 3 138 139 ✗ ✗
8 Dougados 201174 3 39 43 ✗ ✗ ✗
9 Gorman 200279 3 20 20 ✗
10 Calin 200483 3 45 39 ✗ ✗
11 van der Heijde 200686 3 305 51 ✗
12 GO-RAISE 200890 4 138 78 ✗ ✗
13 Bao 201296 4 108 105 ✗ ✗
14 Braun 200298 5 34 35 ✗ ✗a ✗a
15 Marzo-Ortega 2005100 5 28 14 ✗ ✗a
16 Van den Bosch 2002101 5 9 12 ✗a ✗a
a Do not report any measure of dispersion (such as SDs).Treatment: 1, adalimumab; 2, certolizumab (certolizumab 200mg and/or certolizumab 400mg); 3, etanercept (etanercept25mg and/or etanercept 50mg); 4, golimumab 50mg; 5, infliximab.Note that some studies only report one of the BASDAI measures. For example, the golimumab trials (studies 12 and 13)only report BASDAI 50 and not the absolute change in this score.
TABLE 153 Modelling approach A: data
Study, j Treatment, t Outcome, o y SE
1 1 1 – –
2 1 1 1.61 0.28
3 1 1 – –
4 1 1 1.47 0.30
5 2 1 1.79 0.42
6 3 1 2.30 1.13
7 3 1 – –
8 3 1 1.04 0.48
9 3 1 – –
10 3 1 – –
11 3 1 1.78 0.37
12 4 1 1.47 0.36
13 4 1 2.34 0.50
14 5 1 2.45 0.69
APPENDIX 12
NIHR Journals Library www.journalslibrary.nihr.ac.uk
280
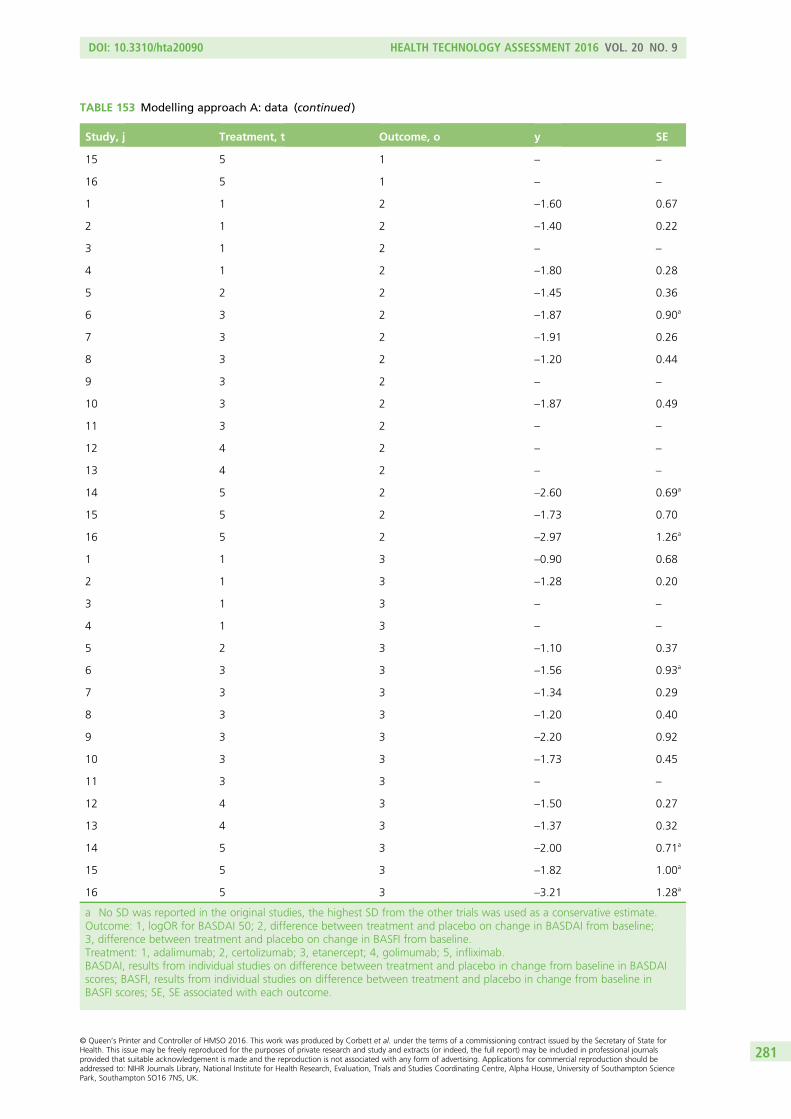
TABLE 153 Modelling approach A: data (continued )
Study, j Treatment, t Outcome, o y SE
15 5 1 – –
16 5 1 – –
1 1 2 –1.60 0.67
2 1 2 –1.40 0.22
3 1 2 – –
4 1 2 –1.80 0.28
5 2 2 –1.45 0.36
6 3 2 –1.87 0.90a
7 3 2 –1.91 0.26
8 3 2 –1.20 0.44
9 3 2 – –
10 3 2 –1.87 0.49
11 3 2 – –
12 4 2 – –
13 4 2 – –
14 5 2 –2.60 0.69a
15 5 2 –1.73 0.70
16 5 2 –2.97 1.26a
1 1 3 –0.90 0.68
2 1 3 –1.28 0.20
3 1 3 – –
4 1 3 – –
5 2 3 –1.10 0.37
6 3 3 –1.56 0.93a
7 3 3 –1.34 0.29
8 3 3 –1.20 0.40
9 3 3 –2.20 0.92
10 3 3 –1.73 0.45
11 3 3 – –
12 4 3 –1.50 0.27
13 4 3 –1.37 0.32
14 5 3 –2.00 0.71a
15 5 3 –1.82 1.00a
16 5 3 –3.21 1.28a
a No SD was reported in the original studies, the highest SD from the other trials was used as a conservative estimate.Outcome: 1, logOR for BASDAI 50; 2, difference between treatment and placebo on change in BASDAI from baseline;3, difference between treatment and placebo on change in BASFI from baseline.Treatment: 1, adalimumab; 2, certolizumab; 3, etanercept; 4, golimumab; 5, infliximab.BASDAI, results from individual studies on difference between treatment and placebo in change from baseline in BASDAIscores; BASFI, results from individual studies on difference between treatment and placebo in change from baseline inBASFI scores; SE, SE associated with each outcome.
DOI: 10.3310/hta20090 HEALTH TECHNOLOGY ASSESSMENT 2016 VOL. 20 NO. 9
© Queen’s Printer and Controller of HMSO 2016. This work was produced by Corbett et al. under the terms of a commissioning contract issued by the Secretary of State forHealth. This issue may be freely reproduced for the purposes of private research and study and extracts (or indeed, the full report) may be included in professional journalsprovided that suitable acknowledgement is made and the reproduction is not associated with any form of advertising. Applications for commercial reproduction should beaddressed to: NIHR Journals Library, National Institute for Health Research, Evaluation, Trials and Studies Coordinating Centre, Alpha House, University of Southampton SciencePark, Southampton SO16 7NS, UK.
281
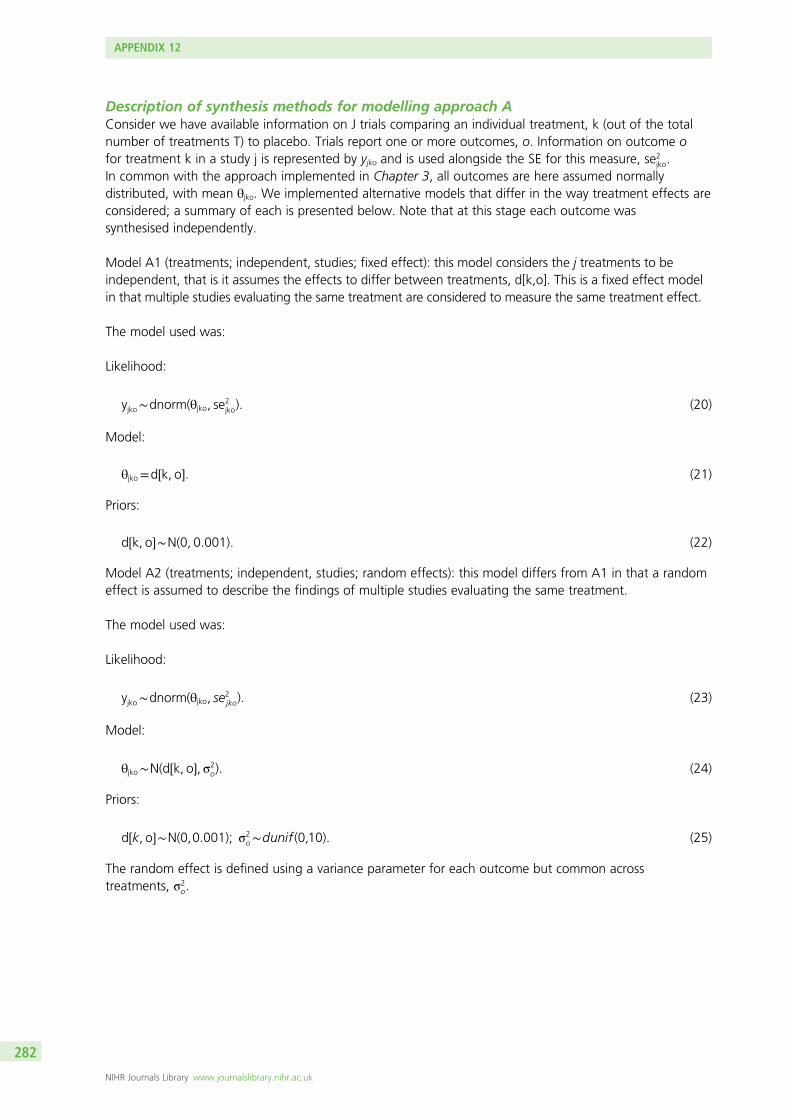
Description of synthesis methods for modelling approach AConsider we have available information on J trials comparing an individual treatment, k (out of the totalnumber of treatments T) to placebo. Trials report one or more outcomes, o. Information on outcome ofor treatment k in a study j is represented by yjko and is used alongside the SE for this measure, se2
jko.In common with the approach implemented in Chapter 3, all outcomes are here assumed normallydistributed, with mean θjko. We implemented alternative models that differ in the way treatment effects areconsidered; a summary of each is presented below. Note that at this stage each outcome wassynthesised independently.
Model A1 (treatments; independent, studies; fixed effect): this model considers the j treatments to beindependent, that is it assumes the effects to differ between treatments, d[k,o]. This is a fixed effect modelin that multiple studies evaluating the same treatment are considered to measure the same treatment effect.
The model used was:
Likelihood:
yjko∼dnorm(θjko, se2jko). (20)
Model:
θjko=d½k, o�. (21)
Priors:
d½k, o�∼N(0, 0:001). (22)
Model A2 (treatments; independent, studies; random effects): this model differs from A1 in that a randomeffect is assumed to describe the findings of multiple studies evaluating the same treatment.
The model used was:
Likelihood:
yjko∼dnorm(θjko, se2jko). (23)
Model:
θjko∼N(d½k, o�, σ2o). (24)
Priors:
d½k, o�∼N(0,0:001); σ2o∼dunif (0,10). (25)
The random effect is defined using a variance parameter for each outcome but common acrosstreatments, σ2
o.
APPENDIX 12
NIHR Journals Library www.journalslibrary.nihr.ac.uk
282
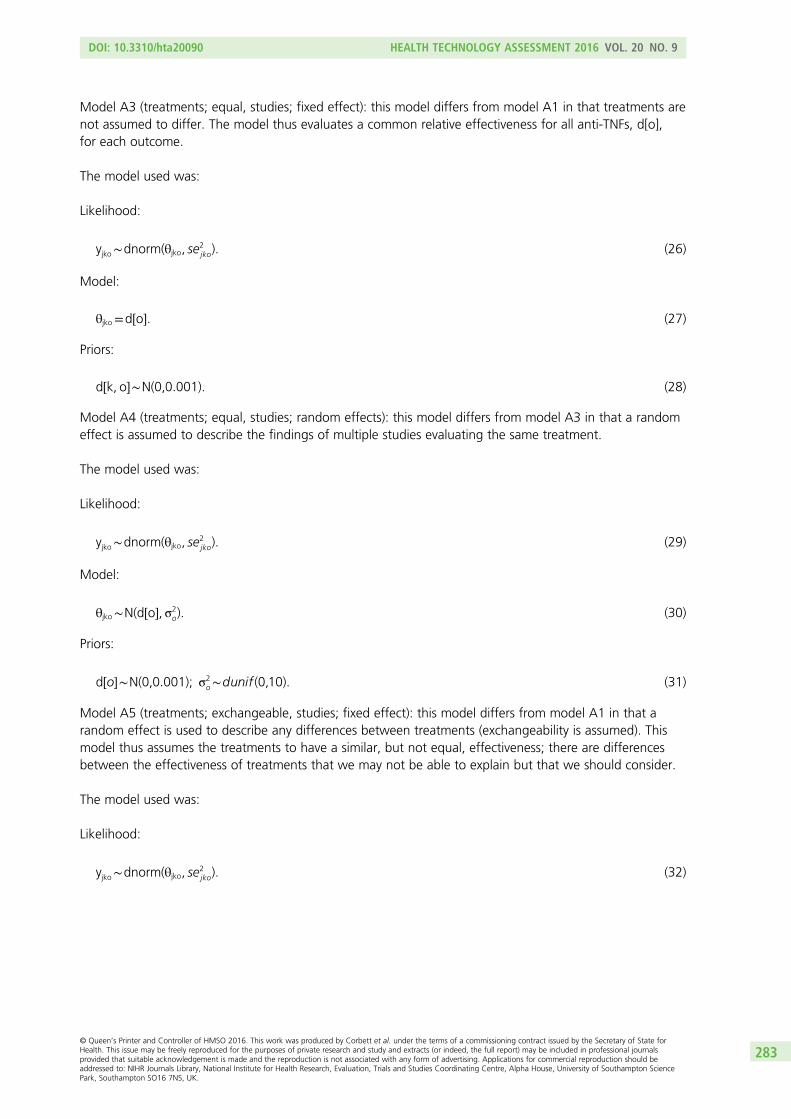
Model A3 (treatments; equal, studies; fixed effect): this model differs from model A1 in that treatments arenot assumed to differ. The model thus evaluates a common relative effectiveness for all anti-TNFs, d[o],for each outcome.
The model used was:
Likelihood:
yjko∼dnorm(θjko, se2jko). (26)
Model:
θjko=d½o�. (27)
Priors:
d½k, o�∼N(0,0:001). (28)
Model A4 (treatments; equal, studies; random effects): this model differs from model A3 in that a randomeffect is assumed to describe the findings of multiple studies evaluating the same treatment.
The model used was:
Likelihood:
yjko∼dnorm(θjko, se2jko). (29)
Model:
θjko∼N(d½o�, σ2o). (30)
Priors:
d½o�∼N(0,0:001); σ2o∼dunif (0,10). (31)
Model A5 (treatments; exchangeable, studies; fixed effect): this model differs from model A1 in that arandom effect is used to describe any differences between treatments (exchangeability is assumed). Thismodel thus assumes the treatments to have a similar, but not equal, effectiveness; there are differencesbetween the effectiveness of treatments that we may not be able to explain but that we should consider.
The model used was:
Likelihood:
yjko∼dnorm(θjko, se2jko). (32)
DOI: 10.3310/hta20090 HEALTH TECHNOLOGY ASSESSMENT 2016 VOL. 20 NO. 9
© Queen’s Printer and Controller of HMSO 2016. This work was produced by Corbett et al. under the terms of a commissioning contract issued by the Secretary of State forHealth. This issue may be freely reproduced for the purposes of private research and study and extracts (or indeed, the full report) may be included in professional journalsprovided that suitable acknowledgement is made and the reproduction is not associated with any form of advertising. Applications for commercial reproduction should beaddressed to: NIHR Journals Library, National Institute for Health Research, Evaluation, Trials and Studies Coordinating Centre, Alpha House, University of Southampton SciencePark, Southampton SO16 7NS, UK.
283
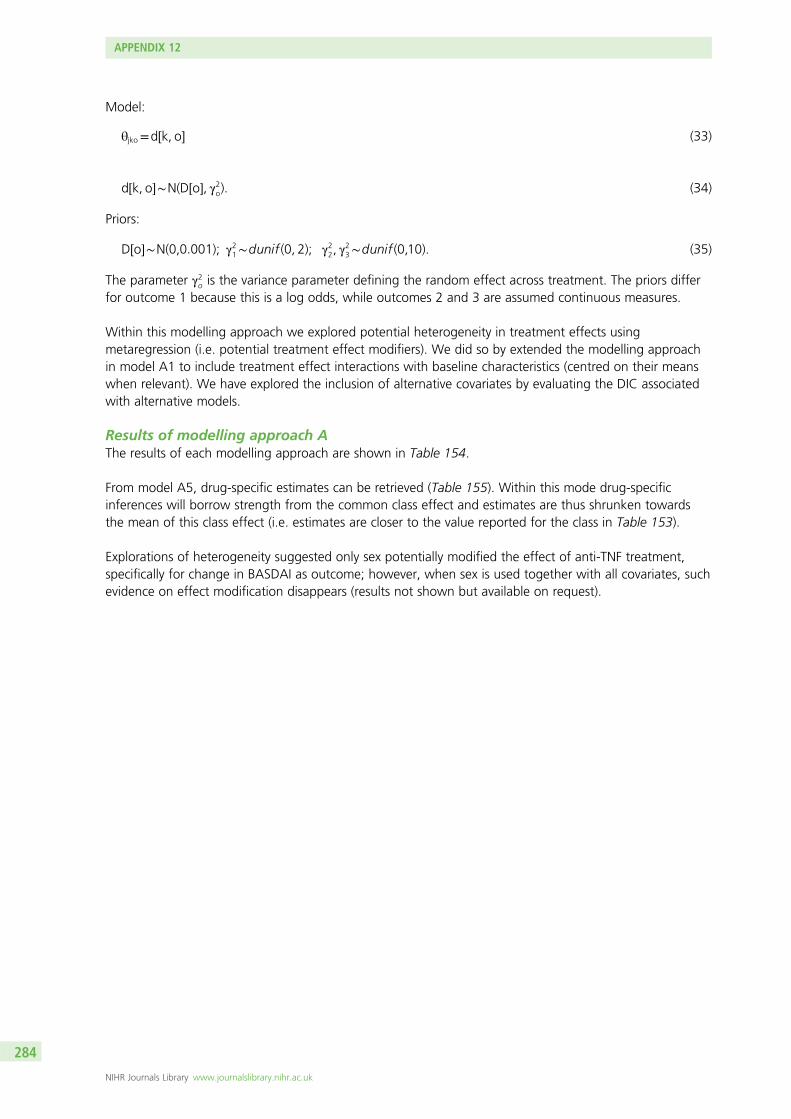
Model:
θjko=d½k, o� (33)
d½k, o�∼N(D½o�, γ2o). (34)
Priors:
D½o�∼N(0,0:001); γ21∼dunif (0, 2); γ22, γ23∼dunif (0,10). (35)
The parameter γ2o is the variance parameter defining the random effect across treatment. The priors differfor outcome 1 because this is a log odds, while outcomes 2 and 3 are assumed continuous measures.
Within this modelling approach we explored potential heterogeneity in treatment effects usingmetaregression (i.e. potential treatment effect modifiers). We did so by extended the modelling approachin model A1 to include treatment effect interactions with baseline characteristics (centred on their meanswhen relevant). We have explored the inclusion of alternative covariates by evaluating the DIC associatedwith alternative models.
Results of modelling approach AThe results of each modelling approach are shown in Table 154.
From model A5, drug-specific estimates can be retrieved (Table 155). Within this mode drug-specificinferences will borrow strength from the common class effect and estimates are thus shrunken towardsthe mean of this class effect (i.e. estimates are closer to the value reported for the class in Table 153).
Explorations of heterogeneity suggested only sex potentially modified the effect of anti-TNF treatment,specifically for change in BASDAI as outcome; however, when sex is used together with all covariates, suchevidence on effect modification disappears (results not shown but available on request).
APPENDIX 12
NIHR Journals Library www.journalslibrary.nihr.ac.uk
284
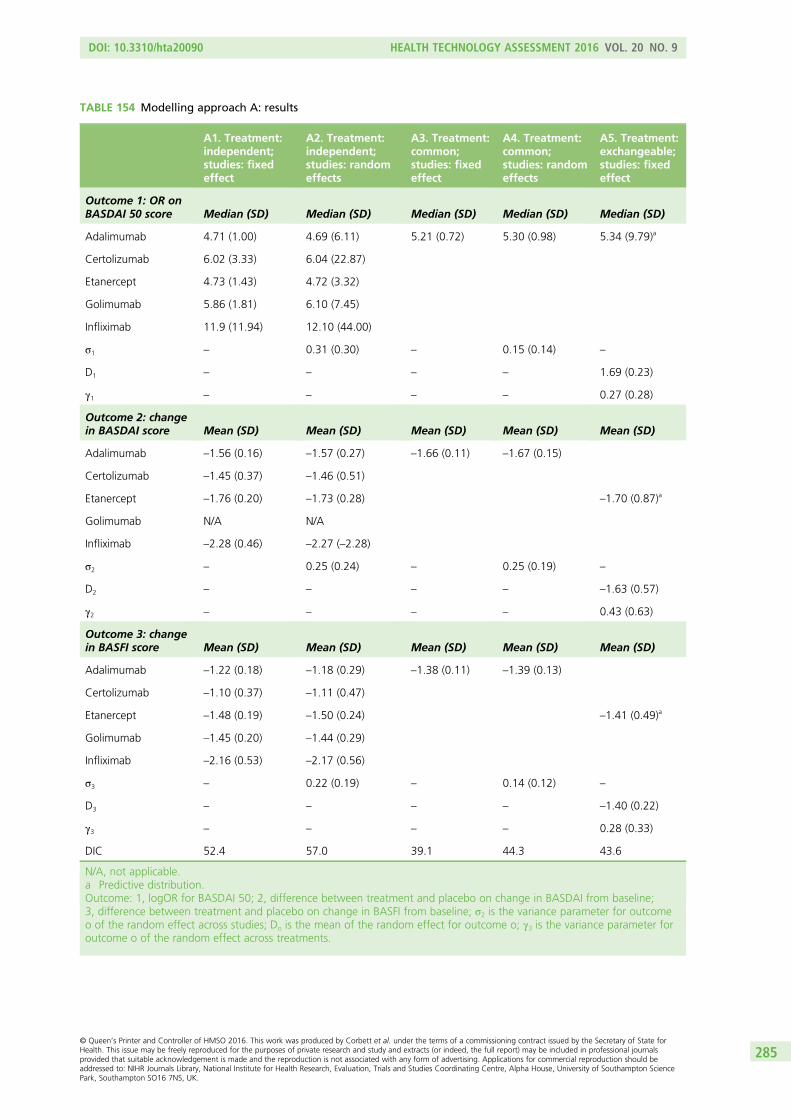
TABLE 154 Modelling approach A: results
A1. Treatment:independent;studies: fixedeffect
A2. Treatment:independent;studies: randomeffects
A3. Treatment:common;studies: fixedeffect
A4. Treatment:common;studies: randomeffects
A5. Treatment:exchangeable;studies: fixedeffect
Outcome 1: OR onBASDAI 50 score Median (SD) Median (SD) Median (SD) Median (SD) Median (SD)
Adalimumab 4.71 (1.00) 4.69 (6.11) 5.21 (0.72) 5.30 (0.98) 5.34 (9.79)a
Certolizumab 6.02 (3.33) 6.04 (22.87)
Etanercept 4.73 (1.43) 4.72 (3.32)
Golimumab 5.86 (1.81) 6.10 (7.45)
Infliximab 11.9 (11.94) 12.10 (44.00)
σ1 – 0.31 (0.30) – 0.15 (0.14) –
D1 – – – – 1.69 (0.23)
γ1 – – – – 0.27 (0.28)
Outcome 2: changein BASDAI score Mean (SD) Mean (SD) Mean (SD) Mean (SD) Mean (SD)
Adalimumab –1.56 (0.16) –1.57 (0.27) –1.66 (0.11) –1.67 (0.15)
Certolizumab –1.45 (0.37) –1.46 (0.51)
Etanercept –1.76 (0.20) –1.73 (0.28) –1.70 (0.87)a
Golimumab N/A N/A
Infliximab –2.28 (0.46) –2.27 (–2.28)
σ2 – 0.25 (0.24) – 0.25 (0.19) –
D2 – – – – –1.63 (0.57)
γ2 – – – – 0.43 (0.63)
Outcome 3: changein BASFI score Mean (SD) Mean (SD) Mean (SD) Mean (SD) Mean (SD)
Adalimumab –1.22 (0.18) –1.18 (0.29) –1.38 (0.11) –1.39 (0.13)
Certolizumab –1.10 (0.37) –1.11 (0.47)
Etanercept –1.48 (0.19) –1.50 (0.24) –1.41 (0.49)a
Golimumab –1.45 (0.20) –1.44 (0.29)
Infliximab –2.16 (0.53) –2.17 (0.56)
σ3 – 0.22 (0.19) – 0.14 (0.12) –
D3 – – – – –1.40 (0.22)
γ3 – – – – 0.28 (0.33)
DIC 52.4 57.0 39.1 44.3 43.6
N/A, not applicable.a Predictive distribution.Outcome: 1, logOR for BASDAI 50; 2, difference between treatment and placebo on change in BASDAI from baseline;3, difference between treatment and placebo on change in BASFI from baseline; σ2 is the variance parameter for outcomeo of the random effect across studies; Do is the mean of the random effect for outcome o; γ3 is the variance parameter foroutcome o of the random effect across treatments.
DOI: 10.3310/hta20090 HEALTH TECHNOLOGY ASSESSMENT 2016 VOL. 20 NO. 9
© Queen’s Printer and Controller of HMSO 2016. This work was produced by Corbett et al. under the terms of a commissioning contract issued by the Secretary of State forHealth. This issue may be freely reproduced for the purposes of private research and study and extracts (or indeed, the full report) may be included in professional journalsprovided that suitable acknowledgement is made and the reproduction is not associated with any form of advertising. Applications for commercial reproduction should beaddressed to: NIHR Journals Library, National Institute for Health Research, Evaluation, Trials and Studies Coordinating Centre, Alpha House, University of Southampton SciencePark, Southampton SO16 7NS, UK.
285
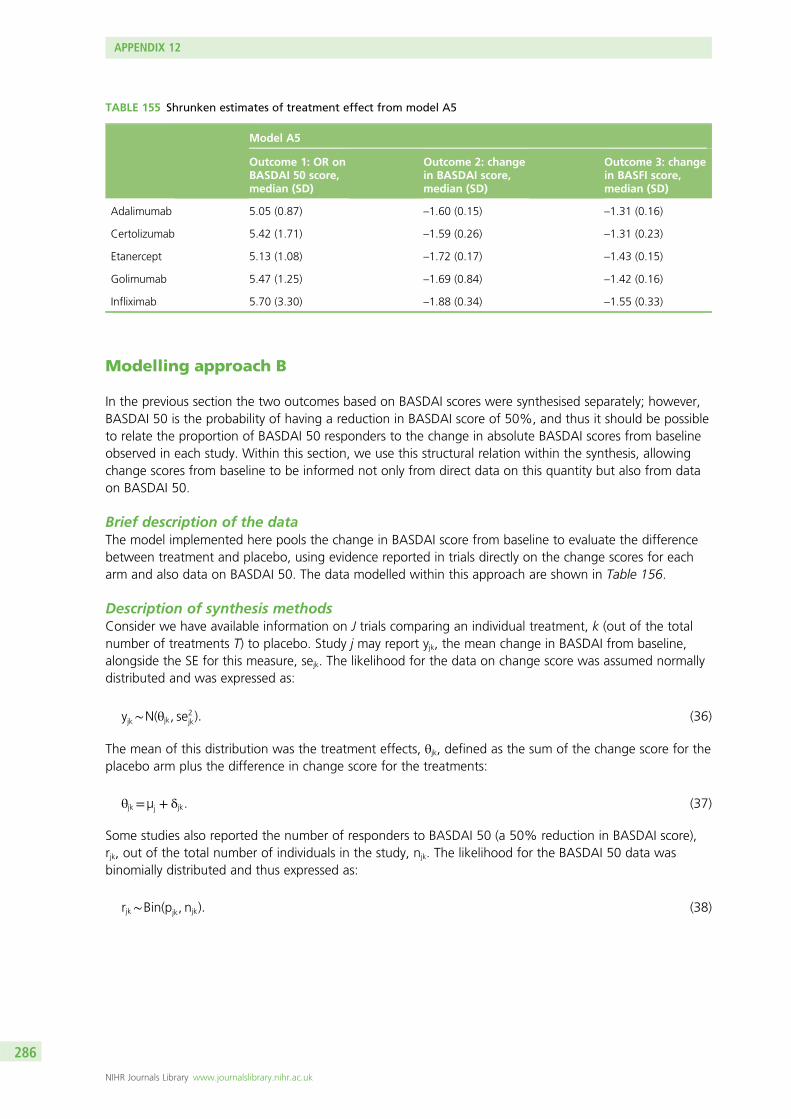
Modelling approach B
In the previous section the two outcomes based on BASDAI scores were synthesised separately; however,BASDAI 50 is the probability of having a reduction in BASDAI score of 50%, and thus it should be possibleto relate the proportion of BASDAI 50 responders to the change in absolute BASDAI scores from baselineobserved in each study. Within this section, we use this structural relation within the synthesis, allowingchange scores from baseline to be informed not only from direct data on this quantity but also from dataon BASDAI 50.
Brief description of the dataThe model implemented here pools the change in BASDAI score from baseline to evaluate the differencebetween treatment and placebo, using evidence reported in trials directly on the change scores for eacharm and also data on BASDAI 50. The data modelled within this approach are shown in Table 156.
Description of synthesis methodsConsider we have available information on J trials comparing an individual treatment, k (out of the totalnumber of treatments T) to placebo. Study j may report yjk, the mean change in BASDAI from baseline,alongside the SE for this measure, sejk. The likelihood for the data on change score was assumed normallydistributed and was expressed as:
yjk∼N(θjk, se2jk): (36)
The mean of this distribution was the treatment effects, θjk, defined as the sum of the change score for theplacebo arm plus the difference in change score for the treatments:
θjk=µj + δjk. (37)
Some studies also reported the number of responders to BASDAI 50 (a 50% reduction in BASDAI score),rjk, out of the total number of individuals in the study, njk. The likelihood for the BASDAI 50 data wasbinomially distributed and thus expressed as:
rjk∼Bin(pjk, njk): (38)
TABLE 155 Shrunken estimates of treatment effect from model A5
Model A5
Outcome 1: OR onBASDAI 50 score,median (SD)
Outcome 2: changein BASDAI score,median (SD)
Outcome 3: changein BASFI score,median (SD)
Adalimumab 5.05 (0.87) –1.60 (0.15) –1.31 (0.16)
Certolizumab 5.42 (1.71) –1.59 (0.26) –1.31 (0.23)
Etanercept 5.13 (1.08) –1.72 (0.17) –1.43 (0.15)
Golimumab 5.47 (1.25) –1.69 (0.84) –1.42 (0.16)
Infliximab 5.70 (3.30) –1.88 (0.34) –1.55 (0.33)
APPENDIX 12
NIHR Journals Library www.journalslibrary.nihr.ac.uk
286
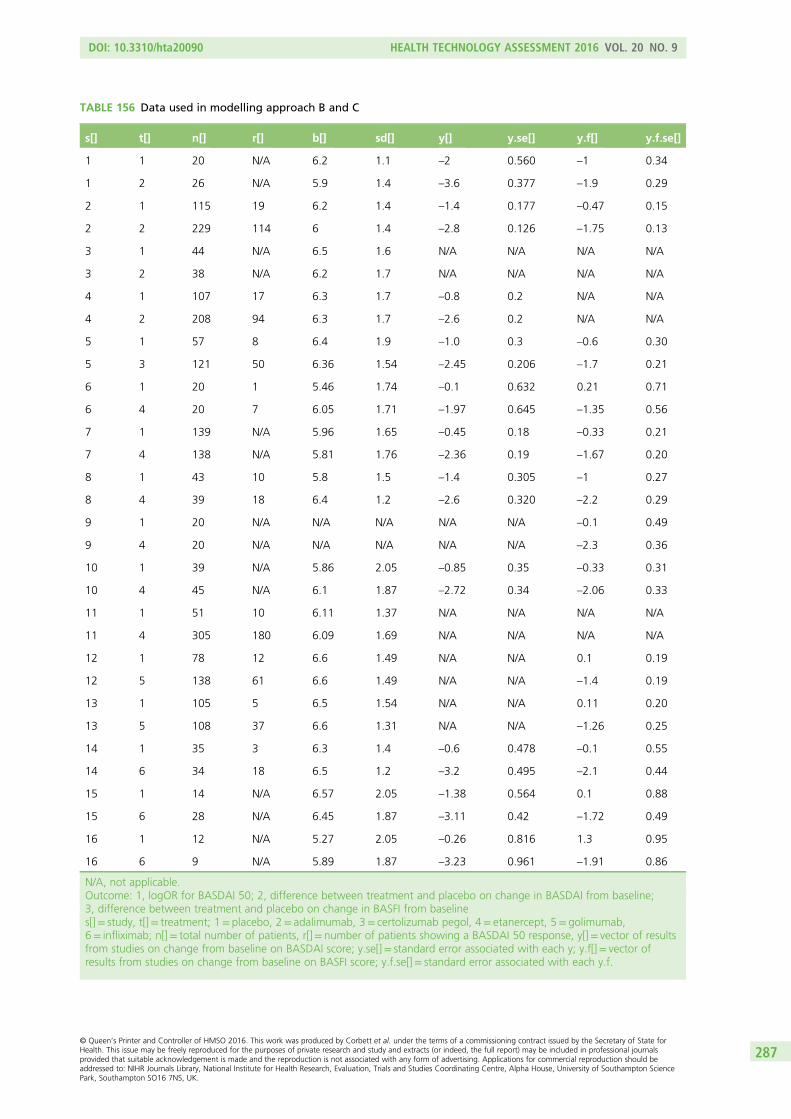
TABLE 156 Data used in modelling approach B and C
s[] t[] n[] r[] b[] sd[] y[] y.se[] y.f[] y.f.se[]
1 1 20 N/A 6.2 1.1 –2 0.560 –1 0.34
1 2 26 N/A 5.9 1.4 –3.6 0.377 –1.9 0.29
2 1 115 19 6.2 1.4 –1.4 0.177 –0.47 0.15
2 2 229 114 6 1.4 –2.8 0.126 –1.75 0.13
3 1 44 N/A 6.5 1.6 N/A N/A N/A N/A
3 2 38 N/A 6.2 1.7 N/A N/A N/A N/A
4 1 107 17 6.3 1.7 –0.8 0.2 N/A N/A
4 2 208 94 6.3 1.7 –2.6 0.2 N/A N/A
5 1 57 8 6.4 1.9 –1.0 0.3 –0.6 0.30
5 3 121 50 6.36 1.54 –2.45 0.206 –1.7 0.21
6 1 20 1 5.46 1.74 –0.1 0.632 0.21 0.71
6 4 20 7 6.05 1.71 –1.97 0.645 –1.35 0.56
7 1 139 N/A 5.96 1.65 –0.45 0.18 –0.33 0.21
7 4 138 N/A 5.81 1.76 –2.36 0.19 –1.67 0.20
8 1 43 10 5.8 1.5 –1.4 0.305 –1 0.27
8 4 39 18 6.4 1.2 –2.6 0.320 –2.2 0.29
9 1 20 N/A N/A N/A N/A N/A –0.1 0.49
9 4 20 N/A N/A N/A N/A N/A –2.3 0.36
10 1 39 N/A 5.86 2.05 –0.85 0.35 –0.33 0.31
10 4 45 N/A 6.1 1.87 –2.72 0.34 –2.06 0.33
11 1 51 10 6.11 1.37 N/A N/A N/A N/A
11 4 305 180 6.09 1.69 N/A N/A N/A N/A
12 1 78 12 6.6 1.49 N/A N/A 0.1 0.19
12 5 138 61 6.6 1.49 N/A N/A –1.4 0.19
13 1 105 5 6.5 1.54 N/A N/A 0.11 0.20
13 5 108 37 6.6 1.31 N/A N/A –1.26 0.25
14 1 35 3 6.3 1.4 –0.6 0.478 –0.1 0.55
14 6 34 18 6.5 1.2 –3.2 0.495 –2.1 0.44
15 1 14 N/A 6.57 2.05 –1.38 0.564 0.1 0.88
15 6 28 N/A 6.45 1.87 –3.11 0.42 –1.72 0.49
16 1 12 N/A 5.27 2.05 –0.26 0.816 1.3 0.95
16 6 9 N/A 5.89 1.87 –3.23 0.961 –1.91 0.86
N/A, not applicable.Outcome: 1, logOR for BASDAI 50; 2, difference between treatment and placebo on change in BASDAI from baseline;3, difference between treatment and placebo on change in BASFI from baselines[]= study, t[]= treatment; 1= placebo, 2= adalimumab, 3= certolizumab pegol, 4= etanercept, 5= golimumab,6= infliximab; n[]= total number of patients, r[]= number of patients showing a BASDAI 50 response, y[]= vector of resultsfrom studies on change from baseline on BASDAI score; y.se[]= standard error associated with each y; y.f[]= vector ofresults from studies on change from baseline on BASFI score; y.f.se[]= standard error associated with each y.f.
DOI: 10.3310/hta20090 HEALTH TECHNOLOGY ASSESSMENT 2016 VOL. 20 NO. 9
© Queen’s Printer and Controller of HMSO 2016. This work was produced by Corbett et al. under the terms of a commissioning contract issued by the Secretary of State forHealth. This issue may be freely reproduced for the purposes of private research and study and extracts (or indeed, the full report) may be included in professional journalsprovided that suitable acknowledgement is made and the reproduction is not associated with any form of advertising. Applications for commercial reproduction should beaddressed to: NIHR Journals Library, National Institute for Health Research, Evaluation, Trials and Studies Coordinating Centre, Alpha House, University of Southampton SciencePark, Southampton SO16 7NS, UK.
287
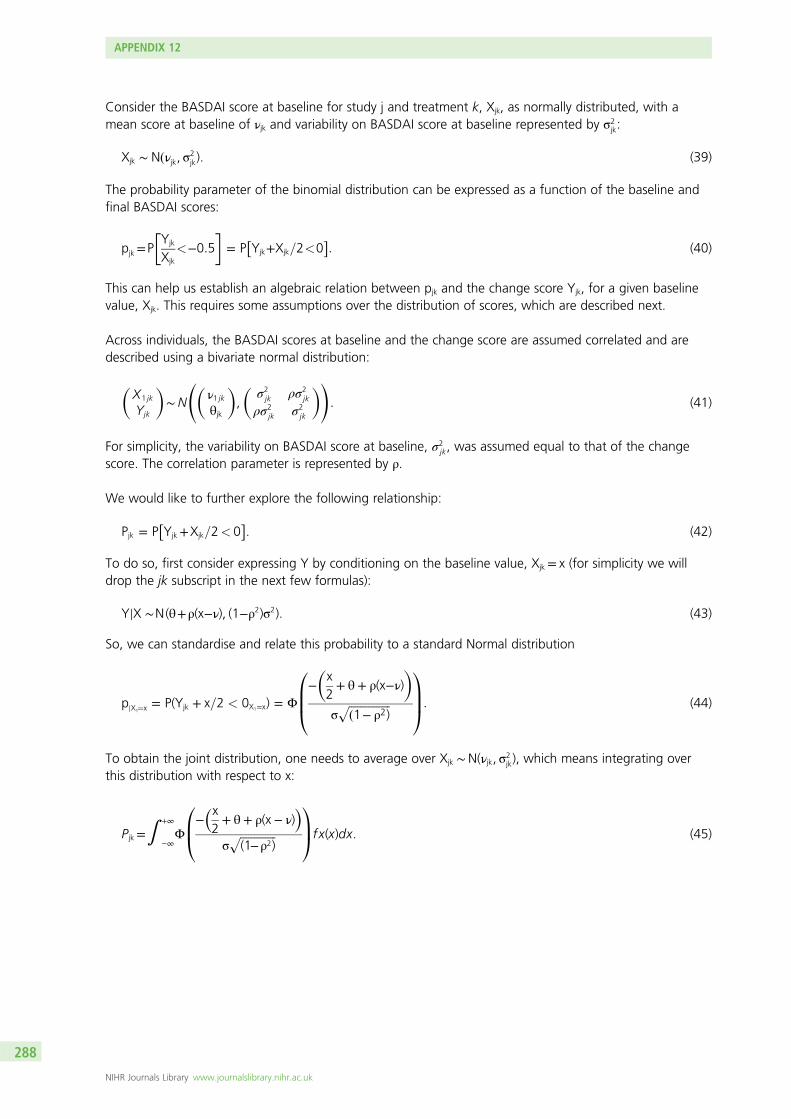
Consider the BASDAI score at baseline for study j and treatment k, Xjk, as normally distributed, with amean score at baseline of νjk and variability on BASDAI score at baseline represented by σ2
jk:
Xjk ∼ Nðνjk, σ2jk). (39)
The probability parameter of the binomial distribution can be expressed as a function of the baseline andfinal BASDAI scores:
pjk=PYjk
Xjk
<−0:5� �
= P�Yjk+Xjk=2<0
�: (40)
This can help us establish an algebraic relation between pjk and the change score Yjk, for a given baselinevalue, Xjk. This requires some assumptions over the distribution of scores, which are described next.
Across individuals, the BASDAI scores at baseline and the change score are assumed correlated and aredescribed using a bivariate normal distribution:
X1 jk
Yjk
� �∼ N
ν1 jkθjk
� �,
σ2jk ρσ2
jk
ρσ2jk σ2
jk
� �!:
(41)
For simplicity, the variability on BASDAI score at baseline, σ2jk, was assumed equal to that of the change
score. The correlation parameter is represented by ρ.
We would like to further explore the following relationship:
Pjk = P�Yjk+Xjk=2< 0
�. (42)
To do so, first consider expressing Y by conditioning on the baseline value, Xjk= x (for simplicity we willdrop the jk subscript in the next few formulas):
YjX ∼N(θ+ρ(x−ν), (1−ρ2)σ2). (43)
So, we can standardise and relate this probability to a standard Normal distribution
pjX1¼x = P(Yjk + x=2 < 0X1=x) = Φ−�x2+ θ + ρ(x−ν)
�σffiffiffiffiffiffiffiffiffiffiffiffiffiffiffið1− ρ2)
p0BB@
1CCA: (44)
To obtain the joint distribution, one needs to average over Xjk ∼N(νjk, σ2jk), which means integrating over
this distribution with respect to x:
P jk=∫+∞
−∞Φ
−x2+ θ + ρ(x− ν)
σffiffiffiffiffiffiffiffiffiffiffiffiffi(1−ρ2)
p0B@
1CAf x(x)dx. (45)
APPENDIX 12
NIHR Journals Library www.journalslibrary.nihr.ac.uk
288
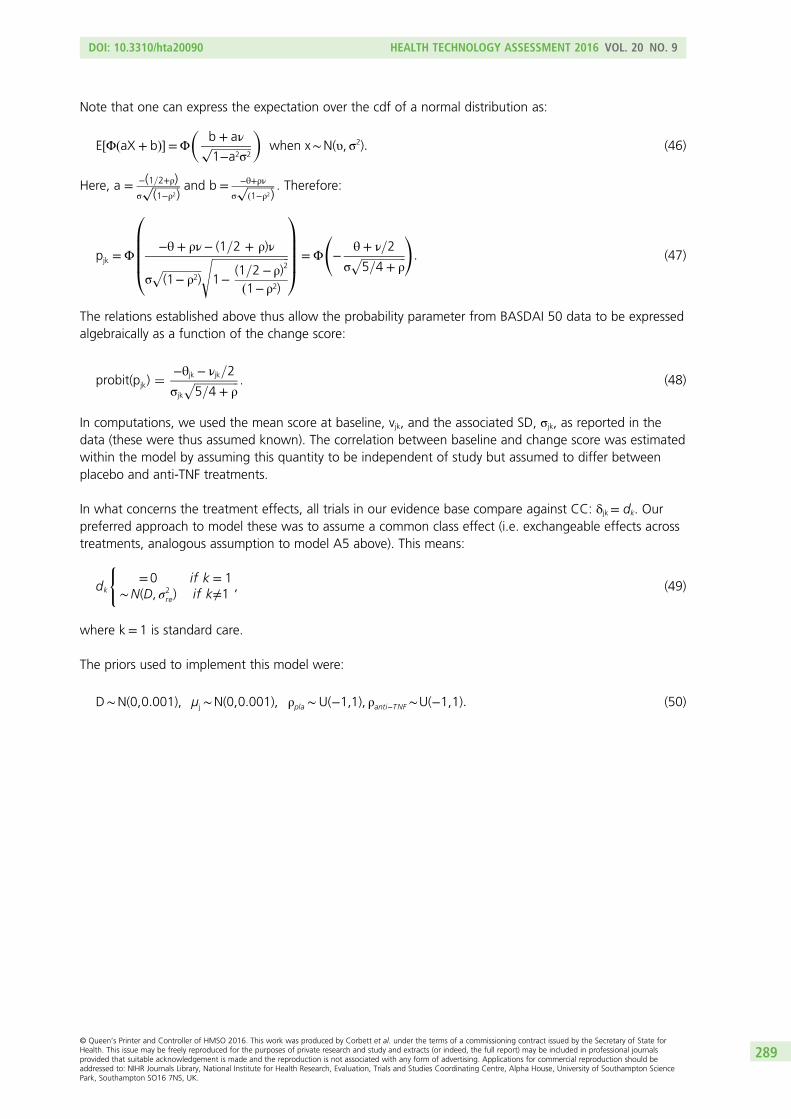
Note that one can express the expectation over the cdf of a normal distribution as:
E½ΦðaX + bÞ�=Φ�
b + aνffiffiffiffiffiffiffiffiffiffiffiffiffiffi1−a2σ2
p�
when x∼N(υ, σ2): (46)
Here, a = −(1=2+ρ)σffiffiffiffiffiffiffiffiffiffi(1−ρ2)
p and b = −θ+ρν
σffiffiffiffiffiffiffiffiffiffið1−ρ2)
p . Therefore:
pjk =Φ−θ + ρν− (1=2 + ρ)ν
σffiffiffiffiffiffiffiffiffiffiffiffiffiffi(1− ρ2)
p ffiffiffiffiffiffiffiffiffiffiffiffiffiffiffiffiffiffiffiffiffiffiffiffiffiffiffiffi1−
(1=2− ρ)2
ð1− ρ2)
s0BBBB@
1CCCCA =Φ −
θ + ν=2σffiffiffiffiffiffiffiffiffiffiffiffiffiffiffiffi5=4 + ρ
p !
: (47)
The relations established above thus allow the probability parameter from BASDAI 50 data to be expressedalgebraically as a function of the change score:
probit(pjk) ¼−θjk − νjk=2σjk
ffiffiffiffiffiffiffiffiffiffiffiffiffiffiffiffi5=4 + ρ
p . (48)
In computations, we used the mean score at baseline, vjk, and the associated SD, σjk, as reported in thedata (these were thus assumed known). The correlation between baseline and change score was estimatedwithin the model by assuming this quantity to be independent of study but assumed to differ betweenplacebo and anti-TNF treatments.
In what concerns the treatment effects, all trials in our evidence base compare against CC: δjk= dk. Ourpreferred approach to model these was to assume a common class effect (i.e. exchangeable effects acrosstreatments, analogous assumption to model A5 above). This means:
dk
(=0 if k = 1
∼N(D, σ2re) if k≠1 , (49)
where k= 1 is standard care.
The priors used to implement this model were:
D∼N(0,0:001), µj ∼N(0,0:001), ρpla ∼U(−1,1), ρanti−TNF∼U(−1,1): (50)
DOI: 10.3310/hta20090 HEALTH TECHNOLOGY ASSESSMENT 2016 VOL. 20 NO. 9
© Queen’s Printer and Controller of HMSO 2016. This work was produced by Corbett et al. under the terms of a commissioning contract issued by the Secretary of State forHealth. This issue may be freely reproduced for the purposes of private research and study and extracts (or indeed, the full report) may be included in professional journalsprovided that suitable acknowledgement is made and the reproduction is not associated with any form of advertising. Applications for commercial reproduction should beaddressed to: NIHR Journals Library, National Institute for Health Research, Evaluation, Trials and Studies Coordinating Centre, Alpha House, University of Southampton SciencePark, Southampton SO16 7NS, UK.
289
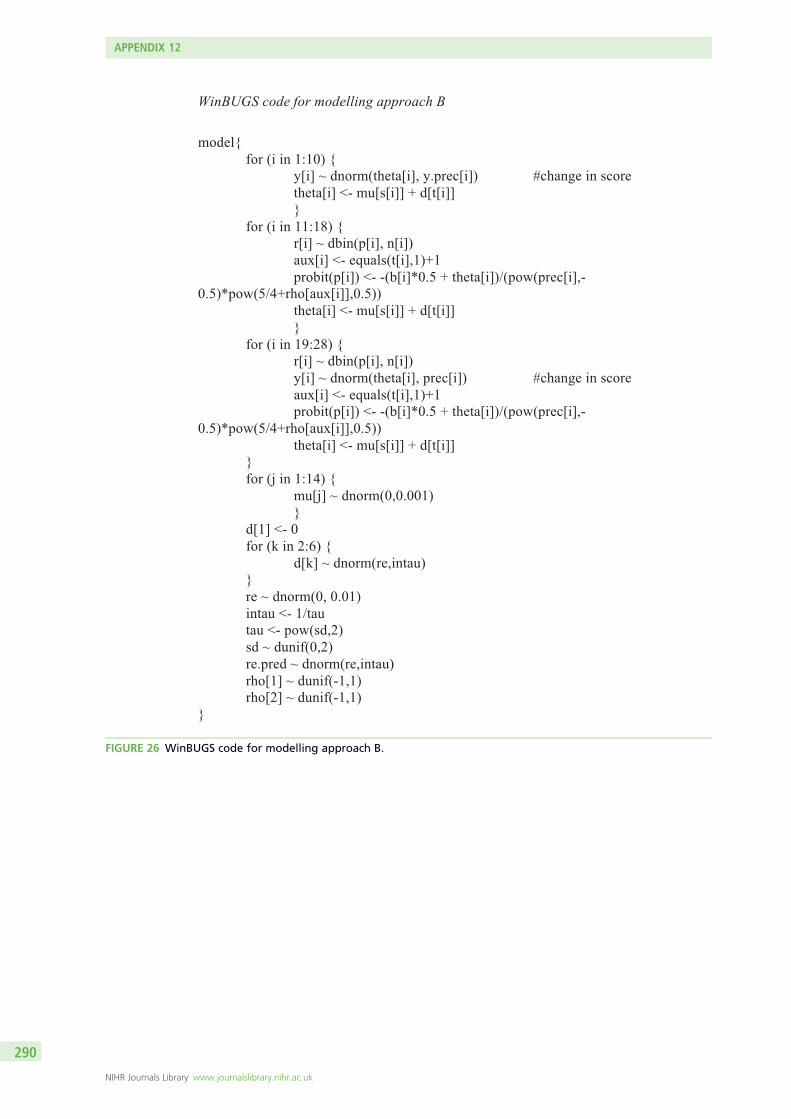
WinBUGS code for modelling approach B
model{
for (i in 1:10) {
y[i] ~ dnorm(theta[i], y.prec[i]) #change in score
theta[i] <- mu[s[i]] + d[t[i]]
}
for (i in 11:18) {
r[i] ~ dbin(p[i], n[i])
aux[i] <- equals(t[i],1)+1
probit(p[i]) <- -(b[i]*0.5 + theta[i])/(pow(prec[i],-
0.5)*pow(5/4+rho[aux[i]],0.5))
theta[i] <- mu[s[i]] + d[t[i]]
}
for (i in 19:28) {
r[i] ~ dbin(p[i], n[i])
y[i] ~ dnorm(theta[i], prec[i]) #change in score
aux[i] <- equals(t[i],1)+1
probit(p[i]) <- -(b[i]*0.5 + theta[i])/(pow(prec[i],-
0.5)*pow(5/4+rho[aux[i]],0.5))
theta[i] <- mu[s[i]] + d[t[i]]
}
for (j in 1:14) {
mu[j] ~ dnorm(0,0.001)
}
d[1] <- 0
for (k in 2:6) {
d[k] ~ dnorm(re,intau)
}
re ~ dnorm(0, 0.01)
intau <- 1/tau
tau <- pow(sd,2)
sd ~ dunif(0,2)
re.pred ~ dnorm(re,intau)
rho[1] ~ dunif(-1,1)
rho[2] ~ dunif(-1,1)
}
FIGURE 26 WinBUGS code for modelling approach B.
APPENDIX 12
NIHR Journals Library www.journalslibrary.nihr.ac.uk
290
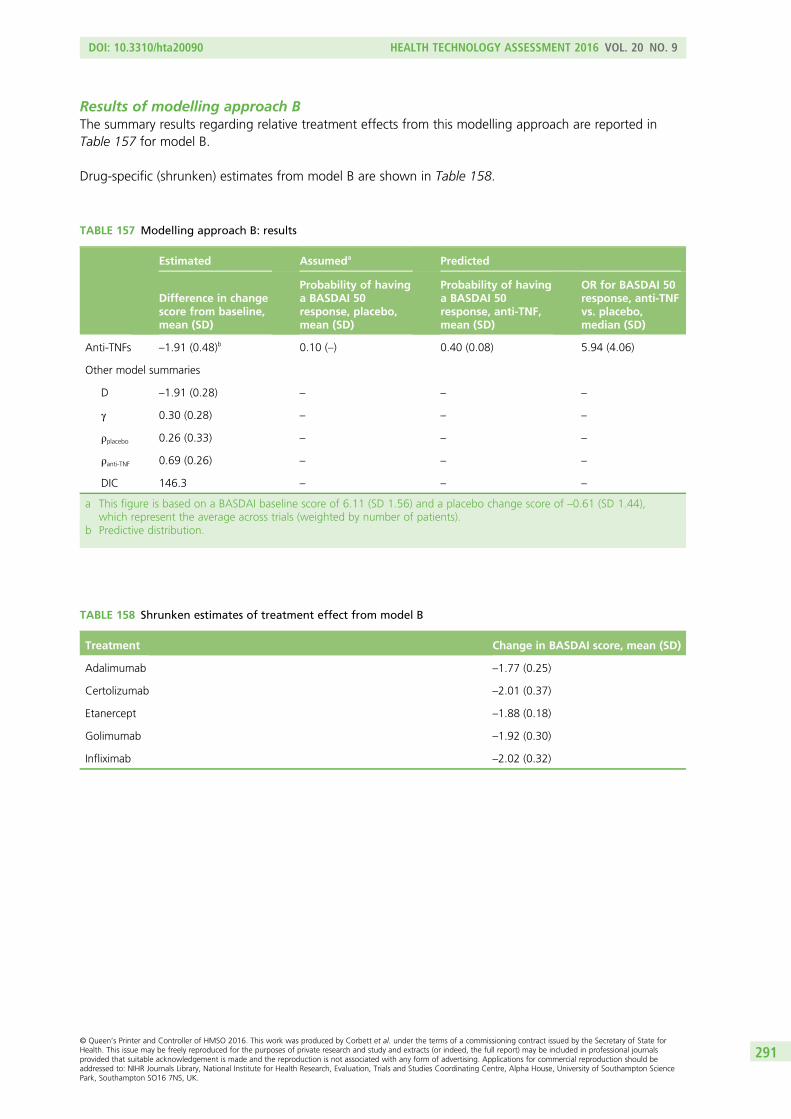
Results of modelling approach BThe summary results regarding relative treatment effects from this modelling approach are reported inTable 157 for model B.
Drug-specific (shrunken) estimates from model B are shown in Table 158.
TABLE 157 Modelling approach B: results
Estimated Assumeda Predicted
Difference in changescore from baseline,mean (SD)
Probability of havinga BASDAI 50response, placebo,mean (SD)
Probability of havinga BASDAI 50response, anti-TNF,mean (SD)
OR for BASDAI 50response, anti-TNFvs. placebo,median (SD)
Anti-TNFs –1.91 (0.48)b 0.10 (–) 0.40 (0.08) 5.94 (4.06)
Other model summaries
D –1.91 (0.28) – – –
γ 0.30 (0.28) – – –
ρplacebo 0.26 (0.33) – – –
ρanti-TNF 0.69 (0.26) – – –
DIC 146.3 – – –
a This figure is based on a BASDAI baseline score of 6.11 (SD 1.56) and a placebo change score of –0.61 (SD 1.44),which represent the average across trials (weighted by number of patients).
b Predictive distribution.
TABLE 158 Shrunken estimates of treatment effect from model B
Treatment Change in BASDAI score, mean (SD)
Adalimumab –1.77 (0.25)
Certolizumab –2.01 (0.37)
Etanercept –1.88 (0.18)
Golimumab –1.92 (0.30)
Infliximab –2.02 (0.32)
DOI: 10.3310/hta20090 HEALTH TECHNOLOGY ASSESSMENT 2016 VOL. 20 NO. 9
© Queen’s Printer and Controller of HMSO 2016. This work was produced by Corbett et al. under the terms of a commissioning contract issued by the Secretary of State forHealth. This issue may be freely reproduced for the purposes of private research and study and extracts (or indeed, the full report) may be included in professional journalsprovided that suitable acknowledgement is made and the reproduction is not associated with any form of advertising. Applications for commercial reproduction should beaddressed to: NIHR Journals Library, National Institute for Health Research, Evaluation, Trials and Studies Coordinating Centre, Alpha House, University of Southampton SciencePark, Southampton SO16 7NS, UK.
291
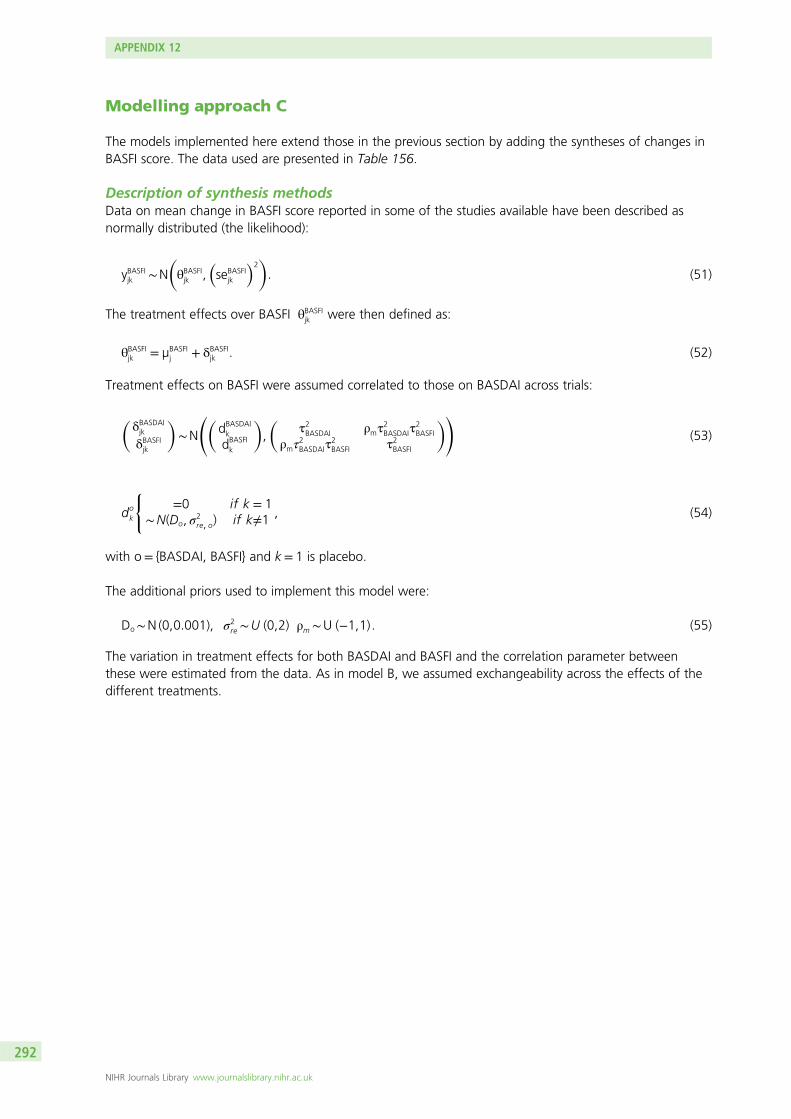
Modelling approach C
The models implemented here extend those in the previous section by adding the syntheses of changes inBASFI score. The data used are presented in Table 156.
Description of synthesis methodsData on mean change in BASFI score reported in some of the studies available have been described asnormally distributed (the likelihood):
yBASFIjk ∼N θBASFIjk , seBASFIjk
2� �
: (51)
The treatment effects over BASFI θBASFIjk were then defined as:
θBASFIjk = µBASFIj + δBASFI
jk . (52)
Treatment effects on BASFI were assumed correlated to those on BASDAI across trials:
δBASDAIjk
δBASFIjk
� �∼N
dBASDAIk
dBASFIk
� �,
τ2BASDAI ρmτ2BASDAIτ
2BASFI
ρmτ2BASDAIτ
2BASFI τ2BASFI
� �!(53)
dok
(=0 if k = 1
∼N(Do, σ2re, o) if k≠1 , (54)
with o= {BASDAI, BASFI} and k= 1 is placebo.
The additional priors used to implement this model were:
Do∼N (0,0:001), σ2re ∼U (0,2) ρm ∼U (−1,1) . (55)
The variation in treatment effects for both BASDAI and BASFI and the correlation parameter betweenthese were estimated from the data. As in model B, we assumed exchangeability across the effects of thedifferent treatments.
APPENDIX 12
NIHR Journals Library www.journalslibrary.nihr.ac.uk
292
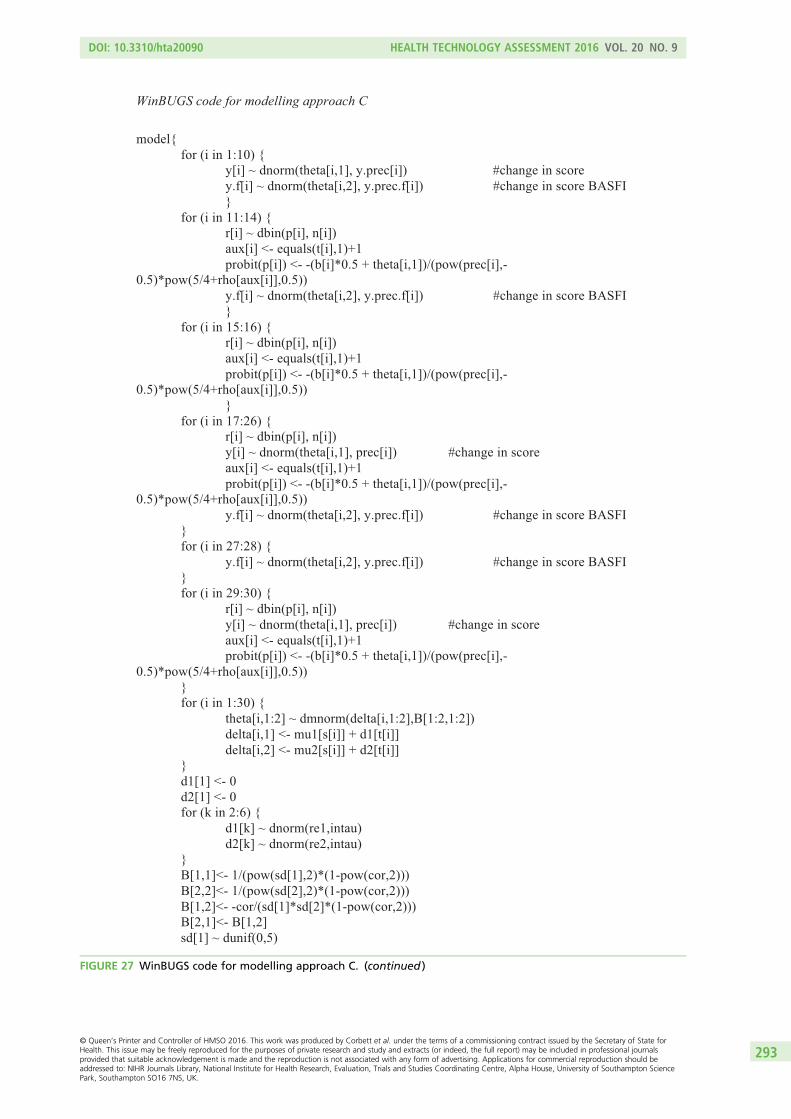
WinBUGS code for modelling approach C
model{ for (i in 1:10) { y[i] ~ dnorm(theta[i,1], y.prec[i]) #change in score y.f[i] ~ dnorm(theta[i,2], y.prec.f[i]) #change in score BASFI } for (i in 11:14) { r[i] ~ dbin(p[i], n[i]) aux[i] <- equals(t[i],1)+1 probit(p[i]) <- -(b[i]*0.5 + theta[i,1])/(pow(prec[i],-0.5)*pow(5/4+rho[aux[i]],0.5)) y.f[i] ~ dnorm(theta[i,2], y.prec.f[i]) #change in score BASFI } for (i in 15:16) { r[i] ~ dbin(p[i], n[i]) aux[i] <- equals(t[i],1)+1 probit(p[i]) <- -(b[i]*0.5 + theta[i,1])/(pow(prec[i],-0.5)*pow(5/4+rho[aux[i]],0.5)) } for (i in 17:26) { r[i] ~ dbin(p[i], n[i]) y[i] ~ dnorm(theta[i,1], prec[i]) #change in score aux[i] <- equals(t[i],1)+1 probit(p[i]) <- -(b[i]*0.5 + theta[i,1])/(pow(prec[i],-0.5)*pow(5/4+rho[aux[i]],0.5)) y.f[i] ~ dnorm(theta[i,2], y.prec.f[i]) #change in score BASFI } for (i in 27:28) { y.f[i] ~ dnorm(theta[i,2], y.prec.f[i]) #change in score BASFI }
for (i in 29:30) { r[i] ~ dbin(p[i], n[i]) y[i] ~ dnorm(theta[i,1], prec[i]) #change in score aux[i] <- equals(t[i],1)+1 probit(p[i]) <- -(b[i]*0.5 + theta[i,1])/(pow(prec[i],-0.5)*pow(5/4+rho[aux[i]],0.5)) } for (i in 1:30) { theta[i,1:2] ~ dmnorm(delta[i,1:2],B[1:2,1:2]) delta[i,1] <- mu1[s[i]] + d1[t[i]] delta[i,2] <- mu2[s[i]] + d2[t[i]] } d1[1] <- 0 d2[1] <- 0 for (k in 2:6) { d1[k] ~ dnorm(re1,intau) d2[k] ~ dnorm(re2,intau) } B[1,1]<- 1/(pow(sd[1],2)*(1-pow(cor,2))) B[2,2]<- 1/(pow(sd[2],2)*(1-pow(cor,2))) B[1,2]<- -cor/(sd[1]*sd[2]*(1-pow(cor,2))) B[2,1]<- B[1,2] sd[1] ~ dunif(0,5)
FIGURE 27 WinBUGS code for modelling approach C. (continued )
DOI: 10.3310/hta20090 HEALTH TECHNOLOGY ASSESSMENT 2016 VOL. 20 NO. 9
© Queen’s Printer and Controller of HMSO 2016. This work was produced by Corbett et al. under the terms of a commissioning contract issued by the Secretary of State forHealth. This issue may be freely reproduced for the purposes of private research and study and extracts (or indeed, the full report) may be included in professional journalsprovided that suitable acknowledgement is made and the reproduction is not associated with any form of advertising. Applications for commercial reproduction should beaddressed to: NIHR Journals Library, National Institute for Health Research, Evaluation, Trials and Studies Coordinating Centre, Alpha House, University of Southampton SciencePark, Southampton SO16 7NS, UK.
293
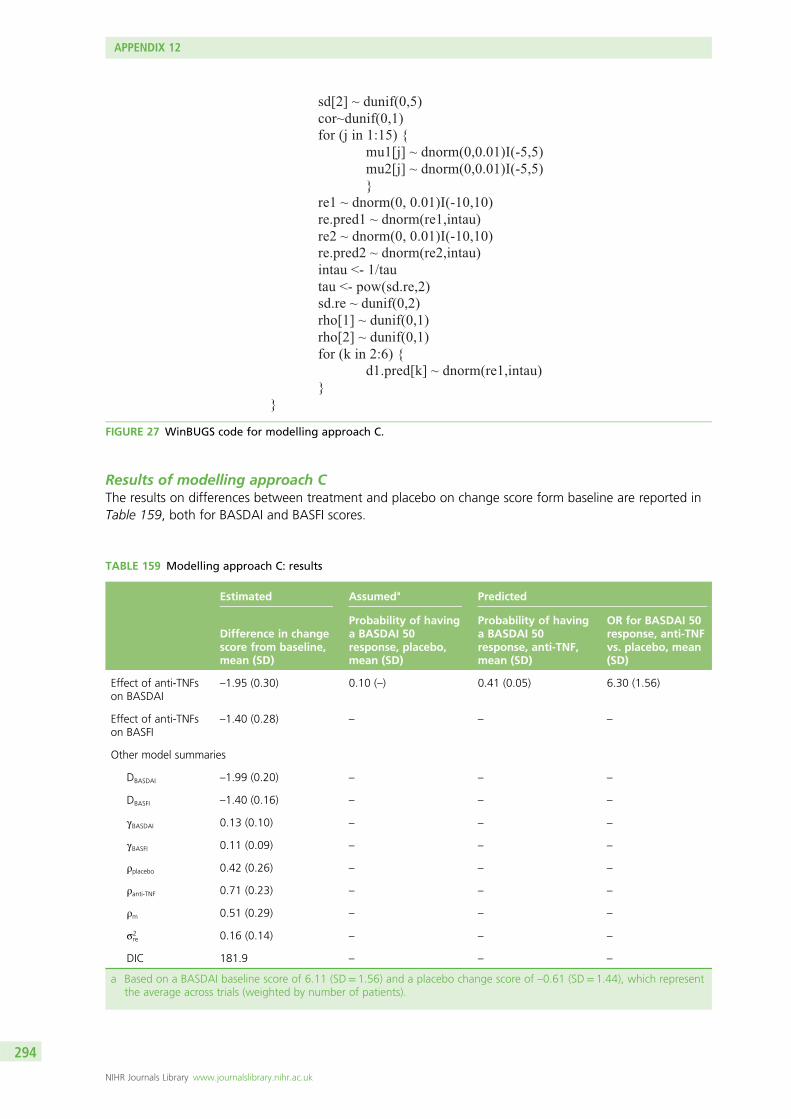
sd[2] ~ dunif(0,5) cor~dunif(0,1) for (j in 1:15) { mu1[j] ~ dnorm(0,0.01)I(-5,5) mu2[j] ~ dnorm(0,0.01)I(-5,5) } re1 ~ dnorm(0, 0.01)I(-10,10) re.pred1 ~ dnorm(re1,intau) re2 ~ dnorm(0, 0.01)I(-10,10) re.pred2 ~ dnorm(re2,intau) intau <- 1/tau tau <- pow(sd.re,2) sd.re ~ dunif(0,2) rho[1] ~ dunif(0,1) rho[2] ~ dunif(0,1) for (k in 2:6) { d1.pred[k] ~ dnorm(re1,intau) } }
FIGURE 27 WinBUGS code for modelling approach C.
Results of modelling approach CThe results on differences between treatment and placebo on change score form baseline are reported inTable 159, both for BASDAI and BASFI scores.
TABLE 159 Modelling approach C: results
Estimated Assumeda Predicted
Difference in changescore from baseline,mean (SD)
Probability of havinga BASDAI 50response, placebo,mean (SD)
Probability of havinga BASDAI 50response, anti-TNF,mean (SD)
OR for BASDAI 50response, anti-TNFvs. placebo, mean(SD)
Effect of anti-TNFson BASDAI
–1.95 (0.30) 0.10 (–) 0.41 (0.05) 6.30 (1.56)
Effect of anti-TNFson BASFI
–1.40 (0.28) – – –
Other model summaries
DBASDAI –1.99 (0.20) – – –
DBASFI –1.40 (0.16) – – –
γBASDAI 0.13 (0.10) – – –
γBASFI 0.11 (0.09) – – –
ρplacebo 0.42 (0.26) – – –
ρanti-TNF 0.71 (0.23) – – –
ρm 0.51 (0.29) – – –
σ2re 0.16 (0.14) – – –
DIC 181.9 – – –
a Based on a BASDAI baseline score of 6.11 (SD= 1.56) and a placebo change score of –0.61 (SD= 1.44), which representthe average across trials (weighted by number of patients).
APPENDIX 12
NIHR Journals Library www.journalslibrary.nihr.ac.uk
294
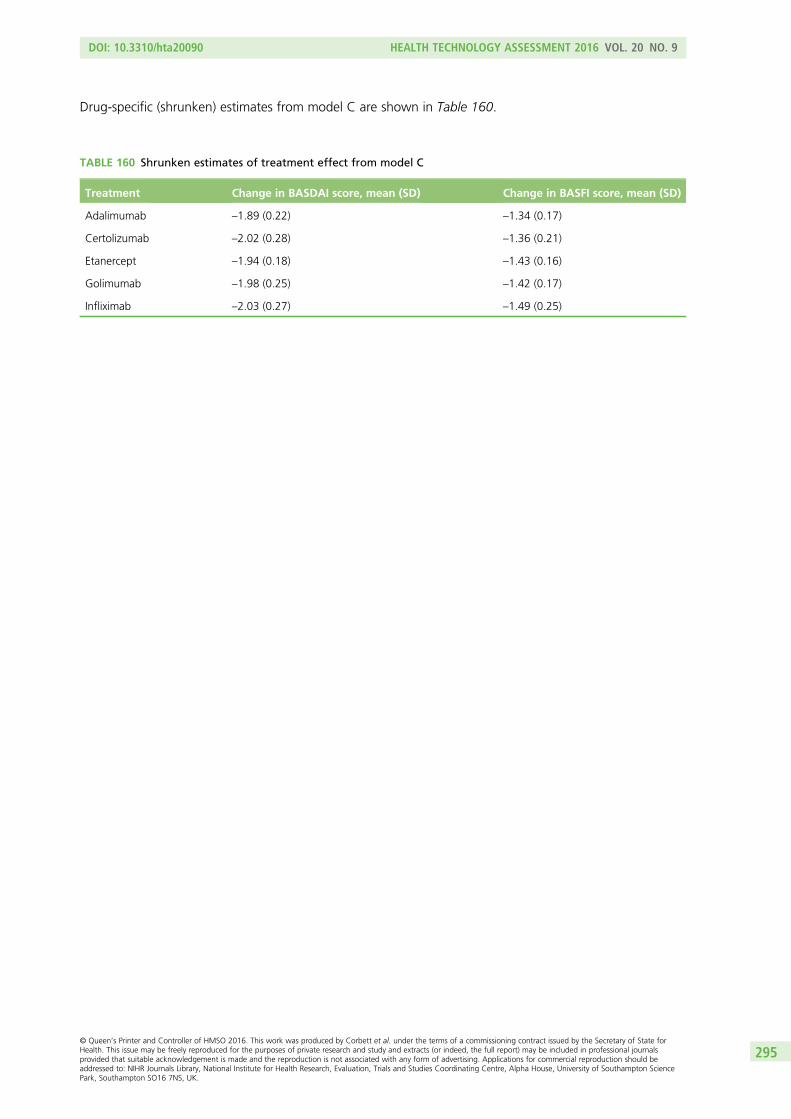
Drug-specific (shrunken) estimates from model C are shown in Table 160.
TABLE 160 Shrunken estimates of treatment effect from model C
Treatment Change in BASDAI score, mean (SD) Change in BASFI score, mean (SD)
Adalimumab –1.89 (0.22) –1.34 (0.17)
Certolizumab –2.02 (0.28) –1.36 (0.21)
Etanercept –1.94 (0.18) –1.43 (0.16)
Golimumab –1.98 (0.25) –1.42 (0.17)
Infliximab –2.03 (0.27) –1.49 (0.25)
DOI: 10.3310/hta20090 HEALTH TECHNOLOGY ASSESSMENT 2016 VOL. 20 NO. 9
© Queen’s Printer and Controller of HMSO 2016. This work was produced by Corbett et al. under the terms of a commissioning contract issued by the Secretary of State forHealth. This issue may be freely reproduced for the purposes of private research and study and extracts (or indeed, the full report) may be included in professional journalsprovided that suitable acknowledgement is made and the reproduction is not associated with any form of advertising. Applications for commercial reproduction should beaddressed to: NIHR Journals Library, National Institute for Health Research, Evaluation, Trials and Studies Coordinating Centre, Alpha House, University of Southampton SciencePark, Southampton SO16 7NS, UK.
295

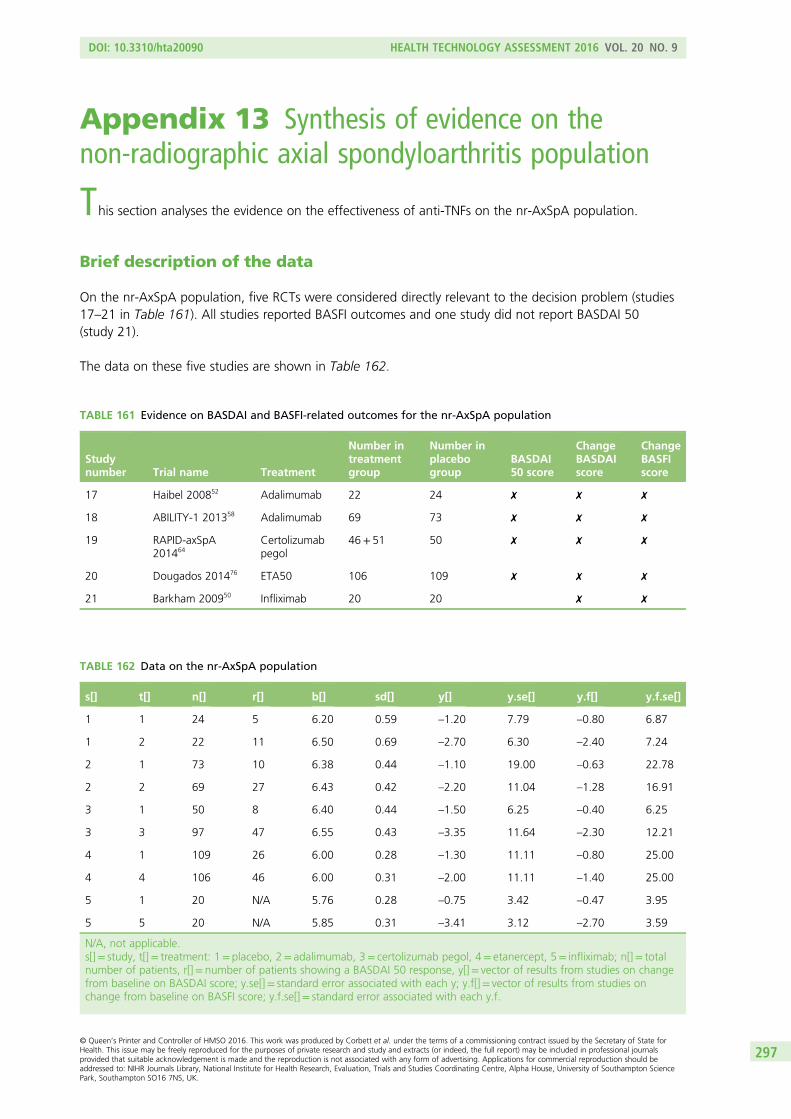
Appendix 13 Synthesis of evidence on thenon-radiographic axial spondyloarthritis population
This section analyses the evidence on the effectiveness of anti-TNFs on the nr-AxSpA population.
Brief description of the data
On the nr-AxSpA population, five RCTs were considered directly relevant to the decision problem (studies17–21 in Table 161). All studies reported BASFI outcomes and one study did not report BASDAI 50(study 21).
The data on these five studies are shown in Table 162.
TABLE 162 Data on the nr-AxSpA population
s[] t[] n[] r[] b[] sd[] y[] y.se[] y.f[] y.f.se[]
1 1 24 5 6.20 0.59 –1.20 7.79 –0.80 6.87
1 2 22 11 6.50 0.69 –2.70 6.30 –2.40 7.24
2 1 73 10 6.38 0.44 –1.10 19.00 –0.63 22.78
2 2 69 27 6.43 0.42 –2.20 11.04 –1.28 16.91
3 1 50 8 6.40 0.44 –1.50 6.25 –0.40 6.25
3 3 97 47 6.55 0.43 –3.35 11.64 –2.30 12.21
4 1 109 26 6.00 0.28 –1.30 11.11 –0.80 25.00
4 4 106 46 6.00 0.31 –2.00 11.11 –1.40 25.00
5 1 20 N/A 5.76 0.28 –0.75 3.42 –0.47 3.95
5 5 20 N/A 5.85 0.31 –3.41 3.12 –2.70 3.59
N/A, not applicable.s[]= study, t[]= treatment: 1= placebo, 2= adalimumab, 3= certolizumab pegol, 4= etanercept, 5= infliximab; n[]= totalnumber of patients, r[]= number of patients showing a BASDAI 50 response, y[]= vector of results from studies on changefrom baseline on BASDAI score; y.se[]= standard error associated with each y; y.f[]= vector of results from studies onchange from baseline on BASFI score; y.f.se[]= standard error associated with each y.f.
TABLE 161 Evidence on BASDAI and BASFI-related outcomes for the nr-AxSpA population
Studynumber Trial name Treatment
Number intreatmentgroup
Number inplacebogroup
BASDAI50 score
ChangeBASDAIscore
ChangeBASFIscore
17 Haibel 200852 Adalimumab 22 24 ✗ ✗ ✗
18 ABILITY-1 201358 Adalimumab 69 73 ✗ ✗ ✗
19 RAPID-axSpA201464
Certolizumabpegol
46+ 51 50 ✗ ✗ ✗
20 Dougados 201476 ETA50 106 109 ✗ ✗ ✗
21 Barkham 200950 Infliximab 20 20 ✗ ✗
DOI: 10.3310/hta20090 HEALTH TECHNOLOGY ASSESSMENT 2016 VOL. 20 NO. 9
© Queen’s Printer and Controller of HMSO 2016. This work was produced by Corbett et al. under the terms of a commissioning contract issued by the Secretary of State forHealth. This issue may be freely reproduced for the purposes of private research and study and extracts (or indeed, the full report) may be included in professional journalsprovided that suitable acknowledgement is made and the reproduction is not associated with any form of advertising. Applications for commercial reproduction should beaddressed to: NIHR Journals Library, National Institute for Health Research, Evaluation, Trials and Studies Coordinating Centre, Alpha House, University of Southampton SciencePark, Southampton SO16 7NS, UK.
297
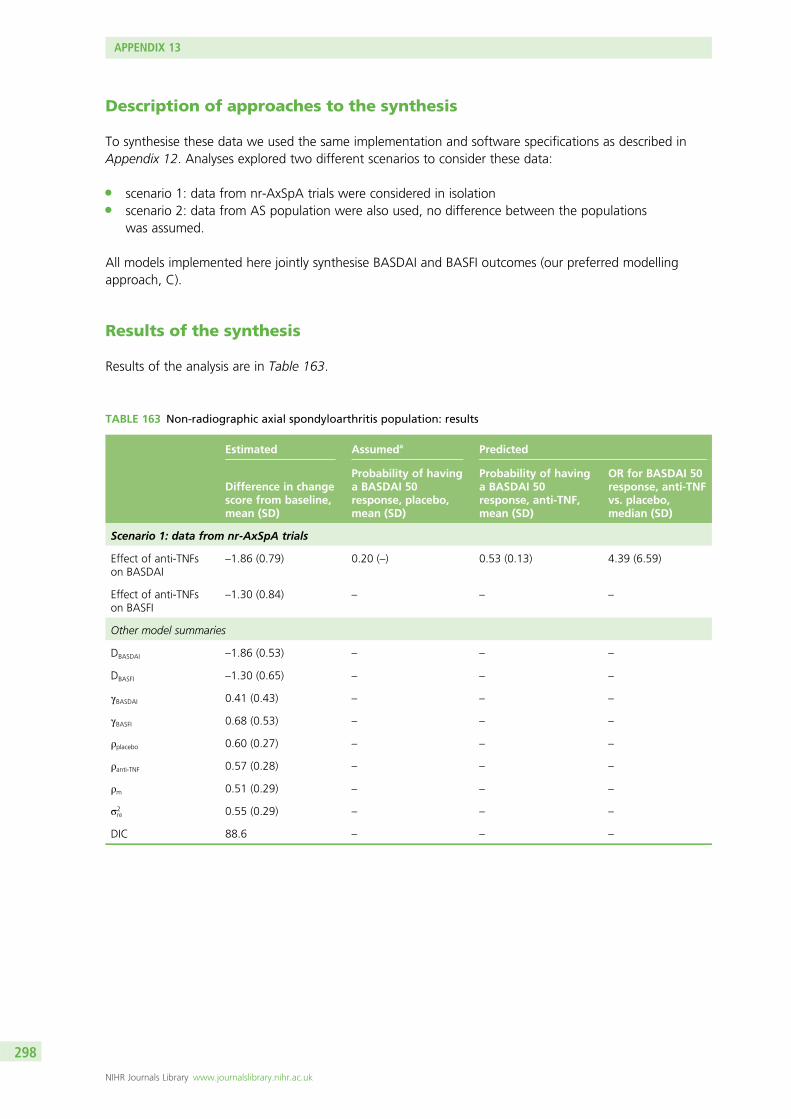
Description of approaches to the synthesis
To synthesise these data we used the same implementation and software specifications as described inAppendix 12. Analyses explored two different scenarios to consider these data:
l scenario 1: data from nr-AxSpA trials were considered in isolationl scenario 2: data from AS population were also used, no difference between the populations
was assumed.
All models implemented here jointly synthesise BASDAI and BASFI outcomes (our preferred modellingapproach, C).
Results of the synthesis
Results of the analysis are in Table 163.
TABLE 163 Non-radiographic axial spondyloarthritis population: results
Estimated Assumeda Predicted
Difference in changescore from baseline,mean (SD)
Probability of havinga BASDAI 50response, placebo,mean (SD)
Probability of havinga BASDAI 50response, anti-TNF,mean (SD)
OR for BASDAI 50response, anti-TNFvs. placebo,median (SD)
Scenario 1: data from nr-AxSpA trials
Effect of anti-TNFson BASDAI
–1.86 (0.79) 0.20 (–) 0.53 (0.13) 4.39 (6.59)
Effect of anti-TNFson BASFI
–1.30 (0.84) – – –
Other model summaries
DBASDAI –1.86 (0.53) – – –
DBASFI –1.30 (0.65) – – –
γBASDAI 0.41 (0.43) – – –
γBASFI 0.68 (0.53) – – –
ρplacebo 0.60 (0.27) – – –
ρanti-TNF 0.57 (0.28) – – –
ρm 0.51 (0.29) – – –
σ2re 0.55 (0.29) – – –
DIC 88.6 – – –
APPENDIX 13
NIHR Journals Library www.journalslibrary.nihr.ac.uk
298

TABLE 163 Non-radiographic axial spondyloarthritis population: results (continued )
Estimated Assumeda Predicted
Difference in changescore from baseline,mean (SD)
Probability of havinga BASDAI 50response, placebo,mean (SD)
Probability of havinga BASDAI 50response, anti-TNF,mean (SD)
OR for BASDAI 50response, anti-TNFvs. placebo,median (SD)
Scenario 2: data from AS and nr-AxSpA trials, no difference between the populations
Effect of anti-TNFson BASDAI
–1.97 (0.32) 0.20 (–) 0.55 (0.06) 4.94 (1.48)
Effect of anti-TNFson BASFI
–1.37 (0.3) – – –
Other model summaries
DBASDAI –1.97 (0.20) – – –
DBASFI –1.37 (0.18) – – –
γBASDAI 0.12 (0.09) – – –
γBASFI 0.18 (0.11) – – –
ρplacebo 0.50 (0.26) – – –
ρanti-TNF 0.74 (0.22) – – –
ρm 0.54 (0.29) – – –
σ2re 0.19 (0.16) – – –
DIC 269.0 – – –
a Based on a BASDAI baseline score of (AiC information has been removed) and a placebo change score of(AiC information has been removed), which represent the results seen in the certolizumab trial (RAPID-axSpA64).
DOI: 10.3310/hta20090 HEALTH TECHNOLOGY ASSESSMENT 2016 VOL. 20 NO. 9
© Queen’s Printer and Controller of HMSO 2016. This work was produced by Corbett et al. under the terms of a commissioning contract issued by the Secretary of State forHealth. This issue may be freely reproduced for the purposes of private research and study and extracts (or indeed, the full report) may be included in professional journalsprovided that suitable acknowledgement is made and the reproduction is not associated with any form of advertising. Applications for commercial reproduction should beaddressed to: NIHR Journals Library, National Institute for Health Research, Evaluation, Trials and Studies Coordinating Centre, Alpha House, University of Southampton SciencePark, Southampton SO16 7NS, UK.
299

Appendix 14 Utility review
In accordance with the NICE reference case,238 utility values should be based on the EQ-5D instrument.Therefore, a systematic review of utility studies was carried out to identify relevant studies which
(1) directly estimate EQ-5D utility values; and (2) establish the relationship between generic measures ofutility (in particular the EQ-5D) and measures of disease progression (including mapping studies). Thereview of utility studies focuses on anti-TNFs for AS and AxSpA without radiographic evidence of AS(nr-AxSpA).
Methods
Searches were undertaken in EMBASE and MEDLINE/MEDLINE In-Process & Other Non-Indexed Citations(Ovid). A combination of disease terms and terms associated with the EQ-5D were used. Upon initial review,it was evident that the results of the search did not identify the studies found in the cost-effectivenessreview that also reported on the quality of life of AS patients, for example Ara et al.161 Therefore, a separatesearch in NHS EED, MEDLINE and EMBASE for published modelling studies was also subsequentlyundertaken. No language and date limits were applied. Full details of the search strategy used are presentedin Appendix 1.
Studies that reported utility values consistent with the NICE reference case were included in the review,that is studies reporting utilities for AS or nr-AxSpa patients generated using:
l the EQ-5Dl HRQoL or changes in HRQoL measured directly by patientsl changes in HRQoL should be valued using public preferences from a representative sample of the UK
population using a choice-based method (or this could be reasonably assumed from the publication).
When a mapping algorithm was reported, eligibility of studies was restricted to those that mapped fromBASDAI score and/or BASFI score to EQ-5D.
Results
Identified studiesThe combined search retrieved 210 citations. After screening titles and abstracts, 28 citations wereretrieved for full review. The abstract by Pumford et al.239 was excluded, as the full publication byWade et al.240 reported on the same study. The abstract by Lee et al.241 was excluded as a more recent fullpublication of the study (Lee et al.242) reported that a non-UK valuation set was used. Joore et al.243 wasalso excluded, as primary data were reported in Van Tubergen et al.244 A further three studies wereexcluded because the manuscripts were in a language other than English.
Kobelt et al. have reported costs/quality of life/cost-effectiveness of AS patients in multiple references(e.g. Kobelt et al. 2004,152 Kobelt et al. 2006,245 Kobelt et al. 2007160 and Kobelt et al. 2008246). Kobeltet al.152,160 are relevant to a UK population and are preferred to the other Kobelt publications that arerelevant to non-UK populations. Of these, Kobelt et al.152 reports utility data collected and used in theanalysis and is, therefore, included in this review.
In total, 12 studies were deemed to meet the NICE reference case238 and are summarised in Table 164.
DOI: 10.3310/hta20090 HEALTH TECHNOLOGY ASSESSMENT 2016 VOL. 20 NO. 9
© Queen’s Printer and Controller of HMSO 2016. This work was produced by Corbett et al. under the terms of a commissioning contract issued by the Secretary of State forHealth. This issue may be freely reproduced for the purposes of private research and study and extracts (or indeed, the full report) may be included in professional journalsprovided that suitable acknowledgement is made and the reproduction is not associated with any form of advertising. Applications for commercial reproduction should beaddressed to: NIHR Journals Library, National Institute for Health Research, Evaluation, Trials and Studies Coordinating Centre, Alpha House, University of Southampton SciencePark, Southampton SO16 7NS, UK.
301
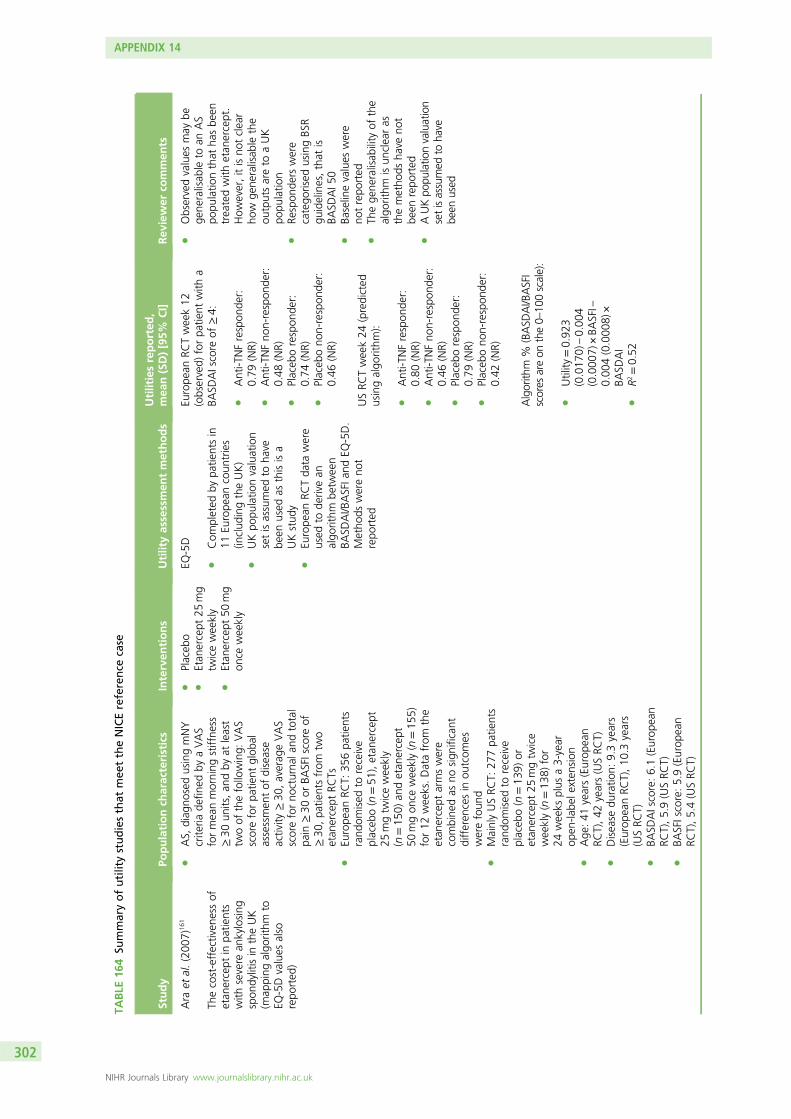
TABLE
164
Summaryofutilitystudiesthat
mee
ttheNICEreference
case
Study
Populationch
aracteristics
Interven
tions
Utilityassessmen
tmethods
Utilitiesreported
,mea
n(SD)[95%
CI]
Rev
iewer
commen
ts
Ara
etal.(200
7)16
1
Thecost-effectiven
essof
etan
ercept
inpa
tients
with
severe
ankylosing
spon
dylitisin
theUK
(map
ping
algo
rithm
toEQ
-5Dvalues
also
repo
rted
)
lAS,
diag
nosedusingmNY
crite
riade
fined
byaVAS
formeanmorning
stiffne
ss≥30
units,an
dby
atleast
twoof
thefollowing:
VAS
scoreforpa
tient
glob
alassessmen
tof
disease
activity
≥30
,averag
eVAS
scoreforno
cturna
land
total
pain
≥30
orBA
SFIscore
of≥30
,pa
tientsfrom
two
etan
ercept
RCTs
lEu
rope
anRC
T:35
6pa
tients
rand
omised
toreceive
placeb
o(n=51
),etan
ercept
25mgtw
iceweekly
(n=15
0)an
detan
ercept
50mgon
ceweekly(n=15
5)for12
weeks.Datafrom
the
etan
ercept
armswere
combine
das
nosign
ificant
differen
cesin
outcom
eswerefoun
dl
MainlyUSRC
T:27
7pa
tients
rand
omised
toreceive
placeb
o(n=13
9)or
etan
ercept
25mgtw
ice
weekly(n=13
8)for
24weeks
plus
a3-year
open
-labe
lexten
sion
lAge
:41
years(Europ
ean
RCT),42
years(USRC
T)l
Disease
duratio
n:9.3years
(Europ
eanRC
T),10
.3years
(USRC
T)l
BASD
AIscore:6.1(Europ
ean
RCT),5.9(USRC
T)l
BASFIscore:5.9(Europ
ean
RCT),5.4(USRC
T)
lPlaceb
ol
Etan
ercept
25mg
twiceweekly
lEtan
ercept
50mg
once
weekly
EQ-5D
lCom
pleted
bypa
tientsin
11Eu
rope
ancoun
tries
(includ
ingtheUK)
lUKpo
pulatio
nvaluation
setisassumed
toha
vebe
enused
asthisisa
UKstud
yl
Europe
anRC
Tda
tawere
used
tode
rivean
algo
rithm
betw
een
BASD
AI/B
ASFIa
ndEQ
-5D.
Metho
dswereno
trepo
rted
Europe
anRC
Tweek12
(observed)
forpa
tient
with
aBA
SDAIscore
of≥4:
lAnti-T
NFrespon
der:
0.79
(NR)
lAnti-T
NFno
n-respon
der:
0.48
(NR)
lPlaceb
orespon
der:
0.74
(NR)
lPlaceb
ono
n-respon
der:
0.46
(NR)
USRC
Tweek24
(predicted
usingalgo
rithm
):
lAnti-T
NFrespon
der:
0.80
(NR)
lAnti-T
NFno
n-respon
der:
0.46
(NR)
lPlaceb
orespon
der:
0.79
(NR)
lPlaceb
ono
n-respon
der:
0.42
(NR)
Algorith
m%
(BASD
AI/BASFI
scores
areon
the0–
100scale):
lUtility
=0.92
3(0.017
0)–0.00
4(0.000
7)×BA
SFI–
0.00
4(0.000
8)×
BASD
AI
lR2
=0.52
lObservedvalues
may
bege
neralisab
leto
anAS
popu
latio
nthat
hasbe
entreatedwith
etan
ercept.
How
ever,itisno
tclear
how
gene
ralisab
lethe
outputsareto
aUK
popu
latio
nl
Respon
ders
were
catego
rised
usingBS
Rgu
idelines,that
isBA
SDAI5
0l
Baselinevalues
were
notrepo
rted
lTh
ege
neralisab
ility
ofthe
algo
rithm
isun
clearas
themetho
dsha
veno
tbe
enrepo
rted
lAUKpo
pulatio
nvaluation
setisassumed
toha
vebe
enused
APPENDIX 14
NIHR Journals Library www.journalslibrary.nihr.ac.uk
302
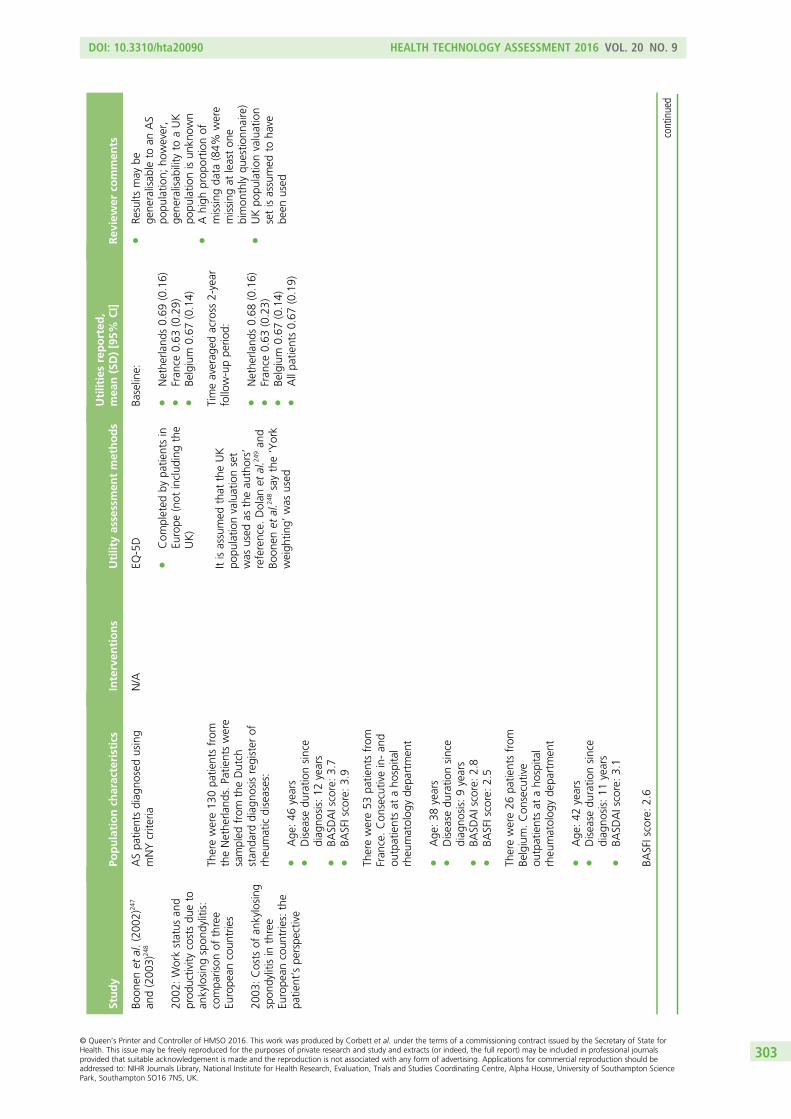
Study
Populationch
aracteristics
Interven
tions
Utilityassessmen
tmethods
Utilitiesreported
,mea
n(SD)[95%
CI]
Rev
iewer
commen
ts
Boon
enet
al.(200
2)24
7
and(200
3)24
8
2002
:Workstatus
and
prod
uctivity
costsdu
eto
ankylosing
spon
dylitis:
compa
rison
ofthree
Europe
ancoun
tries
2003
:Costs
ofan
kylosing
spon
dylitisin
three
Europe
ancoun
tries:the
patie
nt’spe
rspe
ctive
ASpa
tientsdiag
nosedusing
mNYcrite
riaN/A
EQ-5D
lCom
pleted
bypa
tientsin
Europe
(not
includ
ingthe
UK)
Itisassumed
that
theUK
popu
latio
nvaluationset
was
used
astheau
thors’
reference.
Dolan
etal.2
49an
dBo
onen
etal.2
48saythe‘York
weigh
ting’
was
used
Baseline:
lNethe
rland
s0.69
(0.16)
lFran
ce0.63
(0.29)
lBe
lgium
0.67
(0.14)
lRe
sults
may
bege
neralisab
leto
anAS
popu
latio
n;ho
wever,
gene
ralisab
ility
toaUK
popu
latio
nisun
know
nl
Ahigh
prop
ortio
nof
missing
data
(84%
were
missing
atleaston
ebimon
thlyqu
estio
nnaire)
lUKpo
pulatio
nvaluation
setisassumed
toha
vebe
enused
Therewere13
0pa
tientsfrom
theNethe
rland
s.Pa
tientswere
sampled
from
theDutch
stan
dard
diag
nosisregister
ofrheu
maticdiseases:
lAge
:46
years
lDisease
duratio
nsince
diag
nosis:12
years
lBA
SDAIscore:3.7
lBA
SFIscore:3.9
Timeaverag
edacross
2-year
follow-uppe
riod:
lNethe
rland
s0.68
(0.16)
lFran
ce0.63
(0.23)
lBe
lgium
0.67
(0.14)
lAllpa
tients0.67
(0.19)
Therewere53
patie
ntsfrom
Fran
ce.Con
secutivein-an
dou
tpatientsat
aho
spita
lrheu
matolog
yde
partmen
t
lAge
:38
years
lDisease
duratio
nsince
diag
nosis:9years
lBA
SDAIscore:2.8
lBA
SFIscore:2.5
Therewere26
patie
ntsfrom
Belgium.Con
secutive
outpatientsat
aho
spita
lrheu
matolog
yde
partmen
t
lAge
:42
years
lDisease
duratio
nsince
diag
nosis:11
years
lBA
SDAIscore:3.1
BASFIscore:2.6
continued
DOI: 10.3310/hta20090 HEALTH TECHNOLOGY ASSESSMENT 2016 VOL. 20 NO. 9
© Queen’s Printer and Controller of HMSO 2016. This work was produced by Corbett et al. under the terms of a commissioning contract issued by the Secretary of State forHealth. This issue may be freely reproduced for the purposes of private research and study and extracts (or indeed, the full report) may be included in professional journalsprovided that suitable acknowledgement is made and the reproduction is not associated with any form of advertising. Applications for commercial reproduction should beaddressed to: NIHR Journals Library, National Institute for Health Research, Evaluation, Trials and Studies Coordinating Centre, Alpha House, University of Southampton SciencePark, Southampton SO16 7NS, UK.
303
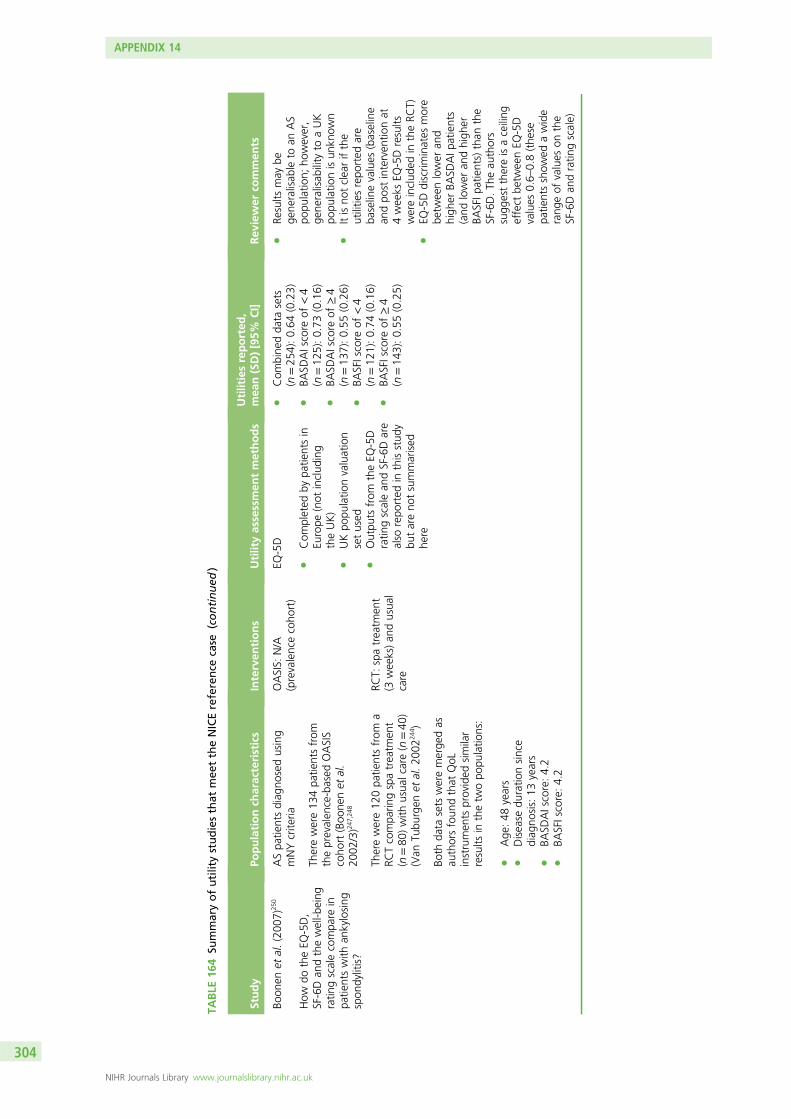
TABLE
164
Summaryofutilitystudiesthat
mee
ttheNICEreference
case
(continued
)
Study
Populationch
aracteristics
Interven
tions
Utilityassessmen
tmethods
Utilitiesreported
,mea
n(SD)[95%
CI]
Rev
iewer
commen
ts
Boon
enet
al.(200
7)25
0
How
dotheEQ
-5D,
SF-6Dan
dthewell-b
eing
ratin
gscalecompa
rein
patie
ntswith
ankylosing
spon
dylitis?
ASpa
tientsdiag
nosedusing
mNYcrite
riaOASIS:
N/A
(prevalencecoho
rt)
EQ-5D
lCom
pleted
bypa
tientsin
Europe
(not
includ
ing
theUK)
lUKpo
pulatio
nvaluation
setused
lOutpu
tsfrom
theEQ
-5D
ratin
gscalean
dSF-6Dare
also
repo
rted
inthisstud
ybu
tareno
tsummarised
here
lCom
bine
dda
tasets
(n=25
4):0.64
(0.23)
lBA
SDAIscore
of<4
(n=12
5):0.73
(0.16)
lBA
SDAIscore
of≥4
(n=13
7):0.55
(0.26)
lBA
SFIscore
of<4
(n=12
1):0.74
(0.16)
lBA
SFIscore
of≥4
(n=14
3):0.55
(0.25)
lRe
sults
may
bege
neralisab
leto
anAS
popu
latio
n;ho
wever,
gene
ralisab
ility
toaUK
popu
latio
nisun
know
nl
Itisno
tclearifthe
utilitie
srepo
rted
are
baselinevalues
(baseline
andpo
stinterven
tionat
4weeks
EQ-5Dresults
wereinclud
edin
theRC
T)l
EQ-5Ddiscrim
inates
more
betw
eenlower
and
high
erBA
SDAIp
atients
(and
lower
andhigh
erBA
SFIp
atients)than
the
SF-6D.Th
eau
thors
sugg
estthereisaceiling
effect
betw
eenEQ
-5D
values
0.6–
0.8(the
sepa
tientsshow
edawide
rang
eof
values
onthe
SF-6Dan
dratin
gscale)
Therewere13
4pa
tientsfrom
theprevalen
ce-based
OASIS
coho
rt(Boo
nenet
al.
2002
/3)2
47,248
Therewere12
0pa
tientsfrom
aRC
Tcompa
ringspatreatm
ent
(n=80
)with
usua
lcare(n=40
)(Van
Tubu
rgen
etal.20
0224
4 )
RCT:
spatreatm
ent
(3weeks)an
dusua
lcare
Both
data
sets
weremerge
das
authorsfoun
dthat
QoL
instrumen
tsprovided
similar
results
inthetw
opo
pulatio
ns:
lAge
:48
years
lDisease
duratio
nsince
diag
nosis:13
years
lBA
SDAIscore:4.2
lBA
SFIscore:4.2
APPENDIX 14
NIHR Journals Library www.journalslibrary.nihr.ac.uk
304
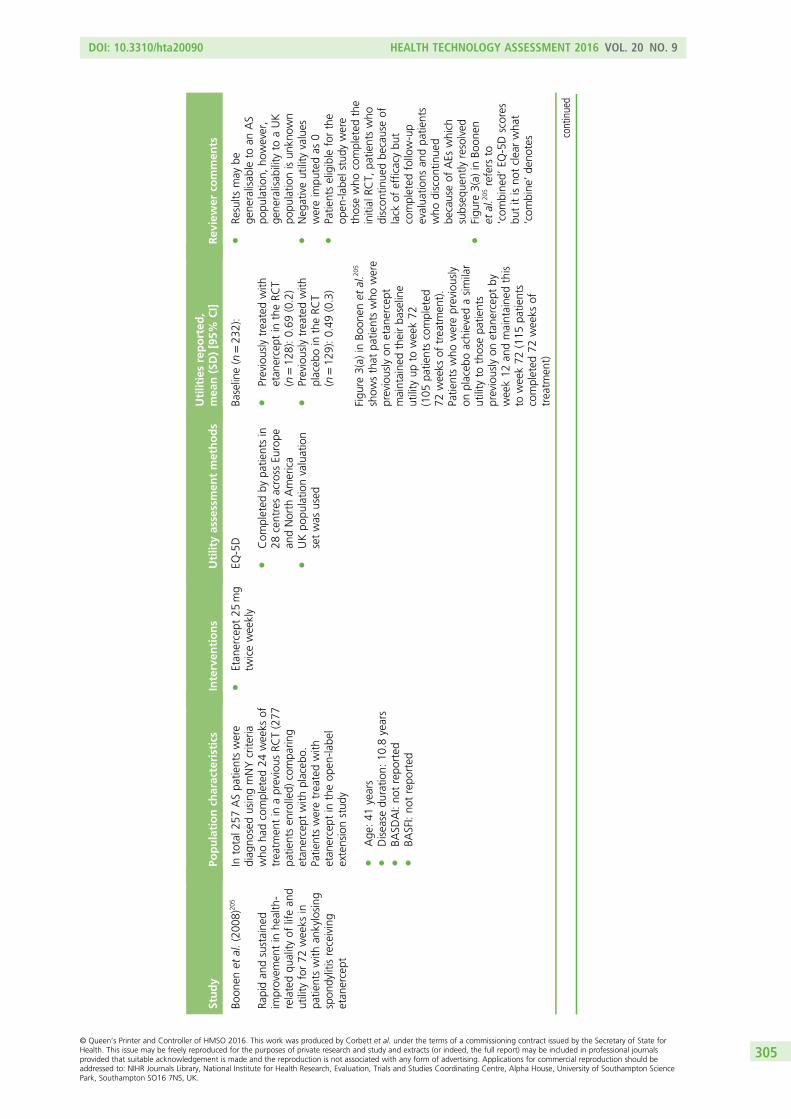
Study
Populationch
aracteristics
Interven
tions
Utilityassessmen
tmethods
Utilitiesreported
,mea
n(SD)[95%
CI]
Rev
iewer
commen
ts
Boon
enet
al.(200
8)20
5
Rapidan
dsustaine
dim
provem
entin
health-
relatedqu
ality
oflifean
dutility
for72
weeks
inpa
tientswith
ankylosing
spon
dylitisreceiving
etan
ercept
Intotal2
57ASpa
tientswere
diag
nosedusingmNYcrite
riawho
hadcompleted
24weeks
oftreatm
entin
aprevious
RCT(277
patie
ntsen
rolled)
compa
ring
etan
ercept
with
placeb
o.Patie
ntsweretreatedwith
etan
ercept
intheop
en-la
bel
extensionstud
y
lAge
:41
years
lDisease
duratio
n:10
.8years
lBA
SDAI:no
trepo
rted
lBA
SFI:no
trepo
rted
lEtan
ercept
25mg
twiceweekly
EQ-5D
lCom
pleted
bypa
tientsin
28centresacross
Europe
andNorth
America
lUKpo
pulatio
nvaluation
setwas
used
Baseline(n=23
2):
lPreviouslytreatedwith
etan
ercept
intheRC
T(n
=12
8):0.69
(0.2)
lPreviouslytreatedwith
placeb
oin
theRC
T(n
=12
9):0.49
(0.3)
Figu
re3(a)
inBo
onen
etal.2
05
show
sthat
patie
ntswho
were
previouslyon
etan
ercept
maintaine
dtheirba
seline
utility
upto
week72
(105
patie
ntscompleted
72weeks
oftreatm
ent).
Patie
ntswho
werepreviously
onplaceb
oachieved
asimilar
utility
tothosepa
tients
previouslyon
etan
ercept
byweek12
andmaintaine
dthis
toweek72
(115
patie
nts
completed
72weeks
oftreatm
ent)
lRe
sults
may
bege
neralisab
leto
anAS
popu
latio
n,ho
wever,
gene
ralisab
ility
toaUK
popu
latio
nisun
know
nl
Neg
ativeutility
values
wereim
putedas
0l
Patie
ntseligible
forthe
open
-labe
lstudy
were
thosewho
completed
the
initial
RCT,
patie
ntswho
discon
tinue
dbe
causeof
lack
ofefficacybu
tcompleted
follow-up
evalua
tions
andpa
tients
who
discon
tinue
dbe
causeof
AEs
which
subseq
uentlyresolved
lFigu
re3(a)
inBo
onen
etal.2
05refers
to‘com
bine
d’EQ
-5Dscores
butitisno
tclearwha
t‘com
bine
’de
notes continued
DOI: 10.3310/hta20090 HEALTH TECHNOLOGY ASSESSMENT 2016 VOL. 20 NO. 9
© Queen’s Printer and Controller of HMSO 2016. This work was produced by Corbett et al. under the terms of a commissioning contract issued by the Secretary of State forHealth. This issue may be freely reproduced for the purposes of private research and study and extracts (or indeed, the full report) may be included in professional journalsprovided that suitable acknowledgement is made and the reproduction is not associated with any form of advertising. Applications for commercial reproduction should beaddressed to: NIHR Journals Library, National Institute for Health Research, Evaluation, Trials and Studies Coordinating Centre, Alpha House, University of Southampton SciencePark, Southampton SO16 7NS, UK.
305
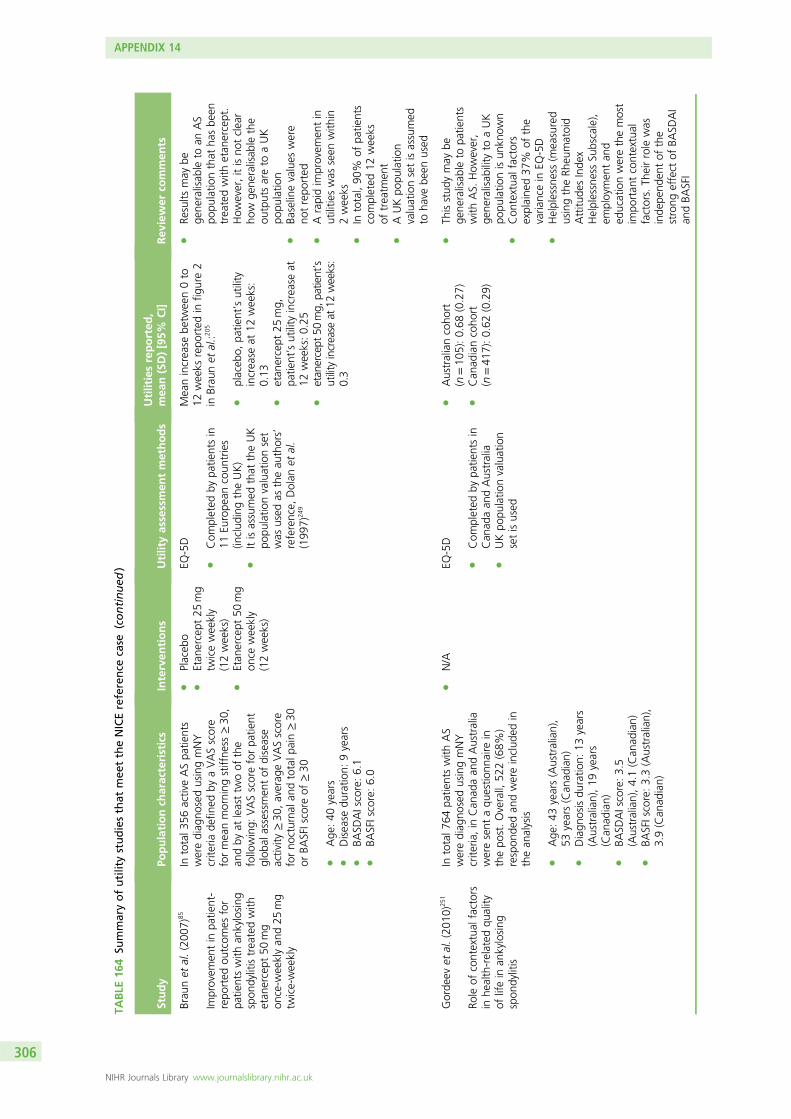
TABLE
164
Summaryofutilitystudiesthat
mee
ttheNICEreference
case
(continued
)
Study
Populationch
aracteristics
Interven
tions
Utilityassessmen
tmethods
Utilitiesreported
,mea
n(SD)[95%
CI]
Rev
iewer
commen
ts
Brau
net
al.(200
7)85
Improvem
entin
patie
nt-
repo
rted
outcom
esfor
patie
ntswith
ankylosing
spon
dylitistreatedwith
etan
ercept
50mg
once-w
eeklyan
d25
mg
twice-weekly
Intotal3
56activeASpa
tients
werediag
nosedusingmNY
crite
riade
fined
byaVASscore
formeanmorning
stiffne
ss≥30
,an
dby
atleasttw
oof
the
following:
VASscoreforpa
tient
glob
alassessmen
tof
disease
activity
≥30
,averag
eVASscore
forno
cturna
land
totalp
ain≥30
orBA
SFIscore
of≥30
lAge
:40
years
lDisease
duratio
n:9years
lBA
SDAIscore:6.1
lBA
SFIscore:6.0
lPlaceb
ol
Etan
ercept
25mg
twiceweekly
(12weeks)
lEtan
ercept
50mg
once
weekly
(12weeks)
EQ-5D
lCom
pleted
bypa
tientsin
11Eu
rope
ancoun
tries
(includ
ingtheUK)
lItisassumed
that
theUK
popu
latio
nvaluationset
was
used
astheau
thors’
reference,
Dolan
etal.
(199
7)24
9
Meanincrease
betw
een0to
12weeks
repo
rted
infig
ure2
inBrau
net
al.:2
05
lplaceb
o,pa
tient’sutility
increase
at12
weeks:
0.13
letan
ercept
25mg,
patie
nt’sutility
increase
at12
weeks:0.25
letan
ercept
50mg,
patient’s
utilityincrease
at12
weeks:
0.3
lRe
sults
may
bege
neralisab
leto
anAS
popu
latio
nthat
hasbe
entreatedwith
etan
ercept.
How
ever,itisno
tclear
how
gene
ralisab
lethe
outputsareto
aUK
popu
latio
nl
Baselinevalues
were
notrepo
rted
lArapidim
provem
entin
utilitie
swas
seen
with
in2weeks
lIn
total,90
%of
patie
nts
completed
12weeks
oftreatm
ent
lAUKpo
pulatio
nvaluationsetisassumed
toha
vebe
enused
Gorde
evet
al.(201
0)25
1
Role
ofcontextual
factors
inhe
alth-related
quality
oflifein
ankylosing
spon
dylitis
Intotal7
64pa
tientswith
AS
werediag
nosedusingmNY
crite
ria,in
Can
adaan
dAustralia
weresent
aqu
estio
nnaire
inthepo
st.Overall,
522(68%
)respon
dedan
dwereinclud
edin
thean
alysis
lAge
:43
years(Australian),
53years(Can
adian)
lDiagn
osisdu
ratio
n:13
years
(Australian),19
years
(Can
adian)
lBA
SDAIscore:3.5
(Australian),4.1(Can
adian)
lBA
SFIscore:3.3(Australian),
3.9(Can
adian)
lN/A
EQ-5D
lCom
pleted
bypa
tientsin
Can
adaan
dAustralia
lUKpo
pulatio
nvaluation
setisused
lAustraliancoho
rt(n
=10
5):0.68
(0.27)
lCan
adiancoho
rt(n
=41
7):0.62
(0.29)
lTh
isstud
ymay
bege
neralisab
leto
patie
nts
with
AS.
How
ever,
gene
ralisab
ility
toaUK
popu
latio
nisun
know
nl
Con
textua
lfactors
explaine
d37
%of
the
varia
ncein
EQ-5D
lHelplessness(m
easured
usingtheRh
eumatoid
Attitu
desInde
xHelplessnessSu
bscale),
employmen
tan
ded
ucationwerethemost
impo
rtan
tcontextual
factors.Th
eirrole
was
inde
pend
entof
the
strong
effect
ofBA
SDAI
andBA
SFI
APPENDIX 14
NIHR Journals Library www.journalslibrary.nihr.ac.uk
306
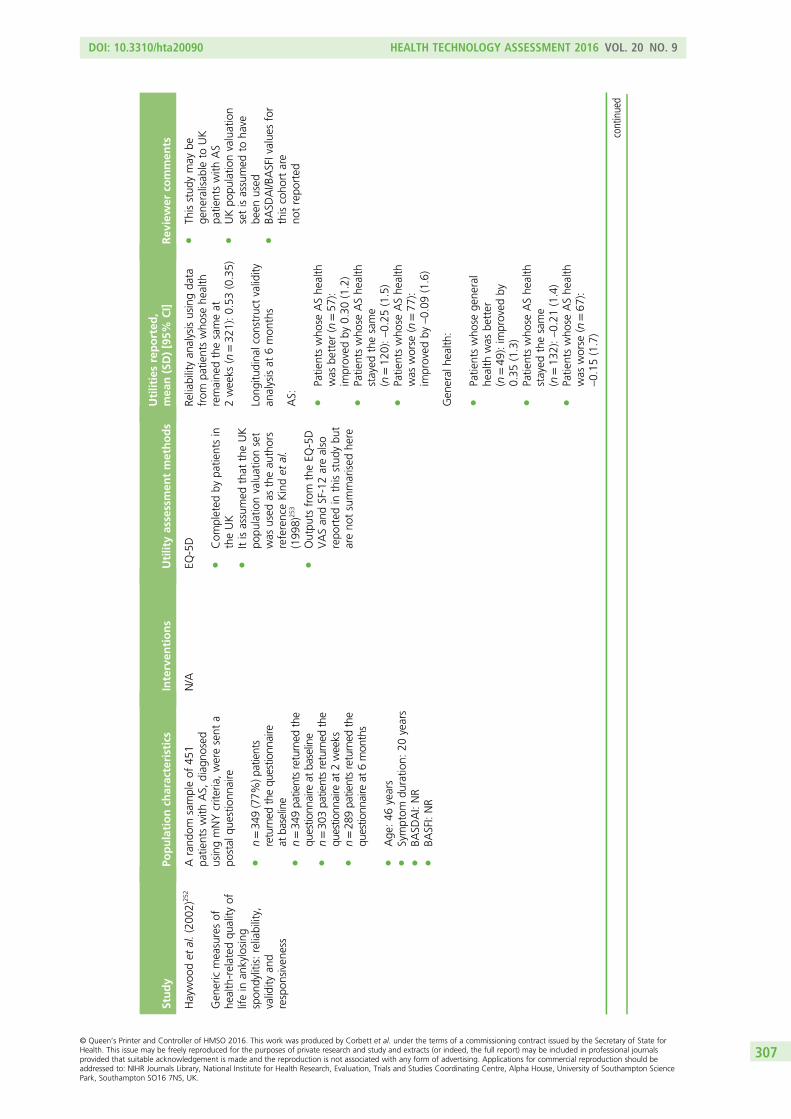
Study
Populationch
aracteristics
Interven
tions
Utilityassessmen
tmethods
Utilitiesreported
,mea
n(SD)[95%
CI]
Rev
iewer
commen
ts
Haywoo
det
al.(200
2)25
2
Gen
ericmeasuresof
health-related
quality
oflifein
ankylosing
spon
dylitis:reliability,
validity
and
respon
sivene
ss
Arand
omsampleof
451
patie
ntswith
AS,
diag
nosed
usingmNYcrite
ria,weresent
apo
stal
questio
nnaire
ln=34
9(77%
)patients
returned
thequ
estio
nnaire
atba
seline
ln=34
9pa
tientsreturned
the
questio
nnaire
atba
seline
ln=30
3pa
tientsreturned
the
questio
nnaire
at2weeks
ln=28
9pa
tientsreturned
the
questio
nnaire
at6mon
ths
lAge
:46
years
lSymptom
duratio
n:20
years
lBA
SDAI:NR
lBA
SFI:NR
N/A
EQ-5D
lCom
pleted
bypa
tientsin
theUK
lItisassumed
that
theUK
popu
latio
nvaluationset
was
used
astheau
thors
referenceKindet
al.
(199
8)25
3
lOutpu
tsfrom
theEQ
-5D
VASan
dSF-12arealso
repo
rted
inthisstud
ybu
tareno
tsummarised
here
Reliabilityan
alysisusingda
tafrom
patie
ntswho
sehe
alth
remaine
dthesameat
2weeks
(n=32
1):0.53
(0.35)
Long
itudina
lcon
struct
validity
analysisat
6mon
ths
lTh
isstud
ymay
bege
neralisab
leto
UK
patie
ntswith
AS
lUKpo
pulatio
nvaluation
setisassumed
toha
vebe
enused
lBA
SDAI/B
ASFIvalue
sfor
thiscoho
rtare
notrepo
rted
AS:
lPatie
ntswho
seAShe
alth
was
better
(n=57
):im
proved
by0.30
(1.2)
lPatie
ntswho
seAShe
alth
stayed
thesame
(n=12
0):–0.25
(1.5)
lPatie
ntswho
seAShe
alth
was
worse
(n=77
):im
proved
by–0.09
(1.6)
Gen
eral
health:
lPatie
ntswho
sege
neral
health
was
better
(n=49
):im
proved
by0.35
(1.3)
lPatie
ntswho
seAShe
alth
stayed
thesame
(n=13
2):–0.21
(1.4)
lPatie
ntswho
seAShe
alth
was
worse
(n=67
):–0.15
(1.7)
continued
DOI: 10.3310/hta20090 HEALTH TECHNOLOGY ASSESSMENT 2016 VOL. 20 NO. 9
© Queen’s Printer and Controller of HMSO 2016. This work was produced by Corbett et al. under the terms of a commissioning contract issued by the Secretary of State forHealth. This issue may be freely reproduced for the purposes of private research and study and extracts (or indeed, the full report) may be included in professional journalsprovided that suitable acknowledgement is made and the reproduction is not associated with any form of advertising. Applications for commercial reproduction should beaddressed to: NIHR Journals Library, National Institute for Health Research, Evaluation, Trials and Studies Coordinating Centre, Alpha House, University of Southampton SciencePark, Southampton SO16 7NS, UK.
307
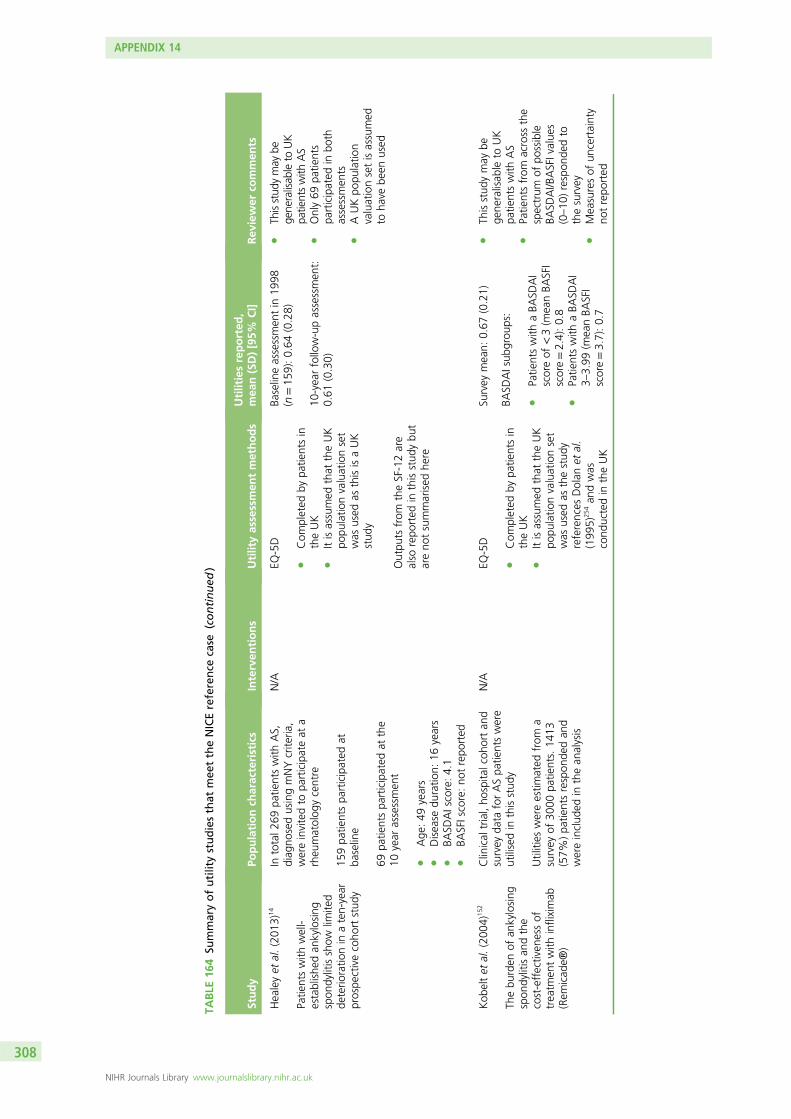
TABLE
164
Summaryofutilitystudiesthat
mee
ttheNICEreference
case
(continued
)
Study
Populationch
aracteristics
Interven
tions
Utilityassessmen
tmethods
Utilitiesreported
,mea
n(SD)[95%
CI]
Rev
iewer
commen
ts
Healeyet
al.(201
3)14
Patie
ntswith
well-
establishe
dan
kylosing
spon
dylitisshow
limite
dde
terio
ratio
nin
aten-year
prospe
ctivecoho
rtstud
y
Intotal2
69pa
tientswith
AS,
diag
nosedusingmNYcrite
ria,
wereinvitedto
participateat
arheu
matolog
ycentre
159pa
tientspa
rticipated
atba
seline
69pa
tientspa
rticipated
atthe
10year
assessmen
t
lAge
:49
years
lDisease
duratio
n:16
years
lBA
SDAIscore:4.1
lBA
SFIscore:no
trepo
rted
N/A
EQ-5D
lCom
pleted
bypa
tientsin
theUK
lItisassumed
that
theUK
popu
latio
nvaluationset
was
used
asthisisaUK
stud
y
Outpu
tsfrom
theSF-12are
also
repo
rted
inthisstud
ybu
tareno
tsummarised
here
Baselineassessmen
tin
1998
(n=15
9):0.64
(0.28)
10-yearfollow-upassessmen
t:0.61
(0.30)
lTh
isstud
ymay
bege
neralisab
leto
UK
patientswith
AS
lOnly69
patie
nts
participated
inbo
thassessmen
tsl
AUKpo
pulatio
nvaluationsetisassumed
toha
vebe
enused
Kob
eltet
al.(200
4)15
2
Thebu
rden
ofan
kylosing
spon
dylitisan
dthe
cost-effectiven
essof
treatm
entwith
infliximab
(Rem
icad
e®)
Clinical
trial,ho
spita
lcoh
ortan
dsurvey
data
forASpa
tientswere
utilisedin
thisstud
y
Utilities
wereestim
ated
from
asurvey
of30
00pa
tients.14
13(57%
)pa
tientsrespon
dedan
dwereinclud
edin
thean
alysis
N/A
EQ-5D
lCom
pleted
bypa
tientsin
theUK
lItisassumed
that
theUK
popu
latio
nvaluationset
was
used
asthestud
yreferences
Dolan
etal.
(199
5)25
4an
dwas
cond
uctedin
theUK
Survey
mean:
0.67
(0.21)
lTh
isstud
ymay
bege
neralisab
leto
UK
patie
ntswith
AS
lPatie
ntsfrom
across
the
spectrum
ofpo
ssible
BASD
AI/B
ASFIvalue
s(0–10
)respon
dedto
thesurvey
lMeasuresof
uncertainty
notrepo
rted
BASD
AIsub
grou
ps:
lPatie
ntswith
aBA
SDAI
scoreof
<3(m
eanBA
SFI
score=2.4):0.8
lPatie
ntswith
aBA
SDAI
3–3.99
(meanBA
SFI
score=3.7):0.7
APPENDIX 14
NIHR Journals Library www.journalslibrary.nihr.ac.uk
308
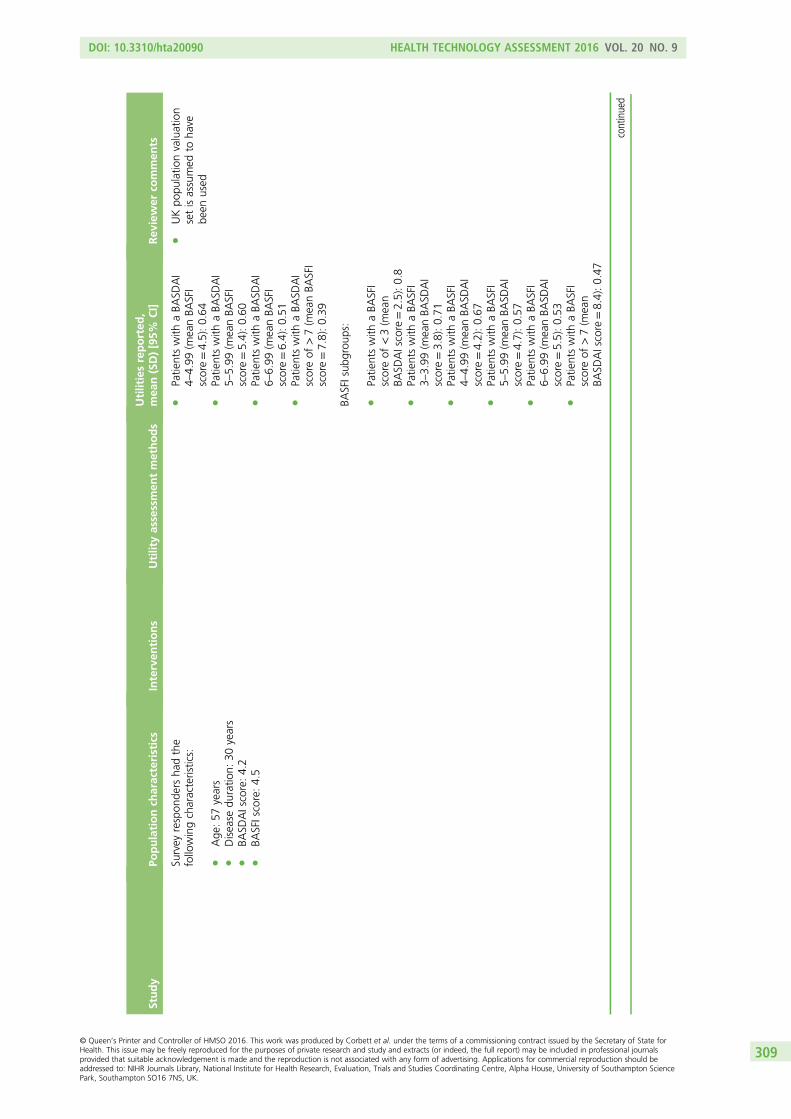
Study
Populationch
aracteristics
Interven
tions
Utilityassessmen
tmethods
Utilitiesreported
,mea
n(SD)[95%
CI]
Rev
iewer
commen
ts
Survey
respon
ders
hadthe
followingcharacteristics:
lAge
:57
years
lDisease
duratio
n:30
years
lBA
SDAIscore:4.2
lBA
SFIscore:4.5
lUKpo
pulatio
nvaluation
setisassumed
toha
vebe
enused
lPatie
ntswith
aBA
SDAI
4–4.99
(meanBA
SFI
score=4.5):0.64
lPatie
ntswith
aBA
SDAI
5–5.99
(meanBA
SFI
score=5.4):0.60
lPatie
ntswith
aBA
SDAI
6–6.99
(meanBA
SFI
score=6.4):0.51
lPatie
ntswith
aBA
SDAI
scoreof
>7(m
eanBA
SFI
score=7.8):0.39
BASFIsub
grou
ps:
lPatie
ntswith
aBA
SFI
scoreof
<3(m
ean
BASD
AIscore
=2.5):0.8
lPatie
ntswith
aBA
SFI
3–3.99
(meanBA
SDAI
score=3.8):0.71
lPatie
ntswith
aBA
SFI
4–4.99
(meanBA
SDAI
score=4.2):0.67
lPatie
ntswith
aBA
SFI
5–5.99
(meanBA
SDAI
score=4.7):0.57
lPatie
ntswith
aBA
SFI
6–6.99
(meanBA
SDAI
score=5.5):0.53
lPatie
ntswith
aBA
SFI
scoreof
>7(m
ean
BASD
AIscore
=8.4):0.47
continued
DOI: 10.3310/hta20090 HEALTH TECHNOLOGY ASSESSMENT 2016 VOL. 20 NO. 9
© Queen’s Printer and Controller of HMSO 2016. This work was produced by Corbett et al. under the terms of a commissioning contract issued by the Secretary of State forHealth. This issue may be freely reproduced for the purposes of private research and study and extracts (or indeed, the full report) may be included in professional journalsprovided that suitable acknowledgement is made and the reproduction is not associated with any form of advertising. Applications for commercial reproduction should beaddressed to: NIHR Journals Library, National Institute for Health Research, Evaluation, Trials and Studies Coordinating Centre, Alpha House, University of Southampton SciencePark, Southampton SO16 7NS, UK.
309
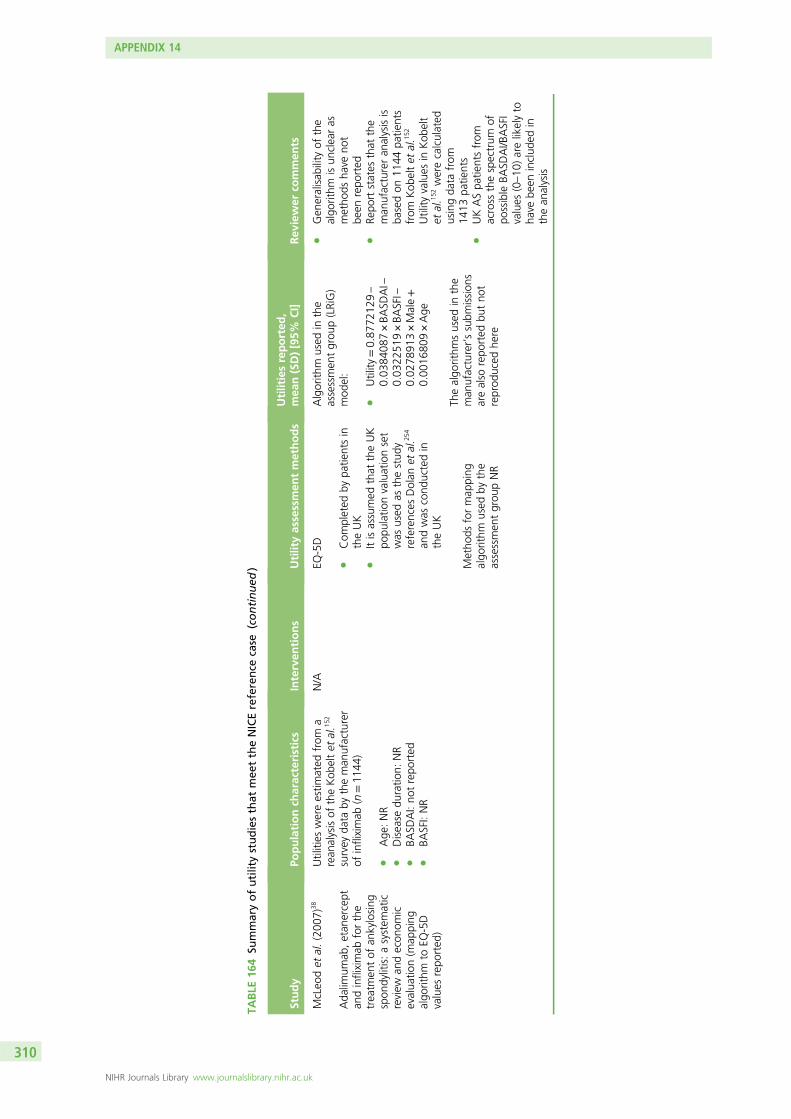
TABLE
164
Summaryofutilitystudiesthat
mee
ttheNICEreference
case
(continued
)
Study
Populationch
aracteristics
Interven
tions
Utilityassessmen
tmethods
Utilitiesreported
,mea
n(SD)[95%
CI]
Rev
iewer
commen
ts
McLeo
det
al.(200
7)38
Ada
limum
ab,etan
ercept
andinfliximab
forthe
treatm
entof
ankylosing
spon
dylitis:asystem
atic
review
andecon
omic
evalua
tion(m
apping
algo
rithm
toEQ
-5D
values
repo
rted
)
Utilities
wereestim
ated
from
arean
alysisof
theKob
eltet
al.1
52
survey
data
bytheman
ufacturer
ofinfliximab
(n=11
44)
lAge
:NR
lDisease
duratio
n:NR
lBA
SDAI:no
trepo
rted
lBA
SFI:NR
N/A
EQ-5D
lCom
pleted
bypa
tientsin
theUK
lItisassumed
that
theUK
popu
latio
nvaluationset
was
used
asthestud
yreferences
Dolan
etal.2
54
andwas
cond
uctedin
theUK
Metho
dsformap
ping
algo
rithm
used
bythe
assessmen
tgrou
pNR
Algorith
mused
inthe
assessmen
tgrou
p(LRiG)
mod
el:
lUtility
=0.87
7212
9–
0.03
8408
7×BA
SDAI–
0.03
2251
9×BA
SFI–
0.02
7891
3×Male+
0.00
1680
9×Age
Thealgo
rithm
sused
inthe
man
ufacturer’ssubm
ission
sarealso
repo
rted
butno
treprod
uced
here
lGen
eralisab
ility
ofthe
algo
rithm
isun
clearas
metho
dsha
veno
tbe
enrepo
rted
lRe
portstates
that
the
man
ufactureran
alysisis
basedon
1144
patie
nts
from
Kob
eltet
al.1
52
Utility
values
inKob
elt
etal.1
52werecalculated
usingda
tafrom
1413
patie
nts
lUKASpa
tientsfrom
across
thespectrum
ofpo
ssible
BASD
AI/B
ASFI
values
(0–10
)arelikelyto
have
been
includ
edin
thean
alysis
APPENDIX 14
NIHR Journals Library www.journalslibrary.nihr.ac.uk
310
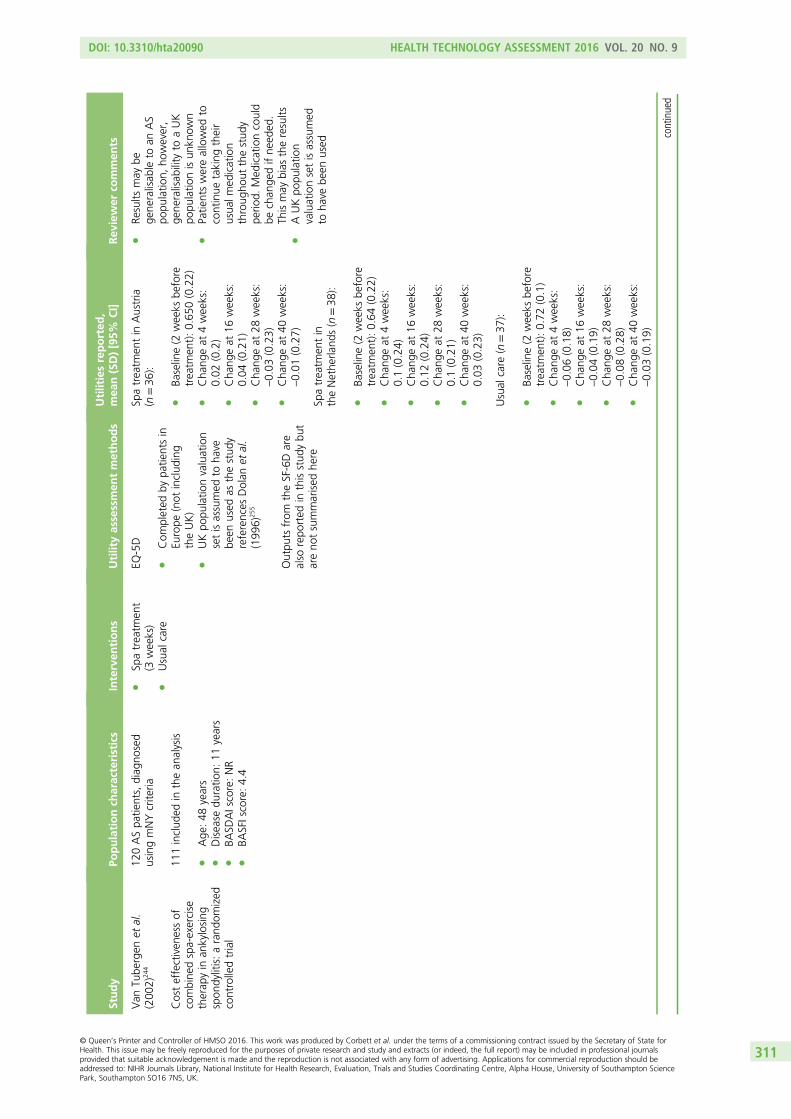
Study
Populationch
aracteristics
Interven
tions
Utilityassessmen
tmethods
Utilitiesreported
,mea
n(SD)[95%
CI]
Rev
iewer
commen
ts
Van
Tube
rgen
etal.
(200
2)24
4
Costeffectiven
essof
combine
dspa-exercise
therap
yin
ankylosing
spon
dylitis:arand
omized
controlledtrial
120ASpa
tients,diag
nosed
usingmNYcrite
ria
111includ
edin
thean
alysis
lAge
:48
years
lDisease
duratio
n:11
years
lBA
SDAIscore:NR
lBA
SFIscore:4.4
lSp
atreatm
ent
(3weeks)
lUsual
care
EQ-5D
lCom
pleted
bypa
tientsin
Europe
(not
includ
ing
theUK)
lUKpo
pulatio
nvaluation
setisassumed
toha
vebe
enused
asthestud
yreferences
Dolan
etal.
(199
6)25
5
Outpu
tsfrom
theSF-6Dare
also
repo
rted
inthisstud
ybu
tareno
tsummarised
here
Spatreatm
entin
Austria
(n=36
):
lBa
seline(2
weeks
before
treatm
ent):0.65
0(0.22)
lCha
ngeat
4weeks:
0.02
(0.2)
lCha
ngeat
16weeks:
0.04
(0.21)
lCha
ngeat
28weeks:
–0.03
(0.23)
lCha
ngeat
40weeks:
–0.01
(0.27)
lRe
sults
may
bege
neralisab
leto
anAS
popu
latio
n,ho
wever,
gene
ralisab
ility
toaUK
popu
latio
nisun
know
nl
Patie
ntswereallowed
tocontinue
taking
their
usua
lmed
ication
throug
hout
thestud
ype
riod.
Med
icationcould
bechan
gedifne
eded
.Th
ismay
bias
theresults
lAUKpo
pulatio
nvaluationsetisassumed
toha
vebe
enused
Spatreatm
entin
theNethe
rland
s(n
=38
):
lBa
seline(2
weeks
before
treatm
ent):0.64
(0.22)
lCha
ngeat
4weeks:
0.1(0.24)
lCha
ngeat
16weeks:
0.12
(0.24)
lCha
ngeat
28weeks:
0.1(0.21)
lCha
ngeat
40weeks:
0.03
(0.23)
Usual
care
(n=37
):
lBa
seline(2
weeks
before
treatm
ent):0.72
(0.1)
lCha
ngeat
4weeks:
–0.06
(0.18)
lCha
ngeat
16weeks:
–0.04
(0.19)
lCha
ngeat
28weeks:
–0.08
(0.28)
lCha
ngeat
40weeks:
–0.03
(0.19)
continued
DOI: 10.3310/hta20090 HEALTH TECHNOLOGY ASSESSMENT 2016 VOL. 20 NO. 9
© Queen’s Printer and Controller of HMSO 2016. This work was produced by Corbett et al. under the terms of a commissioning contract issued by the Secretary of State forHealth. This issue may be freely reproduced for the purposes of private research and study and extracts (or indeed, the full report) may be included in professional journalsprovided that suitable acknowledgement is made and the reproduction is not associated with any form of advertising. Applications for commercial reproduction should beaddressed to: NIHR Journals Library, National Institute for Health Research, Evaluation, Trials and Studies Coordinating Centre, Alpha House, University of Southampton SciencePark, Southampton SO16 7NS, UK.
311
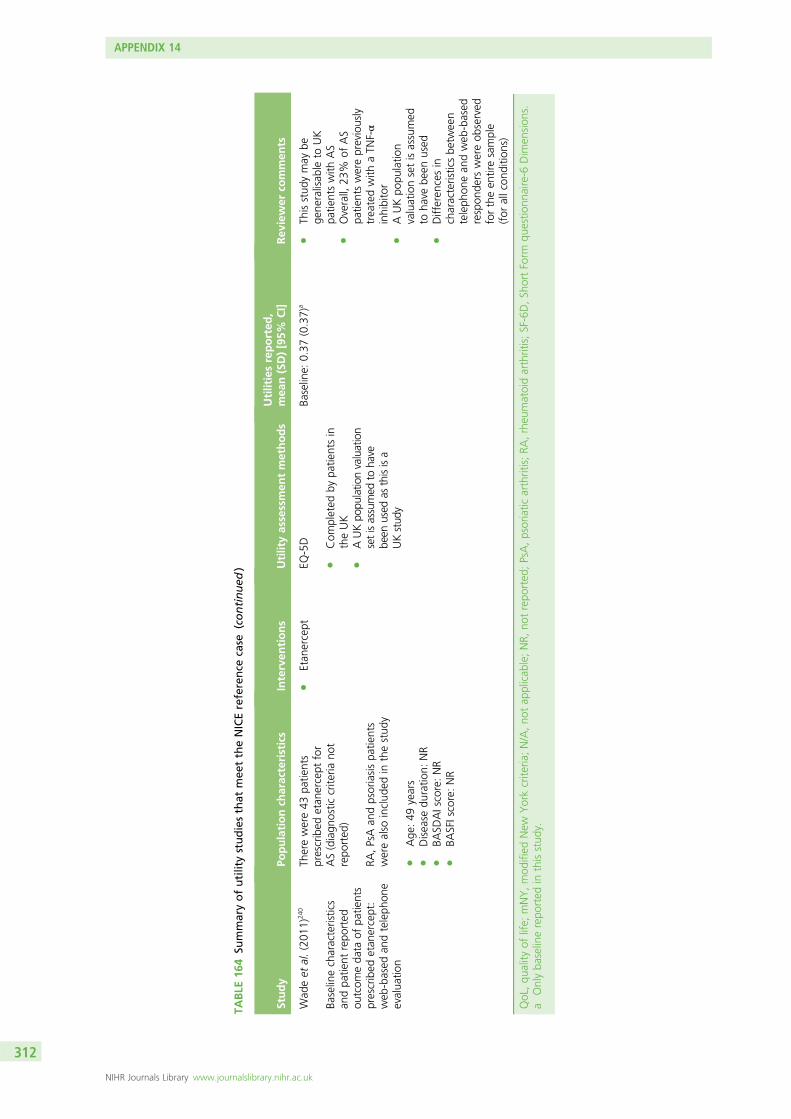
TABLE
164
Summaryofutilitystudiesthat
mee
ttheNICEreference
case
(continued
)
Study
Populationch
aracteristics
Interven
tions
Utilityassessmen
tmethods
Utilitiesreported
,mea
n(SD)[95%
CI]
Rev
iewer
commen
ts
Wad
eet
al.(201
1)24
0
Baselinecharacteristics
andpa
tient
repo
rted
outcom
eda
taof
patie
nts
prescribed
etan
ercept:
web
-based
andteleph
one
evalua
tion
Therewere43
patie
nts
prescribed
etan
ercept
for
AS(diagn
ostic
crite
riano
trepo
rted
)
RA,PsAan
dpsoriasispa
tients
werealso
includ
edin
thestud
y
lAge
:49
years
lDisease
duratio
n:NR
lBA
SDAIscore:NR
lBA
SFIscore:NR
lEtan
ercept
EQ-5D
lCom
pleted
bypa
tientsin
theUK
lAUKpo
pulatio
nvaluation
setisassumed
toha
vebe
enused
asthisisa
UKstud
y
Baseline:
0.37
(0.37)
al
Thisstud
ymay
bege
neralisab
leto
UK
patie
ntswith
AS
lOverall,
23%
ofAS
patie
ntswerepreviously
treatedwith
aTN
F-α
inhibitor
lAUKpo
pulatio
nvaluationsetisassumed
toha
vebe
enused
lDifferen
cesin
characteristicsbe
tween
teleph
onean
dweb
-based
respon
ders
wereob
served
fortheen
tiresample
(for
allcon
ditio
ns)
QoL,qu
ality
oflife;
mNY,mod
ified
New
Yorkcrite
ria;N/A,no
tap
plicab
le;NR,
notrepo
rted
;PsA,psoriatic
arthritis;RA
,rheu
matoidarthritis;SF-6D,Sh
ortForm
questio
nnaire-6
Dim
ension
s.a
Onlyba
selinerepo
rted
inthisstud
y.
APPENDIX 14
NIHR Journals Library www.journalslibrary.nihr.ac.uk
312
The main reasons for excluding studies at the title/abstract and at full review stage were (1) utilities werenot reported (e.g. Haywood et al.256), (2) valuation set not reported or a non-UK valuation was used(e.g. Kvamme et al.257), (3) utilities were reported for a mixed population with different inflammatoryarthropies or in a population not relevant to the decision problem (e.g. Osnes-Ringen et al.258).
Studies meeting the National Institute for Health and Care Excellencereference caseThe 12 studies meeting the reference case238 have been summarised in Table 164. The table includes aprimary study to Boonen et al.,250 reported in Boonen et al.247,248 The study by Boonen et al.250 has beenretained as it reports utility values for patients with a BASDAI score of ≥ 4.
Ankylosing spondylitis populationAll studies included in Table 164 are of AS patients. Five studies reported utility values (or mappingalgorithms) generated from data specifically collected from the UK population (Haywood et al.,252
Healey et al.,14 Kobelt et al.,152 McLeod et al.38 and Wade et al.240). Four studies included interventionsspecific to this appraisal, all of these studies were of etanercept (Ara et al.,161 Boonen et al.,205
Braun et al.87 and Wade et al.240). Utility values reported ranged from values at baseline to at10 years’ follow-up.
Non-radiographic axial spondyloarthritis populationTwo citations were identified in the review that reported utilities for nr-AxSpA patients (Dougados et al.78
and Lindstrom et al.259). However, these studies did not explicitly report which population valuation setswere used and, therefore, were excluded from the review.
Mapping algorithmsOf the 12 studies in Table 164, two report mapping algorithms between disease-specific measures andthe EQ-5D (Ara et al.161 and McLeod et al.38). Both have been reported as part of a cost-effectivenessanalysis and provide limited information on methodology employed (e.g. covariates tested, correlationconsiderations and goodness of fit). McLeod et al.38 reports on an algorithm generated using data fromUK AS patients.
DOI: 10.3310/hta20090 HEALTH TECHNOLOGY ASSESSMENT 2016 VOL. 20 NO. 9
© Queen’s Printer and Controller of HMSO 2016. This work was produced by Corbett et al. under the terms of a commissioning contract issued by the Secretary of State forHealth. This issue may be freely reproduced for the purposes of private research and study and extracts (or indeed, the full report) may be included in professional journalsprovided that suitable acknowledgement is made and the reproduction is not associated with any form of advertising. Applications for commercial reproduction should beaddressed to: NIHR Journals Library, National Institute for Health Research, Evaluation, Trials and Studies Coordinating Centre, Alpha House, University of Southampton SciencePark, Southampton SO16 7NS, UK.
313

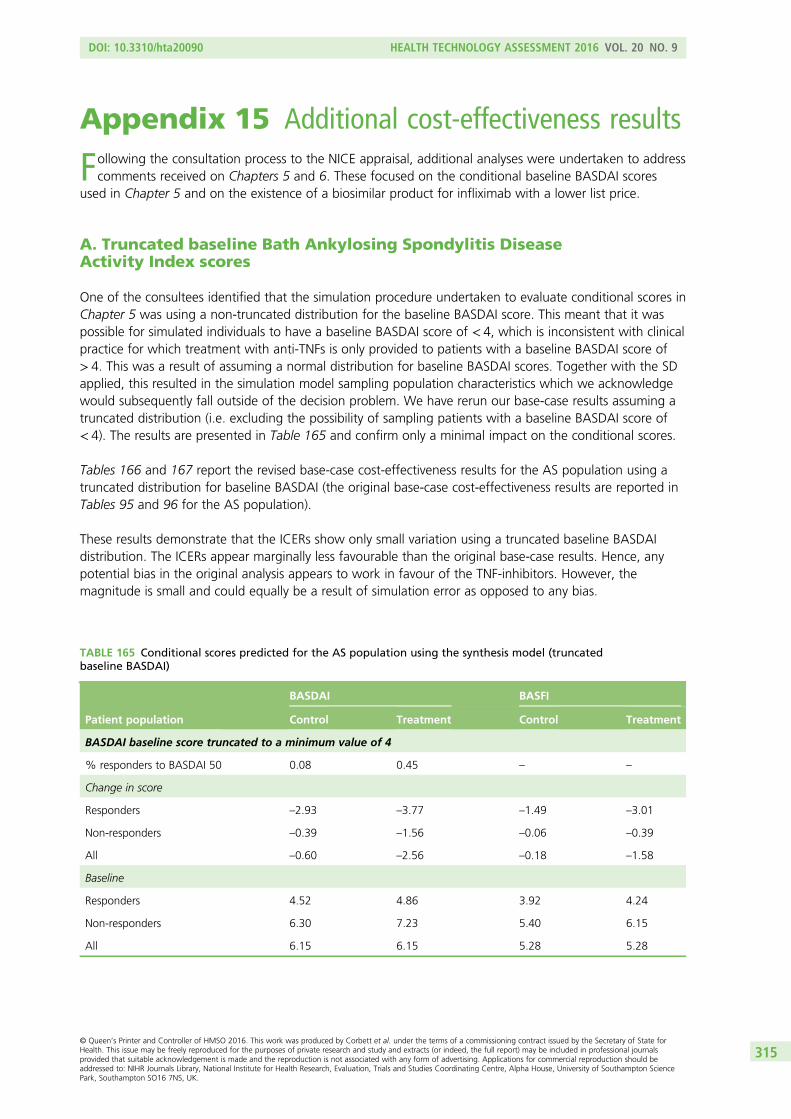
Appendix 15 Additional cost-effectiveness results
Following the consultation process to the NICE appraisal, additional analyses were undertaken to addresscomments received on Chapters 5 and 6. These focused on the conditional baseline BASDAI scores
used in Chapter 5 and on the existence of a biosimilar product for infliximab with a lower list price.
A. Truncated baseline Bath Ankylosing Spondylitis DiseaseActivity Index scores
One of the consultees identified that the simulation procedure undertaken to evaluate conditional scores inChapter 5 was using a non-truncated distribution for the baseline BASDAI score. This meant that it waspossible for simulated individuals to have a baseline BASDAI score of < 4, which is inconsistent with clinicalpractice for which treatment with anti-TNFs is only provided to patients with a baseline BASDAI score of> 4. This was a result of assuming a normal distribution for baseline BASDAI scores. Together with the SDapplied, this resulted in the simulation model sampling population characteristics which we acknowledgewould subsequently fall outside of the decision problem. We have rerun our base-case results assuming atruncated distribution (i.e. excluding the possibility of sampling patients with a baseline BASDAI score of< 4). The results are presented in Table 165 and confirm only a minimal impact on the conditional scores.
Tables 166 and 167 report the revised base-case cost-effectiveness results for the AS population using atruncated distribution for baseline BASDAI (the original base-case cost-effectiveness results are reported inTables 95 and 96 for the AS population).
These results demonstrate that the ICERs show only small variation using a truncated baseline BASDAIdistribution. The ICERs appear marginally less favourable than the original base-case results. Hence, anypotential bias in the original analysis appears to work in favour of the TNF-inhibitors. However, themagnitude is small and could equally be a result of simulation error as opposed to any bias.
TABLE 165 Conditional scores predicted for the AS population using the synthesis model (truncatedbaseline BASDAI)
Patient population
BASDAI BASFI
Control Treatment Control Treatment
BASDAI baseline score truncated to a minimum value of 4
% responders to BASDAI 50 0.08 0.45 – –
Change in score
Responders –2.93 –3.77 –1.49 –3.01
Non-responders –0.39 –1.56 –0.06 –0.39
All –0.60 –2.56 –0.18 –1.58
Baseline
Responders 4.52 4.86 3.92 4.24
Non-responders 6.30 7.23 5.40 6.15
All 6.15 6.15 5.28 5.28
DOI: 10.3310/hta20090 HEALTH TECHNOLOGY ASSESSMENT 2016 VOL. 20 NO. 9
© Queen’s Printer and Controller of HMSO 2016. This work was produced by Corbett et al. under the terms of a commissioning contract issued by the Secretary of State forHealth. This issue may be freely reproduced for the purposes of private research and study and extracts (or indeed, the full report) may be included in professional journalsprovided that suitable acknowledgement is made and the reproduction is not associated with any form of advertising. Applications for commercial reproduction should beaddressed to: NIHR Journals Library, National Institute for Health Research, Evaluation, Trials and Studies Coordinating Centre, Alpha House, University of Southampton SciencePark, Southampton SO16 7NS, UK.
315
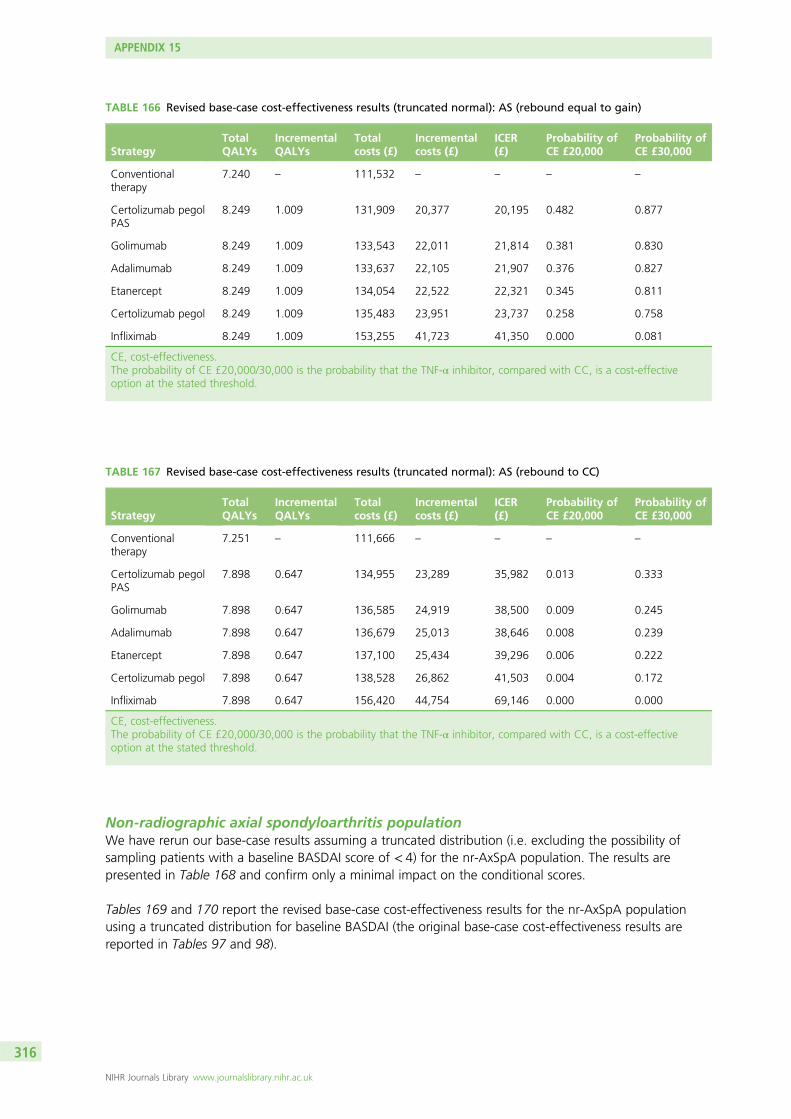
Non-radiographic axial spondyloarthritis populationWe have rerun our base-case results assuming a truncated distribution (i.e. excluding the possibility ofsampling patients with a baseline BASDAI score of < 4) for the nr-AxSpA population. The results arepresented in Table 168 and confirm only a minimal impact on the conditional scores.
Tables 169 and 170 report the revised base-case cost-effectiveness results for the nr-AxSpA populationusing a truncated distribution for baseline BASDAI (the original base-case cost-effectiveness results arereported in Tables 97 and 98).
TABLE 166 Revised base-case cost-effectiveness results (truncated normal): AS (rebound equal to gain)
StrategyTotalQALYs
IncrementalQALYs
Totalcosts (£)
Incrementalcosts (£)
ICER(£)
Probability ofCE £20,000
Probability ofCE £30,000
Conventionaltherapy
7.240 – 111,532 – – – –
Certolizumab pegolPAS
8.249 1.009 131,909 20,377 20,195 0.482 0.877
Golimumab 8.249 1.009 133,543 22,011 21,814 0.381 0.830
Adalimumab 8.249 1.009 133,637 22,105 21,907 0.376 0.827
Etanercept 8.249 1.009 134,054 22,522 22,321 0.345 0.811
Certolizumab pegol 8.249 1.009 135,483 23,951 23,737 0.258 0.758
Infliximab 8.249 1.009 153,255 41,723 41,350 0.000 0.081
CE, cost-effectiveness.The probability of CE £20,000/30,000 is the probability that the TNF-α inhibitor, compared with CC, is a cost-effectiveoption at the stated threshold.
TABLE 167 Revised base-case cost-effectiveness results (truncated normal): AS (rebound to CC)
StrategyTotalQALYs
IncrementalQALYs
Totalcosts (£)
Incrementalcosts (£)
ICER(£)
Probability ofCE £20,000
Probability ofCE £30,000
Conventionaltherapy
7.251 – 111,666 – – – –
Certolizumab pegolPAS
7.898 0.647 134,955 23,289 35,982 0.013 0.333
Golimumab 7.898 0.647 136,585 24,919 38,500 0.009 0.245
Adalimumab 7.898 0.647 136,679 25,013 38,646 0.008 0.239
Etanercept 7.898 0.647 137,100 25,434 39,296 0.006 0.222
Certolizumab pegol 7.898 0.647 138,528 26,862 41,503 0.004 0.172
Infliximab 7.898 0.647 156,420 44,754 69,146 0.000 0.000
CE, cost-effectiveness.The probability of CE £20,000/30,000 is the probability that the TNF-α inhibitor, compared with CC, is a cost-effectiveoption at the stated threshold.
APPENDIX 15
NIHR Journals Library www.journalslibrary.nihr.ac.uk
316
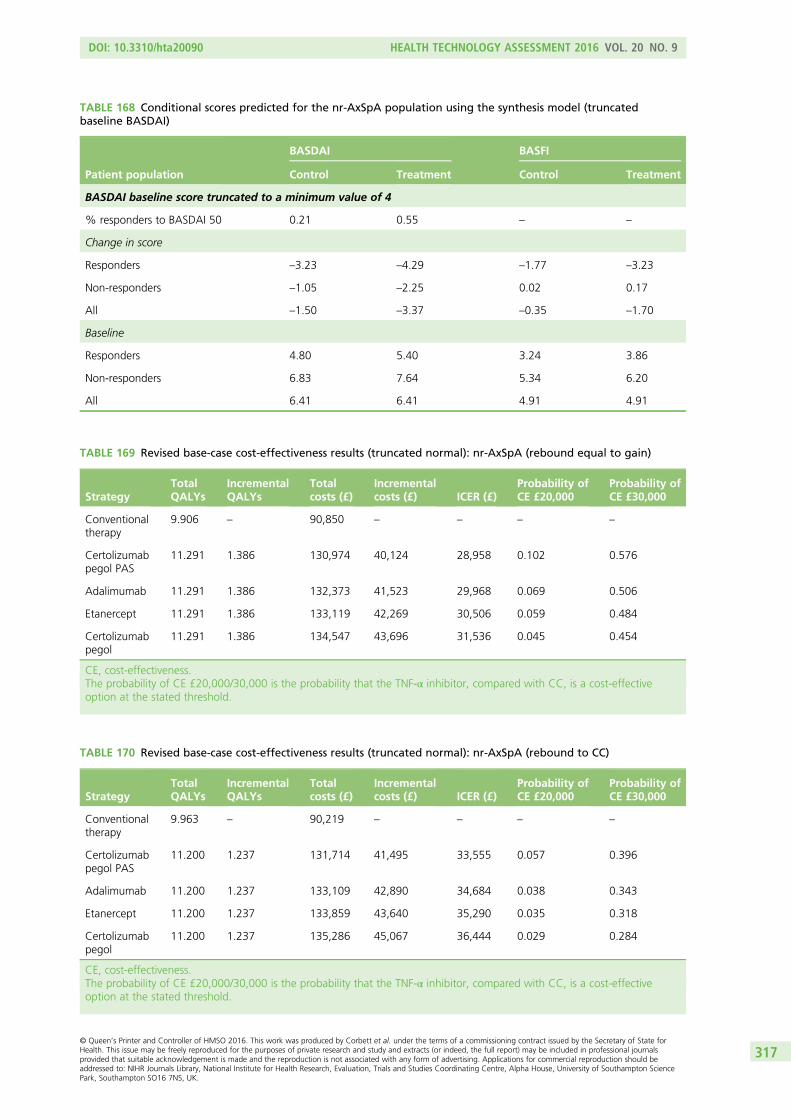
TABLE 168 Conditional scores predicted for the nr-AxSpA population using the synthesis model (truncatedbaseline BASDAI)
Patient population
BASDAI BASFI
Control Treatment Control Treatment
BASDAI baseline score truncated to a minimum value of 4
% responders to BASDAI 50 0.21 0.55 – –
Change in score
Responders –3.23 –4.29 –1.77 –3.23
Non-responders –1.05 –2.25 0.02 0.17
All –1.50 –3.37 –0.35 –1.70
Baseline
Responders 4.80 5.40 3.24 3.86
Non-responders 6.83 7.64 5.34 6.20
All 6.41 6.41 4.91 4.91
TABLE 169 Revised base-case cost-effectiveness results (truncated normal): nr-AxSpA (rebound equal to gain)
StrategyTotalQALYs
IncrementalQALYs
Totalcosts (£)
Incrementalcosts (£) ICER (£)
Probability ofCE £20,000
Probability ofCE £30,000
Conventionaltherapy
9.906 – 90,850 – – – –
Certolizumabpegol PAS
11.291 1.386 130,974 40,124 28,958 0.102 0.576
Adalimumab 11.291 1.386 132,373 41,523 29,968 0.069 0.506
Etanercept 11.291 1.386 133,119 42,269 30,506 0.059 0.484
Certolizumabpegol
11.291 1.386 134,547 43,696 31,536 0.045 0.454
CE, cost-effectiveness.The probability of CE £20,000/30,000 is the probability that the TNF-α inhibitor, compared with CC, is a cost-effectiveoption at the stated threshold.
TABLE 170 Revised base-case cost-effectiveness results (truncated normal): nr-AxSpA (rebound to CC)
StrategyTotalQALYs
IncrementalQALYs
Totalcosts (£)
Incrementalcosts (£) ICER (£)
Probability ofCE £20,000
Probability ofCE £30,000
Conventionaltherapy
9.963 – 90,219 – – – –
Certolizumabpegol PAS
11.200 1.237 131,714 41,495 33,555 0.057 0.396
Adalimumab 11.200 1.237 133,109 42,890 34,684 0.038 0.343
Etanercept 11.200 1.237 133,859 43,640 35,290 0.035 0.318
Certolizumabpegol
11.200 1.237 135,286 45,067 36,444 0.029 0.284
CE, cost-effectiveness.The probability of CE £20,000/30,000 is the probability that the TNF-α inhibitor, compared with CC, is a cost-effectiveoption at the stated threshold.
DOI: 10.3310/hta20090 HEALTH TECHNOLOGY ASSESSMENT 2016 VOL. 20 NO. 9
© Queen’s Printer and Controller of HMSO 2016. This work was produced by Corbett et al. under the terms of a commissioning contract issued by the Secretary of State forHealth. This issue may be freely reproduced for the purposes of private research and study and extracts (or indeed, the full report) may be included in professional journalsprovided that suitable acknowledgement is made and the reproduction is not associated with any form of advertising. Applications for commercial reproduction should beaddressed to: NIHR Journals Library, National Institute for Health Research, Evaluation, Trials and Studies Coordinating Centre, Alpha House, University of Southampton SciencePark, Southampton SO16 7NS, UK.
317
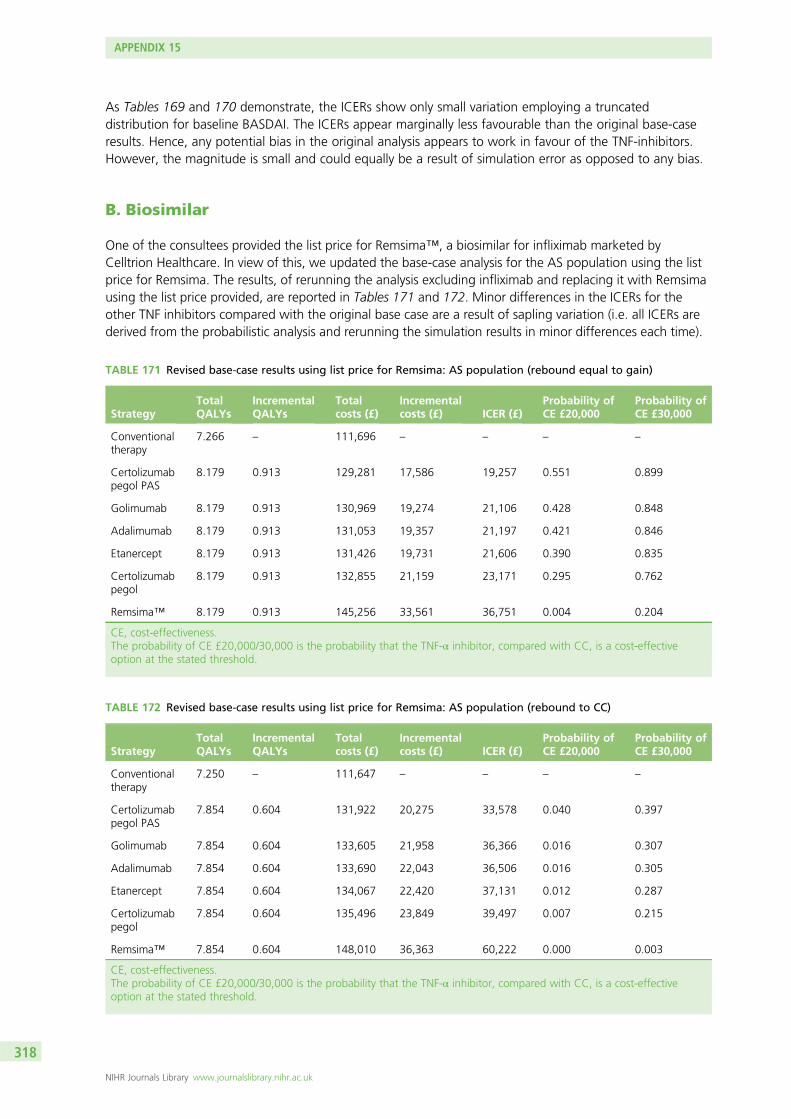
As Tables 169 and 170 demonstrate, the ICERs show only small variation employing a truncateddistribution for baseline BASDAI. The ICERs appear marginally less favourable than the original base-caseresults. Hence, any potential bias in the original analysis appears to work in favour of the TNF-inhibitors.However, the magnitude is small and could equally be a result of simulation error as opposed to any bias.
B. Biosimilar
One of the consultees provided the list price for Remsima™, a biosimilar for infliximab marketed byCelltrion Healthcare. In view of this, we updated the base-case analysis for the AS population using the listprice for Remsima. The results, of rerunning the analysis excluding infliximab and replacing it with Remsimausing the list price provided, are reported in Tables 171 and 172. Minor differences in the ICERs for theother TNF inhibitors compared with the original base case are a result of sapling variation (i.e. all ICERs arederived from the probabilistic analysis and rerunning the simulation results in minor differences each time).
TABLE 171 Revised base-case results using list price for Remsima: AS population (rebound equal to gain)
StrategyTotalQALYs
IncrementalQALYs
Totalcosts (£)
Incrementalcosts (£) ICER (£)
Probability ofCE £20,000
Probability ofCE £30,000
Conventionaltherapy
7.266 – 111,696 – – – –
Certolizumabpegol PAS
8.179 0.913 129,281 17,586 19,257 0.551 0.899
Golimumab 8.179 0.913 130,969 19,274 21,106 0.428 0.848
Adalimumab 8.179 0.913 131,053 19,357 21,197 0.421 0.846
Etanercept 8.179 0.913 131,426 19,731 21,606 0.390 0.835
Certolizumabpegol
8.179 0.913 132,855 21,159 23,171 0.295 0.762
Remsima™ 8.179 0.913 145,256 33,561 36,751 0.004 0.204
CE, cost-effectiveness.The probability of CE £20,000/30,000 is the probability that the TNF-α inhibitor, compared with CC, is a cost-effectiveoption at the stated threshold.
TABLE 172 Revised base-case results using list price for Remsima: AS population (rebound to CC)
StrategyTotalQALYs
IncrementalQALYs
Totalcosts (£)
Incrementalcosts (£) ICER (£)
Probability ofCE £20,000
Probability ofCE £30,000
Conventionaltherapy
7.250 – 111,647 – – – –
Certolizumabpegol PAS
7.854 0.604 131,922 20,275 33,578 0.040 0.397
Golimumab 7.854 0.604 133,605 21,958 36,366 0.016 0.307
Adalimumab 7.854 0.604 133,690 22,043 36,506 0.016 0.305
Etanercept 7.854 0.604 134,067 22,420 37,131 0.012 0.287
Certolizumabpegol
7.854 0.604 135,496 23,849 39,497 0.007 0.215
Remsima™ 7.854 0.604 148,010 36,363 60,222 0.000 0.003
CE, cost-effectiveness.The probability of CE £20,000/30,000 is the probability that the TNF-α inhibitor, compared with CC, is a cost-effectiveoption at the stated threshold.
APPENDIX 15
NIHR Journals Library www.journalslibrary.nihr.ac.uk
318
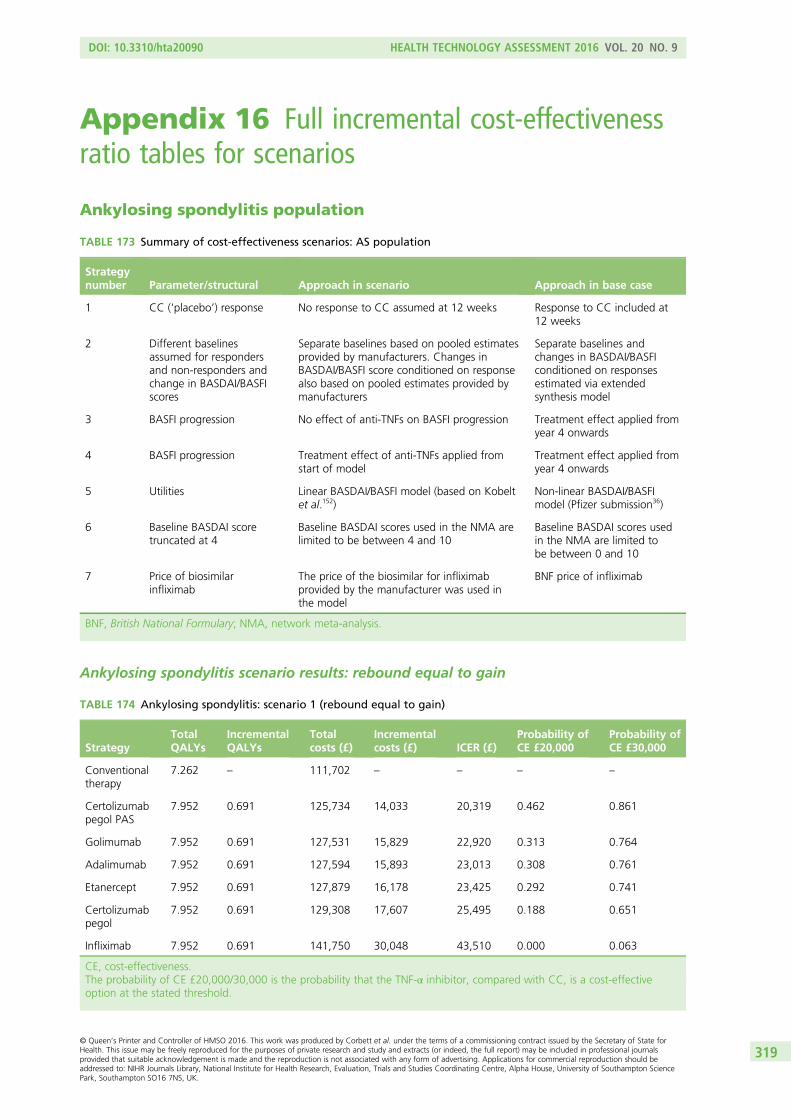
Appendix 16 Full incremental cost-effectivenessratio tables for scenarios
Ankylosing spondylitis population
TABLE 173 Summary of cost-effectiveness scenarios: AS population
Strategynumber Parameter/structural Approach in scenario Approach in base case
1 CC (‘placebo’) response No response to CC assumed at 12 weeks Response to CC included at12 weeks
2 Different baselinesassumed for respondersand non-responders andchange in BASDAI/BASFIscores
Separate baselines based on pooled estimatesprovided by manufacturers. Changes inBASDAI/BASFI score conditioned on responsealso based on pooled estimates provided bymanufacturers
Separate baselines andchanges in BASDAI/BASFIconditioned on responsesestimated via extendedsynthesis model
3 BASFI progression No effect of anti-TNFs on BASFI progression Treatment effect applied fromyear 4 onwards
4 BASFI progression Treatment effect of anti-TNFs applied fromstart of model
Treatment effect applied fromyear 4 onwards
5 Utilities Linear BASDAI/BASFI model (based on Kobeltet al.152)
Non-linear BASDAI/BASFImodel (Pfizer submission36)
6 Baseline BASDAI scoretruncated at 4
Baseline BASDAI scores used in the NMA arelimited to be between 4 and 10
Baseline BASDAI scores usedin the NMA are limited tobe between 0 and 10
7 Price of biosimilarinfliximab
The price of the biosimilar for infliximabprovided by the manufacturer was used inthe model
BNF price of infliximab
BNF, British National Formulary; NMA, network meta-analysis.
Ankylosing spondylitis scenario results: rebound equal to gain
TABLE 174 Ankylosing spondylitis: scenario 1 (rebound equal to gain)
StrategyTotalQALYs
IncrementalQALYs
Totalcosts (£)
Incrementalcosts (£) ICER (£)
Probability ofCE £20,000
Probability ofCE £30,000
Conventionaltherapy
7.262 – 111,702 – – – –
Certolizumabpegol PAS
7.952 0.691 125,734 14,033 20,319 0.462 0.861
Golimumab 7.952 0.691 127,531 15,829 22,920 0.313 0.764
Adalimumab 7.952 0.691 127,594 15,893 23,013 0.308 0.761
Etanercept 7.952 0.691 127,879 16,178 23,425 0.292 0.741
Certolizumabpegol
7.952 0.691 129,308 17,607 25,495 0.188 0.651
Infliximab 7.952 0.691 141,750 30,048 43,510 0.000 0.063
CE, cost-effectiveness.The probability of CE £20,000/30,000 is the probability that the TNF-α inhibitor, compared with CC, is a cost-effectiveoption at the stated threshold.
DOI: 10.3310/hta20090 HEALTH TECHNOLOGY ASSESSMENT 2016 VOL. 20 NO. 9
© Queen’s Printer and Controller of HMSO 2016. This work was produced by Corbett et al. under the terms of a commissioning contract issued by the Secretary of State forHealth. This issue may be freely reproduced for the purposes of private research and study and extracts (or indeed, the full report) may be included in professional journalsprovided that suitable acknowledgement is made and the reproduction is not associated with any form of advertising. Applications for commercial reproduction should beaddressed to: NIHR Journals Library, National Institute for Health Research, Evaluation, Trials and Studies Coordinating Centre, Alpha House, University of Southampton SciencePark, Southampton SO16 7NS, UK.
319
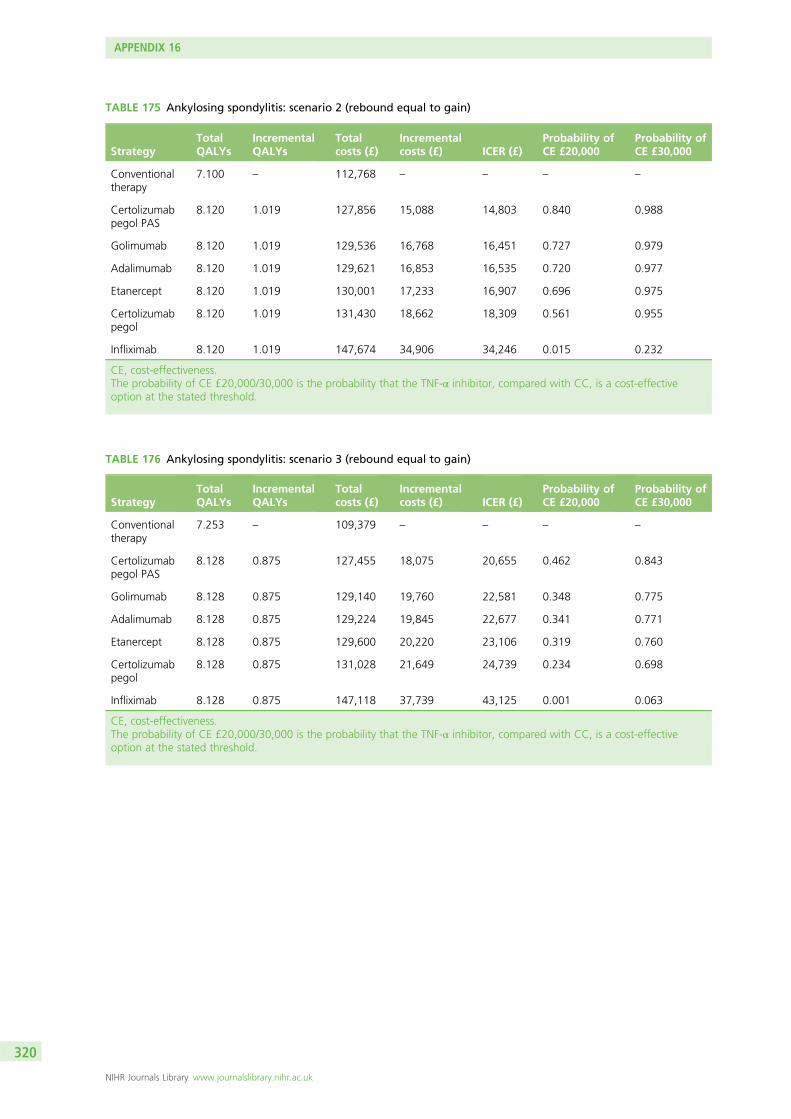
TABLE 175 Ankylosing spondylitis: scenario 2 (rebound equal to gain)
StrategyTotalQALYs
IncrementalQALYs
Totalcosts (£)
Incrementalcosts (£) ICER (£)
Probability ofCE £20,000
Probability ofCE £30,000
Conventionaltherapy
7.100 – 112,768 – – – –
Certolizumabpegol PAS
8.120 1.019 127,856 15,088 14,803 0.840 0.988
Golimumab 8.120 1.019 129,536 16,768 16,451 0.727 0.979
Adalimumab 8.120 1.019 129,621 16,853 16,535 0.720 0.977
Etanercept 8.120 1.019 130,001 17,233 16,907 0.696 0.975
Certolizumabpegol
8.120 1.019 131,430 18,662 18,309 0.561 0.955
Infliximab 8.120 1.019 147,674 34,906 34,246 0.015 0.232
CE, cost-effectiveness.The probability of CE £20,000/30,000 is the probability that the TNF-α inhibitor, compared with CC, is a cost-effectiveoption at the stated threshold.
TABLE 176 Ankylosing spondylitis: scenario 3 (rebound equal to gain)
StrategyTotalQALYs
IncrementalQALYs
Totalcosts (£)
Incrementalcosts (£) ICER (£)
Probability ofCE £20,000
Probability ofCE £30,000
Conventionaltherapy
7.253 – 109,379 – – – –
Certolizumabpegol PAS
8.128 0.875 127,455 18,075 20,655 0.462 0.843
Golimumab 8.128 0.875 129,140 19,760 22,581 0.348 0.775
Adalimumab 8.128 0.875 129,224 19,845 22,677 0.341 0.771
Etanercept 8.128 0.875 129,600 20,220 23,106 0.319 0.760
Certolizumabpegol
8.128 0.875 131,028 21,649 24,739 0.234 0.698
Infliximab 8.128 0.875 147,118 37,739 43,125 0.001 0.063
CE, cost-effectiveness.The probability of CE £20,000/30,000 is the probability that the TNF-α inhibitor, compared with CC, is a cost-effectiveoption at the stated threshold.
APPENDIX 16
NIHR Journals Library www.journalslibrary.nihr.ac.uk
320
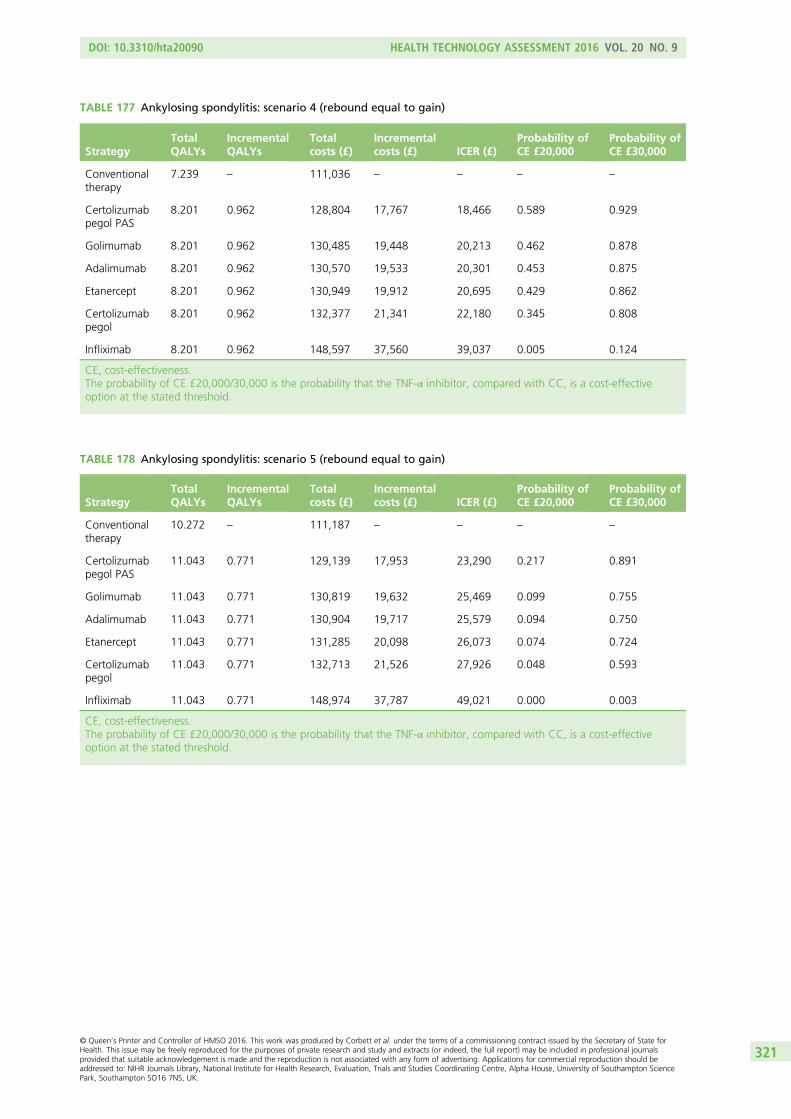
TABLE 177 Ankylosing spondylitis: scenario 4 (rebound equal to gain)
StrategyTotalQALYs
IncrementalQALYs
Totalcosts (£)
Incrementalcosts (£) ICER (£)
Probability ofCE £20,000
Probability ofCE £30,000
Conventionaltherapy
7.239 – 111,036 – – – –
Certolizumabpegol PAS
8.201 0.962 128,804 17,767 18,466 0.589 0.929
Golimumab 8.201 0.962 130,485 19,448 20,213 0.462 0.878
Adalimumab 8.201 0.962 130,570 19,533 20,301 0.453 0.875
Etanercept 8.201 0.962 130,949 19,912 20,695 0.429 0.862
Certolizumabpegol
8.201 0.962 132,377 21,341 22,180 0.345 0.808
Infliximab 8.201 0.962 148,597 37,560 39,037 0.005 0.124
CE, cost-effectiveness.The probability of CE £20,000/30,000 is the probability that the TNF-α inhibitor, compared with CC, is a cost-effectiveoption at the stated threshold.
TABLE 178 Ankylosing spondylitis: scenario 5 (rebound equal to gain)
StrategyTotalQALYs
IncrementalQALYs
Totalcosts (£)
Incrementalcosts (£) ICER (£)
Probability ofCE £20,000
Probability ofCE £30,000
Conventionaltherapy
10.272 – 111,187 – – – –
Certolizumabpegol PAS
11.043 0.771 129,139 17,953 23,290 0.217 0.891
Golimumab 11.043 0.771 130,819 19,632 25,469 0.099 0.755
Adalimumab 11.043 0.771 130,904 19,717 25,579 0.094 0.750
Etanercept 11.043 0.771 131,285 20,098 26,073 0.074 0.724
Certolizumabpegol
11.043 0.771 132,713 21,526 27,926 0.048 0.593
Infliximab 11.043 0.771 148,974 37,787 49,021 0.000 0.003
CE, cost-effectiveness.The probability of CE £20,000/30,000 is the probability that the TNF-α inhibitor, compared with CC, is a cost-effectiveoption at the stated threshold.
DOI: 10.3310/hta20090 HEALTH TECHNOLOGY ASSESSMENT 2016 VOL. 20 NO. 9
© Queen’s Printer and Controller of HMSO 2016. This work was produced by Corbett et al. under the terms of a commissioning contract issued by the Secretary of State forHealth. This issue may be freely reproduced for the purposes of private research and study and extracts (or indeed, the full report) may be included in professional journalsprovided that suitable acknowledgement is made and the reproduction is not associated with any form of advertising. Applications for commercial reproduction should beaddressed to: NIHR Journals Library, National Institute for Health Research, Evaluation, Trials and Studies Coordinating Centre, Alpha House, University of Southampton SciencePark, Southampton SO16 7NS, UK.
321
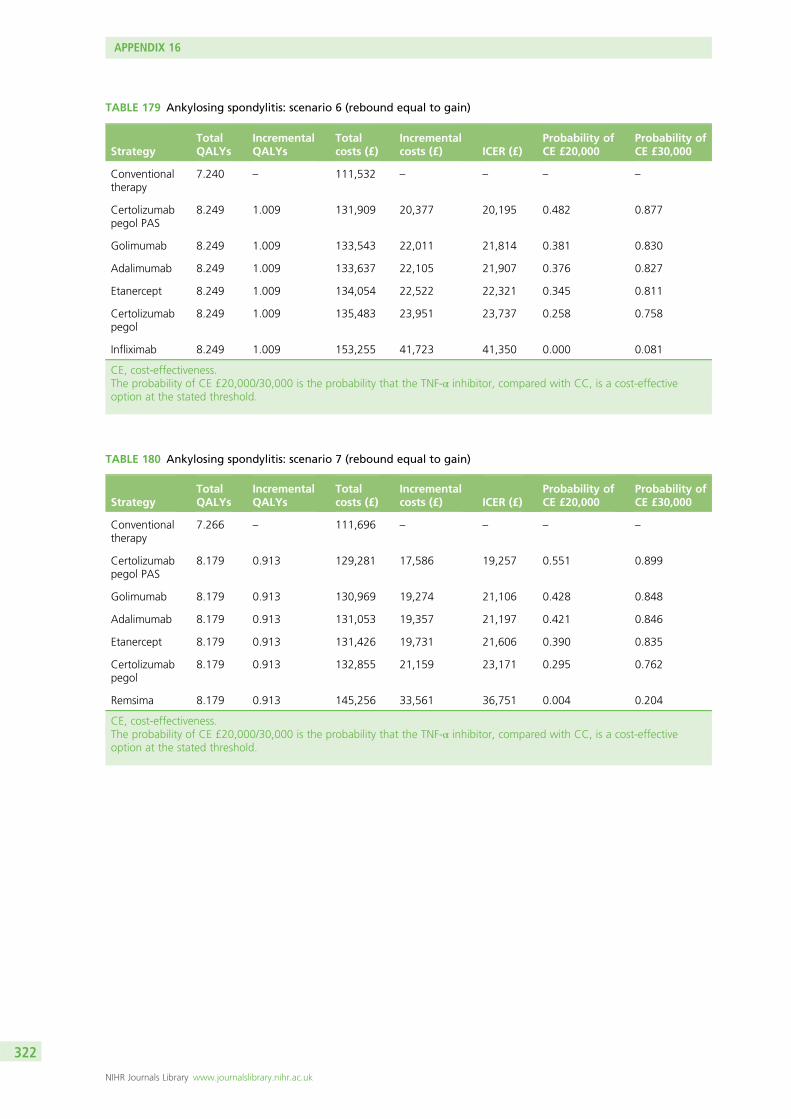
TABLE 179 Ankylosing spondylitis: scenario 6 (rebound equal to gain)
StrategyTotalQALYs
IncrementalQALYs
Totalcosts (£)
Incrementalcosts (£) ICER (£)
Probability ofCE £20,000
Probability ofCE £30,000
Conventionaltherapy
7.240 – 111,532 – – – –
Certolizumabpegol PAS
8.249 1.009 131,909 20,377 20,195 0.482 0.877
Golimumab 8.249 1.009 133,543 22,011 21,814 0.381 0.830
Adalimumab 8.249 1.009 133,637 22,105 21,907 0.376 0.827
Etanercept 8.249 1.009 134,054 22,522 22,321 0.345 0.811
Certolizumabpegol
8.249 1.009 135,483 23,951 23,737 0.258 0.758
Infliximab 8.249 1.009 153,255 41,723 41,350 0.000 0.081
CE, cost-effectiveness.The probability of CE £20,000/30,000 is the probability that the TNF-α inhibitor, compared with CC, is a cost-effectiveoption at the stated threshold.
TABLE 180 Ankylosing spondylitis: scenario 7 (rebound equal to gain)
StrategyTotalQALYs
IncrementalQALYs
Totalcosts (£)
Incrementalcosts (£) ICER (£)
Probability ofCE £20,000
Probability ofCE £30,000
Conventionaltherapy
7.266 – 111,696 – – – –
Certolizumabpegol PAS
8.179 0.913 129,281 17,586 19,257 0.551 0.899
Golimumab 8.179 0.913 130,969 19,274 21,106 0.428 0.848
Adalimumab 8.179 0.913 131,053 19,357 21,197 0.421 0.846
Etanercept 8.179 0.913 131,426 19,731 21,606 0.390 0.835
Certolizumabpegol
8.179 0.913 132,855 21,159 23,171 0.295 0.762
Remsima 8.179 0.913 145,256 33,561 36,751 0.004 0.204
CE, cost-effectiveness.The probability of CE £20,000/30,000 is the probability that the TNF-α inhibitor, compared with CC, is a cost-effectiveoption at the stated threshold.
APPENDIX 16
NIHR Journals Library www.journalslibrary.nihr.ac.uk
322
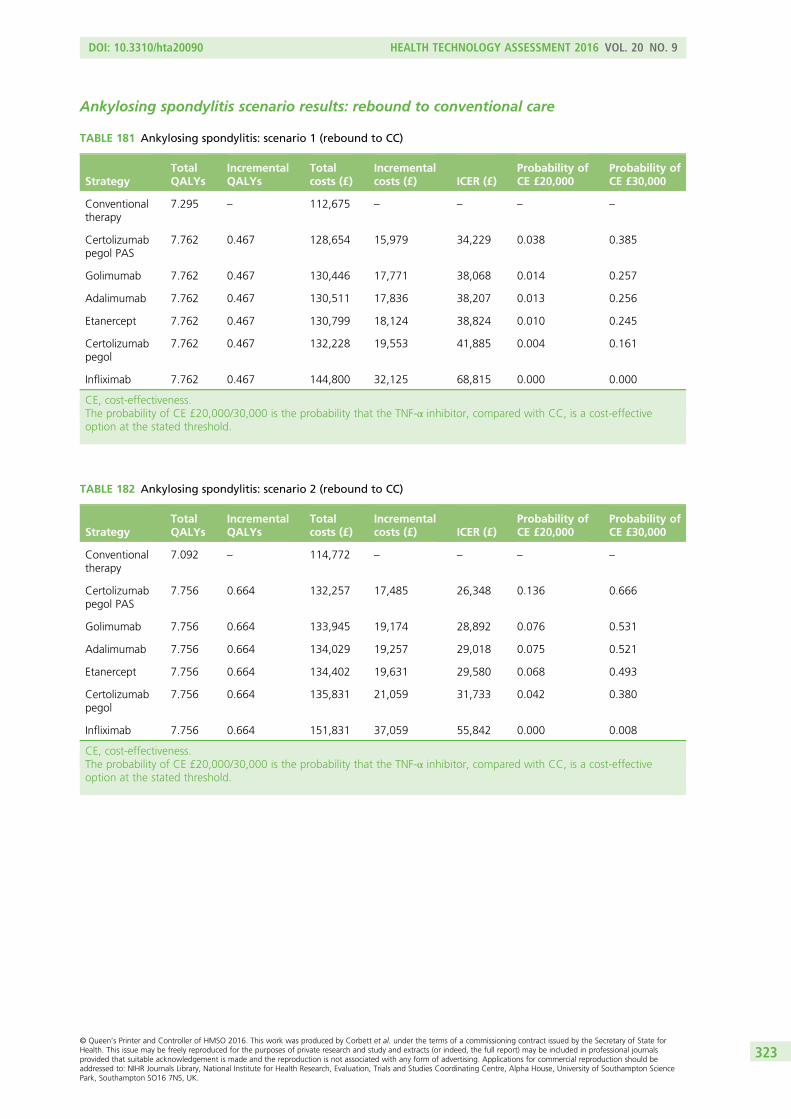
Ankylosing spondylitis scenario results: rebound to conventional care
TABLE 181 Ankylosing spondylitis: scenario 1 (rebound to CC)
StrategyTotalQALYs
IncrementalQALYs
Totalcosts (£)
Incrementalcosts (£) ICER (£)
Probability ofCE £20,000
Probability ofCE £30,000
Conventionaltherapy
7.295 – 112,675 – – – –
Certolizumabpegol PAS
7.762 0.467 128,654 15,979 34,229 0.038 0.385
Golimumab 7.762 0.467 130,446 17,771 38,068 0.014 0.257
Adalimumab 7.762 0.467 130,511 17,836 38,207 0.013 0.256
Etanercept 7.762 0.467 130,799 18,124 38,824 0.010 0.245
Certolizumabpegol
7.762 0.467 132,228 19,553 41,885 0.004 0.161
Infliximab 7.762 0.467 144,800 32,125 68,815 0.000 0.000
CE, cost-effectiveness.The probability of CE £20,000/30,000 is the probability that the TNF-α inhibitor, compared with CC, is a cost-effectiveoption at the stated threshold.
TABLE 182 Ankylosing spondylitis: scenario 2 (rebound to CC)
StrategyTotalQALYs
IncrementalQALYs
Totalcosts (£)
Incrementalcosts (£) ICER (£)
Probability ofCE £20,000
Probability ofCE £30,000
Conventionaltherapy
7.092 – 114,772 – – – –
Certolizumabpegol PAS
7.756 0.664 132,257 17,485 26,348 0.136 0.666
Golimumab 7.756 0.664 133,945 19,174 28,892 0.076 0.531
Adalimumab 7.756 0.664 134,029 19,257 29,018 0.075 0.521
Etanercept 7.756 0.664 134,402 19,631 29,580 0.068 0.493
Certolizumabpegol
7.756 0.664 135,831 21,059 31,733 0.042 0.380
Infliximab 7.756 0.664 151,831 37,059 55,842 0.000 0.008
CE, cost-effectiveness.The probability of CE £20,000/30,000 is the probability that the TNF-α inhibitor, compared with CC, is a cost-effectiveoption at the stated threshold.
DOI: 10.3310/hta20090 HEALTH TECHNOLOGY ASSESSMENT 2016 VOL. 20 NO. 9
© Queen’s Printer and Controller of HMSO 2016. This work was produced by Corbett et al. under the terms of a commissioning contract issued by the Secretary of State forHealth. This issue may be freely reproduced for the purposes of private research and study and extracts (or indeed, the full report) may be included in professional journalsprovided that suitable acknowledgement is made and the reproduction is not associated with any form of advertising. Applications for commercial reproduction should beaddressed to: NIHR Journals Library, National Institute for Health Research, Evaluation, Trials and Studies Coordinating Centre, Alpha House, University of Southampton SciencePark, Southampton SO16 7NS, UK.
323

TABLE 183 Ankylosing spondylitis: scenario 3 (rebound to CC)
StrategyTotalQALYs
IncrementalQALYs
Totalcosts (£)
Incrementalcosts (£) ICER (£)
Probability ofCE £20,000
Probability ofCE £30,000
Conventionaltherapy
7.252 – 110,930 – – – –
Certolizumabpegol PAS
7.818 0.566 131,610 20,679 36,518 0.021 0.339
Golimumab 7.818 0.566 133,289 22,359 39,483 0.009 0.249
Adalimumab 7.818 0.566 133,374 22,444 39,634 0.008 0.245
Etanercept 7.818 0.566 133,755 22,824 40,306 0.006 0.230
Certolizumabpegol
7.818 0.566 135,183 24,253 42,828 0.003 0.166
Infliximab 7.818 0.566 151,457 40,526 71,565 0.000 0.000
CE, cost-effectiveness.The probability of CE £20,000/30,000 is the probability that the TNF-α inhibitor, compared with CC, is a cost-effectiveoption at the stated threshold.
TABLE 184 Ankylosing spondylitis: scenario 4 (rebound to CC)
StrategyTotalQALYs
IncrementalQALYs
Totalcosts (£)
Incrementalcosts (£) ICER (£)
Probability ofCE £20,000
Probability ofCE £30,000
Conventionaltherapy
7.268 – 108,817 – – – –
Certolizumabpegol PAS
7.894 0.626 128,999 20,182 32,222 0.047 0.429
Golimumab 7.894 0.626 130,683 21,866 34,910 0.022 0.341
Adalimumab 7.894 0.626 130,767 21,951 35,045 0.020 0.339
Etanercept 7.894 0.626 131,144 22,327 35,647 0.016 0.310
Certolizumabpegol
7.894 0.626 132,573 23,756 37,928 0.008 0.234
Infliximab 7.894 0.626 148,706 39,889 63,684 0.000 0.000
CE, cost-effectiveness.The probability of CE £20,000/30,000 is the probability that the TNF-α inhibitor, compared with CC, is a cost-effectiveoption at the stated threshold.
APPENDIX 16
NIHR Journals Library www.journalslibrary.nihr.ac.uk
324
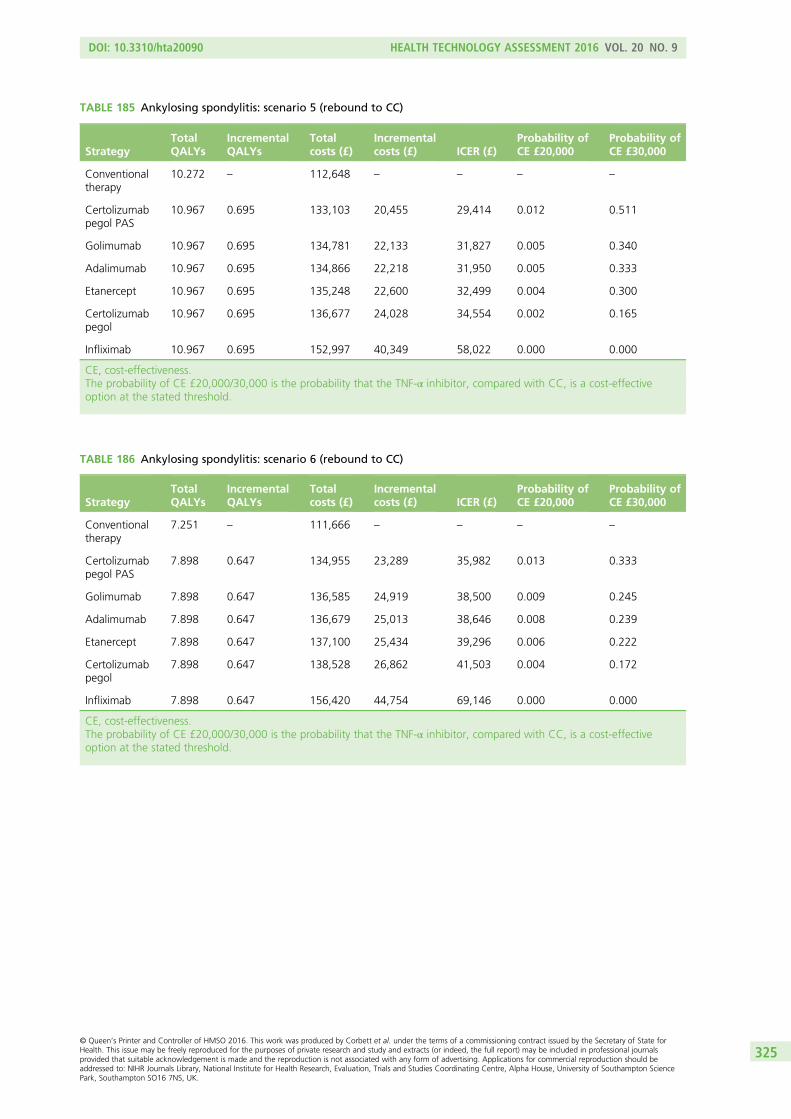
TABLE 185 Ankylosing spondylitis: scenario 5 (rebound to CC)
StrategyTotalQALYs
IncrementalQALYs
Totalcosts (£)
Incrementalcosts (£) ICER (£)
Probability ofCE £20,000
Probability ofCE £30,000
Conventionaltherapy
10.272 – 112,648 – – – –
Certolizumabpegol PAS
10.967 0.695 133,103 20,455 29,414 0.012 0.511
Golimumab 10.967 0.695 134,781 22,133 31,827 0.005 0.340
Adalimumab 10.967 0.695 134,866 22,218 31,950 0.005 0.333
Etanercept 10.967 0.695 135,248 22,600 32,499 0.004 0.300
Certolizumabpegol
10.967 0.695 136,677 24,028 34,554 0.002 0.165
Infliximab 10.967 0.695 152,997 40,349 58,022 0.000 0.000
CE, cost-effectiveness.The probability of CE £20,000/30,000 is the probability that the TNF-α inhibitor, compared with CC, is a cost-effectiveoption at the stated threshold.
TABLE 186 Ankylosing spondylitis: scenario 6 (rebound to CC)
StrategyTotalQALYs
IncrementalQALYs
Totalcosts (£)
Incrementalcosts (£) ICER (£)
Probability ofCE £20,000
Probability ofCE £30,000
Conventionaltherapy
7.251 – 111,666 – – – –
Certolizumabpegol PAS
7.898 0.647 134,955 23,289 35,982 0.013 0.333
Golimumab 7.898 0.647 136,585 24,919 38,500 0.009 0.245
Adalimumab 7.898 0.647 136,679 25,013 38,646 0.008 0.239
Etanercept 7.898 0.647 137,100 25,434 39,296 0.006 0.222
Certolizumabpegol
7.898 0.647 138,528 26,862 41,503 0.004 0.172
Infliximab 7.898 0.647 156,420 44,754 69,146 0.000 0.000
CE, cost-effectiveness.The probability of CE £20,000/30,000 is the probability that the TNF-α inhibitor, compared with CC, is a cost-effectiveoption at the stated threshold.
DOI: 10.3310/hta20090 HEALTH TECHNOLOGY ASSESSMENT 2016 VOL. 20 NO. 9
© Queen’s Printer and Controller of HMSO 2016. This work was produced by Corbett et al. under the terms of a commissioning contract issued by the Secretary of State forHealth. This issue may be freely reproduced for the purposes of private research and study and extracts (or indeed, the full report) may be included in professional journalsprovided that suitable acknowledgement is made and the reproduction is not associated with any form of advertising. Applications for commercial reproduction should beaddressed to: NIHR Journals Library, National Institute for Health Research, Evaluation, Trials and Studies Coordinating Centre, Alpha House, University of Southampton SciencePark, Southampton SO16 7NS, UK.
325
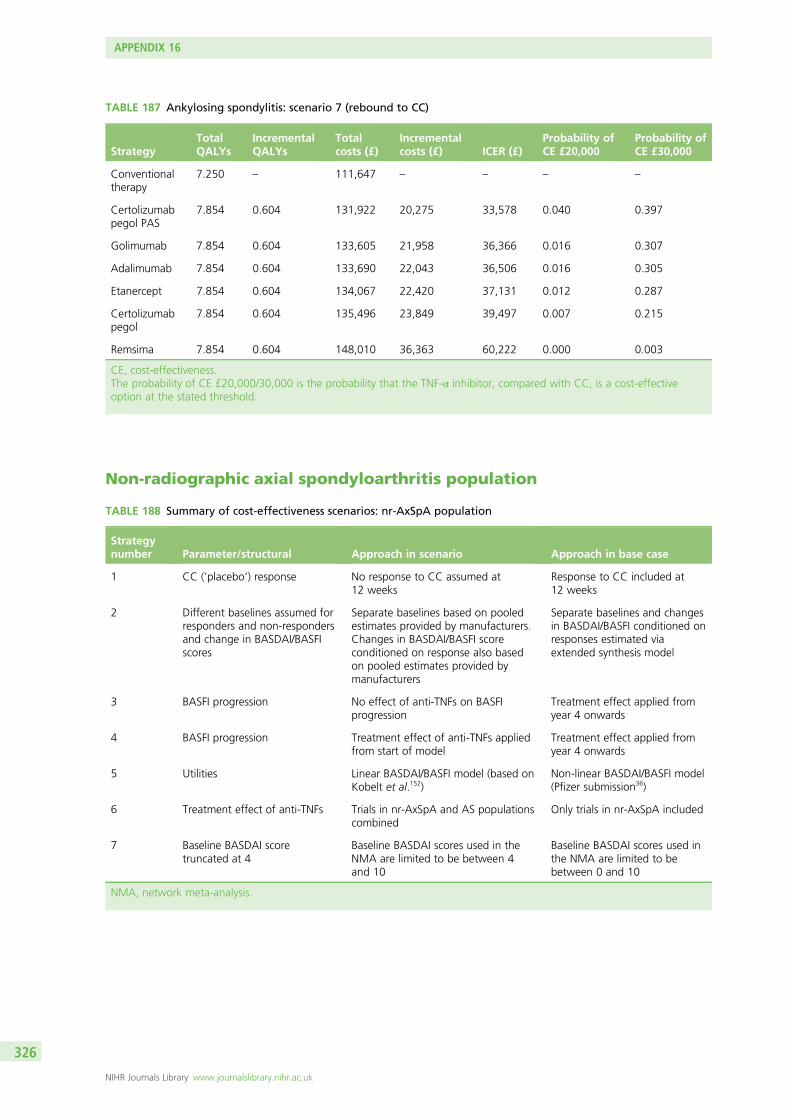
TABLE 187 Ankylosing spondylitis: scenario 7 (rebound to CC)
StrategyTotalQALYs
IncrementalQALYs
Totalcosts (£)
Incrementalcosts (£) ICER (£)
Probability ofCE £20,000
Probability ofCE £30,000
Conventionaltherapy
7.250 – 111,647 – – – –
Certolizumabpegol PAS
7.854 0.604 131,922 20,275 33,578 0.040 0.397
Golimumab 7.854 0.604 133,605 21,958 36,366 0.016 0.307
Adalimumab 7.854 0.604 133,690 22,043 36,506 0.016 0.305
Etanercept 7.854 0.604 134,067 22,420 37,131 0.012 0.287
Certolizumabpegol
7.854 0.604 135,496 23,849 39,497 0.007 0.215
Remsima 7.854 0.604 148,010 36,363 60,222 0.000 0.003
CE, cost-effectiveness.The probability of CE £20,000/30,000 is the probability that the TNF-α inhibitor, compared with CC, is a cost-effectiveoption at the stated threshold.
Non-radiographic axial spondyloarthritis population
TABLE 188 Summary of cost-effectiveness scenarios: nr-AxSpA population
Strategynumber Parameter/structural Approach in scenario Approach in base case
1 CC (‘placebo’) response No response to CC assumed at12 weeks
Response to CC included at12 weeks
2 Different baselines assumed forresponders and non-respondersand change in BASDAI/BASFIscores
Separate baselines based on pooledestimates provided by manufacturers.Changes in BASDAI/BASFI scoreconditioned on response also basedon pooled estimates provided bymanufacturers
Separate baselines and changesin BASDAI/BASFI conditioned onresponses estimated viaextended synthesis model
3 BASFI progression No effect of anti-TNFs on BASFIprogression
Treatment effect applied fromyear 4 onwards
4 BASFI progression Treatment effect of anti-TNFs appliedfrom start of model
Treatment effect applied fromyear 4 onwards
5 Utilities Linear BASDAI/BASFI model (based onKobelt et al.152)
Non-linear BASDAI/BASFI model(Pfizer submission36)
6 Treatment effect of anti-TNFs Trials in nr-AxSpA and AS populationscombined
Only trials in nr-AxSpA included
7 Baseline BASDAI scoretruncated at 4
Baseline BASDAI scores used in theNMA are limited to be between 4and 10
Baseline BASDAI scores used inthe NMA are limited to bebetween 0 and 10
NMA, network meta-analysis.
APPENDIX 16
NIHR Journals Library www.journalslibrary.nihr.ac.uk
326
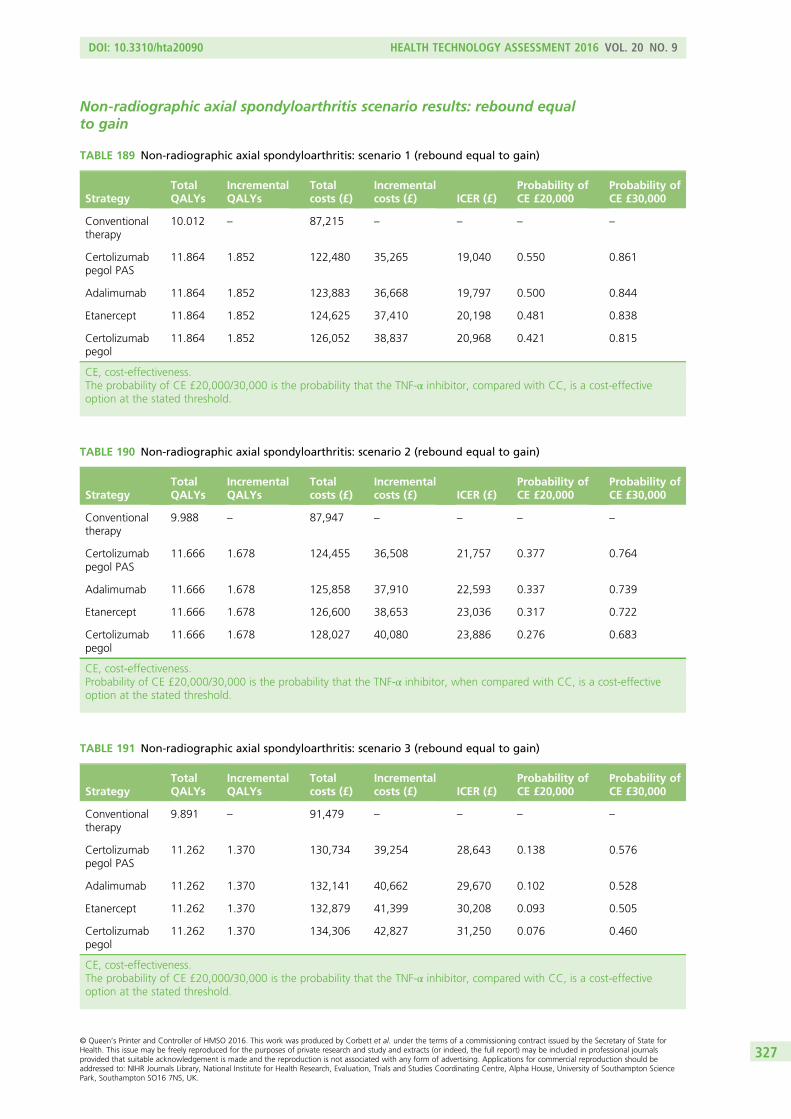
Non-radiographic axial spondyloarthritis scenario results: rebound equalto gain
TABLE 189 Non-radiographic axial spondyloarthritis: scenario 1 (rebound equal to gain)
StrategyTotalQALYs
IncrementalQALYs
Totalcosts (£)
Incrementalcosts (£) ICER (£)
Probability ofCE £20,000
Probability ofCE £30,000
Conventionaltherapy
10.012 – 87,215 – – – –
Certolizumabpegol PAS
11.864 1.852 122,480 35,265 19,040 0.550 0.861
Adalimumab 11.864 1.852 123,883 36,668 19,797 0.500 0.844
Etanercept 11.864 1.852 124,625 37,410 20,198 0.481 0.838
Certolizumabpegol
11.864 1.852 126,052 38,837 20,968 0.421 0.815
CE, cost-effectiveness.The probability of CE £20,000/30,000 is the probability that the TNF-α inhibitor, compared with CC, is a cost-effectiveoption at the stated threshold.
TABLE 190 Non-radiographic axial spondyloarthritis: scenario 2 (rebound equal to gain)
StrategyTotalQALYs
IncrementalQALYs
Totalcosts (£)
Incrementalcosts (£) ICER (£)
Probability ofCE £20,000
Probability ofCE £30,000
Conventionaltherapy
9.988 – 87,947 – – – –
Certolizumabpegol PAS
11.666 1.678 124,455 36,508 21,757 0.377 0.764
Adalimumab 11.666 1.678 125,858 37,910 22,593 0.337 0.739
Etanercept 11.666 1.678 126,600 38,653 23,036 0.317 0.722
Certolizumabpegol
11.666 1.678 128,027 40,080 23,886 0.276 0.683
CE, cost-effectiveness.Probability of CE £20,000/30,000 is the probability that the TNF-α inhibitor, when compared with CC, is a cost-effectiveoption at the stated threshold.
TABLE 191 Non-radiographic axial spondyloarthritis: scenario 3 (rebound equal to gain)
StrategyTotalQALYs
IncrementalQALYs
Totalcosts (£)
Incrementalcosts (£) ICER (£)
Probability ofCE £20,000
Probability ofCE £30,000
Conventionaltherapy
9.891 – 91,479 – – – –
Certolizumabpegol PAS
11.262 1.370 130,734 39,254 28,643 0.138 0.576
Adalimumab 11.262 1.370 132,141 40,662 29,670 0.102 0.528
Etanercept 11.262 1.370 132,879 41,399 30,208 0.093 0.505
Certolizumabpegol
11.262 1.370 134,306 42,827 31,250 0.076 0.460
CE, cost-effectiveness.The probability of CE £20,000/30,000 is the probability that the TNF-α inhibitor, compared with CC, is a cost-effectiveoption at the stated threshold.
DOI: 10.3310/hta20090 HEALTH TECHNOLOGY ASSESSMENT 2016 VOL. 20 NO. 9
© Queen’s Printer and Controller of HMSO 2016. This work was produced by Corbett et al. under the terms of a commissioning contract issued by the Secretary of State forHealth. This issue may be freely reproduced for the purposes of private research and study and extracts (or indeed, the full report) may be included in professional journalsprovided that suitable acknowledgement is made and the reproduction is not associated with any form of advertising. Applications for commercial reproduction should beaddressed to: NIHR Journals Library, National Institute for Health Research, Evaluation, Trials and Studies Coordinating Centre, Alpha House, University of Southampton SciencePark, Southampton SO16 7NS, UK.
327
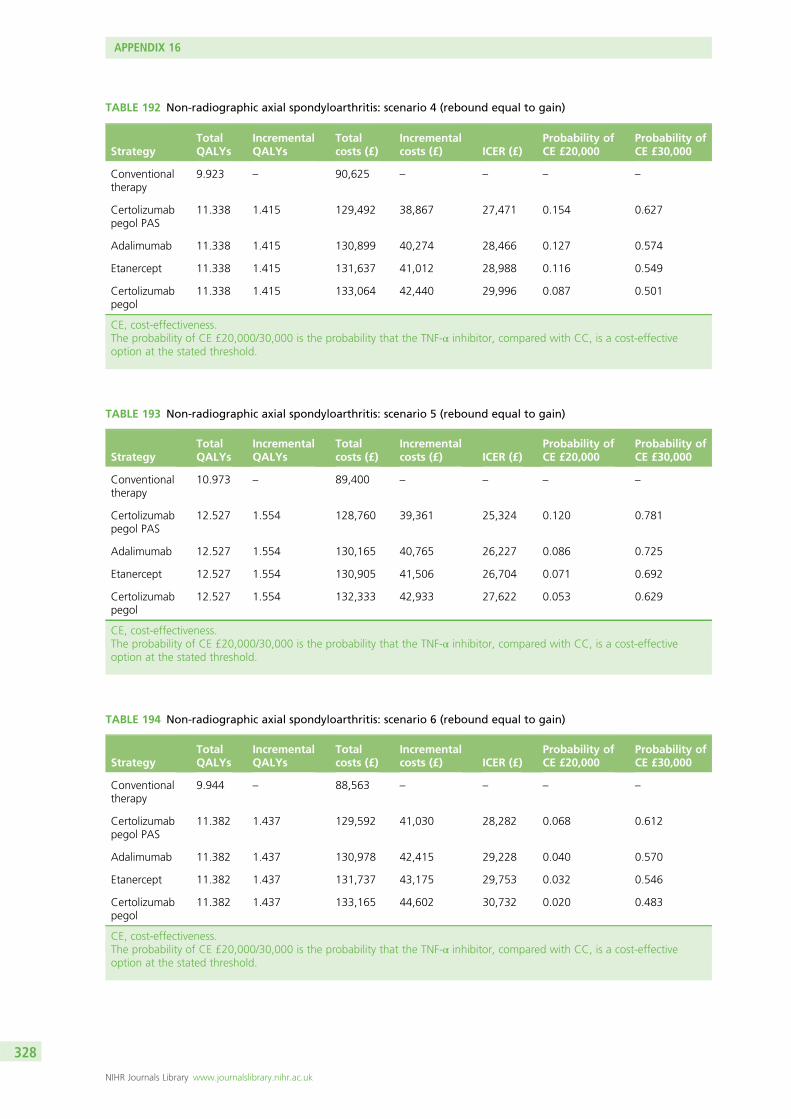
TABLE 192 Non-radiographic axial spondyloarthritis: scenario 4 (rebound equal to gain)
StrategyTotalQALYs
IncrementalQALYs
Totalcosts (£)
Incrementalcosts (£) ICER (£)
Probability ofCE £20,000
Probability ofCE £30,000
Conventionaltherapy
9.923 – 90,625 – – – –
Certolizumabpegol PAS
11.338 1.415 129,492 38,867 27,471 0.154 0.627
Adalimumab 11.338 1.415 130,899 40,274 28,466 0.127 0.574
Etanercept 11.338 1.415 131,637 41,012 28,988 0.116 0.549
Certolizumabpegol
11.338 1.415 133,064 42,440 29,996 0.087 0.501
CE, cost-effectiveness.The probability of CE £20,000/30,000 is the probability that the TNF-α inhibitor, compared with CC, is a cost-effectiveoption at the stated threshold.
TABLE 193 Non-radiographic axial spondyloarthritis: scenario 5 (rebound equal to gain)
StrategyTotalQALYs
IncrementalQALYs
Totalcosts (£)
Incrementalcosts (£) ICER (£)
Probability ofCE £20,000
Probability ofCE £30,000
Conventionaltherapy
10.973 – 89,400 – – – –
Certolizumabpegol PAS
12.527 1.554 128,760 39,361 25,324 0.120 0.781
Adalimumab 12.527 1.554 130,165 40,765 26,227 0.086 0.725
Etanercept 12.527 1.554 130,905 41,506 26,704 0.071 0.692
Certolizumabpegol
12.527 1.554 132,333 42,933 27,622 0.053 0.629
CE, cost-effectiveness.The probability of CE £20,000/30,000 is the probability that the TNF-α inhibitor, compared with CC, is a cost-effectiveoption at the stated threshold.
TABLE 194 Non-radiographic axial spondyloarthritis: scenario 6 (rebound equal to gain)
StrategyTotalQALYs
IncrementalQALYs
Totalcosts (£)
Incrementalcosts (£) ICER (£)
Probability ofCE £20,000
Probability ofCE £30,000
Conventionaltherapy
9.944 – 88,563 – – – –
Certolizumabpegol PAS
11.382 1.437 129,592 41,030 28,282 0.068 0.612
Adalimumab 11.382 1.437 130,978 42,415 29,228 0.040 0.570
Etanercept 11.382 1.437 131,737 43,175 29,753 0.032 0.546
Certolizumabpegol
11.382 1.437 133,165 44,602 30,732 0.020 0.483
CE, cost-effectiveness.The probability of CE £20,000/30,000 is the probability that the TNF-α inhibitor, compared with CC, is a cost-effectiveoption at the stated threshold.
APPENDIX 16
NIHR Journals Library www.journalslibrary.nihr.ac.uk
328
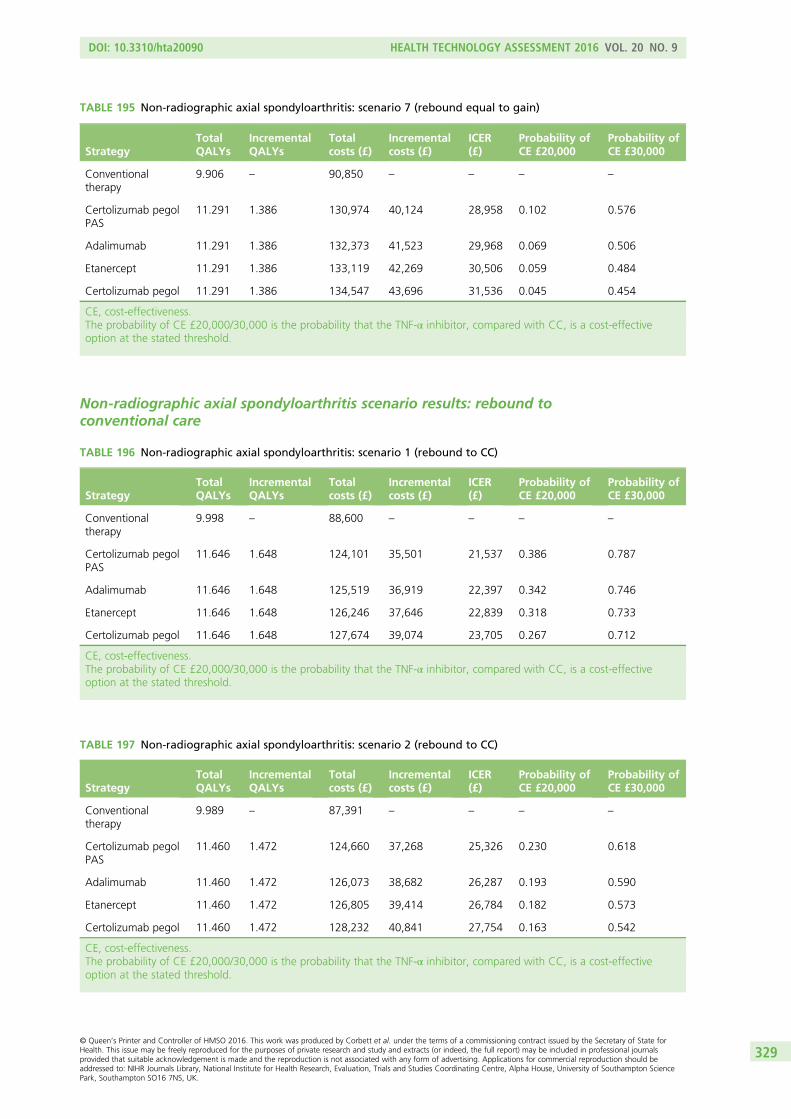
TABLE 195 Non-radiographic axial spondyloarthritis: scenario 7 (rebound equal to gain)
StrategyTotalQALYs
IncrementalQALYs
Totalcosts (£)
Incrementalcosts (£)
ICER(£)
Probability ofCE £20,000
Probability ofCE £30,000
Conventionaltherapy
9.906 – 90,850 – – – –
Certolizumab pegolPAS
11.291 1.386 130,974 40,124 28,958 0.102 0.576
Adalimumab 11.291 1.386 132,373 41,523 29,968 0.069 0.506
Etanercept 11.291 1.386 133,119 42,269 30,506 0.059 0.484
Certolizumab pegol 11.291 1.386 134,547 43,696 31,536 0.045 0.454
CE, cost-effectiveness.The probability of CE £20,000/30,000 is the probability that the TNF-α inhibitor, compared with CC, is a cost-effectiveoption at the stated threshold.
Non-radiographic axial spondyloarthritis scenario results: rebound toconventional care
TABLE 196 Non-radiographic axial spondyloarthritis: scenario 1 (rebound to CC)
StrategyTotalQALYs
IncrementalQALYs
Totalcosts (£)
Incrementalcosts (£)
ICER(£)
Probability ofCE £20,000
Probability ofCE £30,000
Conventionaltherapy
9.998 – 88,600 – – – –
Certolizumab pegolPAS
11.646 1.648 124,101 35,501 21,537 0.386 0.787
Adalimumab 11.646 1.648 125,519 36,919 22,397 0.342 0.746
Etanercept 11.646 1.648 126,246 37,646 22,839 0.318 0.733
Certolizumab pegol 11.646 1.648 127,674 39,074 23,705 0.267 0.712
CE, cost-effectiveness.The probability of CE £20,000/30,000 is the probability that the TNF-α inhibitor, compared with CC, is a cost-effectiveoption at the stated threshold.
TABLE 197 Non-radiographic axial spondyloarthritis: scenario 2 (rebound to CC)
StrategyTotalQALYs
IncrementalQALYs
Totalcosts (£)
Incrementalcosts (£)
ICER(£)
Probability ofCE £20,000
Probability ofCE £30,000
Conventionaltherapy
9.989 – 87,391 – – – –
Certolizumab pegolPAS
11.460 1.472 124,660 37,268 25,326 0.230 0.618
Adalimumab 11.460 1.472 126,073 38,682 26,287 0.193 0.590
Etanercept 11.460 1.472 126,805 39,414 26,784 0.182 0.573
Certolizumab pegol 11.460 1.472 128,232 40,841 27,754 0.163 0.542
CE, cost-effectiveness.The probability of CE £20,000/30,000 is the probability that the TNF-α inhibitor, compared with CC, is a cost-effectiveoption at the stated threshold.
DOI: 10.3310/hta20090 HEALTH TECHNOLOGY ASSESSMENT 2016 VOL. 20 NO. 9
© Queen’s Printer and Controller of HMSO 2016. This work was produced by Corbett et al. under the terms of a commissioning contract issued by the Secretary of State forHealth. This issue may be freely reproduced for the purposes of private research and study and extracts (or indeed, the full report) may be included in professional journalsprovided that suitable acknowledgement is made and the reproduction is not associated with any form of advertising. Applications for commercial reproduction should beaddressed to: NIHR Journals Library, National Institute for Health Research, Evaluation, Trials and Studies Coordinating Centre, Alpha House, University of Southampton SciencePark, Southampton SO16 7NS, UK.
329
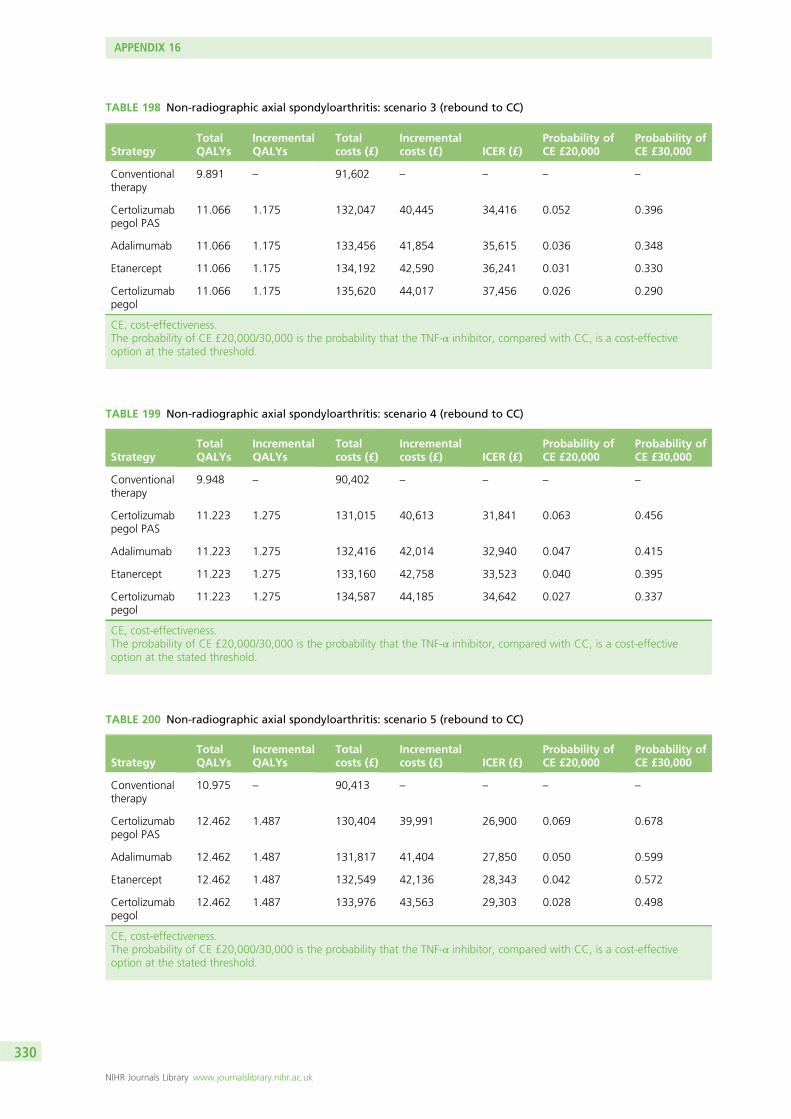
TABLE 198 Non-radiographic axial spondyloarthritis: scenario 3 (rebound to CC)
StrategyTotalQALYs
IncrementalQALYs
Totalcosts (£)
Incrementalcosts (£) ICER (£)
Probability ofCE £20,000
Probability ofCE £30,000
Conventionaltherapy
9.891 – 91,602 – – – –
Certolizumabpegol PAS
11.066 1.175 132,047 40,445 34,416 0.052 0.396
Adalimumab 11.066 1.175 133,456 41,854 35,615 0.036 0.348
Etanercept 11.066 1.175 134,192 42,590 36,241 0.031 0.330
Certolizumabpegol
11.066 1.175 135,620 44,017 37,456 0.026 0.290
CE, cost-effectiveness.The probability of CE £20,000/30,000 is the probability that the TNF-α inhibitor, compared with CC, is a cost-effectiveoption at the stated threshold.
TABLE 199 Non-radiographic axial spondyloarthritis: scenario 4 (rebound to CC)
StrategyTotalQALYs
IncrementalQALYs
Totalcosts (£)
Incrementalcosts (£) ICER (£)
Probability ofCE £20,000
Probability ofCE £30,000
Conventionaltherapy
9.948 – 90,402 – – – –
Certolizumabpegol PAS
11.223 1.275 131,015 40,613 31,841 0.063 0.456
Adalimumab 11.223 1.275 132,416 42,014 32,940 0.047 0.415
Etanercept 11.223 1.275 133,160 42,758 33,523 0.040 0.395
Certolizumabpegol
11.223 1.275 134,587 44,185 34,642 0.027 0.337
CE, cost-effectiveness.The probability of CE £20,000/30,000 is the probability that the TNF-α inhibitor, compared with CC, is a cost-effectiveoption at the stated threshold.
TABLE 200 Non-radiographic axial spondyloarthritis: scenario 5 (rebound to CC)
StrategyTotalQALYs
IncrementalQALYs
Totalcosts (£)
Incrementalcosts (£) ICER (£)
Probability ofCE £20,000
Probability ofCE £30,000
Conventionaltherapy
10.975 – 90,413 – – – –
Certolizumabpegol PAS
12.462 1.487 130,404 39,991 26,900 0.069 0.678
Adalimumab 12.462 1.487 131,817 41,404 27,850 0.050 0.599
Etanercept 12.462 1.487 132,549 42,136 28,343 0.042 0.572
Certolizumabpegol
12.462 1.487 133,976 43,563 29,303 0.028 0.498
CE, cost-effectiveness.The probability of CE £20,000/30,000 is the probability that the TNF-α inhibitor, compared with CC, is a cost-effectiveoption at the stated threshold.
APPENDIX 16
NIHR Journals Library www.journalslibrary.nihr.ac.uk
330
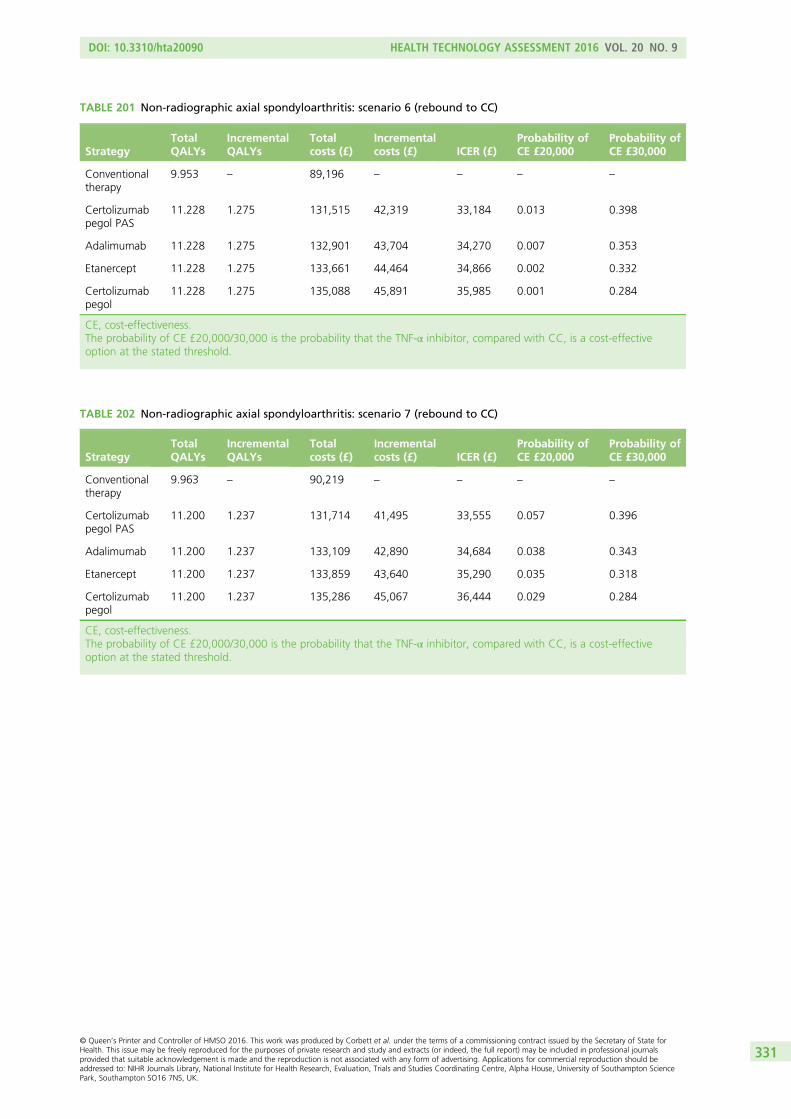
TABLE 201 Non-radiographic axial spondyloarthritis: scenario 6 (rebound to CC)
StrategyTotalQALYs
IncrementalQALYs
Totalcosts (£)
Incrementalcosts (£) ICER (£)
Probability ofCE £20,000
Probability ofCE £30,000
Conventionaltherapy
9.953 – 89,196 – – – –
Certolizumabpegol PAS
11.228 1.275 131,515 42,319 33,184 0.013 0.398
Adalimumab 11.228 1.275 132,901 43,704 34,270 0.007 0.353
Etanercept 11.228 1.275 133,661 44,464 34,866 0.002 0.332
Certolizumabpegol
11.228 1.275 135,088 45,891 35,985 0.001 0.284
CE, cost-effectiveness.The probability of CE £20,000/30,000 is the probability that the TNF-α inhibitor, compared with CC, is a cost-effectiveoption at the stated threshold.
TABLE 202 Non-radiographic axial spondyloarthritis: scenario 7 (rebound to CC)
StrategyTotalQALYs
IncrementalQALYs
Totalcosts (£)
Incrementalcosts (£) ICER (£)
Probability ofCE £20,000
Probability ofCE £30,000
Conventionaltherapy
9.963 – 90,219 – – – –
Certolizumabpegol PAS
11.200 1.237 131,714 41,495 33,555 0.057 0.396
Adalimumab 11.200 1.237 133,109 42,890 34,684 0.038 0.343
Etanercept 11.200 1.237 133,859 43,640 35,290 0.035 0.318
Certolizumabpegol
11.200 1.237 135,286 45,067 36,444 0.029 0.284
CE, cost-effectiveness.The probability of CE £20,000/30,000 is the probability that the TNF-α inhibitor, compared with CC, is a cost-effectiveoption at the stated threshold.
DOI: 10.3310/hta20090 HEALTH TECHNOLOGY ASSESSMENT 2016 VOL. 20 NO. 9
© Queen’s Printer and Controller of HMSO 2016. This work was produced by Corbett et al. under the terms of a commissioning contract issued by the Secretary of State forHealth. This issue may be freely reproduced for the purposes of private research and study and extracts (or indeed, the full report) may be included in professional journalsprovided that suitable acknowledgement is made and the reproduction is not associated with any form of advertising. Applications for commercial reproduction should beaddressed to: NIHR Journals Library, National Institute for Health Research, Evaluation, Trials and Studies Coordinating Centre, Alpha House, University of Southampton SciencePark, Southampton SO16 7NS, UK.
331
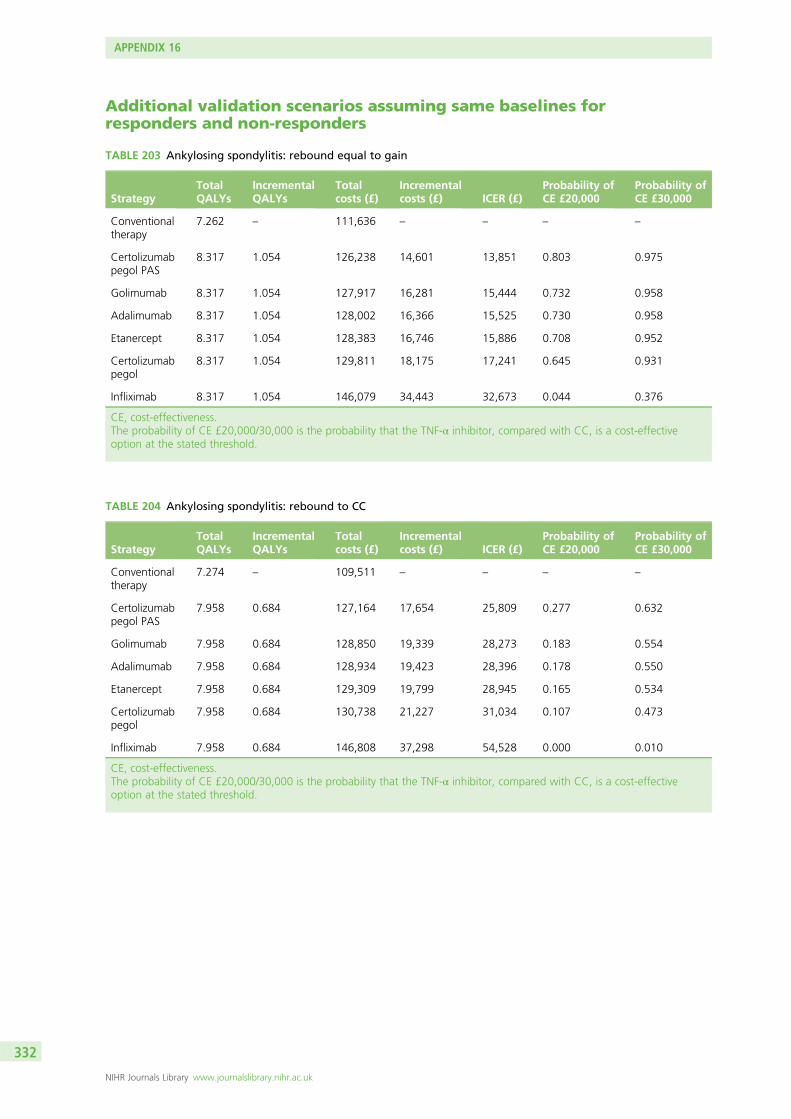
Additional validation scenarios assuming same baselines forresponders and non-responders
TABLE 203 Ankylosing spondylitis: rebound equal to gain
StrategyTotalQALYs
IncrementalQALYs
Totalcosts (£)
Incrementalcosts (£) ICER (£)
Probability ofCE £20,000
Probability ofCE £30,000
Conventionaltherapy
7.262 – 111,636 – – – –
Certolizumabpegol PAS
8.317 1.054 126,238 14,601 13,851 0.803 0.975
Golimumab 8.317 1.054 127,917 16,281 15,444 0.732 0.958
Adalimumab 8.317 1.054 128,002 16,366 15,525 0.730 0.958
Etanercept 8.317 1.054 128,383 16,746 15,886 0.708 0.952
Certolizumabpegol
8.317 1.054 129,811 18,175 17,241 0.645 0.931
Infliximab 8.317 1.054 146,079 34,443 32,673 0.044 0.376
CE, cost-effectiveness.The probability of CE £20,000/30,000 is the probability that the TNF-α inhibitor, compared with CC, is a cost-effectiveoption at the stated threshold.
TABLE 204 Ankylosing spondylitis: rebound to CC
StrategyTotalQALYs
IncrementalQALYs
Totalcosts (£)
Incrementalcosts (£) ICER (£)
Probability ofCE £20,000
Probability ofCE £30,000
Conventionaltherapy
7.274 – 109,511 – – – –
Certolizumabpegol PAS
7.958 0.684 127,164 17,654 25,809 0.277 0.632
Golimumab 7.958 0.684 128,850 19,339 28,273 0.183 0.554
Adalimumab 7.958 0.684 128,934 19,423 28,396 0.178 0.550
Etanercept 7.958 0.684 129,309 19,799 28,945 0.165 0.534
Certolizumabpegol
7.958 0.684 130,738 21,227 31,034 0.107 0.473
Infliximab 7.958 0.684 146,808 37,298 54,528 0.000 0.010
CE, cost-effectiveness.The probability of CE £20,000/30,000 is the probability that the TNF-α inhibitor, compared with CC, is a cost-effectiveoption at the stated threshold.
APPENDIX 16
NIHR Journals Library www.journalslibrary.nihr.ac.uk
332
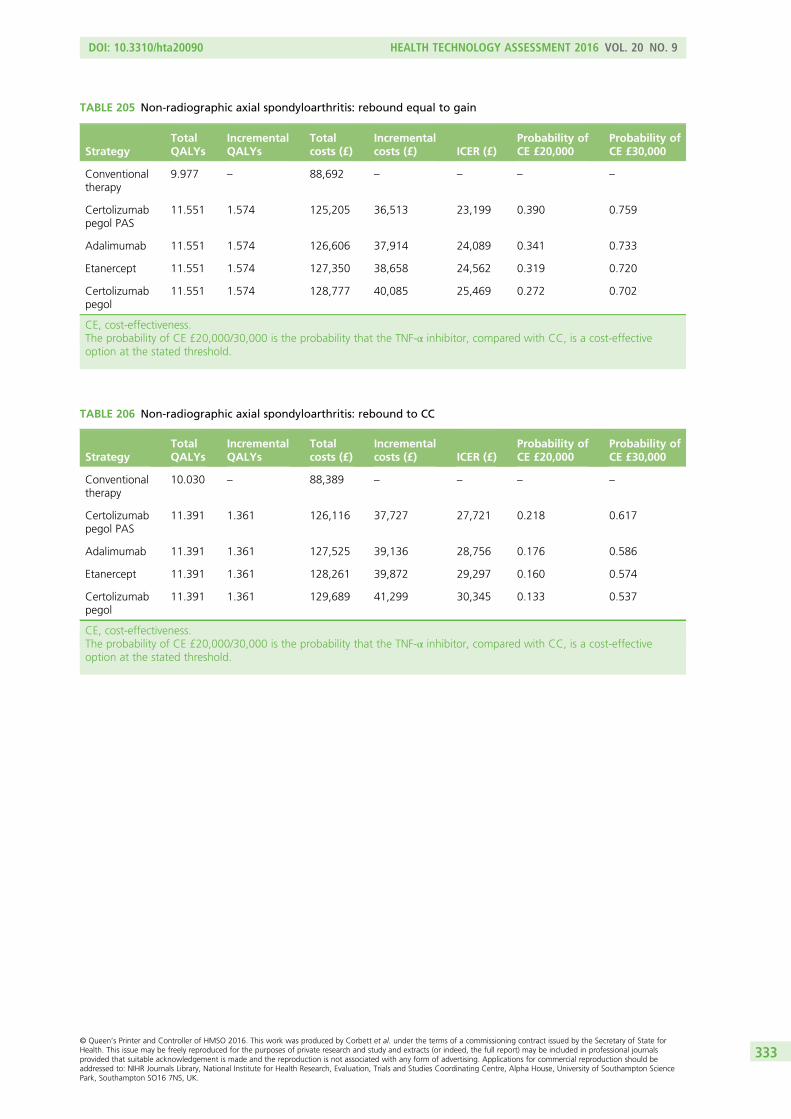
TABLE 205 Non-radiographic axial spondyloarthritis: rebound equal to gain
StrategyTotalQALYs
IncrementalQALYs
Totalcosts (£)
Incrementalcosts (£) ICER (£)
Probability ofCE £20,000
Probability ofCE £30,000
Conventionaltherapy
9.977 – 88,692 – – – –
Certolizumabpegol PAS
11.551 1.574 125,205 36,513 23,199 0.390 0.759
Adalimumab 11.551 1.574 126,606 37,914 24,089 0.341 0.733
Etanercept 11.551 1.574 127,350 38,658 24,562 0.319 0.720
Certolizumabpegol
11.551 1.574 128,777 40,085 25,469 0.272 0.702
CE, cost-effectiveness.The probability of CE £20,000/30,000 is the probability that the TNF-α inhibitor, compared with CC, is a cost-effectiveoption at the stated threshold.
TABLE 206 Non-radiographic axial spondyloarthritis: rebound to CC
StrategyTotalQALYs
IncrementalQALYs
Totalcosts (£)
Incrementalcosts (£) ICER (£)
Probability ofCE £20,000
Probability ofCE £30,000
Conventionaltherapy
10.030 – 88,389 – – – –
Certolizumabpegol PAS
11.391 1.361 126,116 37,727 27,721 0.218 0.617
Adalimumab 11.391 1.361 127,525 39,136 28,756 0.176 0.586
Etanercept 11.391 1.361 128,261 39,872 29,297 0.160 0.574
Certolizumabpegol
11.391 1.361 129,689 41,299 30,345 0.133 0.537
CE, cost-effectiveness.The probability of CE £20,000/30,000 is the probability that the TNF-α inhibitor, compared with CC, is a cost-effectiveoption at the stated threshold.
DOI: 10.3310/hta20090 HEALTH TECHNOLOGY ASSESSMENT 2016 VOL. 20 NO. 9
© Queen’s Printer and Controller of HMSO 2016. This work was produced by Corbett et al. under the terms of a commissioning contract issued by the Secretary of State forHealth. This issue may be freely reproduced for the purposes of private research and study and extracts (or indeed, the full report) may be included in professional journalsprovided that suitable acknowledgement is made and the reproduction is not associated with any form of advertising. Applications for commercial reproduction should beaddressed to: NIHR Journals Library, National Institute for Health Research, Evaluation, Trials and Studies Coordinating Centre, Alpha House, University of Southampton SciencePark, Southampton SO16 7NS, UK.
333


Part of the NIHR Journals Library www.journalslibrary.nihr.ac.uk
Published by the NIHR Journals Library
This report presents independent research funded by the National Institute for Health Research (NIHR). The views expressed are those of the author(s) and not necessarily those of the NHS, the NIHR or the Department of Health
EMEHS&DRHTAPGfARPHR


![SOLUCIONES TEMA 2 Ejercicio 1 - UC3Mmlazaro/Docencia/GISC_GIT-CD/MD... · 6 4 c[0] c[1] c[2] c[3] 3 7 7 5= 2 6 6 4 0 1 0 0 3 7 7 5; P = 2 6 6 4 1=2 0 1 1=2 1=2 1 0 1=2 3 7 7 5 Resolviendo](https://static.fdocument.org/doc/165x107/5f0e38827e708231d43e3113/soluciones-tema-2-ejercicio-1-mlazarodocenciagiscgit-cdmd-6-4-c0-c1.jpg)