
Graphene under uniaxial and hydrostatic deformation
33
Τεχνικό σεμινάριο, 14 Νοεμβρίου 2012 Η δονητική φασματοσκοπία και οι μηχανικές μετρήσεις στη νανοτεχνολογία Δρ Ι. Παρθένιος Κύριος Ε. Λ. Ε., ITE/IEXMH CNT
Transcript of Graphene under uniaxial and hydrostatic deformation
Τεχνικό σεμινάριο, 14 Νοεμβρίου 2012
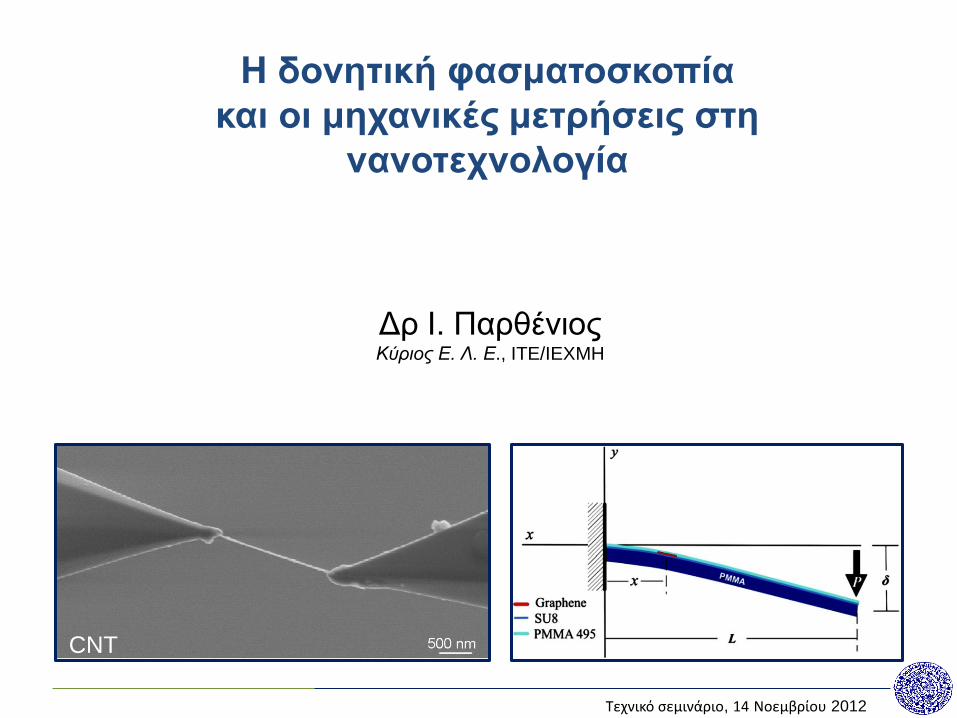
Η δονητική φασματοσκοπία
και οι μηχανικές μετρήσεις στη
νανοτεχνολογία
Δρ Ι. Παρθένιος Κύριος Ε. Λ. Ε., ITE/IEXMH
CNT
Τεχνικό σεμινάριο, 14 Νοεμβρίου 2012
(a) (b) (c) (d)
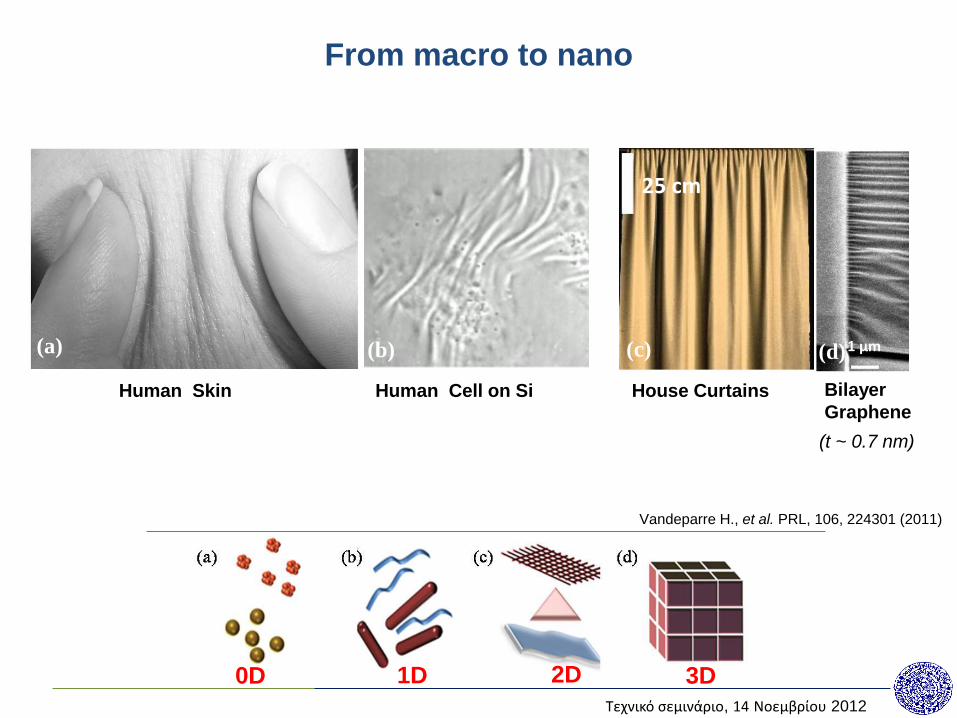
From macro to nano
1μm 25 cm
0D 1D 2D 3D
Vandeparre H., et al. PRL, 106, 224301 (2011)
25 cm
1 μm
Human Skin House Curtains Bilayer
Graphene Human Cell on Si
(t ~ 0.7 nm)
Τεχνικό σεμινάριο, 14 Νοεμβρίου 2012
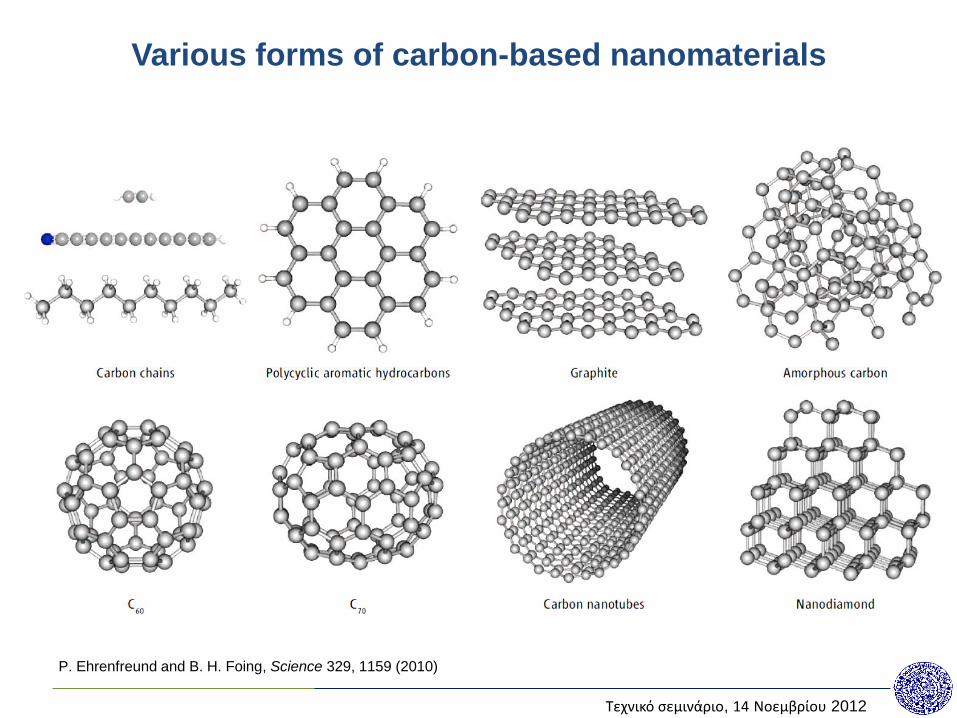
Various forms of carbon-based nanomaterials
P. Ehrenfreund and B. H. Foing, Science 329, 1159 (2010)
Τεχνικό σεμινάριο, 14 Νοεμβρίου 2012
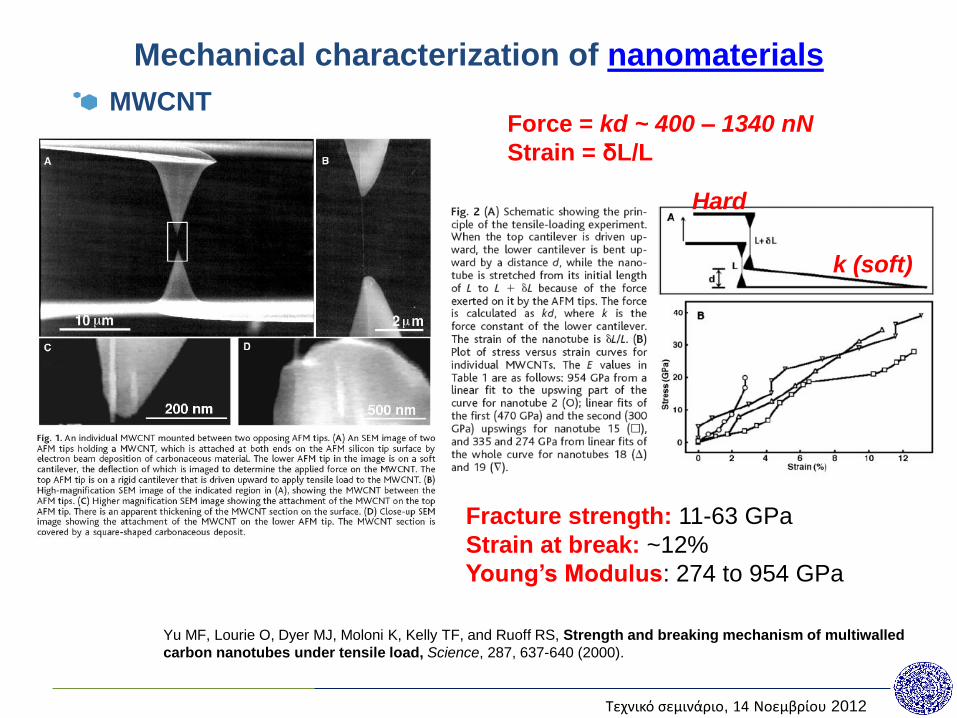
Mechanical characterization of nanomaterials
Yu MF, Lourie O, Dyer MJ, Moloni K, Kelly TF, and Ruoff RS, Strength and breaking mechanism of multiwalled
carbon nanotubes under tensile load, Science, 287, 637-640 (2000).
Fracture strength: 11-63 GPa
Strain at break: ~12%
Young’s Modulus: 274 to 954 GPa
Force = kd ~ 400 – 1340 nN
Strain = δL/L
k (soft)
Hard
MWCNT
Τεχνικό σεμινάριο, 14 Νοεμβρίου 2012
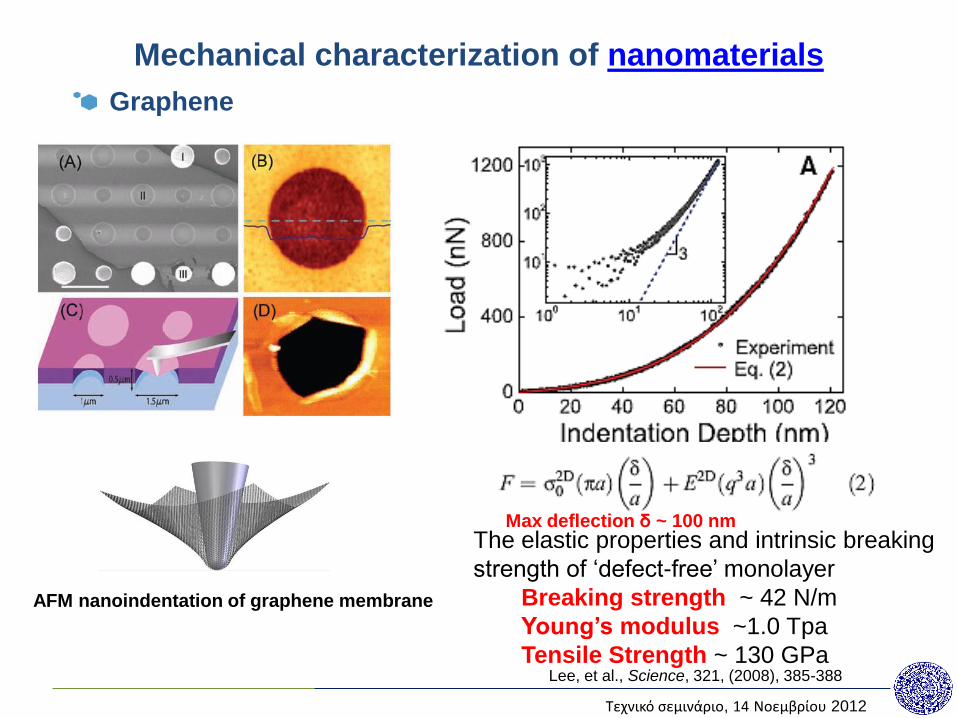
Mechanical characterization of nanomaterials
Graphene
Lee, et al., Science, 321, (2008), 385-388
AFM nanoindentation of graphene membrane
The elastic properties and intrinsic breaking
strength of ‘defect-free’ monolayer
Breaking strength ~ 42 N/m
Young’s modulus ~1.0 Tpa
Tensile Strength ~ 130 GPa
Max deflection δ ~ 100 nm
Τεχνικό σεμινάριο, 14 Νοεμβρίου 2012
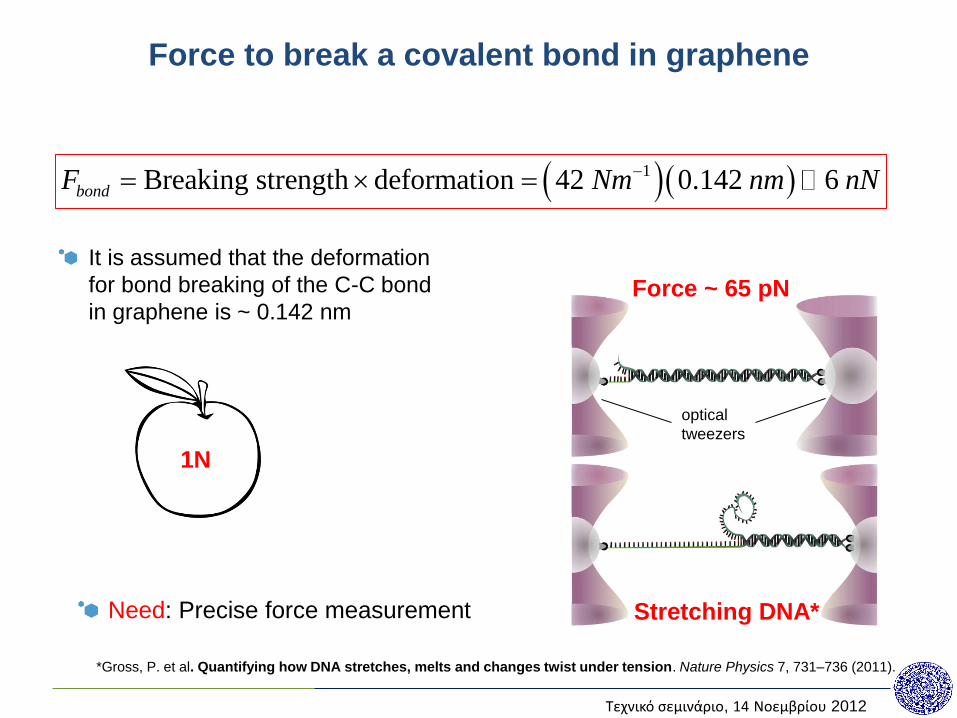
Force to break a covalent bond in graphene
It is assumed that the deformation
for bond breaking of the C-C bond
in graphene is ~ 0.142 nm
1Breaking strength deformation 42 0.142 6bondF Nm nm nN
1N
Stretching DNA*
Force ~ 65 pN
Need: Precise force measurement
*Gross, P. et al. Quantifying how DNA stretches, melts and changes twist under tension. Nature Physics 7, 731–736 (2011).
optical
tweezers
Τεχνικό σεμινάριο, 14 Νοεμβρίου 2012
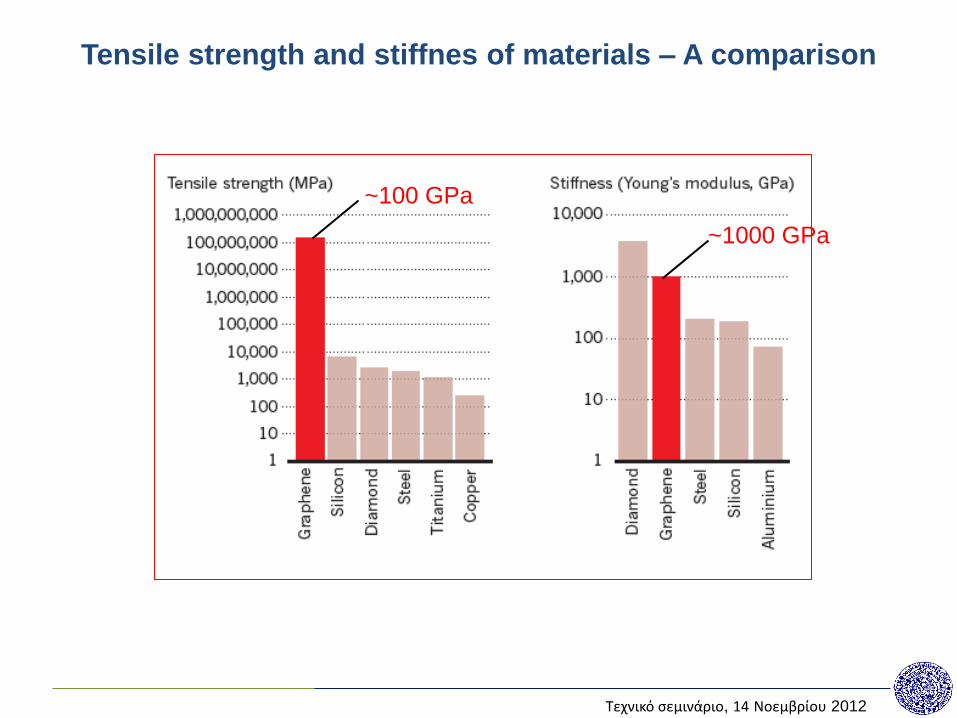
Tensile strength and stiffnes of materials – A comparison
~100 GPa
~1000 GPa
Τεχνικό σεμινάριο, 14 Νοεμβρίου 2012
Raman spectroscopy in Nanomechanics
Τεχνικό σεμινάριο, 14 Νοεμβρίου 2012
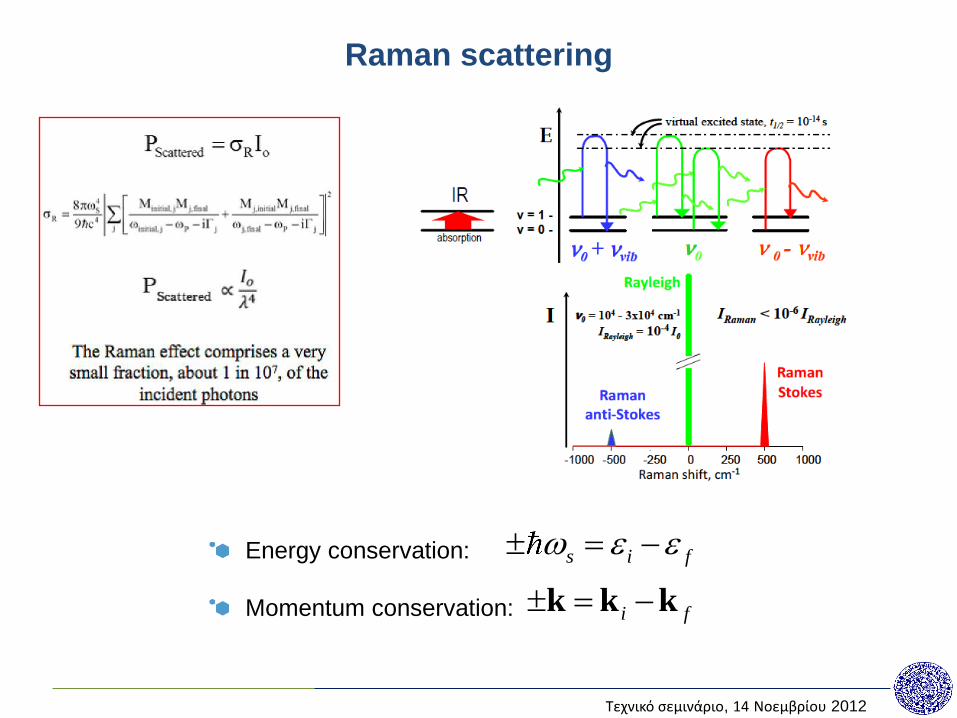
Energy conservation:
Momentum conservation: i f k k k
s i f
Raman scattering
Τεχνικό σεμινάριο, 14 Νοεμβρίου 2012
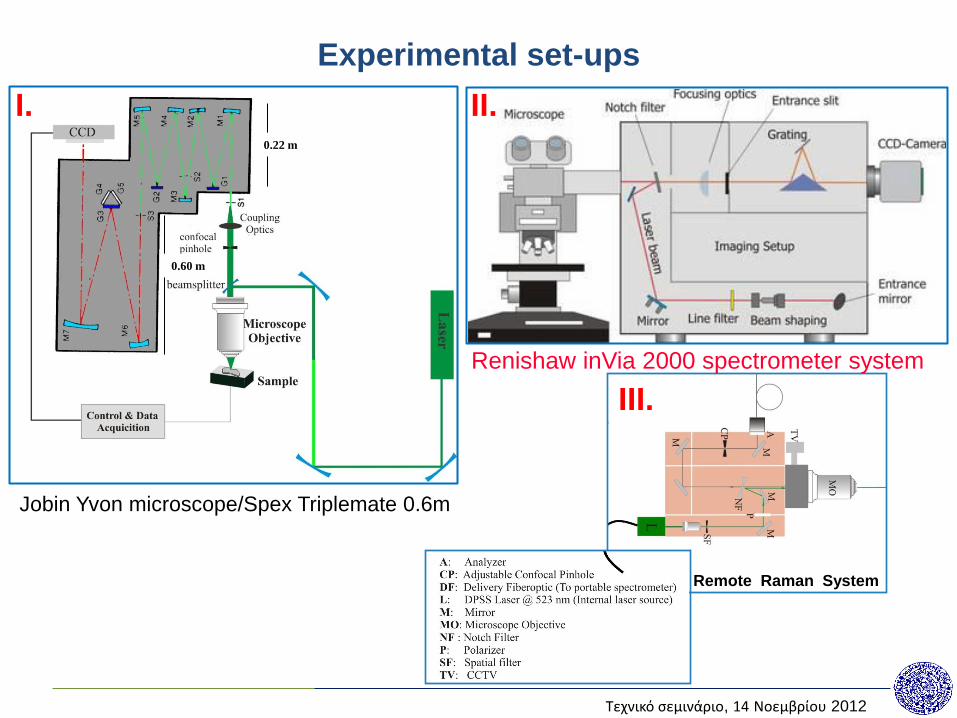
Remote Raman System
Experimental set-ups
Jobin Yvon microscope/Spex Triplemate 0.6m
0.22 m
0.60 m
Renishaw inVia 2000 spectrometer system
I. II.
III.
Τεχνικό σεμινάριο, 14 Νοεμβρίου 2012
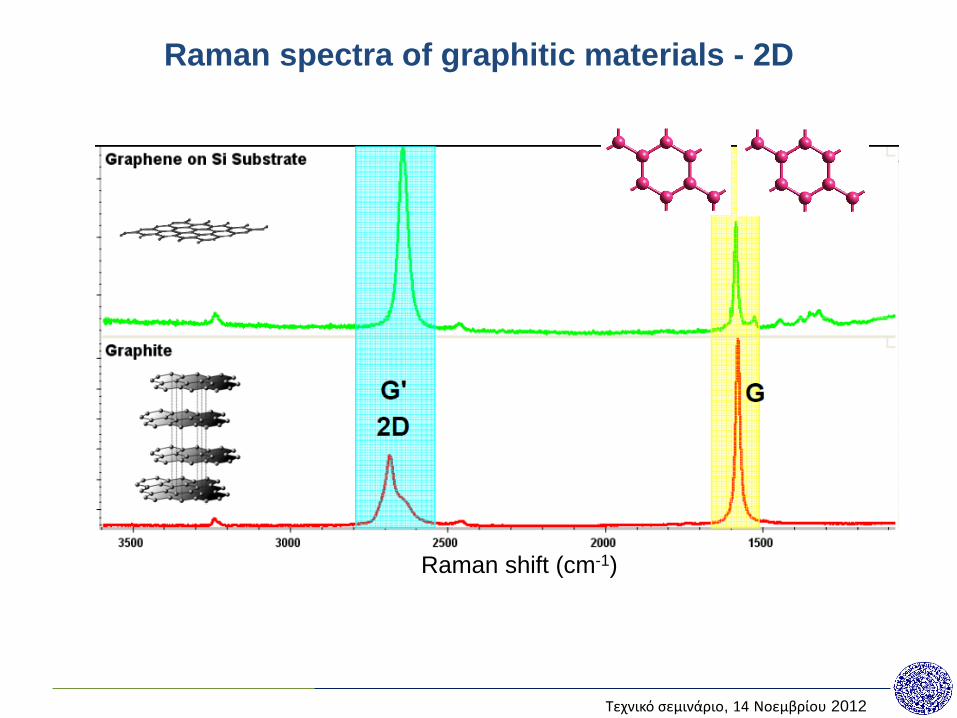
Raman spectra of graphitic materials - 2D
Raman shift (cm-1)
Τεχνικό σεμινάριο, 14 Νοεμβρίου 2012
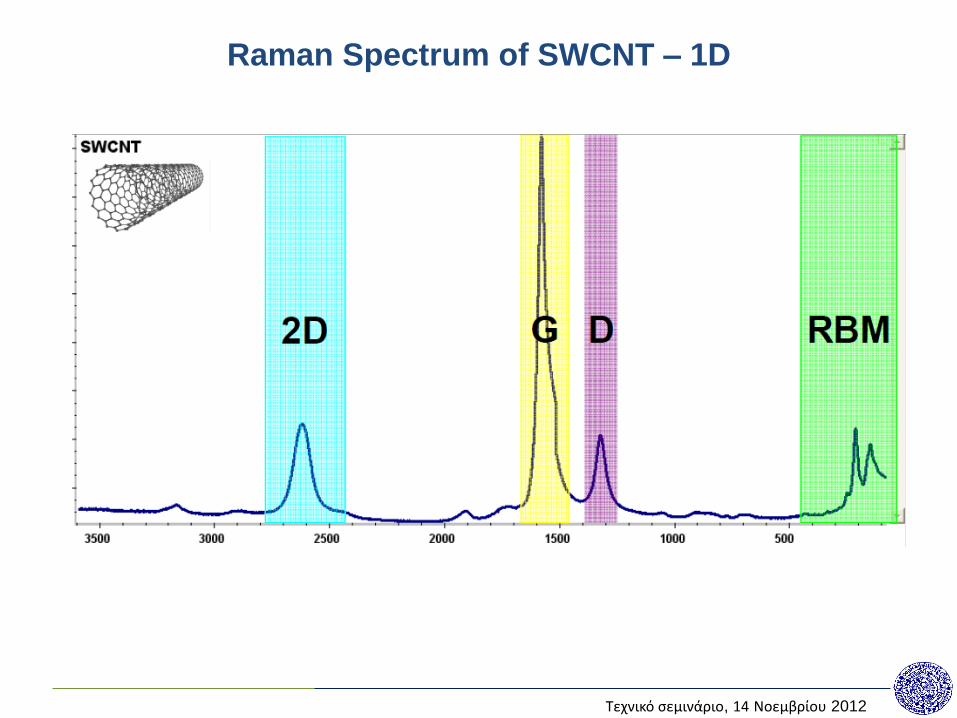
Raman Spectrum of SWCNT – 1D
Τεχνικό σεμινάριο, 14 Νοεμβρίου 2012
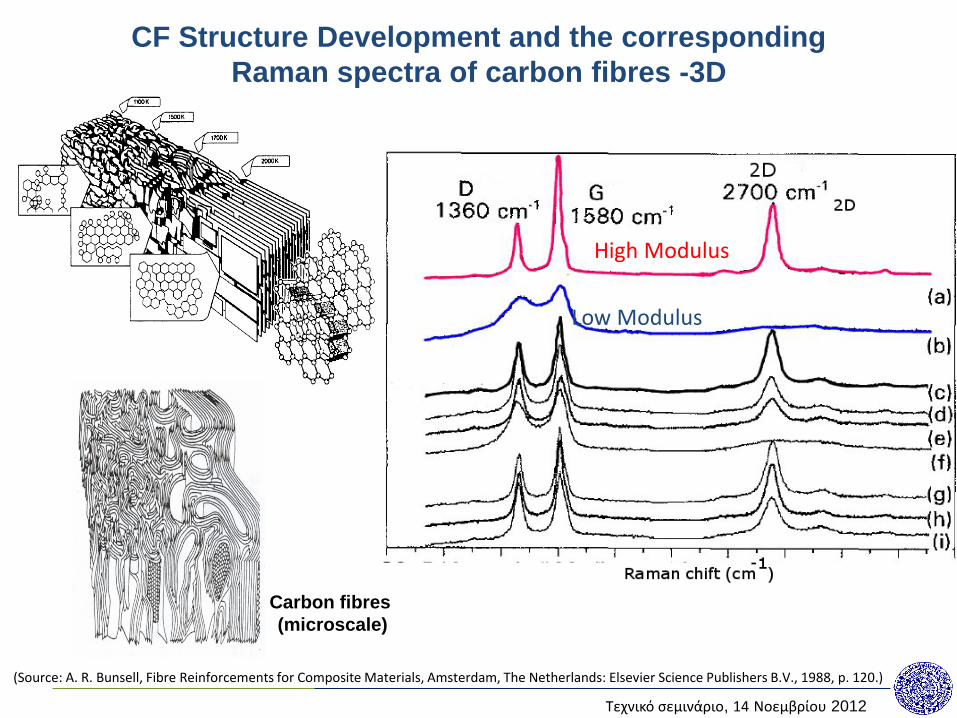
CF Structure Development and the corresponding
Raman spectra of carbon fibres -3D
High Modulus
Low Modulus
(Source: A. R. Bunsell, Fibre Reinforcements for Composite Materials, Amsterdam, The Netherlands: Elsevier Science Publishers B.V., 1988, p. 120.)
Carbon fibres
(microscale)

Τεχνικό σεμινάριο, 14 Νοεμβρίου 2012
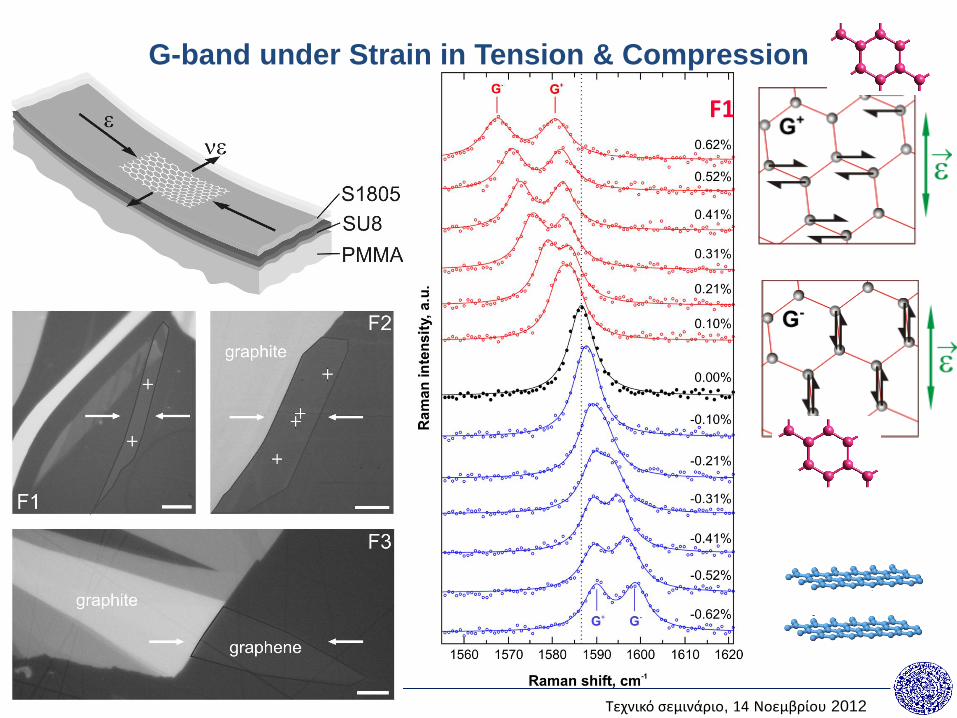
G-band of graphene under Strain in Tension & Compression
Τεχνικό σεμινάριο, 14 Νοεμβρίου 2012
Axial Experiments in Graphene
(tension & compression combined with Raman
measurements)
Τεχνικό σεμινάριο, 14 Νοεμβρίου 2012
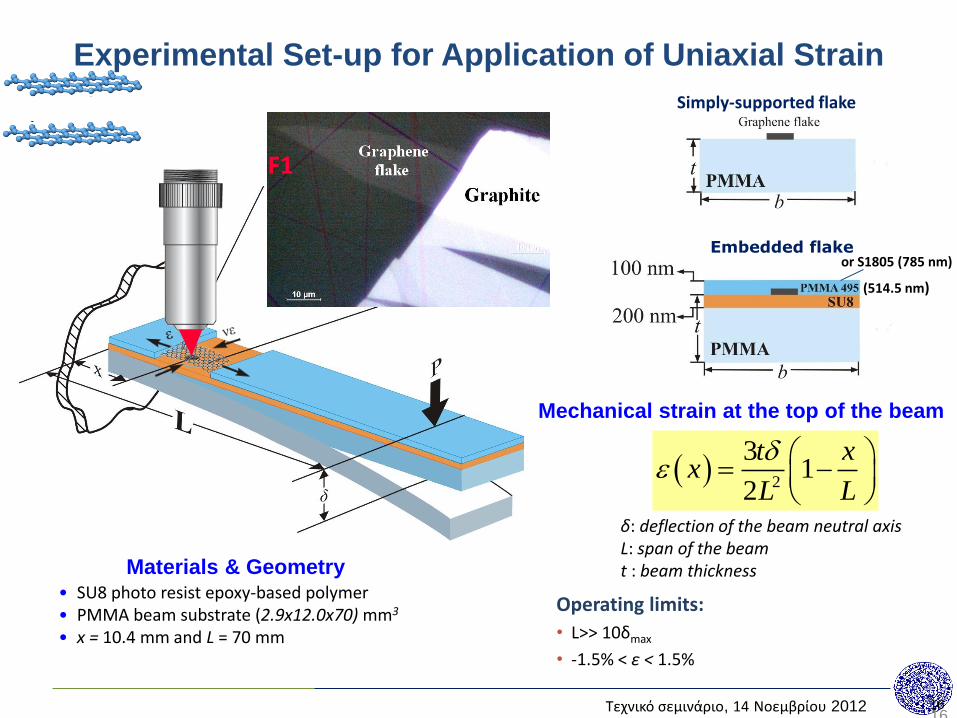
Experimental Set-up for Application of Uniaxial Strain
16 16
2
31
2
t xx
L L
δ: deflection of the beam neutral axis L: span of the beam t : beam thickness
• SU8 photo resist epoxy-based polymer • PMMA beam substrate (2.9x12.0x70) mm3 • x = 10.4 mm and L = 70 mm
Materials & Geometry
Mechanical strain at the top of the beam
Simply-supported flake
Embedded flake
F1
or S1805 (785 nm)
(514.5 nm)
Operating limits:
• L>> 10δmax
• -1.5% < ε < 1.5%
Τεχνικό σεμινάριο, 14 Νοεμβρίου 2012
F1
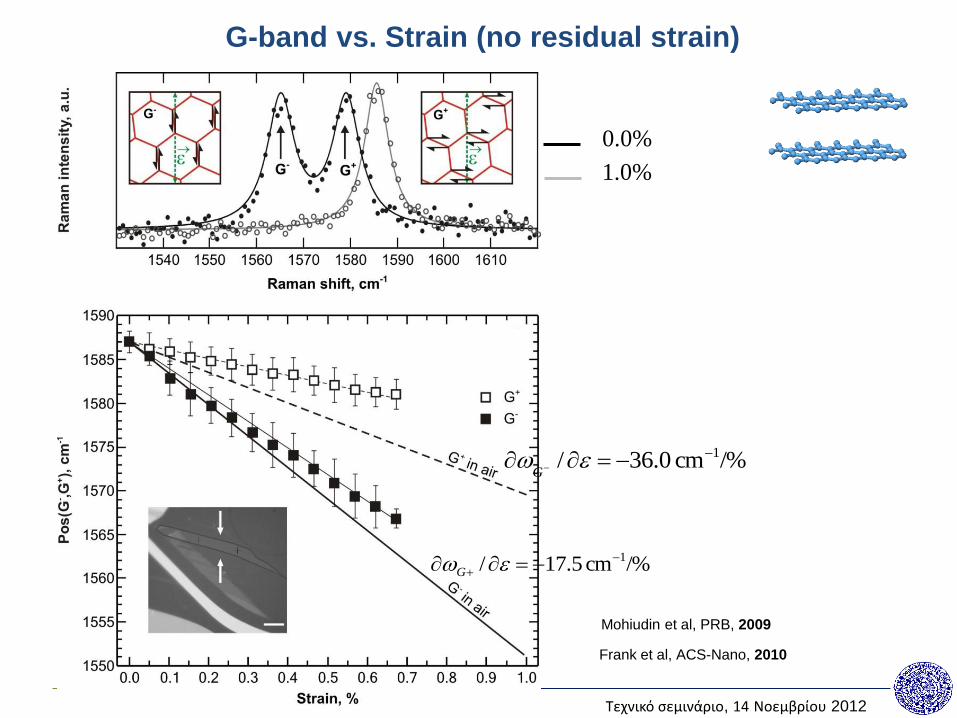
G-band under Strain in Tension & Compression
Τεχνικό σεμινάριο, 14 Νοεμβρίου 2012
0.0%
1.0%
Mohiudin et al, PRB, 2009
Frank et al, ACS-Nano, 2010
/%cm 0.36/ 1 G
/%cm 5.17/ 1
G
G-band vs. Strain (no residual strain)
Τεχνικό σεμινάριο, 14 Νοεμβρίου 2012
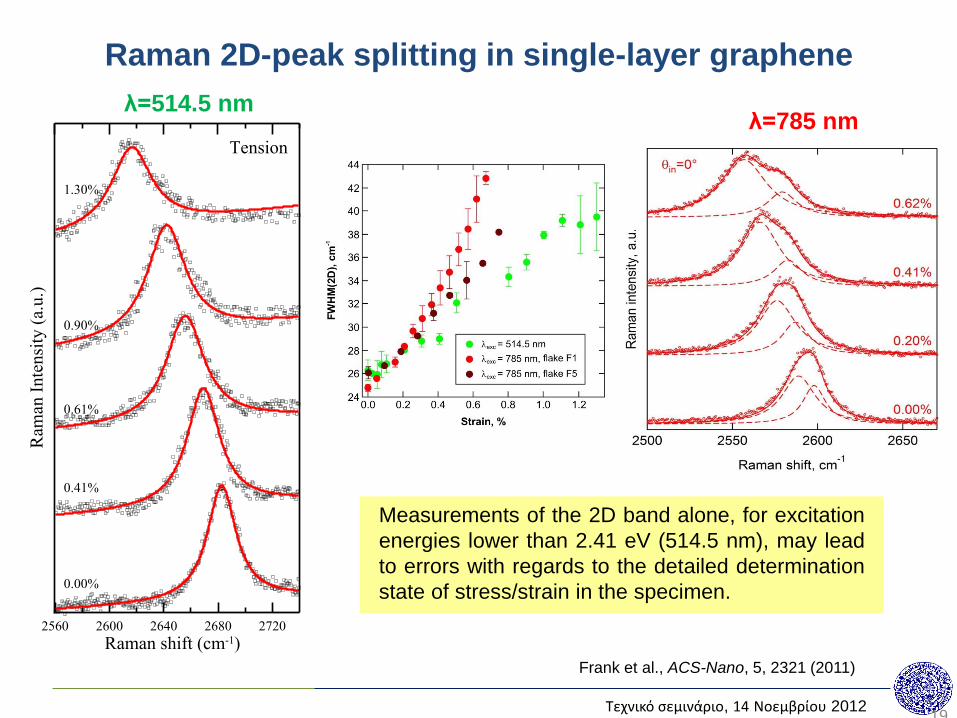
Raman 2D-peak splitting in single-layer graphene
19
Ram
an I
nte
nsi
ty (
a.u.)
2560 2600 2640 2680 2720
Raman shift (cm-1)
0.00%
0.41%
0.61%
0.90%
1.30%
Tension
λ=785 nm λ=514.5 nm
Measurements of the 2D band alone, for excitation
energies lower than 2.41 eV (514.5 nm), may lead
to errors with regards to the detailed determination
state of stress/strain in the specimen.
Frank et al., ACS-Nano, 5, 2321 (2011)
Τεχνικό σεμινάριο, 14 Νοεμβρίου 2012
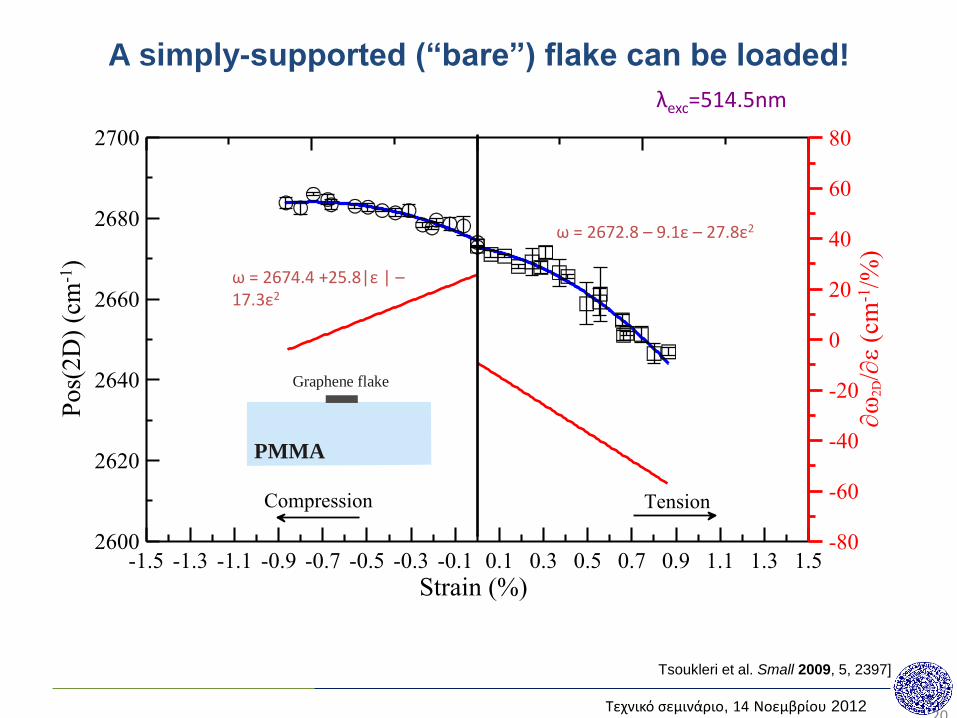
A simply-supported (“bare”) flake can be loaded!
20
2600
2620
2640
2660
2680
2700
Po
s(2
D)
(cm
-1)
-1.5 -1.3 -1.1 -0.9 -0.7 -0.5 -0.3 -0.1 0.1 0.3 0.5 0.7 0.9 1.1 1.3 1.5
Strain (%)
-80
-60
-40
-20
0
20
40
60
80
ω
2D/ε
(cm
-1/%
)
Compression Tension
ω = 2674.4 +25.8|ε | –17.3ε2
ω = 2672.8 – 9.1ε – 27.8ε2
PMMA
Graphene flake
λexc=514.5nm
Tsoukleri et al. Small 2009, 5, 2397]
Τεχνικό σεμινάριο, 14 Νοεμβρίου 2012
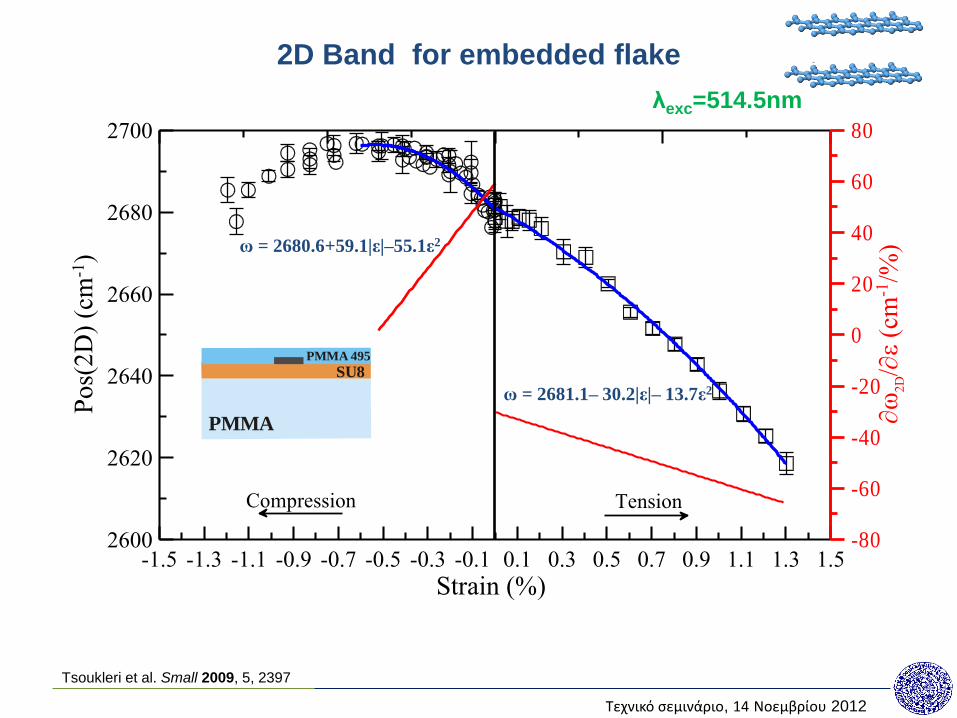
2D Band for embedded flake
2600
2620
2640
2660
2680
2700
Pos(
2D
) (c
m-1
)
-1.5 -1.3 -1.1 -0.9 -0.7 -0.5 -0.3 -0.1 0.1 0.3 0.5 0.7 0.9 1.1 1.3 1.5
Strain (%)
-80
-60
-40
-20
0
20
40
60
80
ω
2D/ε
(cm
-1/%
)
Compression Tension
λexc=514.5nm
ω = 2681.1– 30.2|ε|– 13.7ε2
ω = 2680.6+59.1|ε|–55.1ε2
PMMA 495
SU8
PMMA
Tsoukleri et al. Small 2009, 5, 2397
Τεχνικό σεμινάριο, 14 Νοεμβρίου 2012
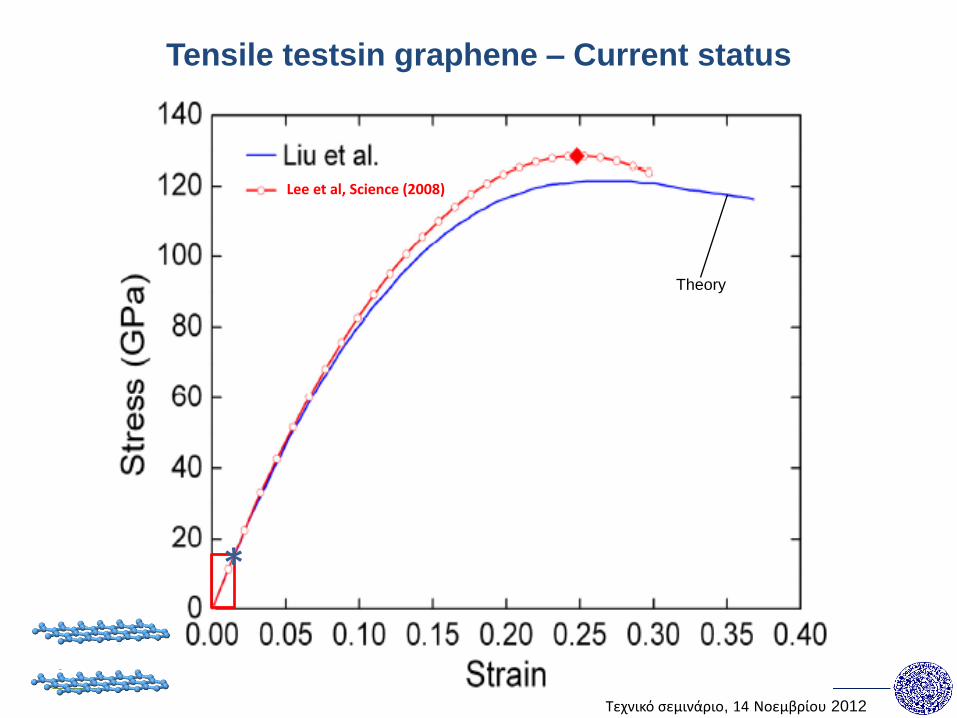
Lee et al, Science (2008)
Theory
Tensile testsin graphene – Current status
*
Τεχνικό σεμινάριο, 14 Νοεμβρίου 2012
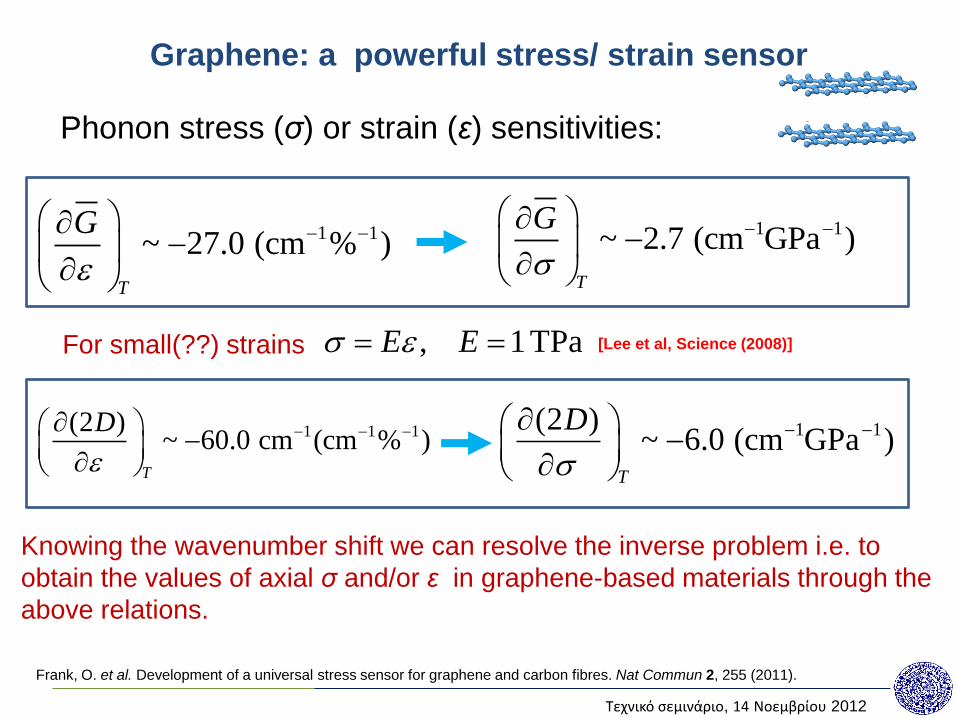
Graphene: a powerful stress/ strain sensor
1 1~ 27.0 (cm % )
T
G
Frank, O. et al. Development of a universal stress sensor for graphene and carbon fibres. Nat Commun 2, 255 (2011).
1 1(2 )~ 6.0 (cm GPa )
T
D
Knowing the wavenumber shift we can resolve the inverse problem i.e. to
obtain the values of axial σ and/or ε in graphene-based materials through the
above relations.
Phonon stress (σ) or strain (ε) sensitivities:
, 1TPaE E
1 1 1(2 )~ 60.0 cm (cm % )
T
D
1 1~ 2.7 (cm GPa )
T
G
[Lee et al, Science (2008)] For small(??) strains
Τεχνικό σεμινάριο, 14 Νοεμβρίου 2012
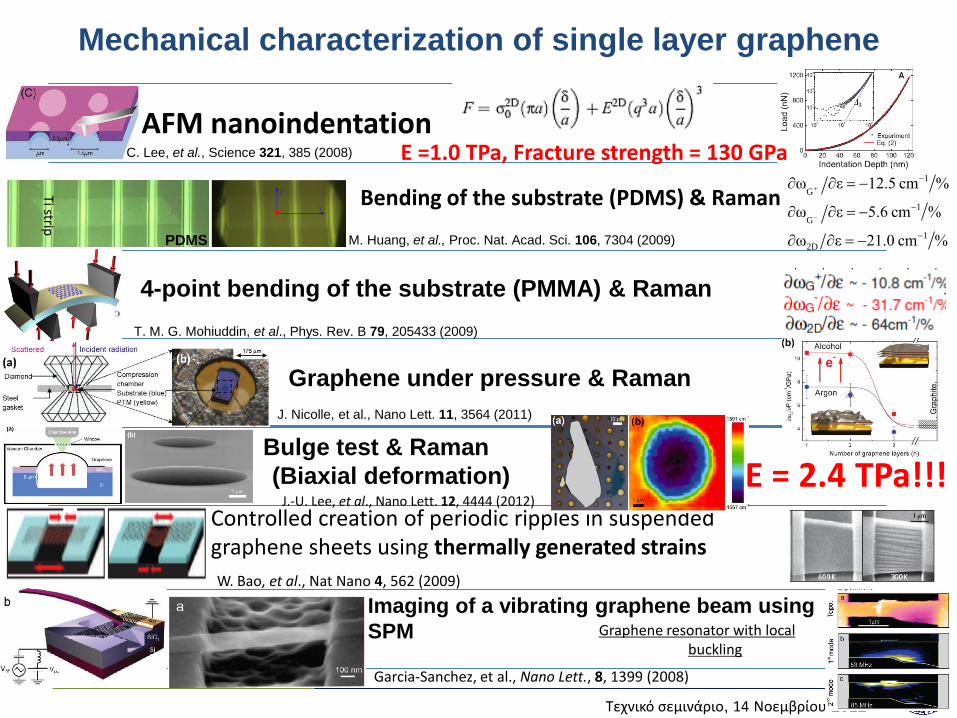
Mechanical characterization of single layer graphene
AFM nanoindentation C. Lee, et al., Science 321, 385 (2008)
PDMS
Bending of the substrate (PDMS) & Raman Ti strip
M. Huang, et al., Proc. Nat. Acad. Sci. 106, 7304 (2009)
4-point bending of the substrate (PMMA) & Raman
T. M. G. Mohiuddin, et al., Phys. Rev. B 79, 205433 (2009)
1
G
1
G
1
2D
ω ε 12.5 cm %
ω ε 5.6 cm %
ω ε 21.0 cm %
Bulge test & Raman
(Biaxial deformation)
Controlled creation of periodic ripples in suspended graphene sheets using thermally generated strains
W. Bao, et al., Nat Nano 4, 562 (2009)
Imaging of a vibrating graphene beam using
SPM Graphene resonator with local buckling
Garcia-Sanchez, et al., Nano Lett., 8, 1399 (2008)
E = 2.4 TPa!!!
E =1.0 TPa, Fracture strength = 130 GPa
J.-U. Lee, et al., Nano Lett. 12, 4444 (2012)
Graphene under pressure & Raman
J. Nicolle, et al., Nano Lett. 11, 3564 (2011)
Τεχνικό σεμινάριο, 14 Νοεμβρίου 2012
Axial Experiments in CNT yarns
(tension combined with Raman measurements)
Τεχνικό σεμινάριο, 14 Νοεμβρίου 2012
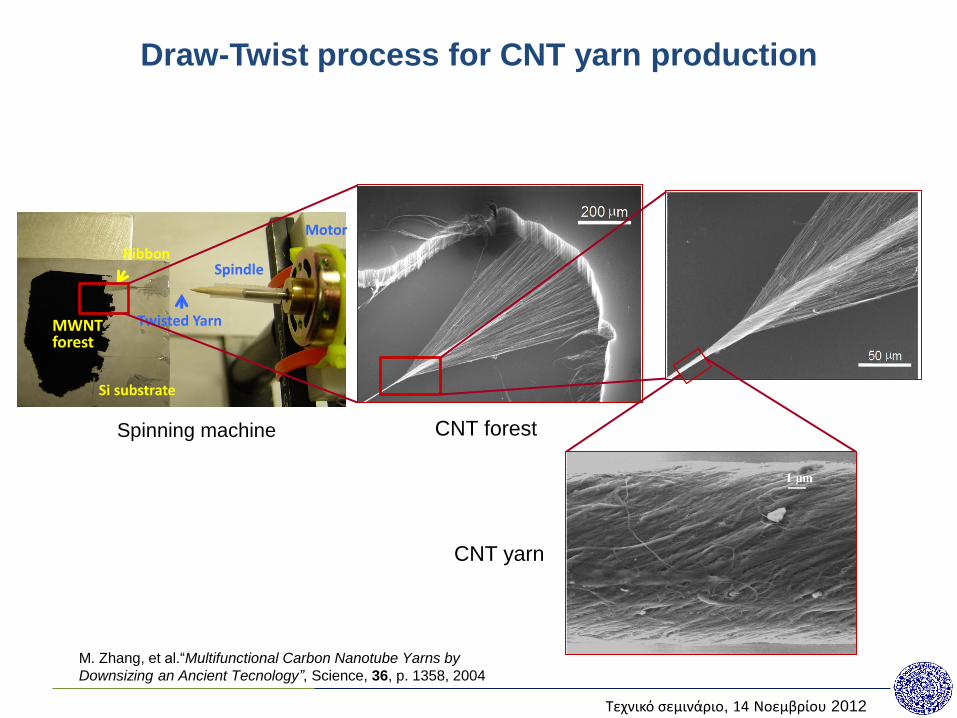
Draw-Twist process for CNT yarn production
Spinning machine
MWNT forest
Si substrate
Spindle
Motor
Ribbon
Twisted Yarn
CNT forest
CNT yarn
M. Zhang, et al.“Multifunctional Carbon Nanotube Yarns by
Downsizing an Ancient Tecnology”, Science, 36, p. 1358, 2004

Τεχνικό σεμινάριο, 14 Νοεμβρίου 2012
Yarn model geometry (Ideal helical structure)
Yarn segment concentric packing of l layers
layer helix angles (h is the height along the yarn axis
of one turn of twist)
R
(R is the radius of the outer layer of the yarn and rk is the radius of layer k )
rk
2arctan
s
Ra
h
Outer layer helix angle
Inner layer k helix angle tan
arctan k s
s
r aa
R
Τεχνικό σεμινάριο, 14 Νοεμβρίου 2012
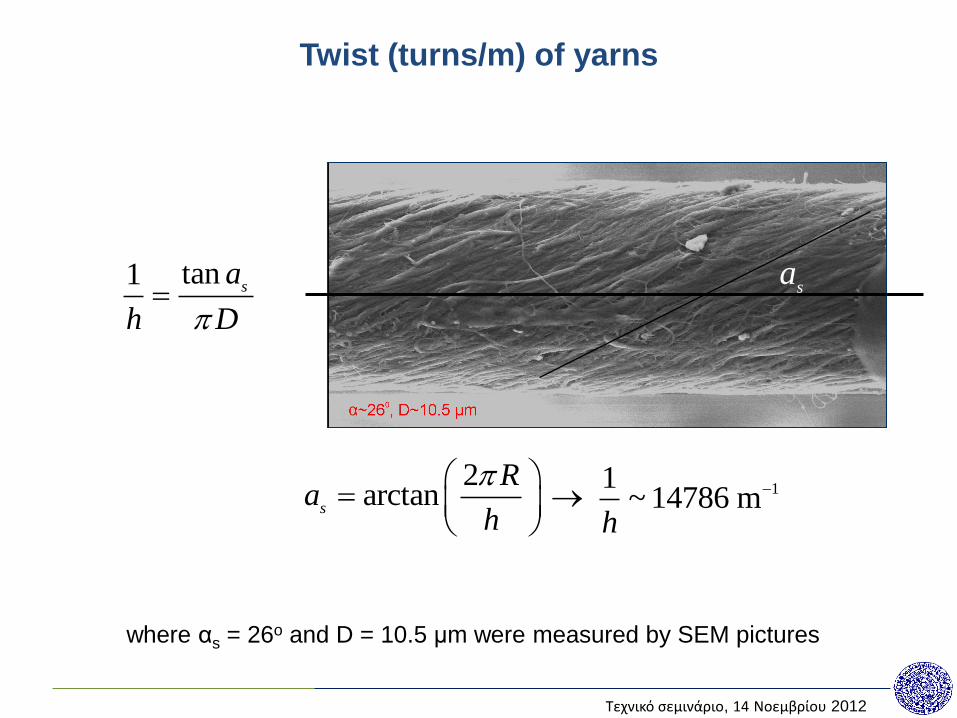
Twist (turns/m) of yarns
2arctan
s
Ra
h
tan1s
a
h D
11~ 14786 m
h
where αs = 26o and D = 10.5 μm were measured by SEM pictures
sa
Τεχνικό σεμινάριο, 14 Νοεμβρίου 2012
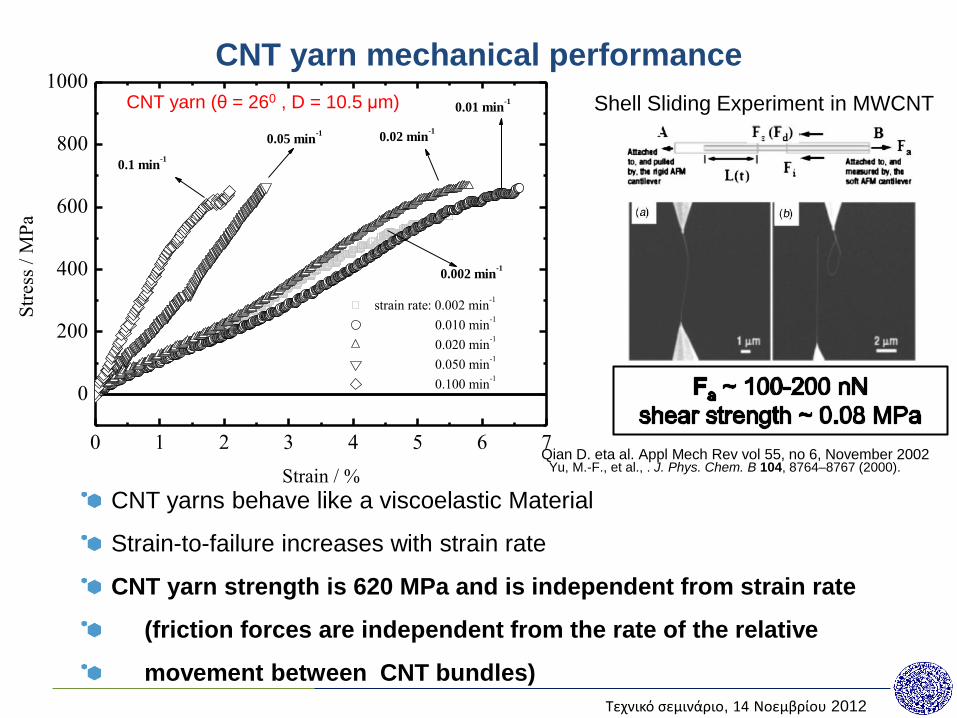
CNT yarn mechanical performance
0 1 2 3 4 5 6 7
0
200
400
600
800
1000
0.002 min-1
0.01 min-1
0.02 min-1
0.05 min-1
0.1 min-1
strain rate: 0.002 min-1
0.010 min-1
0.020 min-1
0.050 min-1
0.100 min-1
Str
ess
/ M
Pa
Strain / %
CNT yarn (θ = 260 , D = 10.5 μm)
CNT yarns behave like a viscoelastic Material
Strain-to-failure increases with strain rate
CNT yarn strength is 620 MPa and is independent from strain rate
(friction forces are independent from the rate of the relative
movement between CNT bundles)
Shell Sliding Experiment in MWCNT
Qian D. eta al. Appl Mech Rev vol 55, no 6, November 2002 Yu, M.-F., et al., . J. Phys. Chem. B 104, 8764–8767 (2000).
Τεχνικό σεμινάριο, 14 Νοεμβρίου 2012
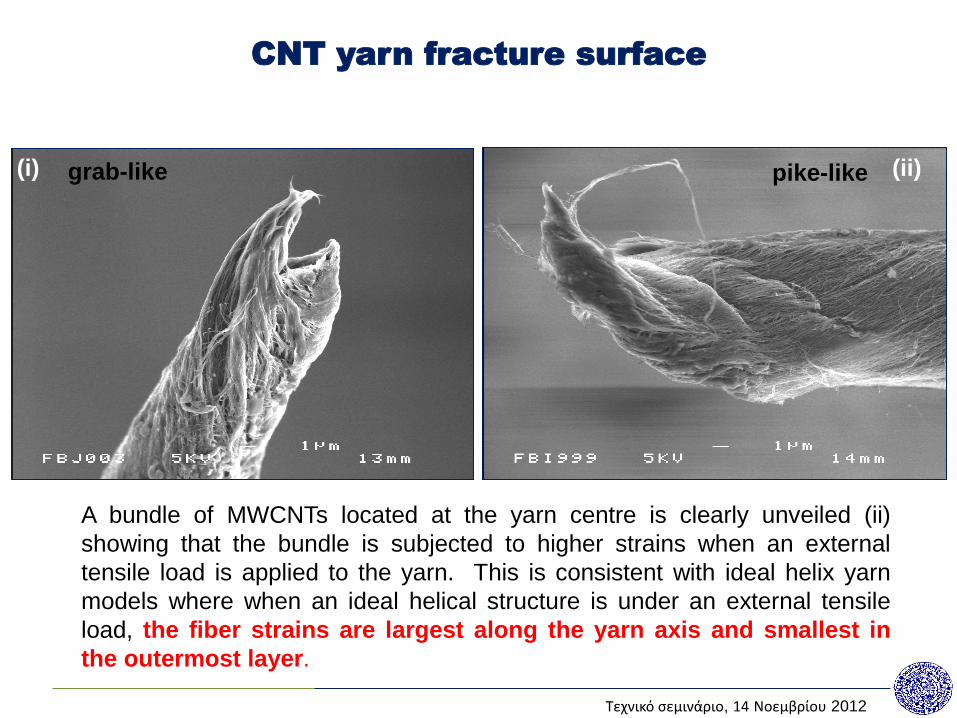
CNT yarn fracture surface
(i) (ii)
A bundle of MWCNTs located at the yarn centre is clearly unveiled (ii)
showing that the bundle is subjected to higher strains when an external
tensile load is applied to the yarn. This is consistent with ideal helix yarn
models where when an ideal helical structure is under an external tensile
load, the fiber strains are largest along the yarn axis and smallest in
the outermost layer.
grab-like pike-like
Τεχνικό σεμινάριο, 14 Νοεμβρίου 2012
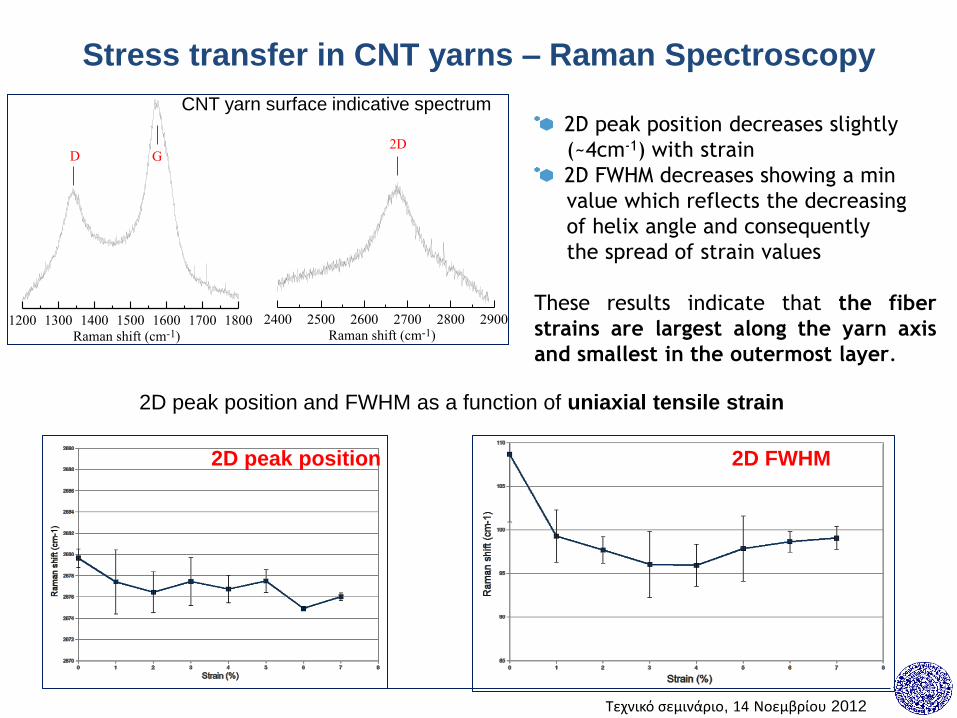
Stress transfer in CNT yarns – Raman Spectroscopy
1200 1300 1400 1500 1600 1700 1800
Raman shift (cm-1)
2400 2500 2600 2700 2800 2900
Raman shift (cm-1)
D G2D
CNT yarn surface indicative spectrum
2D FWHM 2D peak position
2D peak position and FWHM as a function of uniaxial tensile strain
2D peak position decreases slightly
(~4cm-1) with strain
2D FWHM decreases showing a min
value which reflects the decreasing
of helix angle and consequently
the spread of strain values
These results indicate that the fiber
strains are largest along the yarn axis
and smallest in the outermost layer.

Τεχνικό σεμινάριο, 14 Νοεμβρίου 2012
Breaking the diffraction limit with TERS
(Tip Enhanced Raman Spectrocopy)
AFM + Raman microscopy
Graphene
G 2D
P. Dorozhkin et al, Microscopy Today, doi:10.1017/S1551929510000982 (2010)
The AFM nano-antenna can locally enhance the electromagnetic field
intensity near the tip apex and become a localized “nano-source of light.”
Stadler, J., et al., Nano Lett. 10, 4514–4520 (2010).
Τεχνικό σεμινάριο, 14 Νοεμβρίου 2012
Thank you very much for your kind attention !


![HYDROSTATICS N.ppt [Read-Only] - cvut.czhydraulika.fsv.cvut.cz/.../2006/02_Hydrostatics.pdf(one-dimensional form) CHANGE OF PRESSURE. K141 HYAE Hydrostatics 5 Euler hydrostatic equation](https://static.fdocument.org/doc/165x107/5eb4be95c34ce109321662d2/hydrostatics-nppt-read-only-cvut-one-dimensional-form-change-of-pressure.jpg)