Gene Regulatory Network - Test Page for Apache...
18
Gene Regulatory Network Identification Korkut Uygun and Yinlun Huang Department of Chemical Engineering and Materials Science Wayne State University AIChE Annual National Meeting San Francisco November 16-21, 2003
Transcript of Gene Regulatory Network - Test Page for Apache...
Gene Regulatory Network Identification
Korkut Uygun and Yinlun HuangDepartment of Chemical Engineering and
Materials ScienceWayne State University
AIChE Annual National MeetingSan Francisco
November 16-21, 2003
IntroductionThe regulatory network is major unknown in modeling [Gombert and Nielsen, 2000]
Temporal gene expression data is available Can the gene regulatory network be identified from mRNA data?
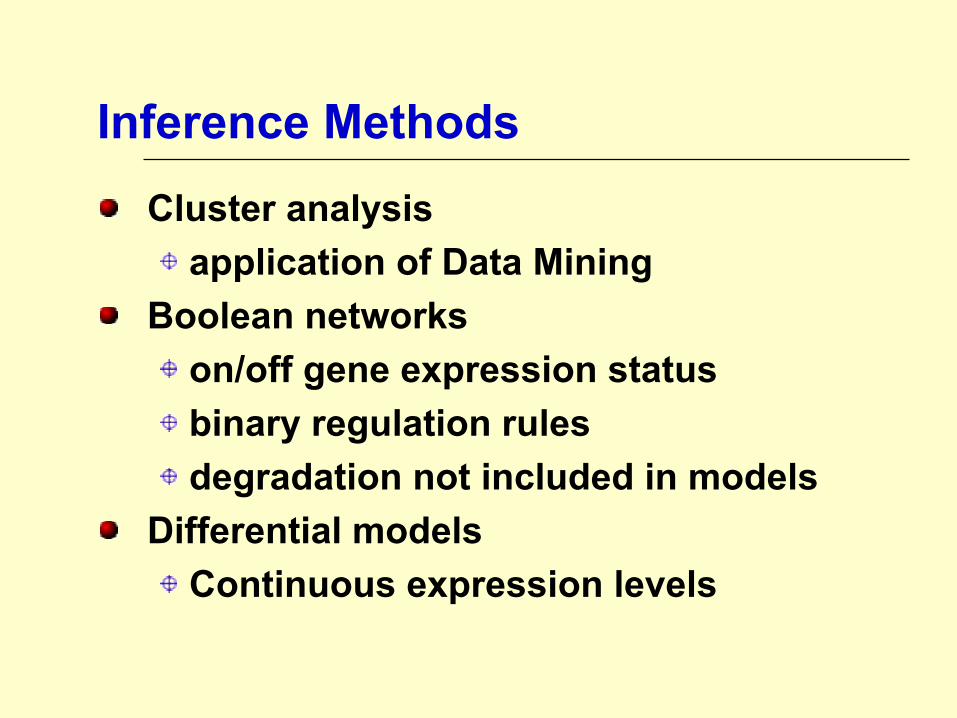
Inference MethodsCluster analysis
application of Data MiningBoolean networks
on/off gene expression statusbinary regulation rulesdegradation not included in models
Differential modelsContinuous expression levels
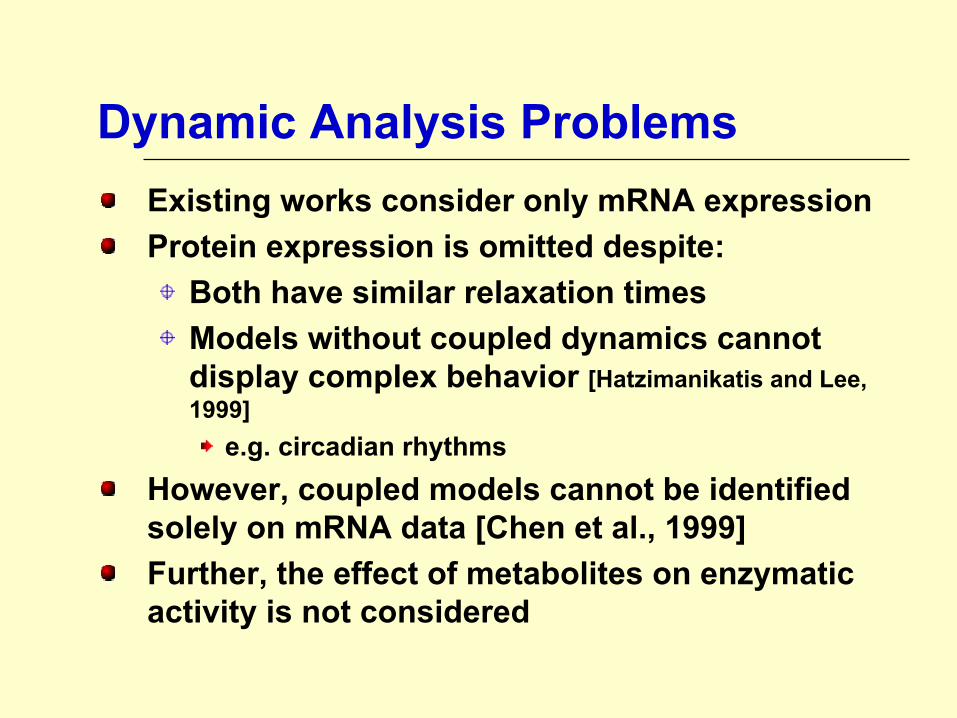
Dynamic Analysis ProblemsExisting works consider only mRNA expressionProtein expression is omitted despite:
Both have similar relaxation timesModels without coupled dynamics cannot display complex behavior [Hatzimanikatis and Lee, 1999]
e.g. circadian rhythmsHowever, coupled models cannot be identified solely on mRNA data [Chen et al., 1999]Further, the effect of metabolites on enzymatic activity is not considered
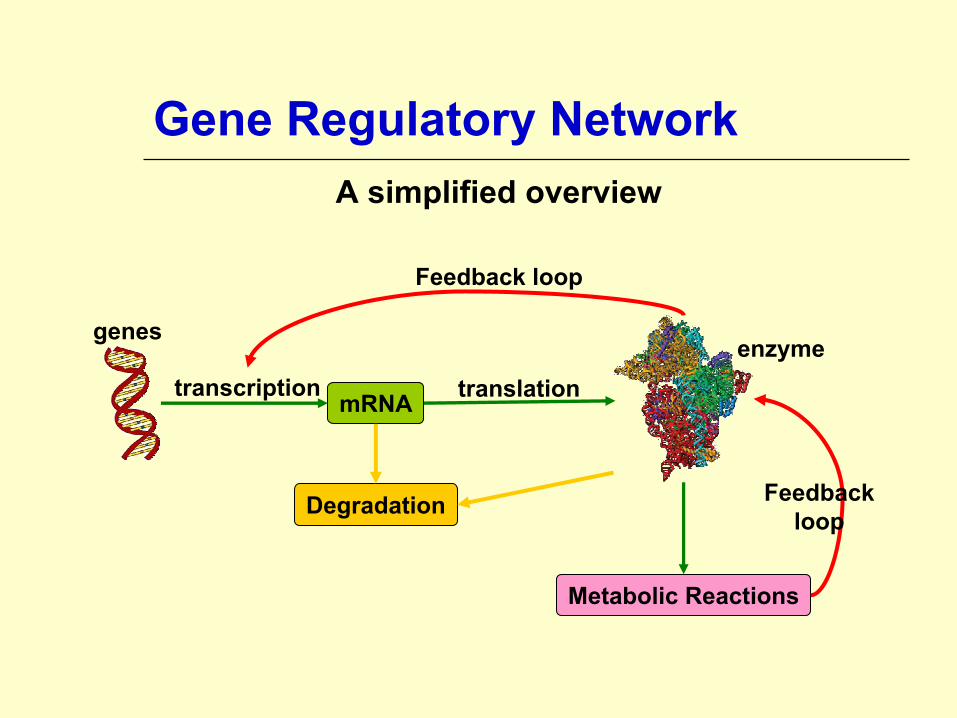
Gene Regulatory Network A simplified overview
mRNA
Metabolic Reactions
Degradation
transcription translation
Feedback loop
Feedback loop
genesenzyme
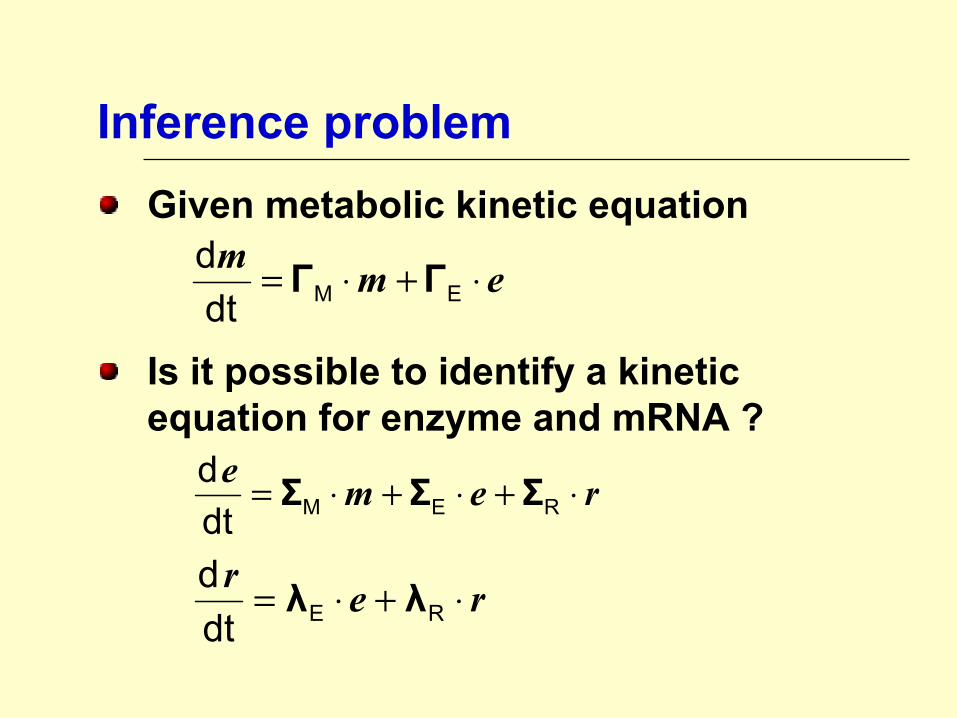
Inference problemGiven metabolic kinetic equation
Is it possible to identify a kinetic equation for enzyme and mRNA ?
emm ⋅+⋅= EMdtd ΓΓ
reme ⋅+⋅+⋅= REMdtd ΣΣΣ
rer ⋅+⋅= REdtd λλ
Dynamic Cybernetic Modeling
Postulates that the metabolism is evolved to optimize a cellular objectiveEnables modeling the unknown characteristicsProvides new information based on cybernetic optimality
in silico experimentation
DCM: Log-linear Models
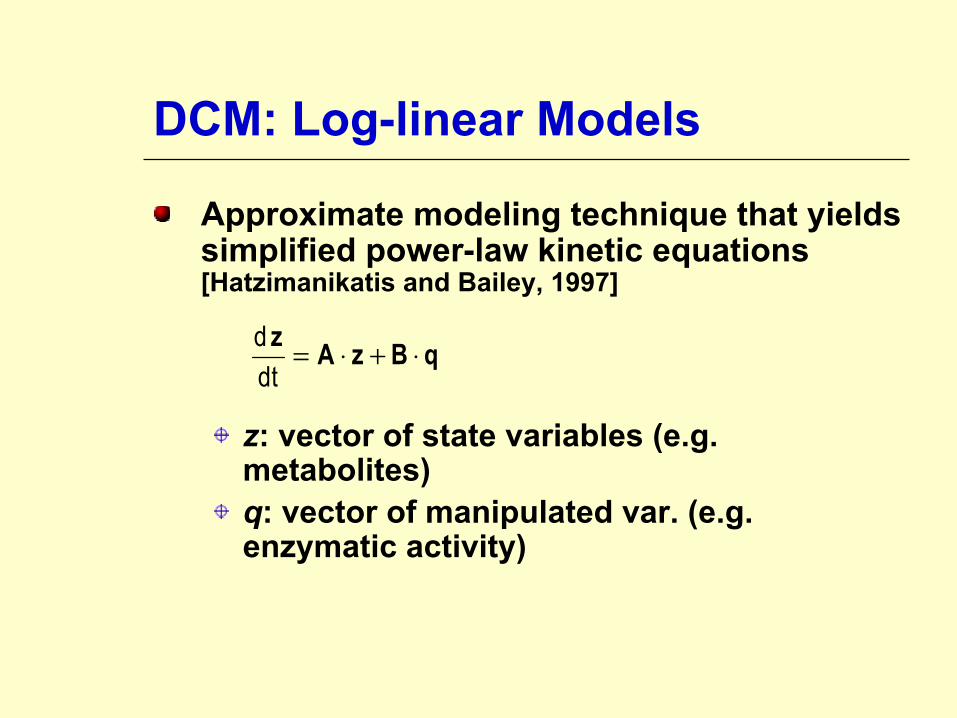
Approximate modeling technique that yields simplified power-law kinetic equations [Hatzimanikatis and Bailey, 1997]
z: vector of state variables (e.g. metabolites)q: vector of manipulated var. (e.g. enzymatic activity)
qBzAz ⋅+⋅=dtd
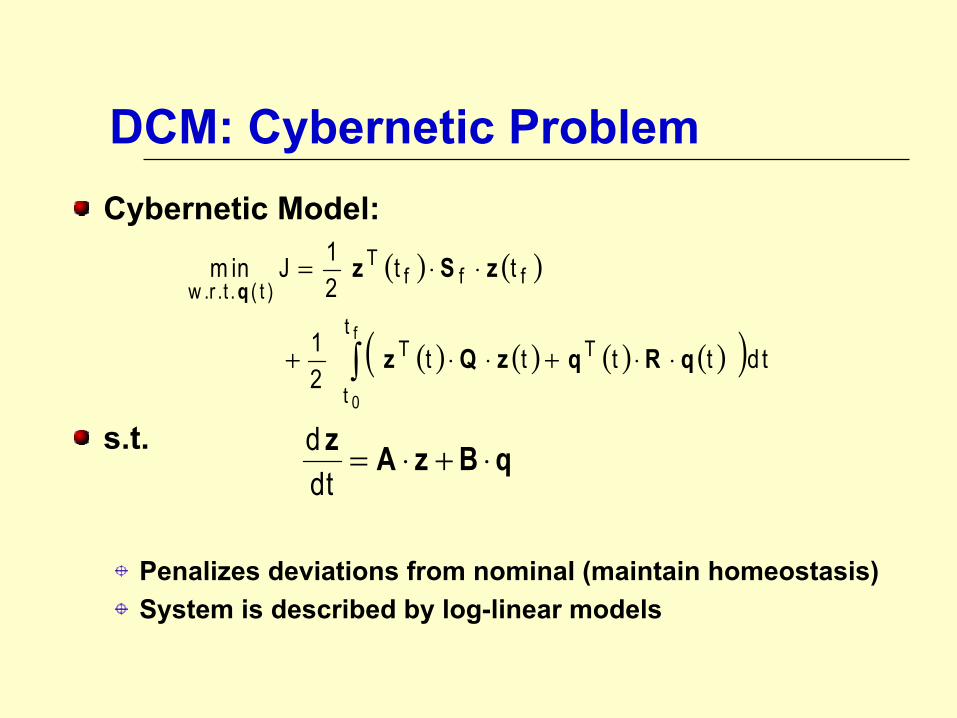
DCM: Cybernetic ProblemCybernetic Model:
s.t.
Penalizes deviations from nominal (maintain homeostasis)System is described by log-linear models
( ) ( )
( ) ( ) ( ) ( )( )∫ ⋅⋅+⋅⋅+
⋅⋅=
f
0
t
t
TT
fffT
)t(.t.r.w
d ttttt21
tt21Jm in
qRqzQz
zSzq
qBzAz ⋅+⋅=dtd
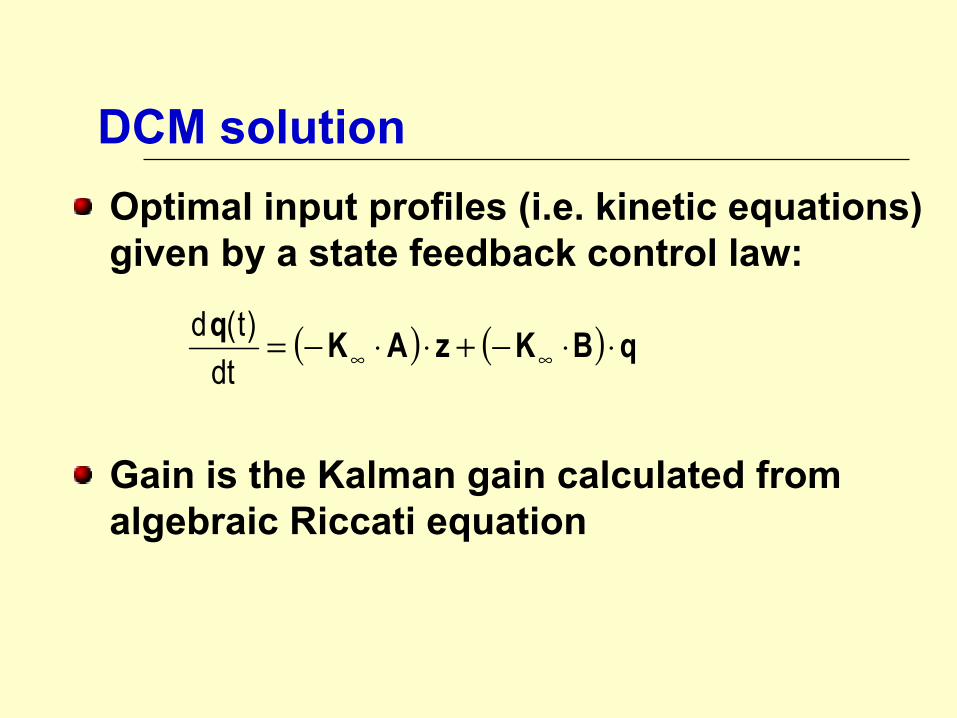
DCM solutionOptimal input profiles (i.e. kinetic equations) given by a state feedback control law:
Gain is the Kalman gain calculated from algebraic Riccati equation
( ) ( ) qBKzAKq ⋅⋅−+⋅⋅−= ∞∞dt)t(d

DCM-inference problemDefine
assume λE, λR are known
Optimal system is:
=rm
z e=q
( ) ( ) ( )
⋅−⋅−⋅−⋅−=
)t()t()t(
)t()t()t(
dtd
RE
RREREMMM
EM
rem
rem
λλ0λKλKΓKΓK
0ΓΓ
Data fit for mRNASystem can be evaluated analyticallyNonlinear Least-Square regression problemmRNA matrices are identified by iterationCan be simplified by diagonalizing the system
Transforms the multi-variable regression to multiple single variable regressions
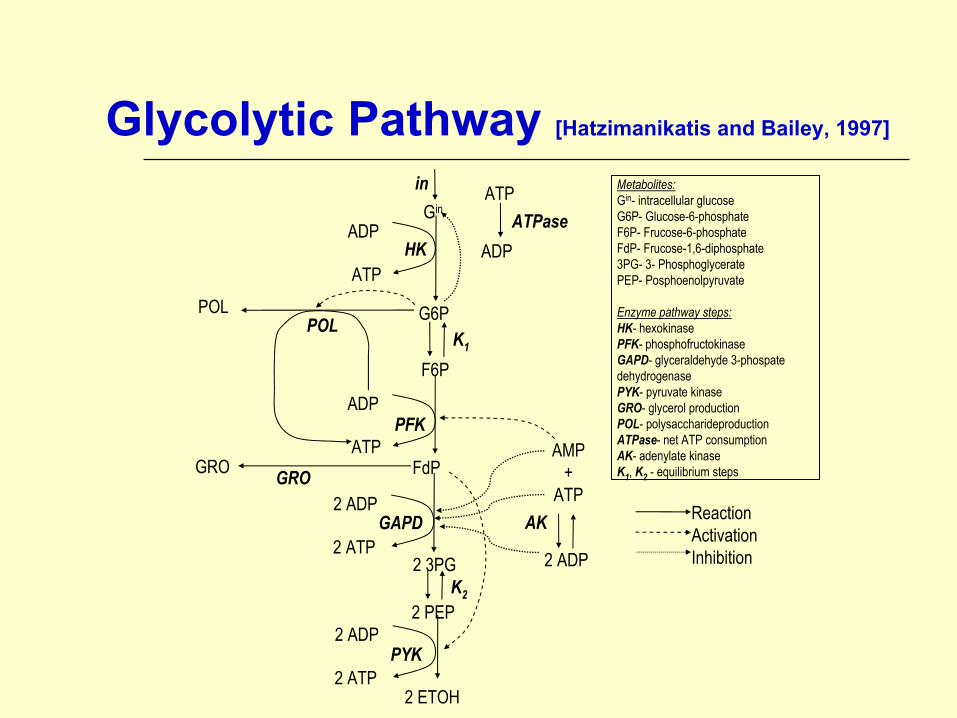
Glycolytic Pathway [Hatzimanikatis and Bailey, 1997]
Gin
in
HK
G6P
F6P
FdP
2 3PG
2 PEP
2 ETOH
POL
GRO
K1
K2
PFK
GAPD
PYK
AMP+
ATP
2 ADP
AK
ATP
ADPATPase
GRO2 ADP
2 ATP
2 ADP
2 ATP
ADP
ATP
POL
ADP
ATP
Metabolites:Gin- intracellular glucoseG6P- Glucose-6-phosphateF6P- Frucose-6-phosphateFdP- Frucose-1,6-diphosphate3PG- 3- PhosphoglyceratePEP- Posphoenolpyruvate
Enzyme pathway steps:HK- hexokinase PFK- phosphofructokinaseGAPD- glyceraldehyde 3-phospate dehydrogenasePYK- pyruvate kinaseGRO- glycerol productionPOL- polysaccharideproductionATPase- net ATP consumptionAK- adenylate kinaseK1, K2 - equilibrium steps
ReactionActivationInhibition
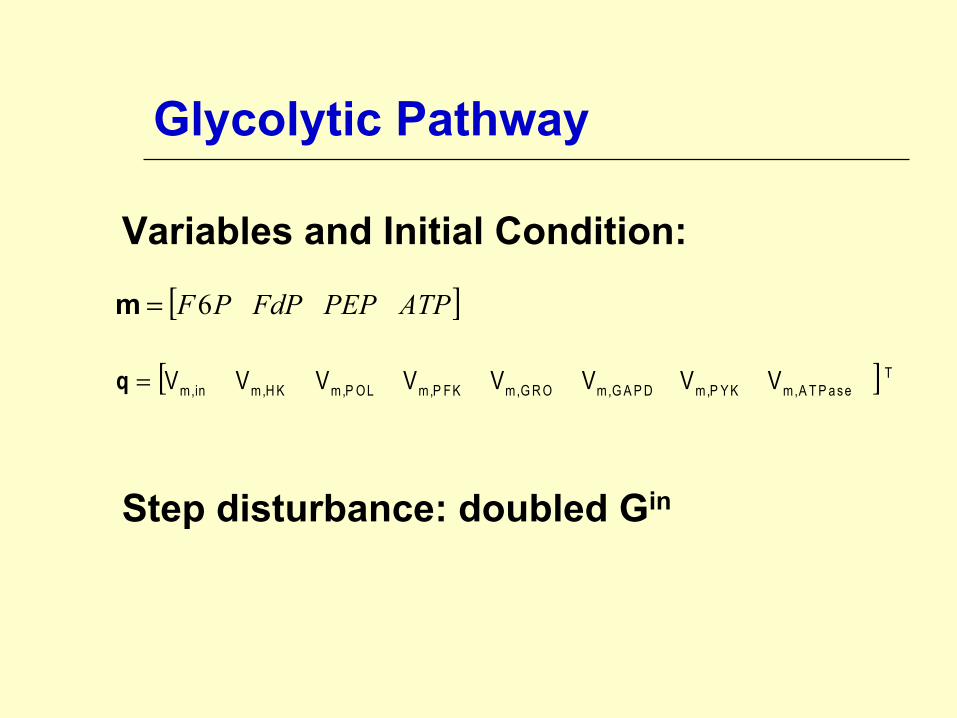
Glycolytic Pathway
[ ] TA T P a se,mP Y K,mG A P D,mG R O,mP FK,mP O L,mH K,min,m VVVVVVVV=q
Variables and Initial Condition:
Step disturbance: doubled Gin
[ ]ATPPEPFdPPF6=m
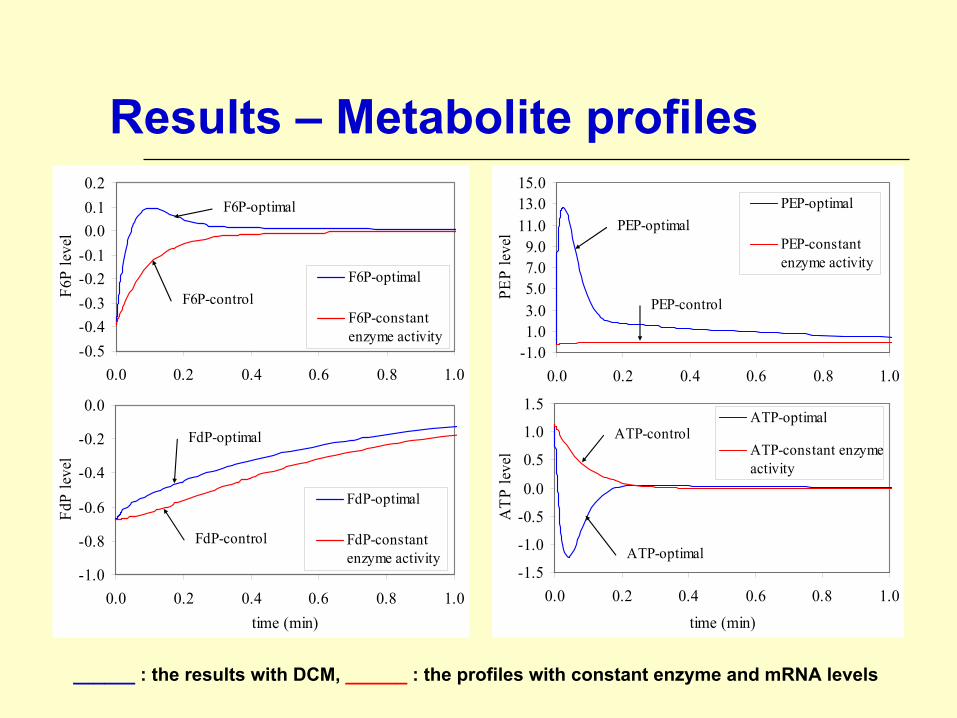
Results – Metabolite profiles
______ : the results with DCM, ______ : the profiles with constant enzyme and mRNA levels
-0.5-0.4-0.3-0.2-0.10.00.10.2
0.0 0.2 0.4 0.6 0.8 1.0time (min)
F6P
leve
l
F6P-optimal
F6P-constantenzyme activity
F6P-optimal
F6P-control
-1.0
-0.8
-0.6
-0.4
-0.2
0.0
0.0 0.2 0.4 0.6 0.8 1.0time (min)
FdP
leve
l
FdP-optimal
FdP-constantenzyme activity
FdP-optimal
FdP-control
-1.01.03.05.07.09.0
11.013.015.0
0.0 0.2 0.4 0.6 0.8 1.0time (min)
PEP
leve
l
PEP-optimal
PEP-constantenzyme activity
PEP-optimal
PEP-control
-1.5
-1.0
-0.5
0.0
0.5
1.0
1.5
0.0 0.2 0.4 0.6 0.8 1.0
time (min)
ATP
leve
l
ATP-optimal
ATP-constant enzymeactivity
ATP-optimal
ATP-control
Glycolytic Pathway - DiscussionsDynamics are significantly different:
Cybernetic model results display more complex behaviorMore realistic F6P and ATP profiles are observed [based on experimental data from Chassagnole et al., 2002]
Dynamics are faster than expected
Concluding RemarksA DCM framework for gene regulatory network
inference is introduced:Simple, suitable for very large problems enables identification of the cellular regulatory network based on mRNA data and metabolite kinetic descriptions cybernetic model is capable of describing the complex responses observed in actual biological phenomena can be extended to include other dynamics
transportation of mRNA to the ribosome possibly enzyme activation
Experimental verification of method is underway
ReferencesChassagnole C, Noisommit-Rizzi N, Schmid JW, MauchK, Reuss M. Biotechnology and Bioengineering 79(1):53-73, 2002. Chen T, He H.L., Church G.M. Proc. Pac. Symp. on Biocomputing 4:29-40. 2002. Galazzo JL, Bailey JE. Enzyme and Microbial Technology 12(3):162-172. 1990. Gombert AK, Nielsen J. 11(2):180-186, 2000. Hatzimanikatis V, Bailey JE. Biotechnology and Bioengineering 54(2):91-104, 1997. Hatzimanikatis V, Lee, K.H. Metabolic Engineering 1:275-281, 1999.