GAS1 IS RELATED TO THE GDNF FAMILY … · 2 In a ligand-independent manner, Gas1 sequesters Ret to...
22
1 GAS1 IS RELATED TO THE GDNF FAMILY RECEPTORS α AND REGULATES RET SIGNALING J. Ruben Cabrera 1 , Luis Sanchez-Pulido 2 , Ana M. Rojas 2 , Alfonso Valencia 2 , Santos Mañes 3 , Jose R. Naranjo 1 , Britt Mellström 1 1 Department of Molecular and Cellular Biology, 2 Protein Design Group, 3 Department of Immunology and Oncology, Centro Nacional de Biotecnologia, CSIC, 28049 Madrid, Spain Running title: Gas1 regulates Ret signaling Address correspondence to: B. Mellström, Department of Molecular and Cellular Biology, Centro Nacional de Biotecnologia, Darwin 3, Cantoblanco, 28049 Madrid, Spain, Tel. 34-91 585 4682; Fax. 34-91 585 4506; E-mail: [email protected] The growth arrest-specific gene 1 (Gas1) protein has been proposed to function during development as an inhibitor of growth and a mediator of cell death, and is also re- expressed in adult neurons during excitotoxic insult. Here we demonstrate that the Gas1 protein shows high structural similarity to the GDNF (glial cell-derived neurotrophic factor) family receptors α , which mediate GDNF responses through the receptor tyrosine kinase Ret. We found that Gas1 binds Ret in a ligand-independent manner and sequesters Ret in lipid rafts. Signaling downstream of Ret is thus modified through a mechanism that involves the adaptor protein Shc as well as Erk, eventually blocking Akt activation. Consequently, when Gas1 is induced, Ret- mediated GDNF-dependent survival effects are compromised. Gas1 is a GPI (glycosyl- phosphatidylinositol)-anchored protein, expressed at growth arrest and downregulated under proliferative conditions (1, 2). During development, Gas1 is widely expressed in the nervous system (3), and is associated with growth inhibition and cell death (4). In Gas1 -/- mice the cerebellum is smaller than in wild-type (5), however, indicating an unexpected role for Gas1 in proliferation. Moreover, Gas1 is induced by Wnt and interacts directly with sonic hedgehog (SHH), antagonizing SHH patterning function (6). In the adult, Gas1 is expressed during physiological apoptosis in some tissues (7), although not in brain (3). Aberrant Gas1 expression was nonetheless found in adult neurons during excitotoxicity, and its expression in neuroblastoma cells is associated with proapoptotic effects (8). Together, this suggests that Gas1 may have different functions within distinct cell contexts, and that its mechanism of action depends on its spatio-temporal expression. No mechanisms have yet been proposed by which Gas1 transmits signals that affect decisions about cell proliferation, growth arrest/differentiation, or cell death. The GFRα (GDNF f amily r eceptors α) are four GPI-anchored proteins, which serve as a link between the neurotrophic factors GFL (GDNF f amily l igand) and the transmembrane receptor tyrosine kinase Ret (reviewed in 9). The GFL consist of four proteins, GDNF, neurturin, artemin, and persephin, representing an important class of soluble mediators of neuronal survival, neurite growth, and differentiation. GFL are critical regulators of neurodevelopment and support the survival of midbrain dopaminergic and spinal motorneurons (reviewed in 10). These effects are mediated through the multicomponent receptor system consisting of GFRα and Ret (11, 12). Activated Ret binds many different adaptor proteins to activate divergent downstream signaling pathways. Recruitment of Ret to lipid rafts seems to be important for the choice of adaptor molecule (13, 14), although the mechanisms are not yet fully understood (reviewed in 15). To study the Gas1 mechanism of action, we undertook detailed sequence analysis and found a structural relationship between Gas1 and the GFRα. Based on this finding, we analyzed Gas1 involvement in GFRα1-Ret receptor complex formation and downstream effects. Our results suggest that Gas1 is related to the GFRα, and may have a regulatory function in Ret signaling. http://www.jbc.org/cgi/doi/10.1074/jbc.M509572200 The latest version is at JBC Papers in Press. Published on March 20, 2006 as Manuscript M509572200 Copyright 2006 by The American Society for Biochemistry and Molecular Biology, Inc. by guest on August 5, 2018 http://www.jbc.org/ Downloaded from
Transcript of GAS1 IS RELATED TO THE GDNF FAMILY … · 2 In a ligand-independent manner, Gas1 sequesters Ret to...
1
GAS1 IS RELATED TO THE GDNF FAMILY RECEPTORS α AND REGULATES RET SIGNALING J. Ruben Cabrera1, Luis Sanchez-Pulido2, Ana M. Rojas2, Alfonso Valencia2, Santos Mañes3, Jose R. Naranjo1, Britt Mellström1 1Department of Molecular and Cellular Biology, 2Protein Design Group, 3Department of Immunology and Oncology, Centro Nacional de Biotecnologia, CSIC, 28049 Madrid, Spain Running title: Gas1 regulates Ret signaling Address correspondence to: B. Mellström, Department of Molecular and Cellular Biology, Centro Nacional de Biotecnologia, Darwin 3, Cantoblanco, 28049 Madrid, Spain, Tel. 34-91 585 4682; Fax. 34-91 585 4506; E-mail: [email protected]
The growth arrest-specific gene 1 (Gas1) protein has been proposed to function during development as an inhibitor of growth and a mediator of cell death, and is also re-expressed in adult neurons during excitotoxic insult. Here we demonstrate that the Gas1 protein shows high structural similarity to the GDNF (glial cell-derived neurotrophic factor) family receptors α , which mediate GDNF responses through the receptor tyrosine kinase Ret. We found that Gas1 binds Ret in a ligand-independent manner and sequesters Ret in lipid rafts. Signaling downstream of Ret is thus modified through a mechanism that involves the adaptor protein Shc as well as Erk, eventually blocking Akt activation. Consequently, when Gas1 is induced, Ret-mediated GDNF-dependent survival effects are compromised.
Gas1 is a GPI (glycosyl-phosphatidylinositol)-anchored protein, expressed at growth arrest and downregulated under proliferative conditions (1, 2). During development, Gas1 is widely expressed in the nervous system (3), and is associated with growth inhibition and cell death (4). In Gas1-/- mice the cerebellum is smaller than in wild-type (5), however, indicating an unexpected role for Gas1 in proliferation. Moreover, Gas1 is induced by Wnt and interacts directly with sonic hedgehog (SHH), antagonizing SHH patterning function (6). In the adult, Gas1 is expressed during physiological apoptosis in some tissues (7), although not in brain (3). Aberrant Gas1 expression was nonetheless found in adult neurons during excitotoxicity, and its expression in neuroblastoma cells is associated with
proapoptotic effects (8). Together, this suggests that Gas1 may have different functions within distinct cell contexts, and that its mechanism of action depends on its spatio-temporal expression. No mechanisms have yet been proposed by which Gas1 transmits signals that affect decisions about cell proliferation, growth arrest/differentiation, or cell death.
The GFRα (GDNF family receptors α) are four GPI-anchored proteins, which serve as a link between the neurotrophic factors GFL (GDNF family ligand) and the transmembrane receptor tyrosine kinase Ret (reviewed in 9). The GFL consist of four proteins, GDNF, neurturin, artemin, and persephin, representing an important class of soluble mediators of neuronal survival, neurite growth, and differentiation. GFL are critical regulators of neurodevelopment and support the survival of midbrain dopaminergic and spinal motorneurons (reviewed in 10). These effects are mediated through the multicomponent receptor system consisting of GFRα and Ret (11, 12). Activated Ret binds many different adaptor proteins to activate divergent downstream signaling pathways. Recruitment of Ret to lipid rafts seems to be important for the choice of adaptor molecule (13, 14), although the mechanisms are not yet fully understood (reviewed in 15).
To study the Gas1 mechanism of action, we undertook detailed sequence analysis and found a structural relationship between Gas1 and the GFRα. Based on this finding, we analyzed Gas1 involvement in GFRα1-Ret receptor complex formation and downstream effects. Our results suggest that Gas1 is related to the GFRα, and may have a regulatory function in Ret signaling.
http://www.jbc.org/cgi/doi/10.1074/jbc.M509572200The latest version is at JBC Papers in Press. Published on March 20, 2006 as Manuscript M509572200
Copyright 2006 by The American Society for Biochemistry and Molecular Biology, Inc.
by guest on August 5, 2018
http://ww
w.jbc.org/
Dow
nloaded from
2
In a ligand-independent manner, Gas1 sequesters Ret to lipid rafts, mediates Shc and Erk recruitment to this membrane domain, and blocks Akt activation without affecting Erk activation. This indicates that the proapoptotic function of Gas1 could be associated to its interaction with Ret and to inhibition of a GDNF-dependent survival pathway. EXPERIMENTAL PRCEDURES
Sequence analysis For sequence analysis, we related distant protein families via intermediate searches (16) using global hidden Markov model profiles (17). To improve profile quality, we searched against EST (expressed sequence tag) databases. Alignment was produced with T-Coffee software (18) and was slightly refined manually; it is viewed with the Belvu program (http://www.cgb.ki.se/cgb/groups/sonnhammer/Belvu.html). Secondary structure was predicted using PhD (19). The location of predicted signal peptides and transmembrane regions is based on Signal-P and TMHMM2 programs, respectively (20, 21).
Phylogenetic analysis To determine the phylogenetic distribution of the domains in homologous proteins, the domains were considered as individual entries. We used standard methods based on progressive alignment (22), generating Neighbour-Joining trees (23) to establish topologies in 10,000 bootstrap replicates. As the sequences were small and divergent, we used a probabilistic approach using MrBayes (24), running for 900,000 generations and four independent Markov chains. We sampled 25,000 trees and generated a consensus. Trees were drawn using the TreeView tool (25). For clarity, only the probabilistic unrooted tree is shown (Fig. 2). Molecular modeling- Fold recognition analyses were performed using the 3D-Jury metaserver (26). The model was based on the published crystal structure from domain 3 of the GFRα1 receptor protein (27), and obtained using Swiss-Model (28). The model was evaluated using PSQS (http://www1.jcsg.org/psqs/). Model and template coordinates were superimposed using the DALI server (http://www.ebi.ac.uk/dali/Interactive.html). Illustrations were generated with MOLMOL.
Plasmids The rat Gas1 expression vector was previously described (8). Human
GFRα1 was obtained by PCR from a substantia nigra cDNA library (BD Biosciences, Mountain View, CA) with the primers: 5´ TGAACCCCTAAAAGCGGAACC and 5´ GCATATCCCAAAGCCTTCT GAGTT. Isoform GFRα1.1 was subcloned in pcDNA3. The Ret sequence coding for amino acids 1 to 663 (extracellular domain, transmembrane domain and 5 amino acids of the intracellular domain) was obtained by PCR using the primers 5´ ATGGCGAAGGCGACGT and 5´ AAACTTGTGGTAGCAGTGGA, and a human pcDNA3-Ret9 plasmid as the template. The amplified product was subcloned in the pCS2+Myc expression vector to obtain the plasmid pCS-RetMyc. The Gas1-TM expression construct, which codes for rat Gas1 without the putative amino acids susceptible to GPI modification, fused to the transmembrane domain (TM) and a truncated cytosolic tail (CT12) of human LDL receptor (29), were generated as follows. The TM and CT12 of human LDL-R was amplified by PCR using the primers 5´ GTTGGCGC GCCAGGAAGTAGCGTGAGGGCTCTG 3´ and 5´ CGCTCTAGATTATCAGTTGATGCTG TTGATGTTC 3´ with XhoI and XbaI restriction sites, respectively. The PCR product was cloned into pGEM-T Easy, sequenced, and subsequently ligated with rat Gas1, truncated at the C-terminal residue 357, in pcDNA3.
Cell culture, transfections and treatments Human embryonic kidney (HEK)293T, and mouse neuroblastoma Neuro 2a (N2a) cells were cultured in DMEM, human neuroectodermic cells SK-N-MC in DMEM/F12 Glutamax, and human neuroblastoma SH-SY5Y in RPMI; all media were supplemented with 10% fetal bovine serum, Glutamax-I and penicillin/streptomycin. To select for Ret9 stably transfected clones in SK-N-MC, complete medium was supplemented with 0.4 mg/ml geneticin (G418; Invitrogen). G418-resistant clones were expanded and assayed for Ret expression. For experiments, clone 3 (SK-S3) was selected for moderate Ret expression. Cells were plated at 70% confluence in 60 mm plates. HEK293T and N2a cells were transfected with JetPei reagent (Bridge Bioscience, Palo Alto, CA) for 16 h according to manufacturer’s instructions and the transfection efficiency was about 50% for both cell lines. In N2a cells, the GFRα1:Gas1plasmid ratio was 1:2. Before treatment, cells were incubated in serum-free medium for 6 h (HEK293T and SK-S3 cells) or
by guest on August 5, 2018
http://ww
w.jbc.org/
Dow
nloaded from
3
2-4 h (N2a cells). HEK293T cells were stimulated with 100 ng/ml SHH (R&D Systems, Minneapolis, MN) or 50 ng/ml GDNF (Peprotech, Rocky Hill, NJ) for 30 min. N2a cells were stimulated with 25 ng/ml GDNF for 15 min, except when otherwise stated. SK-S3 and SH-SY5Y were stimulated with 100 ng/ml GDNF for 15 min.
Chemical crosslinking Chemical crosslinking was performed essentially as described (30). HEK293T cells were transfected as above and serum-deprived for 6 h. The 125I-GDNF ligand (500 nM; Amersham) was incubated with cells (30 min) and removed before crosslinking with ethyl-dimethylaminopropyl-carbodiimide (EDC) supplemented with sulfo-NHS (Pierce), according to manufacturer’s instructions.
Cell lysis, immunoprecipitation and immunoblotting Cells were lysed in lysis buffer [50 mM Tris-HCl, pH 7.5, 150 mM NaCl, 1% Nonidet P-40, protease inhibitor cocktail (Roche Molecular Biochemicals) and phosphatase inhibitors (Calbiochem Phosphatase Inhibitor Cocktail Set II) and 1 mM NaO4Va] for 10 min on ice and for an additional 30 min rotating at 4ºC. Lysates were cleared by centrifugation. Immunoprecipitation was done using antibodies and 10 µl of protein G-Sepharose beads (GE Healthcare) (4 ºC, overnight). The immunoprecipitates were washed three times with lysis buffer and solubilized in sample buffer. Anti-Gas1 has been described (8). Antibodies against Ret, Src, GFRα1, FRS2, Erk-2, TSHR and actin were from Santa Cruz, phosphotyrosine (4G10), Shc and phosphoShc were from Upstate Biotechnologies, Akt, phosphoAkt and CREB were from Cell Signaling, TR was from Zymed, Myc, (9E10) was from BD Biosciences, and phosphoErk was from Sigma. Blots were developed by chemiluminiscence (Super Signal West Dura, Pierce or ECL Advance, GE Healthcare) and quantified using NHI Image software. Fold- induction was calculated by ratio of phosphorylated form to total protein and the ratio in basal condition was set to 1.0. Statistical analysis was performed using Student’s t-test or one-way ANOVA followed by Tukey’s posthoc test for the significance of differences.
Lentiviral infection HEK293 cells were cotransfected with three packaging plasmids and the vector encoding rat antisense Gas1 (pRRLsin.PPT.hCMV.Gas1AS) or GFP
(PRRLsin.PPT.hCMV.GFPWpre) as described (31). After 36-60 h, viral particles were collected and concentrated by ultracentrifugation. Virus concentration was estimated by measuring the amount of p24 protein (PerkinElmer, Wellesley, MA). SH-SY5Y was transduced 12 h after plating using 5 µg of p24/106 cells. Medium was changed 8 h after virus addition, and cells were allowed to express the mRNA of interest for at least 48 h before experiments. Typical infection efficiency was ~90%, as assessed using viral delivery of GFP.
Flotation gradient and detergent-resistant membranes For analysis of detergent-insoluble complexes in flotation gradients, 1.5 x 10⁶ cells were cooled on ice, washed with PBS, and lysed in 350 µl TNE buffer (50 mM Tris·HCl, pH 7.4, 150 mM NaCl, 5 mM EDTA) with 0.3% Triton X-100 (Calbiochem), as described (32). Cells were extracted (20 min, on ice) and the extract subsequently brought to 35% (vol/vol) Optiprep (Reactiva). The lysate (250 µl) was overlayered sequentially with 3.5 ml 30% (vol/vol) Optiprep and 200 µl TNE with detergent in SW60 tubes. After centrifugation (4 h, 170,000 x g, 4 ºC), six 600 µl fractions (1 to 6) were collected from the gradient (top to bottom) and precipitated with trichloroacetic acid (all steps performed in a 4 ºC cold room, on ice). Normalized protein amounts for each fraction were analyzed by SDS/PAGE and immunoblotting. As controls for the gradients, we used anti-Src (present in the raft-associated fraction one) and anti-transferrin receptor (TR) (present in the nonraft-associated fraction six). Detergent-resistant membrane fractions were isolated as described (13).
Flow cytometry analysis of propidium iodide incorporation SH-SY5Y cells were plated and infected after 12 h in culture. At 24 h postinfection, medium was replaced with serum-free medium; at 48 h, cells were treated with GDNF until 72 h postinfection. Cells were collected, prepared for cytometry using Coulter DNA-Prep Reagents Kit (Beckman-Coulter), and analyzed in a Coulter Epics XL-MCL Flow Cytometer (Beckman-Coulter). Ten thousand events were counted on the scatter gate. Expo32 was used as statistical analysis software. Experiments were repeated two times in quadruplicates and analyzed by one-way ANOVA followed by Bonferroni test for the significance of differences.
by guest on August 5, 2018
http://ww
w.jbc.org/
Dow
nloaded from
4
RESULTS
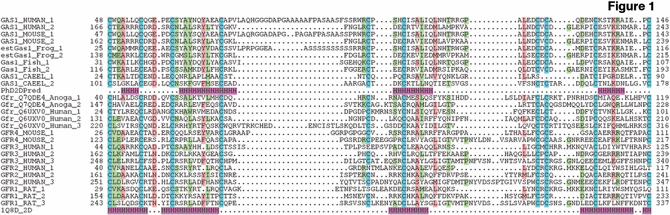
GAS1 is related to the GDNF family receptors α Multiple alignment of the GAS1 protein primary sequence from several species identified two cysteine-rich repeats, residues 48 to 147 and 166 to 243 in the human sequence, in which the relative positions of the cysteines were highly conserved (Fig. 1). Searches with the global profile HMMer (hidden Markov model) of the cysteine-rich repeat region of GAS1 proteins found GFRα with an E-value of 0.049 (sptrembl_id:Q6UXV0, residues 131-210). Reciprocally, the profile of the GFRα repeat domain detected Gas1 proteins with an E-value of 0.55 (swissprot_id:GAS1_HUMAN, residues 166-243). None of these profile HMMer searches retrieved any other related sequences. The human sequence sptrembl_id:Q6UXV0, GRAL (33), was automatically identified as a new GFRα member by Pfam (http://www.sanger.ac.uk/Software/Pfam/). In addition, secondary structure prediction for the Gas1 protein (Fig. 1) showed good agreement with the crystal structure of GFRα1 domain 3 (27).
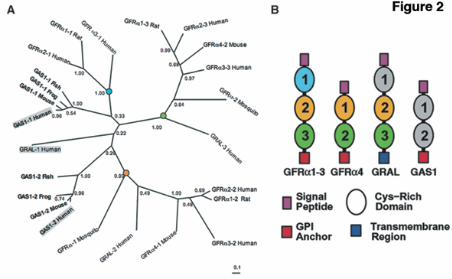
We used sequence alignment of the repeated domain common to the GFRα and the GAS1 proteins for phylogenetic analysis. Taking into account both the short length and the high divergence of the alignment, low clade confidence values at deep branches of the tree are predicted. Nonetheless, the topology was consistent and sufficient to establish a relation among the GFRα domains (Fig. 2A). In addition to the sequence similarity, we found an overall resemblance in the domain architecture of GFRα and GAS1 proteins (Fig. 2B). We confirmed a signal peptide located at the N-terminus of both GAS1 and GFRα1, and a GPI anchor at the C-terminus of GFRα (11, 12) and GAS1 proteins (2). Mammalian GRAL has a C-terminal transmembrane domain.
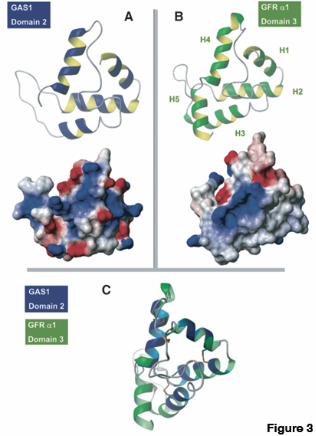
To determine whether fold recognition analysis generated consistent results, we submitted the two GAS1 cysteine-rich domains (swissprot_id: GAS1_HUMAN, residues 48-147 and 166-243) as a query to a fold-assignment metaserver. The structure of the GFRα1 protein cysteine-rich domain 3 (PDB code: 1Q8D) was detected as the optimal template. The disulfide bridges are conserved and the overall fold is maintained (Fig. 3). Scores were low, as
predicted, due to the short length of the domain and the low level of sequence similarity among the proteins. The high degree of sequence divergence can be explained by the fact that the overall fold of the template is sustained by disulfide bridges. This type of protein domain keeps the overall fold as a consequence of spatial restrictions imposed by its conserved disulphide bridges (34). Considering the E-values of the profile HMMer searches, the common domain architecture, the reliability of the secondary structure prediction, and the fold assignment results, we conclude that the cysteine-rich repeat domains in the Gas1 protein are similar to the GFRα family repeats. Together, the data suggest that Gas1 is related to the GFRα.
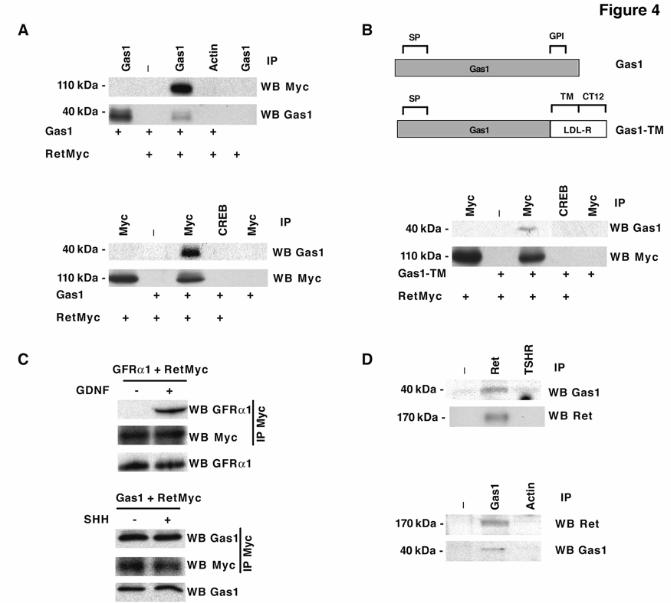
Gas1 interacts with Ret in a ligand-independent manner Since the Gas1 repeats showed a fold similar to that of GFRα1, we hypothesized that Gas1 interacts with Ret, the GFRα1 binding partner. To study this possibility, we analyzed Gas1 binding to Ret in HEK293T cells, which are not growth-arrested by Gas1 and do not express endogenous Gas1 or Ret proteins. We generated a RetMyc construct, in which the carboxy-terminal intracellular domain was replaced by six Myc epitopes. Coimmunoprecipitation experiments following Gas1 and RetMyc expression in HEK293T cells showed that RetMyc was precipitated by a Gas1 antibody and Gas1 was precipitated by an anti-c-Myc antibody (Fig. 4A). To assure that the Gas1/RetMyc interaction was not an artefact due to overexpression of a GPI-anchored protein, we generated a Gas1 construct, Gas1-TM, without the GPI anchor. This construct maintains the signal peptide and the two cysteine-rich domains, but the C-terminal amino acids, including the putative GPI modification sequence, were replaced by the transmembrane domain and 12 cytosolic amino acids of the human LDL receptor (29) (Fig. 4B, upper panel). The Gas1-TM construct was expressed correctly and was recognized by the Gas1 antibody (not shown). HEK293T cells were transfected with RetMyc and Gas1-TM and analyzed by immunoprecipitation. The c-Myc antibody precipitated Gas1-TM efficiently (Fig. 4B, lower panel), confirming that GPI modification is not decisive for interaction with Ret.
Immunoprecipitations were done after cell culture in the presence of serum; we thus cannot rule out the possibility that the interaction is influenced by neurotrophic factors in the serum.
by guest on August 5, 2018
http://ww
w.jbc.org/
Dow
nloaded from
5
To determine whether the interaction is ligand-dependent, as is the case for Ret binding to GFRα1, coimmunoprecipitations were repeated after serum deprivation, with or without known ligands. GFRα1 coimmunoprecipitated with RetMyc only after addition of its preferred ligand GDNF (Fig. 4C), as described (13). Conversely, Gas1 coimmunoprecipitated with RetMyc, both alone and in the presence of its reported ligand, SHH (6), and with or without GDNF (Fig. 4C and not shown) indicating that Gas1 interacts with RetMyc in a ligand-independent manner.
Gas1 is widely expressed in the nervous system during mouse embryonic development (4), at times when Ret expression has also been reported, e.g. in brain at embryonic day 14 (E14) (35). To demonstrate that the Gas1-Ret interaction can occur in vivo, we used brain extract from E14 mice for immunoprecipitation with an anti-Ret antibody. Immunoprecipitated Gas1 was detected by western blot (Fig. 4D, upper panel). To confirm this interaction, Gas1 was immunoprecipitated from E14 mouse brain extract, and Ret was detected by western blot (Fig. 4D, lower panel). These data indicate that Gas1 could interact with Ret in developing mouse brain.
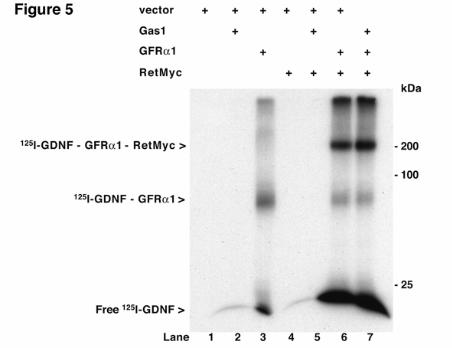
Gas1 does not bind to GDNF As the Gas1/Ret interaction is ligand-independent, we tested whether Gas1 interferes with the phosphorylation-competent complex formed by GDNF, GFRα1 and Ret, in crosslinking experiments with radiolabeled GDNF in transfected HEK293T cells. GFRα1 bound 125I-GDNF, forming a complex of ~85 kDa (Fig. 5, lane 3), as described (11, 12), while Gas1 did not bind to 125I-GDNF (lane 2). In cells transfected with RetMyc alone or together with Gas1, we observed no binding to 125I-GDNF (lanes 4, 5). Cotransfection of GFRα1 and RetMyc resulted in the formation of two complexes, at ~85 and 200 kDa, corresponding to the 125I-GDNF-GFRα1 and 125I-GDNF-GFRα1-RetMyc complexes, respectively (lane 6). Cotransfection of Gas1 with GFRα1 and RetMyc showed the same banding pattern as for GFRα1 and RetMyc alone, with no change in the level of the complex at 200 kDa (lane 7). The results indicate that neither Gas1 alone nor the Gas1-RetMyc complex is able to bind 125I-GDNF, and that Gas1 does not interfere with GDNF-GFRα1 binding to Ret.
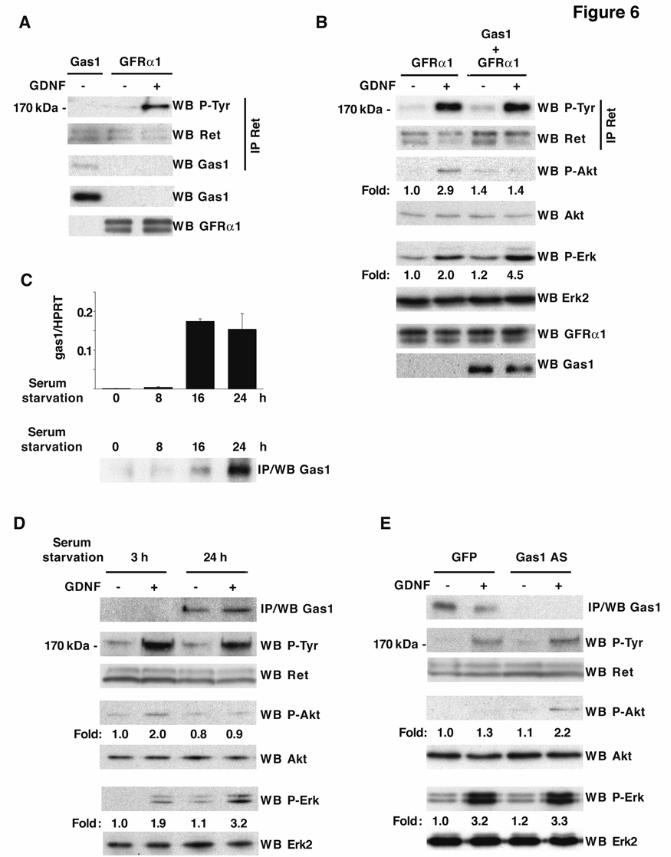
Gas1 modifies Ret downstream signaling Since Gas1 did not affect GFRα1-Ret receptor complex formation, we analyzed whether Gas1 influenced Ret autophosphorylation and activation. We used the N2a neuroblastoma cell line, which expresses Ret and very low GFRα1 levels (11). Gas1 expression in serum-deprived N2a cells did not result in Ret tyrosine phosphorylation, although Gas1 coimmunoprecipitated with Ret (Fig. 6A); cells transfected with GFRα1 and stimulated with GDNF showed robust Ret phosphorylation (Fig. 6A), as described (11). To determine whether Gas1 is involved in the regulation of Ret downstream signaling, we transfected N2a cells with GFRα1, with or without Gas1. We analyzed the phosphorylation of Akt and Erk, two major effectors downstream of Ret, after serum deprivation and GDNF stimulation. To permit comparison after GDNF stimulation, we verified similar GFRα1 expression in all samples in each experiment. Coexpression with Gas1 did not modify GFRα1-GDNF-induced Ret autophosphorylation (Fig. 6B). The presence of Gas1 severely decreased GDNF-induced Akt phosphorylation from 2.9- to 1.4-fold compared to control cells (p<0.01, n=4) (Fig. 6B), whereas Erk phosphorylation increased from 2.0- to 4.5-fold (p<0.01, n=4). Time-course analysis of Ret, Akt and Erk phosphorylation showed that in the presence of Gas1, Akt phosphorylation was impaired at all times analyzed up to 2 h, while Erk phosphorylation took place earlier and lasted longer (not shown).
We analyzed the influence of endogenously expressed Gas1 on Ret signaling using the SH-SY5Y human neuroblastoma cell line, which expresses Ret and GFRα1 and responds to GDNF (36). Gas1 was expressed at very low levels in the presence of serum, while Gas1 mRNA was strongly induced after 16 h of serum deprivation (Fig. 6C). This correlated with increased Gas1 protein levels detected by immunoprecipitation (Fig. 6C). We used this cell model to analyze Ret signaling with or without Gas1. SH-SY5Y cells were serum-deprived for 3 h (absence of Gas1) or for 24 h (presence of Gas1). Cells were subsequently stimulated with GDNF, and phosphorylation of Ret, Akt and Erk was analyzed. Concurring with the results in transfected N2a cells (Fig. 6A, B), in Gas1-expressing cells Ret phosphorylation was independent of Gas1 expression (Fig. 6D), while Akt phosphorylation decreased appreciably,
by guest on August 5, 2018
http://ww
w.jbc.org/
Dow
nloaded from
6
from 2.0 to 0.9-fold (p<0.05, n=3) and Erk phosphorylation increased from 1.9 to 3.2-fold (p<0.01, n=3) (Fig. 6D). As serum deprivation can affect other pathways, however, these data do not allow us to conclude that Gas1 is uniquely responsible for inhibition of Akt activation and increased Erk activation after GDNF stimulation.
To confirm the influence of Gas1 on Ret signaling, we analyzed GDNF-induced Ret, Akt and Erk phosphorylation in SH-SY5Y cells, in which Gas1 induction after serum deprivation was knocked-down by lentivirus-mediated expression of an antisense Gas1 mRNA. Ret phosphorylation was similar in GFP-infected cells (Gas1-expressing cells) and in cells infected with antisense Gas1 (Gas1 knock-down cells) (Fig. 6E). Gas1-expressing cells (GFP-infected) did not activate Akt after GDNF stimulation (1.3-fold), while cells infected with antisense Gas1 (knock-down) were able to do so (2.2-fold, p<0.001, n=4) (Fig. 6E). Erk phosphorylation was similar both in Gas1-expressing cells and in Gas1 knock-down cells, 3.2-fold and 3.3-fold, respectively (Fig. 6E). These results indicate that endogenously induced Gas1 cannot activate Ret, but modifies Ret downstream signaling induced by GDNF-GFRα1, so that Akt phosphorylation is reduced. The relevance of Gas1 in Erk phosphorylation is nonetheless unclear. Overexpressed Gas1 mediates an increase in Erk phosphorylation in response to GDNF. Erk is also strongly activated after 24 h of serum deprivation and GDNF stimulation, as compared to cells serum-deprived for 3 h. This increase was not reversed by antisense Gas1mRNA, however, suggesting a minor role for Gas1 in Erk activation. Alternatively, serum deprivation may generate sufficient oxidative stress to strongly activate Erk after GDNF stimulation, also in the Gas1 knock-down cells. Taken together, our results show that Gas1 is a regulator of Ret downstream signaling, specifically blocking Akt activation.
Gas1 recruits Ret to lipid rafts The location of phosphorylated Ret in the cell membrane is an important determinant for the activation of distinct downstream signaling pathways (14). GFRα1 is constitutively located inside lipid rafts through its GPI anchor, whereas in unstimulated cells Ret is found mainly outside rafts. After GDNF stimulation, GFRα1-GDNF complex formation induces transient Ret recruitment to lipid rafts (13), and activated Ret is in equilibrium between detergent-resistant membranes and the soluble membrane fraction
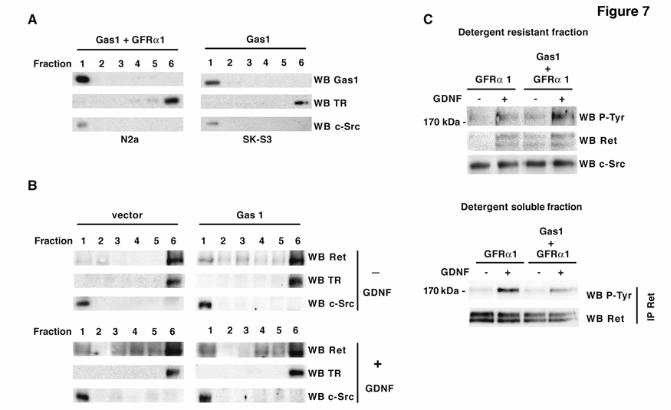
(14). To determine Gas1 location in the plasma membrane, we used N2a cells and SK-S3, a clone derived from the human neuroectodermic SK-N-MC cell line. SK-N-MC cells express endogenous GFRα1 and GFRα2 (37), and the SK-S3 clone stably expresses Ret9, the short isoform of Ret (38). We transiently transfected N2a and SK-S3 cells with Gas1 and separated cell extracts in flotation gradients. Gas1 co-fractionated with a raft-associated marker in the first fraction (Fig. 7A). We used SK-S3 cells to establish whether the effect of Gas1 on Ret signaling is due to modification of Ret location in the membrane. In cells transfected with vector alone, a small fraction (8% of total protein) of Ret was found in lipid rafts (fraction 1) (Fig. 7B, upper left), which increased (13%) in the presence of GDNF (Fig. 7B, lower left), as described (13, 14). In cells transfected with Gas1, we observed substantial Ret recruitment to lipid rafts (fraction 1) in the absence of GDNF (16%) (Fig. 7B, upper right), which increased further after GDNF addition (21%) (Fig. 7B, lower right). This indicates that prior to cell stimulation with GDNF, Gas1 increases the Ret fraction in lipid rafts, which may modify signaling events downstream of Ret.
To analyze how Gas1 affects the membrane distribution of phosphorylated Ret, we isolated detergent-resistant membranes and soluble fractions from transfected N2a cells. When Gas1 was cotransfected with GFRα1, the level of phosphorylated Ret increased in the detergent-resistant fraction both in unstimulated and GDNF-stimulated cells (Fig. 7C, upper). The reverse was the case in the soluble fraction, and Ret phosphorylation was higher in the absence of Gas1 (Fig. 7C, lower). This confirms the ability of Gas1 to recruit Ret to lipid rafts and shows that activated Ret is increased in this membrane microdomain in the presence of Gas1.
Gas1 mediates the recruitment of activated Shc and Erk2 to lipid rafts Ret can activate the PI3K/Akt pathway through various adaptors (15). To explain Gas1-mediated impairment of Akt activation, we analyzed activation of the adaptor FRS2, which transduces Ret signaling in rafts and is proposed to activate the PI3K/Akt pathway (39). We also analyzed the Shc adaptor which transduces Ret signaling outside rafts (14) and activates the PI3K/Akt pathway (40). We immunoprecipitated FRS2 from N2a cell extracts and analyzed tyrosine phosphorylation by immunoblotting. GDNF stimulation induced a strong tyrosine phosphorylated band at 75 kDa
by guest on August 5, 2018
http://ww
w.jbc.org/
Dow
nloaded from
7
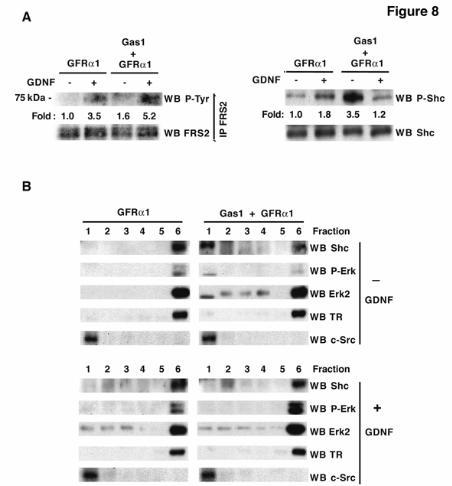
(3.5-fold), corresponding to activated FRS2. In the presence of Gas1 and GDNF, the level of activated FRS2 was higher (5.2-fold, p<0.05, n=3) (Fig. 8A, left), in agreement with the Ret increase in rafts. Gas1 thus increases GDNF-induced FRS2 activation, which concurs with the fact that Gas1 is changing the raft/non-raft equilibrium of Ret, it cannot however explain the reduction in Akt phosphorylation.
In cells transfected with GFRα1 and stimulated with GDNF, Shc phosphorylation increased 1.8-fold (Fig. 8A, right) as described (40). Strikingly, in cells transfected with GFRα1 and Gas1, Shc was strongly activated, 3.5-fold (p<0.01, n=3) in the absence of GDNF. Addition of GDNF resulted in rapid Shc dephosphorylation to basal levels (1.2-fold) (Fig. 8A, right). The strong, Gas1-mediated Shc activation in the absence of GDNF did not result in activation of Akt or Erk, as shown in figure 6B. GDNF addition thus reversed Shc phosphorylation, suggesting that Shc is involved in the mechanism that blocks Akt activation in the presence of Gas1. Gas1 recruits non-phosphorylated Ret to lipid rafts (see Fig. 7), which may contribute to the modified function of adaptor proteins. We thus analyzed recruitment to lipid rafts of Shc, as well as of Erk, a major downstream effector that is implicated in negative loops that regulate adaptor signaling (41, 42). In the absence of Gas1 and prior to GDNF stimulation, we detected no Shc or phosphoErk recruitment to lipid rafts (Fig. 8B, upper left). In unstimulated cells transfected with Gas1, we observed strong Shc recruitment and a single band of activated Erk in lipid rafts (Fig. 8B, upper right). An Erk2-specific antibody identified the single phosphoErk band as Erk2 (Fig. 8B). After GDNF stimulation in the presence of Gas1, Shc and phosphorylated Erk2 recruitment to lipid rafts was not maintained (Fig. 8B, lower right). In summary, Gas1 not only recruits Ret to lipid rafts in a ligand-independent manner, but also recruits Shc and phosphorylated Erk2. This modifies the protein environment of Ret, resulting in a Gas1-specific pathway downstream of Ret that blocks Akt activation.
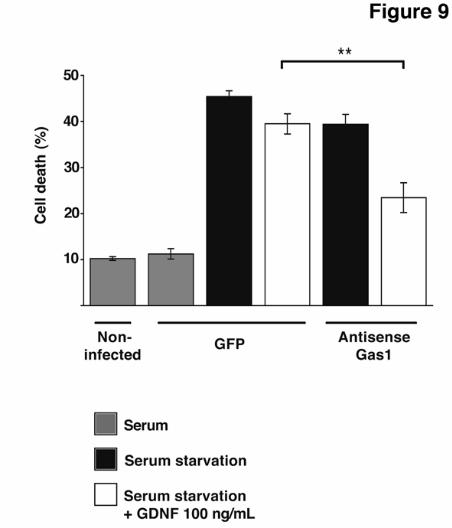
Gas1 blocks GDNF-induced survival Since Gas1 blocks GDNF-induced Akt phosphorylation, we studied the effect of endogenous Gas1 expression on GDNF-mediated cell survival after serum deprivation. We quantified cell viability after knock-down of endogenous Gas1 expression induced by serum
deprivation, using a lentivirus expressing antisense Gas1 mRNA (LV-ASgas1). We used a lentiviral vector coding for GFP (LV-GFP) as a negative control, and to monitor equivalence of infectivity between experiments, as determined by FACS. Infection with lentiviral particles had no effect on SH-SY5Y neuroblastoma cell viability compared to uninfected cells (Fig. 9 and not shown). In LV-GFP-infected cells, serum deprivation-induced cell death was only slightly modified by GDNF treatment (100 ng/ml) (Fig. 9). Knock-down of endogenously induced Gas1 in LV-ASgas1-infected cells improved cell survival only slightly. Treatment with the same GDNF concentration in Gas1 knock-down cells, however, significantly rescued neuroblastoma cells, reducing the percentage of cell death by half (Fig. 9). These data suggest that endogenous Gas1 expression counteracts the GDNF-activated survival pathway by providing a scenario in which Gas1 and Ret interaction has clear physiological consequences. DISSCUSSION
Sequence alignments, secondary structure predictions and threading analyses yielded a template suitable for building a feasible model of GAS1. The GFRα1 structure is maintained by cysteine bridges (27), and although the conservation in the alignment was low, Gas1 proteins conserve these critical residues. The E-values obtained in HMMer searches showed a high degree of reliability, and based on the biological evidence presented here, we conclude that Gas1 is related to the GDNF family receptors α. The phylogenetic analysis did not provide high confidence branches; this is expected due to the short and highly divergent nature of the sequences, but tree topology was consistent when analyses were independent. This suggests that Gas1 was separated from GFRα very early in metazoan evolution, and developed behavior different from that of GFRα The ability of Gas1 to interact with Ret in the absence of ligand reflects this early divergence, suggesting that Gas1 could have functions or partners different from those described for the GFRα
Our data suggest that Gas1 is a regulator of Ret signaling. The temporal expression patterns of these two proteins at defined developmental stages suggests a physiological function for the Gas1-Ret interaction. Gas1 and Ret are both expressed in midbrain, hindbrain and spinal cord
by guest on August 5, 2018
http://ww
w.jbc.org/
Dow
nloaded from
8
at E10-10.5 (4, 35). At E14-14.5, Gas1 and Ret are present in hindbrain, spinal cord, dorsal root ganglia, lung bronchioles, and gonads, although coexpression has not been analyzed in the different cell types in these tissues (4, 35). Another putative site for a Gas1-Ret interaction is the mouse embryonic retina. Ret is expressed strongly at E13.5 in neural retina and in the retinal pigmented epithelium, a layer in which Gas1 transcripts have been detected from E12.5 to E14.5 (43). Gas1-deficient mice show transdifferentiation of the retinal pigmented epithelium to neural retina, (43), which may indicate a Gas1 association to differentiation. Taken together, the expression data and the present results suggest that Gas1 may have an influence on Ret signaling during development.
Through the tyrosine kinase Ret, the GFL are able to activate many different signaling pathways (15). Akt and Erk are two main effectors of Ret signaling, and both proteins are usually activated together. Since Akt is associated with survival and proliferation (37), whereas Erk is implicated in differentiation and neurite outgrowth (37, 44), there must be a coordinating mechanism that permits them to mediate the different biological activities of Ret. Ectopic Gas1 expression in N2a cells suggests that Gas1 negatively regulates GDNF-induced Akt signaling, while Erk activation is increased. Transient knock-down of endogenous Gas1 in SH-SY5Y cells confirmed the ability of Gas1 to block GDNF-induced Akt phosphorylation. The role of endogenous Gas1 as a positive regulator of Erk activation has not been completely resolved, however, since induced levels of activated Erk, which are resistant to Gas1 knock-down, could be due to activation of parallel signaling pathways during serum deprivation.
In the absence of Gas1, Ret is located mainly outside rafts; following GDNF stimulation, Ret is recruited to the rafts and is tyrosine phosphorylated. Activated Ret is in equilibrium between rafts and soluble membrane, where Ret associates with the adaptors FRS2 and Shc, respectively (14). Ret downstream signaling from outside rafts seems to be less efficient, according to results using the GFRα1 (13) and Gas1 TM constructs (not shown). FRS2 and Shc both activate Akt and MAPK, eventually resulting in survival/differentiation. These two pathways are activated by the formation of different, independent complexes. One complex involves Grb2-Gab1/2 and leads to recruitment of p85, which activates the PI3K/Akt pathway;
the other, mediated by Grb2-Sos, leads to Ras/MAPK activation (39, 40).
Gas1 is located in lipid rafts and recruits Ret to these microdomains, resulting in a higher level of activated FRS2. A consequent increase in the activation of Akt and Erk would be predicted. Remarkably, the Akt pathway was inhibited, while the Erk pathway was not. To explain these modifications, it is important to consider the Gas1-induced changes that occur before GDNF stimulation; these are Ret recruitment to rafts, which promotes Ret interaction with FRS2, and the recruitment of activated Shc and Erk2. The biological significance of these later recruitment is presently unknown, but they can be mechanistically linked to the negative regulation of the PI3K/Akt pathway.
Signals through Ret activate PI3K/Akt through many different adaptors, which must be blocked by Gas1 to inhibit the PI3K/Akt pathway. One candidate mediator of this inhibition is the scaffold adaptor protein Gab1/2, which links the adaptors and the PI3K regulatory subunit p85 (15). Gab1/2 can be inhibited or activated by Erk via phosphorylation at different threonine residues. Phosphorylation of Gab1 at Thr477 enhances recruitment, whereas phosphorylation at a still unidentified threonine residue correlates with inhibition of PI3K activation (42). We observed Erk2 inhibition of Gab1/2 in the presence of Gas1 before stimulation; this could agree with existing data (39, 40), as the block in PI3K activation via Grb2-Gab1/2-p85 does not impair Grb2-Sos-Ras formation and activation of MAPK. In addition to Gab1/2, another protein(s) must participate in mediating the Gas1 block of Akt activation. Among these, we might hypothesize a protein phosphatase that rapidly inactivates Shc after GDNF stimulation in the presence of Gas1. The nature of this phosphatase, as well as of other mediators of Gas1-induced Akt inactivation, is presently unknown.
Gas1 is proapoptotic during development (4) and participates in excitotoxic neuronal death in adult brain (8). Here we show that GDNF-induced Akt phosphorylation is blocked by Gas1. GDNF-induced neuron survival and proliferation is dependent on PI3K/Akt activation and not on the Ras/Erk pathway (40, 37). Suppression of the Akt phosphorylation blockade by antisense Gas1 knock-down concurs with the improved survival effect of GDNF in serum-deprived SH-SY5Y cells. Our data show that Gas1 also modifies GDNF-induced Erk
by guest on August 5, 2018
http://ww
w.jbc.org/
Dow
nloaded from
9
activation. Erk phosphorylation is associated to differentiation (37, 44), and it is tempting to speculate that Gas1 could function as a switch between proliferation and differentiation during neuron development. In the adult brain, Erk activation has also been associated with a proapoptotic function, since in vivo inhibition of Erk activation after ischemia promotes cell survival (45). Emerging data relating Erk activation with neuron degeneration and apoptosis were recently reviewed (46). A putative dual mechanism for the proapoptotic function of Gas1 in adult brain could thus be linked to Akt blockage as well as to Erk activation.
Gas1 regulates Ret signaling in a ligand-independent manner, and our data show that SHH does not affect the Ret-Gas1 interaction. Recently, however, SHH was described to repress GDNF-induced differentiation and
migration of neural crest cells (47). Gas1 interacts with SHH (6) and with Ret; for this reason, an interaction involving SHH and Ret cannot be excluded. Gas1 blocks the cell cycle in fibroblasts (1), a cell type that does not express Ret, indicating that other transmembrane receptor(s) could also mediate the biological effects of Gas1 in different cell systems. GFRα1 is known to interact with p140 N-CAM (30), for instance, suggesting that CAM could be potential partners for Gas1 biological effects. Nevertheless, because of the early divergence between GFRα and Gas1 during evolution, this putative interaction between CAM and Gas1 must be demonstrated experimentally. The interaction between Gas1 and Ret provides a new framework to understand the functions described for Gas1 during development and neurodegeneration.
REFERENCES
1. Del Sal, G., Ruaro, M. E., Philipson, L., and Schneider, C. (1992) Cell 70, 595–607 2. Stebel, M., Vatta, P., Ruaro, M. E., Del Sal, G., Parton, R. G., and Schneider, C. (2000) FEBS
L 481, 152-158 3. Del Sal, G., Collavin, L., Ruaro, M. E., Edomi, P., Saccone, S., Della Valle, G., and
Schneider, C. (1994) Proc. Natl. Acad. Sci. 91, 1848–1852 4. Lee, K. K., Leung, A. K., Tang, M. K., Cai, D. Q., Schneider, C., Brancolini, C., and Chow, P.
H. (2001) Dev. Biol. 234, 188-203 5. Liu, Y., May, N. R., and Fan, C. M. (2001) Dev. Biol. 236, 30-45 6. Lee, C. S., Buttitta, L., and Fan, C. M. (2001) Proc. Natl. Acad. Sci. 98, 11347-11352 7. Bielke, W., Ke, G., Feng, Z., Buhrer, S., Sauer, S., and Friis, R. R. (1997) Cell Death
Different. 4, 114-124 8. Mellström, B., Ceña, V., Lamas, M., Perales, C., González, C., and Naranjo, J. R. (2002) Mol.
Cell. Neurosci. 19, 417–429 9. Airaksinen, M. S., and Saarma, M. (2002). Nat. Rev. Neurosci. 3, 383-394 10. Baloh, R. H., Enomoto, H., Johnson, E. M. Jr, and. Milbrandt, J. (2000) Curr. Opin.
Neurobiol. 10, 103–110 11. Jing, S., Wen, D., Yu, Y., Holst, P. L., Luo, Y., Fang, M., Tamir, R., Antonio, L., Hu, Z.,
Cupples, R., Louis, J. C., Hu, S., Altrock, B. W., and Fox, G. M. (1996) Cell 85, 1113-1124 12. Treanor, J. J. S, Goodman, L., de Sauvage, F., Stone, D. M., Poulsen, K. T., Beck, C. D.,
Gray, C., Armanini, M. P., Pollock, R. A., Hefti, F., Phillips, H. S., Goddard, A., Moore, M. W., Buj-Bello, A., Davies, A. M., Asai, N., Takahashi, M., Vandlen, R., Henderson, C. E. and Rosenthal, A. (1996) Nature 382, 80–83
13. Tansey, M. G., Baloh, R. H., Milbrandt, J., and Johnson, E. M. Jr (2000) Neuron 25, 611–623 14. Paratcha, G., Ledda, F., Baars, L., Coulpier, M., Besset, V., Anders, J., Scott, R., and Ibáñez,
C. F. (2001) Neuron 29, 171–184 15. Santoro, M., Carlomagno, F., Melillo, R. M., and Fusco, A. (2004) Cell. Mol. Life Sci. 61,
2954-2964 16. Park, J., Teichmann, S. A., Hubbard, T., and Chothia, C. (1997) J. Mol. Biol. 273, 349-354 17. Eddy, S. R. (1998) Bioinformatics 14, 755-763 18. Notredame, C., Higgins, D. G., and Heringa, J. (2000) J. Mol. Biol. 302, 205-217
by guest on August 5, 2018
http://ww
w.jbc.org/
Dow
nloaded from
10
19. Rost, B. (1996) Methods Enzymol. 266, 525-539 20. Bendtsen, J. D., Nielsen, H., von Heijne, G., and Brunak, S. (2004) J. Mol. Biol. 340, 783-795 21. Sonnhammer, E. L., von Heijne, G., and Krogh, A. (1998) Proc. Int. Conf. Intell. Syst. Mol.
Biol. 6, 175-182 22. Feng, D. F., and Doolittle, R. F. (1996) Methods Enzymol. 266, 368-382 23. Kumar, S., Tamura, K., Jakobsen, I. B., and Nei, M. (2001) Bioinformatics 17, 1244-1245 24. Ronquist, F., and Huelsenbeck, J. P. (2003) Bioinformatics 19, 1572-1574 25. Page, R. D. (1996) Comput. Appl. Biosci. 12, 357-358 26. Ginalski, K., Elofsson, A., Fischer, D., Rychlewski, L. (2003) Bioinformatics 19, 1015-1018 27. Leppänen, V. M., Bespalov, M. M., Runeberg-Roos, P., Puurand, U., Merits, A., Saarma, M.,
and Goldman, A. (2004) EMBO J. 23, 1452-1462 28. Schwede, T., Kopp, J., Guex, N., and Peitsch, M. C. (2003) Nucleic Acids Res. 31, 3381-3385 29. Benting, J. H., Rieveld, A. G. and Simons, K. (1999) J. Cell Biol. 146, 313-20 30. Paratcha, G., Ledda, F., and Ibáñez, C. F. (2003) Cell 113, 867-879 31. Gómez-Villafuertes, R., Torres, B., Barrio, J., Savignac, M., Gabellini, N., Rizzato, F.,
Pintado, B., Gutierrez-Adán, A., Mellström, B., Carafoli, E., and Naranjo, J.R. (2005) J. Neurosci. 47, 10822-10830
32. Gómez-Mouton, C., Abad, J. L., Mira, E., Lacalle, R. A., Gallardo, E., Jiménez-Baranda, S., Illa, I., Bernad, A., Manes , S., and Martinez-A., C. (2001) Proc. Natl. Acad. Sci. 98, 9642-9647
33. Li, Z., Wang, B., Wu, X., Cheng, S. Y., Paraoan, L. and Zhou, J. (2005) L. Neurochem. 95, 361-376
34. Thornton, J. M. (1981) J. Mol. Biol. 151, 261-287 35. Pachnis, V., Mankoo, B. and Costantini, F. (1993) Development 119, 1005-17. 36. Fukuda, T., Kiuchi K., and Takahashi M. (2002) J. Biol. Chem. 277, 19114-19121. 37. Mograbi, B., Bocciardi, R., Bourget, I., Busca, R., Rochet, N., Farahi-Far, D., Juhel, T., and
Rossi, B. (2001) J. Biol. Chem. 276, 45307–45319 38. Tsui-Pierchala, B.A., Crowder, R.J., Milbrandt, J., and Johnson, E.M. (2002) J. Biol. Chem.
277, 34618-34625. 39. Hadari, Y. R., Gotoh, N., Kouhara, H., Lax, I., and Schlessinger, J. (2001) Proc. Natl. Acad.
Sci. 98, 8578-8583 40. Besset, V., Scott, R. P., and Ibáñez, C. F. (2000) J. Biol. Chem. 275, 39159–39166 41. Paz, K., Hemi, R., LeRoith, D., Karasik, A., Elhanany, E., Kanety H., and Zick, Y. (1997) J.
Biol. Chem. 272, 29911-29918. 42. Gu, H., and Neel, B.G. (2003) Trends Cell Biology 13, 122-130. 43. Lee, C. S., May, N. R. and Fan, C. M. (2001) Dev. Biol. 236, 17-29. 44. Grimm, J., Sachs, M., Britsch, S., Di Cesare, S., Schwarz-Romond, T., Alitalo, K., and
Birchmeier, W. (2001) J. Cell Biol. 154, 345-354. 45. Alessandrini, A., Namura, S., Moskowitz, M. A., and Bonventre, J. V. (1999) Proc. Natl.
Acad. Sci. 96, 12866-12869 46. Cheung, E. C., and Slack, R. S. (2004) Sci. STKE 251, PE45 47. Fu, M., Lui, V. C., Sham, M. H., Pachnis, V., and Tam, P. K. (2004) J. Cell Biol. 166, 673-
684 FOOTNOTES We thank D. Campos for expert technical assistance, Dr. S. Gutiérrez for confocal and flow cytometry, and C. Mark for editorial help. JRC holds an FPI fellowship from the Spanish Ministry of Education; BM has a Ramon y Cajal contract. This work was supported by grants from the Madrid regional government (to BM), the DGICYT and the Human Frontiers program (to JRN). The Department of Immunology and Oncology was founded and is supported by the Spanish National Research Council (CSIC) and by Pfizer. Abbreviations used are: Gas1, growth arrest specific gene 1; GDNF, glial derived neurotrophic factor; GFRα, GDNF family receptor α; SHH, sonic hedgehog; Erk, extracellular signal regulated kinase;
by guest on August 5, 2018
http://ww
w.jbc.org/
Dow
nloaded from
11
FRS2, fibroblast receptor substrate 2; Ret, rearranged during transfection; GRAL, GDNF receptor alpha like; GPI, glycosyl-phosphatidylinositol; CAM, cell adhesion molecule; Shc, SH2-containing collagen related protein; GFP, green fluorescence protein: LDL, low density lipoprotein; TSHR, thyroglobulin stimulating hormone receptor. FIGURE LEGENDS Fig. 1. Analysis of Gas1/GFRα cysteine-rich domains. Alignment of representative sequences. The coloring scheme indicates average BLOSUM62 score (correlated to amino acid conservation) in each alignment column: cyan (>3), light red (3-1.5) and light green (1.5-0.5). Domain limits are indicated by residue positions on each side. X-ray-determined structure of the GFRα1 domain 3 (pdb-code: 1Q8D) is shown beneath the GFRα1_RAT domain 3 sequence. PHD secondary structure prediction for GAS proteins is shown beneath the Caenorhabditis elegans Gas1 domain 2 sequence (swissprot_Id: Gas1_CAEEL), with H indicating an alpha helix (violet). Sequences are named with swissprot or sptrembl identifications and, if necessary, with their common species name. The numbering after the protein name indicates domain-repeat number. The "est" prefix identifies consensus sequences reconstructed manually by assembling highly similar expressed sequence tags from identical species (conceptual translations). Fig. 2. Phylogenetic analysis of Gas1/GFRα cysteine-rich domains. (A) Phylogenetic tree of representative Gas1/GFRα. The cysteine-rich repeated domains are colored according to GFRα1 domain similarity, in light blue, orange and green for repeats 1, 2 and 3, respectively. Grey indicates domains with low clade probability. The scale-bar indicates branch length. (B) Common features in human Gas1/GFRα. Cysteine-rich repeated domains are colored according to GFRα domain branch location, as in A. Fig. 3. Comparison of cysteine-rich domains from GFRα and Gas1 proteins. (A) Ribbon representation and electrostatic surface potential map of the structure of the third cysteine-rich domain of GFR protein (PDB code: 1Q8D). (B) Ribbon representation and electrostatic surface potential map of homology model of the Gas1 protein second cysteine-rich domain. Blue indicates positively charged regions; red shows negatively charged regions. Molecules are in the same orientation. (C) Superposition of the structure of the GFRα1 protein third domain and the model of the second domain of human Gas1. Fig. 4. Gas1 interacts with Ret in a ligand-independent manner. (A) RetMyc was immunoprecipitated with a Gas1 antibody (upper panel) and Gas1 was immunoprecipitated with a Myc antibody (lower panel) from Gas1- and RetMyc-cotransfected HEK293T cells in 10% serum. (B) Scheme shows Gas1 and Gas1-TM (upper panel); signal peptide (SP), glycosyl-phosphatidylinositol anchor (GPI), human LDL receptor transmembrane domain (TM) and truncated cytosolic tail of the human LDL receptor (CT12). Gas1-TM was immunoprecipitated by an anti-Myc antibody from Gas1-TM- and RetMyc-cotransfected HEK293T cells in 10% serum (lower panel). (C) HEK293T cells were serum-deprived for 6 h. GFRα1 cotransfected with RetMyc was immunoprecipitated using a Myc antibody only in the presence of GDNF (upper panel); Gas1 was immunoprecipitated in the absence or presence of its ligand SHH (lower panel). (D) Ret was immunoprecipitated from E14 mouse brain extract and Gas1 was detected by western blot (upper panel). Gas1 was immunoprecipitated from E14 mouse brain extract and Ret was detected by western blot (lower panel). Control for all immunoprecipitations were performed in parallel blots using the same cell extracts under identical conditions. Fig. 5. Gas1 does not modify the 125I-GDNF-GFRα1-RetMyc complex. Crosslinking in HEK293T cells transfected with different expression vectors after addition of 125I-GDNF. Gas1 (lane 2), RetMyc (lane 4), or both (cotransfected; lane 5) did not bind to 125I-GDNF. Cells transfected with GFRα1 (lane 3) or cotransfected with GFRα1 and RetMyc (lane 6) showed ~85 and 200 kDa bands, corresponding
by guest on August 5, 2018
http://ww
w.jbc.org/
Dow
nloaded from
12
to the respective complexes as indicated. We detected no modification of the complexes after cotransfection with Gas1, GFRα1 and RetMyc (lane 7). Fig. 6. Gas1 modifies GDNF-GFRα1-induced Ret downstream signaling. (A) N2a cells were transfected with Gas1 or GFRα1, serum-deprived, and Ret phosphorylation was analyzed. Gas1 induced no Ret phosphorylation, whereas transfection with GFRα1 and stimulation with GDNF resulted in Ret phosphorylation. (B) N2a cells were transfected with GFRα1 or cotransfected with GFRα1 and Gas1, then serum-deprived and stimulated with GDNF. Phosphorylation of Ret, Erk and Akt was analyzed by immunoprecipitation and immunoblotting. (C) Gas1 induction in SH-SY5Y cells after serum deprivation. Gas1 mRNA was measured by real-time quantitative RT-PCR (upper panel), and Gas1 protein synthesis increase was analyzed by immunoblotting after immunoprecipitation. (D) SH-SY5Y cells were serum-deprived for 3 h (absence of Gas1) or 24 h (Gas1-expressing cells), stimulated with GDNF, and phosphorylation of Ret, Erk and Akt was analyzed. (E) SH-SY5Y cells were infected with GFP- or antisense Gas1-expressing lentivirus, serum-deprived for 24 h, stimulated with GDNF, and phosphorylation of Ret, Erk and Akt was analyzed. Fold-induction in B, C and D was analyzed as detailed in Experimental Procedures. Fig. 7. Ret is recruited to lipid rafts in the presence of Gas1. (A) N2a or SK-S3 cells were transfected with Gas1+GFRα1 or Gas1, respectively, and serum deprived. Flotation gradients were prepared and fractions analyzed by immunoblotting. (B) Ret recruitment to rafts was analyzed in SK-S3 cells. In empty vector-transfected cells, Ret is recruited only in the presence of GDNF (upper and lower left panels). Gas1 promotes strong Ret recruitment to the first fraction, with or without ligand (upper and lower right panels). (C) Detergent resistent and soluble membrane preparations from transfected N2a cells were used for the analysis of Ret phosphorylation. Cells expressing Gas1 showed higher levels of Ret phosphorylation in the detergent resistent fraction (upper panel) with a corresponding reduction in the soluble fraction (lower panel). Fig. 8. Gas1 modifies the profile of adaptor proteins in lipid rafts. (A) Transfected N2a cells were serum-deprived and stimulated with GDNF. After immunoprecipitation with an anti-FRS2 antibody, FRS2 phosphorylation (left panel) was analyzed by immunoblotting with a phosphotyrosine-specific antibody. Phosphorylation of Shc (right panel) was analyzed by immunoblotting using a specific anti-phosphoShc antibody. (B) Flotation gradients prepared from transfected N2a cells, serum-deprived and GDNF-stimulated, were analyzed by immunoblotting. In cells transfected with GFRα1 alone, recruitment of nonphosphorylated Erk2 was neither detected before nor after GNDF stimulation (upper and lower left panels). Cells transfected with Gas1 and GFRα1 showed Shc and activated Erk2 recruitment to lipid rafts prior to GDNF stimulation (upper right). After GDNF stimulation, the pattern of raft recruitment was similar to that in GFRα1-only-transfected cells (lower right). Fig. 9. Gas1 blocks GDNF-induced survival. SH-SY5Y cells were infected, serum deprived to induce Gas1, then GDNF-treated. Results are the mean of two experiments performed in quadruplicate. ** p<0.01.
by guest on August 5, 2018
http://ww
w.jbc.org/
Dow
nloaded from
Mañes, Jose R. Naranjo and Britt MellströmJorge Ruben Cabrera, Luis Sanchez-Pulido, Ana M. Rojas, Alfonso Valencia, Santos
and regulates ret signalingαGAS1 is related to the GDNF family receptors
published online March 20, 2006J. Biol. Chem.
10.1074/jbc.M509572200Access the most updated version of this article at doi:
Alerts:
When a correction for this article is posted•
When this article is cited•
to choose from all of JBC's e-mail alertsClick here
by guest on August 5, 2018
http://ww
w.jbc.org/
Dow
nloaded from