FORMULAE & TABLES FOR STAT 1123 FINAL EXAM 1123... · FORMULAE & TABLES FOR STAT 1123 FINAL EXAM ....
10
STAT 1123 Final Exam Page 1 of 10 FORMULAE & TABLES FOR STAT 1123 FINAL EXAM μ: population mean, x : sample mean; x = n x n i i ∑ =1 , where n: sample size σ: population standard deviation, s: sample standard deviation; s = ( ) 1 1 2 − − ∑ = n x x n i i Confidence interval for μ when σ is known: x – Z n σ < μ < x + Z n σ LCL = x – Z n σ , UCL = x + Z n σ Sample size: n = 2 × E Z σ Confidence interval for μ when σ is unknown: n s t x n s t x + < < − µ , df = n – 1 LCL = x – t n s , UCL = x + t n s Testing Hypothesis about μ: Test statistics: Z = n x σ µ − , if σ is known. Or, t = n s x µ − , if σ is unknown, degree of freedom = n – 1. Test Statistics for Two Independent Samples: ( ) ( ) available. are and if , 2 1 2 2 2 1 2 1 2 1 2 1 σ σ σ σ µ µ n n x x Z + − − − = (Note: (μ 1 – μ 2 ) = 0).
Transcript of FORMULAE & TABLES FOR STAT 1123 FINAL EXAM 1123... · FORMULAE & TABLES FOR STAT 1123 FINAL EXAM ....

STAT 1123 Final Exam
Page 1 of 10
FORMULAE & TABLES FOR STAT 1123 FINAL EXAM
µ: population mean, x : sample mean; x = n
xn
ii∑
=1 , where n: sample size
σ: population standard deviation, s: sample standard deviation; s =
( )
11
2
−
−∑=
n
xxn
ii
Confidence interval for μ when σ is known: x – Znσ < µ < x + Z
nσ
LCL = x – Znσ , UCL = x + Z
nσ
Sample size: n = 2
×
EZ σ
Confidence interval for μ when σ is unknown: nstx
nstx +<<− µ , df = n – 1
LCL = x – tns , UCL = x + t
ns
Testing Hypothesis about μ:
Test statistics: Z =
n
xσµ− , if σ is known.
Or, t =
ns
x µ− , if σ is unknown, degree of freedom = n – 1.
Test Statistics for Two Independent Samples:
( ) ( ) available. are and if, 21
2
22
1
21
2121 σσσσ
µµ
nn
xxZ+
−−−= (Note: (µ1 – µ2) = 0).
STAT 1123 Final Exam
Page 2 of 10
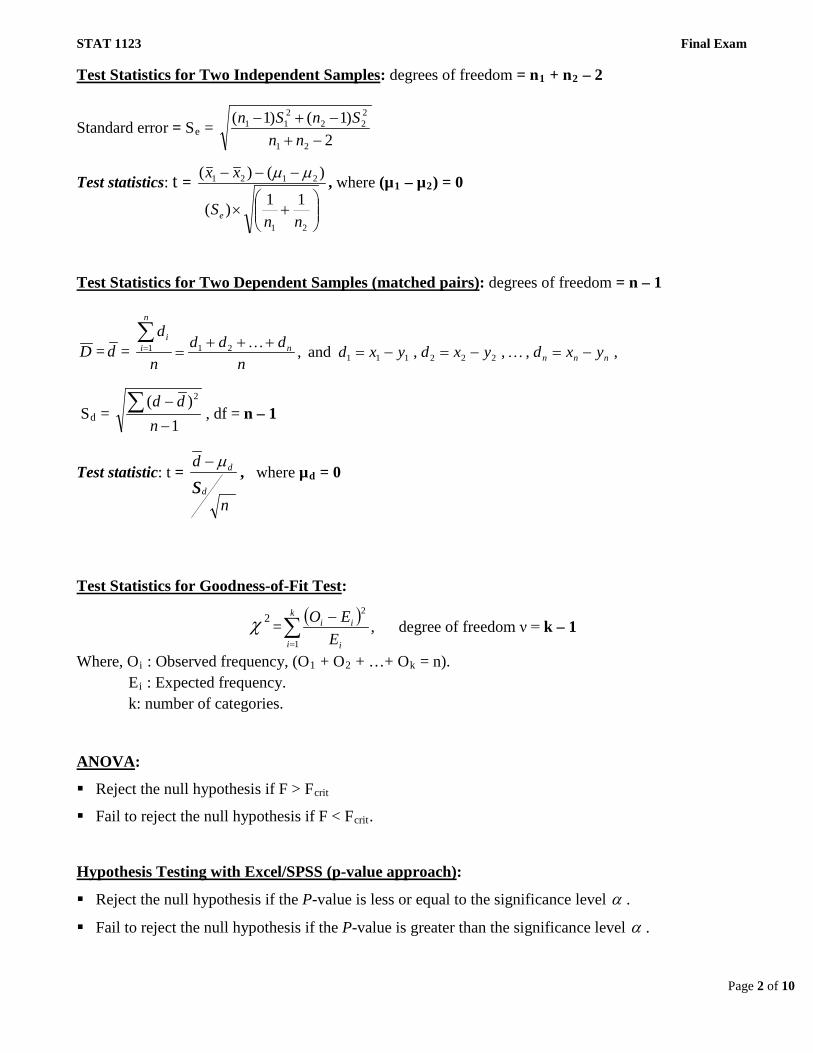
Test Statistics for Two Independent Samples: degrees of freedom = n1 + n2 – 2
Standard error = Se = 2
)1()1(
21
222
211
−+−+−
nnSnSn
Test statistics: t =
+×
−−−
21
2121
11)(
)()(
nnS
xx
e
µµ , where (µ1 – µ2) = 0
Test Statistics for Two Dependent Samples (matched pairs): degrees of freedom = n – 1
D = d = ,,,, and , 222111211
nnnn
n
ii
yxdyxdyxdn
dddn
d−=−=−=
+++=
∑= 2
2
Sd = 1
)( 2
−−∑
ndd
, df = n – 1
Test statistic: t =
n
dsd
dµ− , where µd = 0
Test Statistics for Goodness-of-Fit Test:
2χ = ( )∑=
−k
i i
ii
EEO
1
2
, degree of freedom ν = k – 1
Where, Oi : Observed frequency, (O1 + O2 + …+ Ok = n). Ei : Expected frequency. k: number of categories. ANOVA:
Reject the null hypothesis if F > Fcrit
Fail to reject the null hypothesis if F < Fcrit. Hypothesis Testing with Excel/SPSS (p-value approach):
Reject the null hypothesis if the P-value is less or equal to the significance level α .
Fail to reject the null hypothesis if the P-value is greater than the significance level α .
STAT 1123 Final Exam
Page 3 of 10
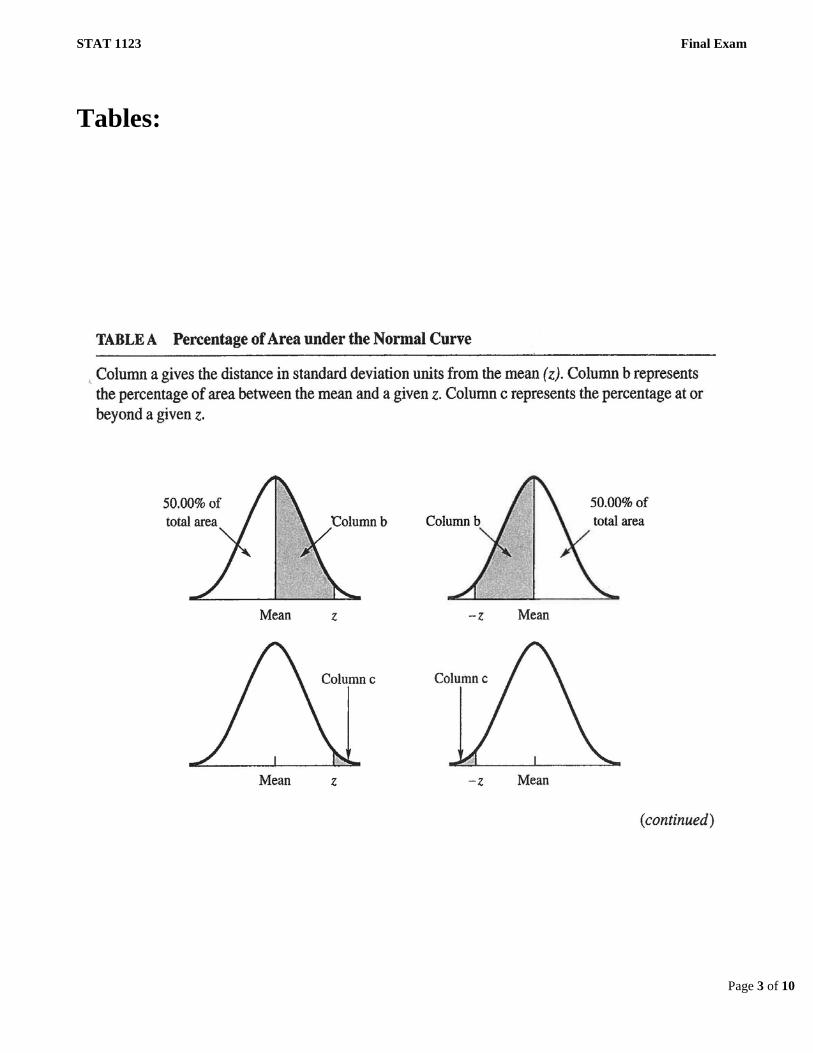
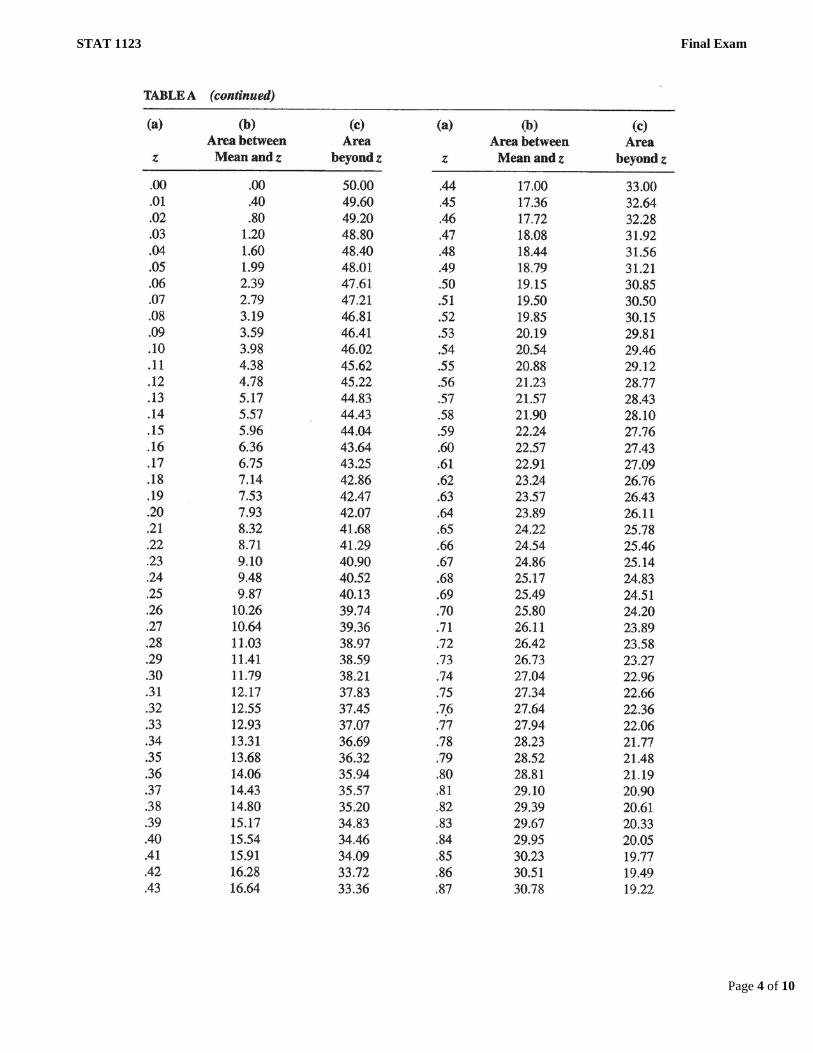
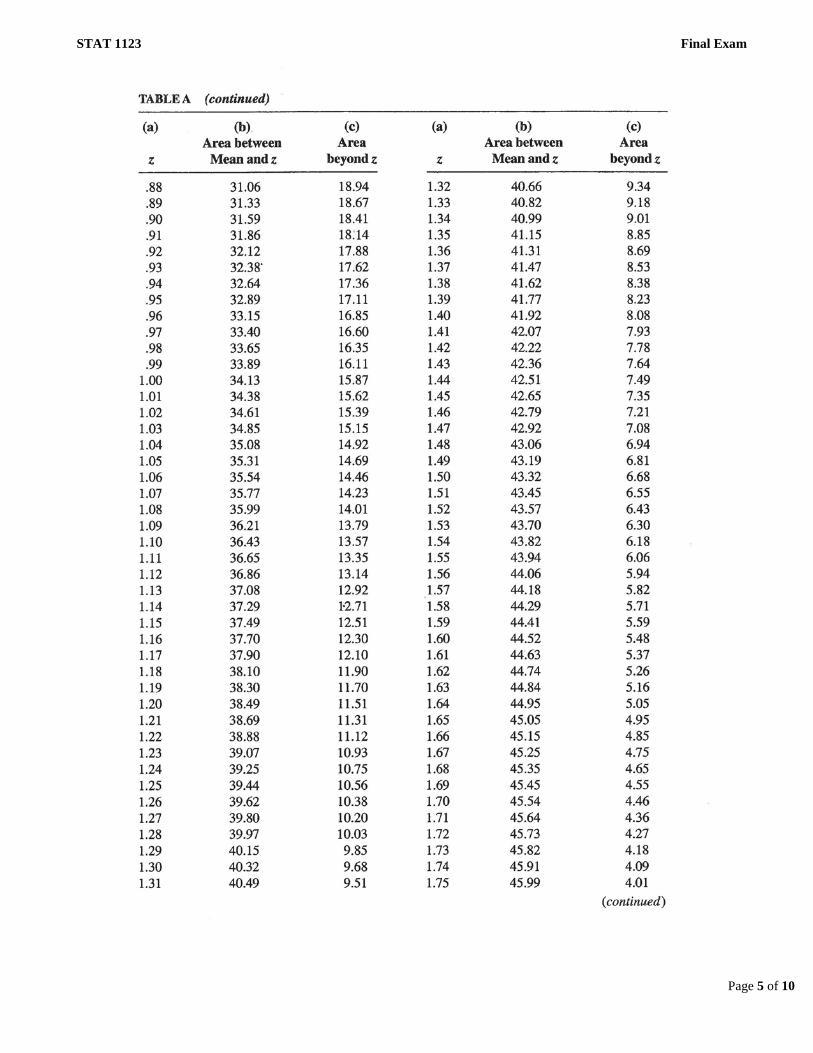
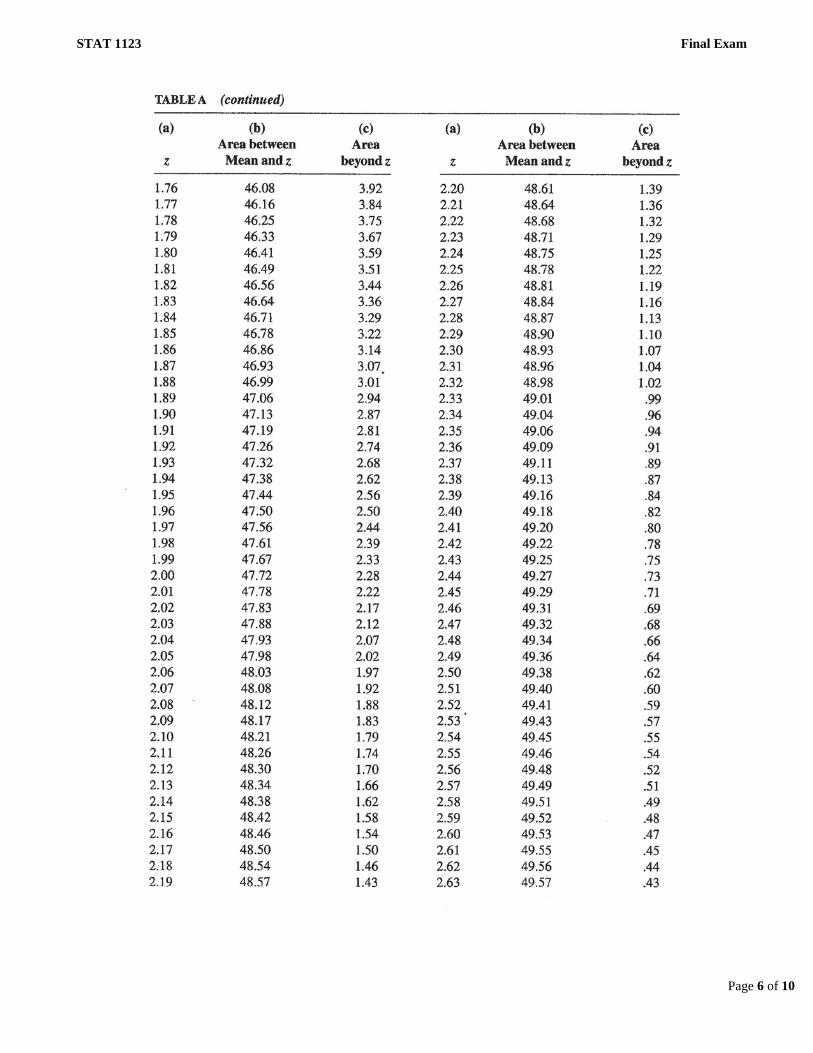
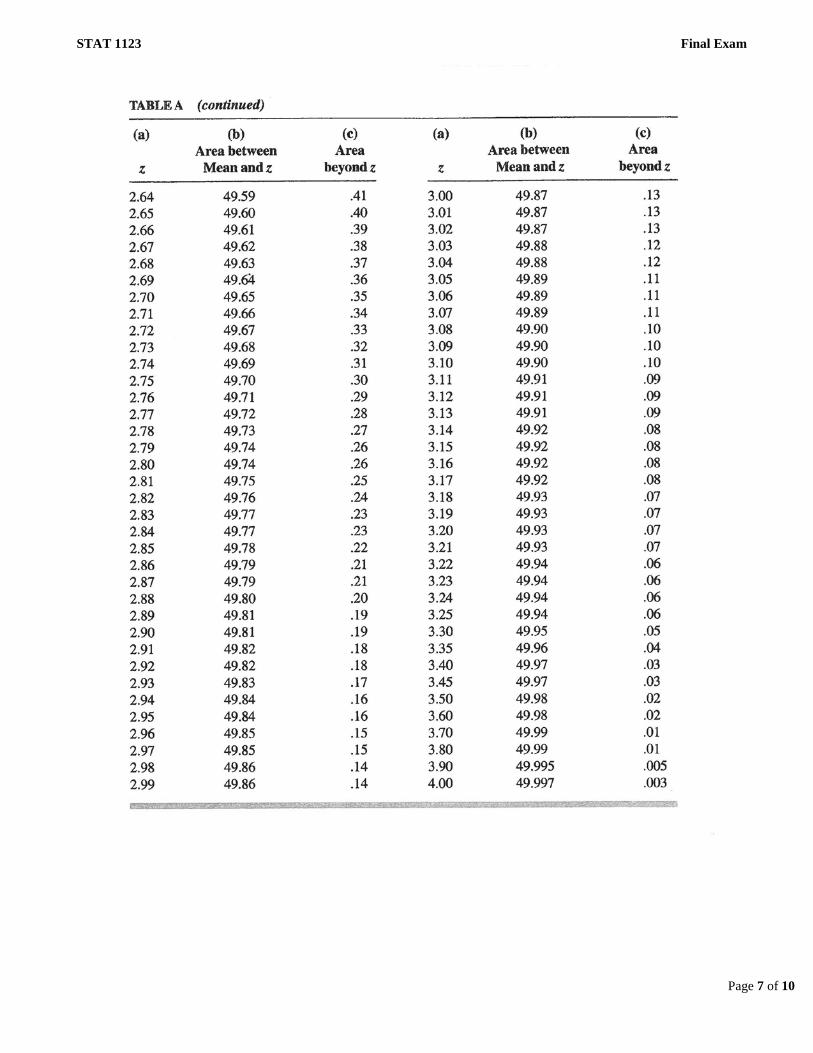
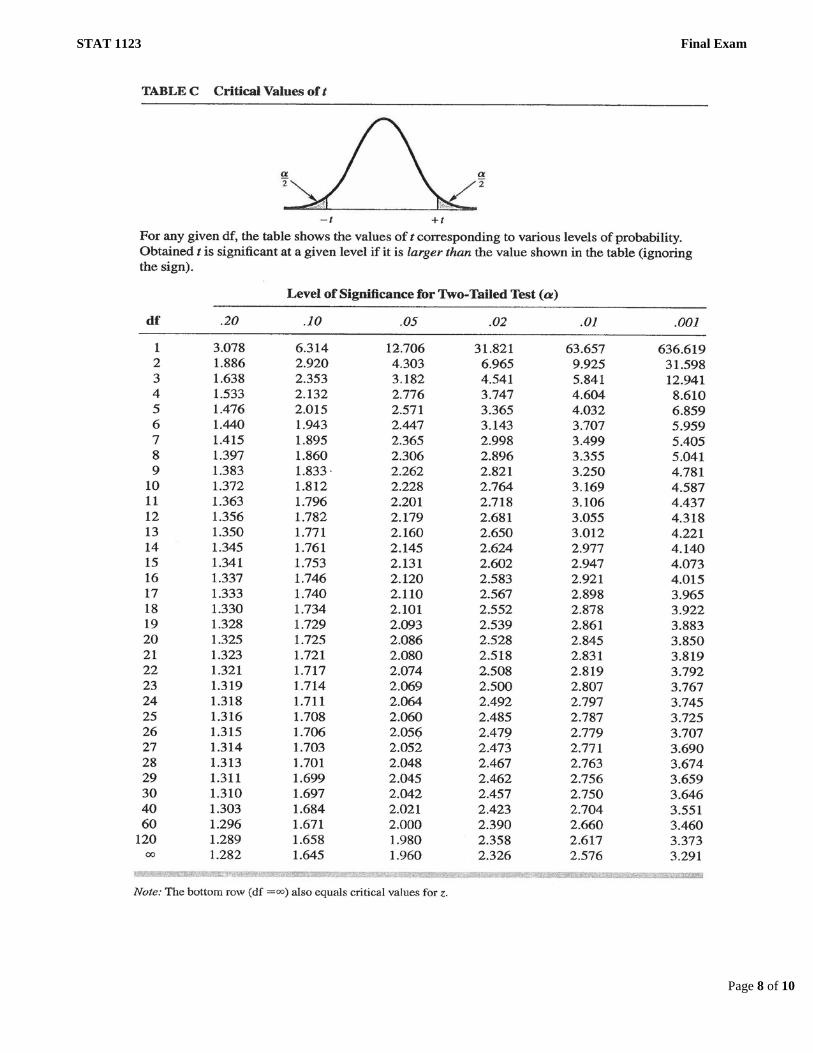
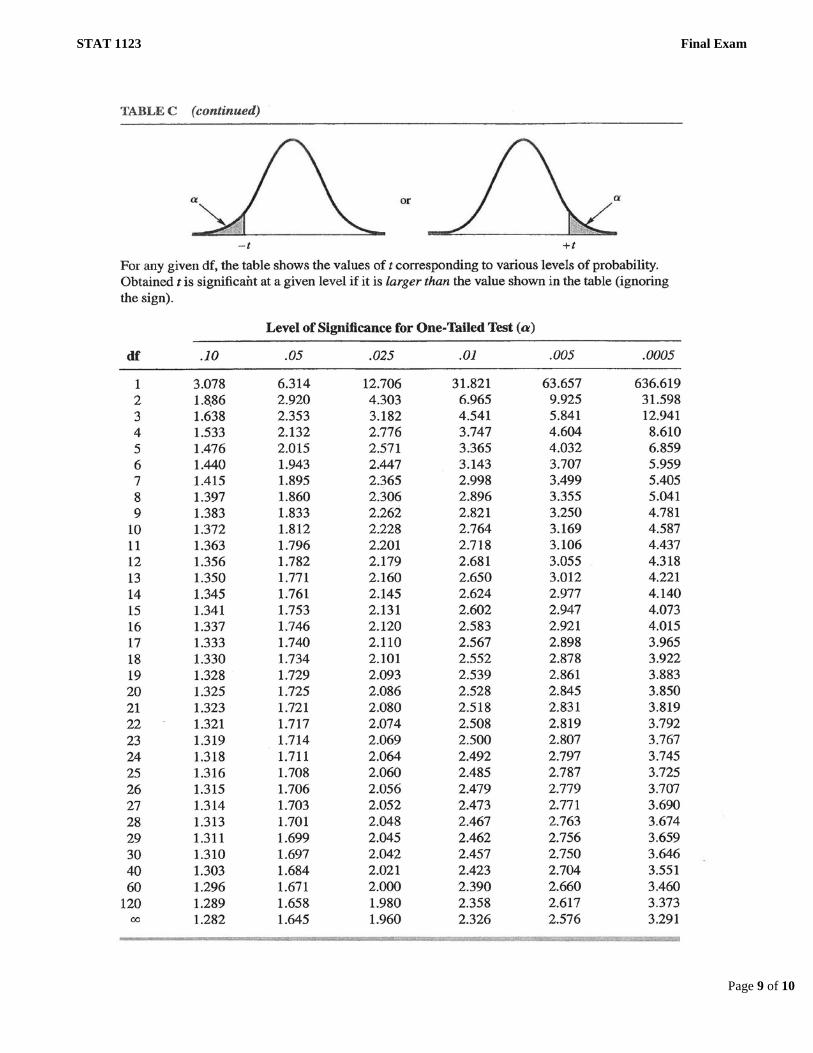
Tables:
STAT 1123 Final Exam
Page 4 of 10
STAT 1123 Final Exam
Page 5 of 10
STAT 1123 Final Exam
Page 6 of 10
STAT 1123 Final Exam
Page 7 of 10
STAT 1123 Final Exam
Page 8 of 10
STAT 1123 Final Exam
Page 9 of 10
STAT 1123 Final Exam
Page 10 of 10
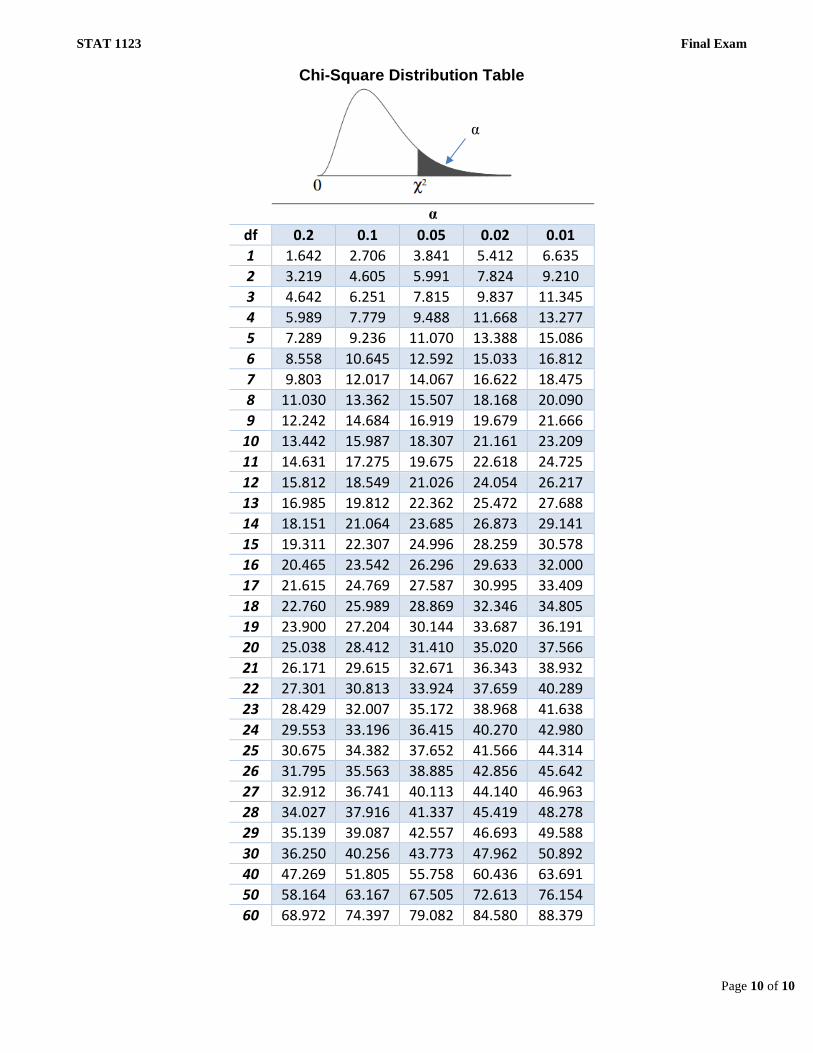
Chi-Square Distribution Table
α
df 0.2 0.1 0.05 0.02 0.01 1 1.642 2.706 3.841 5.412 6.635 2 3.219 4.605 5.991 7.824 9.210 3 4.642 6.251 7.815 9.837 11.345 4 5.989 7.779 9.488 11.668 13.277 5 7.289 9.236 11.070 13.388 15.086 6 8.558 10.645 12.592 15.033 16.812 7 9.803 12.017 14.067 16.622 18.475 8 11.030 13.362 15.507 18.168 20.090 9 12.242 14.684 16.919 19.679 21.666
10 13.442 15.987 18.307 21.161 23.209 11 14.631 17.275 19.675 22.618 24.725 12 15.812 18.549 21.026 24.054 26.217 13 16.985 19.812 22.362 25.472 27.688 14 18.151 21.064 23.685 26.873 29.141 15 19.311 22.307 24.996 28.259 30.578 16 20.465 23.542 26.296 29.633 32.000 17 21.615 24.769 27.587 30.995 33.409 18 22.760 25.989 28.869 32.346 34.805 19 23.900 27.204 30.144 33.687 36.191 20 25.038 28.412 31.410 35.020 37.566 21 26.171 29.615 32.671 36.343 38.932 22 27.301 30.813 33.924 37.659 40.289 23 28.429 32.007 35.172 38.968 41.638 24 29.553 33.196 36.415 40.270 42.980 25 30.675 34.382 37.652 41.566 44.314 26 31.795 35.563 38.885 42.856 45.642 27 32.912 36.741 40.113 44.140 46.963 28 34.027 37.916 41.337 45.419 48.278 29 35.139 39.087 42.557 46.693 49.588 30 36.250 40.256 43.773 47.962 50.892 40 47.269 51.805 55.758 60.436 63.691 50 58.164 63.167 67.505 72.613 76.154 60 68.972 74.397 79.082 84.580 88.379
α