Statistics PSY302 Quiz Chapters 16 & 17. 1. Alpha α is also known as: A.The null hypopthesis B.Chi...
26
Statistics PSY302 Quiz Chapters 16 & 17
-
Upload
judith-brooks -
Category
Documents
-
view
217 -
download
0
Transcript of Statistics PSY302 Quiz Chapters 16 & 17. 1. Alpha α is also known as: A.The null hypopthesis B.Chi...
Statistics PSY302 Quiz Chapters 16 & 17
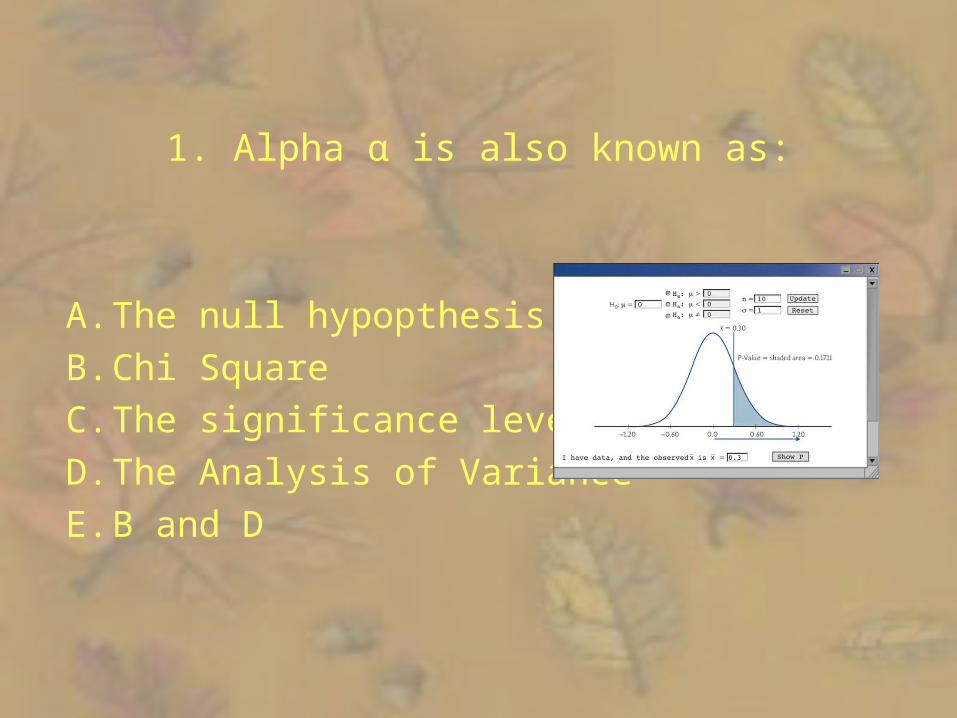
1. Alpha α is also known as:
A. The null hypopthesis
B. Chi Square
C. The significance level
D. The Analysis of Variance
E. B and D
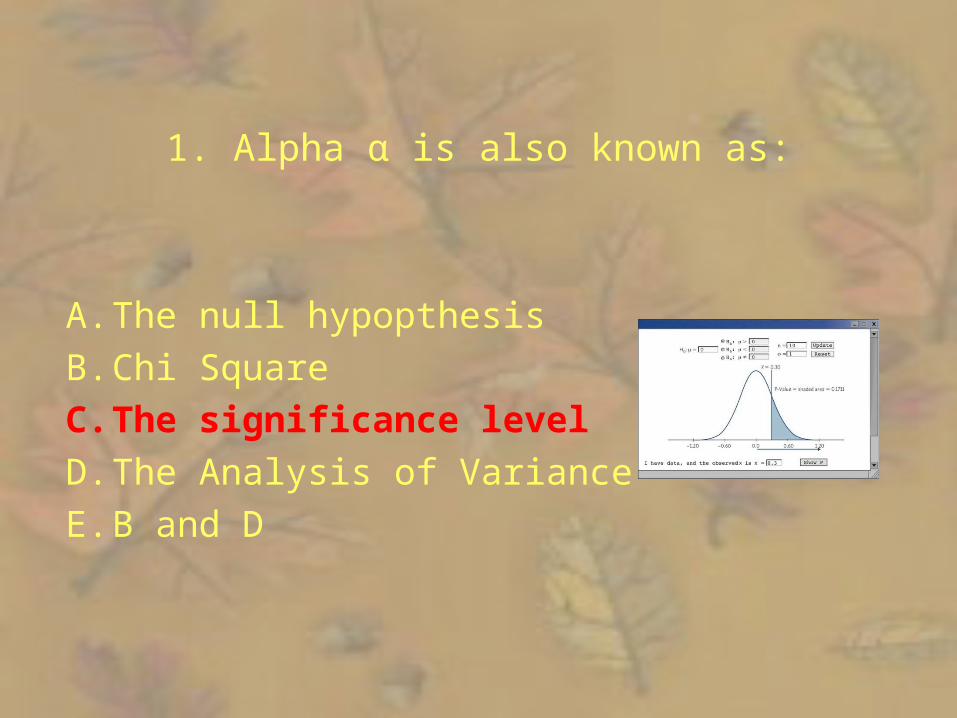
1. Alpha α is also known as:
A. The null hypopthesis
B. Chi Square
C. The significance level
D. The Analysis of Variance
E. B and D
2. The ____ tells us the likelihood of getting a value as high as the test statistic by chance.
• null hypothesis• margin of error• P-value• sampling distribution• confidence interval
2. The ____ tells us the likelihood of getting a value as high as the test statistic by chance.
• null hypothesis• margin of error• P-value• sampling distribution• confidence interval
3. It the p-value is ______, then we say the data are statistically significant.
• Equal to the mean• as small as or smaller than α• Greater than the obtained
statistic• Larger than alpha• greater than .05
3. It the p-value is ______, then we say the data are statistically significant.
• Equal to the mean• as small as or smaller than α• Greater than the obtained
statistic• Larger than alpha• greater than .05
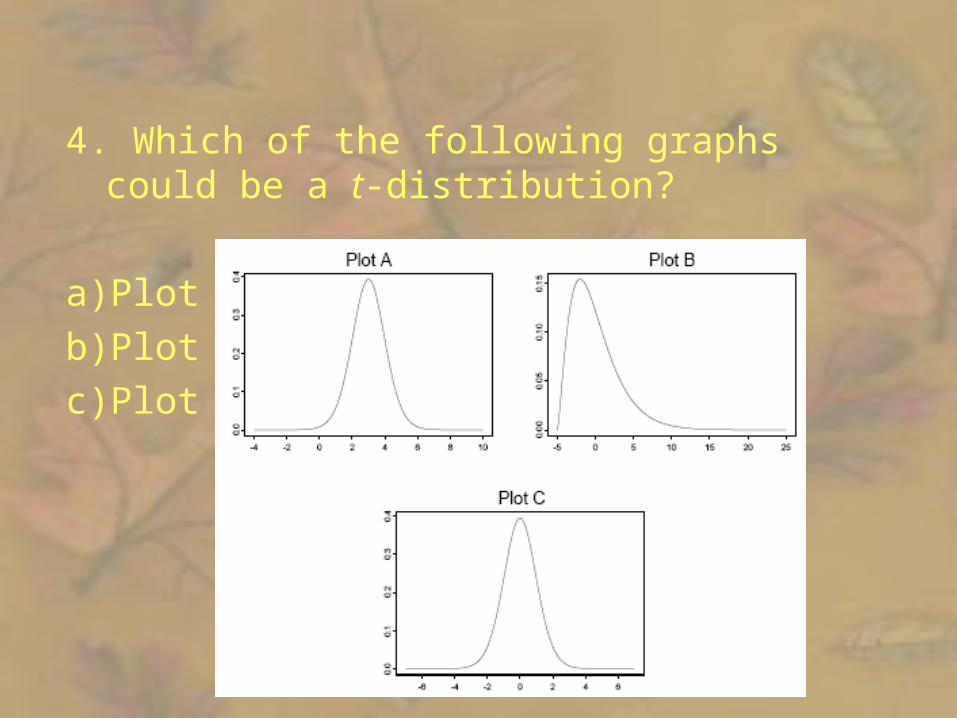
4. Which of the following graphs could be a t-distribution?
a) Plot A
b) Plot B
c) Plot C
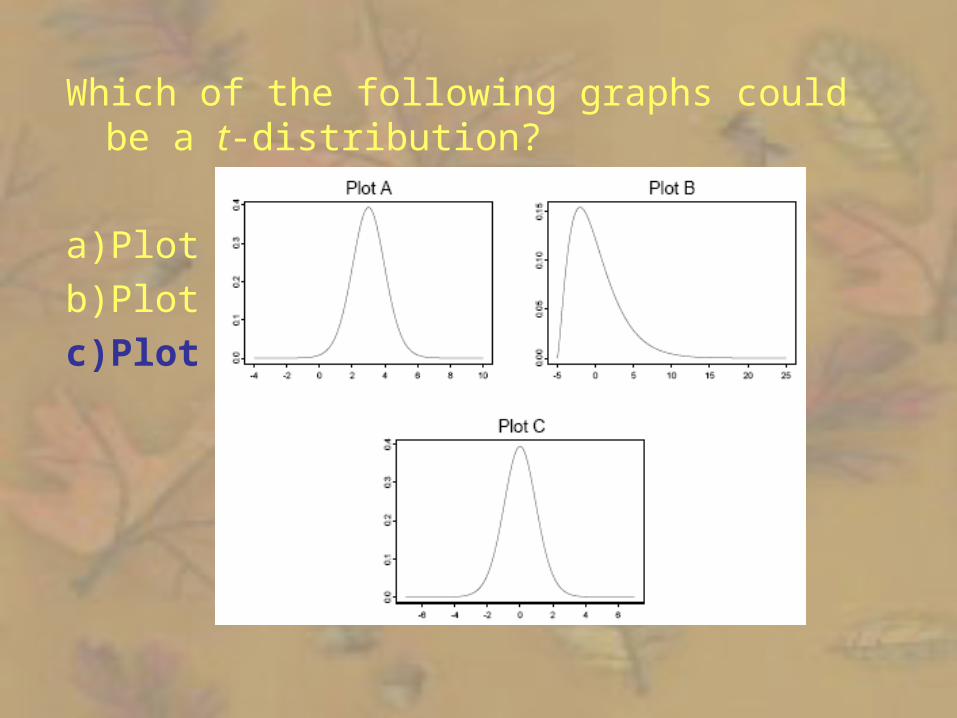
Which of the following graphs could be a t-distribution?
a) Plot A
b) Plot B
c) Plot C
4. We use t scores when:
1. We want to talk about values rather than a claim about the relationship
2. We want to predict the value3. The population standard deviation is unknown4. We are concerned about chance5. We have categorical data
4. We use t scores when:
1. We want to talk about values rather than a claim about the relationship
2. We want to predict the value3. The population standard deviation is unknown4. We are concerned about chance5. We have categorical data
5. The proper T distribution is decided by:
1. The P-value2. The significance level3. The confidence interval4. Degrees of freedom5. Square root of N.
5. The proper T distribution is decided by:
1. The P-value2. The significance level3. The confidence interval4. Degrees of freedom5. Square root of N.
6. To compare the responses to the two treatments in _____ design, apply the one-sample
t procedures to the observed differences.
1. P-value2. significance level3. confidence interval4. Degrees of freedom5. Matched pairs
6. To compare the responses to the two treatments in _____ design, apply the one-sample
t procedures to the observed differences.
1. P-value2. significance level3. confidence interval4. Degrees of freedom5. Matched pairs
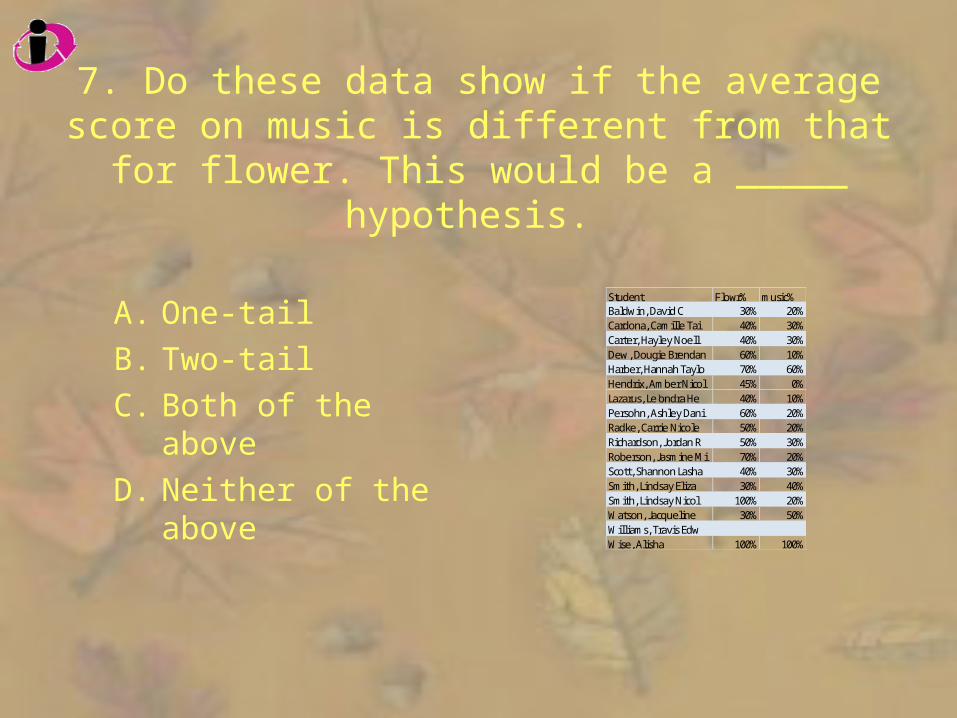
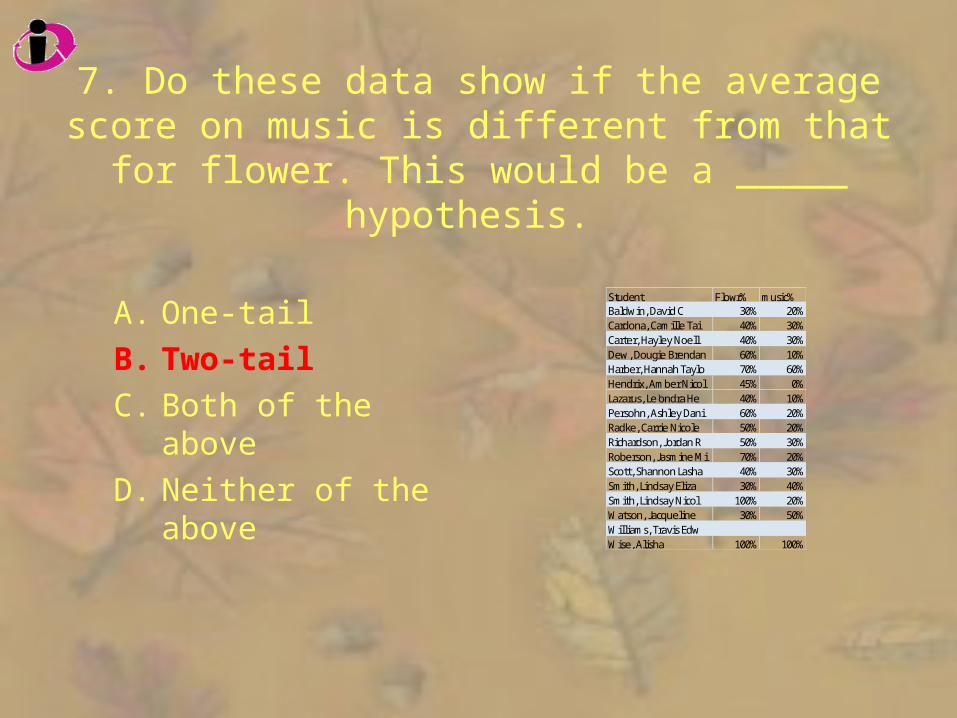
7. Do these data show if the average score on music is different from that for flower. This would
be a _____ hypothesis.
A. One-tail
B. Two-tail
C. Both of the above
D. Neither of the above
Student Flowr% music%Baldwin, David C 30% 20%Cardona, Camille Tai 40% 30%Carter, Hayley Noell 40% 30%Dew, Dougie Brendan 60% 10%Harber, Hannah Taylo 70% 60%Hendrix, Amber Nicol 45% 0%Lazarus, Le'ondra He 40% 10%Persohn, Ashley Dani 60% 20%Radke, Carrie Nicole 50% 20%Richardson, Jordan R 50% 30%Roberson, Jasmine Mi 70% 20%Scott, Shannon Lasha 40% 30%Smith, Lindsay Eliza 30% 40%Smith, Lindsay Nicol 100% 20%Watson, Jacqueline 30% 50%Williams, Travis EdwWise, Alisha 100% 100%
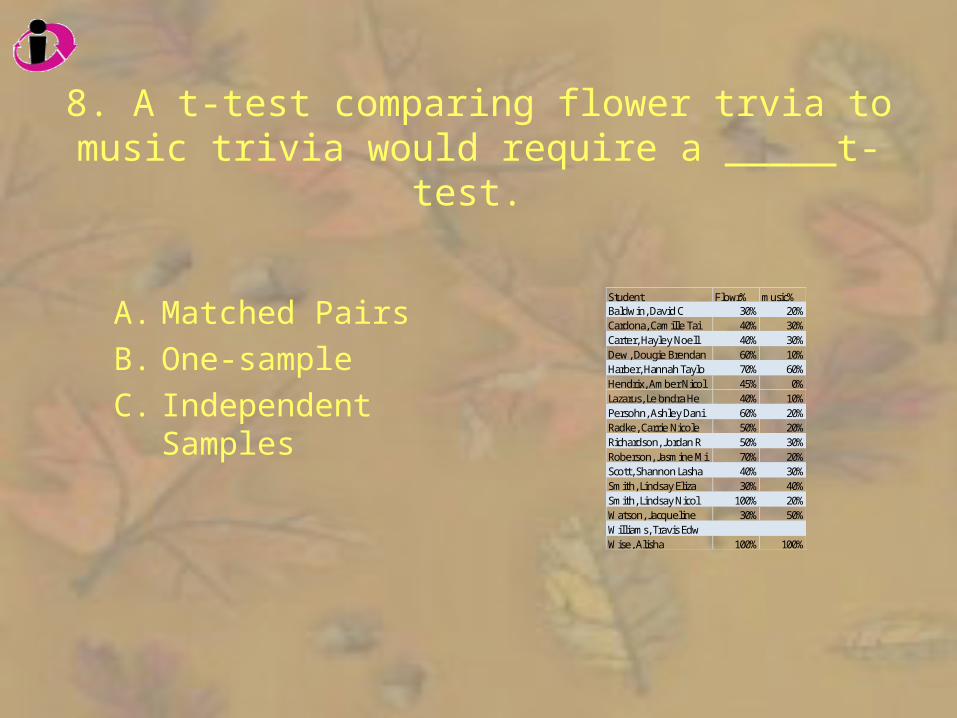
8. A t-test comparing flower trvia to music trivia would require a _____t-test.
A. Matched Pairs
B. One-sample
C. Independent Samples
Student Flowr% music%Baldwin, David C 30% 20%Cardona, Camille Tai 40% 30%Carter, Hayley Noell 40% 30%Dew, Dougie Brendan 60% 10%Harber, Hannah Taylo 70% 60%Hendrix, Amber Nicol 45% 0%Lazarus, Le'ondra He 40% 10%Persohn, Ashley Dani 60% 20%Radke, Carrie Nicole 50% 20%Richardson, Jordan R 50% 30%Roberson, Jasmine Mi 70% 20%Scott, Shannon Lasha 40% 30%Smith, Lindsay Eliza 30% 40%Smith, Lindsay Nicol 100% 20%Watson, Jacqueline 30% 50%Williams, Travis EdwWise, Alisha 100% 100%
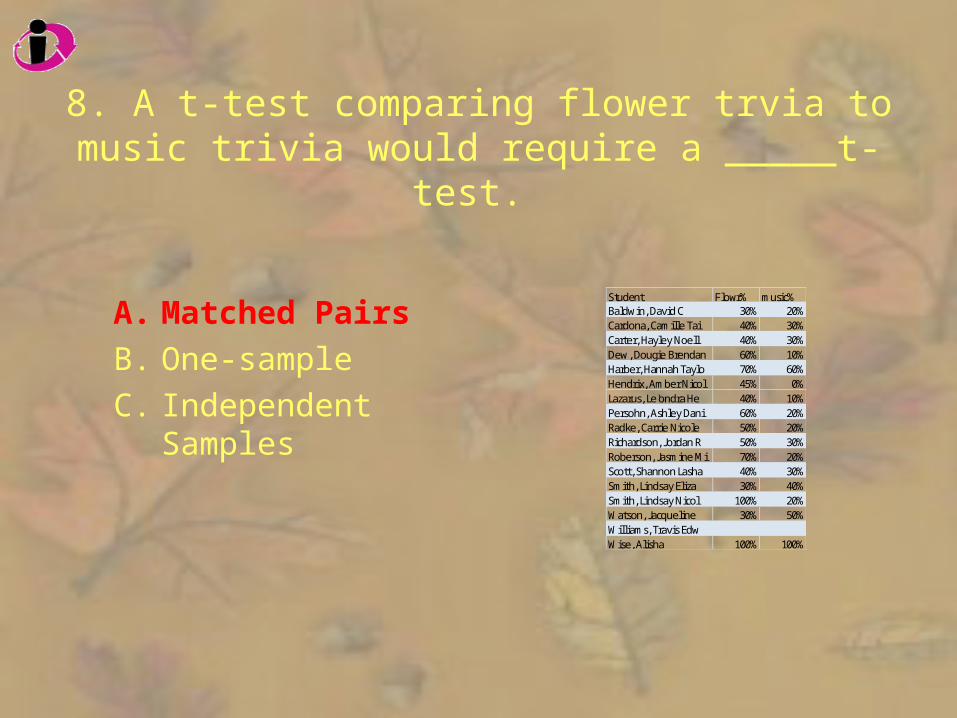
8. A t-test comparing flower trvia to music trivia would require a _____t-test.
A. Matched Pairs
B. One-sample
C. Independent Samples
Student Flowr% music%Baldwin, David C 30% 20%Cardona, Camille Tai 40% 30%Carter, Hayley Noell 40% 30%Dew, Dougie Brendan 60% 10%Harber, Hannah Taylo 70% 60%Hendrix, Amber Nicol 45% 0%Lazarus, Le'ondra He 40% 10%Persohn, Ashley Dani 60% 20%Radke, Carrie Nicole 50% 20%Richardson, Jordan R 50% 30%Roberson, Jasmine Mi 70% 20%Scott, Shannon Lasha 40% 30%Smith, Lindsay Eliza 30% 40%Smith, Lindsay Nicol 100% 20%Watson, Jacqueline 30% 50%Williams, Travis EdwWise, Alisha 100% 100%
9. A Z score of .50 means
1. 50 points above the average of the sample
2. Way, way above average
3. One half a standard deviation above the mean
4. All of the above
9. A Z score of .50 means
1. 50 points above the average of the sample
2. Way, way above average
3. One half a standard deviation above the mean
4. All of the above
10. Degrees of freedom is determined by:
1. The variance2. Sample size3. The square root of n4. T distribution5. The null hypothesis
10. Degrees of freedom is determined by:
1. The variance2. Sample size3. The square root of n4. T distribution5. The null hypothesis
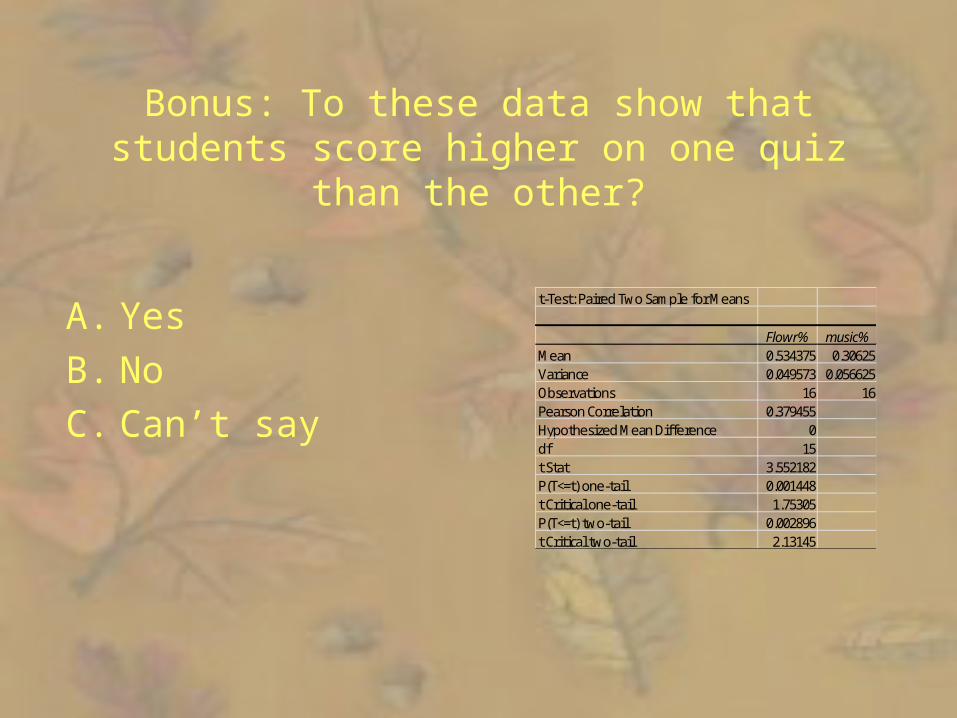
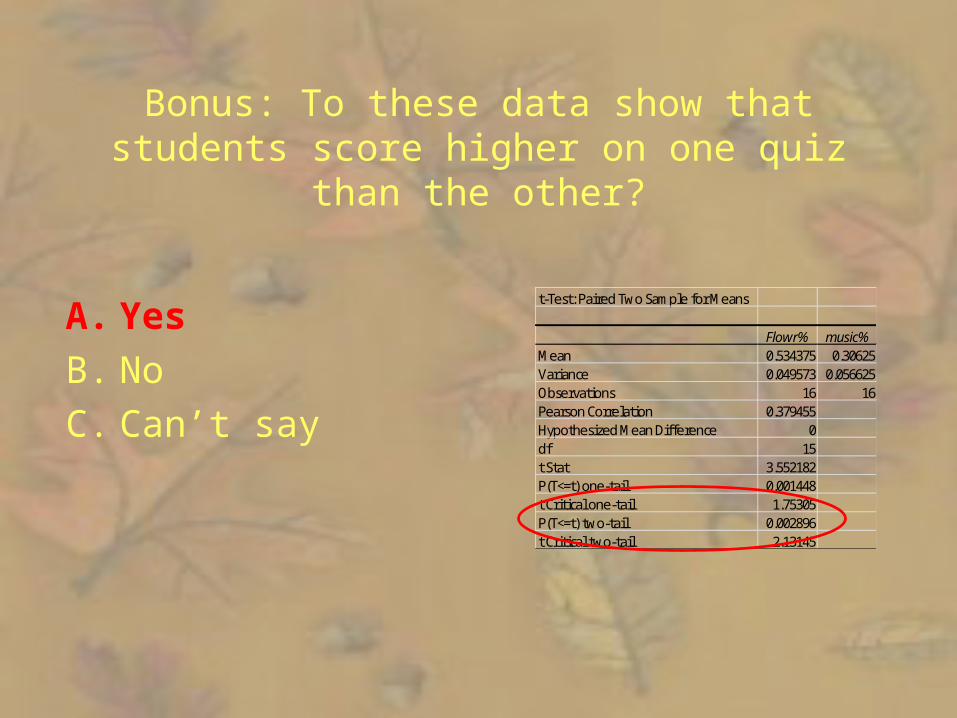
Bonus: To these data show that students score higher on one quiz than the other?
A. Yes
B. No
C. Can’t say
t-Test: Paired Two Sample for Means
Flowr% music%Mean 0.534375 0.30625Variance 0.049573 0.056625Observations 16 16Pearson Correlation 0.379455Hypothesized Mean Difference 0df 15t Stat 3.552182P(T<=t) one-tail 0.001448t Critical one-tail 1.75305P(T<=t) two-tail 0.002896t Critical two-tail 2.13145