FOODIMA EU Food Industry Dynamics and Methodological Advances Task 1.2 Market structure of the Food...
31
FOODIMA FOODIMA EU Food Industry Dynamics and EU Food Industry Dynamics and Methodological Methodological Advances Advances Task 1.2 Market structure of the Food Supply Chain in the EU κosτas κaranτininis & Luljeta Hajderllari
-
Upload
kathryn-ferguson -
Category
Documents
-
view
213 -
download
0
Transcript of FOODIMA EU Food Industry Dynamics and Methodological Advances Task 1.2 Market structure of the Food...
FOODIMAFOODIMAEU Food Industry Dynamics and EU Food Industry Dynamics and
MethodologicalMethodologicalAdvancesAdvances
Task 1.2 Market structure of the Food Supply Chain in the EU
κosτas κaranτininis&
Luljeta Hajderllari
In-depth Picture and Evaluation of the Market Structure, Concentration and
Competition of the Food Supply Chain in the EU
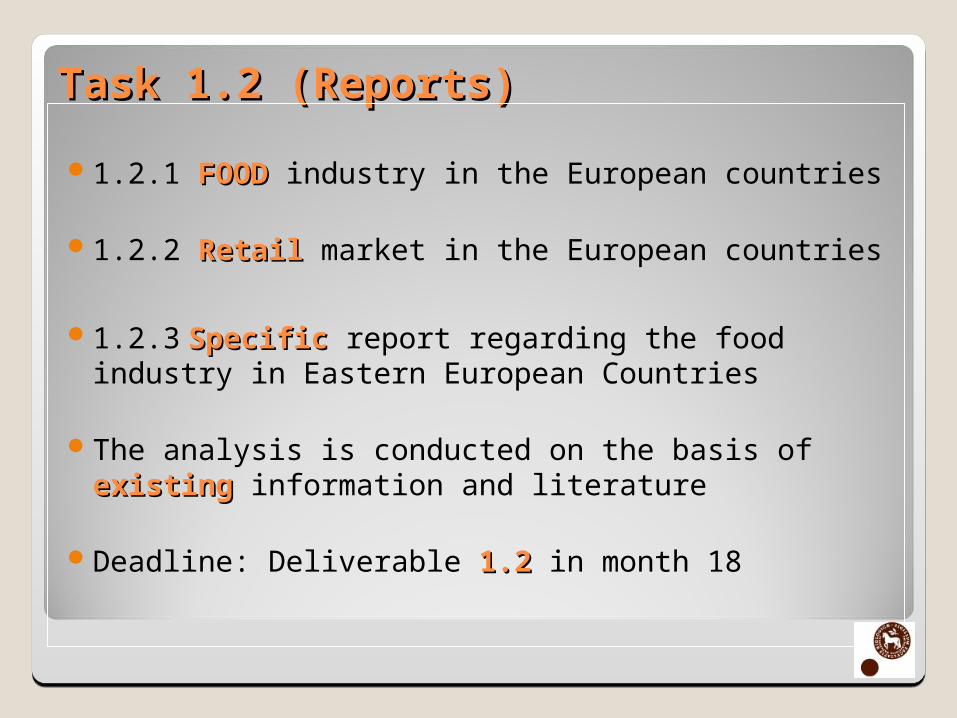
Task 1.2 (Reports)Task 1.2 (Reports)
1.2.1 FOOD FOOD industry in the European countries
1.2.2 Retail Retail market in the European countries
1.2.3 Specific Specific report regarding the food industry in Eastern European Countries
The analysis is conducted on the basis of existing existing information and literature
Deadline: Deliverable 1.21.2 in month 18
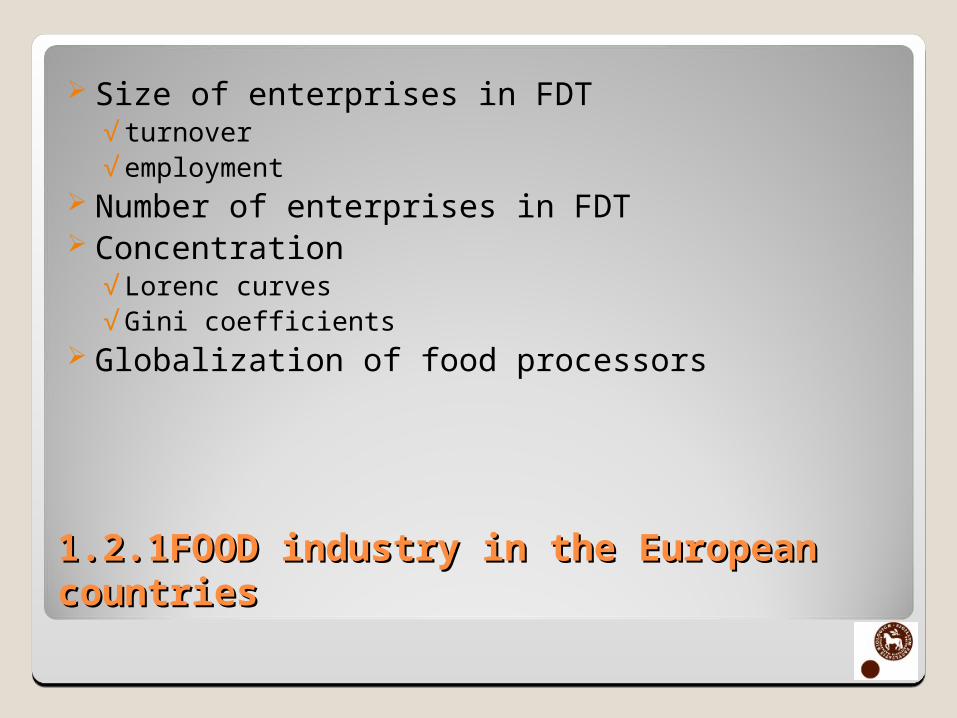
Size of enterprises in FDT√turnover√employment
Number of enterprises in FDT Concentration
√Lorenc curves√Gini coefficients
Globalization of food processors
1.2.1FOOD industry in the European 1.2.1FOOD industry in the European countriescountries
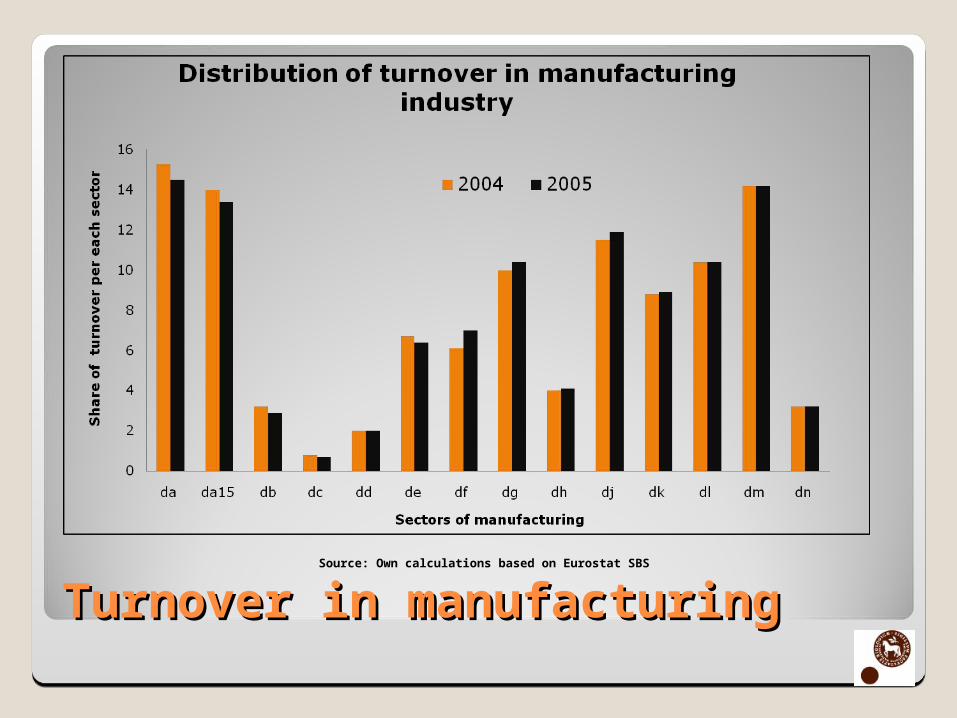
Turnover in manufacturingTurnover in manufacturingSource: Own calculations based on Eurostat SBS
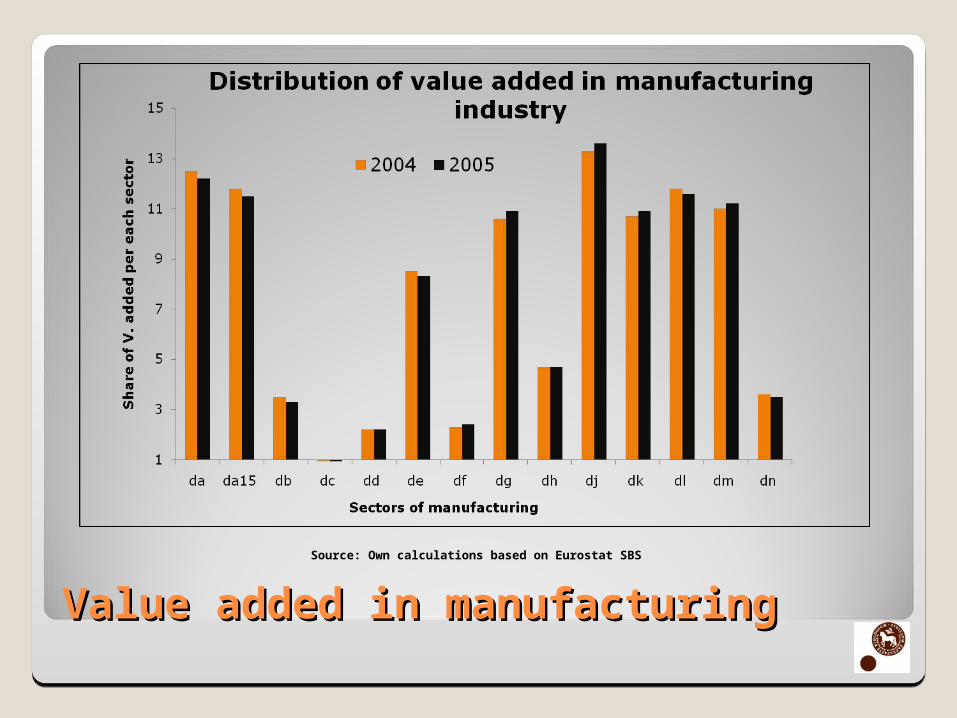
Value added in manufacturingValue added in manufacturingSource: Own calculations based on Eurostat SBS
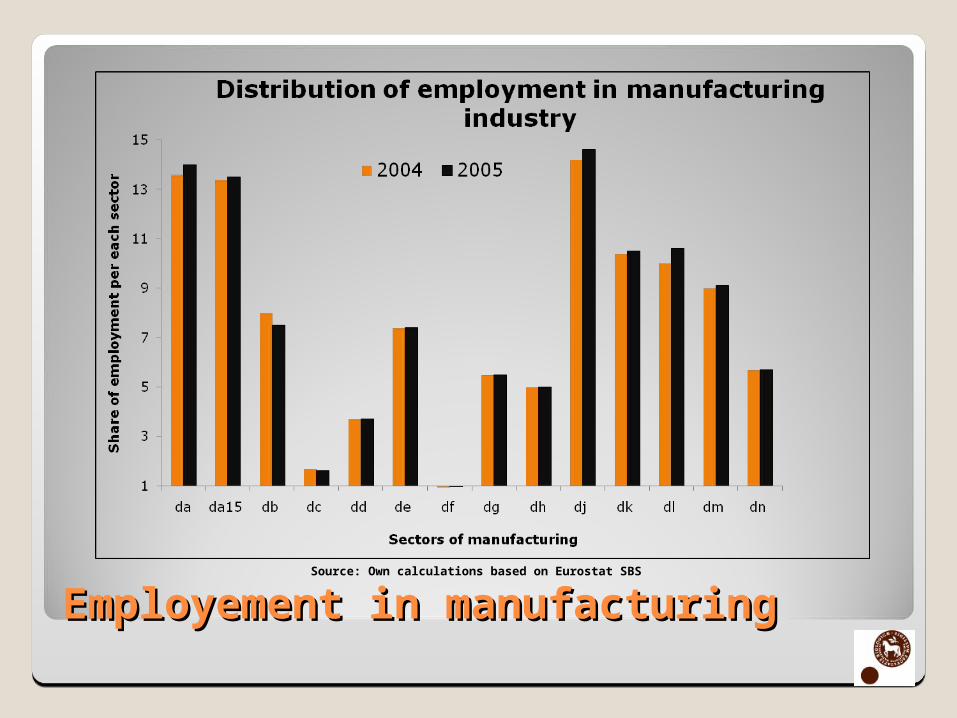
Employement in manufacturingEmployement in manufacturingSource: Own calculations based on Eurostat SBS
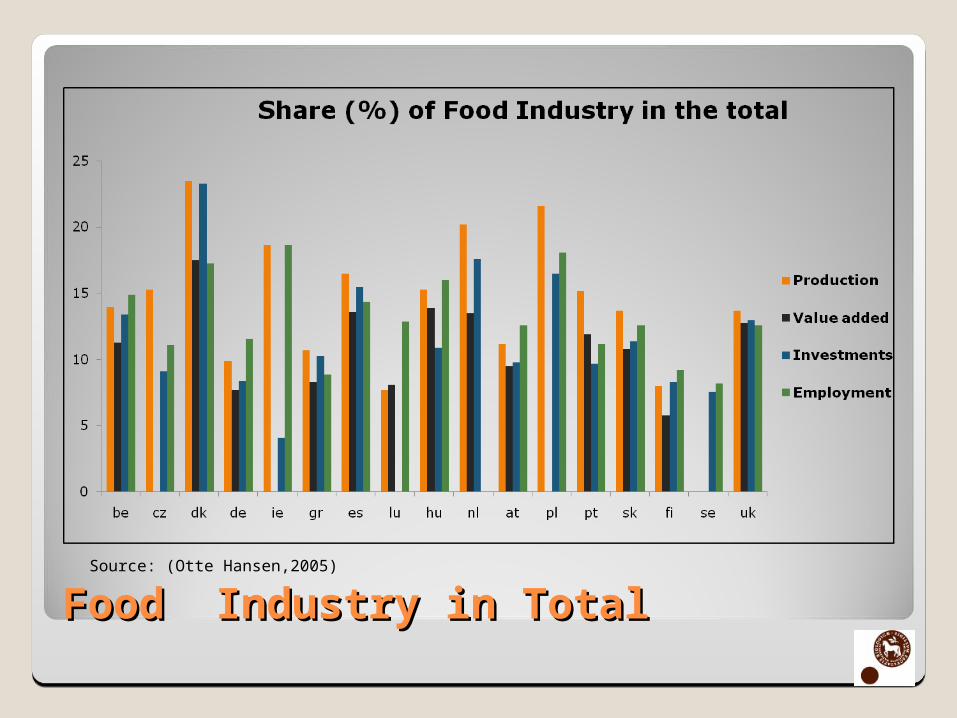
Food Industry in Total Food Industry in Total Source: (Otte Hansen,2005)
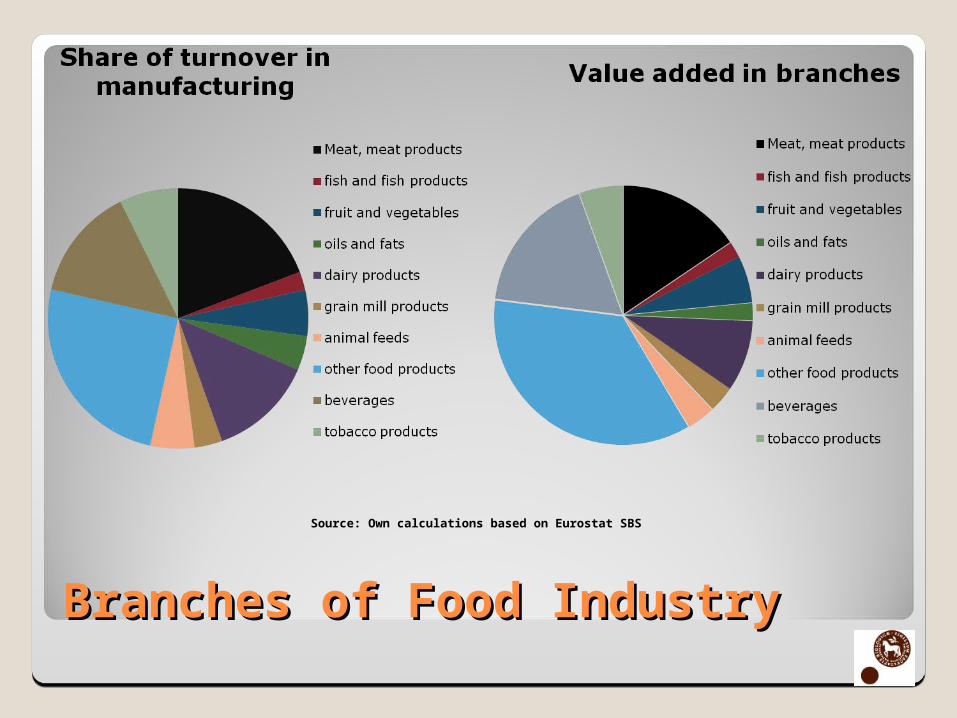
Branches of Food IndustryBranches of Food Industry
Source: Own calculations based on Eurostat SBS
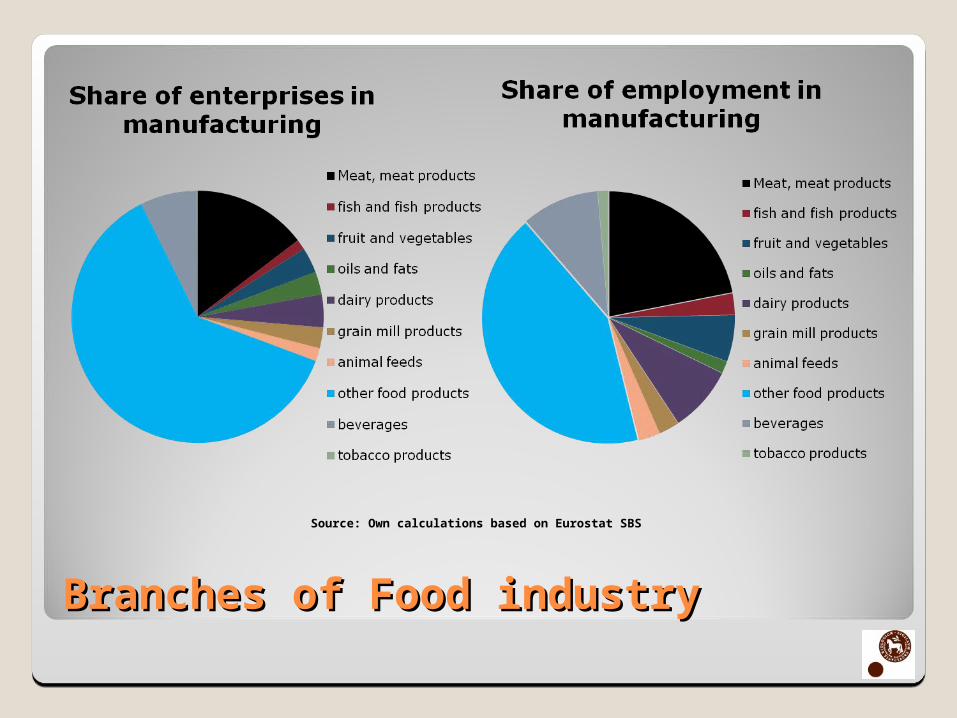
Branches of Food industryBranches of Food industry
Source: Own calculations based on Eurostat SBS
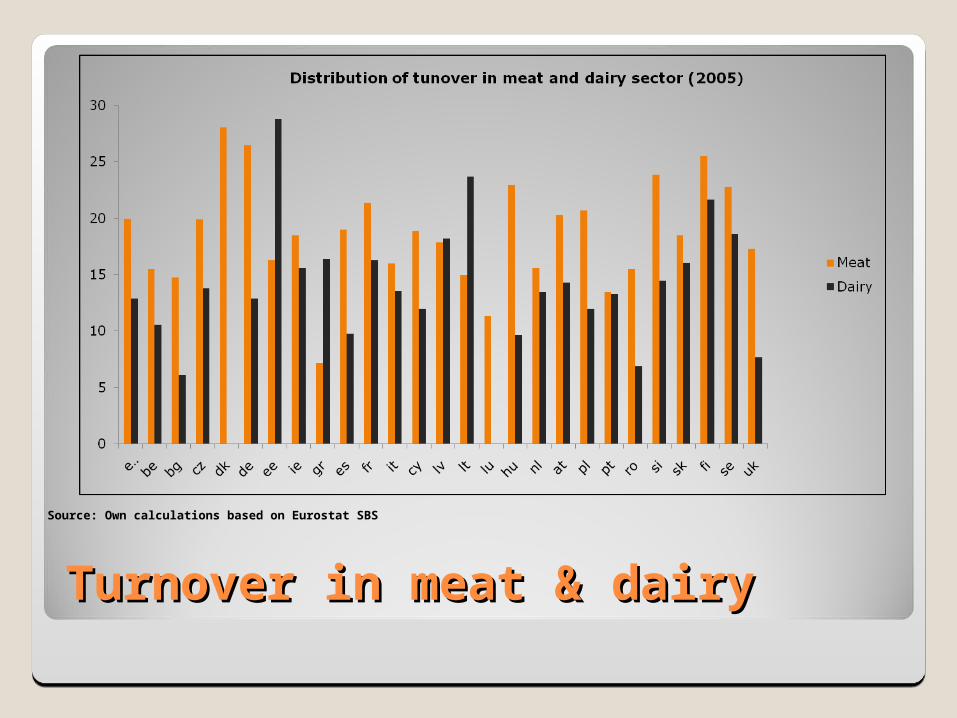
Turnover in meat & dairyTurnover in meat & dairy
Source: Own calculations based on Eurostat SBS
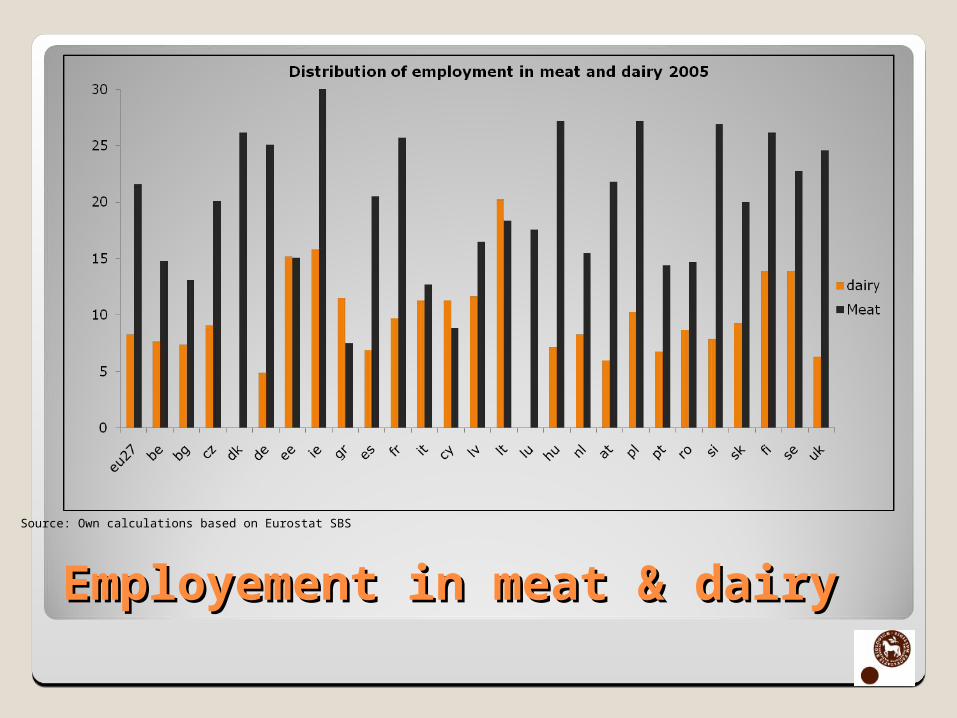
Employement in meat & dairyEmployement in meat & dairy
Source: Own calculations based on Eurostat SBS
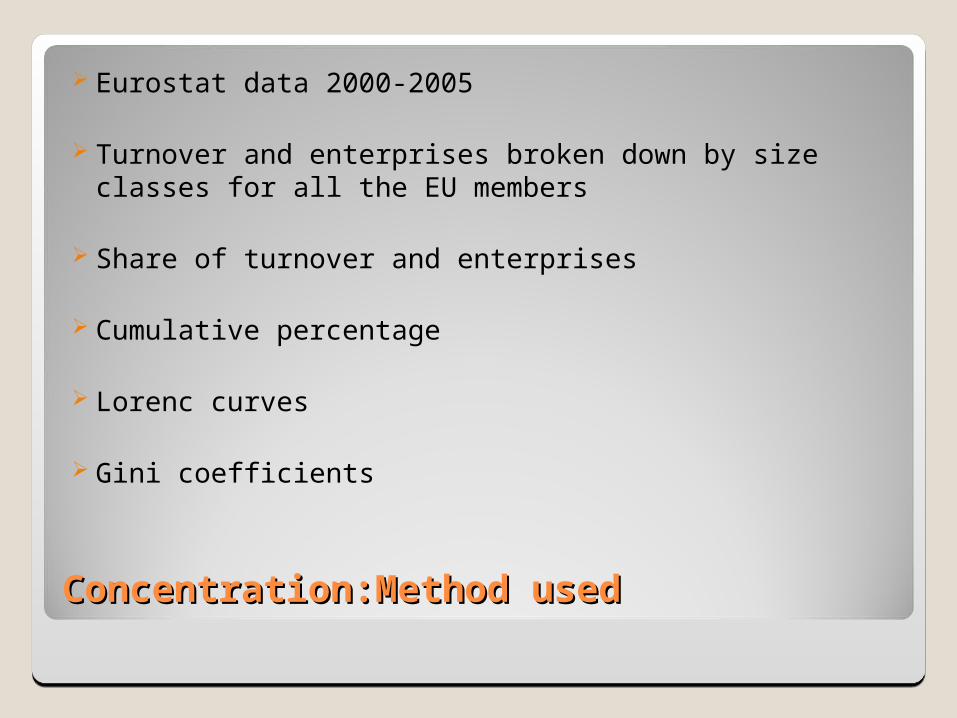
Concentration:Method usedConcentration:Method used
Eurostat data 2000-2005
Turnover and enterprises broken down by size classes for all the EU members
Share of turnover and enterprises
Cumulative percentage
Lorenc curves
Gini coefficients
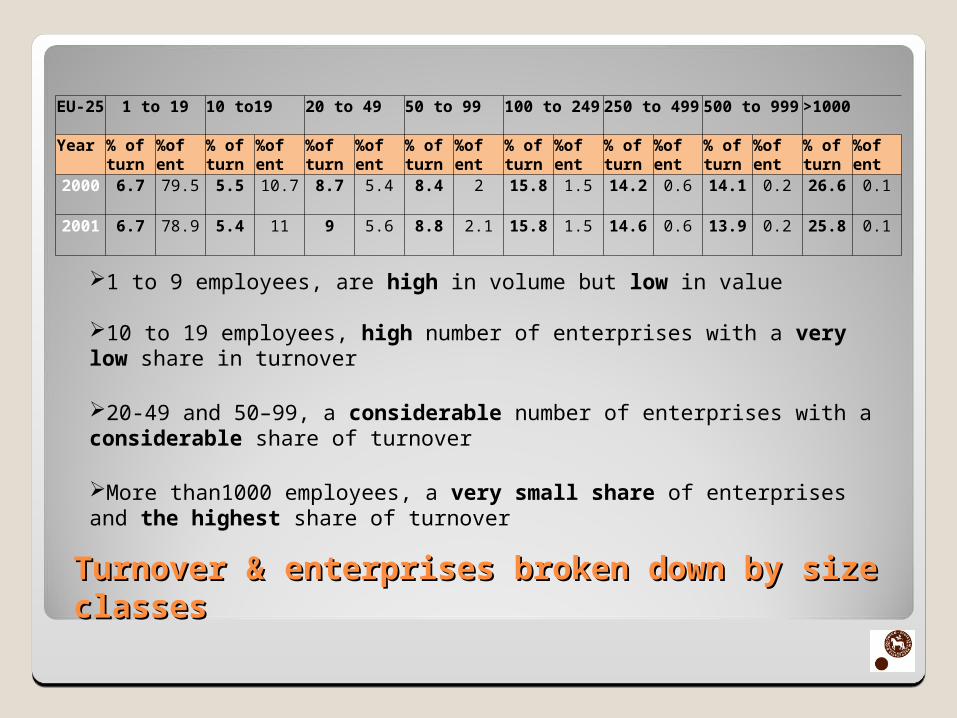
EU-25 1 to 19 10 to19 20 to 49 50 to 99 100 to 249 250 to 499 500 to 999 >1000
Year % of turn
%of ent
% of turn
%of ent
%of turn
%of ent
% of turn
%of ent
% of turn
%of ent
% of turn
%of ent
% of turn
%of ent
% of turn
%of ent
2000 6.7 79.5 5.5 10.7 8.7 5.4 8.4 2 15.8 1.5 14.2 0.6 14.1 0.2 26.6 0.1
2001 6.7 78.9 5.4 11 9 5.6 8.8 2.1 15.8 1.5 14.6 0.6 13.9 0.2 25.8 0.1
1 to 9 employees, are high in volume but low in value
10 to 19 employees, high number of enterprises with a very low share in turnover
20-49 and 50–99, a considerable number of enterprises with a considerable share of turnover
More than1000 employees, a very small share of enterprises and the highest share of turnover
Turnover & enterprises broken down by size Turnover & enterprises broken down by size classesclasses
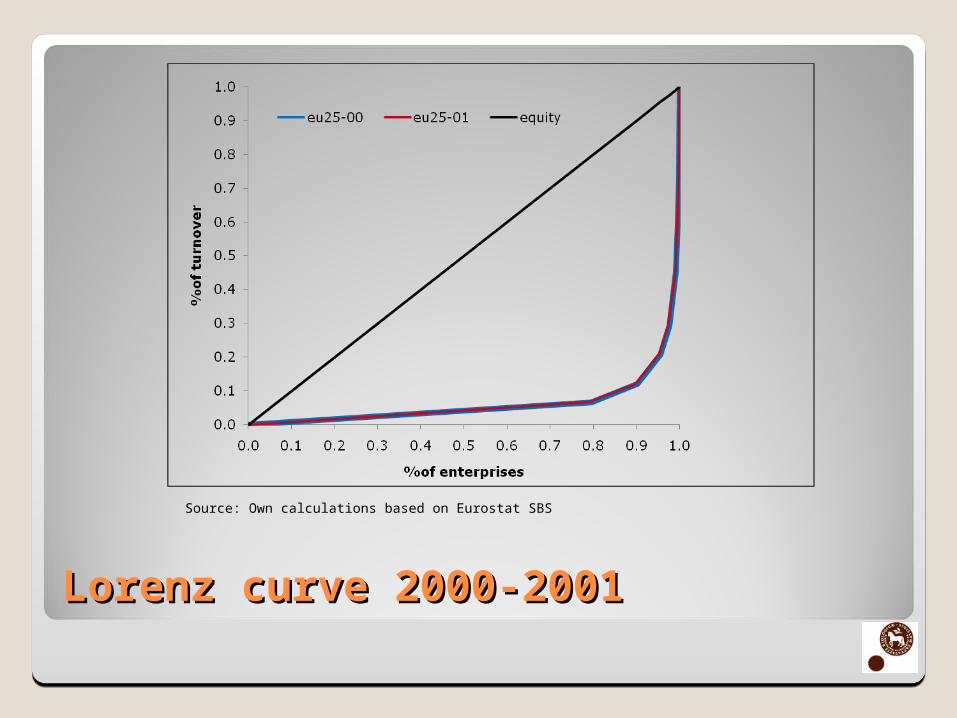
Lorenz curve 2000-2001Lorenz curve 2000-2001
Source: Own calculations based on Eurostat SBS
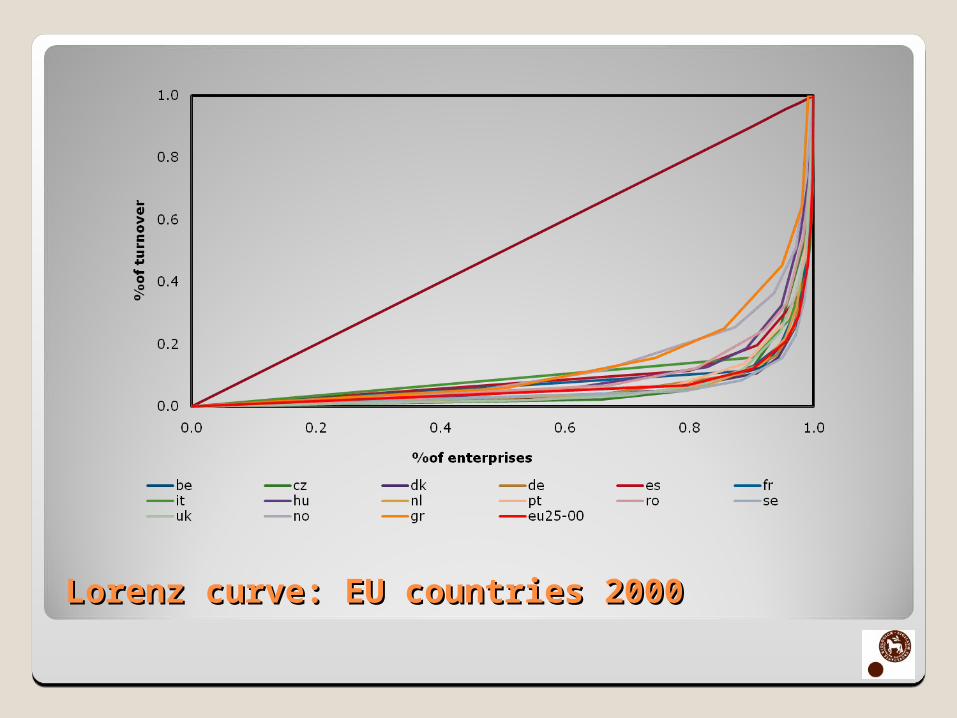
Lorenz curve: Lorenz curve: EU countries 2000EU countries 2000
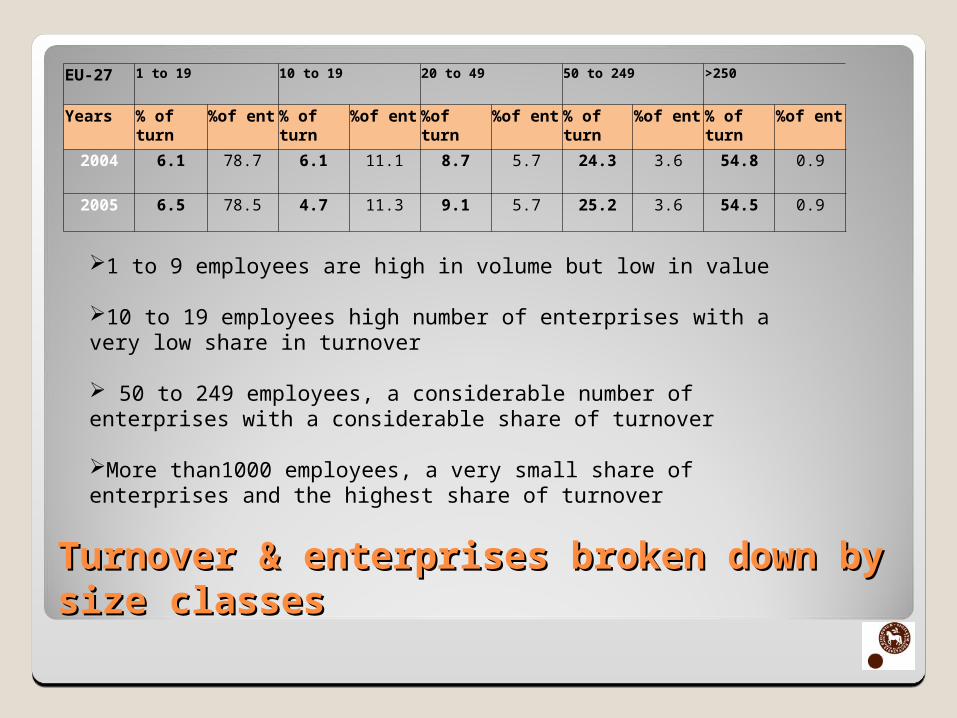
EU-27 1 to 19 10 to 19 20 to 49 50 to 249 >250
Years % of turn %of ent % of turn %of ent %of turn %of ent % of turn %of ent % of turn %of ent
2004 6.1 78.7 6.1 11.1 8.7 5.7 24.3 3.6 54.8 0.9
2005 6.5 78.5 4.7 11.3 9.1 5.7 25.2 3.6 54.5 0.9
1 to 9 employees are high in volume but low in value
10 to 19 employees high number of enterprises with a very low share in turnover
50 to 249 employees, a considerable number of enterprises with a considerable share of turnover
More than1000 employees, a very small share of enterprises and the highest share of turnover
Turnover & enterprises broken down by Turnover & enterprises broken down by size classessize classes
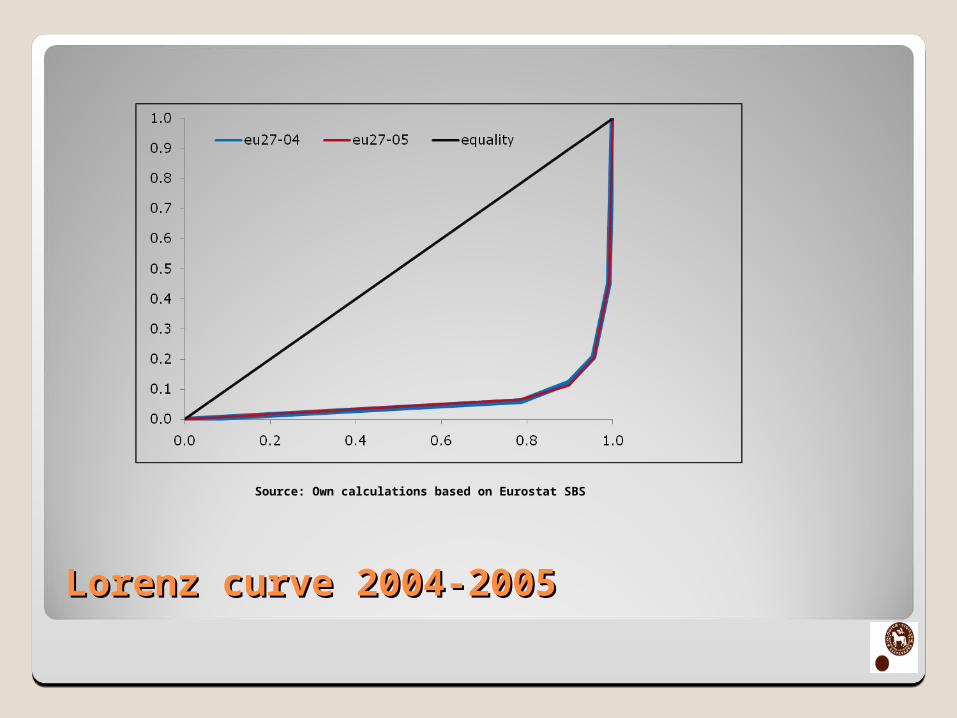
Lorenz curve 2004-2005Lorenz curve 2004-2005
Source: Own calculations based on Eurostat SBS
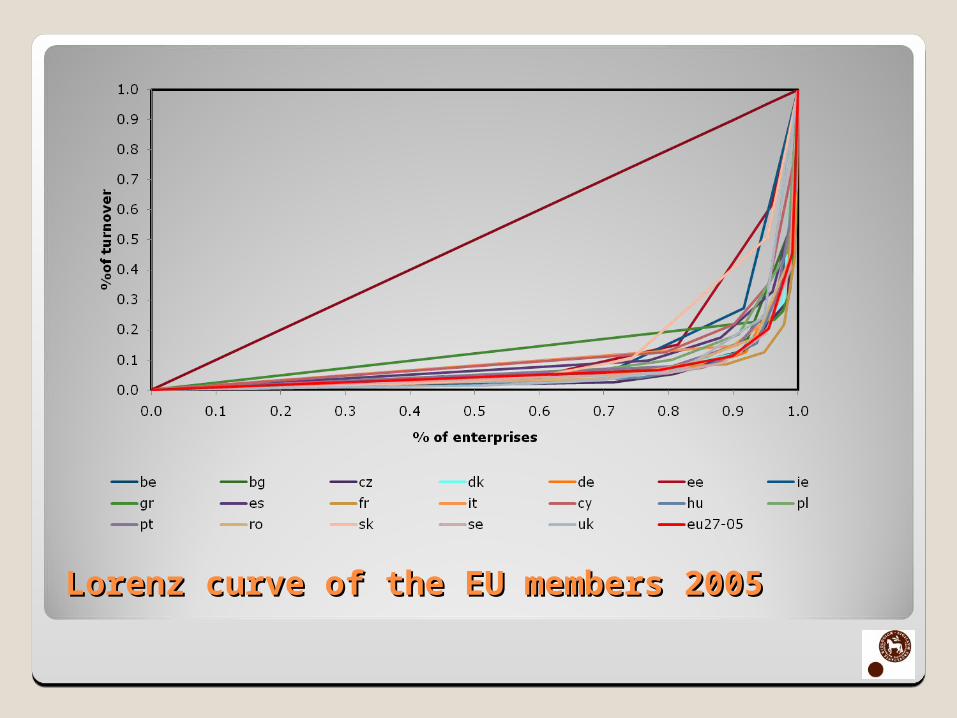
Lorenz curve of the EU members 2005Lorenz curve of the EU members 2005
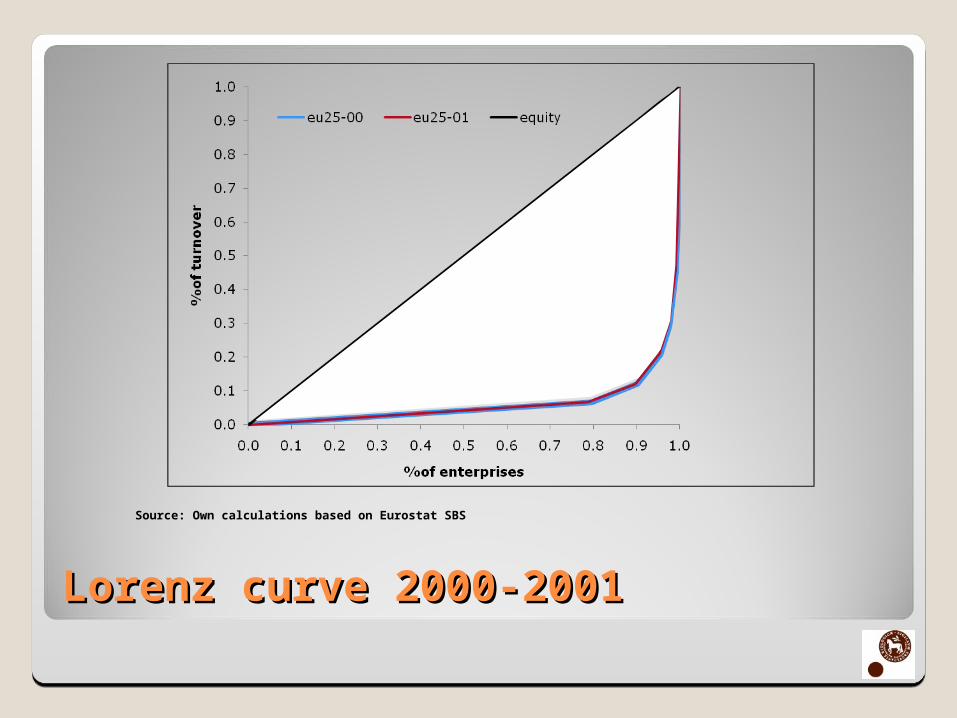
Lorenz curve 2000-2001Lorenz curve 2000-2001
Source: Own calculations based on Eurostat SBS
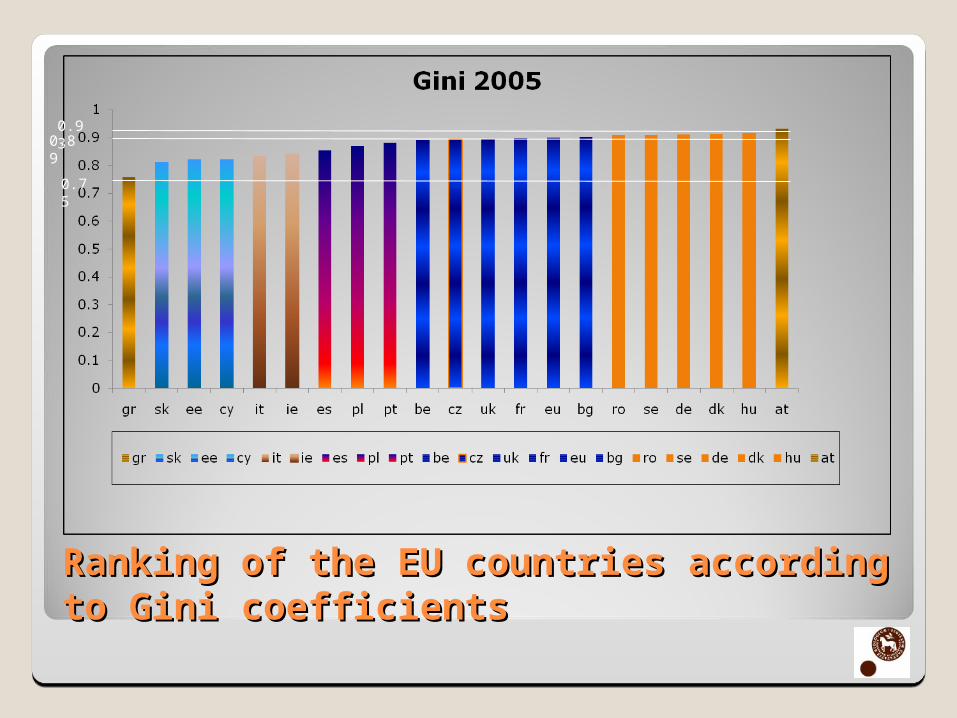
Ranking of the EU countries according Ranking of the EU countries according to Gini coefficientsto Gini coefficients
0.93
0.75
0.89
Globalization of food processorsGlobalization of food processors
Ranking of Multinational Enterprise (agri-food focus) by food and drink sales
Total sales toward agrifood sales of MNE
The total number of businesses for leading enterprises is counted in both home and host zones and a globalization index is obtained
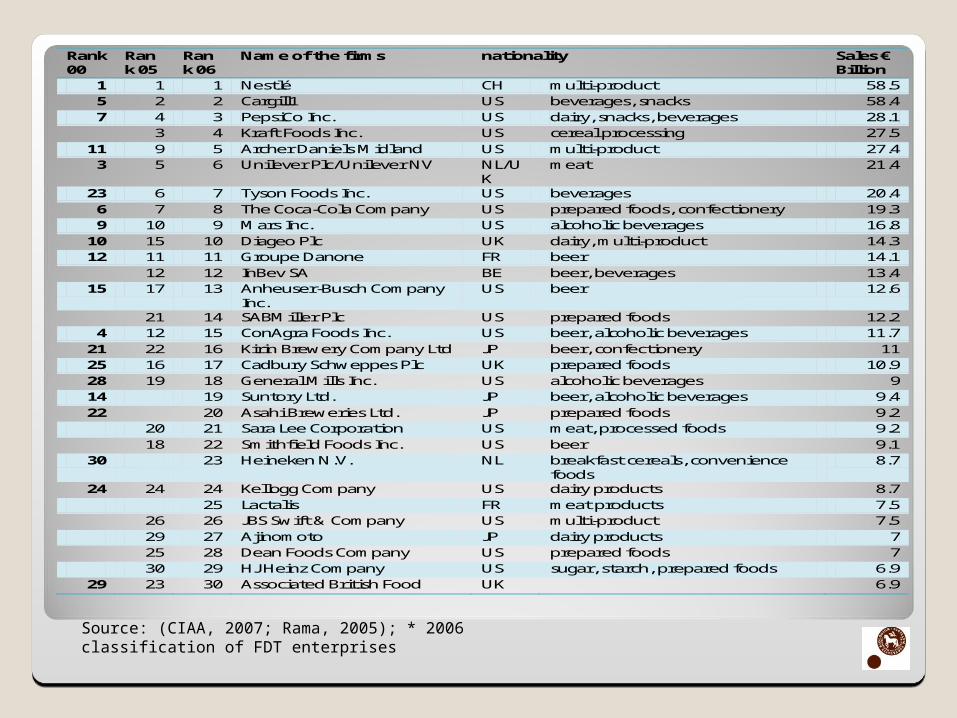
Rank 00
Rank 05
Rank 06
Name of the firms nationality Sales € Billion
1 1 1 Nestlé CH multi-product 58.5 5 2 2 Cargill1 US beverages, snacks 58.4 7 4 3 PepsiCo Inc. US dairy, snacks, beverages 28.1
3 4 Kraft Foods Inc. US cereal processing 27.5 11 9 5 Archer Daniels Midland US multi-product 27.4
3 5 6 Unilever Plc/Unilever NV NL/UK
meat 21.4
23 6 7 Tyson Foods Inc. US beverages 20.4 6 7 8 The Coca-Cola Company US prepared foods, confectionery 19.3 9 10 9 Mars Inc. US alcoholic beverages 16.8
10 15 10 Diageo Plc UK dairy, multi-product 14.3 12 11 11 Groupe Danone FR beer 14.1
12 12 InBev SA BE beer, beverages 13.4 15 17 13 Anheuser-Busch Company
Inc. US beer 12.6
21 14 SABMiller Plc US prepared foods 12.2 4 12 15 ConAgra Foods Inc. US beer, alcoholic beverages 11.7
21 22 16 Kirin Brewery Company Ltd JP beer, confectionery 11 25 16 17 Cadbury Schweppes Plc UK prepared foods 10.9 28 19 18 General Mills Inc. US alcoholic beverages 9 14 19 Suntory Ltd. JP beer, alcoholic beverages 9.4 22 20 Asahi Breweries Ltd. JP prepared foods 9.2
20 21 Sara Lee Corporation US meat, processed foods 9.2 18 22 Smithfield Foods Inc. US beer 9.1
30 23 Heineken N.V. NL breakfast cereals, convenience foods
8.7
24 24 24 Kellogg Company US dairy products 8.7 25 Lactalis FR meat products 7.5 26 26 JBS Swift & Company US multi-product 7.5 29 27 Ajinomoto JP dairy products 7 25 28 Dean Foods Company US prepared foods 7 30 29 HJ Heinz Company US sugar, starch, prepared foods 6.9
29 23 30 Associated British Food UK 6.9
Source: (CIAA, 2007; Rama, 2005); * 2006 classification of FDT enterprises
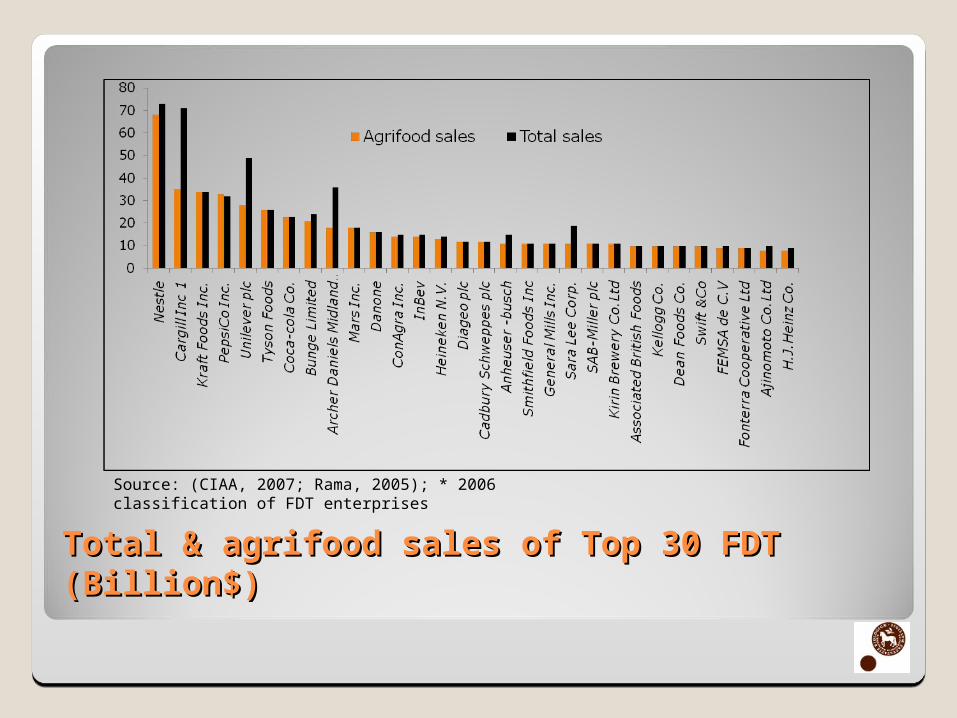
Total & agrifood sales of Top 30 FDT Total & agrifood sales of Top 30 FDT (Billion$)(Billion$)
Source: (CIAA, 2007; Rama, 2005); * 2006 classification of FDT enterprises
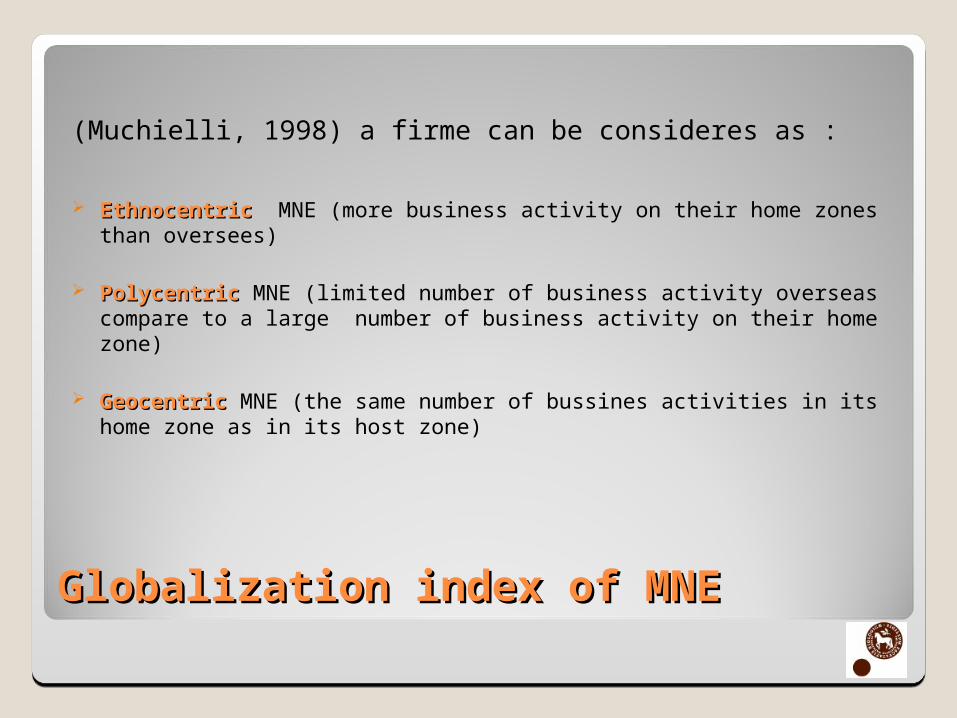
Globalization index of MNEGlobalization index of MNE
(Muchielli, 1998) a firme can be consideres as :
EthnocentricEthnocentric MNE (more business activity on their home zones than oversees)
PolycentricPolycentric MNE (limited number of business activity overseas compare to a large number of business activity on their home zone)
GeocentricGeocentric MNE (the same number of bussines activities in its home zone as in its host zone)
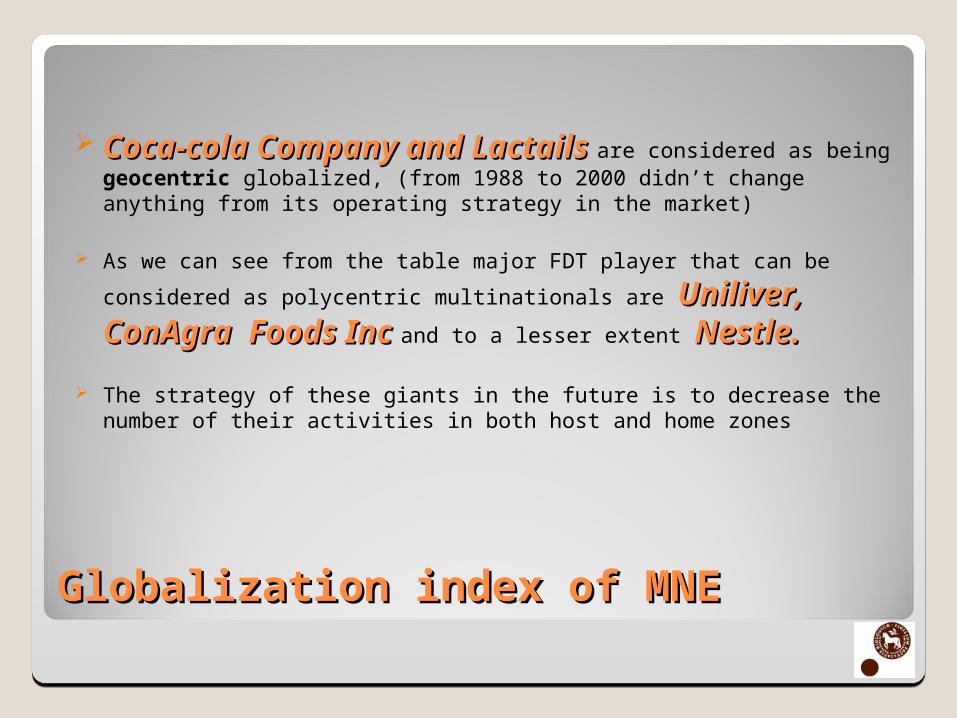
Globalization index of MNEGlobalization index of MNE
Coca-cola Company and Lactails Coca-cola Company and Lactails are considered as being geocentric globalized, (from 1988 to 2000 didn’t change anything from its operating strategy in the market)
As we can see from the table major FDT player that can be considered as
polycentric multinationals are Uniliver, ConAgra Foods Uniliver, ConAgra Foods Inc Inc and to a lesser extent Nestle. Nestle.
The strategy of these giants in the future is to decrease the number of their activities in both host and home zones
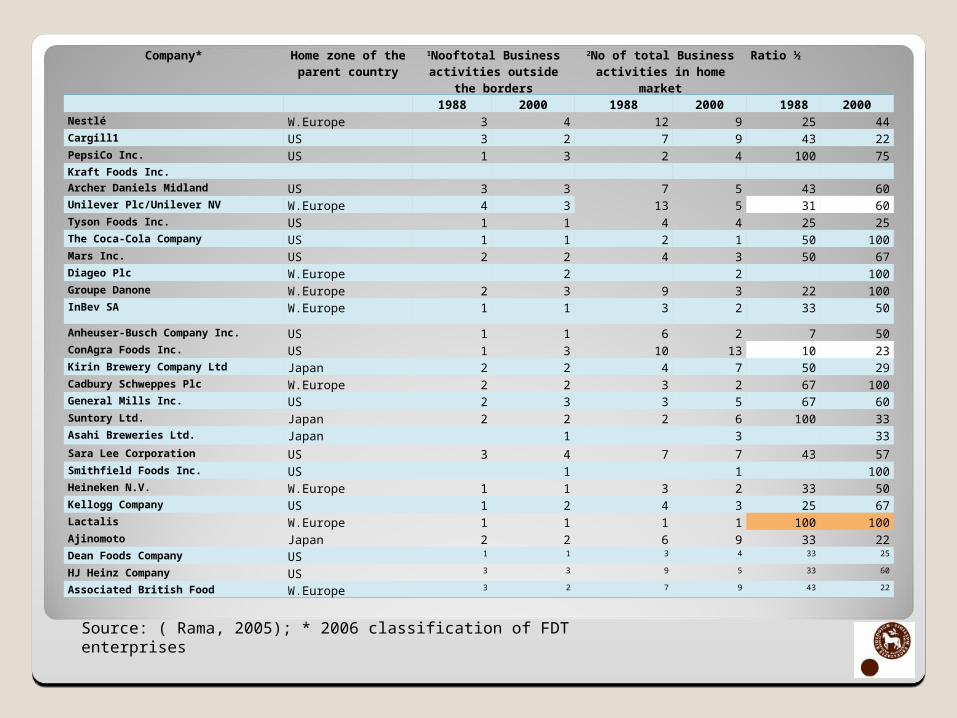
Company* Home zone of the parent country
1Nooftotal Business activities outside the borders
2No of total Business activities in home market
Ratio ½
1988 2000 1988 2000 1988 2000Nestlé W.Europe 3 4 12 9 25 44Cargill1 US 3 2 7 9 43 22PepsiCo Inc. US 1 3 2 4 100 75Kraft Foods Inc.Archer Daniels Midland US 3 3 7 5 43 60Unilever Plc/Unilever NV W.Europe 4 3 13 5 31 60Tyson Foods Inc. US 1 1 4 4 25 25The Coca-Cola Company US 1 1 2 1 50 100Mars Inc. US 2 2 4 3 50 67Diageo Plc W.Europe 2 2 100Groupe Danone W.Europe 2 3 9 3 22 100InBev SA W.Europe 1 1 3 2 33 50
Anheuser-Busch Company Inc. US 1 1 6 2 7 50ConAgra Foods Inc. US 1 3 10 13 10 23Kirin Brewery Company Ltd Japan 2 2 4 7 50 29Cadbury Schweppes Plc W.Europe 2 2 3 2 67 100General Mills Inc. US 2 3 3 5 67 60Suntory Ltd. Japan 2 2 2 6 100 33Asahi Breweries Ltd. Japan 1 3 33Sara Lee Corporation US 3 4 7 7 43 57Smithfield Foods Inc. US 1 1 100Heineken N.V. W.Europe 1 1 3 2 33 50Kellogg Company US 1 2 4 3 25 67Lactalis W.Europe 1 1 1 1 100 100Ajinomoto Japan 2 2 6 9 33 22Dean Foods Company US 1 1 3 4 33 25
HJ Heinz Company US 3 3 9 5 33 60
Associated British Food W.Europe 3 2 7 9 43 22
Source: ( Rama, 2005); * 2006 classification of FDT enterprises
ConclusionsConclusions
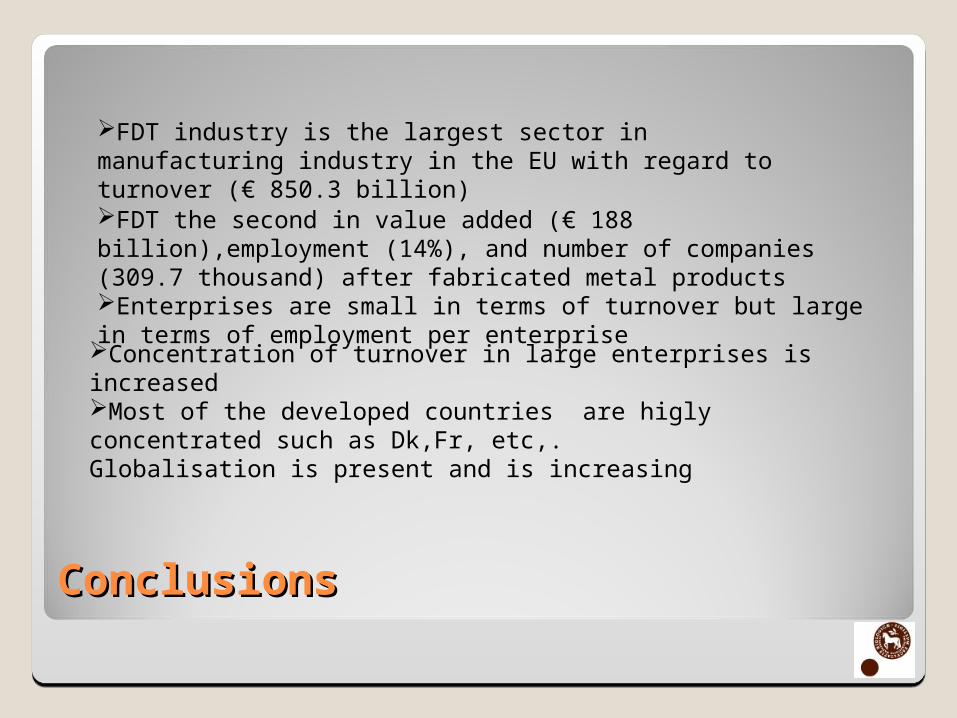
Concentration of turnover in large enterprises is increasedMost of the developed countries are higly concentrated such as Dk,Fr, etc,.Globalisation is present and is increasing
FDT industry is the largest sector in manufacturing industry in the EU with regard to turnover (€ 850.3 billion)
FDT the second in value added (€ 188 billion),employment (14%), and number of companies (309.7 thousand) after fabricated metal productsEnterprises are small in terms of turnover but large in terms of employment per enterprise
Food industry in the Eastern European Food industry in the Eastern European CountriesCountries
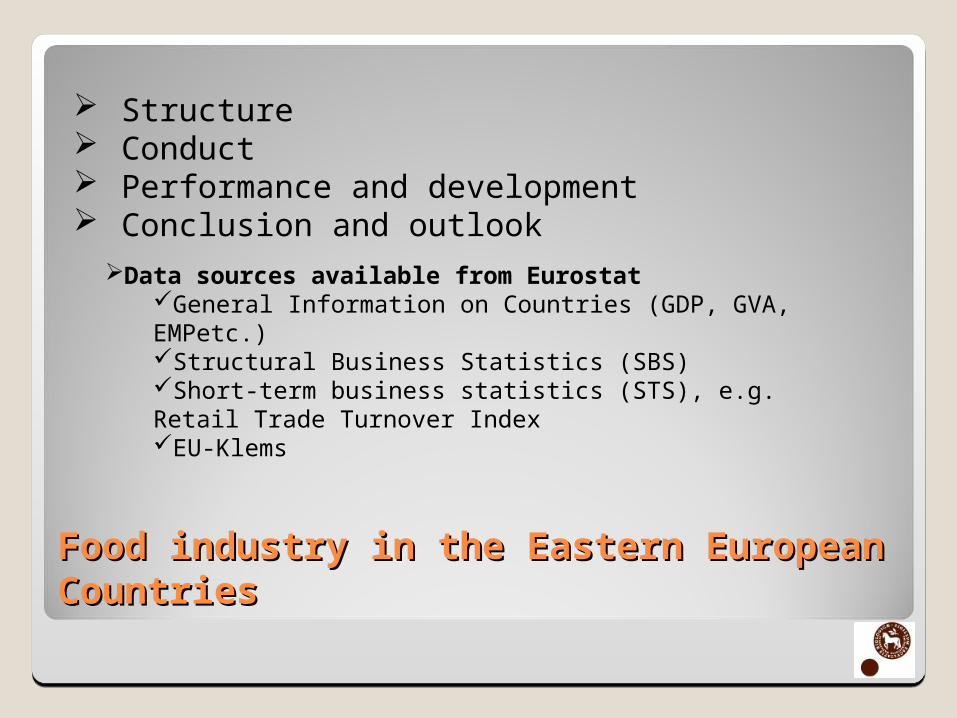
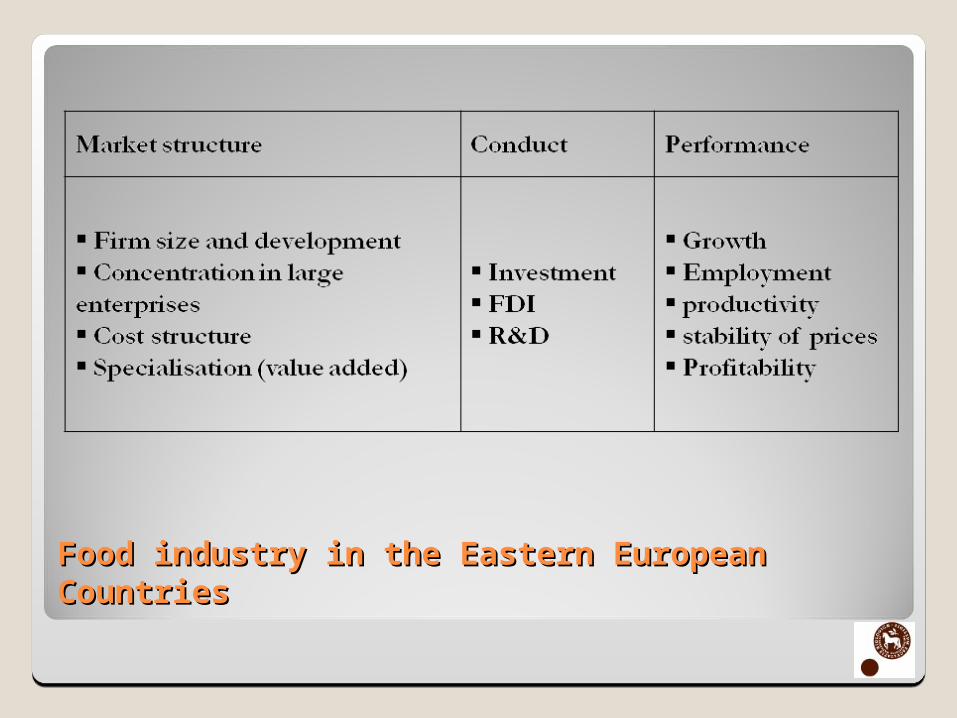
Structure Conduct Performance and development Conclusion and outlook
Data sources available from EurostatGeneral Information on Countries (GDP, GVA, EMPetc.)Structural Business Statistics (SBS)Short-term business statistics (STS), e.g. Retail Trade Turnover IndexEU-Klems
Food industry in the Eastern European Food industry in the Eastern European CountriesCountries
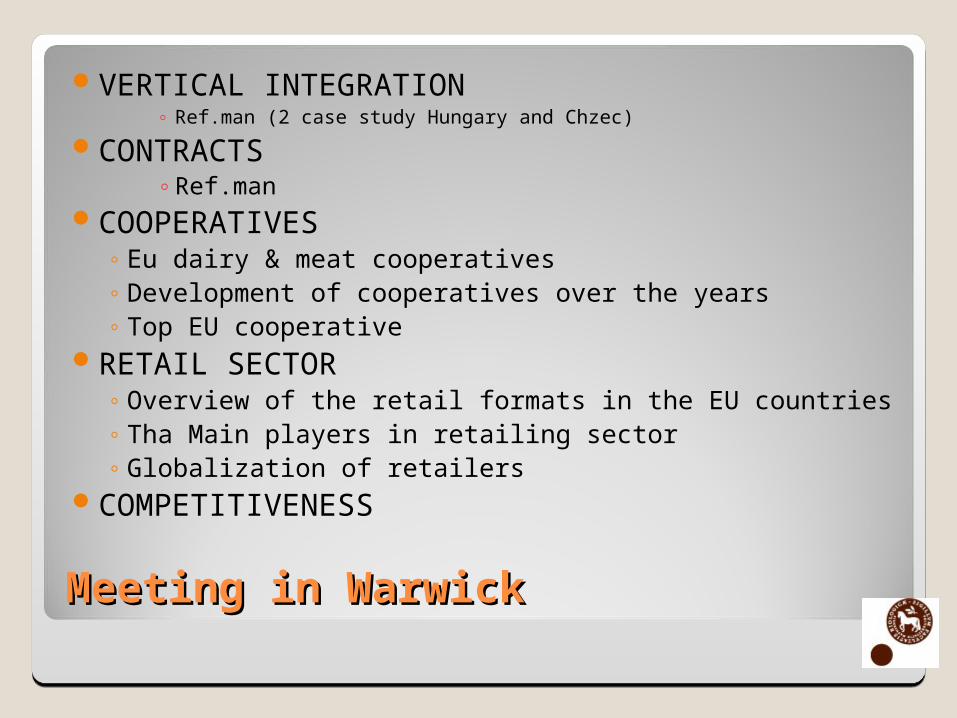
VERTICAL INTEGRATION◦ Ref.man (2 case study Hungary and Chzec)
CONTRACTS ◦Ref.man
COOPERATIVES◦ Eu dairy & meat cooperatives◦ Development of cooperatives over the years◦ Top EU cooperative
RETAIL SECTOR◦ Overview of the retail formats in the EU countries◦ Tha Main players in retailing sector◦ Globalization of retailers
COMPETITIVENESS
Meeting in Warwick Meeting in Warwick


![DEN KOMPLETTE POLYETHYLEN ISOLERINGSPAKKE TIL … · • Forbedret akustisk komfort ... (ϑm-40)²]/1000 Reaktion på brand Byggemateriale-klasse2 Tubolit DG E EU 5221 EU 5232 EU](https://static.fdocument.org/doc/165x107/5bf748d309d3f2ac7c8b85cb/den-komplette-polyethylen-isoleringspakke-til-forbedret-akustisk-komfort.jpg)