μFE models can represent microdamaged regions of healthy ...
22
TSpace Research Repository tspace.library.utoronto.ca μFE models can represent microdamaged regions of healthy and metastatically involved whole vertebrae identified through histology and contrast enhanced μCT imaging Choudhari C., Chan K., Akens M. K., and Whyne C. M. Version Post-Print/Accepted Manuscript Citation (published version) Choudhari C, Chan K, Akens MK, Whyne CM. μFE models can represent microdamaged regions of healthy and metastatically involved whole vertebrae identified through histology and contrast enhanced μCT imaging. J Biomech. 2016 May 3;49(7):110310. doi: 10.1016/j.jbiomech.2016.02.034. PMID: 26947031 Copyright / License This work is licensed under a Creative Commons Attribution- NonCommercial-NoDerivatives 4.0 International License. Publisher’s Statement The final published version of this article is available at Elsevier via https://dx.doi.org/10.1016/j.jbiomech.2016.02.034. How to cite TSpace items Always cite the published version, so the author(s) will receive recognition through services that track citation counts, e.g. Scopus. If you need to cite the page number of the TSpace version (original manuscript or accepted manuscript) because you cannot access the published version, then cite the TSpace version in addition to the published version using the permanent URI (handle) found on the record page.
Transcript of μFE models can represent microdamaged regions of healthy ...
TSpace Research Repository tspace.library.utoronto.ca
μFE models can represent microdamaged regions of healthy and metastatically involved whole vertebrae identified through histology
and contrast enhanced μCT imaging
Choudhari C., Chan K., Akens M. K., and Whyne C. M.
Version Post-Print/Accepted Manuscript
Citation (published version)
Choudhari C, Chan K, Akens MK, Whyne CM. μFE models can represent microdamaged regions of healthy and metastatically involved whole vertebrae identified through histology and contrast enhanced μCT imaging. J Biomech. 2016 May 3;49(7):110310. doi: 10.1016/j.jbiomech.2016.02.034. PMID: 26947031
Copyright / License
This work is licensed under a Creative Commons Attribution-NonCommercial-NoDerivatives 4.0 International License.
Publisher’s Statement The final published version of this article is available at Elsevier via https://dx.doi.org/10.1016/j.jbiomech.2016.02.034.
How to cite TSpace items
Always cite the published version, so the author(s) will receive recognition through services that track citation counts, e.g. Scopus. If you need to cite the page number of the TSpace version (original manuscript or accepted manuscript) because you cannot access the published version, then cite the TSpace version in addition to the published version using the permanent URI (handle) found on the record page.
μFE models can represent microdamaged regions of healthy and
metastatically involved whole vertebrae identified through histology and
contrast enhanced μCT imaging.
Chetan Choudhari1,4
, Katelyn Chan1, Margarete K. Akens
2,3, Cari M. Whyne
1,3,4.
1Sunnybrook Research Institute, Toronto, ON, Canada,
2TECHNA Institute, University Health Network, Toronto,
ON, Canada, 3Department of Surgery, Toronto, ON, Canada,
4Institute for Biomaterials and Biomedical
Engineering, Toronto, ON, Canada,
Abstract
Microdamage formation within the skeleton is an important stimulant for bone remodelling,
however abnormal build-up of microdamage can lead to skeletal fragility. In this study, µCT
imaging based micro finite element (μFE) models were used to evaluate tissue level damage
criteria in whole healthy and metastatically-involved vertebrae. T13-L2 spinal segments were
excised from osteolytic (n=3) and healthy (n=3) female athymic rnu/rnu rats. Osteolytic
metastasis was generated by intercardiac injection of HELA cancer cells. Micro-mechanical axial
loading was applied to the spinal motion segments under μCT imaging. Vertebral samples
underwent BaSO4 staining and sequential calcein/fuchsin staining to identify load induced
microdamage. μCT imaging was used generate specimen specific μFE models of the healthy and
osteolytic whole rat vertebrae. Model boundary conditions were generated through deformable
image registration of loaded and unloaded scans. Elevated stresses and strains were detected in
regions of microdamage identified through histological and BaSO4 staining within healthy and
osteolytic vertebral models, as compared to undamaged regions. Additionally, damaged regions
of metastatic vertebrae experienced significantly higher local stresses and strains than those in
the damaged regions of healthy specimens. Areas identified by BaSO4 staining, however, yielded
lower levels of stress and strain in damaged and undamaged regions of healthy and metastatic
vertebrae as compared to fuschin staining. The multimodal (experimental, image-based and
computational) techniques used in this study demonstrated the ability of local stresses and strains
computed through µFE analysis to identify trabecular microdamage, that can be applied to
biomechanical analyses of healthy and diseased whole bones.
Title Page & Abstract
2
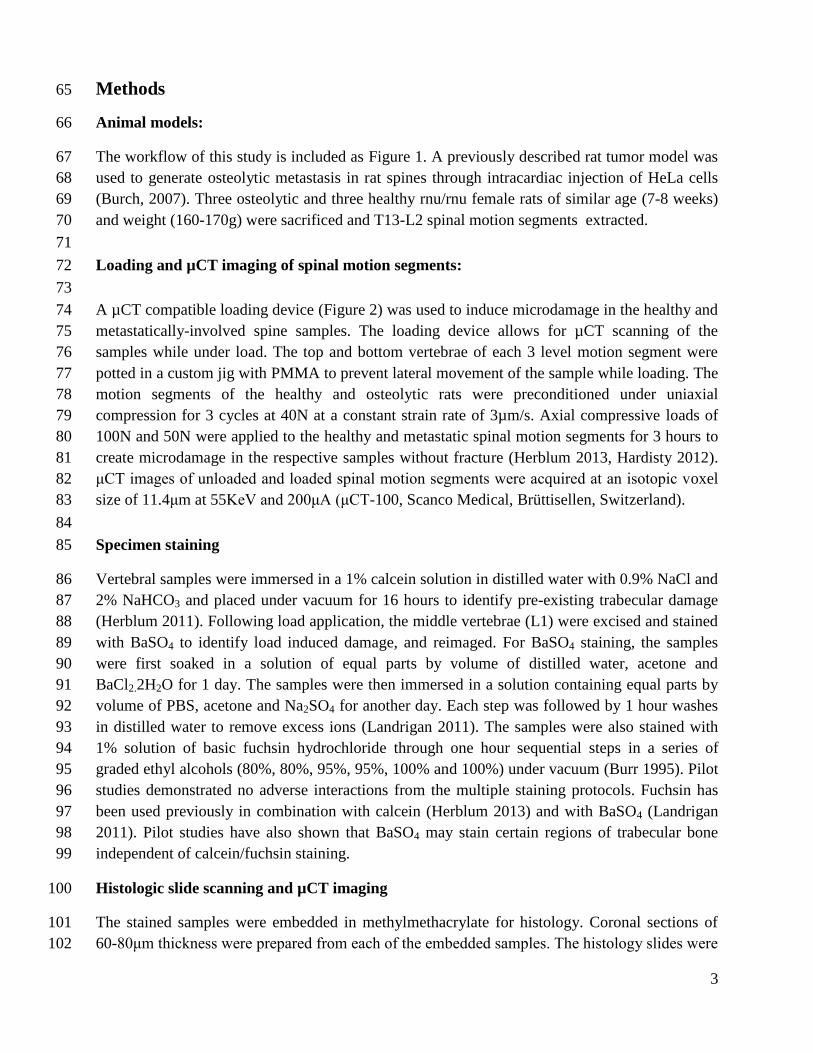
Introduction 26
Physiological microdamage formation within the skeleton serves as a stimulant for bone 27
remodeling. Accumulation of unrepaired microdamage in trabecular bone can result from 28
inferior bone quality due to age-related changes or skeletal pathology (Iwata 2014). Despite the 29
importance of microdamage to the mechanical properties of bone, the trabecular stresses and 30
strains experienced at its initiation are not well characterized. Evaluation of stresses and strains 31
associated with microdamage initiation at the local level may enable improvement of fracture 32
risk assessment techniques and the development of therapeutic methods for treatment of skeletal 33
fragility diseases such as metastasis. 34
Microdamage sites can be experimentally identified through sequential staining and 35
histomorphometry (Lee 2000). Sequential histologic staining (i.e. calcein green and fuchsin) has 36
been utilized to differentiate pre-existing and test induced microdamage (Lee 2000, Herblum 37
2013). Barium sulfate (BaSO4) contrast enhanced µCT imaging has been used as a non-38
destructive 3D alternative to conventional histology to detect accumulation of microdamage in 39
trabecular and cortical bone (Landrigan 2011, Wang 2007). 40
Micro-finite element analysis (µFEA) has been utilized to study local damage initiation 41
properties of trabecular bone (Herblum 2013, Nagaraja 2005). This technique converts 42
segmented µCT voxels representing bone directly into finite elements, yielding large models 43
which can represent complex structural tissue organization. µFEA has the capability to model the 44
trabecular morphology, allowing calculation of stresses and strains at histologically identified 45
damage sites (Keaveny 2001). Nagaraja et al. used this approach to determine variations in 46
microdamage initiation parameters in response to age related changes in human and bovine 47
trabecular bone cores (Nagaraja 2005, 2007, 2011, Green 2011). µFEA of whole bones allows 48
loading through joints/soft tissues, simulating more physiological loading conditions. Herblum et 49
al. recently demonstrated successful application of µFEA to show elevated stresses and strains in 50
regions containing mechanically induced microdamage within whole healthy rat vertebrae 51
(Herblum 2013). 52
Spinal metastasis progressively degrades the trabecular architecture of the vertebral body, 53
leading to an increased risk of fracture (Kurth 2001). Previous studies have demonstrated 54
significant differences in microstructural parameters (i.e. trabecular thickness, trabecular 55
number, etc.) between healthy and metastatically involved vertebrae (Hojjat 2011). The 56
structural parameters do affect the distribution of stresses and strains across the trabecular 57
microarchitecture, but the geometric distribution of bone tissue is not sufficient to explain all the 58
difference (Hojjat 2012). It is not clear if the initiation and propagation of unrepaired 59
microdamage, which precedes fracture, is distinct in metastatic spines. This study aims to 60
generate µFE models that accurately represent damage initiation of whole healthy and osteolytic 61
vertebrae based on histological and contrast enhanced μCT damage quantification and to 62
determine thresholds for damage initiation based on these models. It is hypothesized that µFEA 63
will yield consistent damage initiation thresholds in healthy and osteolytic vertebrae. 64
3
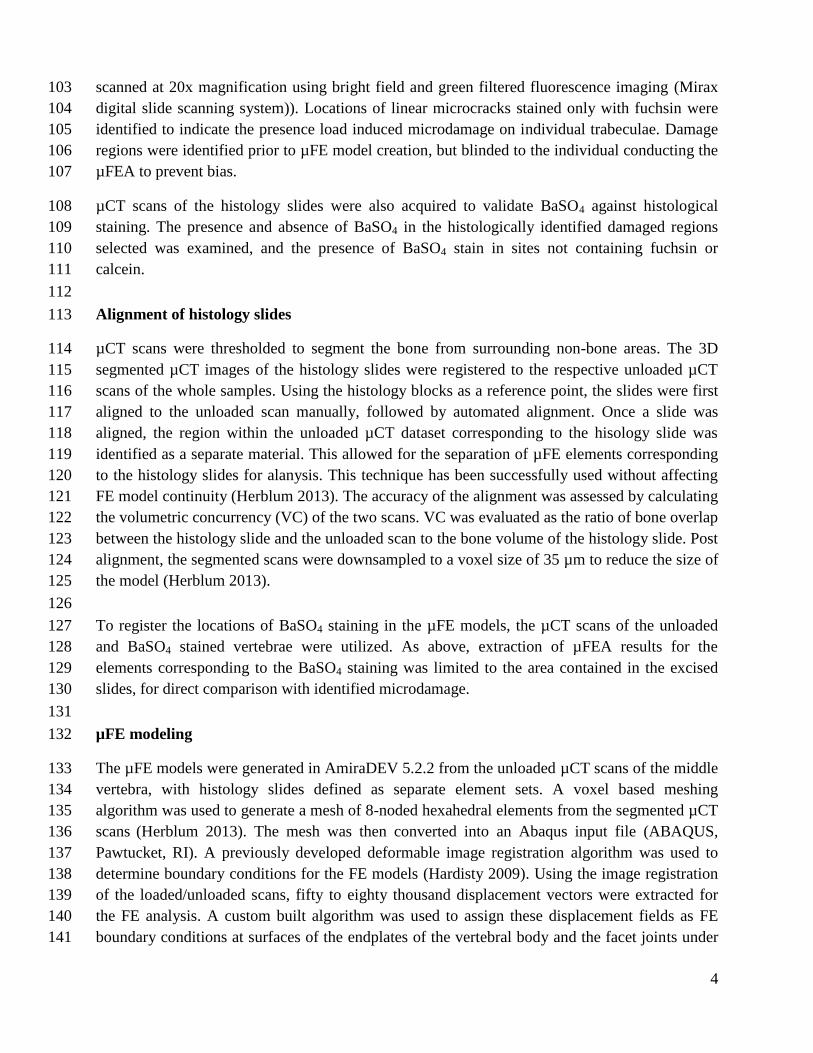
Methods 65
Animal models: 66
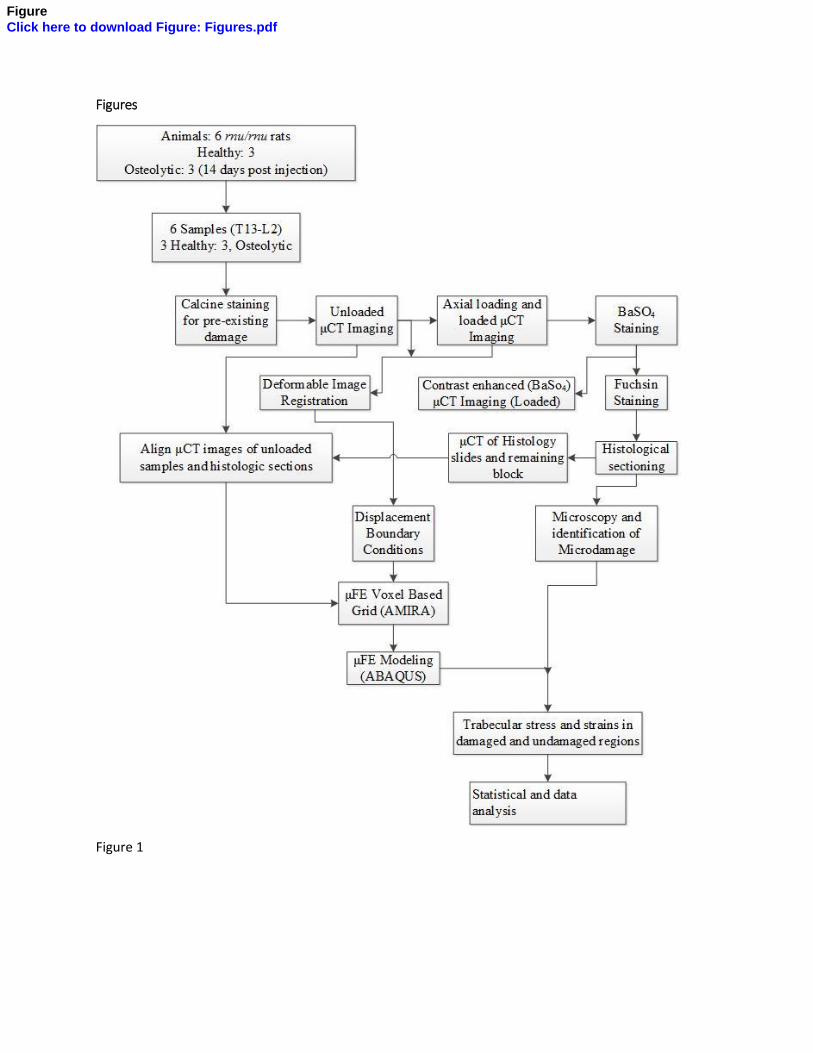
The workflow of this study is included as Figure 1. A previously described rat tumor model was 67
used to generate osteolytic metastasis in rat spines through intracardiac injection of HeLa cells 68
(Burch, 2007). Three osteolytic and three healthy rnu/rnu female rats of similar age (7-8 weeks) 69
and weight (160-170g) were sacrificed and T13-L2 spinal motion segments extracted. 70
71
Loading and µCT imaging of spinal motion segments: 72
73
A µCT compatible loading device (Figure 2) was used to induce microdamage in the healthy and 74
metastatically-involved spine samples. The loading device allows for µCT scanning of the 75
samples while under load. The top and bottom vertebrae of each 3 level motion segment were 76
potted in a custom jig with PMMA to prevent lateral movement of the sample while loading. The 77
motion segments of the healthy and osteolytic rats were preconditioned under uniaxial 78
compression for 3 cycles at 40N at a constant strain rate of 3µm/s. Axial compressive loads of 79
100N and 50N were applied to the healthy and metastatic spinal motion segments for 3 hours to 80
create microdamage in the respective samples without fracture (Herblum 2013, Hardisty 2012). 81
μCT images of unloaded and loaded spinal motion segments were acquired at an isotopic voxel 82
size of 11.4μm at 55KeV and 200μA (μCT-100, Scanco Medical, Brüttisellen, Switzerland). 83
84
Specimen staining 85
Vertebral samples were immersed in a 1% calcein solution in distilled water with 0.9% NaCl and 86
2% NaHCO3 and placed under vacuum for 16 hours to identify pre-existing trabecular damage 87
(Herblum 2011). Following load application, the middle vertebrae (L1) were excised and stained 88
with BaSO4 to identify load induced damage, and reimaged. For BaSO4 staining, the samples 89
were first soaked in a solution of equal parts by volume of distilled water, acetone and 90
BaCl2.2H2O for 1 day. The samples were then immersed in a solution containing equal parts by 91
volume of PBS, acetone and Na2SO4 for another day. Each step was followed by 1 hour washes 92
in distilled water to remove excess ions (Landrigan 2011). The samples were also stained with 93
1% solution of basic fuchsin hydrochloride through one hour sequential steps in a series of 94
graded ethyl alcohols (80%, 80%, 95%, 95%, 100% and 100%) under vacuum (Burr 1995). Pilot 95
studies demonstrated no adverse interactions from the multiple staining protocols. Fuchsin has 96
been used previously in combination with calcein (Herblum 2013) and with BaSO4 (Landrigan 97
2011). Pilot studies have also shown that BaSO4 may stain certain regions of trabecular bone 98
independent of calcein/fuchsin staining. 99
Histologic slide scanning and µCT imaging 100
The stained samples were embedded in methylmethacrylate for histology. Coronal sections of 101
60-80μm thickness were prepared from each of the embedded samples. The histology slides were 102
4
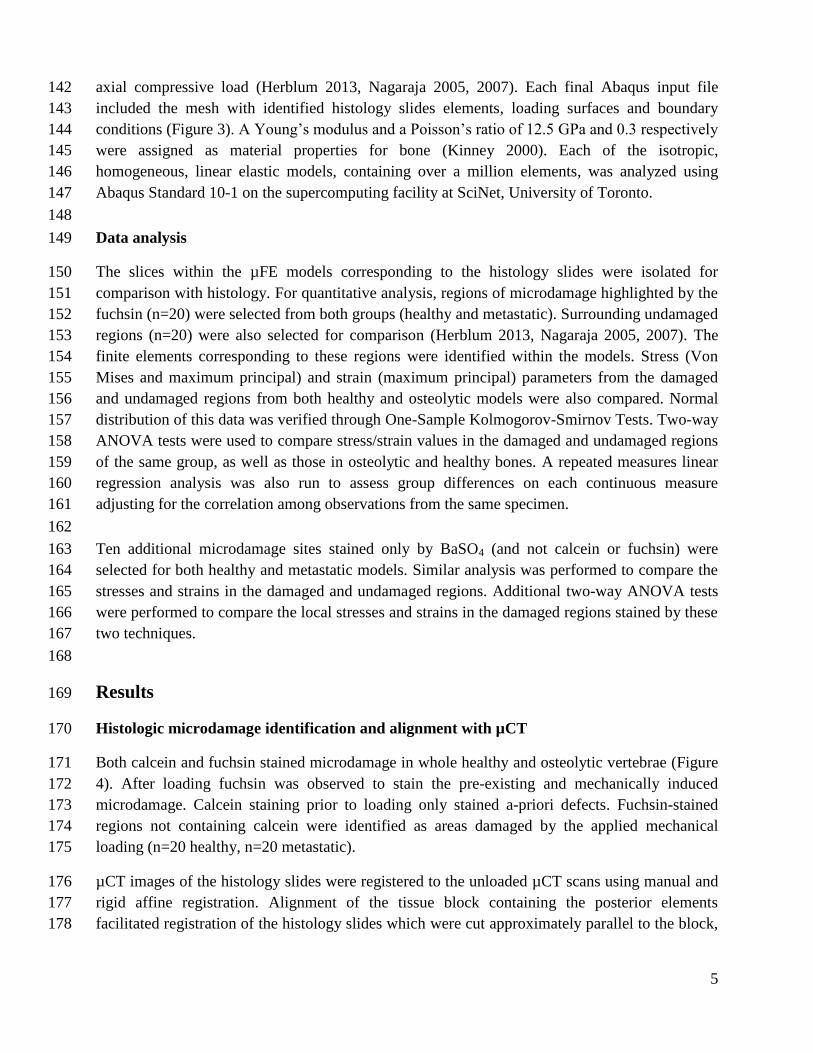
scanned at 20x magnification using bright field and green filtered fluorescence imaging (Mirax 103
digital slide scanning system)). Locations of linear microcracks stained only with fuchsin were 104
identified to indicate the presence load induced microdamage on individual trabeculae. Damage 105
regions were identified prior to µFE model creation, but blinded to the individual conducting the 106
µFEA to prevent bias. 107
µCT scans of the histology slides were also acquired to validate BaSO4 against histological 108
staining. The presence and absence of BaSO4 in the histologically identified damaged regions 109
selected was examined, and the presence of BaSO4 stain in sites not containing fuchsin or 110
calcein. 111
112
Alignment of histology slides 113
µCT scans were thresholded to segment the bone from surrounding non-bone areas. The 3D 114
segmented µCT images of the histology slides were registered to the respective unloaded µCT 115
scans of the whole samples. Using the histology blocks as a reference point, the slides were first 116
aligned to the unloaded scan manually, followed by automated alignment. Once a slide was 117
aligned, the region within the unloaded µCT dataset corresponding to the hisology slide was 118
identified as a separate material. This allowed for the separation of µFE elements corresponding 119
to the histology slides for alanysis. This technique has been successfully used without affecting 120
FE model continuity (Herblum 2013). The accuracy of the alignment was assessed by calculating 121
the volumetric concurrency (VC) of the two scans. VC was evaluated as the ratio of bone overlap 122
between the histology slide and the unloaded scan to the bone volume of the histology slide. Post 123
alignment, the segmented scans were downsampled to a voxel size of 35 µm to reduce the size of 124
the model (Herblum 2013). 125
126
To register the locations of BaSO4 staining in the µFE models, the µCT scans of the unloaded 127
and BaSO4 stained vertebrae were utilized. As above, extraction of µFEA results for the 128
elements corresponding to the BaSO4 staining was limited to the area contained in the excised 129
slides, for direct comparison with identified microdamage. 130
131
µFE modeling 132
The µFE models were generated in AmiraDEV 5.2.2 from the unloaded µCT scans of the middle 133
vertebra, with histology slides defined as separate element sets. A voxel based meshing 134
algorithm was used to generate a mesh of 8-noded hexahedral elements from the segmented µCT 135
scans (Herblum 2013). The mesh was then converted into an Abaqus input file (ABAQUS, 136
Pawtucket, RI). A previously developed deformable image registration algorithm was used to 137
determine boundary conditions for the FE models (Hardisty 2009). Using the image registration 138
of the loaded/unloaded scans, fifty to eighty thousand displacement vectors were extracted for 139
the FE analysis. A custom built algorithm was used to assign these displacement fields as FE 140
boundary conditions at surfaces of the endplates of the vertebral body and the facet joints under 141
5
axial compressive load (Herblum 2013, Nagaraja 2005, 2007). Each final Abaqus input file 142
included the mesh with identified histology slides elements, loading surfaces and boundary 143
conditions (Figure 3). A Young’s modulus and a Poisson’s ratio of 12.5 GPa and 0.3 respectively 144
were assigned as material properties for bone (Kinney 2000). Each of the isotropic, 145
homogeneous, linear elastic models, containing over a million elements, was analyzed using 146
Abaqus Standard 10-1 on the supercomputing facility at SciNet, University of Toronto. 147
148
Data analysis 149
The slices within the µFE models corresponding to the histology slides were isolated for 150
comparison with histology. For quantitative analysis, regions of microdamage highlighted by the 151
fuchsin (n=20) were selected from both groups (healthy and metastatic). Surrounding undamaged 152
regions (n=20) were also selected for comparison (Herblum 2013, Nagaraja 2005, 2007). The 153
finite elements corresponding to these regions were identified within the models. Stress (Von 154
Mises and maximum principal) and strain (maximum principal) parameters from the damaged 155
and undamaged regions from both healthy and osteolytic models were also compared. Normal 156
distribution of this data was verified through One-Sample Kolmogorov-Smirnov Tests. Two-way 157
ANOVA tests were used to compare stress/strain values in the damaged and undamaged regions 158
of the same group, as well as those in osteolytic and healthy bones. A repeated measures linear 159
regression analysis was also run to assess group differences on each continuous measure 160
adjusting for the correlation among observations from the same specimen. 161
162
Ten additional microdamage sites stained only by BaSO4 (and not calcein or fuchsin) were 163
selected for both healthy and metastatic models. Similar analysis was performed to compare the 164
stresses and strains in the damaged and undamaged regions. Additional two-way ANOVA tests 165
were performed to compare the local stresses and strains in the damaged regions stained by these 166
two techniques. 167
168
Results 169
Histologic microdamage identification and alignment with µCT 170
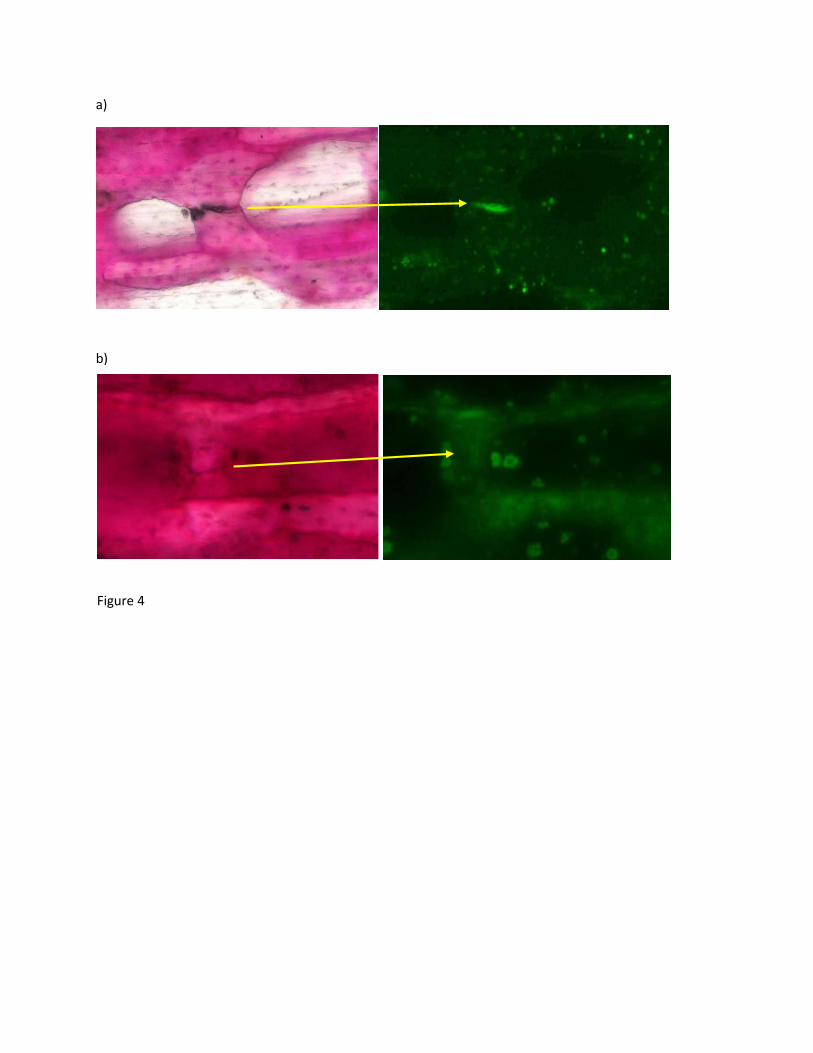
Both calcein and fuchsin stained microdamage in whole healthy and osteolytic vertebrae (Figure 171
4). After loading fuchsin was observed to stain the pre-existing and mechanically induced 172
microdamage. Calcein staining prior to loading only stained a-priori defects. Fuchsin-stained 173
regions not containing calcein were identified as areas damaged by the applied mechanical 174
loading (n=20 healthy, n=20 metastatic). 175
µCT images of the histology slides were registered to the unloaded µCT scans using manual and 176
rigid affine registration. Alignment of the tissue block containing the posterior elements 177
facilitated registration of the histology slides which were cut approximately parallel to the block, 178
6
The volumetric concurrency (VC) averaged 68% (range=63-77%) for slides from healthy 179
samples (n=7) and 64% (range=59-79%) for slides from metastatic samples (n=8). 180
181
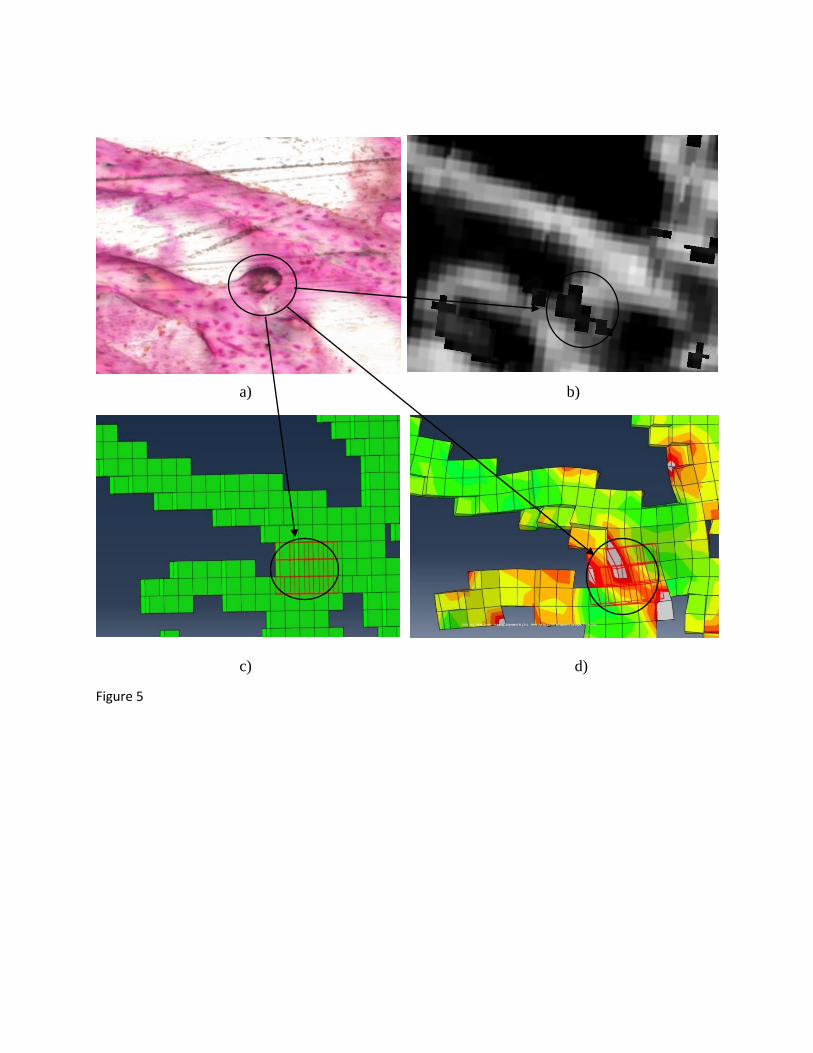
Stresses and strains in histologically identified damaged and undamaged regions 182
The elements corresponding to the selected fuchsin stained regions (n=20 healthy, n=20 183
metastatic) were identified within the µFE models (Figure 5). Damage initiation thresholds were 184
identified as 53-80MPa (principal stress) and 0.47-0.71% (principal strain) in healthy samples. In 185
metastatic bones, the analogous values were found to be 78-127MPa and 0.66-0.98%. A one 186
sample Kolmogorov-Smirnov (KS) test verified the normal distribution of the stress and strain 187
values. Two-way ANOVA revealed that the von Mises stresses, maximum principal stresses and 188
strains in the damaged regions were significantly greater than those in the undamaged regions for 189
healthy and metastatic models (Tables 1 and 5). 190
Using independent two-way ANOVA tests, the average maximum principal stress and strain 191
were significantly higher in the damaged regions of metastatic vs. healthy vertebrae, with a 192
similar trend for von Mises stress (Tables 2 and 5). Similar findings were observed for damaged 193
(28-58%) and undamaged (23-47%) regions. Interactions between the two variable groups were 194
not significant. The repeated measures linear regression analysis demonstrated significant group 195
differences for principal stress and strain adjusting for the correlation among observations from 196
the same specimen (p<0.05), but the difference was not found to be significant for maximum 197
Von Mises stress (p=0.18). 198
199
Stresses and strains in BaSO4 identified damaged regions 200
Each of the 40 histologically identified damage sites were compared with the corresponding µCT 201
scans for presence of BaSO4. 35/40 fuchsin stained damage sites were found to be enhanced by 202
BaSO4 (efficiency of 87.5%). Imperfect segmentation or improper alignment may cause BaSO4 203
to not be observed in some fuchsin stained regions. Additionally, in some cases calcein and 204
fuchsin stains may stain old features or small proteins masking the BaSO4 staining. 205
BaSO4 was also found in regions of bone not stained by either calcein or fuchsin. These regions 206
may represent finer microcracks, that only smaller barium and sulfate ions can penetrate 207
(Landrigan 2009). Regions containing only BaSO4 (and not calcein and fuchsin) demonstrated 208
elevated maximum principal stresses and strains and von Mises Stress (metastatic only) in the 209
damaged regions (Tables 3 and 5). Regions of BaSO4 identified microdamage in the metastatic 210
models were found to have higher principal stresses and strains in the damaged and undamaged 211
regions as compared to healthy models, with a similar trend for average Von Mises stresses 212
(Tables 4 and 5). 213
214
7
Discussion 215
Reductions in the quality of metastatic bone (lower density, architectural weaknesses) lead to 216
increased occurrence of microdamage. Understanding the initiation and the progression of 217
microdamage to fracture can improve the mechanical assessment of bone. Previous studies in 218
non-pathologic trabecular bone cores and whole bones have demonstrated elevated tissue level 219
stresses and strains in regions of damage (Herblum 2013, Nagaraja 2007). In this study, 220
specimen specific µFE models were applied to evaluate trabecular damage parameters in healthy 221
and metastatically-involved vertebral specimens. 222
Significantly elevated maximum principal stresses and strains were found in the damaged 223
regions as compared to undamaged ones. Damage initiation was considered to occur at 224
stress/strain values between those found in the undamaged and damaged regions. Trabecular 225
microdamage for healthy rnu/rnu vertebrae initiated between stress and strains in the range of 53-226
80MPa and 0.47-0.71% respectively. Using a similar methodology on larger whole wistar rat 227
vertebrae, Herblum et al. reported damage initiation at 85-128MPa and 0.9-1.4% (Herblum 228
2013). Nagaraja et al. found damage initiated between 92-132MPa and 0.82-1.21% in young 229
bovine trabecular cores, and between 81-110MPa and 0.38-0.64%in older bovine trabecular 230
sections (Nagaraja 2011). The alterations in local mechanical properties were attributed to age 231
related mineral and architectural changes in trabecular bone. Green et al. revealed that 232
microdamage in human trabecular bone cores initiated in the range of 53-83MPa and 0.48-0.81% 233
for young donors, with no significant differences in local damage initiation thresholds for older 234
specimens (50-84MPa and 0.51-0.83%) (Green 2011). From these studies large intra and inter-235
specimen diversity in local damage initiation properties exist, which may be due to both 236
physiological and structural sample differences. 237
As in healthy samples, damaged regions exhibited significantly higher maximum principal 238
stresses and strains in metastatic vertebrae. Damage in osteolytic specimens initiated between 239
stress and strain range of 78-127MPa and 0.66-0.98% respectively. Osteolytic samples have 240
lower trabecular number and thicknesses (Hojjat 2011). This implies that at similar continuum 241
strains, individual trabecular struts in osteolytic spines have higher stresses compared to healthy 242
bone. Also, as the metastatic spine is structurally weaker, it is closer to bulk yield when loaded 243
under similar strain. Damaged regions have been shown to experience higher stresses and strains 244
when loaded to strains closer to the yield strain (Nagaraja 2005). Herblum reported microdamage 245
initiation in a mixed osteolytic/osteoblastic metastatic model in an rnu/rnu rat vertebra at 224-246
447MPa and 2.5-4.4% (Herblum 2011) - much higher than those observed in this study. 247
However, local bone mechanics vary significantly with the type of tumor, giving rise to 248
differences in failure initiation properties. Compared with healthy samples, trabeculae in the 249
osteolytic vertebrae experience significantly higher stresses (127MPa vs. 80MPa) and strains 250
(0.98% vs. 0.71%) in the damaged regions, despite the reduced applied axial load. 251
Initiation and accumulation of microdamage severely degrades bone quality and elevates fracture 252
risk. This study demonstrates a relationship between tissue level stresses and strains with local 253
8
failure events. The quantitative results indicate the stress and strain values as determined for 254
damaged bone vs. undamaged bone, with damage initiation beginning somewhere between the 255
damaged and undamaged range. As such, this study did not aim to predict the stress/strain values 256
at which microdamage initiation occurs; but rather define a range of values where damage may 257
begin. Thus, the models generated in this study were not predictive. The selection of 258
microdamage sites in the healthy and metastatic slides was also not exhaustive, but represented a 259
subset of overall microdamage within the samples since not all microdamage sites on the 260
histology slides could be well visualized. Future work may establish the cut-off stress/strain 261
values for microdamage initiation using µFE models that evaluate the total volumetric presence 262
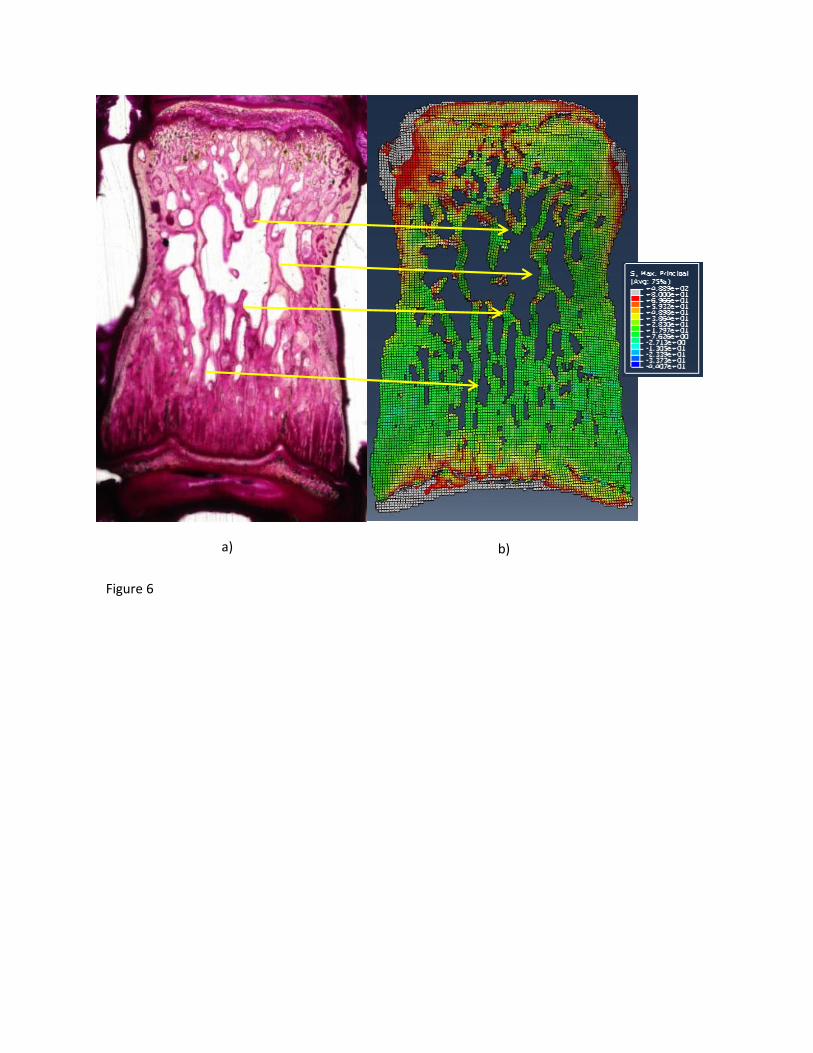
of microdamage. A few regions, especially near the endplates, that were observed to have stress 263
concentrations without failure (figure 6), may indicate structural diversities across the trabecular 264
mesh could lead to different failure mechanisms and thresholds. 265
Vertebral µFE models generated at a 35µm voxel size have previously demonstrated sufficient 266
convergence (Neibur 1999, Ladd 1998). At this resolution, each trabecula had at least two voxels 267
in one plane, and more than 4 voxels spanning its thickness. No singularities were observed in 268
the model. The large size of the µFE models and associated computational requirements were the 269
limiting factors for the voxel size utilized. The trabecular network near the growth plates was not 270
well resolved at this resolution, limiting the evaluation of microdamage within these regions. 271
Voxel size also limits the resolution of the mechanical parameters in the damaged areas which 272
may lead to underestimation of the stresses and strains experienced. µFE models at higher 273
resolutions have the potential to address these issues, leading to improved damage initiation 274
criteria. Selectively increasing the resolution of critical regions of the models may represent a 275
future approach to limit computational costs (Herblum 2013). 276
More advanced non-linear µFEA may improve the fidelity of the models by accounting for 277
material softening during damage initiation and stress redistribution to surrounding undamaged 278
elements (Nagaraja 2007). In this study homogeneous material properties were used for both 279
healthy and metastatically involved bone. Metastasis has been shown to alter bone tissue material 280
properties resulting in reduced elastic moduli as compared to normal bone (Nazrin 2008). The 281
heterogeneity of these changes, however, has not been well characterized. Intensity based 282
specimen specific inhomogeneous material property assignment has been shown to yield slightly 283
more accurate local stresses and strains in µFE models (Nagaraja 2007). However, implementing 284
this is complicated by potential differences in the quality of healthy and metastatically involved 285
bone, which may not be captured by BMD alone. Using a constant modulus of elasticity in 286
healthy and metastatic bone may have led to overestimation of local stresses and strains in the 287
metastatic models. Localized nanoindentation data from healthy and metastatic vertebrae may 288
ultimately provide data for heterogenous voxel based BMD based mechanical property 289
assignment (Wolfram 2010). 290
A sequential staining routine previously developed and optimized was used to identify regions of 291
pre and post loading microdamage. Calcein acts as a site specific dye for microdamage detection, 292
9
as it chelates and combines with exposed calcium ions on microdamaged surfaces (Lee 2000). 293
1% fuchsin staining with graded alcohols was used to identify de novo damage in response to 294
uniaxial compressive loading (Burr 1995). Fuchsin labels microdamage partially by diffusing 295
and accumulating in the damaged region and partially by binding to exposed collagen (Lee 296
2000). This study extended the sequential stains to evaluate the effectiveness of BaSO4. Fuchsin 297
and calcein stains have a much bigger molecules size compared to Ba and SO4 ions. As a result, 298
BaSO4 can enter smaller cracks that fuchsin and calcein cannot penetrate (Landrigan 2009). Also 299
Ba ions may be preferential towards high surface energies and binding sites on the cracked 300
mineral. A strong agreement was detected between regions of microdamage identified by BaSO4 301
and fuchsin (87.5%) suggesting that the staining techniques can be used concurrently. The lack 302
of complete concurrency may be due in part to non-ideal registration of the slides to the µCT 303
scans of the whole vertebrae. BaSO4 also labelled calcein stained pre-existing microdamage, and 304
thus was not specific to load induced damage. Sequential staining with BaSO4 could overcome 305
this challenge. To differentiate between pre-existing and newly formed cracks with BaSO4 306
sequential staining and microCT imaging pre and post loading could be used in future studies. In 307
this manner the pre-existing damage can be quantified in an initial scan and, with accurate 308
alignment, identified in the second (post loading) scan. Additional areas of BaSO4 stain can then 309
be said to represent load induced microdamage (Landrigan 2009). Overall, successful 310
implementation of BaSO4 staining in whole healthy and osteolytic vertebrae represents a 311
significant step forward to establish this technique as a powerful 3D volumetric complement to 312
microscopic methodologies. 313
BaSO4 was found to stain some regions of bone unstained by calcein or fuchsin. µFE results for 314
such regions from the healthy and metastatic models, were similar to the results for histologically 315
identified microdamage. In comparing stresses and strains in the regions identified by histology 316
and BaSO4, the stresses and strains were consistently lower in BaSO4 only enhanced damage 317
sites, but these differences were not significant. These regions may represent finer microcracks 318
and/or diffuse damage unstained by both calcein and fuchsin. While only linear microcracks 319
were selected for the histologic analysis, BaSO4 staining does not distinguish between linear and 320
diffuse damage at the resolution used. Nagaraja et al. demonstrated that more severe regions of 321
damage yield higher stresses and strains within the µFE model (Nagaraja 2005). As such, the 322
calcein/fuchsin stained regions of microdamage may represent more severe form of damage and 323
consequently yield slightly higher stresses and strains. 324
Physiologic loading was simulated in this study through uniaxial compression applied through 325
intervertebral discs. Multi-axial loading (compression, torsion and bending) may allow further 326
investigation of trabecular failure (including bending and buckling) that in combination with 327
fatigue protocols could provide a more comprehensive description of local failure. In vivo 328
vertebrae are subjected to multi-axial repetitive loading, thus studying their effects on trabecular 329
failure may lead to a more complete understanding of physiological microdamage initiation. 330
10
In the current study, µCT imaging of thick histology slides allowed for volumetric registration 331
between the histology slides and unloaded µCT scans. Thick bone sections facilitated automated 332
rigid volumetric registration for improved efficiency of the alignment process. The alignment 333
enabled identification of identical trabeculae on the slides and unloaded scans. The volumetric 334
concurrencies achieved were acceptable (Herblum 2013), but may have been somewhat limited 335
due to histological processing artefacts (i.e. variable thicknesses). The efficiency of alignment 336
may also have suffered in the metastatic samples as a result of decreased osteolytic bone content. 337
Accurate registration of the histology slides to the unloaded µCT images of whole vertebrae 338
represented an important component of the experimental procedure. This allowed direct 339
comparison of histologically identified load induced microdamage with the µFEA results. 340
Registration of the slide to the unloaded scans also allowed for verification of BaSO4 staining 341
against the gold standard histological staining. 342
Overall, specimen specific µFE models of healthy and metastatic (osteolytic) vertebrae were 343
successfully generated with accurate integration of histologically defined regions based on 344
volumetric image registration and displacement boundary conditions based on loaded/unloaded 345
µCT image registration. Microdamage was histologically identified through a whole bone 346
sequential calcein/fuchsin labelling technique. The ability of BaSO4 contrast agent to highlight 347
regions of vertebral microdamage was verified against histological staining. In the µFE models, 348
significantly higher stresses and strains were recorded in regions of damage identified by 349
staining. This advanced modelling technique provides a new robust method for validating the 350
ability of µFE modeling to quantify microdamage in skeletal structures, with potential for 351
application to the analysis of healthy or pathologic whole bones under complex physiologic 352
loading conditions. 353
354
Acknowledgements 355
Microdamage: This study was supported by the Canadian Institute of Health Research (Funding 356
reference numbers: 68911 and 125886). The authors thank the University of Toronto Dentistry 357
histology lab and the Imaging Facility at SickKids hospital for histologic sectioning and imaging 358
and Dr A Kiss for statistical assistance. 359
360
Conflict of Interest Statement 361
The authors have no conflict of interest. 362
11
References: 363
Burch S, Bisland SK, Wilson BC, Whyne C, Yee AJ., 2007. Multimodality imaging for vertebral 364
metastases in a rat osteolytic model. Clin Orthop Relat Res. Jan;454:230-6. 365
Burr, D. B., Hooser, M., 1995. Alterations to the en bloc basic fuchsin staining protocol for the 366
demonstration of microdamage produced in vivo. Bone 17, 431-433. 367
Evans, S.P., Parr, W.C.H., Clausen, P.D., Jones A., Wroe, S., 2012. Finite element analysis of a 368
micromechanical model of bone and a new 3D approach to validation. Journal of 369
Biomechanics 45, 2702–2705 370
Green, J., Nagaraja, S., Diab, T., Vidakovic, B. Guldberg, R.E., 2011. Age-related changes in 371
human trabecular bone: Relationship between microstructural stress and strain and 372
damage morphology. Journal of Biomechanics 44, 2279–2285 373
Hardisty, M.R., Whyne, C.M., 2009. Whole bone strain quantification by image registration: a 374
validation study. Journal of Biomechanical Engineering 131, 064502. 375
Hardisty, M.R., Akens, M.K., Hojjat, S.P., Yee, A., Whyne, C.M., 2012. Quantification of the 376
Effect of Osteolytic Metastases on Bone Strain within Whole Vertebrae Using Image 377
Registration. Journal of Orthopedic Research 30, 1032-1039. 378
Herblum, R., 2011. Evaluation of micro level structural integrity of the spine through micro 379
finite element modeling and histological analysis. PhD. Thesis. University of Toronto, 380
Canada 381
Herblum, R., Beek, M., Whyne, C.M., 2013. μFEA successfully exhibits higher stresses and 382
strains in microdamaged regions of whole vertebrae. Journal of Orthopaedic Research 31, 383
1653-1660. 384
Hojjat, S.P., Whyne, C.M., 2011. Automated quantitative microstructural analysis of 385
metastatically involved vertebrae: Effects of stereologic model and spatial resolution. 386
Medical Engineering & Physics 33, 188–194 387
Hojjat SP, Beek M, Akens MK, Whyne CM., 2012. Can micro-imaging based analysis methods 388
quantify structural integrity of rat vertebrae with and without metastatic involvement? 389
Journal of Biomechanics. Sep 21;45(14):2342-8. 390
Iwata, K., Mashiba, T., Hitora, T.,Yamagami, Y., Yamamoto, T., 2014. A large amount of 391
microdamages in the cortical bone around fracture site in a patient of atypical femoral 392
fracture after long-term bisphosphonate therapy. Bone 64183-186. 393
Keaveny, T.M., Morgan, E.F., Niebur G.L., Yeh O.C., 2001. Biomechanics of trabecular bone. 394
Annual Review of Biomedical Engineering 3, 307–333. 395
Kinney, J. H. et al., 2000. Three-dimensional morphometry of the L6 vertebra in the 396
ovariectomized rat model of osteoporosis: biomechanical implications. Journal of Bone 397
and Mineral Research 15, 1981-1991. 398
Kurth A.A., Muller, R., 2001. The effect of an osteolytic tumor on the three-dimensional 399
trabecular bone morphology in an animal model. Skeletal Radiology 30, 94–98 400
12
Landrigan, M.D., Li, J., Turnbull, T.L.,Burr, D.B., Niebur, G.L., Roeder, R.K., 2011. Contrast-401
enhanced micro-computed tomography of fatigue microdamage accumulation in human 402
cortical bone. Bone 48, 443-450. 403
Landrigan, M.D., 2009. Evaluation of methods for measuring microdamage accumulation in 404
cortical bone. PhD Thesis. University of Notre Dame, US. 405
Ladd, A. J., Kinney, J. H., Haupt, D. L. & Goldstein, S. A., 1998. Finite-element modeling of 406
trabecular bone: comparison with mechanical testing and determination of tissue 407
modulus. Journal of Orthopedic Research 16, 622-628. 408
Lee T. C., Arthur T. L., Gibson L. J., Hayes W. C., 2000. Sequential labelling of microdamage in 409
bone using chelating agents. Journal of Orthopedic Research 18, 322-325. 410
Nagaraja, S., Couse, T. L., Guldberg, R. E., 2005. Trabecular bone microdamage and 411
microstructural stresses under uniaxial compression. Journal of Biomechanics 38, 707-412
716. 413
Nagaraja, S., Lin, A. S., Guldberg, R. E., 2007. Age-related changes in trabecular bone 414
microdamage initiation. Bone 40, 973-980. 415
Nagaraja, S., Skrinjar, O., Guldberg, R.E., 2011. Spatial Correlations of Trabecular Bone 416
Microdamage with Local Stresses and strains Using Rigid Image Registration. Journal of 417
Biomechanical Engineering 133, 064502. 418
Nazarian, A., von Stechow, D., Zurakowski, D., Müller, R., Snyder, B.D., 2008. Bone volume 419
fraction explains the variation in strength and stiffness of cancellous bone affected by 420
metastatic cancer and osteoporosis. Calcifies Tissue International 83(6), 368-79. 421
Niebur, G. L., Yuen, J. C., Hsia, A. C., Keaveny, T. M., 1999. Convergence behavior of high-422
resolution finite element models of trabecular bone. Journal of Biomechanical 423
Engineering 121, 629-635. 424
Wang, X., Masse, D.B., Leng, H., Hess, K.P., Ross, R.D., Roeder, R.K., Niebur, G.L., 2007. 425
Detection of trabecular bone microdamage by micro-computed tomography. Journal of 426
Biomechanics 40, 3397-3403. 427
Wolfram, U., Wilke, H.J., Zysset, P.K., 2010. Valid micro finite element models of vertebral 428
trabecular bone can be obtained using tissue properties measured with nanoindentation 429
under wet conditions Journal of Biomechanics 43(9), 1731-7. 430
431
432
433
434
435
436
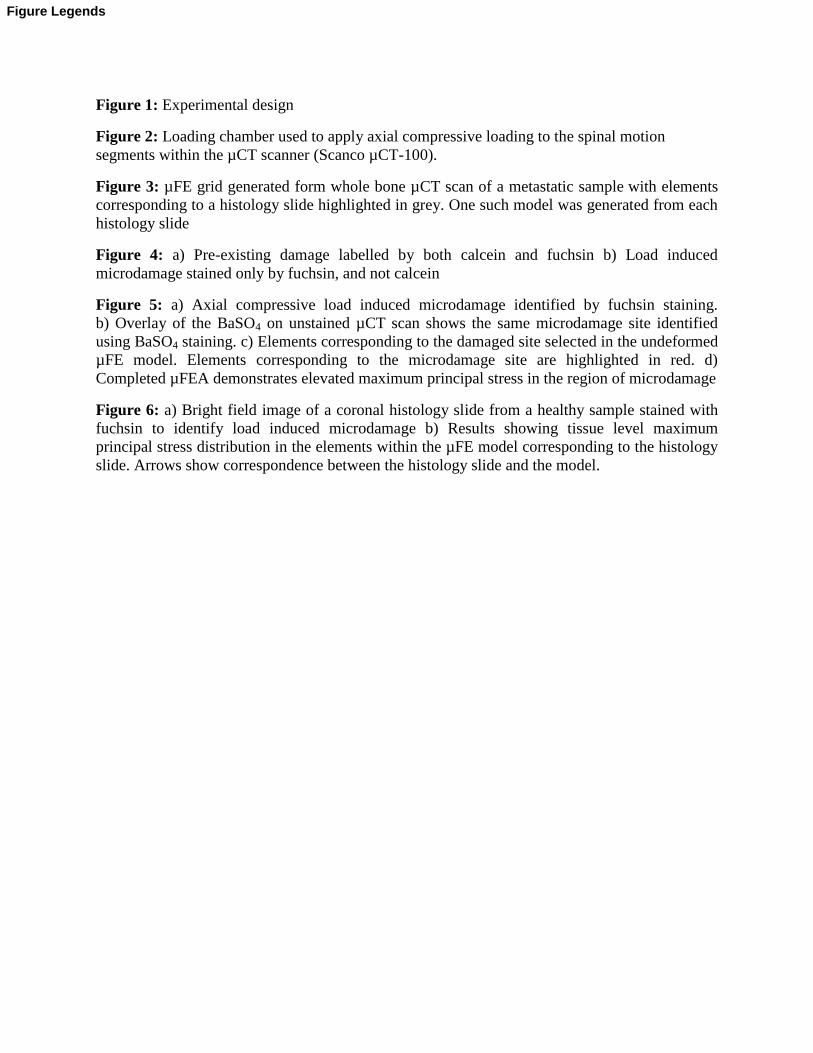
Figure 1: Experimental design
Figure 2: Loading chamber used to apply axial compressive loading to the spinal motion
segments within the µCT scanner (Scanco µCT-100).
Figure 3: µFE grid generated form whole bone µCT scan of a metastatic sample with elements
corresponding to a histology slide highlighted in grey. One such model was generated from each
histology slide
Figure 4: a) Pre-existing damage labelled by both calcein and fuchsin b) Load induced
microdamage stained only by fuchsin, and not calcein
Figure 5: a) Axial compressive load induced microdamage identified by fuchsin staining.
b) Overlay of the BaSO4 on unstained µCT scan shows the same microdamage site identified
using BaSO4 staining. c) Elements corresponding to the damaged site selected in the undeformed
µFE model. Elements corresponding to the microdamage site are highlighted in red. d)
Completed µFEA demonstrates elevated maximum principal stress in the region of microdamage
Figure 6: a) Bright field image of a coronal histology slide from a healthy sample stained with
fuchsin to identify load induced microdamage b) Results showing tissue level maximum
principal stress distribution in the elements within the µFE model corresponding to the histology
slide. Arrows show correspondence between the histology slide and the model.
Figure Legends
Figures
Figure 1
FigureClick here to download Figure: Figures.pdf
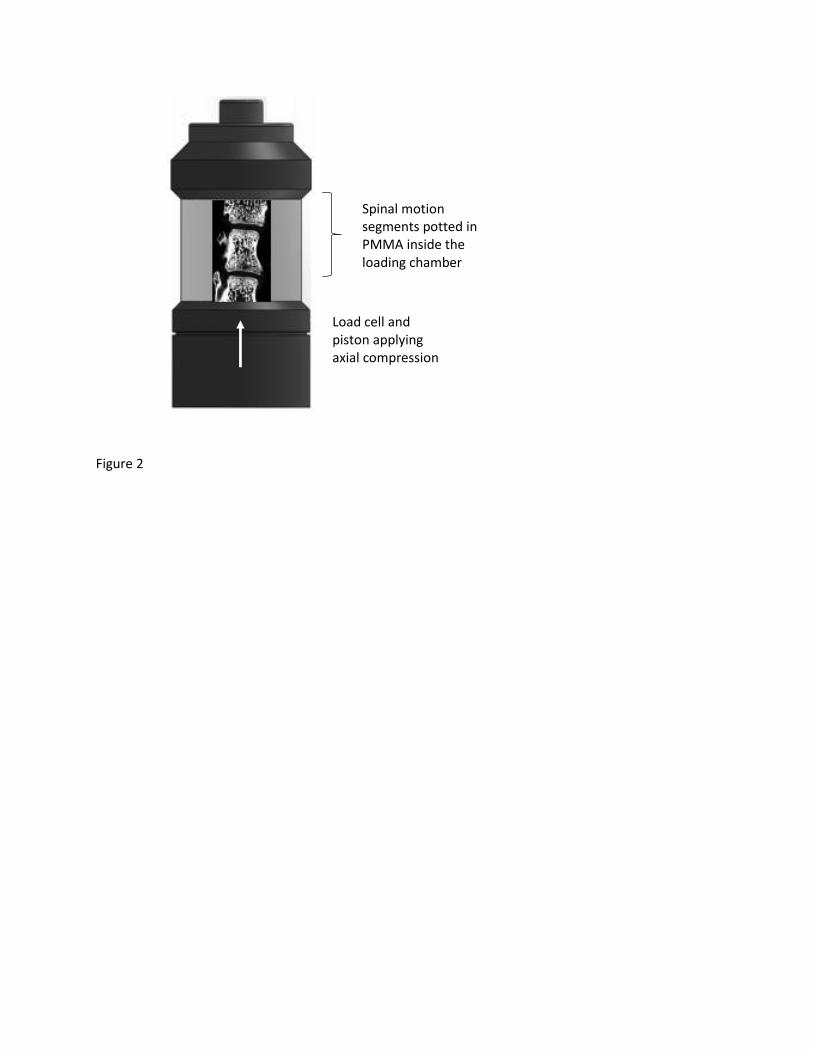
Figure 2
Spinal motion segments potted in PMMA inside the loading chamber
Load cell and piston applying axial compression
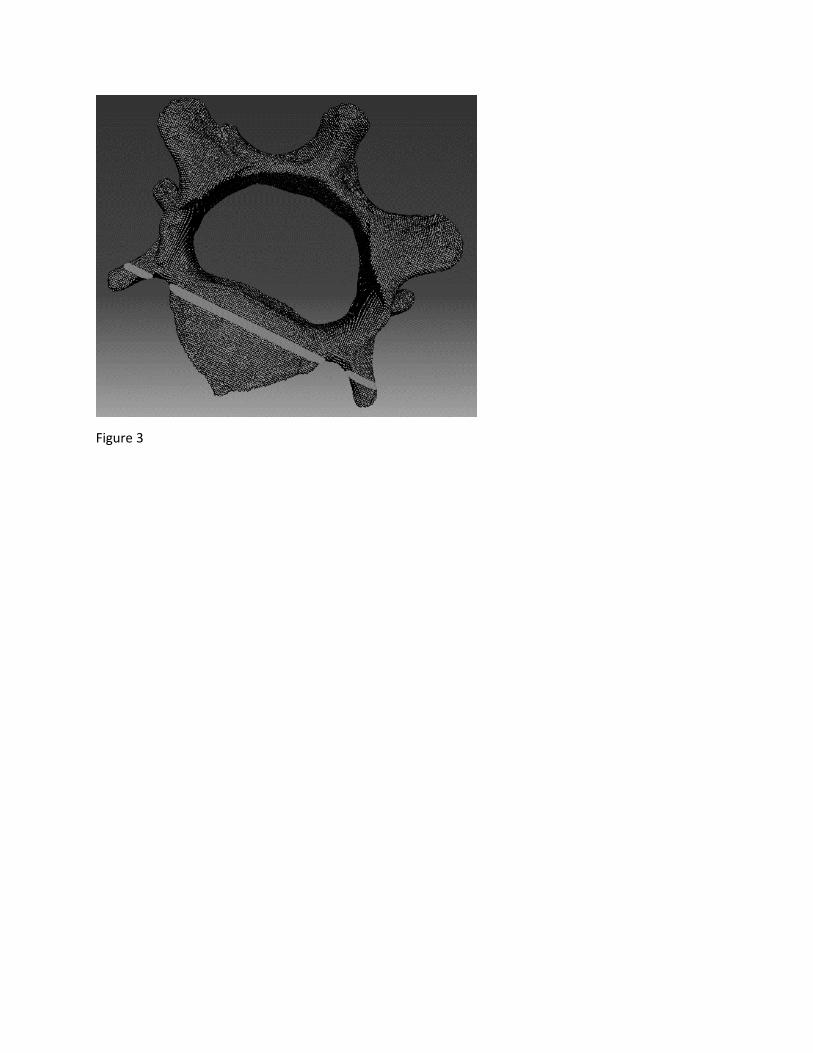
Figure 3
a)
b)
Figure 4
a) b)
c) d)
Figure 5
b) a)
Figure 6
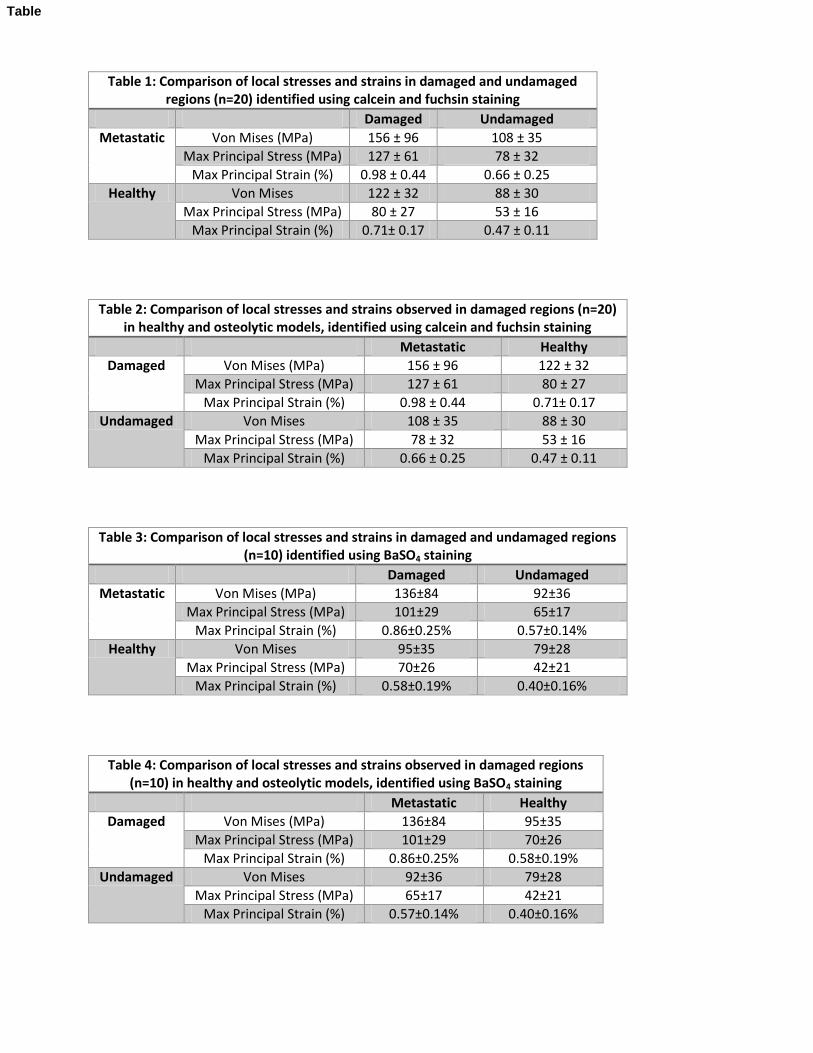
Table 1: Comparison of local stresses and strains in damaged and undamaged regions (n=20) identified using calcein and fuchsin staining
Damaged Undamaged
Metastatic Von Mises (MPa) 156 ± 96 108 ± 35
Max Principal Stress (MPa) 127 ± 61 78 ± 32
Max Principal Strain (%) 0.98 ± 0.44 0.66 ± 0.25
Healthy Von Mises 122 ± 32 88 ± 30
Max Principal Stress (MPa) 80 ± 27 53 ± 16
Max Principal Strain (%) 0.71± 0.17 0.47 ± 0.11
Table 2: Comparison of local stresses and strains observed in damaged regions (n=20) in healthy and osteolytic models, identified using calcein and fuchsin staining
Metastatic Healthy
Damaged Von Mises (MPa) 156 ± 96 122 ± 32
Max Principal Stress (MPa) 127 ± 61 80 ± 27
Max Principal Strain (%) 0.98 ± 0.44 0.71± 0.17
Undamaged Von Mises 108 ± 35 88 ± 30
Max Principal Stress (MPa) 78 ± 32 53 ± 16
Max Principal Strain (%) 0.66 ± 0.25 0.47 ± 0.11
Table 3: Comparison of local stresses and strains in damaged and undamaged regions (n=10) identified using BaSO4 staining
Damaged Undamaged
Metastatic Von Mises (MPa) 136±84 92±36
Max Principal Stress (MPa) 101±29 65±17
Max Principal Strain (%) 0.86±0.25% 0.57±0.14%
Healthy Von Mises 95±35 79±28
Max Principal Stress (MPa) 70±26 42±21
Max Principal Strain (%) 0.58±0.19% 0.40±0.16%
Table 4: Comparison of local stresses and strains observed in damaged regions (n=10) in healthy and osteolytic models, identified using BaSO4 staining
Metastatic Healthy
Damaged Von Mises (MPa) 136±84 95±35
Max Principal Stress (MPa) 101±29 70±26
Max Principal Strain (%) 0.86±0.25% 0.58±0.19%
Undamaged Von Mises 92±36 79±28
Max Principal Stress (MPa) 65±17 42±21
Max Principal Strain (%) 0.57±0.14% 0.40±0.16%
Table
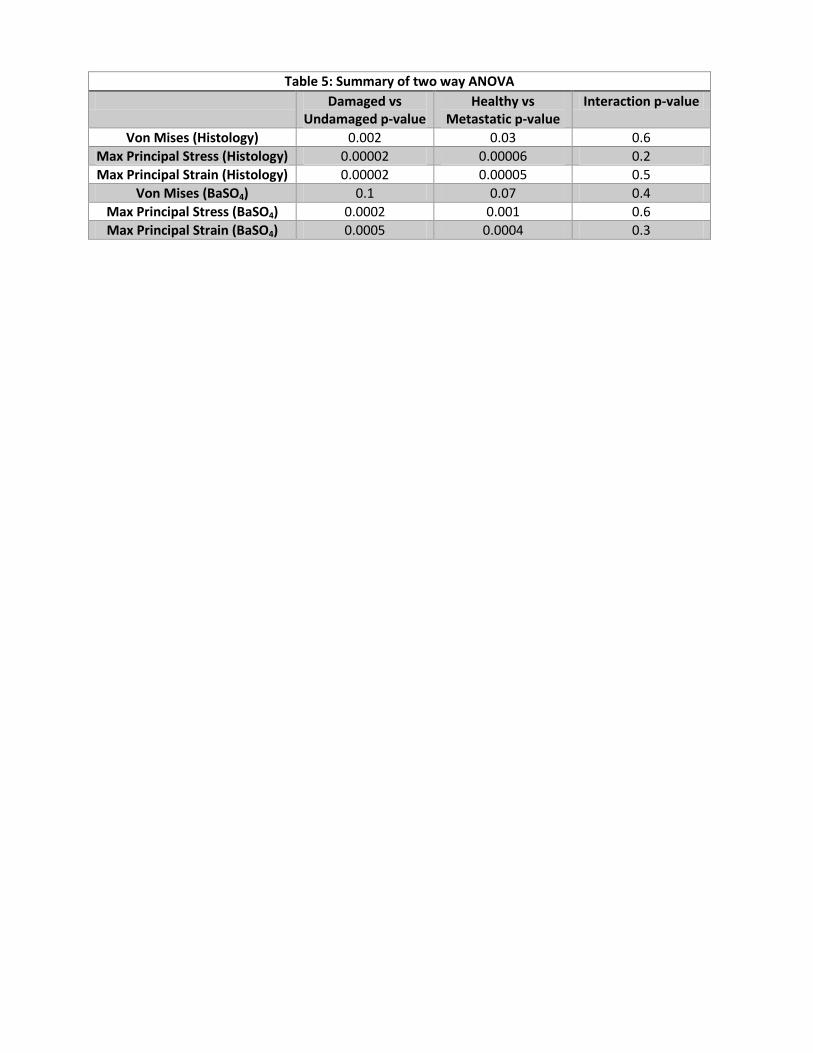
Table 5: Summary of two way ANOVA
Damaged vs Undamaged p-value
Healthy vs Metastatic p-value
Interaction p-value
Von Mises (Histology) 0.002 0.03 0.6
Max Principal Stress (Histology) 0.00002 0.00006 0.2
Max Principal Strain (Histology) 0.00002 0.00005 0.5
Von Mises (BaSO4) 0.1 0.07 0.4
Max Principal Stress (BaSO4) 0.0002 0.001 0.6
Max Principal Strain (BaSO4) 0.0005 0.0004 0.3