Eye - Arizona State University
36
Vision & Perception • Simple model: ¾ simple reflectance/illumination model Eye illumination source i(n 1 ,n 2 ) ¾ image: x(n 1 ,n 2 )=i(n 1 ,n 2 )r(n 1 ,n 2 ) reflectance term r(n 1 ,n 2 ) where 0 < i(n 1 ,n 2 ) < ∞ 0 < r(n 1 ,n 2 ) < 1 EEE 508
Transcript of Eye - Arizona State University
Vision & Perceptions o & e cept o
• Simple model:simple reflectance/illumination model
Eyeillumination source i(n1,n2)
image: x(n1,n2)=i(n1,n2)r(n1,n2)reflectance term r(n1,n2)
where 0 < i(n1,n2) < ∞0 < r(n1,n2) < 1
EEE 508
Vision & Perceptions o & e cept o
• Imaging on the retina (back of eye consisting of photoreceptors)
Focal point of lens Eye
2mRetinal image
17mm
20mm100m
EEE 508
Vision & Perceptions o & e cept o
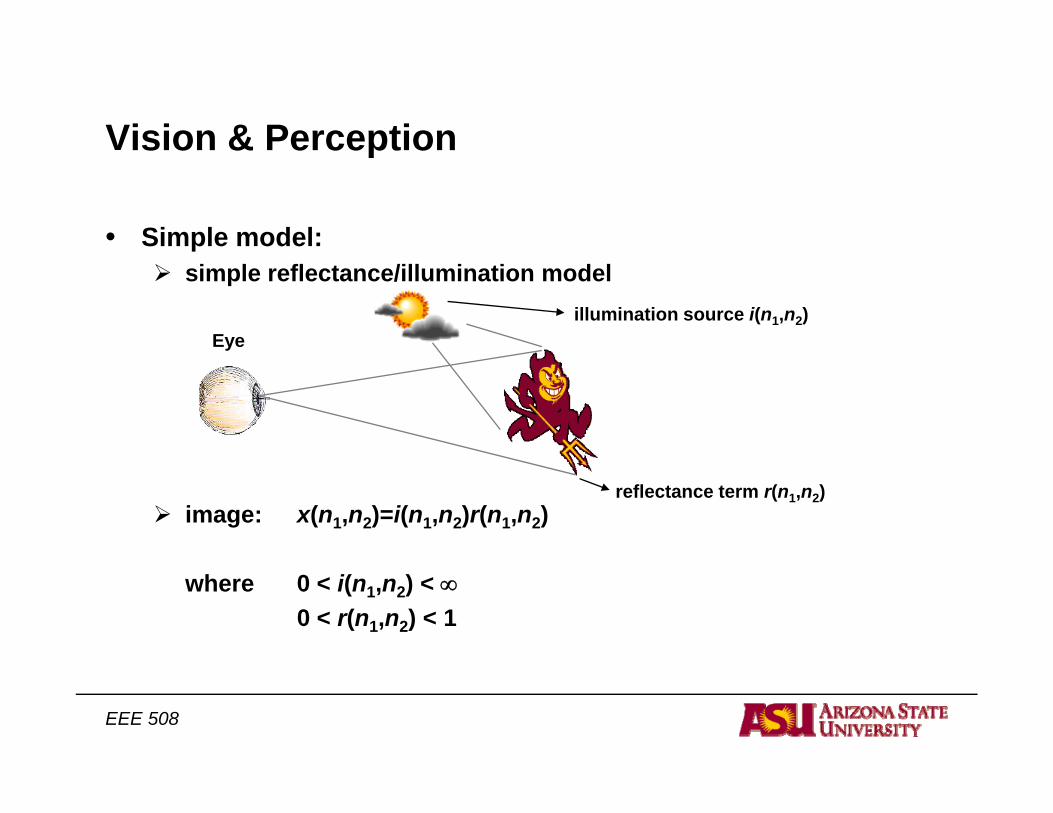
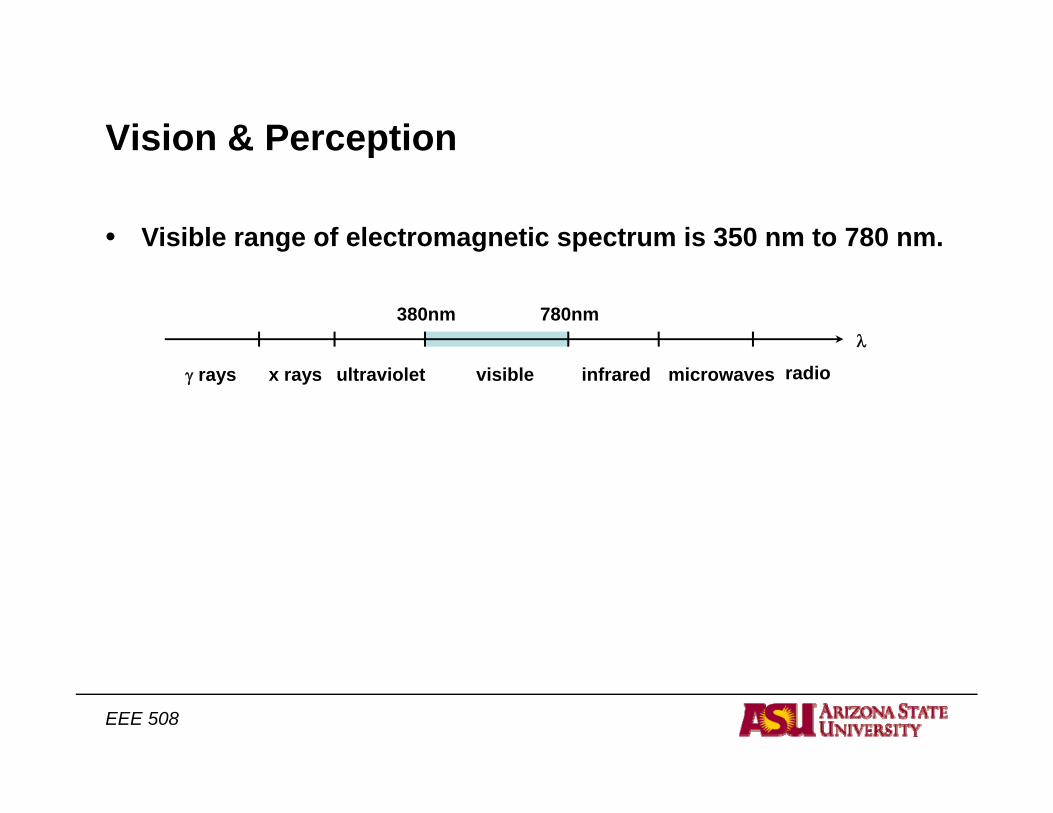
• Visible range of electromagnetic spectrum is 350 nm to 780 nm.
λ380nm 780nm
γ rays x rays ultraviolet visible infrared microwaves radio
EEE 508
Vision & Perception
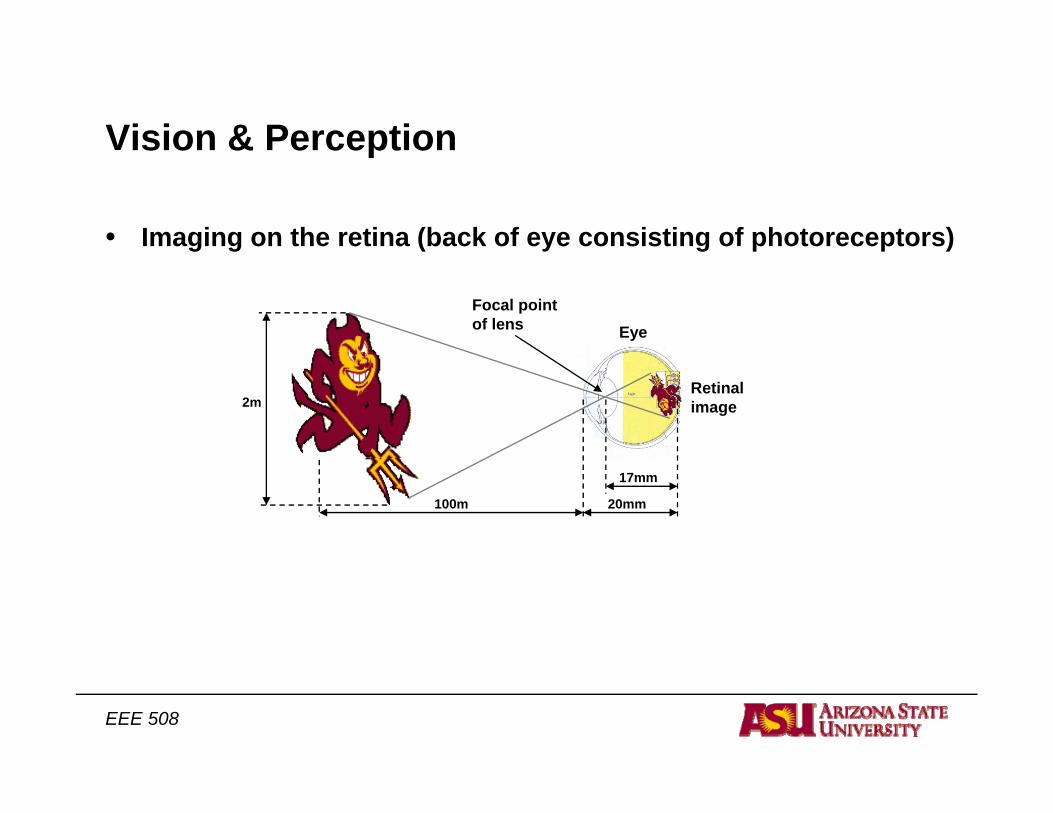
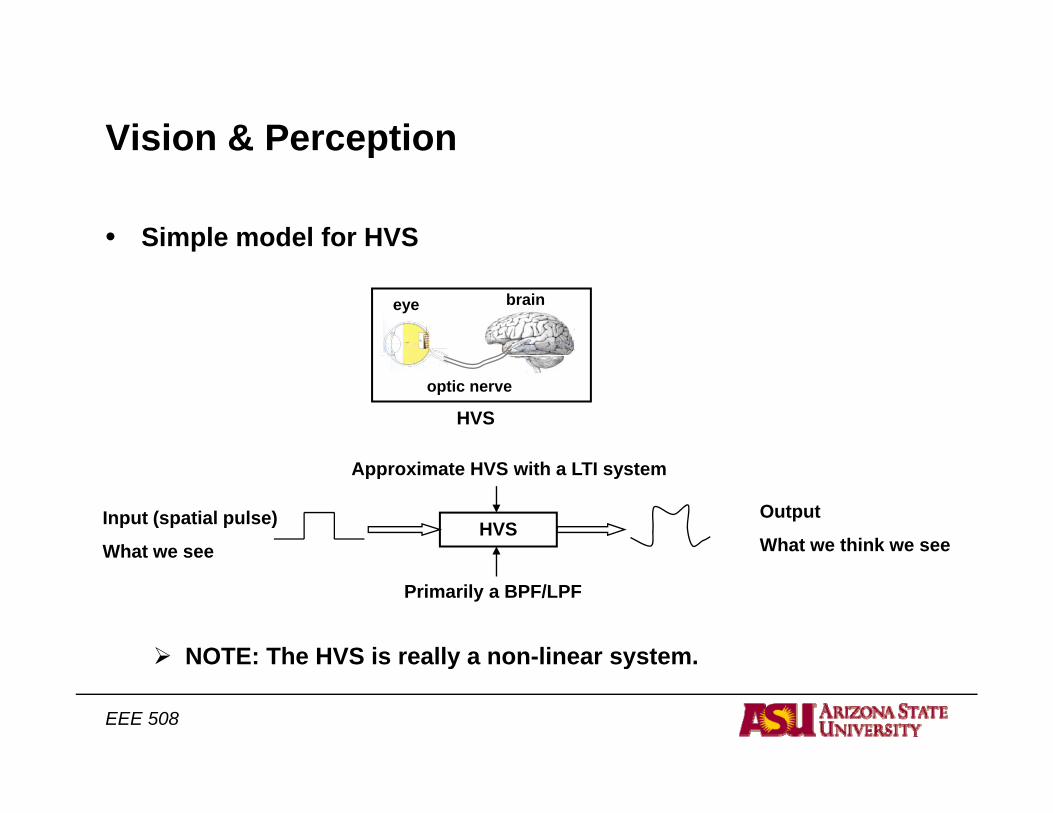
• Simple model for HVS
s o & e cept o
eye brain
optic nerve
HVS
HVSInput (spatial pulse)
What we see
Output
What we think we see
Approximate HVS with a LTI system
NOTE: The HVS is really a non-linear system.
Primarily a BPF/LPF
EEE 508
NOTE: The HVS is really a non linear system.
Vision & Perceptions o & e cept o
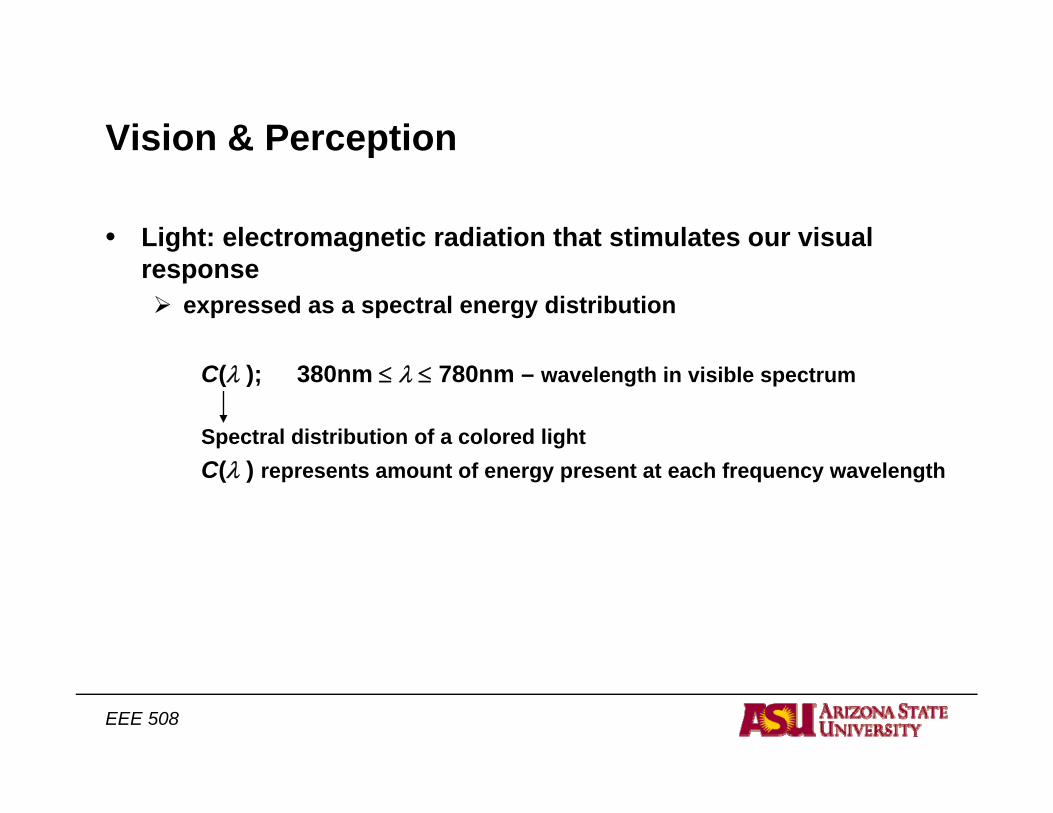
• Light: electromagnetic radiation that stimulates our visual response
expressed as a spectral energy distribution
C(λ ); 380nm ≤ λ ≤ 780nm – wavelength in visible spectrum
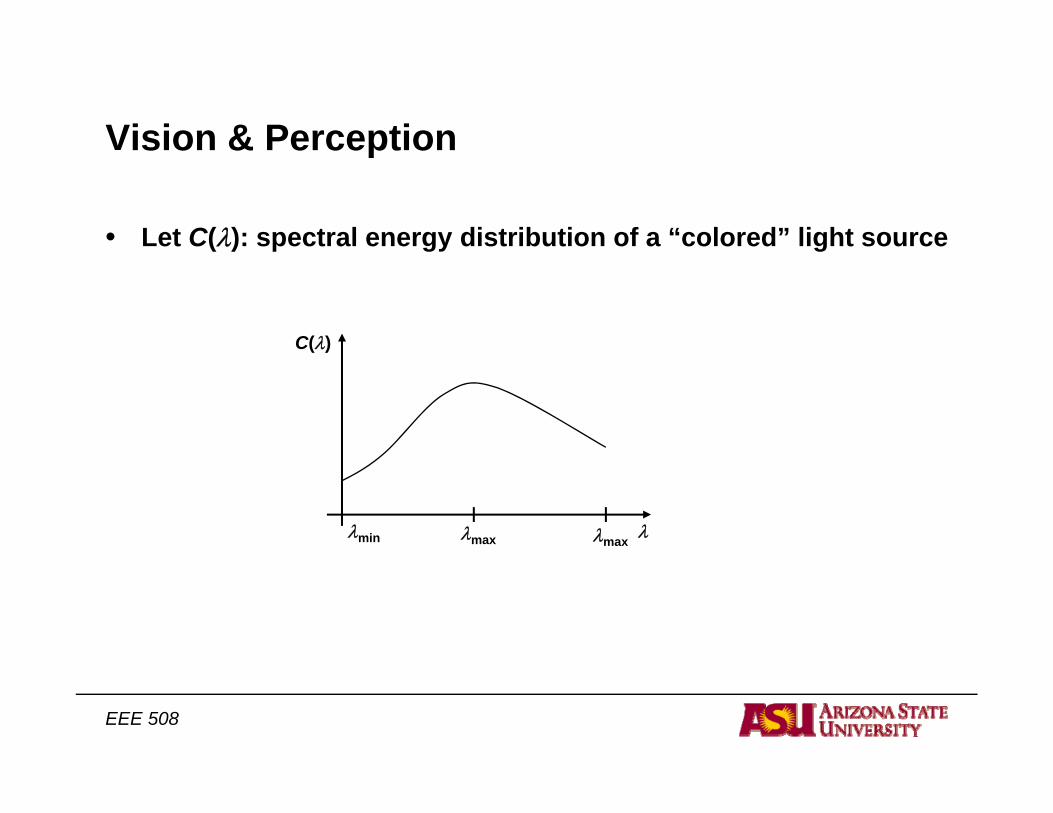
Spectral distribution of a colored lightC(λ ) represents amount of energy present at each frequency wavelength
EEE 508
Vision & Perceptions o & e cept o
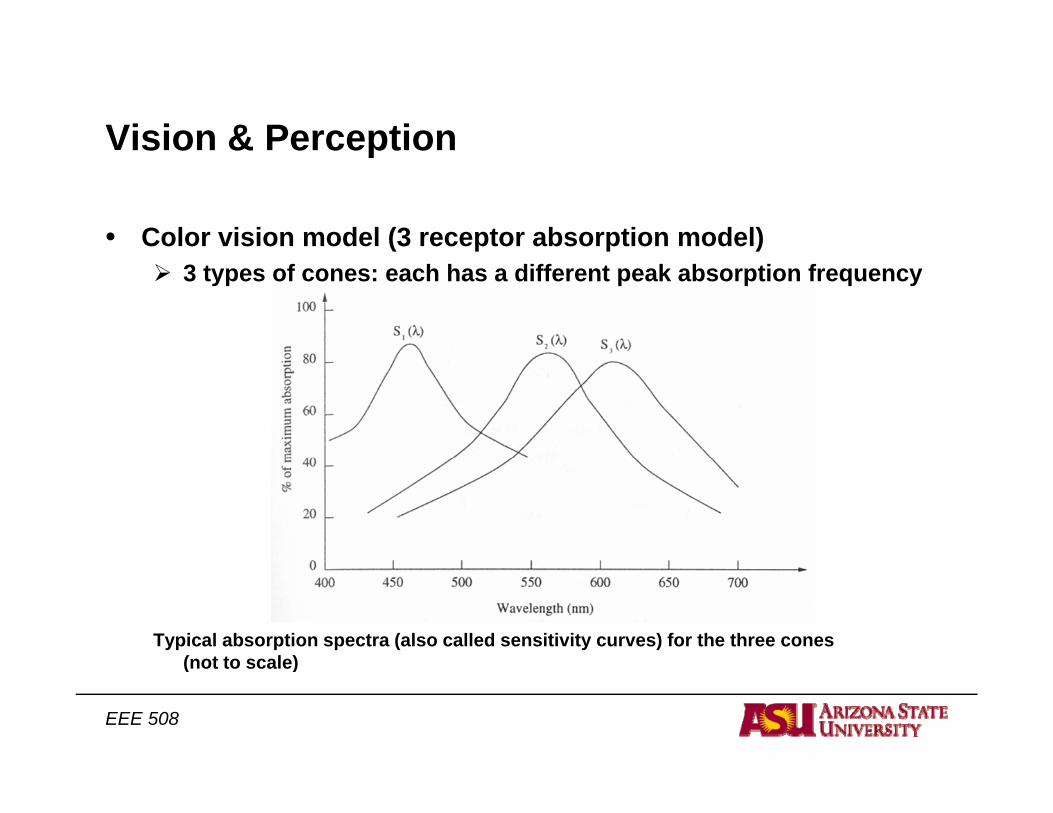
• Color vision model (3 receptor absorption model)3 types of cones: each has a different peak absorption frequency
Typical absorption spectra (also called sensitivity curves) for the three cones (not to scale)
EEE 508
(not to scale)
Vision & Perceptions o & e cept o
• Let C(λ): spectral energy distribution of a “colored” light source
C(λ)
λλmaxλmaxλmin
EEE 508
Vision & Perception
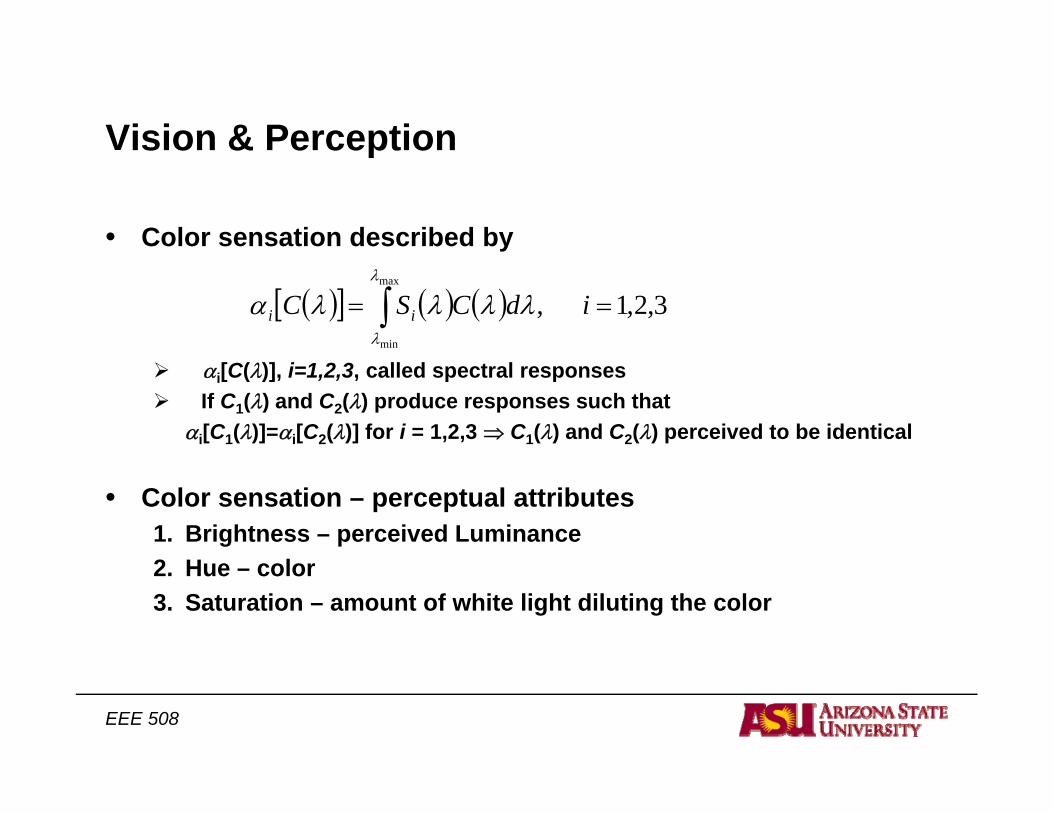
• Color sensation described by
s o & e cept o
( )[ ] ( ) ( ) 3,2,1,max
min
== ∫ idCSC ii
λ
λ
λλλλα
αi[C(λ)], i=1,2,3, called spectral responses If C1(λ) and C2(λ) produce responses such that
αi[C1(λ)]=αi[C2(λ)] for i = 1,2,3 ⇒ C1(λ) and C2(λ) perceived to be identical
• Color sensation – perceptual attributes1. Brightness – perceived Luminance2 H l2. Hue – color3. Saturation – amount of white light diluting the color
EEE 508
Vision & Perceptions o & e cept o
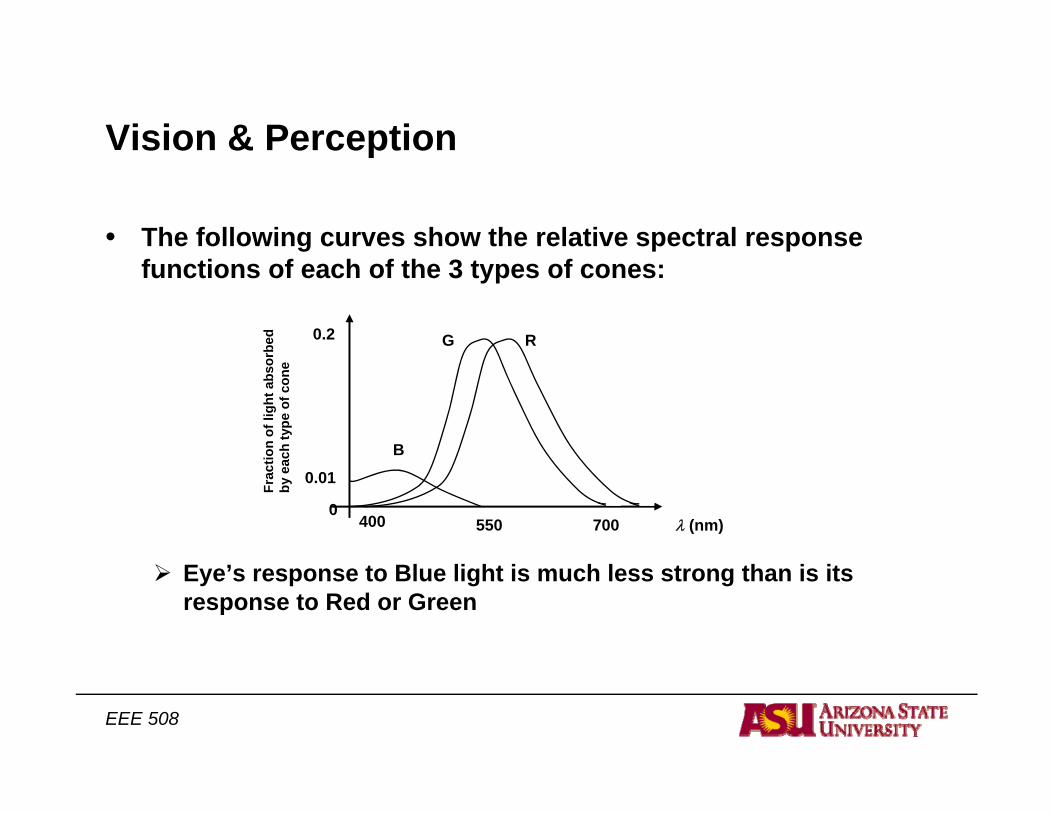
• The following curves show the relative spectral response functions of each of the 3 types of cones:
0.2 RG
rbed
Bion
of li
ght a
bsor
ch ty
pe o
f con
e
400 700550 λ (nm)0
0.01
Frac
tiby
eac
Eye’s response to Blue light is much less strong than is its response to Red or Green
EEE 508
Vision & Perceptions o & e cept o
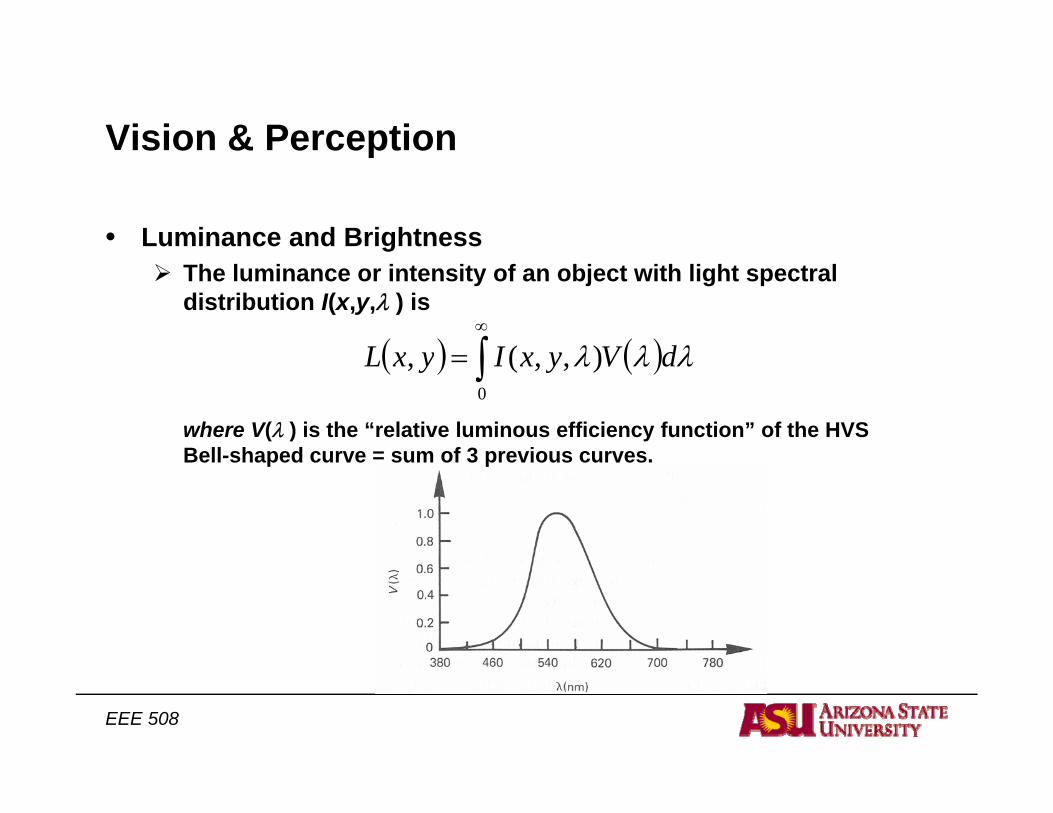
• Luminance and BrightnessThe luminance or intensity of an object with light spectral distribution I(x,y,λ ) is
( ) ( )∫∞
= )( λλλ dVyxIyxL
where V(λ ) is the “relative luminous efficiency function” of the HVS Bell-shaped curve = sum of 3 previous curves
( ) ( )∫=0
),,(, λλλ dVyxIyxL
Bell-shaped curve = sum of 3 previous curves.
EEE 508
Vision & Perceptions o & e cept o
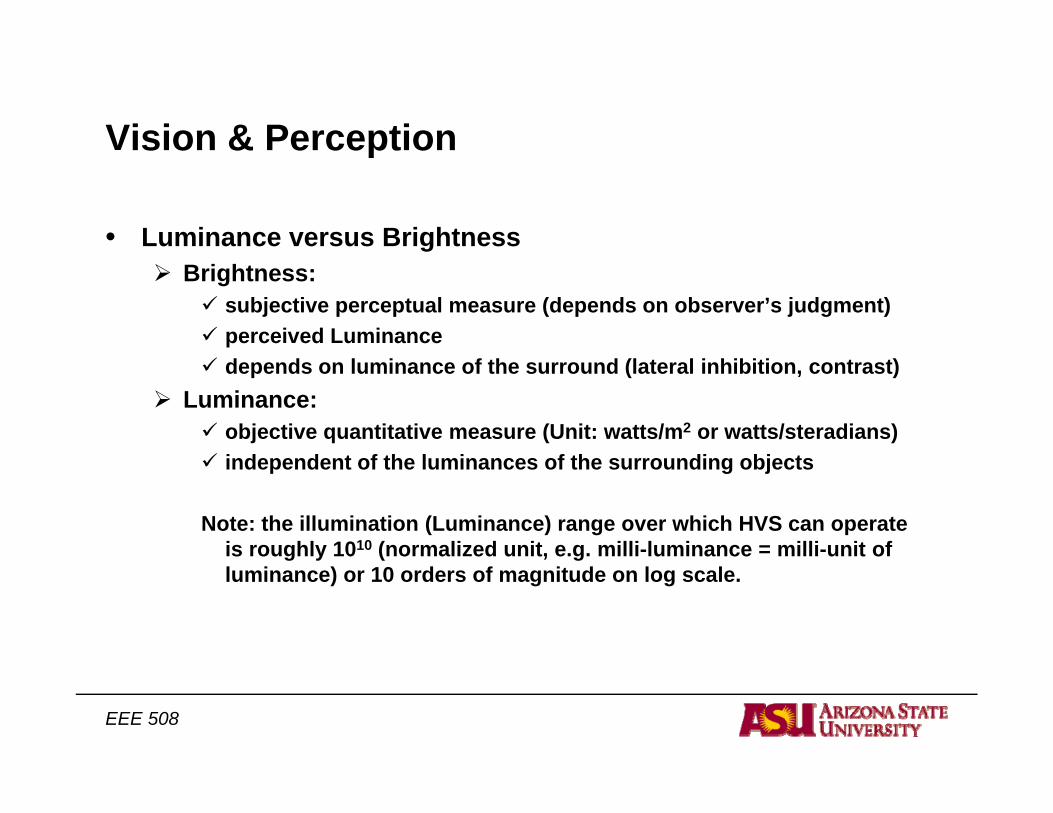
• Luminance versus Brightness Brightness:
subjective perceptual measure (depends on observer’s judgment)perceived Luminance depends on luminance of the surround (lateral inhibition, contrast)
Luminance:objective quantitative measure (Unit: watts/m2 or watts/steradians)i d d t f th l i f th di bj tindependent of the luminances of the surrounding objects
Note: the illumination (Luminance) range over which HVS can operate is roughly 1010 (normalized unit, e.g. milli-luminance = milli-unit of g y ( gluminance) or 10 orders of magnitude on log scale.
EEE 508
Vision & Perceptions o & e cept o
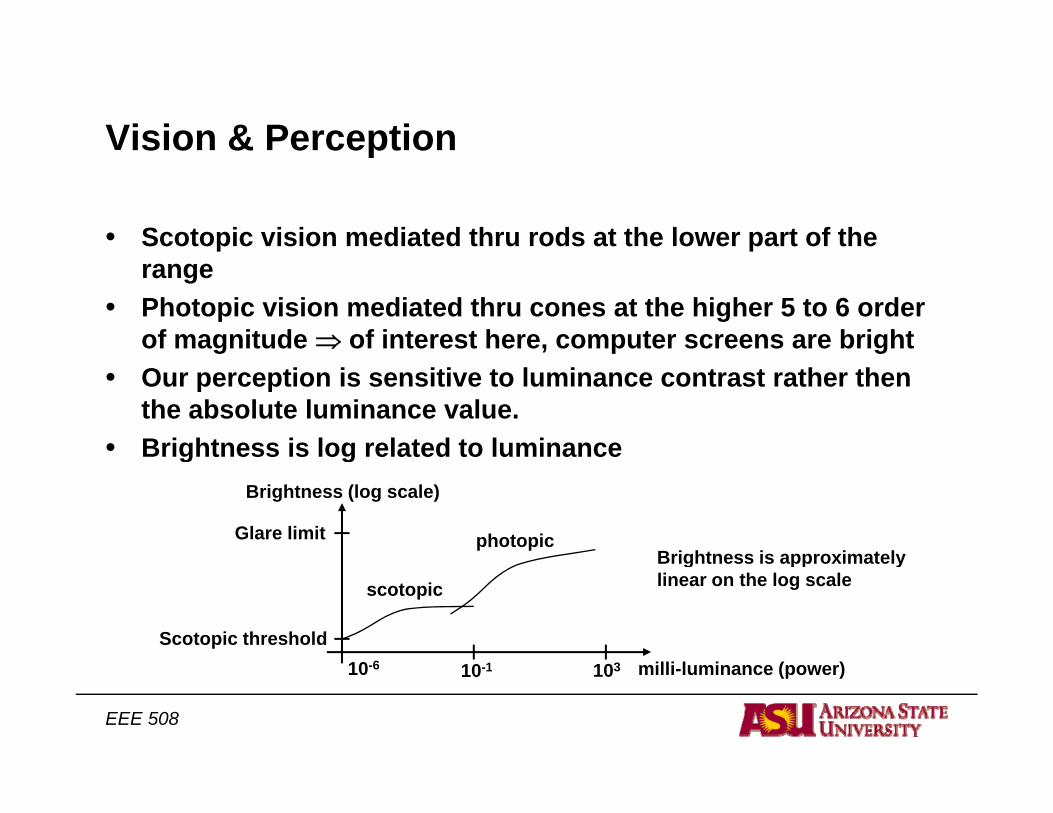
• Scotopic vision mediated thru rods at the lower part of the range
• Photopic vision mediated thru cones at the higher 5 to 6 order of magnitude ⇒ of interest here, computer screens are bright
• Our perception is sensitive to luminance contrast rather then the absolute luminance value.
• Brightness is log related to luminance g g
Glare limit photopic
Brightness (log scale)
Brightness is approximately
3 illi l i ( )110 6
Scotopic threshold
scotopicBrightness is approximately linear on the log scale
EEE 508
103 milli-luminance (power)10-110-6
Vision & Perceptions o & e cept o
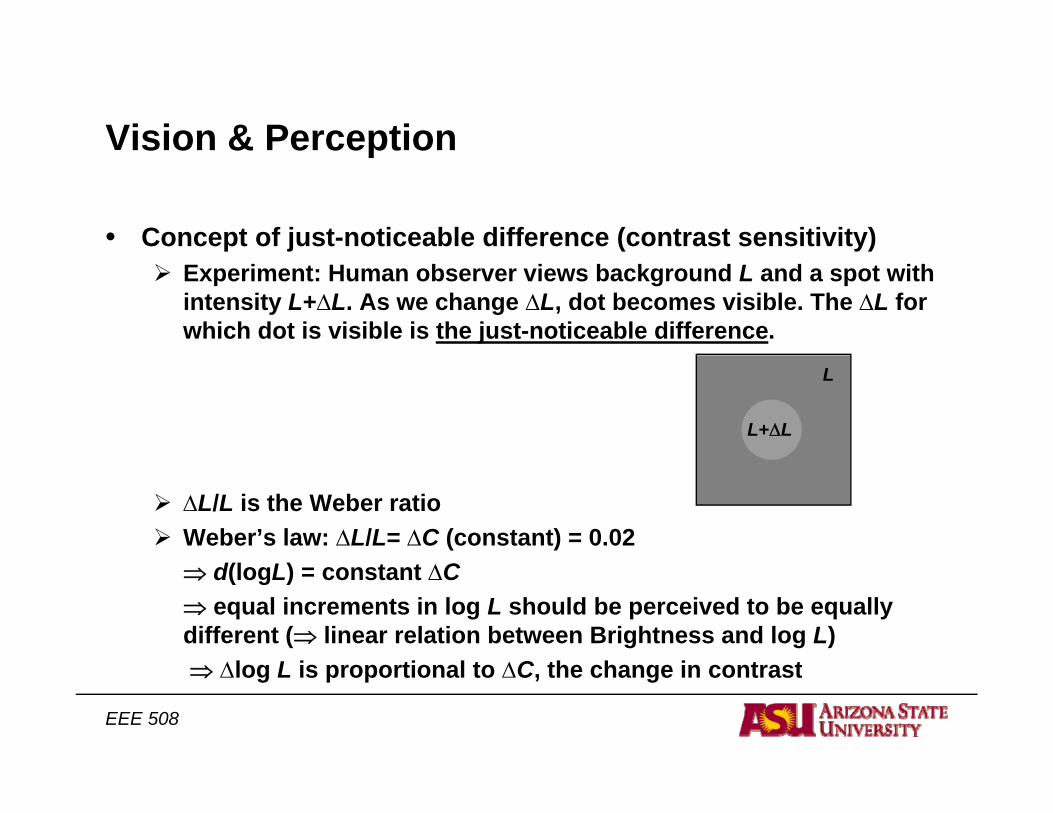
• Concept of just-noticeable difference (contrast sensitivity)Experiment: Human observer views background L and a spot with intensity L+ΔL. As we change ΔL, dot becomes visible. The ΔL for which dot is visible is the just-noticeable difference.
L
L+ΔL
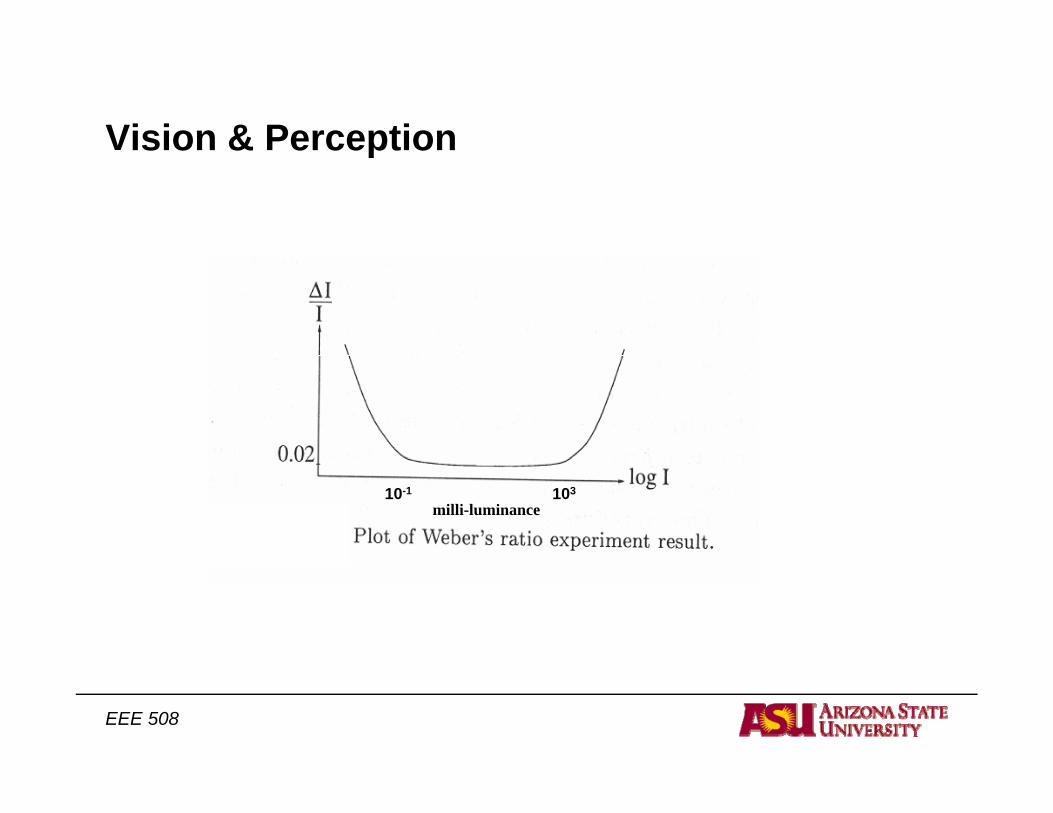
ΔL/L is the Weber ratioWeber’s law: ΔL/L= ΔC (constant) = 0.02 ⇒ d(logL) = constant ΔC⇒ equal increments in log L should be perceived to be equally different (⇒ linear relation between Brightness and log L)
Δl L i ti l t ΔC th h i t t
EEE 508
⇒ Δlog L is proportional to ΔC, the change in contrast
Vision & Perceptions o & e cept o
milli-luminance 10-1 103
EEE 508
Vision & Perceptions o & e cept o
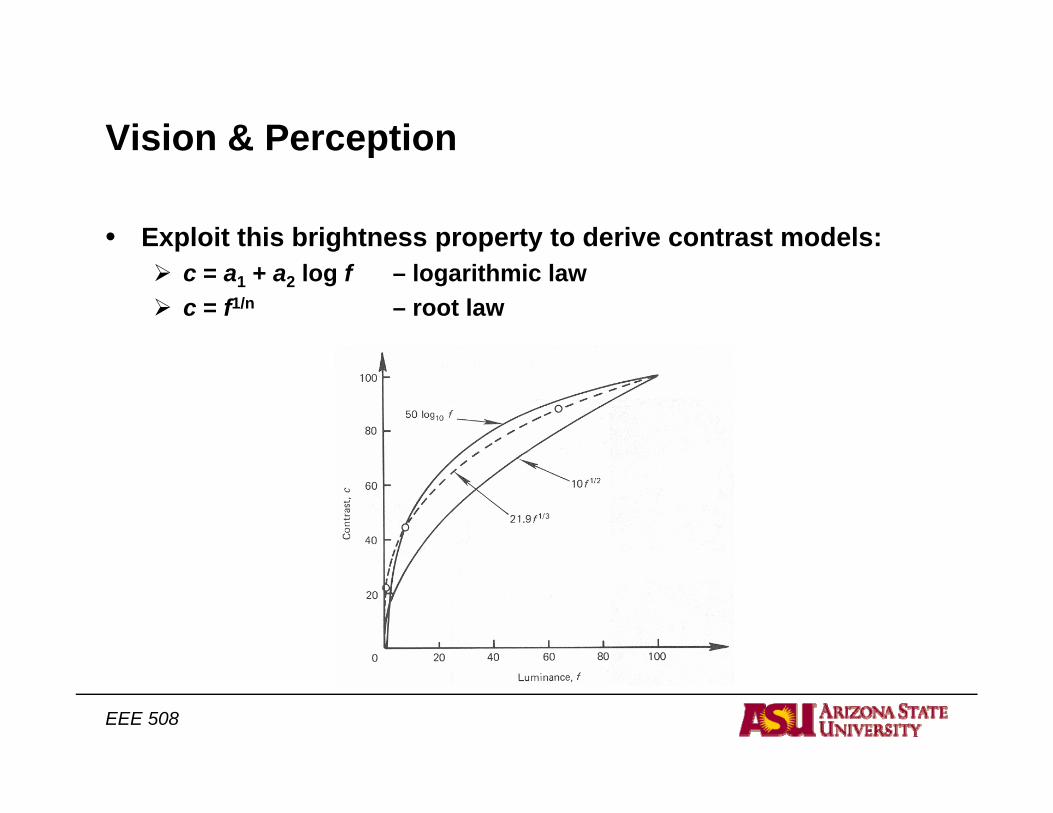
• Exploit this brightness property to derive contrast models: c = a1 + a2 log f – logarithmic lawc = f1/n – root law
EEE 508
Vision & Perceptions o & e cept o
EEE 508

Vision & Perceptions o & e cept o
• Visual Acuity Ability to detect spatial details; spatial frequency sensitivity of the eye
EEE 508
Vision & Perceptions o & e cept o
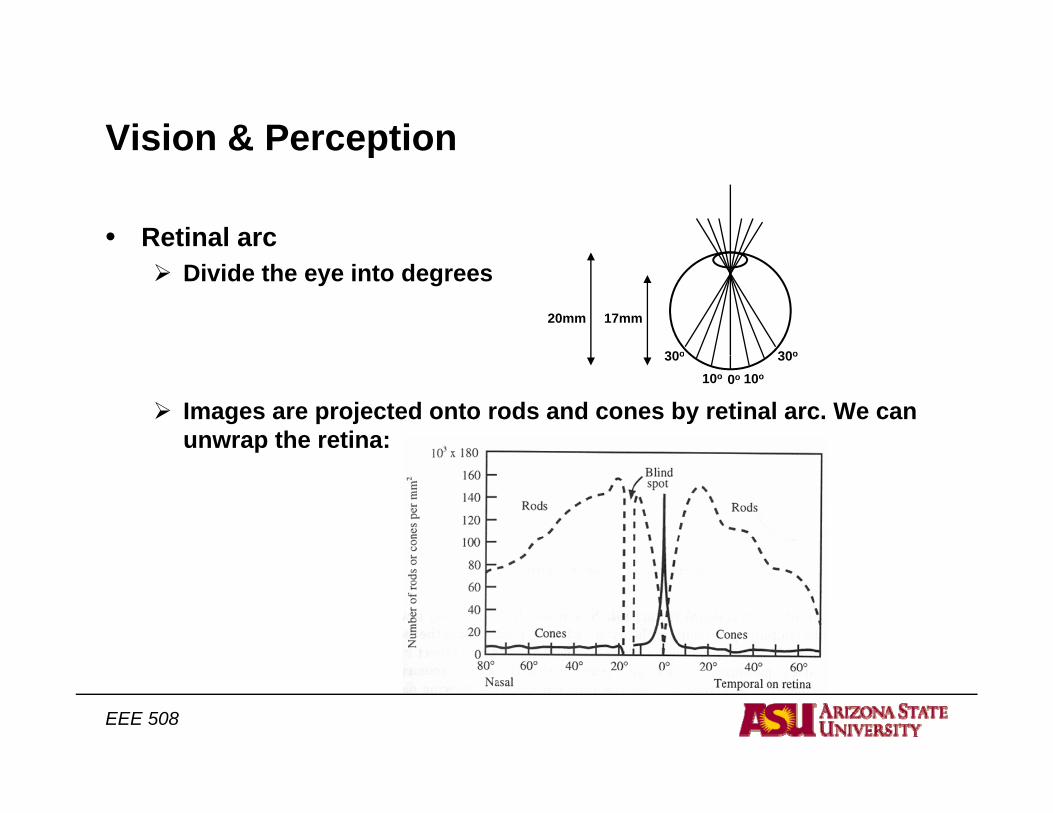
• Retinal arcDivide the eye into degrees
30o30o
17mm20mm
Images are projected onto rods and cones by retinal arc. We can unwrap the retina:
10o 0o 10o
30o30o
EEE 508
Vision & Perceptions o & e cept o
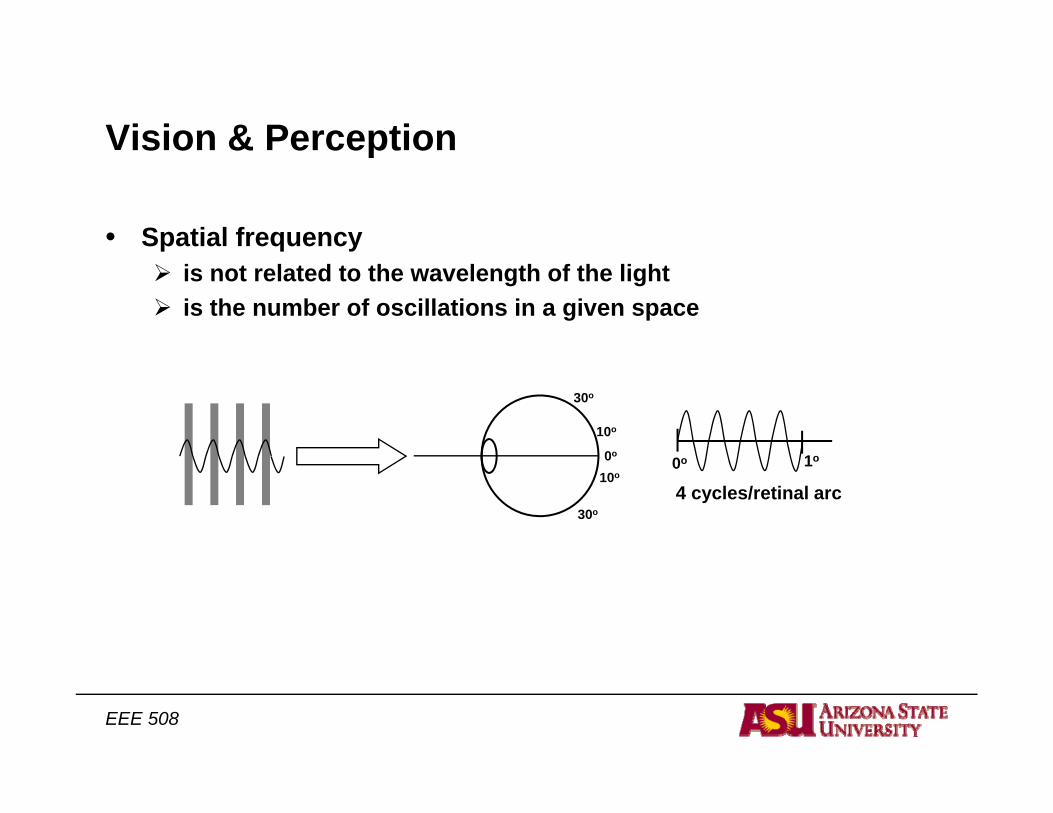
• Spatial frequency is not related to the wavelength of the light is the number of oscillations in a given space
0o
10o
30o
0 1o
10o
0
30o
0o 1o
4 cycles/retinal arc
EEE 508
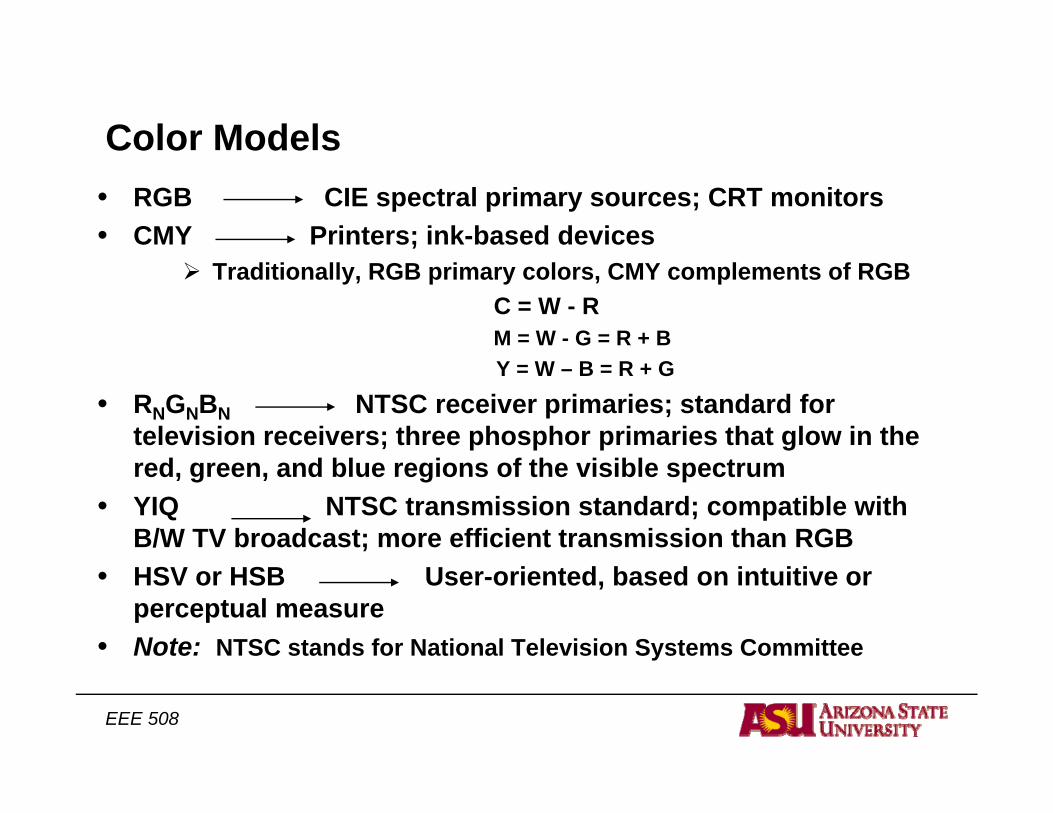
Color ModelsCo o ode s• RGB CIE spectral primary sources; CRT monitors• CMY Printers; ink-based devices
Traditionally, RGB primary colors, CMY complements of RGB C = W - RM = W - G = R + BY = W – B = R + G
• RNGNBN NTSC receiver primaries; standard for television receivers; three phosphor primaries that glow in the
d d bl i f h i iblred, green, and blue regions of the visible spectrum • YIQ NTSC transmission standard; compatible with
B/W TV broadcast; more efficient transmission than RGB• HSV or HSB User-oriented, based on intuitive or
perceptual measure• Note: NTSC stands for National Television Systems Committee
EEE 508
Color Models
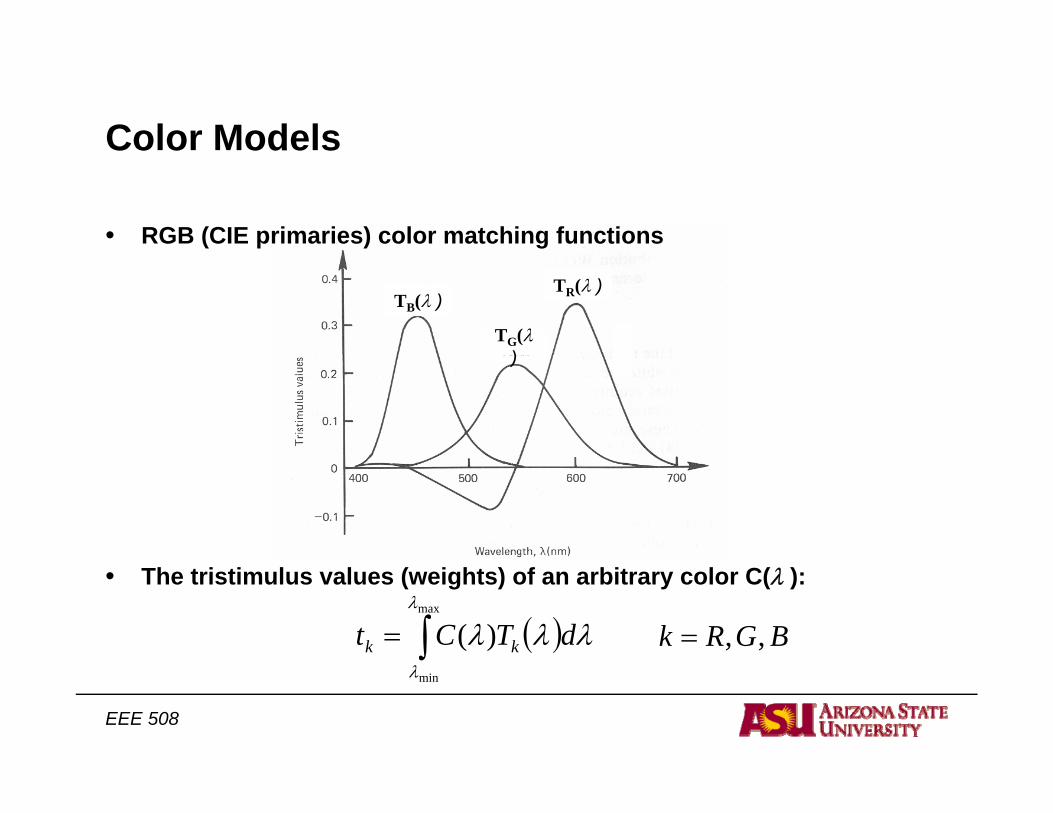
• RGB (CIE primaries) color matching functions
Co o ode s
TG(λ)
TB(λ )TR(λ )
)
• The tristimulus values (weights) of an arbitrary color C(λ ):
( )∫=max
)(λ
λλλ dTCt kk BGRk ,,=
EEE 508
minλ
Color ModelsCo o ode s
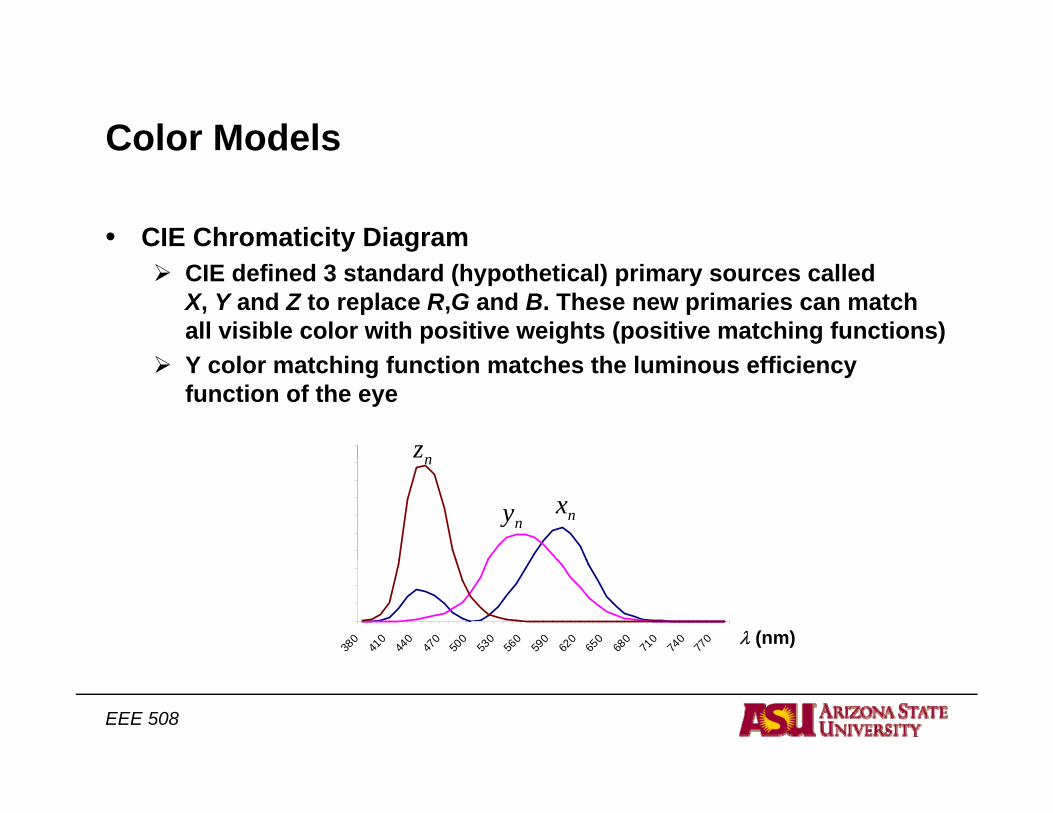
• CIE Chromaticity DiagramCIE defined 3 standard (hypothetical) primary sources called X, Y and Z to replace R,G and B. These new primaries can match all visible color with positive weights (positive matching functions) Y color matching function matches the luminous efficiency function of the eye
1 82
nz
0.81
1.21.41.61.8
nxny
n
λ (nm)0
0.20.40.6
380
410
440
470
500
530
560
590
620
650
680
710
740
770
EEE 508
Color ModelsCo o ode s
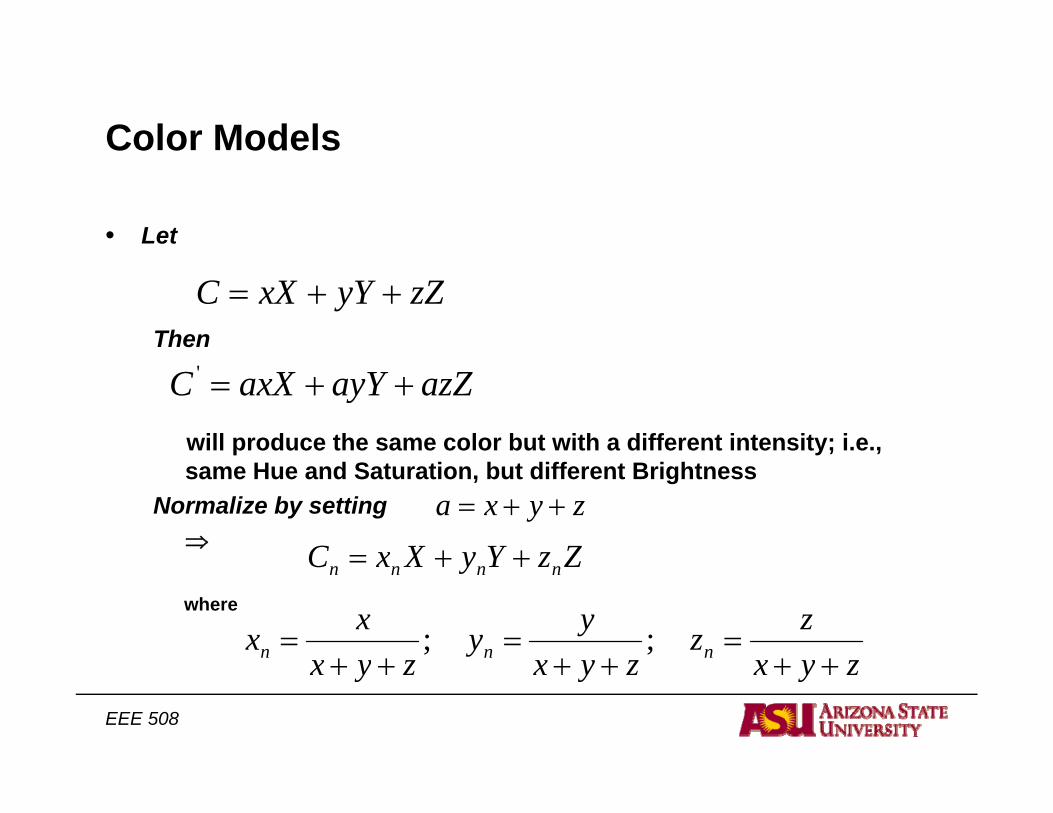
• Let
Then
zZyYxXC ++=
will produce the same color but with a different intensity; i.e.,
azZayYaxXC ++='
same Hue and Saturation, but different BrightnessNormalize by setting
⇒zyxa ++=
ZzYyXxC ++=where
zyxzz
zyxyy
zyxxx nnn ++
=++
=++
= ;;
ZzYyXxC nnnn ++=
EEE 508
zyxzyxzyx ++++++
Color ModelsCo o ode s
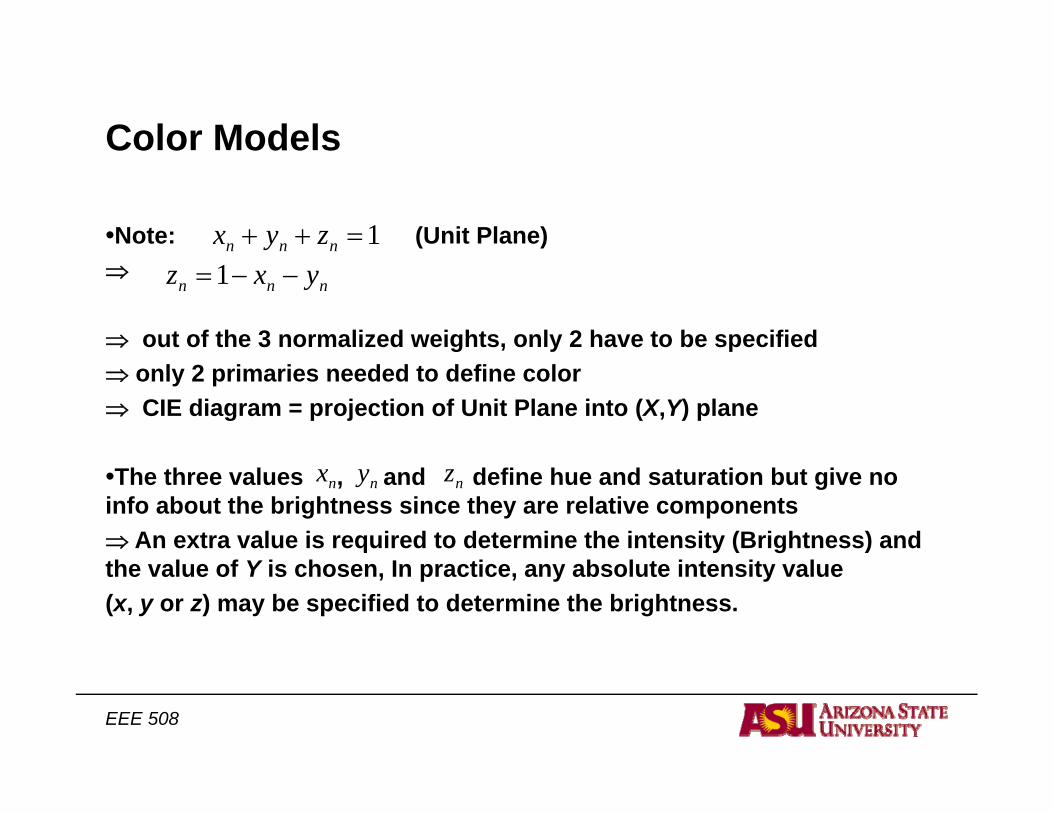
•Note: (Unit Plane)1=++ nnn zyx⇒
⇒ out of the 3 normalized weights, only 2 have to be specified
nnn yxz −−=1
⇒ only 2 primaries needed to define color ⇒ CIE diagram = projection of Unit Plane into (X,Y) plane
•The three values , and define hue and saturation but give no info about the brightness since they are relative components ⇒ An extra value is required to determine the intensity (Brightness) and th l f Y i h I ti b l t i t it l
nznynx
the value of Y is chosen, In practice, any absolute intensity value (x, y or z) may be specified to determine the brightness.
EEE 508
Color ModelsCo o ode s
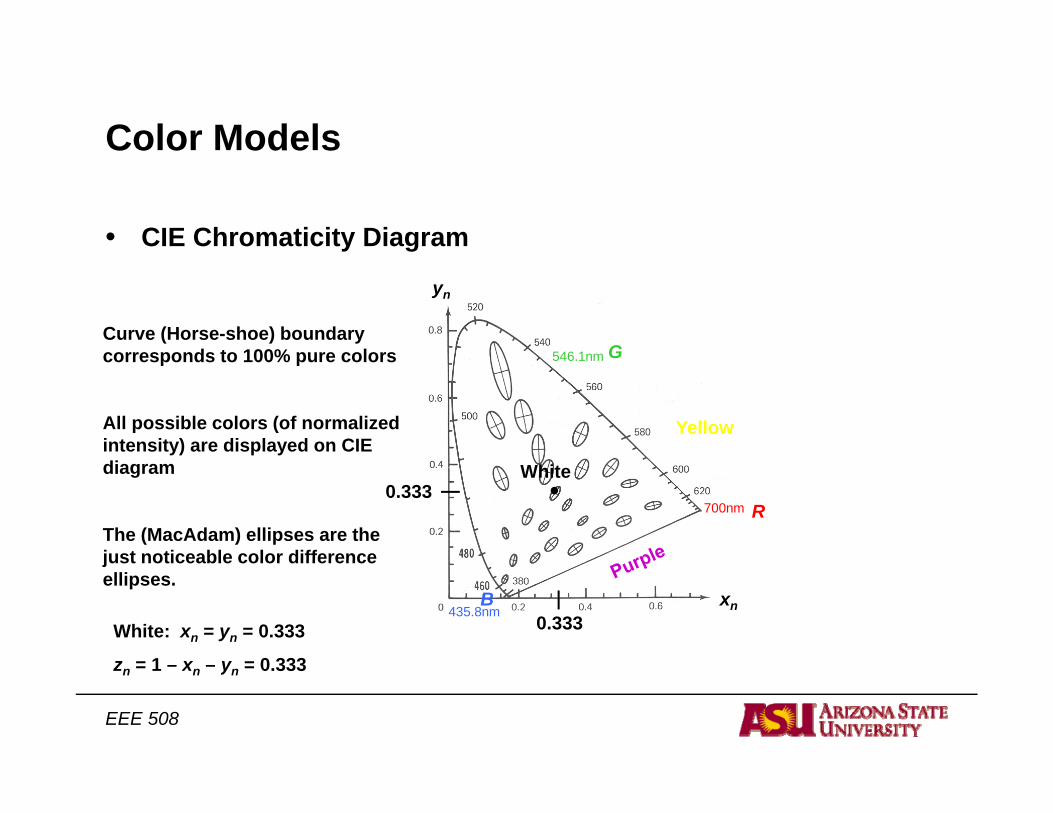
• CIE Chromaticity Diagram
Curve (Horse-shoe) boundary corresponds to 100% pure colors G
yn
546 1nmcorresponds to 100% pure colors
All possible colors (of normalized intensity) are displayed on CIE
Yellow
G546.1nm
diagram
The (MacAdam) ellipses are the just noticeable color difference
R
White
700nm0.333
just noticeable color difference ellipses.
White: xn = yn = 0.333
z = 1 x y = 0 333
0.333B xn435.8nm
EEE 508
zn = 1 – xn – yn = 0.333
Color Models• YIQ:
NTSC transmission standardY L i ( CIE Y i ) l t hi f ti
Co o ode s
Y = Luminance (same as CIE Y primary); color matching function identical to luminous efficiency function V(λ )I and Q: chrominance components (give hue and saturation) Recoding of R G B for transmission efficiencyRecoding of RNGNBN for transmission efficiency
Transmission efficiency: Bandwidth of I or Q < half bandwidth of Y ⇒ NTSC encoding of YIQ into a broadcast signal assigns:
4 MHz to Y to1.5 MHz to I 0.6 MHz to Q
⇒ I and Q components contain less information⇒ less samples (more than 50%less) used to represent I and Q
Downward compatibility with B/W TV receivers (Y component)
EEE 508
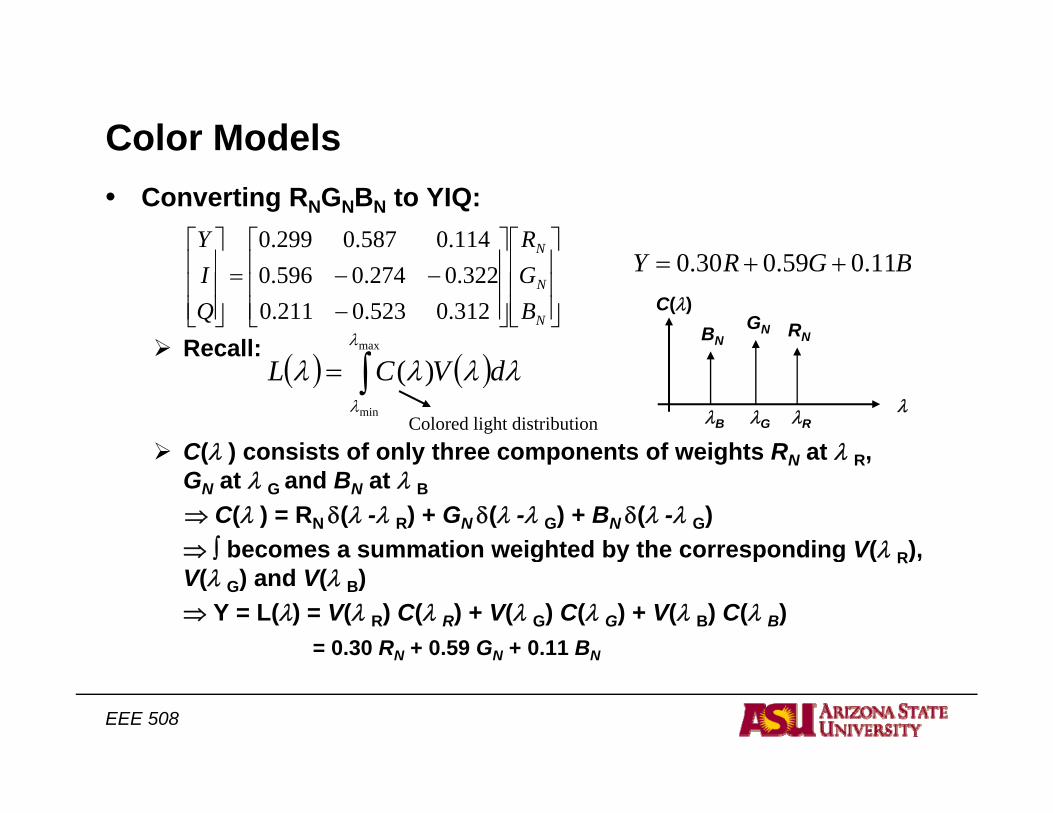
Color ModelsCo o ode s• Converting RNGNBN to YIQ:
⎥⎤
⎢⎡⎥⎤
⎢⎡
⎥⎤
⎢⎡ NRY 114.0587.0299.0
Recall:⎥⎥⎥
⎦⎢⎢⎢
⎣⎥⎥⎥
⎦⎢⎢⎢
⎣ −−−=
⎥⎥⎥
⎦⎢⎢⎢
⎣ N
N
N
BG
QI
312.0523.0211.0322.0274.0596.0 BGRY 11.059.030.0 ++=
C(λ)BN
GN RN
( ) ( )∫maxλRecall:
C(λ ) consists of only three components of weights RN at λ R,
λλRλGλB
( ) ( )∫=min
)(λ
λλλλ dVCL
Colored light distributionC(λ ) consists of only three components of weights RN at λ R, GN at λ G and BN at λ B
⇒ C(λ ) = RN δ(λ -λ R) + GN δ(λ -λ G) + BN δ(λ -λ G) ⇒ ∫ becomes a summation weighted by the corresponding V(λ R), g y p g ( R),V(λ G) and V(λ B)⇒ Y = L(λ) = V(λ R) C(λ R) + V(λ G) C(λ G) + V(λ B) C(λ B)
= 0.30 RN + 0.59 GN + 0.11 BN
EEE 508
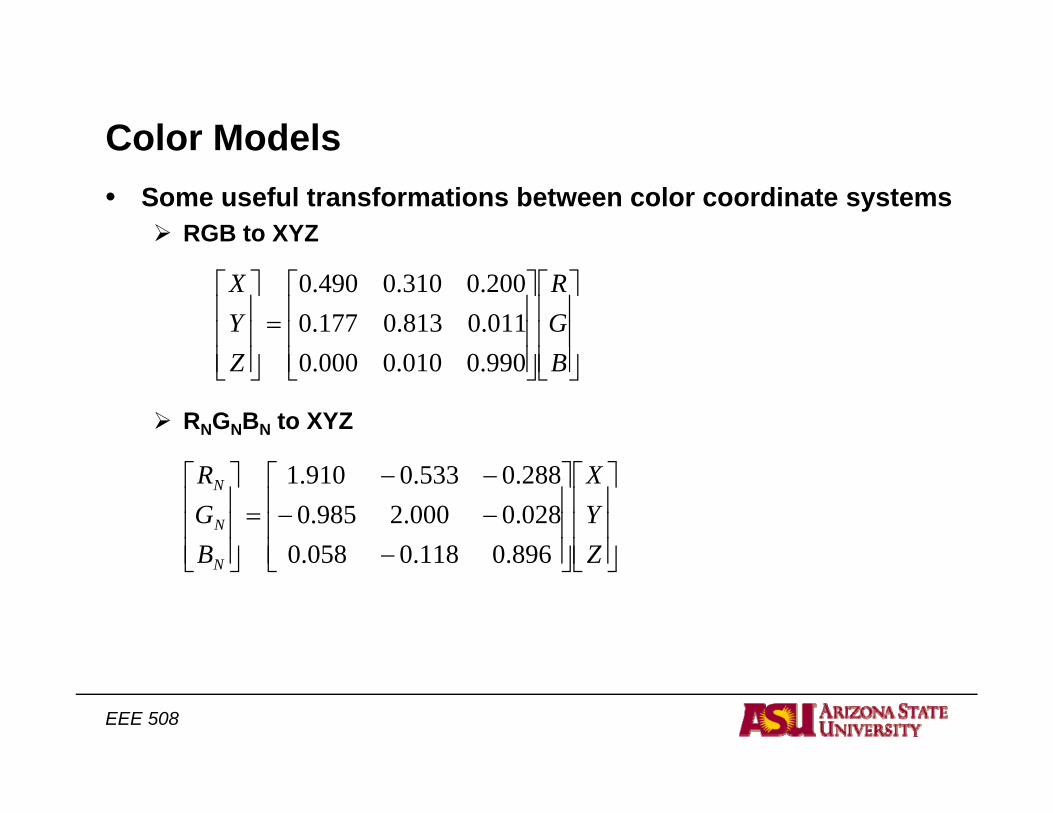
Color ModelsCo o ode s• Some useful transformations between color coordinate systems
RGB to XYZ
⎥⎥⎥
⎦
⎤
⎢⎢⎢
⎣
⎡
⎥⎥⎥
⎦
⎤
⎢⎢⎢
⎣
⎡=
⎥⎥⎥
⎦
⎤
⎢⎢⎢
⎣
⎡
BGR
ZYX
990001000000011.0813.0177.0200.0310.0490.0
RNGNBN to XYZ
⎥⎦⎢⎣⎥⎦⎢⎣⎥⎦⎢⎣ BZ 990.0010.0000.0
⎥⎥⎥
⎦
⎤
⎢⎢⎢
⎣
⎡
⎥⎥⎥
⎦
⎤
⎢⎢⎢
⎣
⎡
−−−−−
=⎥⎥⎥
⎦
⎤
⎢⎢⎢
⎣
⎡
ZYX
BGR
N
N
N
896.0118.0058.0028.0000.2985.0288.0533.0910.1
⎥⎦⎢⎣⎥⎦⎢⎣⎥⎦⎢⎣ ZBN 896.0118.0058.0
EEE 508
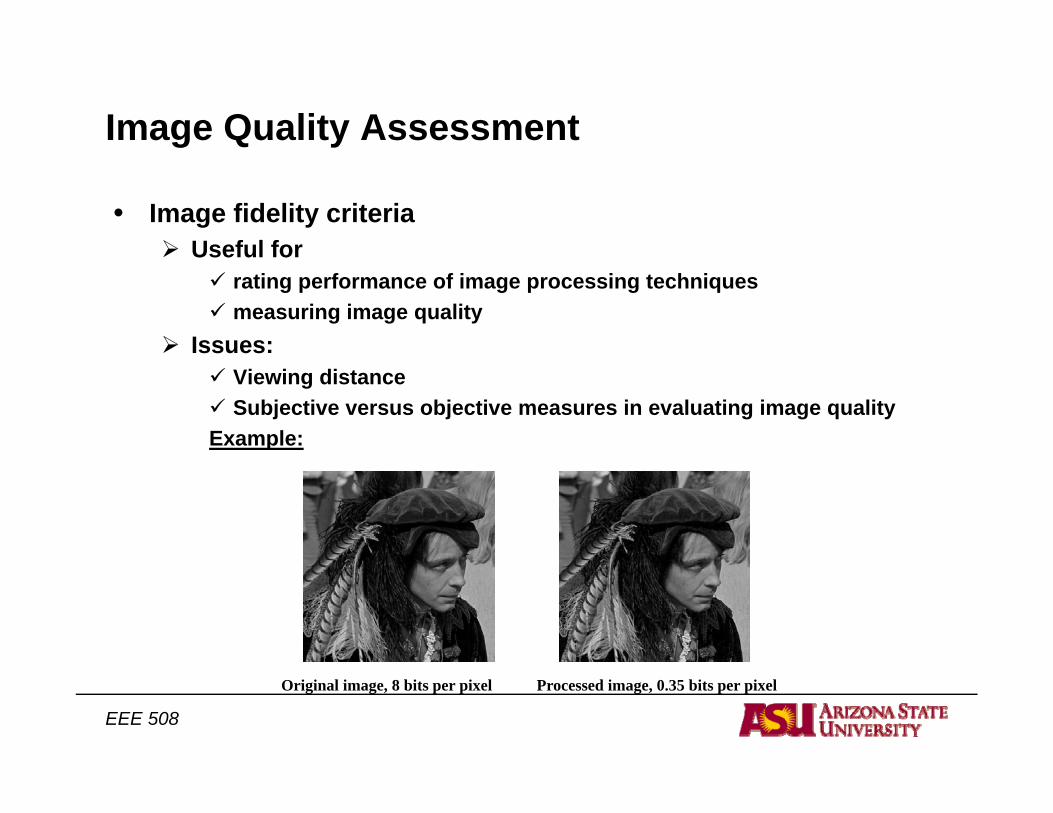
Image Quality Assessment
• Image fidelity criteria Useful forUseful for
rating performance of image processing techniquesmeasuring image quality
Issues:Viewing distanceSubjective versus objective measures in evaluating image quality
Example:
EEE 508
Original image, 8 bits per pixel Processed image, 0.35 bits per pixel
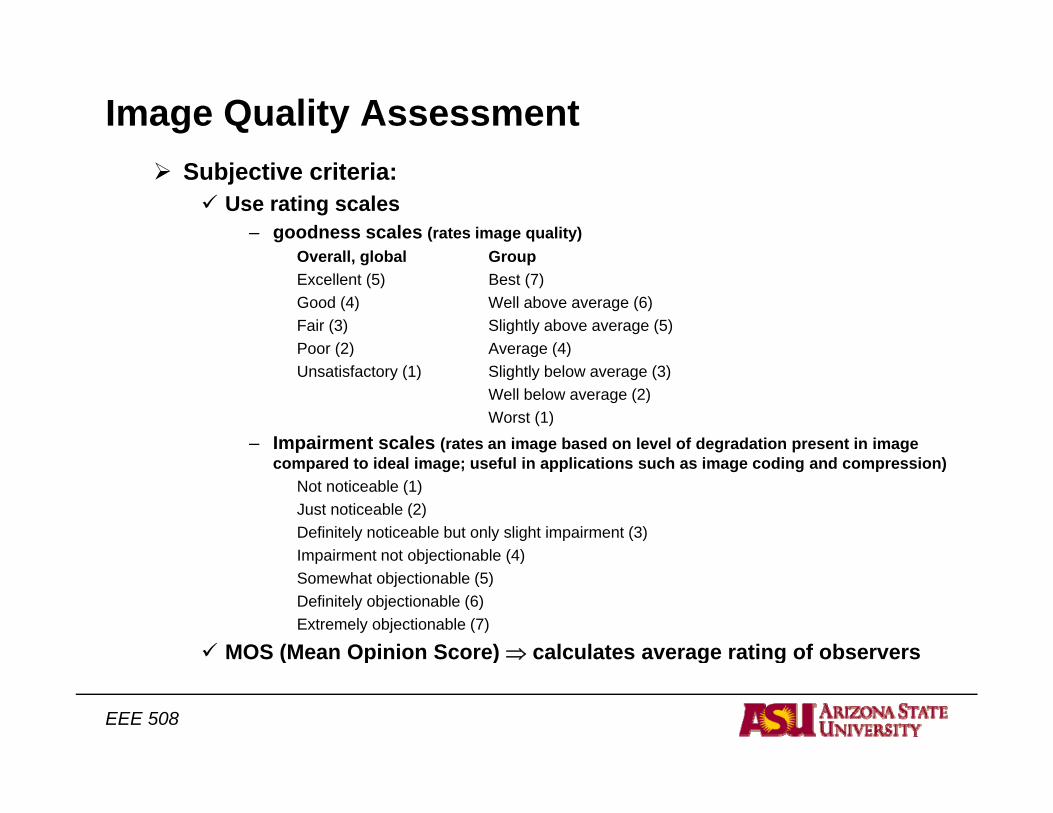
Image Quality AssessmentSubjective criteria:
Use rating scales – goodness scales (rates image quality)
O ll l b l GOverall, global GroupExcellent (5) Best (7)Good (4) Well above average (6)Fair (3) Slightly above average (5)Poor (2) Average (4)( ) g ( )Unsatisfactory (1) Slightly below average (3)
Well below average (2)Worst (1)
– Impairment scales (rates an image based on level of degradation present in image d t id l i f l i li ti h i di d i )compared to ideal image; useful in applications such as image coding and compression)
Not noticeable (1)Just noticeable (2)Definitely noticeable but only slight impairment (3)Impairment not objectionable (4)Impairment not objectionable (4)Somewhat objectionable (5)Definitely objectionable (6)Extremely objectionable (7)
MOS (Mean Opinion Score) ⇒ calculates average rating of observers
EEE 508
( p ) g g
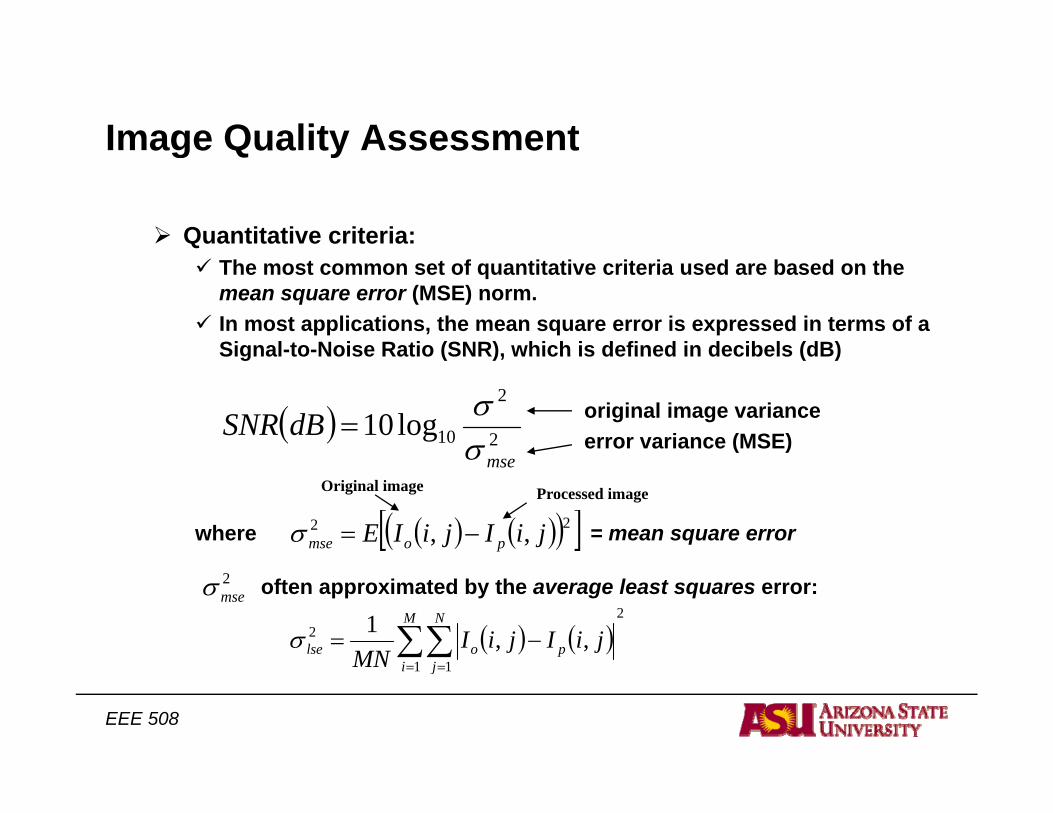
Image Quality Assessmentage Qua ty ssess e t
Quantitative criteria:The most common set of quantitative criteria used are based on the mean square error (MSE) norm.In most applications, the mean square error is expressed in terms of a Signal-to-Noise Ratio (SNR), which is defined in decibels (dB)Signal to Noise Ratio (SNR), which is defined in decibels (dB)
original image varianceerror variance (MSE)( ) 2
2
10log10dBSNRσσ
=
where = mean square error
mseσ
( ) ( )( )[ ]22 ,, jiIjiIE pomse −=σ
Original image Processed image
often approximated by the average least squares error:
( ) ( )2
1 1
2 ,,1 ∑∑ −=M
i
N
jpolse jiIjiI
MNσ
2mseσ
EEE 508
1 1= =i jMN
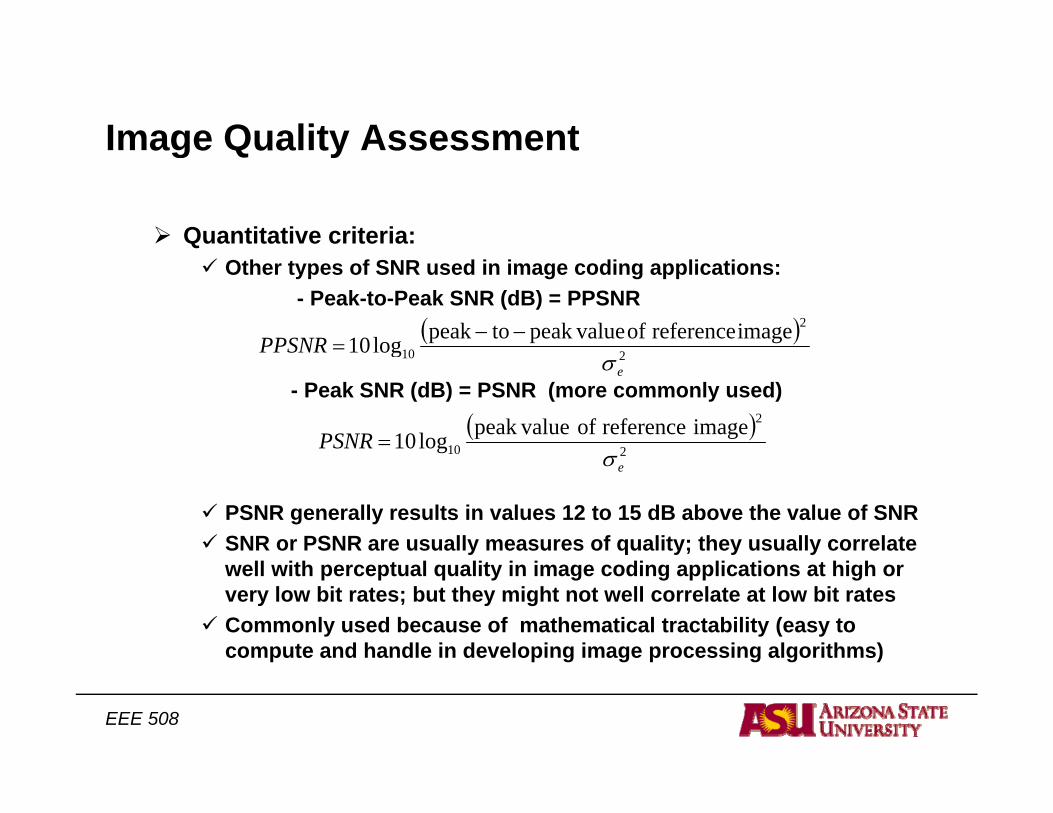
Image Quality Assessmentage Qua ty ssess e t
Quantitative criteria:Other types of SNR used in image coding applications:
- Peak-to-Peak SNR (dB) = PPSNR( )
2
2
10imagereferenceofvaluepeaktopeaklog10PPSNR −−
=
- Peak SNR (dB) = PSNR (more commonly used)
210geσ
( )2
2
10image referenceof valuepeaklog10PSNR
σ=
PSNR generally results in values 12 to 15 dB above the value of SNRSNR or PSNR are usually measures of quality; they usually correlate
eσ
well with perceptual quality in image coding applications at high or very low bit rates; but they might not well correlate at low bit ratesCommonly used because of mathematical tractability (easy to compute and handle in developing image processing algorithms)
EEE 508
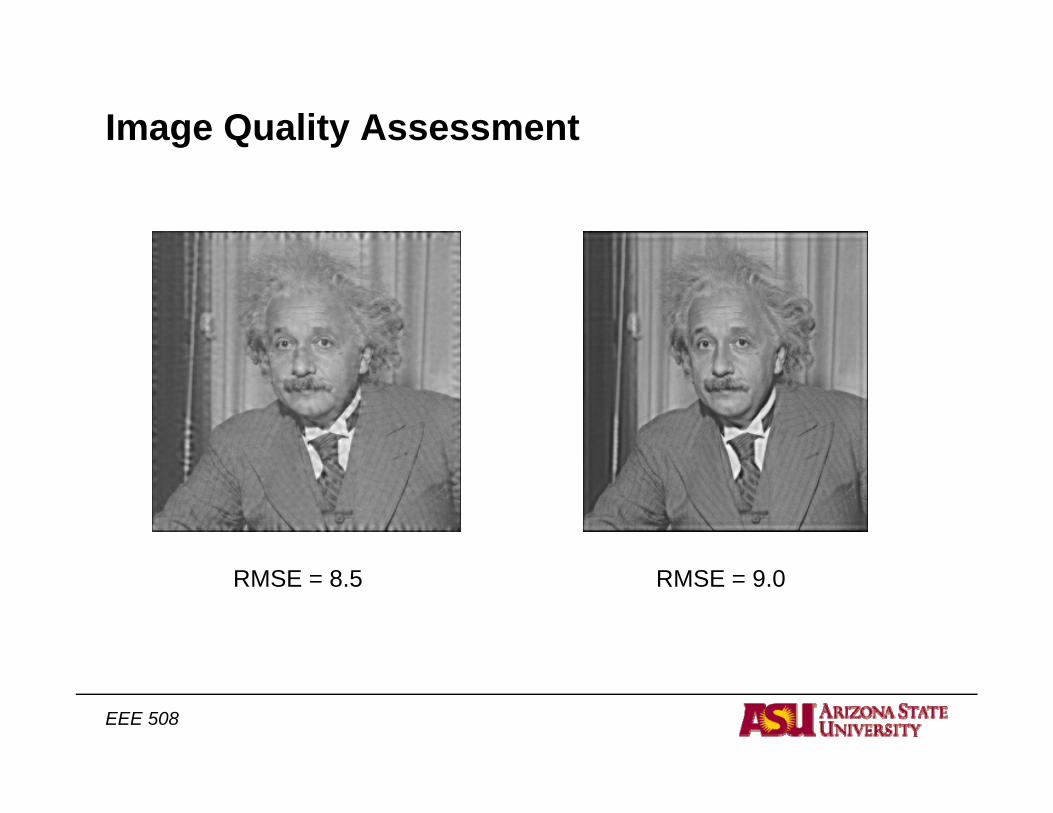
Image Quality Assessment
RMSE = 8.5 RMSE = 9.0
EEE 508
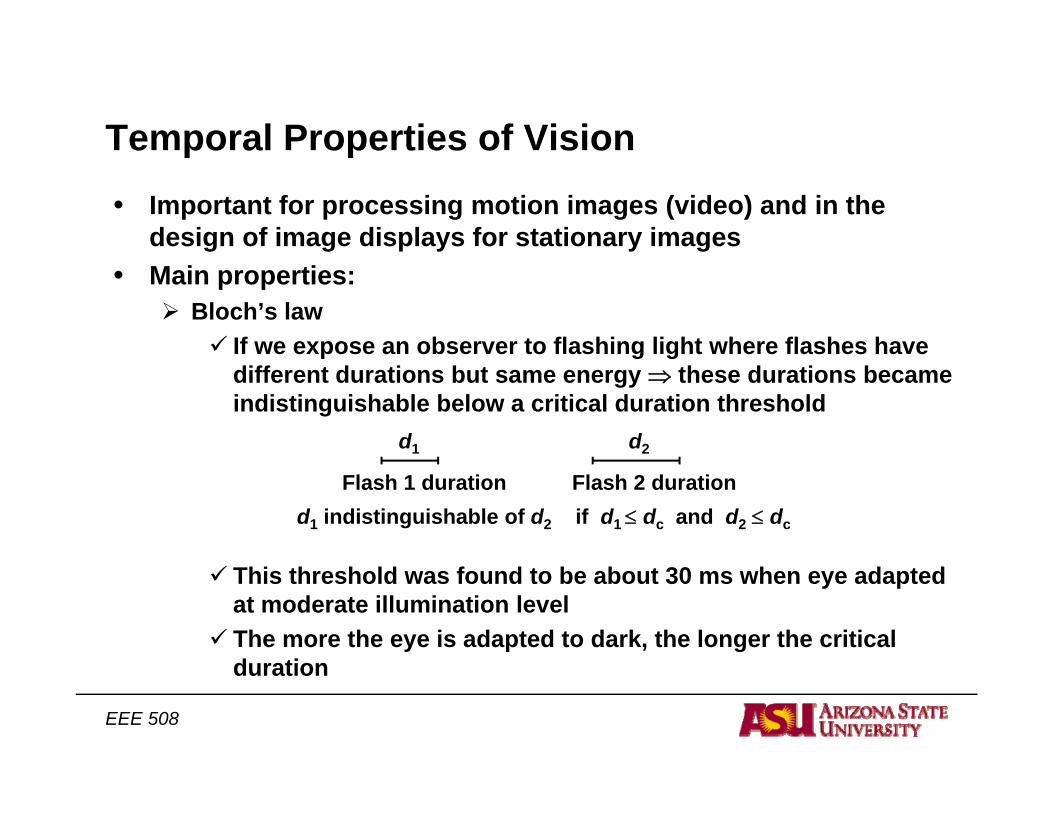
Temporal Properties of Visione po a ope t es o s o• Important for processing motion images (video) and in the
design of image displays for stationary images• Main properties:
Bloch’s lawIf we expose an observer to flashing light where flashes have p g gdifferent durations but same energy ⇒ these durations became indistinguishable below a critical duration threshold
d1 d2
Flash 1 duration Flash 2 durationd1 indistinguishable of d2 if d1 ≤ dc and d2 ≤ dc
This threshold was found to be about 30 ms when eye adapted at moderate illumination levelThe more the eye is adapted to dark, the longer the critical d ration
EEE 508
duration
Temporal Properties of Visione po a ope t es o s oCritical Fusion Frequency (CFF)
If flashing rate of light > CFF ⇒ individual flashes are indistinguishable; i.e., flashes are indistinguishable from a steady light at the same average intensity CFF does not generally exceed 50 to 60 HzBasis for TV raster scanning cameras and displaysInterlaced image fields sampled and displayed at rates of 50 or 60 Hz M d di l f h d t 60 f / t idModern displays are refreshed at 60 frames/sec to avoid flicker perception
EEE 508
Temporal Properties of Visione po a ope t es o s o
• Spatial versus Temporal effects:Eye more sensitive to flickering of high spatial frequencies (i.e. flickering edges) than low spatial frequenciesUseful in coding of motion video where moving areas are subsampled except at the edges (low spatial areas represented by less samples)
EEE 508