increased hygroscopicity of arizona test Dust seeds by ... · PDF fileincreased hygroscopicity...
9
BOREAL ENVIRONMENT RESEARCH 19 (suppl. B): 182–190 © 2014 ISSN 1239-6095 (print) ISSN 1797-2469 (online) Helsinki 30 September 2014 Editor in charge of this article: Veli-Matti Kerminen Increased hygroscopicity of Arizona Test Dust seeds by secondary organic aerosol coating from α-pinene ozonolysis Helmi Keskinen 1) , Aki-Matti Kortelainen 1) , Antti Jaatinen 1) , Pasi Yli-Pirilä 1) , Jorma Joutsensaari 1) , Sami Romakkaniemi 1)6) , Li-Qing Hao 1) , Tiina Torvela 2) , Pasi Miettinen 1) , Annele Virtanen 1) , Douglas R. Worsnop 1)4) , Ari Laaksonen 1)3) and James N. Smith 1)5) 1) Department of Applied Physics, University of Eastern Finland, P.O. Box 1627, FI-70211 Kuopio, Finland 2) Department of Environmental Science, University of Eastern Finland, P.O. Box 1627, FI-70211 Kuopio, Finland 3) Finnish Meteorological Institute, P.O. Box 503, FI-00101 Helsinki, Finland 4) Aerodyne Research, 45 Manning Road, Billerica, MA 01821, USA 5) National Center for Atmospheric Research, P.O. Box 3000, Boulder, CO 80307-3000, USA 6) Finnish Meteorological Institute, P.O. Box 1627, FI-70211 Kuopio, Finland Received 4 Nov. 2013, final version received 23 Apr. 2014, accepted 17 Apr. 2014 Keskinen, H., Kortelainen, A.-M., Jaatinen, A., Yli-Pirilä, P., Joutsensaari, J., Romakkaniemi, S., Hao, L. Q., Torvela, T., Miettinen, P., Virtanen, A., Worsnop, D. R., Laaksonen, A. & Smith, J. N. 2014: Increased hygroscopicity of Arizona Test Dust seeds by secondary organic aerosol coating from α-pinene ozonolysis. Boreal Env. Res. 19 (suppl. B): 182–190. Organic compounds can enhance the hygroscopic properties of insoluble dust particles and thereby affect their cloud condensation nuclei activity in the atmosphere. In this study, Arizona Test Dust (ATD) particles were exposed to oxidized organic vapors from the ozonolysis of α-pinene in a laboratory chamber. The particle size-dependent morphology, inorganic and organic composition and hygroscopic properties were studied. The dust consisted of particles with a range of morphologies from spherical to geometrical, with a size range from 50 nm to 1 µm. Exposure to oxidized organics resulted in a separate mode of secondary organic aerosol (SOA) particles with size ranging below 100 nm and a well-mixed ATD + SOA mode at larger sizes. The O:C mole ratio for the organics pro- duced from α-pinene ozonolysis was stable at 0.4 ± 0.05 in all experiments. The results showed that the hygroscopicities of the ATD particles with a diameter of 100–150 nm were enhanced by a factor of four with the addition of SOA, corresponding to a particulate organic volume fraction of ~0.6 and an average k of 0.09. Introduction Atmospheric particulate matter contains dust and organic matter from natural emission sources such as deserts and forests. Several laboratory and field investigations have been performed to elucidate the role that organic aerosol (e.g., Jimenez et al. 2009) and dust (Kumar et al. 2011) play separately as cloud condensation nuclei (CCN) in the atmosphere. However, understanding the combined role of dust and organics in aerosol–cloud interactions is needed
Transcript of increased hygroscopicity of arizona test Dust seeds by ... · PDF fileincreased hygroscopicity...
Boreal environment research 19 (suppl. B): 182–190 © 2014issn 1239-6095 (print) issn 1797-2469 (online) helsinki 30 september 2014
Editor in charge of this article: Veli-Matti Kerminen
increased hygroscopicity of arizona test Dust seeds by secondary organic aerosol coating from α-pinene ozonolysis
helmi Keskinen1), aki-matti Kortelainen1), antti Jaatinen1), Pasi Yli-Pirilä1), Jorma Joutsensaari1), sami romakkaniemi1)6), li-Qing hao1), tiina torvela2), Pasi miettinen1), annele virtanen1), Douglas r. Worsnop1)4), ari laaksonen1)3)
and James n. smith1)5)
1) Department of Applied Physics, University of Eastern Finland, P.O. Box 1627, FI-70211 Kuopio, Finland
2) Department of Environmental Science, University of Eastern Finland, P.O. Box 1627, FI-70211 Kuopio, Finland
3) Finnish Meteorological Institute, P.O. Box 503, FI-00101 Helsinki, Finland4) Aerodyne Research, 45 Manning Road, Billerica, MA 01821, USA5) National Center for Atmospheric Research, P.O. Box 3000, Boulder, CO 80307-3000, USA6) Finnish Meteorological Institute, P.O. Box 1627, FI-70211 Kuopio, Finland
Received 4 Nov. 2013, final version received 23 Apr. 2014, accepted 17 Apr. 2014
Keskinen, h., Kortelainen, a.-m., Jaatinen, a., Yli-Pirilä, P., Joutsensaari, J., romakkaniemi, s., hao, l. Q., torvela, t., miettinen, P., virtanen, a., Worsnop, D. r., laaksonen, a. & smith, J. n. 2014: increased hygroscopicity of arizona test Dust seeds by secondary organic aerosol coating from α-pinene ozonolysis. Boreal Env. Res. 19 (suppl. B): 182–190.
Organic compounds can enhance the hygroscopic properties of insoluble dust particles and thereby affect their cloud condensation nuclei activity in the atmosphere. In this study, Arizona Test Dust (ATD) particles were exposed to oxidized organic vapors from the ozonolysis of α-pinene in a laboratory chamber. The particle size-dependent morphology, inorganic and organic composition and hygroscopic properties were studied. The dust consisted of particles with a range of morphologies from spherical to geometrical, with a size range from 50 nm to 1 µm. Exposure to oxidized organics resulted in a separate mode of secondary organic aerosol (SOA) particles with size ranging below 100 nm and a well-mixed ATD + SOA mode at larger sizes. The O:C mole ratio for the organics pro-duced from α-pinene ozonolysis was stable at 0.4 ± 0.05 in all experiments. The results showed that the hygroscopicities of the ATD particles with a diameter of 100–150 nm were enhanced by a factor of four with the addition of SOA, corresponding to a particulate organic volume fraction of ~0.6 and an average k of 0.09.
Introduction
Atmospheric particulate matter contains dust and organic matter from natural emission sources such as deserts and forests. Several laboratory and field investigations have been performed
to elucidate the role that organic aerosol (e.g., Jimenez et al. 2009) and dust (Kumar et al. 2011) play separately as cloud condensation nuclei (CCN) in the atmosphere. However, understanding the combined role of dust and organics in aerosol–cloud interactions is needed
Boreal env. res. vol. 19 (suppl. B) • Hygroscopicity of dust and secondary organic aerosol 183
in order to determine their present and future impacts on climate (IPCC 2007). This may be particularly important for boreal-forest regions, which are characterized by high levels of sec-ondary organic aerosol (SOA) precursor gases such as monoterpenes (Hakola et al. 2003), clean conditions with few anthropogenic sources, and, in some locales, incursions of long-range-trans-ported dust. Examples of the latter include trans-Pacific dust events that originate in the Gobi and Takla Makan deserts in Asia and impact the Pacific Northwest region of North America (e.g. Leaitch et al. 2003). Dust from these and other Asian deserts is very likely to be occasionally transported to Siberian forests as well. Monoter-penes are of course emitted from other types of biomes as well, some of which are located in close proximity to deserts.
By measuring hygroscopicity we gain infor-mation on aerosol cloud-droplet activation prop-erties as well as on certain physico-chemical properties such as composition (Petters and Kreidenweis 2007, Keskinen et al. 2013). Inor-ganic mineral and dust particles are not very hygroscopic but they still have ability to act as cloud condensation nuclei (e.g. Vlasenko et al. 2005, 2006, Herich et al. 2009, Kumar et al. 2009, 2011, Koehler et al. 2009). A recent study by Kumar et al. (2011) focused on the CCN activity of fresh dust particles from multiple sources (e.g., Arizona and Sahara). Their major finding was that freshly-emitted dust and mineral aerosols could act as CCN through the effects of water adsorption alone. Specifically, they showed that 100 nm dust particles can exhibit comparable hygroscopicity to organic species or to a particle with an ammonium sulfate (AS) volume fraction of 0.1. Besides salt, atmos-pheric particles contain organics (Jimenez et al., 2009, Halquist et al. 2009). SOA itself, e.g., that formed by α-pinene oxidation, is also known to be hygroscopic (Jimenez et al. 2009, Saathof et al. 2003). In the atmosphere, organic matter can heterogeneously coat solid particles and thus affect the hygroscopic properties and cloud drop-let activation of these particles. For example, the hygroscopicity of nanoscale soot agglom-erates increases by the uptake of organics, up to the hygroscopicity of pure SOA (Saathof et al. 2003). In addition, Hatch et al. (2008) and
Gierlus et al. (2011) observed an increase in the hygroscopicity of pure calcite nanoparticles by organic acids. Though the impact of SOA-coated dust on cold cloud formation has been studied (Koehler et al. 2010), to our knowledge labora-tory studies focusing on its impacts on warm cloud formation have not yet been performed.
In this study, we measured the hygroscopic-ity of well-defined Arizona Test Dust (ATD) seed particles exposed to SOA from the ozonoly-sis of α-pinene in the Kuopio aerosol research chamber (Hao et al. 2011). We report SOA coating amount and its effect on ATD hygro-scopicity. The overarching scientific goal of this study is to improve understanding of the interac-tions between suspended dust and condensable organic compounds, and the role that the uptake of organics may play in warm cloud formation in regions such as the boreal forest. In addition to studying the hygroscopicity of SOA-coated dust, we will also determine the degree to which par-ticulate mass increases as a result. This increased growth rate has implications for CCN activation, since larger particles are more effective conden-sation nuclei. In addition, dust particles inside cloud droplets may cause immersion freezing if the droplets become cold enough. If a SOA coat-ing were to increase the hygroscopicity of a dust particle, it is more likely that it would form a cloud droplet. In this manner, a SOA coating on dust may increase the probability of the occur-rence of immersion freezing.
Experimental methods
We used the Kuopio 6 m3 aerosol chamber to coat the ATD nanoparticles with SOA formed from α-pinene ozonolysis. The ATD particles were generated from an aqueous suspension by a collision-type atomizer (model 3076, TSI, Inc., USA). The solid content in the water suspen-sion of ATD (0–3 µm, Powder Technology, Inc., USA) was set to 0.1 wt%. The produced aerosol was fed into a diffusion drier consisting of a porous tube surrounded by silica gel, resulting in relative humidity (RH) below 5%.
The samples for electron microscopy were collected on perforated carbon–copper grids (300 Mesh Cu, Agar Scientific, UK) by depositing
184 Keskinen et al. • Boreal env. res. vol. 19 (suppl. B)
drops of diluted suspension (0.005 wt%) directly on the grid, and drying under atmospheric condi-tions. In separate investigations, we produced atomized aerosol as described in the previous paragraph and collected those particles on a grid for comparison with the particles created from droplets. The grids containing the atomized par-ticles captured far fewer particles, so we chose the droplet method for spectroscopic analysis. However, in comparing individual particles cre-ated by both techniques we could find no sig-nificant differences in either their morphology or composition.
The morphology and crystallinity of the ATD particles were studied by transmission electron microscopy (TEM) (model JEM 2100F, JEOL Ltd., Japan) operated at 200 kV acceleration voltage. The primary particle size was estimated from TEM micrographs using ImageJ software (National Institutes of Health, USA). The ele-mental composition of the particles was ana-lysed using energy dispersive X-ray spectroscopy (EDS) in spot analysis mode. In order to spatially resolve the elemental composition of particles from that of the background, a spectral image consisting of an elemental spectrum obtained for a 725 nm ¥ 725 nm region with a 2.8 nm pixel–1 resolution was acquired from a representative particle. Fifty frames with 0.5 ms dwell time were collected in scanning mode of TEM. Two princi-pal components were resolved from the spectral image using the multivariate statistical analysis tool of the EDS analyser software (NORAN System 7, Thermo Scientific, USA). By using the principal components, joint spectra of the particle and the background were constructed.
Before each chamber experiment, the aerosol chamber was flushed and filled with pure fil-tered, dry air. Next, the ATD particles were intro-duced into the chamber and diluted achieving the desired concentration (~104 cm–3). Following this, 2 µl of α-pinene was injected into the cham-ber, resulting in a measured gas phase concentra-tion of 33 ± 1 ppb. After 15 min mixing time, ozone enriched air (1.5 ppm at 30 l min–1) was introduced into the chamber to achieve ozone concentration of 50 ± 10 ppb to initiate oxida-tion. Ozone was generated by a UV lamp O3 generator. About 40% of α-pinene was reacted in 30 minutes after the ozone addition based on
the volatile organic compounds (VOC) analysis. Following this, all flows into the chamber were turned off and chamber volume was slowly decreased by the flow required by the instru-ments (10.4 l min–1). The experiments were per-formed for about four hours, which includes the time require for stabilizing the seed particle concentration. In all experiments, NOx was 3 ± 0.5 ppb (i.e. low NOx conditions), temperature was 25 ± 2 °C, and RH was 5% ± 2%.
VOCs were collected onto Tenax TA adsor-bent (mesh 60/80, Supelco Analytical, USA) for 10 minutes with an air flow through the sample tube of 200 ml min–1. The trapped compounds were analyzed with a thermal desorption unit (model ATD400 Automatic Thermal Desorption System, Perkin-Elmer Inc., USA) coupled to a gas chromatograph-mass spectrometer (models GC 6890 and MSD 5973, Hewlett Packard Corp., USA). The compounds were identified by comparing their mass spectra with those in the Wiley 275.L mass spectral library and with pure standards. Details on the analysis of VOCs can be found elsewhere (Vuorinen et al. 2004).
During the experiment, the particle size dis-tribution was monitored by a scanning mobility particle sizer (SMPS) consisting of a model 3081 differential mobility analyzer and model 3785 condensation particle counter (TSI, Inc., USA). Aerosol number concentration was also measured with a condensation particle counter (CPC, model 3025, TSI, Inc., USA). The SMPS measurements covered the mobility diameter range of 9–370 nm. Real-time aerosol chemi-cal composition over the vacuum aerodynamic diameter range from 50 to 1000 nm was meas-ured by Aerodyne High Resolution Time-Of-Flight Aerosol Mass Spectrometer (HR-TOF-AMS, Jayne et al. 2000, DeCarlo et al. 2006) using the standard 600 °C vaporizer temperature. Sulphate, organics, ammonium and nitrate mass loadings were determined from the mass spectra, and O:C ratios were derived using the procedure of Aiken et al. (2008). Size-resolved CCN activ-ity was measured using a CCN counter (model CCN-100, Droplet Measurements Technologies, USA). The CCN counter was operated using Scanning Mobility CCN Analysis developed by Moore and Nenes (2009), covering the dry parti-cle diameter range from 30 to 200 nm.
Boreal env. res. vol. 19 (suppl. B) • Hygroscopicity of dust and secondary organic aerosol 185
In this study, hygroscopicity is represented from CCN measurements using the k-Köhler theory (Petters and Kreidenweis 2007), recog-nizing that a number of assumptions are made in applying Köhler theory to cloud droplet activa-tion (Seinfeld and Pandis 2006). In spite of these assumptions, k-Köhler theory is widely used both in reporting aerosol hygroscopicity meas-urements and also in the modelling of aerosol properties in large scale models. All references in this manuscript regarding hygroscopicity refer directly to kCCN defined as follows:
, (1)
where σw is the water surface tension, Mw is the molecular weight of the water, R is the ideal gas constant, T is the temperature (K), rw is the den-sity of the liquid water, ddry is the dry diameter of particles selected for analysis, and Sc is the critical supersaturation for each dry diameter. The volume fraction of organics (εo) was derived from CCN measurements by assuming a “two-component” particle (Keskinen et al. 2013) con-sisting of organics (o) and ATD (d):
, (2)
where k is the combined overall (measured) hygroscopicity, kd is the hygroscopicity for dust
and ko for organic compounds. In our calculation we used the measured kd and the ko for organ-ics based on the AMS-measured oxidation state (Massoli et al. 2010).
For comparison, we also determined an aver-age organic volume fraction (fov) from AMS results and volume size distributions measured with the SMPS. fov was determined as a ratio of AMS organic volume (Vo) and SMPS total volume (Vtot), i.e. fov = Vo/Vtot. The density of 1.4 (α-pinene ozonolysis product) was used for the AMS organic volume calculation (Kostenidou 2007). Note that the determination of particle volume from the number size distribution is not very accurate, especially for large particles due to low number concentrations, and thus there may be higher uncertainties associated with fov.
Results and discussion
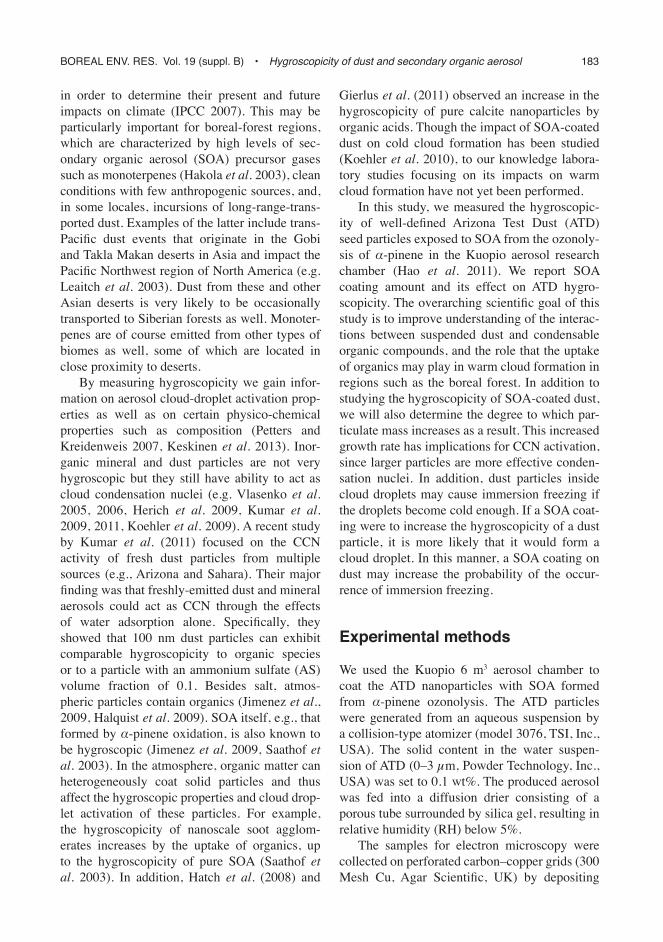
The uncoated ATD particles had typically diverse shapes from spheres to polygon sym-metries (Fig. 1a). The individual particle size measured from TEM-micrographs varied from 50 nm to approximately 1 µm (see for example Figs. 1b and 2a). In addition, the particles were found crystalline (Fig. 1b). The ATD particles were mainly composed of Si, O, and C, deter-mined using the EDS spot analysis. However, trace amounts (mass fraction below 2%) of Al, Fe, Ca, K and Mg were also detected in various
Fig. 1. (a) tem micro-graphs from the atD dust particles lying on the per-forated carbon substrate, showing a closed form but heterogeneous size and shape. (b) Diffraction pattern from the selected area (white circle) of a large particle, showing that the particle is crys-talline.
186 Keskinen et al. • Boreal env. res. vol. 19 (suppl. B)
particles. A typical example of the composition is shown in Fig. 2b (left-hand side) showing the second principal component (PC2) spectrum cal-culated from the spectral image of the particle in Fig. 2a. The high intensity pixels in Fig. 2b show the similar regions compared to PC2 spectrum. As with the various spot analyses, Si, O, C, Al, Fe, Ca, K, Mg and Cu were detected. By experi-ence and the first principal component of spectral image (PC1), it was known that incidences of Cu were from background scattering of the sub-strate grid. The other elements of PC1 were C, O, Cr, and Si, and they were distributed evenly amongst background and particles. Although Ti and Na were not found, the detected elements corresponded with the composition measured by Vlasenko et al. (2005), and with that provided by the supplier of the ATD: SiO2, Al2O3, Fe2O3, Na2O, CaO, MgO, TiO2 and K2O.
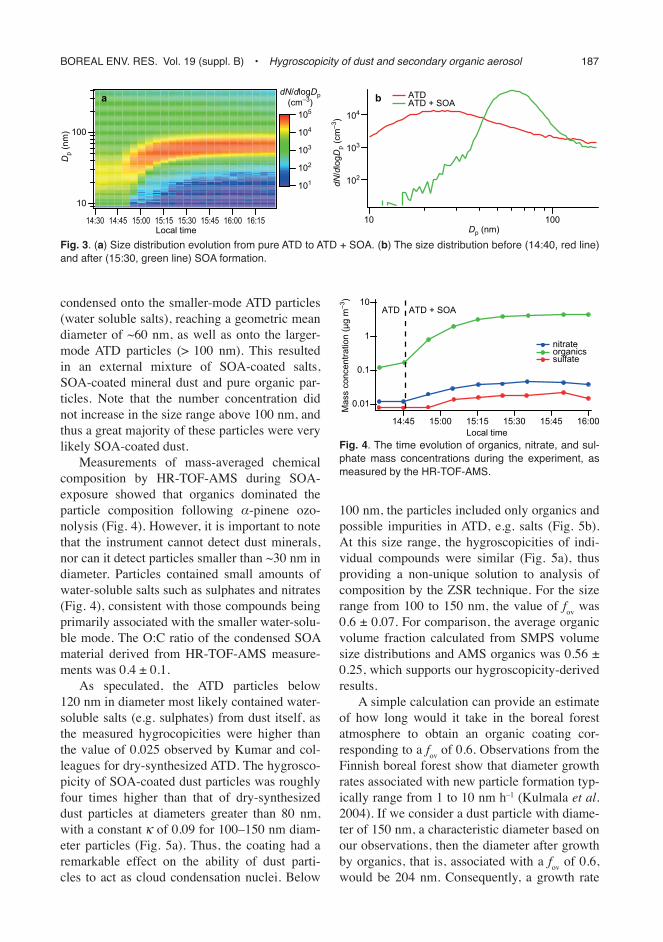
Before the SOA formation, a bimodal distri-bution was observed for the pure ATD with the first mode geometric mean diameter (GMD) of 26 nm and second mode GMD of 114 nm (Fig. 3b). A similar bimodal distribution for the wet-atom-ized ATD was observed by Gustavsson et al. (2005), who speculated that water-soluble species in the mineral dust collected from the ATD form
the first mode, and that the second mode consists of the actual mineral dust. The water-soluble mode composition of the ATD was analysed by Vlasenko et al. (2005), who found that this mode comprises about 2% of the particulate mass and consists mostly of sulphates. However, as the mass of these first-mode particles is substantially low, this fraction is likely not observed by the AMS due to the detection limits of the method (further discussion of this is provided below).
With α-pinene ozonolysis the particle number size distribution changed dramatically (Fig. 3). The total number concentration increased from 8000 to 12 600 cm–3 after the SOA addition, evidence that new-particle formation occurred. Interestingly, sub-20 nm diameter particles were not observed after α-pinene ozonolysis (Fig. 3a), even though the clear increase in total number concentration provides evidence that new parti-cles were formed. We hypothesize that newly-formed particles grew rapidly to a diameter of ~30 nm and where therefore not detected by the SMPS during this period. This phenomenon of a very rapid initial growth of newly-formed parti-cles from α-pinene ozonolysis was also observed by Winkler et al. (2012). In addition to forming new particles, low-volatility organic compounds
Fig. 2. (a) TEM bright field image of an atD particle. (b) high intensity pixels show a reconstruction of the second principal com-ponent (Pc2) of multivari-ate analysis on the eDs map of the particle area and background. the combined element spec-trum is shown on the left. according to the analy-sis, the particle is com-posed of c, o, al, si, K, ca and Fe. the cu peaks at approximately 0.9, 8, and 9 kev in the particle spectra were due to back-ground scattering from the sample grid.
Boreal env. res. vol. 19 (suppl. B) • Hygroscopicity of dust and secondary organic aerosol 187
condensed onto the smaller-mode ATD particles (water soluble salts), reaching a geometric mean diameter of ~60 nm, as well as onto the larger-mode ATD particles (> 100 nm). This resulted in an external mixture of SOA-coated salts, SOA-coated mineral dust and pure organic par-ticles. Note that the number concentration did not increase in the size range above 100 nm, and thus a great majority of these particles were very likely SOA-coated dust.
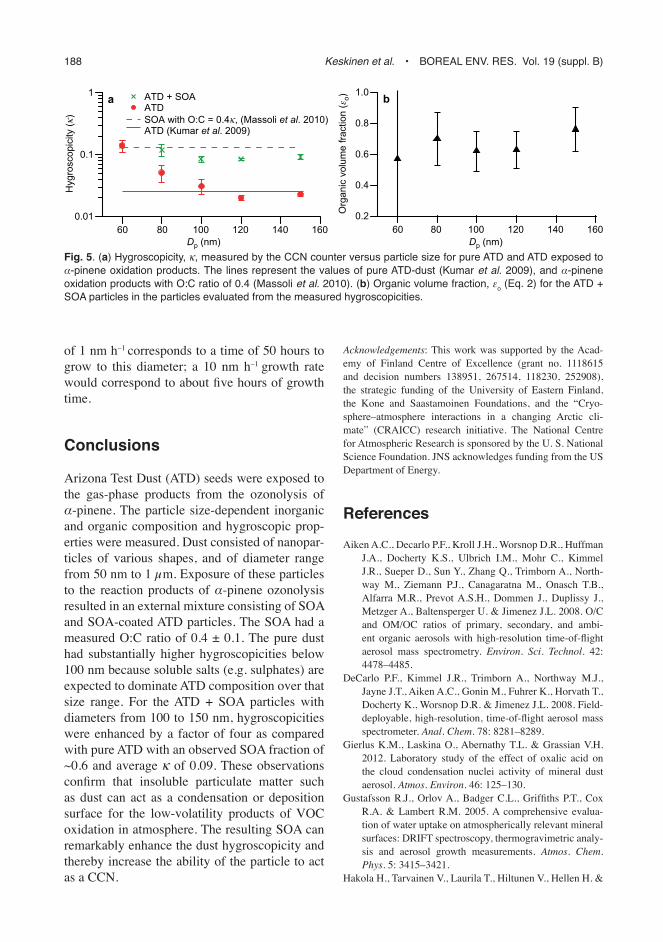
Measurements of mass-averaged chemical composition by HR-TOF-AMS during SOA-exposure showed that organics dominated the particle composition following α-pinene ozo-nolysis (Fig. 4). However, it is important to note that the instrument cannot detect dust minerals, nor can it detect particles smaller than ~30 nm in diameter. Particles contained small amounts of water-soluble salts such as sulphates and nitrates (Fig. 4), consistent with those compounds being primarily associated with the smaller water-solu-ble mode. The O:C ratio of the condensed SOA material derived from HR-TOF-AMS measure-ments was 0.4 ± 0.1.
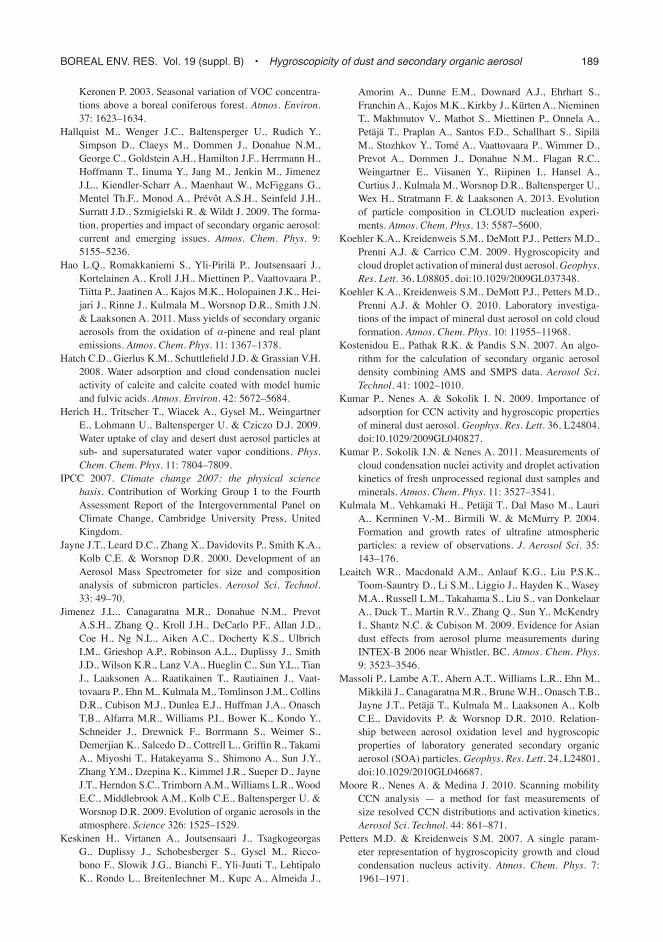
As speculated, the ATD particles below 120 nm in diameter most likely contained water-soluble salts (e.g. sulphates) from dust itself, as the measured hygrocopicities were higher than the value of 0.025 observed by Kumar and col-leagues for dry-synthesized ATD. The hygrosco-picity of SOA-coated dust particles was roughly four times higher than that of dry-synthesized dust particles at diameters greater than 80 nm, with a constant k of 0.09 for 100–150 nm diam-eter particles (Fig. 5a). Thus, the coating had a remarkable effect on the ability of dust parti-cles to act as cloud condensation nuclei. Below
100 nm, the particles included only organics and possible impurities in ATD, e.g. salts (Fig. 5b). At this size range, the hygroscopicities of indi-vidual compounds were similar (Fig. 5a), thus providing a non-unique solution to analysis of composition by the ZSR technique. For the size range from 100 to 150 nm, the value of fov was 0.6 ± 0.07. For comparison, the average organic volume fraction calculated from SMPS volume size distributions and AMS organics was 0.56 ± 0.25, which supports our hygroscopicity-derived results.
A simple calculation can provide an estimate of how long would it take in the boreal forest atmosphere to obtain an organic coating cor-responding to a fov of 0.6. Observations from the Finnish boreal forest show that diameter growth rates associated with new particle formation typ-ically range from 1 to 10 nm h–1 (Kulmala et al. 2004). If we consider a dust particle with diame-ter of 150 nm, a characteristic diameter based on our observations, then the diameter after growth by organics, that is, associated with a fov of 0.6, would be 204 nm. Consequently, a growth rate
10
100
Dp
(nm
)
14:30 14:45 15:00 15:15 15:30 15:45 16:00 16:15Local time
a
101
102
103
104
105
dN/dlogDp(cm–3)
102
103
104
dN/d
logD
p (c
m–3
)
10 100Dp (nm)
b ATDATD + SOA
0.01
0.1
1
10
Mas
s co
ncen
tratio
n (µ
g m
–3)
14:45 15:00 15:15 15:30 15:45 16:00Local time
ATD ATD + SOA
nitrateorganicssulfate
Fig. 3. (a) size distribution evolution from pure atD to atD + soa. (b) the size distribution before (14:40, red line) and after (15:30, green line) soa formation.
Fig. 4. the time evolution of organics, nitrate, and sul-phate mass concentrations during the experiment, as measured by the hr-toF-ams.
188 Keskinen et al. • Boreal env. res. vol. 19 (suppl. B)
of 1 nm h–1 corresponds to a time of 50 hours to grow to this diameter; a 10 nm h–1 growth rate would correspond to about five hours of growth time.
Conclusions
Arizona Test Dust (ATD) seeds were exposed to the gas-phase products from the ozonolysis of α-pinene. The particle size-dependent inorganic and organic composition and hygroscopic prop-erties were measured. Dust consisted of nanopar-ticles of various shapes, and of diameter range from 50 nm to 1 µm. Exposure of these particles to the reaction products of α-pinene ozonolysis resulted in an external mixture consisting of SOA and SOA-coated ATD particles. The SOA had a measured O:C ratio of 0.4 ± 0.1. The pure dust had substantially higher hygroscopicities below 100 nm because soluble salts (e.g. sulphates) are expected to dominate ATD composition over that size range. For the ATD + SOA particles with diameters from 100 to 150 nm, hygroscopicities were enhanced by a factor of four as compared with pure ATD with an observed SOA fraction of ~0.6 and average k of 0.09. These observations confirm that insoluble particulate matter such as dust can act as a condensation or deposition surface for the low-volatility products of VOC oxidation in atmosphere. The resulting SOA can remarkably enhance the dust hygroscopicity and thereby increase the ability of the particle to act as a CCN.
Acknowledgements: This work was supported by the Acad-emy of Finland Centre of Excellence (grant no. 1118615 and decision numbers 138951, 267514, 118230, 252908), the strategic funding of the University of Eastern Finland, the Kone and Saastamoinen Foundations, and the “Cryo-sphere–atmosphere interactions in a changing Arctic cli-mate” (CRAICC) research initiative. The National Centre for Atmospheric Research is sponsored by the U. S. National Science Foundation. JNS acknowledges funding from the US Department of Energy.
References
Aiken A.C., Decarlo P.F., Kroll J.H., Worsnop D.R., Huffman J.A., Docherty K.S., Ulbrich I.M., Mohr C., Kimmel J.R., Sueper D., Sun Y., Zhang Q., Trimborn A., North-way M., Ziemann P.J., Canagaratna M., Onasch T.B., Alfarra M.R., Prevot A.S.H., Dommen J., Duplissy J., Metzger A., Baltensperger U. & Jimenez J.L. 2008. O/C and OM/OC ratios of primary, secondary, and ambi-ent organic aerosols with high-resolution time-of-flight aerosol mass spectrometry. Environ. Sci. Technol. 42: 4478–4485.
DeCarlo P.F., Kimmel J.R., Trimborn A., Northway M.J., Jayne J.T., Aiken A.C., Gonin M., Fuhrer K., Horvath T., Docherty K., Worsnop D.R. & Jimenez J.L. 2008. Field-deployable, high-resolution, time-of-flight aerosol mass spectrometer. Anal. Chem. 78: 8281–8289.
Gierlus K.M., Laskina O., Abernathy T.L. & Grassian V.H. 2012. Laboratory study of the effect of oxalic acid on the cloud condensation nuclei activity of mineral dust aerosol. Atmos. Environ. 46: 125–130.
Gustafsson R.J., Orlov A., Badger C.L., Griffiths P.T., Cox R.A. & Lambert R.M. 2005. A comprehensive evalua-tion of water uptake on atmospherically relevant mineral surfaces: DRIFT spectroscopy, thermogravimetric analy-sis and aerosol growth measurements. Atmos. Chem. Phys. 5: 3415–3421.
Hakola H., Tarvainen V., Laurila T., Hiltunen V., Hellen H. &
Fig. 5. (a) hygroscopicity, k, measured by the ccn counter versus particle size for pure atD and atD exposed to α-pinene oxidation products. the lines represent the values of pure atD-dust (Kumar et al. 2009), and α-pinene oxidation products with o:c ratio of 0.4 (massoli et al. 2010). (b) organic volume fraction, εo (eq. 2) for the atD + soa particles in the particles evaluated from the measured hygroscopicities.
0.01
0.1
1
Hyg
rosc
opic
ity (k
)
16014012010080601601401201008060Dp (nm)Dp (nm)
1.0
0.8
0.6
0.4
0.2Org
anic
vol
ume
fract
ion
(εo)a bATD + SOA
ATDSOA with O:C = 0.4k, (Massoli et al. 2010) ATD (Kumar et al. 2009)
Boreal env. res. vol. 19 (suppl. B) • Hygroscopicity of dust and secondary organic aerosol 189
Keronen P. 2003. Seasonal variation of VOC concentra-tions above a boreal coniferous forest. Atmos. Environ. 37: 1623–1634.
Hallquist M., Wenger J.C., Baltensperger U., Rudich Y., Simpson D., Claeys M., Dommen J., Donahue N.M., George C., Goldstein A.H., Hamilton J.F., Herrmann H., Hoffmann T., Iinuma Y., Jang M., Jenkin M., Jimenez J.L., Kiendler-Scharr A., Maenhaut W., McFiggans G., Mentel Th.F., Monod A., Prévôt A.S.H., Seinfeld J.H., Surratt J.D., Szmigielski R. & Wildt J. 2009. The forma-tion, properties and impact of secondary organic aerosol: current and emerging issues. Atmos. Chem. Phys. 9: 5155–5236.
Hao L.Q., Romakkaniemi S., Yli-Pirilä P., Joutsensaari J., Kortelainen A., Kroll J.H., Miettinen P., Vaattovaara P., Tiitta P., Jaatinen A., Kajos M.K., Holopainen J.K., Hei-jari J., Rinne J., Kulmala M., Worsnop D.R., Smith J.N. & Laaksonen A. 2011. Mass yields of secondary organic aerosols from the oxidation of α-pinene and real plant emissions. Atmos. Chem. Phys. 11: 1367–1378.
Hatch C.D., Gierlus K.M., Schuttlefield J.D. & Grassian V.H. 2008. Water adsorption and cloud condensation nuclei activity of calcite and calcite coated with model humic and fulvic acids. Atmos. Environ. 42: 5672–5684.
Herich H., Tritscher T., Wiacek A., Gysel M., Weingartner E., Lohmann U., Baltensperger U. & Cziczo D.J. 2009. Water uptake of clay and desert dust aerosol particles at sub- and supersaturated water vapor conditions. Phys. Chem. Chem. Phys. 11: 7804–7809.
IPCC 2007. Climate change 2007: the physical science basis. Contribution of Working Group I to the Fourth Assessment Report of the Intergovernmental Panel on Climate Change, Cambridge University Press, United Kingdom.
Jayne J.T., Leard D.C., Zhang X., Davidovits P., Smith K.A., Kolb C.E. & Worsnop D.R. 2000. Development of an Aerosol Mass Spectrometer for size and composition analysis of submicron particles. Aerosol Sci. Technol. 33: 49–70.
Jimenez J.L., Canagaratna M.R., Donahue N.M., Prevot A.S.H., Zhang Q., Kroll J.H., DeCarlo P.F., Allan J.D., Coe H., Ng N.L., Aiken A.C., Docherty K.S., Ulbrich I.M., Grieshop A.P., Robinson A.L., Duplissy J., Smith J.D., Wilson K.R., Lanz V.A., Hueglin C., Sun Y.L., Tian J., Laaksonen A., Raatikainen T., Rautiainen J., Vaat-tovaara P., Ehn M., Kulmala M., Tomlinson J.M., Collins D.R., Cubison M.J., Dunlea E.J., Huffman J.A., Onasch T.B., Alfarra M.R., Williams P.I., Bower K., Kondo Y., Schneider J., Drewnick F., Borrmann S., Weimer S., Demerjian K., Salcedo D., Cottrell L., Griffin R., Takami A., Miyoshi T., Hatakeyama S., Shimono A., Sun J.Y., Zhang Y.M., Dzepina K., Kimmel J.R., Sueper D., Jayne J.T., Herndon S.C., Trimborn A.M., Williams L.R., Wood E.C., Middlebrook A.M., Kolb C.E., Baltensperger U. & Worsnop D.R. 2009. Evolution of organic aerosols in the atmosphere. Science 326: 1525–1529.
Keskinen H., Virtanen A., Joutsensaari J., Tsagkogeorgas G., Duplissy J., Schobesberger S., Gysel M., Ricco-bono F., Slowik J.G., Bianchi F., Yli-Juuti T., Lehtipalo K., Rondo L., Breitenlechner M., Kupc A., Almeida J.,
Amorim A., Dunne E.M., Downard A.J., Ehrhart S., Franchin A., Kajos M.K., Kirkby J., Kürten A., Nieminen T., Makhmutov V., Mathot S., Miettinen P., Onnela A., Petäjä T., Praplan A., Santos F.D., Schallhart S., Sipilä M., Stozhkov Y., Tomé A., Vaattovaara P., Wimmer D., Prevot A., Dommen J., Donahue N.M., Flagan R.C., Weingartner E., Viisanen Y., Riipinen I., Hansel A., Curtius J., Kulmala M., Worsnop D.R., Baltensperger U., Wex H., Stratmann F. & Laaksonen A. 2013. Evolution of particle composition in CLOUD nucleation experi-ments. Atmos. Chem. Phys. 13: 5587–5600.
Koehler K.A., Kreidenweis S.M., DeMott P.J., Petters M.D., Prenni A.J. & Carrico C.M. 2009. Hygroscopicity and cloud droplet activation of mineral dust aerosol. Geophys. Res. Lett. 36, L08805, doi:10.1029/2009GL037348.
Koehler K.A., Kreidenweis S.M., DeMott P.J., Petters M.D., Prenni A.J. & Mohler O. 2010. Laboratory investiga-tions of the impact of mineral dust aerosol on cold cloud formation. Atmos. Chem. Phys. 10: 11955–11968.
Kostenidou E., Pathak R.K. & Pandis S.N. 2007. An algo-rithm for the calculation of secondary organic aerosol density combining AMS and SMPS data. Aerosol Sci. Technol. 41: 1002–1010.
Kumar P., Nenes A. & Sokolik I. N. 2009. Importance of adsorption for CCN activity and hygroscopic properties of mineral dust aerosol. Geophys. Res. Lett. 36, L24804, doi:10.1029/2009GL040827.
Kumar P., Sokolik I.N. & Nenes A. 2011. Measurements of cloud condensation nuclei activity and droplet activation kinetics of fresh unprocessed regional dust samples and minerals. Atmos. Chem. Phys. 11: 3527–3541.
Kulmala M., Vehkamaki H., Petäjä T., Dal Maso M., Lauri A., Kerminen V.-M., Birmili W. & McMurry P. 2004. Formation and growth rates of ultrafine atmospheric particles: a review of observations. J. Aerosol Sci. 35: 143–176.
Leaitch W.R., Macdonald A.M., Anlauf K.G., Liu P.S.K., Toom-Sauntry D., Li S.M., Liggio J., Hayden K., Wasey M.A., Russell L.M., Takahama S., Liu S., van Donkelaar A., Duck T., Martin R.V., Zhang Q., Sun Y., McKendry I., Shantz N.C. & Cubison M. 2009. Evidence for Asian dust effects from aerosol plume measurements during INTEX-B 2006 near Whistler, BC. Atmos. Chem. Phys. 9: 3523–3546.
Massoli P., Lambe A.T., Ahern A.T., Williams L.R., Ehn M., Mikkilä J., Canagaratna M.R., Brune W.H., Onasch T.B., Jayne J.T., Petäjä T., Kulmala M., Laaksonen A., Kolb C.E., Davidovits P. & Worsnop D.R. 2010. Relation-ship between aerosol oxidation level and hygroscopic properties of laboratory generated secondary organic aerosol (SOA) particles. Geophys. Res. Lett. 24, L24801, doi:10.1029/2010GL046687.
Moore R., Nenes A. & Medina J. 2010. Scanning mobility CCN analysis — a method for fast measurements of size resolved CCN distributions and activation kinetics. Aerosol Sci. Technol. 44: 861–871.
Petters M.D. & Kreidenweis S.M. 2007. A single param-eter representation of hygroscopicity growth and cloud condensation nucleus activity. Atmos. Chem. Phys. 7: 1961–1971.
190 Keskinen et al. • Boreal env. res. vol. 19 (suppl. B)
Saathoff H., Naumann K.H., Schnaiter M., Schock W., Mohler O., Schurath U., Weingartner E., Gysel M. & Baltensperger U. 2003. Coating of soot and (NH4)2SO4 particles by ozonolysis products of α-pinene. J. Aerosol Sci. 34: 1297–1321.
Seinfeld J.H. & Pandis S.N. 2006. Atmospheric chemistry and physics: from air pollution to climate change, 2nd ed. John Wiley and Sons, New York.
Vlasenko A., Sjögren S., Weingartner E., Gäggeler H.W. & Ammann M. 2005. Generation of submicron Arizona test dust aerosol: chemical and hygroscopic properties. Aerosol Sci. Technol. 39: 452–460.
Vlasenko A., Sjogren S., Weingartner E., Stemmler K.,
Gäggeler H.W. & Ammann M. 2006. Effect of humidity on nitric acid uptake to mineral dust aerosol particles. Atmos. Chem. Phys. 6: 2147–2160.
Vuorinen T., Nerg A.M., Ibrahim M.A., Reddy G.V.P. & Holopainen J.K. 2004. Emission of Plutella xylostella‐induced compounds from cabbages grown at elevated CO2 and orientation behavior of the natural enemies. Plant Physiol. 135: 1984–1992.
Winkler P.M., Ortega J., Karl T., Cappellin L., Friedli H.R., Barsanti K., McMurry P.H. & Smith J.N. 2012. Identifi-cation of the biogenic compounds responsible for size-dependent nanoparticle growth. Geophys. Res. Lett. 39, L20815, doi:10.1029/2012GL053253.