DGT passive sampling for quantitative in situ measurements ...
MAUDE GIRARD
ÉTUDE QUALITATIVE ET QUANTITATIVE DES INTERACTIONS ENTRE LA
β-LACTOGLOBULINE ET LA PECTINE EN SYSTÈME DILUÉ
Thèse présentée
à la Faculté des études supérieures de l'Université Laval
pour l’obtention du grade de Philosophiae Doctor (Ph.D.)
Département de sciences des aliments et nutrition FACULTÉ DES SCIENCES DE L’AGRICULTURE ET DE L’ALIMENTATION
UNIVERSITÉ LAVAL QUÉBEC
SEPTEMBRE 2003
© Maude Girard, 2003
ii Résumé court
La caractérisation des interactions protéines/polysaccharides a été réalisée à l’aide
d’un système modèle β-lactoglobuline (β-lg)/pectine. Les pH de formation des complexes
solubles entre la β-lg et la pectine faiblement ou hautement méthylée (pectine LM ou HM)
mesurés par titrage potentiométrique sont de 6,1 et 5,5, respectivement. L’importance des
interactions électrostatiques et la présence de liens hydrogène ont été démontrées par la
dissociation des complexes en présence d’agents déstabilisants. La constante d’association,
la stoechiométrie, la taille du site de liaison et la coopérativité des complexes ont été
déterminés sous différentes conditions. Les paramètres d’interaction des peptides β-lg 132-
148, 76-83, 41-60 et 1-14 suggèrent l’implication de ces zones peptidiques dans les
complexes β-lg/pectine. L’initiation de l’interaction entre la β-lg et la pectine se traduit par
la formation de complexes solubles d’origine enthalpique. La neutralisation des complexes
induit leur agrégation et leur insolubilisation. Des facteurs d’origines entropique et
enthalpique sont favorables à cette agrégation. La séparation de phases observée lors de
l’agrégation des complexes s’effectue selon un mécanisme de nucléation et croissance.
Maude Girard Sylvie Turgeon
Professeure
iii Résumé long
La caractérisation des interactions entre les protéines et les polysaccharides a été
réalisée à l’aide d’un système modèle β-lactoglobuline (β-lg)/pectine. Les pH de formation
des complexes solubles (pHc) entre la β-lg et la pectine faiblement ou hautement méthylée
(pectine LM ou HM) mesurés par titrage potentiométrique sont de 6,1 et 5,5,
respectivement. L’effet déstabilisant du chlorure de sodium, de l’urée et d’une
augmentation de la température ont démontré que les interactions maintenant les complexes
β-lg/pectine LM ou HM sont majoritairement de nature électrostatique et en partie dues à
des liens hydrogène. Les paramètres d’interaction des complexes β-lg/pectine LM ou HM
ont été déterminés par l’analyse frontale continue en électrophorèse capillaire (FACCE). À
pH 4, environ 23 molécules de β-lg sont liées de manière coopérative sur la pectine LM. En
se liant à la pectine, une molécule de β-lg couvre un espace moyen de 12 résidus D-galA.
La constante d’association dans ces conditions est de 1431 M-1. Les peptides β-lg 132-148,
76-83, 41-60 et 1-14 ont démontré une interaction attractive avec la pectine. Le titrage
calorimétrique isothermique (ITC) a été utilisé pour caractériser les paramètres
thermodynamiques des interactions β-lg/pectine. La complexation entre la β-lg et la pectine
s’effectue en deux étapes correspondant à la formation de complexes intrapolymères
solubles dirigée par l’enthalpie suivie par une agrégation en complexes interpolymères
insolubles résultant de facteurs enthalpique et entropique favorables. La diffusion statique
de la lumière aux petits angles a permis d’identifier la nucléation et croissance comme étant
le mécanisme impliqué lors de la séparation de phase induite par la formation des
complexes. Les deux étapes de la complexation ainsi qu’une organisation locale des
complexes β-lg/pectine lors de l’acidification ont aussi été démontrées. La microscopie en
contraste de phases a permis d’observer les structures détectés par diffusion de la lumière.
Les connaissances acquises sur les interactions β-lg/pectine seront applicables à des projets
de recherche dans le domaine des ingrédients alimentaires.
Maude Girard Sylvie Turgeon
Professeure
iv Abstract
The aim of this study was to characterize protein/polysaccharide interactions using
the β-lactoglobulin (β-lg)/pectin as a model system. The pH values leading to the formation
of soluble complexes (pHc) between β-lg and low or high-methoxyl-pectin (LM- or HM-
pectin) measured with titration were 6.1 and 5.5, respectively. The destabilizing effect of
sodium chloride, urea and temperature has demonstrated that interactions in the systems are
mainly caused by electrostatic forces and, to a lesser extent, hydrogen bonding. Binding
parameters of β-lg/pectin complexes were determined using frontal analysis continuous
capillary electrophoresis (FACCE). At pH 4, approximately 23 β-lg molecules are
cooperatively complexed on LM-pectin, where each β-lg molecule covers an average of 12
D-galA residues. The calculated binding constant is 1431 M-1. The peptides β-lg 132-148,
76-83, 41-60, and 1-14 would be involved in the interaction with the pectin. Isothermal
titration calorimetry (ITC) was used to characterize the thermodynamic parameters of β-
lg/LM- or HM-pectin complexes. The binding isotherms revealed the formation of soluble
intrapolymer complexes further followed by their aggregation in insoluble interpolymer
complexes. The soluble complexes were enthalpically driven, whereas enthalpic and
entropic factors were involved in the insoluble complexes formation. Static light scattering
was used to monitor the phase separation of β-lg/LM and HM-pectin mixtures as they were
acidified with glucono-δ-lactone (GDL). This technique was used to confirm the two-step
mechanism observed with ITC. The phase separation resulting from complexation was
achieved through a nucleation and growth mechanism. The increase of complexation in
solution with acidification led to a local ordering of systems. Complex formation through
acidification was confirmed using phase contrast microscopy. A better understanding of β-
lg/pectin interactions was required to achieve research projects using complexes as food
ingredients.
Maude Girard Sylvie Turgeon
Professeure
v Avant-Propos
La réalisation de ce projet de doctorat a été parsemée de défis personnels et
professionnels. La rédaction de cette thèse marque la fin d’une bien belle époque. Bien que
le « bonheur soit en nous », plusieurs personnes ont marqué de façon positive cette période
de ma vie.
Un premier merci à ma directrice de thèse Sylvie Turgeon qui par ses
encouragements, son positivisme, sa franchise et son calme inébranlable a su
m’accompagner lors de ces années au doctorat. Merci à ma co-directrice qui, avec son « œil
de lynx », a permis d’ajouter une grande qualité aux travaux présentés. Merci à Christian
Sanchez pour sa contribution à l’article en diffusion statique de la lumière.
Merci à tous les gens du centre STELA qui ont collaboré aux travaux en laboratoire:
Anne-Françoise Allain, Sandra Laneuville et Alain Gaudreau. Certaines personnes externes
ont aussi apporté une aide précieuse: Jacques Lapointe et Louis-Patrick Gagnon du
CREFSIP et Rémy Coulombe du CRDV. Merci aux stagiaires qui ont égayé mes étés:
Michèle Tessier, Caroline Gagné, Frédéric Bellavance et Annick Champoux. Un merci
particulier aux étudiants du Centre STELA qui ont su rendre l’ambiance de travail plus
qu’agréable. Je suis déjà nostalgique des dîners dans la fameuse « tite salle ».
Merci également aux membres de ma famille et de ma belle-famille qui ont contribué
par leur présence et leur gentillesse à mon bonheur. Un merci tout spécial à mon conjoint
Yann Doleyres dont l’amour et l’appui ont joué un rôle incontestable dans
l’accomplissement de ce projet.
Merci à la Fondation de l’Université Laval qui m’a permis de mieux vivre pendant
ces années. Merci au Conseil de Recherches en Sciences Naturelles et en Génie du Canada
sans qui, la présentation de cette thèse n’aura pas été possible.
Cette thèse a été rédigée sous la forme de quatre articles scientifiques. Le premier
chapitre intitulé « Introduction générale » est une revue de littérature portant sur les
biopolymères à l’étude, la théorie des interactions moléculaires, les interactions
vi protéine/polysaccharide et la méthodologie utilisée dans le projet. La présentation de
l’hypothèse de travail, du but et des objectifs spécifiques conclut ce chapitre.
Le deuxième chapitre est intitulé « Interbiopolymer complexing between β-
lactoglobulin and low- or high-methoxyl pectin measured by potentiometric titration and
ultrafiltration » et est publié dans le journal « Food Hydrocolloids » 2002 (16) 585-591. Il
porte sur la détermination des conditions permettant la formation de complexes β-
lactoglobuline/pectine, ainsi que sur l’identification de la nature des interactions impliquées
dans ces complexes. J’ai contribué à ce travail en accomplissant la totalité des
manipulations en laboratoire au centre STELA et en effectuant la rédaction de l’article.
Sylvie Turgeon et Sylvie Gauthier ont apporté leur soutien scientifique lors des
expérimentations en laboratoire et lors de la rédaction de l’article.
Le troisième chapitre intitulé « Quantification of the interactions between β-
lactoglobulin and pectin through capillary electrophoresis analysis » est sous presse dans la
revue « Journal of Agricultural and Food Chemistry ». Cet article porte sur la
quantification des interactions entre la β-lactoglobuline et la pectine (constante
d’association, taille du site de liaison, stœchiométrie des complexes) en utilisant une
technique originale en électrophorèse capillaire. Les sites potentiellement réactifs de la β-
lactoglobuline ont été identifiés par l’ultrafiltration de mélanges pectine/peptides β-
lactoglobuline. J’ai contribué à ce travail en réalisant l’intégralité des manipulations en
laboratoire au Centre STELA et en effectuant la rédaction de l’article. Sylvie Turgeon et
Sylvie Gauthier ont apporté leur soutien scientifique lors des expérimentations en
laboratoire et lors de la rédaction de l’article.
Le quatrième chapitre intitulé « Thermodynamic parameters of β-lactoglobulin/pectin
complexes assessed by isothermal titration calorimetry » est publié dans la revue « Journal
of Agricultural and Food Chemistry » 2003 (51) 4450-4455. Certains paramètres
thermodynamiques tels que l’enthalpie, l’entropie, l’énergie libre de Gibbs, la constante
d’association et la stoechiométrie de complexes β-lactoglobuline/pectine ont pu être
déterminés par une technique de titrage isothermique calorimétrique. L’utilisation de cette
technique a permis d’appuyer les paramètres quantitatifs déterminés par électrophorèse
vii capillaire (chapitre 3). J’ai contribué à ce travail en accomplissant la totalité des
expériences ainsi qu’en rédigeant l’article. Les manipulations en laboratoire ont été
réalisées grâce à la collaboration du professeur Jacques Lapointe, membre du groupe de
recherche CREFSIP de l’université Laval. Sylvie Turgeon et Sylvie Gauthier ont apporté
leur soutien scientifique lors des expérimentations en laboratoire et lors de la rédaction de
l’article.
Le cinquième chapitre intitulé « Associative phase separation of β-
lactoglobulin/pectin solutions: A kinetic study by small angle static light scattering » est
soumis au journal « Langmuir ». Cette étude a permis de suivre la cinétique de séparation
de phases lors de la formation des complexes β-lactoglobuline/pectine. J’ai effectué les
manipulations en laboratoire au Centre de Recherche sur la Défense du Canada situé à
Valcartier. Christian Sanchez et Sandra Laneuville ont contribué au travail par leurs
conseils scientifiques lors de la préparation des manipulations et de l’interprétation des
résultats. Sylvie Turgeon et Sylvie Gauthier ont apporté leur soutien scientifique lors de la
rédaction de l’article.
Un sixième chapitre intitulé « Conclusion générale » conclut le travail par une
discussion générale de l’ensemble des résultats présentés tout au long du document et par la
présentation des perspectives de recherche. Enfin, l’ensemble des références citées dans le
texte ont été décrites à la fin du document, dans la section bibliographie.

à celles qui n’ont pas accès à l’éducation
ix Table des matières
RÉSUMÉ COURT....................................................................................................II
RÉSUMÉ LONG .....................................................................................................III
ABSTRACT ........................................................................................................... IV
AVANT-PROPOS................................................................................................... V
TABLE DES MATIÈRES ....................................................................................... IX
LISTE DES TABLEAUX...................................................................................... XIII
LISTE DES FIGURES .........................................................................................XIV
CHAPITRE 1: INTRODUCTION GÉNÉRALE .........................................................1
1.1 INTRODUCTION.......................................................................................2
1.2 BIOPOLYMÈRES À L’ÉTUDE...................................................................4
1.2.1 La β-lactoglobuline ...........................................................................4 1.2.1.1 Origine et structure ............................................................................. 4 1.2.1.2 Influence du milieu sur la structure .................................................... 6
1.2.2 La Pectine ........................................................................................7 1.2.2.1 Origine et structure ............................................................................. 7 1.2.2.2 Influence du milieu sur la structure .................................................... 9
1.3 LES INTERACTIONS MOLÉCULAIRES .................................................11
1.3.1 Liens covalents ..............................................................................11 1.3.2 Interactions électrostatiques...........................................................12 1.3.3 Forces de van der Waals ...............................................................13 1.3.4 Forces de dispersion de London ....................................................13 1.3.5 Répulsions stériques......................................................................14 1.3.6 Interactions hydrophobes ...............................................................14
1.4 LES SOLUTIONS DE POLYMÈRES.......................................................15
1.4.1 Principes de thermodynamique......................................................15 1.4.2 Loi de Raoult ..................................................................................16 1.4.3 Les théories matricielles.................................................................17 1.4.4 La théorie de Flory-Huggins ...........................................................18
1.4.4.1 Enthalpie de mélange nulle .............................................................. 20 1.4.4.2 Enthalpie de mélange non nulle ....................................................... 20
1.5 INCOMPATIBILITÉ ET COMPATIBILITÉ THERMODYNAMIQUE..........23
1.5.1 Cas particulier des interactions protéine/polysaccharide ...............23
x
1.5.2 La formation de complexes ............................................................26 1.5.3 Facteurs influençant la nature des complexes ...............................27
1.5.3.1 Charge des macromolécules ............................................................. 27 1.5.3.2 Le pH................................................................................................ 27 1.5.3.3 Nature du polysaccharide ................................................................. 28 1.5.3.4 Poids moléculaire ............................................................................. 28 1.5.3.5 Influence du milieu sur la structure .................................................. 28 1.5.3.6 Méthode de fabrication..................................................................... 29
1.5.4 Cinétique de la séparation de phases ............................................29 1.5.5 Le système β-lactoglobuline/pectine ..............................................30
1.6 TECHNIQUES DE CARACTÉRISATION ................................................32
1.6.1 Électrophorèse capillaire ................................................................32 1.6.1.1 Principe de base................................................................................ 32 1.6.1.2 Analyse frontale continue................................................................. 35
1.6.2 Titration calorimétrique isothermique .............................................37 1.6.3 Diffusion statique de la lumière aux petits angles ..........................41
1.7 HYPOTHÈSE, BUT ET OBJECTIFS SPÉCIFIQUES..............................45
1.7.1 Hypothèse ......................................................................................45 1.7.2 But..................................................................................................45 1.7.3 Objectifs spécifiques ......................................................................45
CHAPITRE 2: INTERBIOPOLYMER COMPLEXING BETWEEN Β-LACTOGLOBULIN AND LOW- OR HIGH-METHOXYL PECTIN MEASURED BY POTENTIOMETRIC TITRATION AND ULTRAFILTRATION................................47
2.1 RÉSUMÉ .................................................................................................48
2.2 ABSTRACT .............................................................................................49
2.3 INTRODUCTION.....................................................................................50
2.4 MATERIALS AND METHODS.................................................................52
2.4.1 Materials.........................................................................................52 2.4.2 Potentiometric Titrations.................................................................52 2.4.3 Quantification of the complexed β-lg ..............................................53 2.4.4 Statistical Analysis .........................................................................54
2.5 RESULTS AND DISCUSSION ................................................................55
2.5.1 Potentiometric Titrations.................................................................55 2.5.2 Ultrafiltration ...................................................................................56
2.6 CONCLUSION.........................................................................................59
xi
CHAPITRE 3: QUANTIFICATION OF THE INTERACTIONS BETWEEN Β-LACTOGLOBULIN AND PECTIN THROUGH CAPILLARY ELECTROPHORESIS ANALYSIS.............................................................................................................66
3.1 RÉSUMÉ .................................................................................................67
3.2 ABSTRACT .............................................................................................68
3.3 INTRODUCTION.....................................................................................69
3.4 MATERIALS AND METHODS.................................................................71
3.4.1 Materials.........................................................................................71 3.4.2 Preparation of solutions..................................................................71 3.4.3 Frontal analysis continuous capillary electrophoresis ....................71 3.4.4 Ultrafiltration ...................................................................................72 3.4.5 Calculation of the binding parameters............................................73
3.5 RESULTS................................................................................................75
3.6 DISCUSSION ..........................................................................................78
3.7 CONCLUSION.........................................................................................82
CHAPITRE 4: THERMODYNAMIC PARAMETERS OF β-LACTOGLOBULIN/PECTIN COMPLEXES ASSESSED BY ISOTHERMAL TITRATION CALORIMETRY.................................................................................90
4.1 RÉSUMÉ .................................................................................................91
4.2 ABSTRACT .............................................................................................92
4.3 INTRODUCTION.....................................................................................93
4.4 MATERIALS AND METHODS.................................................................95
4.4.1 Materials.........................................................................................95 4.4.2 Preparation of solutions..................................................................95 4.4.3 Isothermal titration calorimetry .......................................................96 4.4.4 Overlapping binding site model ......................................................96
4.5 RESULTS................................................................................................99
4.6 DISCUSSION ........................................................................................104
4.7 CONCLUSION.......................................................................................107
xii
CHAPITRE 5: ASSOCIATIVE PHASE SEPARATION OF Β-LACTOGLOBULIN/PECTIN SOLUTIONS: A KINETIC STUDY BY SMALL ANGLE STATIC LIGHT SCATTERING ..............................................................112
5.1 RÉSUMÉ ...............................................................................................113
5.2 ABSTRACT ...........................................................................................114
5.3 INTRODUCTION...................................................................................115
5.4 MATERIALS AND METHODS...............................................................118
5.4.1 Materials.......................................................................................118 5.4.2 Preparation of solutions................................................................118 5.4.3 Optical microscopy.......................................................................118 5.4.4 Small angle static light scattering .................................................119
5.5 RESULTS..............................................................................................120
5.5.1 Optical microscopy.......................................................................120 5.5.2 Small angle static light scattering .................................................120
5.6 DISCUSSION ........................................................................................123
5.7 CONCLUSION.......................................................................................127
CHAPITRE 6: CONCLUSION GÉNÉRALE.........................................................134
BIBLIOGRAPHIE ................................................................................................139
xiii Liste des tableaux
Table 2.1 Relative charge on β-lg/pectin complex at different ratios β-lg/pectin. ...61
Table 3.1 Binding parameters of β-lg/LM- or HM-pectin complexes calculated with the overlapping binding site model.........................................................83
Table 3.2 Binding parameters of the peptides β-lg 1-14, 41-60, 76-83, or 132-148/LM-pectin complexes calculated with the overlapping binding site model. ....................................................................................................84
Table 4.1 Thermodynamic parameters of β-lg/LM- or HM-pectin complexes determined with the Microcal ORIGIN software. ..................................108
xiv Liste des figures
Figure 1.1 Structure primaire de la β-lactoglobuline A. ............................................4
Figure 1.2 Structure tridimensionnelle d’un monomère de la β-lactoglobuline A. ....5
Figure 1.3 Chaîne principale d’une pectine..............................................................8
Figure 1.4 Structure schématique de la pectine.......................................................8
Figure 1.5 Théorie matricielle pour une solution réelle ..........................................18
Figure 1.6 Modèle de Flory-Huggins......................................................................19
Figure 1.7 Schématisation de la décomposition spinodale et de la nucléation et croissance..............................................................................................30
Figure 1.8 Principe de l’électrophorèse..................................................................32
Figure 1.9 Ensemble des composantes d’un appareil d’électrophorèse capillaire .33
Figure 1.10 Électrophérogramme d’un mélange ternaire analysé par FACCE. .....35
Figure 1.11 Modèle des sites de liaison superposés .............................................36
Figure 1.12 Schéma d’un appareil ITC ..................................................................38
Figure 1.13 Exemple d'un thermogramme et d'un isotherm d'interaction...............39
Figure 1.14 Isothermes d'interactions en fonction de la valeur c. ..........................40
Figure 1.15 Angle de diffusion de la lumière en fonction de la taille des particules41
Figure 1.16 Schéma d'un appareil de diffusion statique de la lumière aux petits angles. ...................................................................................................42
Figure 2.1 Titration curves of β-lg/pectin mixtures at different ratios......................62
Figure 2.2 Titration curves of β-lg alone and β-lg/pectin mixtures at 4:1 ratio in deionized water, with NaCl or urea. .......................................................63
Figure 2.3 β-lg complexed with LM- and HM-pectin, at 4:1 ratio and at different pH in deionized water, NaCl or urea............................................................64
Figure 2.4 β-lg complexed with LM- and HM-pectin, at 4:1 ratio, in deionized water at 4°C and 40°C.....................................................................................65
xv
Figure 3.1 Localization of the selected peptides on the β-lactoglobulin molecule..85
Figure 3.2 Typical electropherogram obtained for the β-lg/LM- or HM-pectin complexes..............................................................................................86
Figure 3.3 Binding isotherms of β-lg/LM-pectin mixtures in 5 mM phosphate buffer at pH 4, 5, and 6, and in 50 mM phosphate buffer at pH 5. ...................87
Figure 3.4 Binding isotherms of β-lg/HM-pectin mixtures in 5 mM phosphate buffer at pH 4 and 5, and in 50 mM phosphate buffer at pH 5. ........................88
Figure 3.5 Binding isotherms of peptides β-lg 1-14, 41-60, 76-83 and 132-148/LM-pectin complexes at pH 4 in 5 mM sodium phosphate buffer.................89
Figure 4.1 Thermogram and binding isotherm of the β-lg complexing with LM-pectin at pH 4 in 5 mM sodium phosphate buffer.................................109
Figure 4.2 Thermogram and binding isotherm of the β-lg complexing with HM-pectin at pH 4 in 5 mM sodium phosphate buffer.................................110
Figure 4.3 Scatchard plots of the β-lg/LM-pectin and HM-pectin mixtures at pH 4 in 5 mM sodium phosphate buffer. ..........................................................111
Figure 5.1 Phase contrast micrographs from β-lg/LM- and β-lg/HM-pectin solutions at 5:1 and 2:1 ratios .............................................................................128
Figure 5.2 Evolution of turbidity with time calculated for β-lg/LM- and HM-pectin solutions at 5:1 and 2:1 ratios. .............................................................129
Figure 5.3 Number and volume mean diameters of β-lg/LM- and HM-pectin solutions at 5:1 and 2:1 ratios. .............................................................130
Figure 5.4 Light scattering intensity as a function of the wave vector for the β-lg/LM-pectin solution at 5:1 and 2:1 ratios. ..........................................131
Figure 5.5 Light scattering intensity as a function of the wave vector for the β-lg/HM-pectin solution at 5:1 and 2:1 ratios...........................................132
Figure 5.6 Time evolution of fractal dimensions of β-lg/LM- and HM-pectin solutions at ratios 5:1 and 2:1. ............................................................................133

CHAPITRE 1: Introduction générale
2
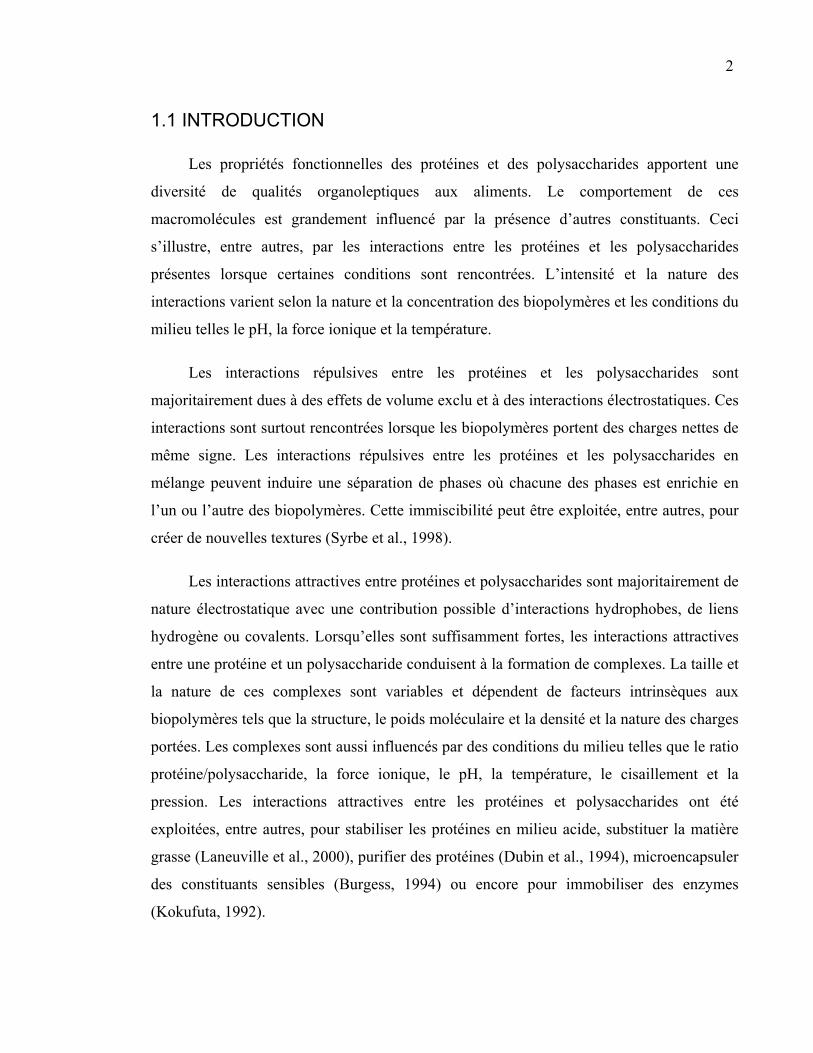
1.1 INTRODUCTION
Les propriétés fonctionnelles des protéines et des polysaccharides apportent une
diversité de qualités organoleptiques aux aliments. Le comportement de ces
macromolécules est grandement influencé par la présence d’autres constituants. Ceci
s’illustre, entre autres, par les interactions entre les protéines et les polysaccharides
présentes lorsque certaines conditions sont rencontrées. L’intensité et la nature des
interactions varient selon la nature et la concentration des biopolymères et les conditions du
milieu telles le pH, la force ionique et la température.
Les interactions répulsives entre les protéines et les polysaccharides sont
majoritairement dues à des effets de volume exclu et à des interactions électrostatiques. Ces
interactions sont surtout rencontrées lorsque les biopolymères portent des charges nettes de
même signe. Les interactions répulsives entre les protéines et les polysaccharides en
mélange peuvent induire une séparation de phases où chacune des phases est enrichie en
l’un ou l’autre des biopolymères. Cette immiscibilité peut être exploitée, entre autres, pour
créer de nouvelles textures (Syrbe et al., 1998).
Les interactions attractives entre protéines et polysaccharides sont majoritairement de
nature électrostatique avec une contribution possible d’interactions hydrophobes, de liens
hydrogène ou covalents. Lorsqu’elles sont suffisamment fortes, les interactions attractives
entre une protéine et un polysaccharide conduisent à la formation de complexes. La taille et
la nature de ces complexes sont variables et dépendent de facteurs intrinsèques aux
biopolymères tels que la structure, le poids moléculaire et la densité et la nature des charges
portées. Les complexes sont aussi influencés par des conditions du milieu telles que le ratio
protéine/polysaccharide, la force ionique, le pH, la température, le cisaillement et la
pression. Les interactions attractives entre les protéines et polysaccharides ont été
exploitées, entre autres, pour stabiliser les protéines en milieu acide, substituer la matière
grasse (Laneuville et al., 2000), purifier des protéines (Dubin et al., 1994), microencapsuler
des constituants sensibles (Burgess, 1994) ou encore pour immobiliser des enzymes
(Kokufuta, 1992).
3
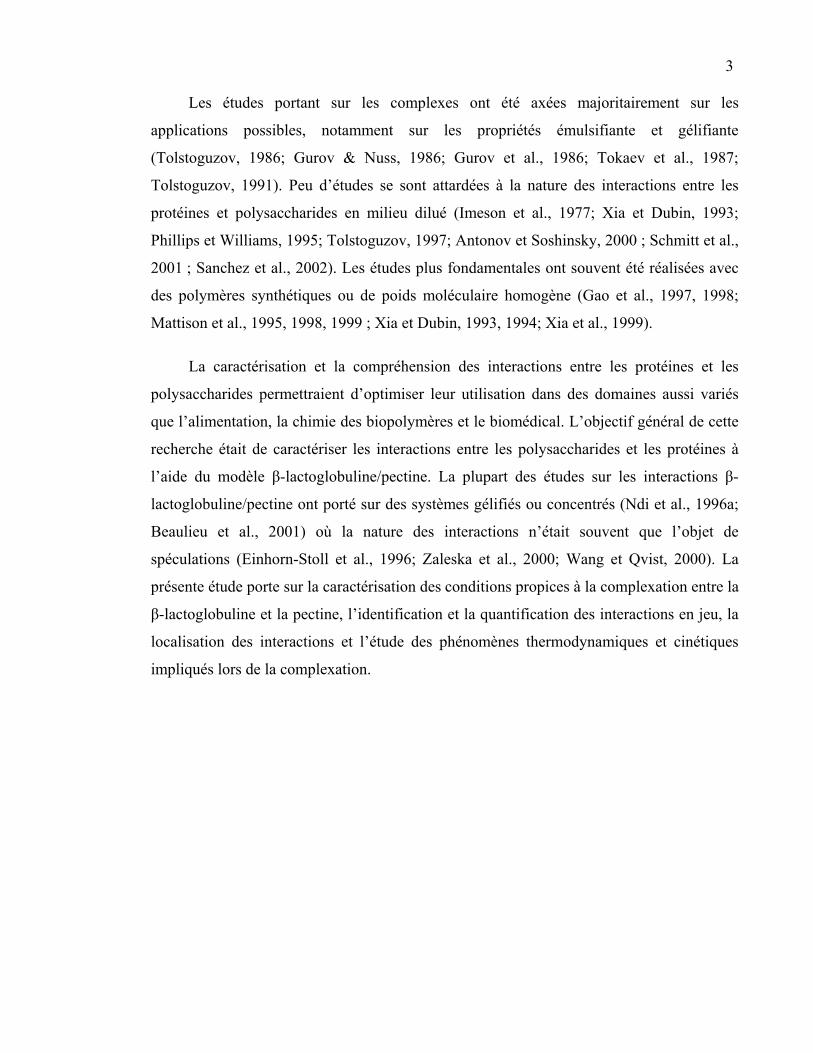
Les études portant sur les complexes ont été axées majoritairement sur les
applications possibles, notamment sur les propriétés émulsifiante et gélifiante
(Tolstoguzov, 1986; Gurov & Nuss, 1986; Gurov et al., 1986; Tokaev et al., 1987;
Tolstoguzov, 1991). Peu d’études se sont attardées à la nature des interactions entre les
protéines et polysaccharides en milieu dilué (Imeson et al., 1977; Xia et Dubin, 1993;
Phillips et Williams, 1995; Tolstoguzov, 1997; Antonov et Soshinsky, 2000 ; Schmitt et al.,
2001 ; Sanchez et al., 2002). Les études plus fondamentales ont souvent été réalisées avec
des polymères synthétiques ou de poids moléculaire homogène (Gao et al., 1997, 1998;
Mattison et al., 1995, 1998, 1999 ; Xia et Dubin, 1993, 1994; Xia et al., 1999).
La caractérisation et la compréhension des interactions entre les protéines et les
polysaccharides permettraient d’optimiser leur utilisation dans des domaines aussi variés
que l’alimentation, la chimie des biopolymères et le biomédical. L’objectif général de cette
recherche était de caractériser les interactions entre les polysaccharides et les protéines à
l’aide du modèle β-lactoglobuline/pectine. La plupart des études sur les interactions β-
lactoglobuline/pectine ont porté sur des systèmes gélifiés ou concentrés (Ndi et al., 1996a;
Beaulieu et al., 2001) où la nature des interactions n’était souvent que l’objet de
spéculations (Einhorn-Stoll et al., 1996; Zaleska et al., 2000; Wang et Qvist, 2000). La
présente étude porte sur la caractérisation des conditions propices à la complexation entre la
β-lactoglobuline et la pectine, l’identification et la quantification des interactions en jeu, la
localisation des interactions et l’étude des phénomènes thermodynamiques et cinétiques
impliqués lors de la complexation.
4
1.2 BIOPOLYMÈRES À L’ÉTUDE
1.2.1 La β-lactoglobuline
1.2.1.1 Origine et structure
Les protéines du lactosérum sont définies comme étant les protéines solubles
présentes dans le lactosérum suivant une précipitation des caséines à pH 4,6 à 20°C. Ces
protéines de lactosérum englobent une première fraction protéique (80%) composée de β-
lactoglobuline, d’α-lactalbumine, d’albumine de sérum bovin et d’immunoglobulines, et
une deuxième fraction non protéique (20%) composée de protéoses peptones et de
composés azotés (De Wit, 1981).
La β-lactoglobuline (β-lg) a une structure bien connue (Sawyer et al., 1999). Elle
représente environ 50 à 60% des protéines du lactosérum. Cette protéine est hautement
nutritive puisqu’elle contient tous les acides aminés essentiels. Certaines études ont
démontré la capacité de la β-lg à lier l’acide rétinoïque ou certains ligands hydrophobes tels
que les vitamines liposolubles et les acides gras (Kontopidis et al., 2002; Wu et al., 1999,
Qin et al., 1998a; Sawyer et Kontopidis, 2000). Cependant, la fonction biologique réelle de
la protéine demeure inconnue (Kontopidis et al., 2002).
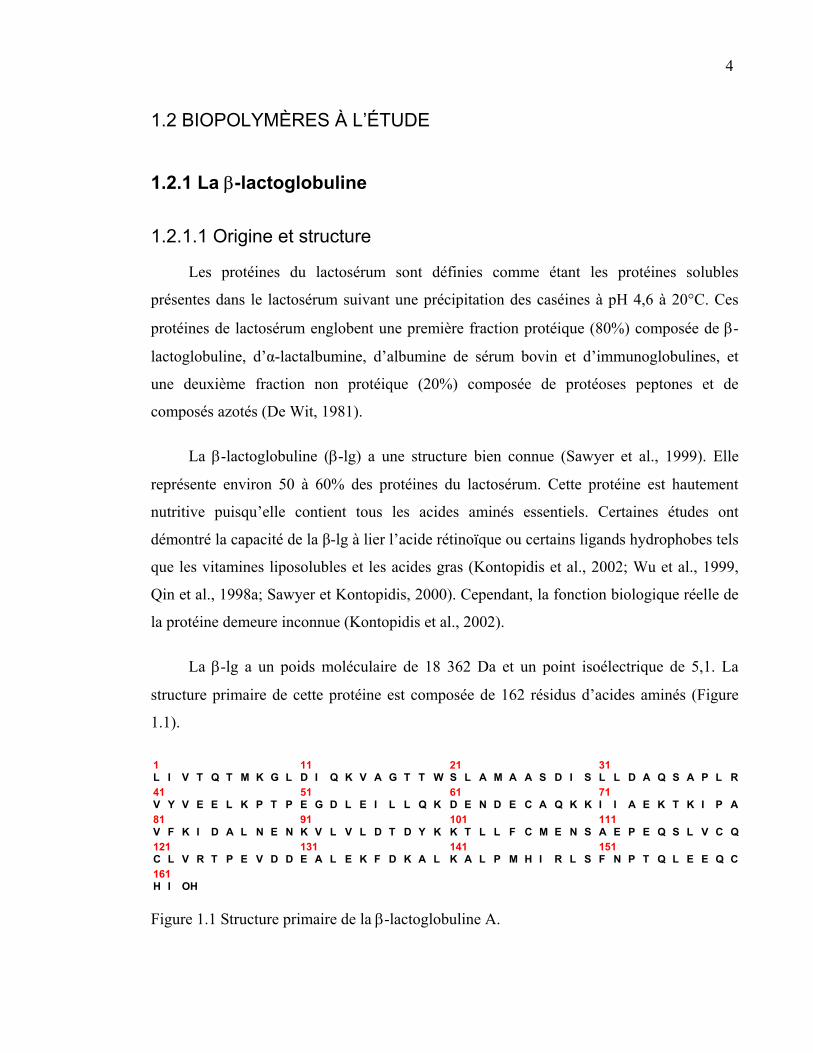
La β-lg a un poids moléculaire de 18 362 Da et un point isoélectrique de 5,1. La
structure primaire de cette protéine est composée de 162 résidus d’acides aminés (Figure
1.1).
1 11 21 31 L I V T Q T M K G L D I Q K V A G T T W S L A M A A S D I S L L D A Q S A P L R41 51 61 71 V Y V E E L K P T P E G D L E I L L Q K D E N D E C A Q K K I I A E K T K I P A81 91 101 111 V F K I D A L N E N K V L V L D T D Y K K T L L F C M E N S A E P E Q S L V C Q121 131 141 151 C L V R T P E V D D E A L E K F D K A L K A L P M H I R L S F N P T Q L E E Q C161 H I OH
Figure 1.1 Structure primaire de la β-lactoglobuline A.
5
Il existe 7 variants génétiques de cette protéine, les plus communs étant le A et le B
qui se différencient par les résidus d’acides aminés en position 64 (aspartyle et glycyle
respectivement) et 118 (valyle et alanyle respectivement) (Morr et Ha, 1993).
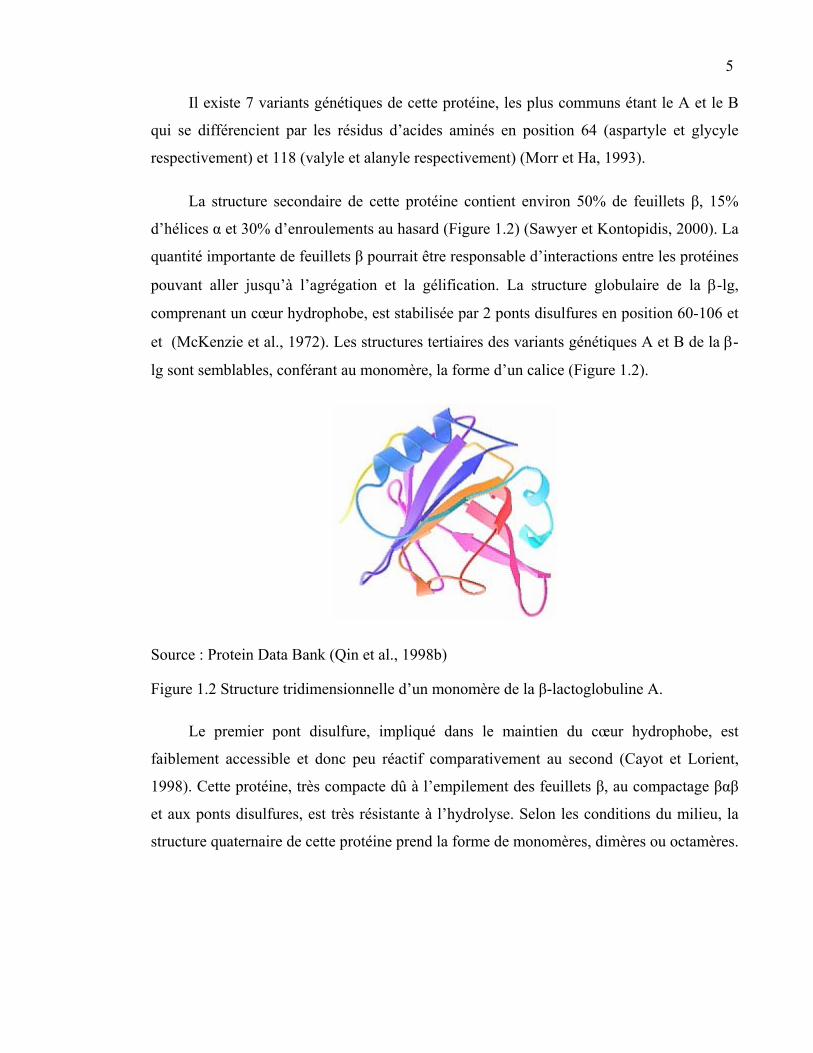
La structure secondaire de cette protéine contient environ 50% de feuillets β, 15%
d’hélices α et 30% d’enroulements au hasard (Figure 1.2) (Sawyer et Kontopidis, 2000). La
quantité importante de feuillets β pourrait être responsable d’interactions entre les protéines
pouvant aller jusqu’à l’agrégation et la gélification. La structure globulaire de la β-lg,
comprenant un cœur hydrophobe, est stabilisée par 2 ponts disulfures en position 60-106 et
et (McKenzie et al., 1972). Les structures tertiaires des variants génétiques A et B de la β-
lg sont semblables, conférant au monomère, la forme d’un calice (Figure 1.2).
Source : Protein Data Bank (Qin et al., 1998b)
Figure 1.2 Structure tridimensionnelle d’un monomère de la β-lactoglobuline A.
Le premier pont disulfure, impliqué dans le maintien du cœur hydrophobe, est
faiblement accessible et donc peu réactif comparativement au second (Cayot et Lorient,
1998). Cette protéine, très compacte dû à l’empilement des feuillets β, au compactage βαβ
et aux ponts disulfures, est très résistante à l’hydrolyse. Selon les conditions du milieu, la
structure quaternaire de cette protéine prend la forme de monomères, dimères ou octamères.
6
1.2.1.2 Influence du milieu sur la structure
Le pH et les minéraux La structure quaternaire de la β-lg est directement reliée au pH et aux minéraux du
milieu. Au pH naturel du lait, soit 6,8, la protéine est présente sous la forme de dimères.
L’ajout de chlorure de sodium ou de calcium provoque une augmentation de l’association
de ces dimères (Renard et al., 1998).
Un pH supérieur à 8 ou inférieur à 3 conduit à la dissociation des dimères de β-lg en
monomères (Ragona et al., 1997). Cette dissociation devient irréversible à pH 9, où la
polymérisation des unités protéiques a lieu en partie grâce à l’augmentation de la réactivité
du groupement sulfhydryle. Lorsque la protéine passe d’un pH neutre à un pH d’environ
4,5, les dimères peuvent s’associer et former des octamères. La présence d’octamères à ce
pH est cependant très faible pour le variant A, et remise en question pour le variant B de la
β-lg (McKenzie et Sawyer, 1967; Taulier et Chalikian, 2001). L’ajout de chlorure de
sodium ou calcium à ce pH favorise l’association des monomères en dimères.
L’ajout de sels à une solution de β-lg favorise les interactions non polaires en
neutralisation les charges de la protéine. Le calcium induit des distortions structurales
locales dans la protéine native en formant des ponts intramoléculaires (Jeyarajah et Allen,
1994). Ces ponts calciques augmentent l’hydrophobicité de la protéine et la réactivité des
groupements sulfhydryles. L’ajout de calcium dans une solution de β-lg partiellement
dénaturée induit la formation d’un gel maintenu par des ponts calciques intermoléculaires
(Jeyarajah et Allen, 1994). La valence des ions incorporés à la solution de β-lg joue un rôle
important dans le mécanisme de gélification (Kuhn et Foegeding, 1991). Le chlorure de
sodium modifie peu l’hydrophobicité de la β-lg et la réactivité des groupements sulfydryles
(Jeyarajah et Allen, 1994). La gélification d’une solution de β-lg en présence de chlorure de
sodium est plus lente que celle observe avec le chlorure de calcium (Foegeding et al.,
1992).
7
La température La protéine adopte la conformation d’un dimère à la température de la pièce. L’effet
de la température dépend du pH et de la force ionique du milieu. Lors d’un chauffage entre
50 et 80ºC à pH neutre, les dimères de la protéine se dissocient, exposant ainsi un
groupement sulfhydryle (Kella et Kinsella, 1988). L’échange de ponts disulfures serait
ensuite responsable de la formation d’oligomères et éventuellement d’agrégats maintenus
par des interactions hydrophobes. La réactivité des groupements thiols augmente à pH
alcalin, atteignant un maximum au pKa du groupement (9,35). Le déplissement de la
protéine permet une accessibilité accrue des groupements sulfhydryles. Les agrégats formés
à un pH supérieur ou égal à 6,0 sont solubles. Le chauffage des protéines en milieu acide
produit une dénaturation sans agrégation. Un réajustement subséquent du pH à 4,5 conduit
à l’insolubilisation des protéines dénaturées (Cayot et Lorient, 1998).
Présence d’autres constituants La présence de sucres tels le lactose, le glucose, le galactose et le sorbitol atténue
l’effet d’un traitement thermique en diminuant les interactions entre les protéines. La
dénaturation des protéines est cependant favorisée en présence de sucres réducteurs
pouvant être impliqués dans la réaction de Maillard (Morr et Ha, 1993).
1.2.2 La Pectine
1.2.2.1 Origine et structure
La pectine est un polysaccharide des parois cellulaires végétales. L’industrie
alimentaire utilise la pectine principalement pour ses propriétés gélifiantes dans des
produits tels les confitures et les gelées et pour sa capacité à stabiliser les produits laitiers
acides. De plus, la pectine est une fibre alimentaire soluble qui diminuerait les risques de
cancer du colon (Nangia-Makker et al., 2002). La pectine disponible sur le marché est
majoritairement extraite des résidus de l’industrie du jus de pommes et des écorces de
citron.
8
La pectine est un hétéropolysaccharide anionique ramifié (pKa 3-4) d’un poids
moléculaire situé entre 50000 et 150000 Da (Voragen et al., 1995). Ce caractère anionique
de la pectine la rend susceptible aux interactions avec les protéines (Tolstoguzov, 1991). Le
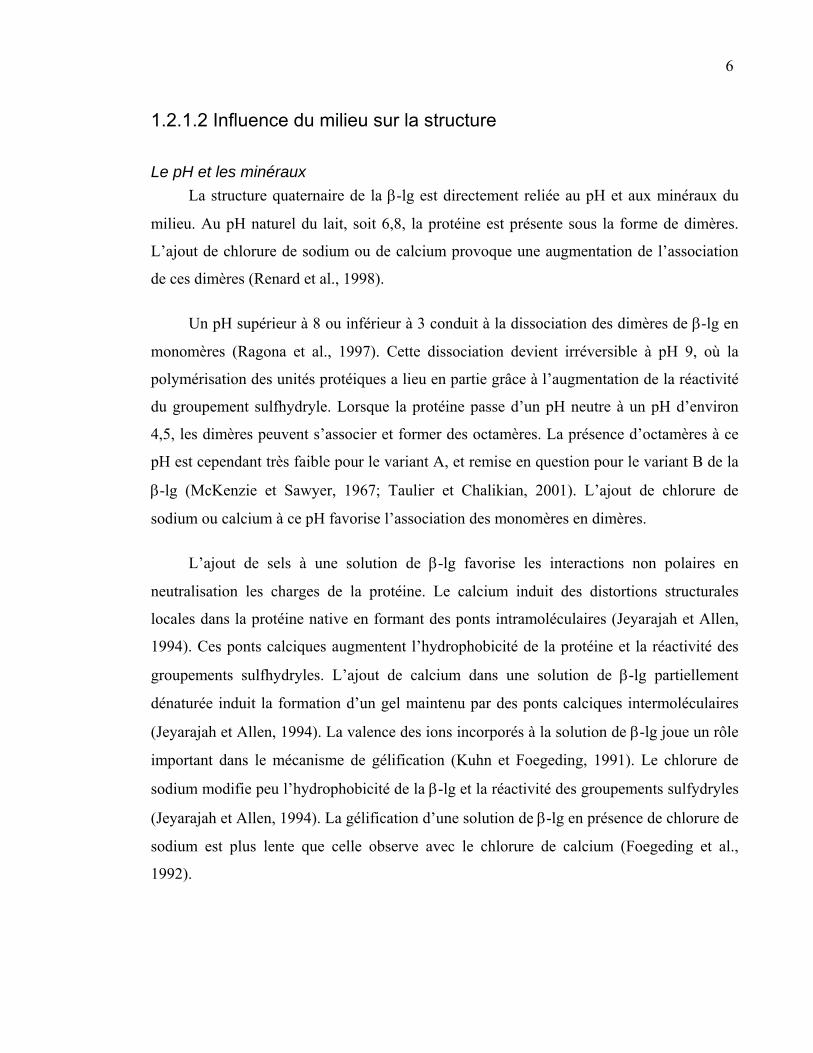
squelette de la pectine est composé majoritairement d’unités (200-1000) d’acide D-
galacturonique (D-galA) reliées par des liens glycosidiques α-(1→4). Dans une plus faible
proportion (1 à 4%), des unités L-rhamnoses (Rha) liées par des liens α-(1→2) viennent
interrompre la chaîne principale (Figure 1.3).
Figure 1.3 Chaîne principale d’une pectine composée d’un enchaînement GalA-Rha-GalA-Rha.
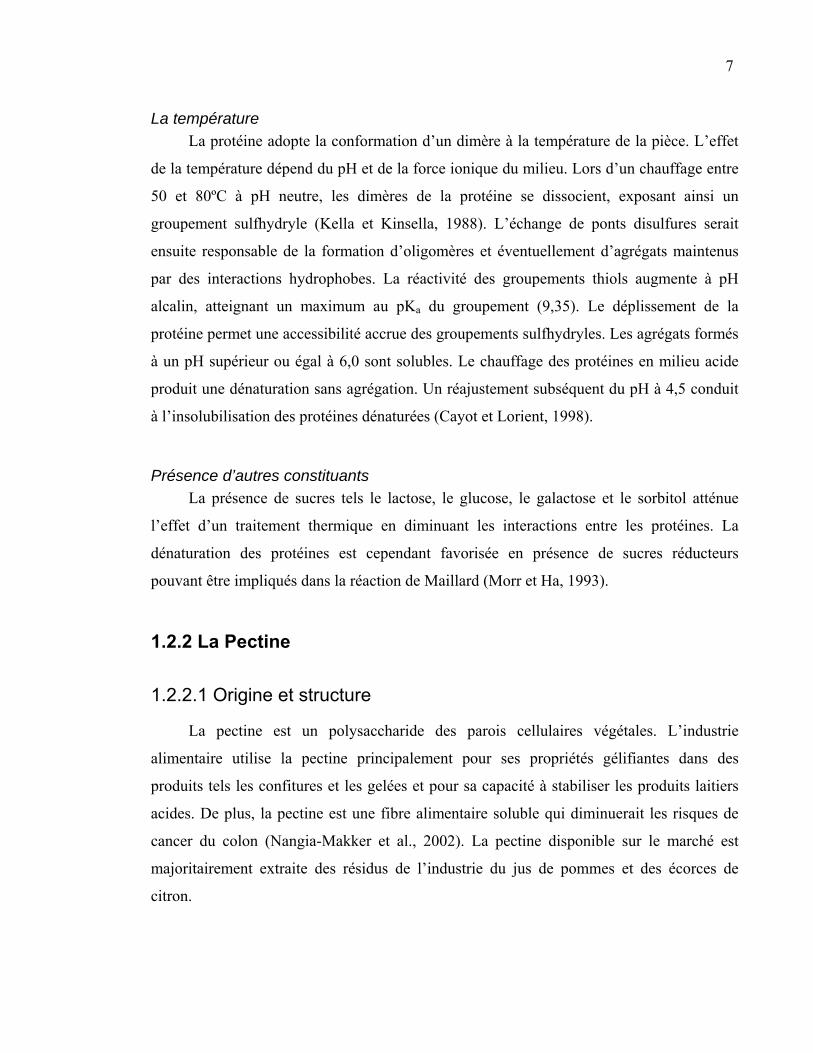
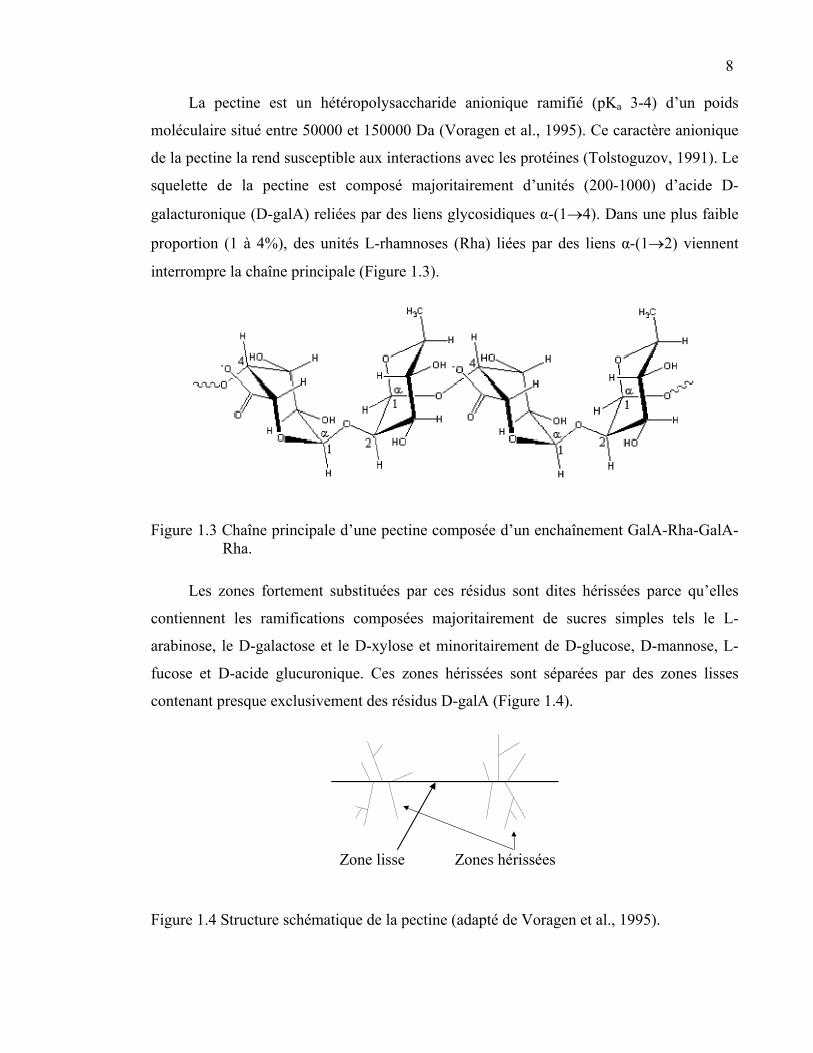
Les zones fortement substituées par ces résidus sont dites hérissées parce qu’elles
contiennent les ramifications composées majoritairement de sucres simples tels le L-
arabinose, le D-galactose et le D-xylose et minoritairement de D-glucose, D-mannose, L-
fucose et D-acide glucuronique. Ces zones hérissées sont séparées par des zones lisses
contenant presque exclusivement des résidus D-galA (Figure 1.4).
Zone lisse Zones hérissées
Figure 1.4 Structure schématique de la pectine (adapté de Voragen et al., 1995).
9
Les zones lisses sont très résistantes à l’hydrolyse acide comparativement aux zones
hérissées qui sont beaucoup plus sensibles (Voragen et al., 1995). En plus de l’hydrolyse
acide, la pectine peut subir une attaque enzymatique par la polygalacturonase, la pectate-
lyase, la pectine lyase, la rhamnogalacturonase, la pectine méthylestérase et la pectine
acétylestérase.
La pectine peut avoir différents degré d’estérification (DE). Le DE est le pourcentage
de groupements carboxyles estérifiés par une molécule de méthanol. La pectine d’un DE
inférieur à 50% est dite faiblement méthylée (LM), celle dont le DE est supérieur à 50% est
dite hautement méthylée (HM) et finalement, lorsque le DE est inférieur à 10%, la pectine
est appelée acide pectique. La pectine commerciale peut aussi contenir des groupes amides.
Le degré d’amidation est le nombre de groupes carboxyliques amidés par 100 unités D-
galA.
La structure tertiaire de la pectine est une hélice tridimensionnelle. La rigidité de la
pectine est causée principalement par les monomères D-galA liés par un lien axial-axial
(Burton et Brant, 1983). Les groupements méthoxyles n’ont pas d’effet sur la flexibilité du
polysaccharide, contrairement au rhamnose dont une faible quantité suffit à l’augmenter. La
présence de groupements amides augmente la rigidité des chaînes de la pectine (Axelos et
Thibault, 1991).
1.2.2.2 Influence du milieu sur la structure
Le pH La pectine est stable à des pH entre 3 et 4. À pH plus acide, les groupements
méthoxyle et acétyle sont éliminés et les sucres neutres hydrolysés. En milieu très acide, la
pectine se décompose en gaz carbonique, en furfural et autres produits de dégradation. En
milieu alcalin, les groupements esters de la pectine sont saponifiés. À pH neutre, la
saponification est accompagnée d’une réaction de dépolymérisation (Voragen et al., 1995).
10
Les minéraux Les ions monovalents se lient de manière électrostatique aux chaînes de pectine alors
que les ions divalents entraînent la gélification de la pectine LM par l’intermédiaire de
ponts salins. Ces derniers ions peuvent être classés en ordre de compatibilité avec la
pectine : Mg2+ << Ca2+ ~ Sr2+ < Ba2+. En présence d’ions divalents, les chaînes de D-galA
se positionnent sur deux dimensions et forment une série de cavités chargées négativement
où les ions divalents viennent se loger. Le gel rigide de pectine LM ainsi obtenu est le
résultat des interactions entre les groupements carboxyles libres et les ions calcium qui
forment des ponts entre les molécules. Ce modèle, connu sous le nom de boîte d’œufs, est
controversé par certains auteurs (Axelos et Thibault, 1991 ; Renard et al., 1993). Le
mécanisme de gélification de la pectine HM se produit en présence d’une grande quantité
de solides totaux (60% de sucre). Le gel formé est maintenu par des interactions
hydrophobes et des liaisons hydrogène (Walkinshaw et Arnott, 1981).
11
1.3 LES INTERACTIONS MOLÉCULAIRES
Les interactions impliquées entre les molécules modifient leur comportement en
solution. La force, la spécificité ainsi que la nature attractive ou répulsive des interactions
sont variables. Les interactions moléculaires peuvent être classées de par leur nature
covalente, électrostatique, due à des forces de van der Waals ou encore à des répulsions
stériques (Hiemenz et Rajagopalan, 1997). Les interactions répulsives sont non spécifiques
et proviennent de répulsions stériques ou d’interactions électrostatiques. Les interactions
attractives peuvent être faibles ou fortes, spécifiques ou non spécifiques. Les liaisons
covalentes sont spécifiques contrairement aux interactions électrostatiques, aux forces de
van der Waals et aux interactions hydrophobes. Les interactions entre les molécules sont
souvent exprimées sous la forme d’énergie potentielle (Prausnitz et al., 1999). L’énergie
potentielle entre deux molécules dépend de leur position relative. La force nécessaire pour
séparer deux molécules sphériques simples d’une distance intermoléculaire r vers l’infini
peut être exprimée par la différence d’énergie potentielle impliquée en fonction de la
distance intermoléculaire (1).
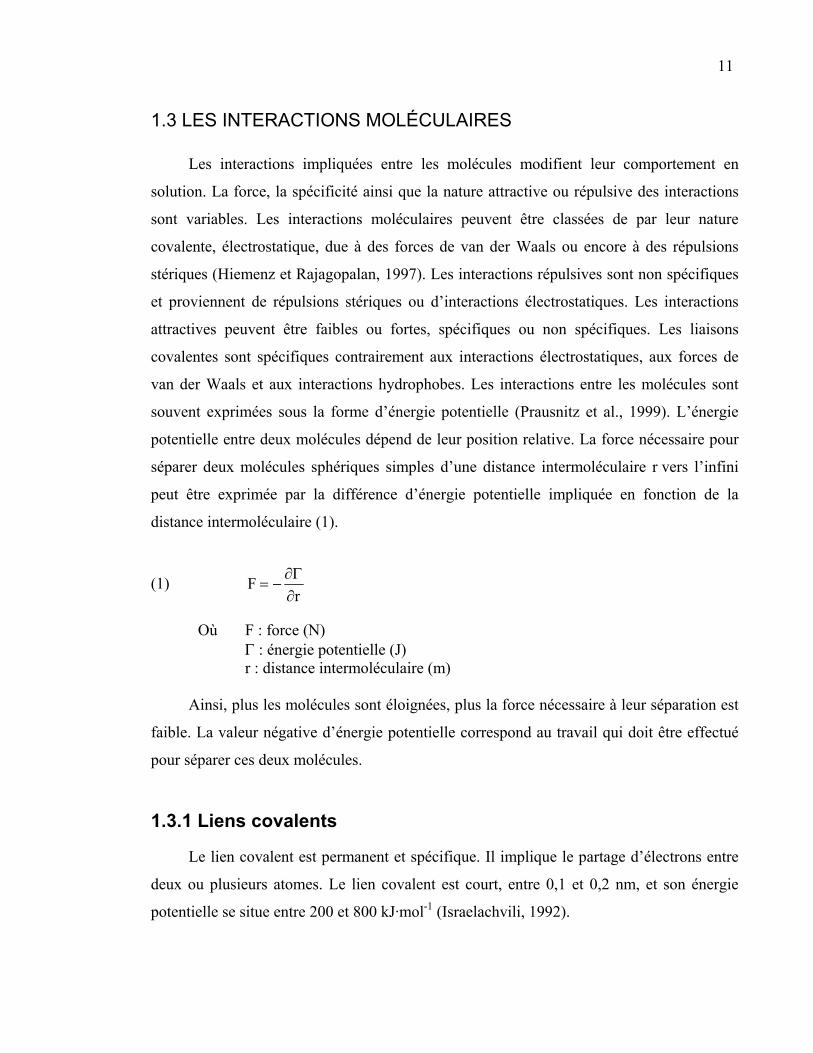
(1) r
F∂Γ∂
−=
Où F : force (N) Γ : énergie potentielle (J) r : distance intermoléculaire (m)
Ainsi, plus les molécules sont éloignées, plus la force nécessaire à leur séparation est
faible. La valeur négative d’énergie potentielle correspond au travail qui doit être effectué
pour séparer ces deux molécules.
1.3.1 Liens covalents
Le lien covalent est permanent et spécifique. Il implique le partage d’électrons entre
deux ou plusieurs atomes. Le lien covalent est court, entre 0,1 et 0,2 nm, et son énergie
potentielle se situe entre 200 et 800 kJ·mol-1 (Israelachvili, 1992).
12
1.3.2 Interactions électrostatiques
Les interactions électrostatiques peuvent être de type ion-ion, ion-dipôle ou dipôle-
dipôle. Les dipôles peuvent être permanents ou induits. Les interactions ion-ion sont
impliquées entre des molécules possédant une charge électrique permanente. Ces liens ont
une longueur variant entre 0,2 et 0,3 nm et ont une énergie potentielle située entre 25 et 50
kJ·mol-1 (Israelachvili, 1992). La force d’interaction dépend des charges des molécules, de
la distance entre les molécules et de la constante diélectrique du milieu (Prausnitz et al.,
1999). Elle peut être exprimée par l’équation 2.
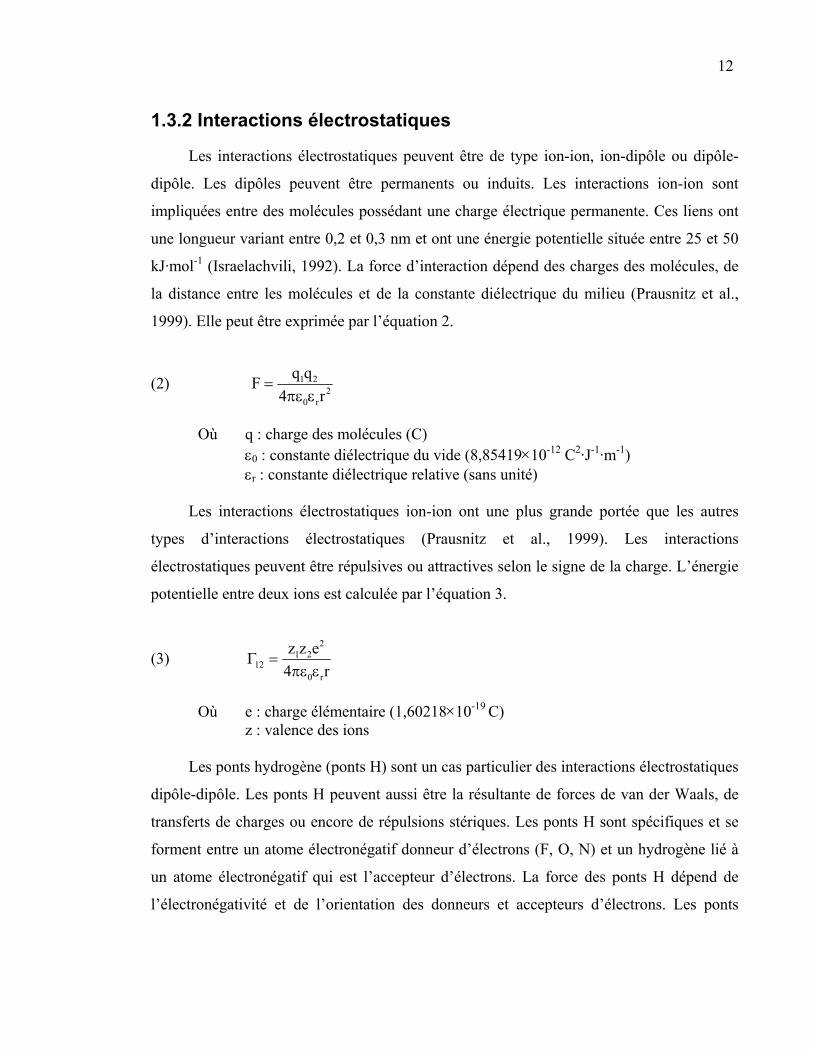
(2) 2r0
21
r4qqFεπε
=
Où q : charge des molécules (C) ε0 : constante diélectrique du vide (8,85419×10⁻¹² C2·J-1·m-1)
εr : constante diélectrique relative (sans unité)
Les interactions électrostatiques ion-ion ont une plus grande portée que les autres
types d’interactions électrostatiques (Prausnitz et al., 1999). Les interactions
électrostatiques peuvent être répulsives ou attractives selon le signe de la charge. L’énergie
potentielle entre deux ions est calculée par l’équation 3.
(3) r4
ezz
r0
221
12 επε=Γ
Où e : charge élémentaire (1,60218×10⁻¹⁹ C) z : valence des ions
Les ponts hydrogène (ponts H) sont un cas particulier des interactions électrostatiques
dipôle-dipôle. Les ponts H peuvent aussi être la résultante de forces de van der Waals, de
transferts de charges ou encore de répulsions stériques. Les ponts H sont spécifiques et se
forment entre un atome électronégatif donneur d’électrons (F, O, N) et un hydrogène lié à
un atome électronégatif qui est l’accepteur d’électrons. La force des ponts H dépend de
l’électronégativité et de l’orientation des donneurs et accepteurs d’électrons. Les ponts
13 hydrogène ont une énergie potentielle entre 10 et 40 kJ·mol-1 et une longueur entre 0,2 et
0,3 nm (Israelachvili, 1992).
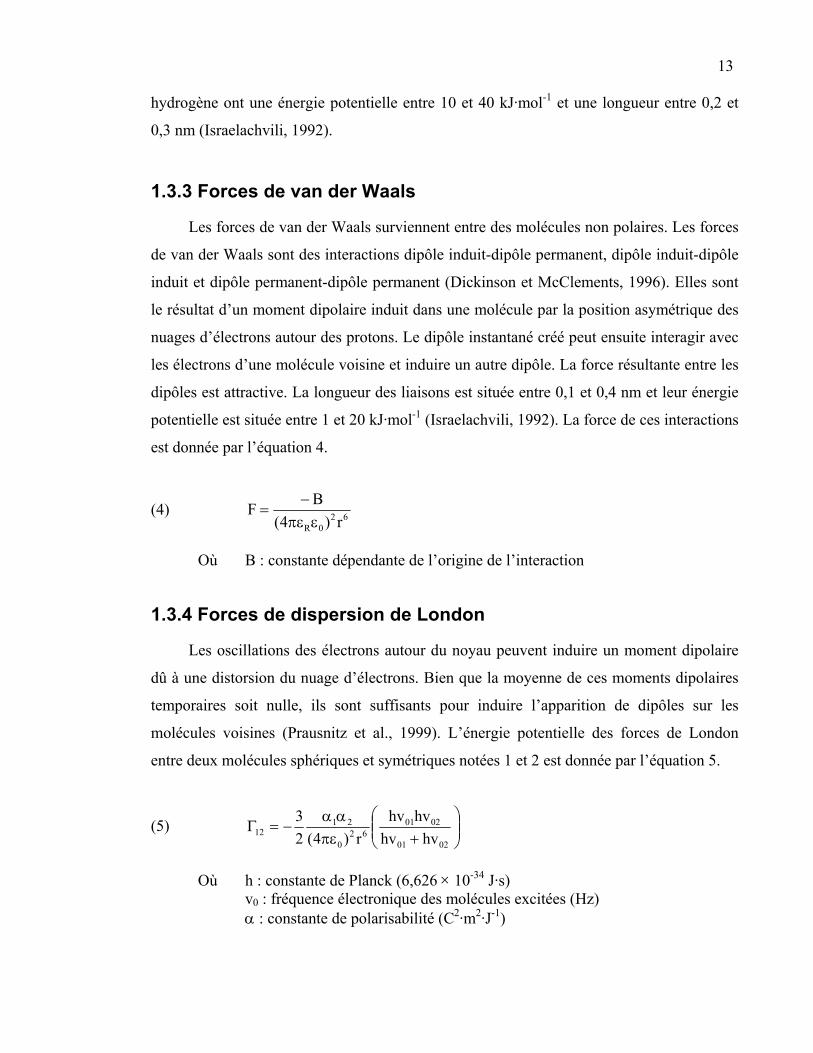
1.3.3 Forces de van der Waals
Les forces de van der Waals surviennent entre des molécules non polaires. Les forces
de van der Waals sont des interactions dipôle induit-dipôle permanent, dipôle induit-dipôle
induit et dipôle permanent-dipôle permanent (Dickinson et McClements, 1996). Elles sont
le résultat d’un moment dipolaire induit dans une molécule par la position asymétrique des
nuages d’électrons autour des protons. Le dipôle instantané créé peut ensuite interagir avec
les électrons d’une molécule voisine et induire un autre dipôle. La force résultante entre les
dipôles est attractive. La longueur des liaisons est située entre 0,1 et 0,4 nm et leur énergie
potentielle est située entre 1 et 20 kJ·mol-1 (Israelachvili, 1992). La force de ces interactions
est donnée par l’équation 4.
(4) 620R r)4(
BFεπε
−=
Où B : constante dépendante de l’origine de l’interaction
1.3.4 Forces de dispersion de London
Les oscillations des électrons autour du noyau peuvent induire un moment dipolaire
dû à une distorsion du nuage d’électrons. Bien que la moyenne de ces moments dipolaires
temporaires soit nulle, ils sont suffisants pour induire l’apparition de dipôles sur les
molécules voisines (Prausnitz et al., 1999). L’énergie potentielle des forces de London
entre deux molécules sphériques et symétriques notées 1 et 2 est donnée par l’équation 5.
(5) ⎟⎟⎠
⎞⎜⎜⎝
⎛+πε
αα−=Γ
0201
020162
0
2112 hvhv
hvhvr)4(2
3
Où h : constante de Planck (6,626 × 10-34 J·s) v0 : fréquence électronique des molécules excitées (Hz) α : constante de polarisabilité (C2·m2·J-1)
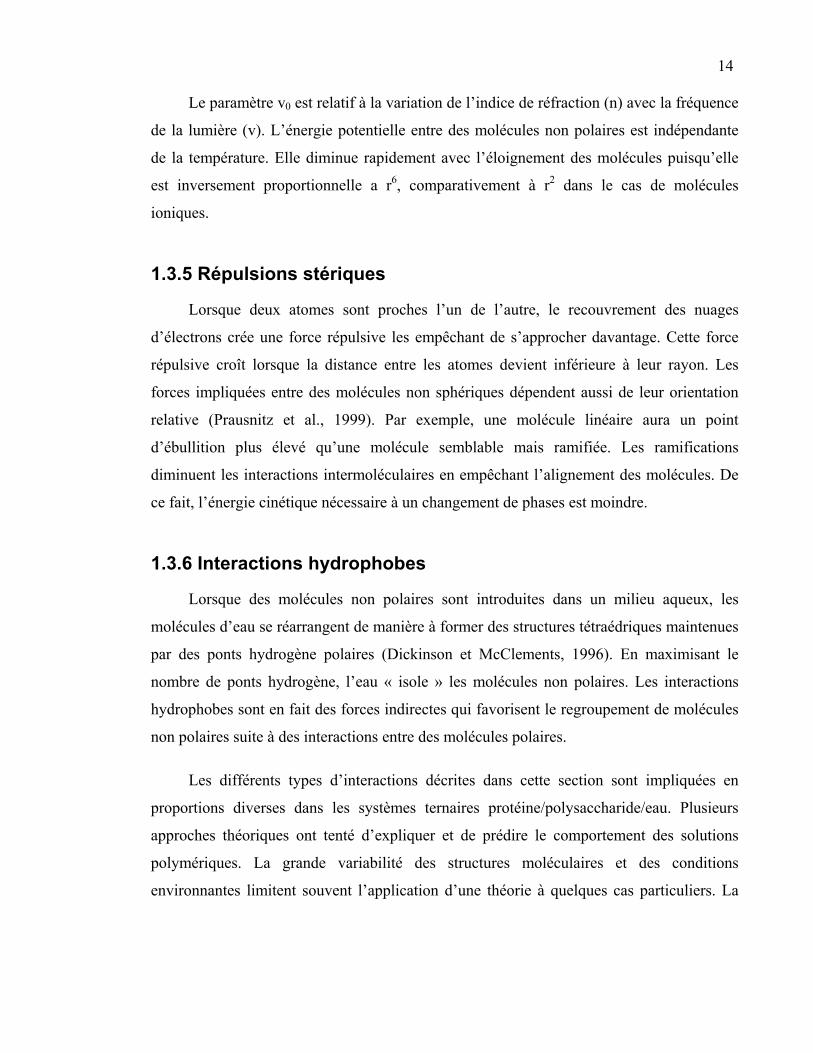
14
Le paramètre v0 est relatif à la variation de l’indice de réfraction (n) avec la fréquence
de la lumière (v). L’énergie potentielle entre des molécules non polaires est indépendante
de la température. Elle diminue rapidement avec l’éloignement des molécules puisqu’elle
est inversement proportionnelle a r6, comparativement à r2 dans le cas de molécules
ioniques.
1.3.5 Répulsions stériques
Lorsque deux atomes sont proches l’un de l’autre, le recouvrement des nuages
d’électrons crée une force répulsive les empêchant de s’approcher davantage. Cette force
répulsive croît lorsque la distance entre les atomes devient inférieure à leur rayon. Les
forces impliquées entre des molécules non sphériques dépendent aussi de leur orientation
relative (Prausnitz et al., 1999). Par exemple, une molécule linéaire aura un point
d’ébullition plus élevé qu’une molécule semblable mais ramifiée. Les ramifications
diminuent les interactions intermoléculaires en empêchant l’alignement des molécules. De
ce fait, l’énergie cinétique nécessaire à un changement de phases est moindre.
1.3.6 Interactions hydrophobes
Lorsque des molécules non polaires sont introduites dans un milieu aqueux, les
molécules d’eau se réarrangent de manière à former des structures tétraédriques maintenues
par des ponts hydrogène polaires (Dickinson et McClements, 1996). En maximisant le
nombre de ponts hydrogène, l’eau « isole » les molécules non polaires. Les interactions
hydrophobes sont en fait des forces indirectes qui favorisent le regroupement de molécules
non polaires suite à des interactions entre des molécules polaires.
Les différents types d’interactions décrites dans cette section sont impliquées en
proportions diverses dans les systèmes ternaires protéine/polysaccharide/eau. Plusieurs
approches théoriques ont tenté d’expliquer et de prédire le comportement des solutions
polymériques. La grande variabilité des structures moléculaires et des conditions
environnantes limitent souvent l’application d’une théorie à quelques cas particuliers. La
15 section suivante présente les théories générales à la base de la thermodynamique des
polymères en solution.
1.4 LES SOLUTIONS DE POLYMÈRES
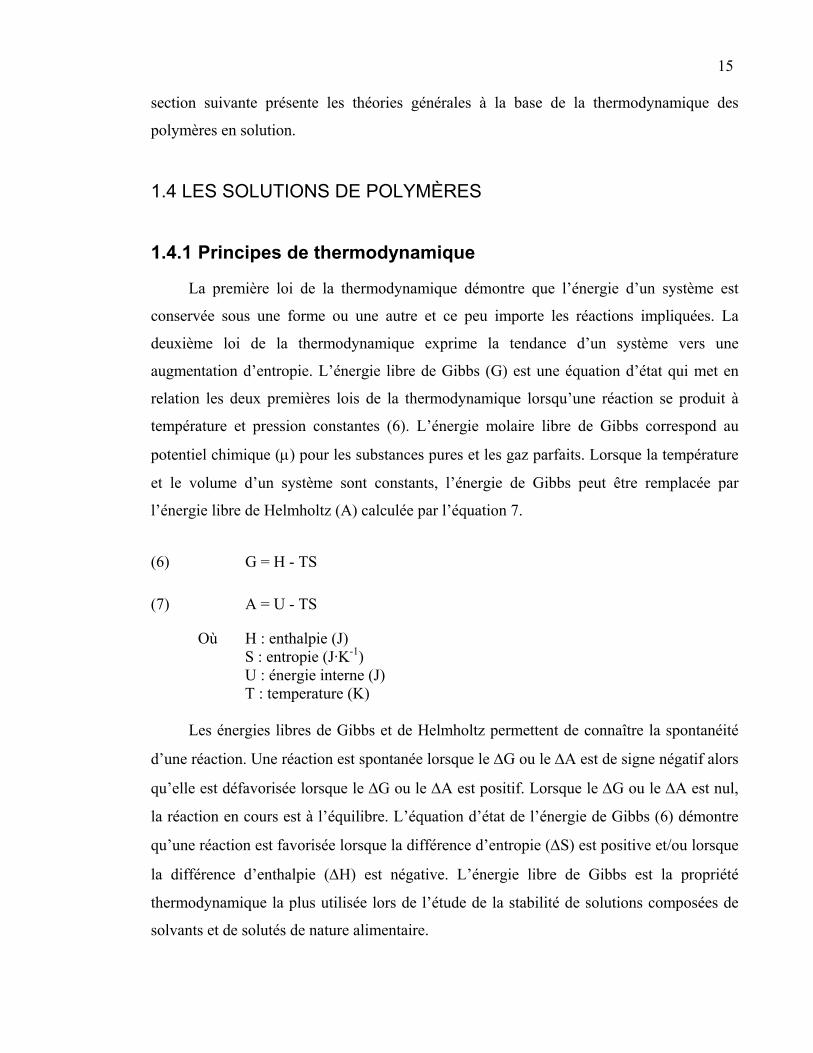
1.4.1 Principes de thermodynamique
La première loi de la thermodynamique démontre que l’énergie d’un système est
conservée sous une forme ou une autre et ce peu importe les réactions impliquées. La
deuxième loi de la thermodynamique exprime la tendance d’un système vers une
augmentation d’entropie. L’énergie libre de Gibbs (G) est une équation d’état qui met en
relation les deux premières lois de la thermodynamique lorsqu’une réaction se produit à
température et pression constantes (6). L’énergie molaire libre de Gibbs correspond au
potentiel chimique (µ) pour les substances pures et les gaz parfaits. Lorsque la température
et le volume d’un système sont constants, l’énergie de Gibbs peut être remplacée par
l’énergie libre de Helmholtz (A) calculée par l’équation 7.
(6) G = H - TS
(7) A = U - TS
Où H : enthalpie (J) S : entropie (J·K-1) U : énergie interne (J) T : temperature (K)
Les énergies libres de Gibbs et de Helmholtz permettent de connaître la spontanéité
d’une réaction. Une réaction est spontanée lorsque le ∆G ou le ∆A est de signe négatif alors
qu’elle est défavorisée lorsque le ∆G ou le ∆A est positif. Lorsque le ∆G ou le ∆A est nul,
la réaction en cours est à l’équilibre. L’équation d’état de l’énergie de Gibbs (6) démontre
qu’une réaction est favorisée lorsque la différence d’entropie (∆S) est positive et/ou lorsque
la différence d’enthalpie (∆H) est négative. L’énergie libre de Gibbs est la propriété
thermodynamique la plus utilisée lors de l’étude de la stabilité de solutions composées de
solvants et de solutés de nature alimentaire.
16
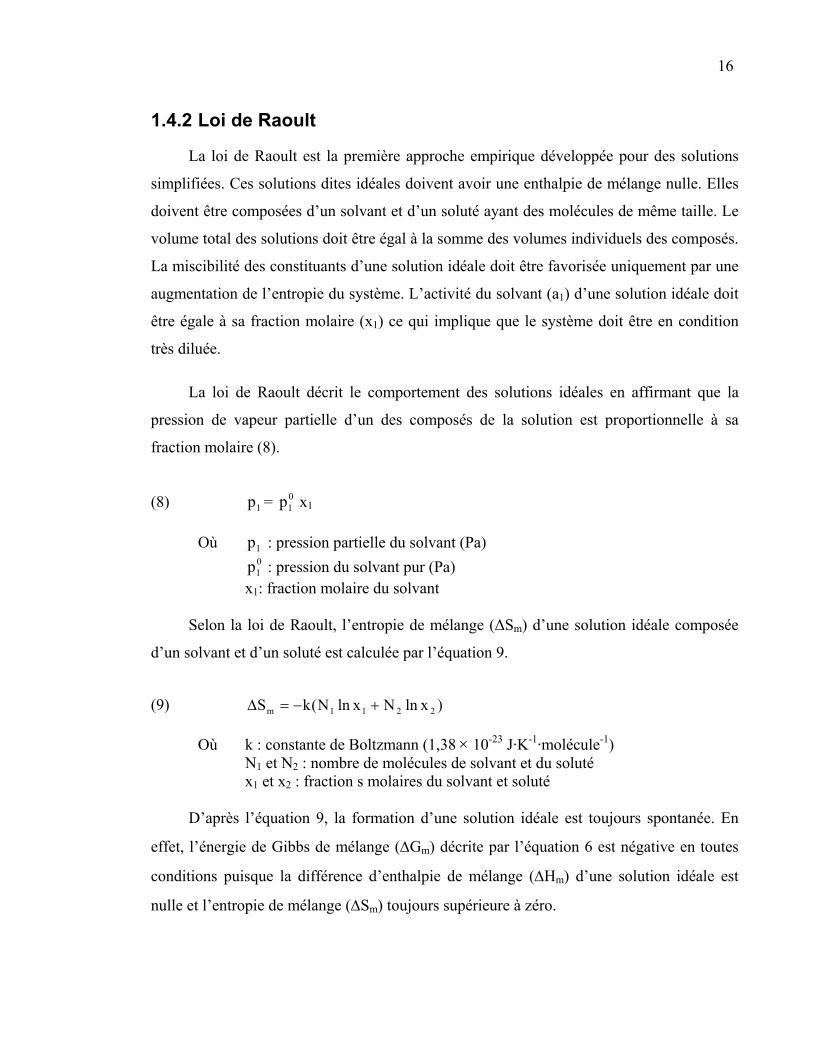
1.4.2 Loi de Raoult
La loi de Raoult est la première approche empirique développée pour des solutions
simplifiées. Ces solutions dites idéales doivent avoir une enthalpie de mélange nulle. Elles
doivent être composées d’un solvant et d’un soluté ayant des molécules de même taille. Le
volume total des solutions doit être égal à la somme des volumes individuels des composés.
La miscibilité des constituants d’une solution idéale doit être favorisée uniquement par une
augmentation de l’entropie du système. L’activité du solvant (a1) d’une solution idéale doit
être égale à sa fraction molaire (x1) ce qui implique que le système doit être en condition
très diluée.
La loi de Raoult décrit le comportement des solutions idéales en affirmant que la
pression de vapeur partielle d’un des composés de la solution est proportionnelle à sa
fraction molaire (8).
(8) = x1p 01p 1
Où : pression partielle du solvant (Pa) 1p01p : pression du solvant pur (Pa)
x1: fraction molaire du solvant
Selon la loi de Raoult, l’entropie de mélange (∆Sm) d’une solution idéale composée
d’un solvant et d’un soluté est calculée par l’équation 9.
(9) )xlnNxlnN(kS 2211m +−=∆
Où k : constante de Boltzmann (1,38 × 10⁻²³ J·K-1·molécule-1) N1 et N2 : nombre de molécules de solvant et du soluté x1 et x2 : fraction s molaires du solvant et soluté
D’après l’équation 9, la formation d’une solution idéale est toujours spontanée. En
effet, l’énergie de Gibbs de mélange (∆Gm) décrite par l’équation 6 est négative en toutes
conditions puisque la différence d’enthalpie de mélange (∆Hm) d’une solution idéale est
nulle et l’entropie de mélange (∆Sm) toujours supérieure à zéro.
17
Les solutions de polymères obéissent à la loi de Raoult de manière asymptotique et
seulement à des concentrations très faibles (Prausnitz et al., 1999). La loi de Raoult ne peut
décrire les solutions de polymères de par l’utilisation de la fraction molaire comme variable
de composition des solutions. La loi de Raoult prévoit que l’effet d’une macromolécule sur
le solvant sera le même que celui d’une molécule simple.
Les solutions de polymères s’écartent de l’idéalité pour plusieurs raisons.
Premièrement, les monomères ont des positions fixes et non aléatoires sur la chaîne de
polymère. Deuxièmement, les polymères évitent de s’interpénétrer dû à leurs chaînes plus
ou moins flexibles. Troisièmement, le ∆Hm d’une solution de polymère n’est pas toujours
nul (Prausnitz et al., 1999). Bien que peu applicable aux solutions réelles, la loi de Raoult
reste toutefois la référence de plusieurs modèles théoriques adaptés aux macromolécules.
1.4.3 Les théories matricielles
Les théories matricielles sont un ensemble de théories assumant que les liquides
adoptent une structure partiellement rigide (Barker, 1963). Selon ces théories, le
mouvement des molécules à l’état liquide n’est pas entièrement libre et aléatoire, mais
limité à une zone déterminée contenue dans une matrice. Ces théories expliquent les
sources de déviation des solutions réelles par rapport aux solutions idéales par une
enthalpie de mélange non nulle. Cette variation d’enthalpie lors du mélange des molécules
est due à la présence de forces attractives et répulsives entre les molécules d’espèces
différentes, lesquelles varient en intensité par rapport à celles observées entre les molécules
de même espèce. De plus, les entropies de mélanges s’écartent de l’idéalité en raison de la
différence entre les tailles des molécules. En effet le mélange de molécules de tailles
diverses entraîne une réorganisation différente de celle observée dans les solutions pures.
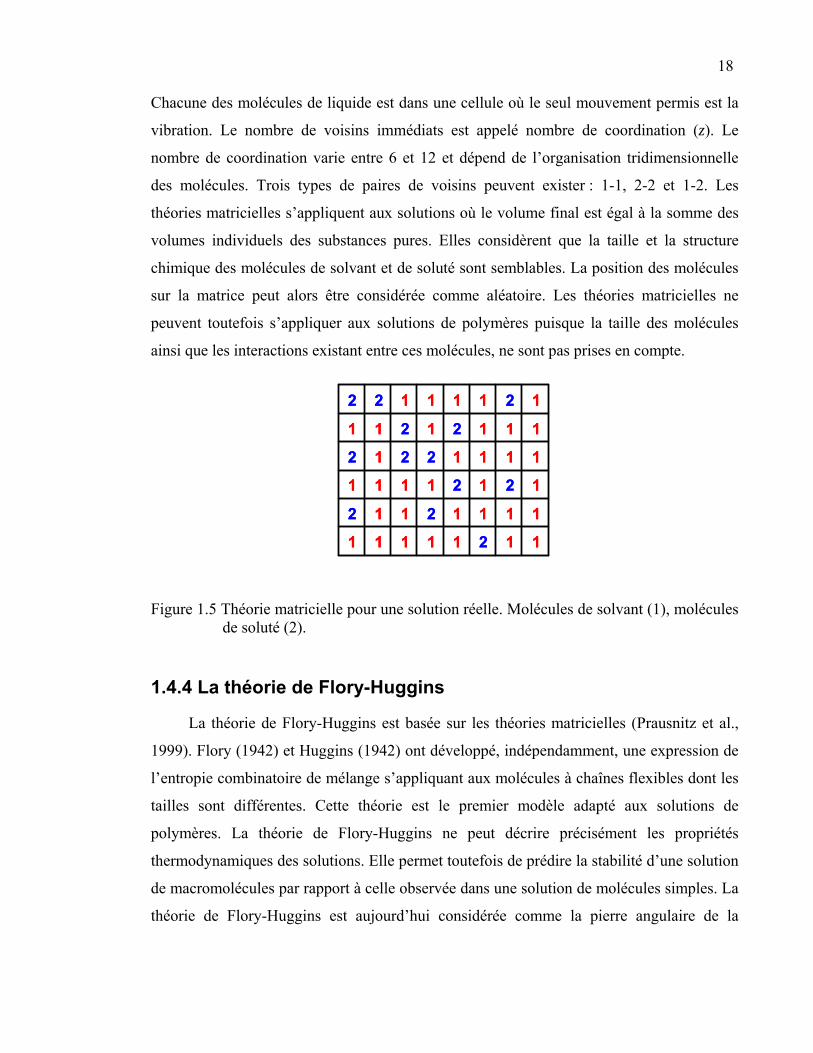
La théorie matricielle peut s’illustrer par le mélange d’un solvant (1) contenant N1
molécules et d’un soluté (2) contenant N2 molécules (Figure 1.5) (Prausnitz et al., 1999).
Les molécules 1 et 2 sont considérées sphériques, symétriques et de mêmes tailles. La
matrice est faite de « cellules » de mêmes dimensions (représentées par les cases),
également séparées et ne pouvant contenir qu’une molécule de solvant ou de soluté.
18
22
22
222
22
222
Chacune des molécules de liquide est dans une cellule où le seul mouvement permis est la
vibration. Le nombre de voisins immédiats est appelé nombre de coordination (z). Le
nombre de coordination varie entre 6 et 12 et dépend de l’organisation tridimensionnelle
des molécules. Trois types de paires de voisins peuvent exister : 1-1, 2-2 et 1-2. Les
théories matricielles s’appliquent aux solutions où le volume final est égal à la somme des
volumes individuels des substances pures. Elles considèrent que la taille et la structure
chimique des molécules de solvant et de soluté sont semblables. La position des molécules
sur la matrice peut alors être considérée comme aléatoire. Les théories matricielles ne
peuvent toutefois s’appliquer aux solutions de polymères puisque la taille des molécules
ainsi que les interactions existant entre ces molécules, ne sont pas prises en compte.
1111111
111111
111111
11111
111111
11111
2 1111111
111111
111111
11111
111111
11111
2
22
22
222
22
222
Figure 1.5 Théorie matricielle pour une solution réelle. Molécules de solvant (1), molécules de soluté (2).
1.4.4 La théorie de Flory-Huggins
La théorie de Flory-Huggins est basée sur les théories matricielles (Prausnitz et al.,
1999). Flory (1942) et Huggins (1942) ont développé, indépendamment, une expression de
l’entropie combinatoire de mélange s’appliquant aux molécules à chaînes flexibles dont les
tailles sont différentes. Cette théorie est le premier modèle adapté aux solutions de
polymères. La théorie de Flory-Huggins ne peut décrire précisément les propriétés
thermodynamiques des solutions. Elle permet toutefois de prédire la stabilité d’une solution
de macromolécules par rapport à celle observée dans une solution de molécules simples. La
théorie de Flory-Huggins est aujourd’hui considérée comme la pierre angulaire de la
19
2
2222
2
2222
thermodynamique des polymères en solution. Elle est à la base de plusieurs modèles
modernes spécifiques aux solutions macromoléculaires.
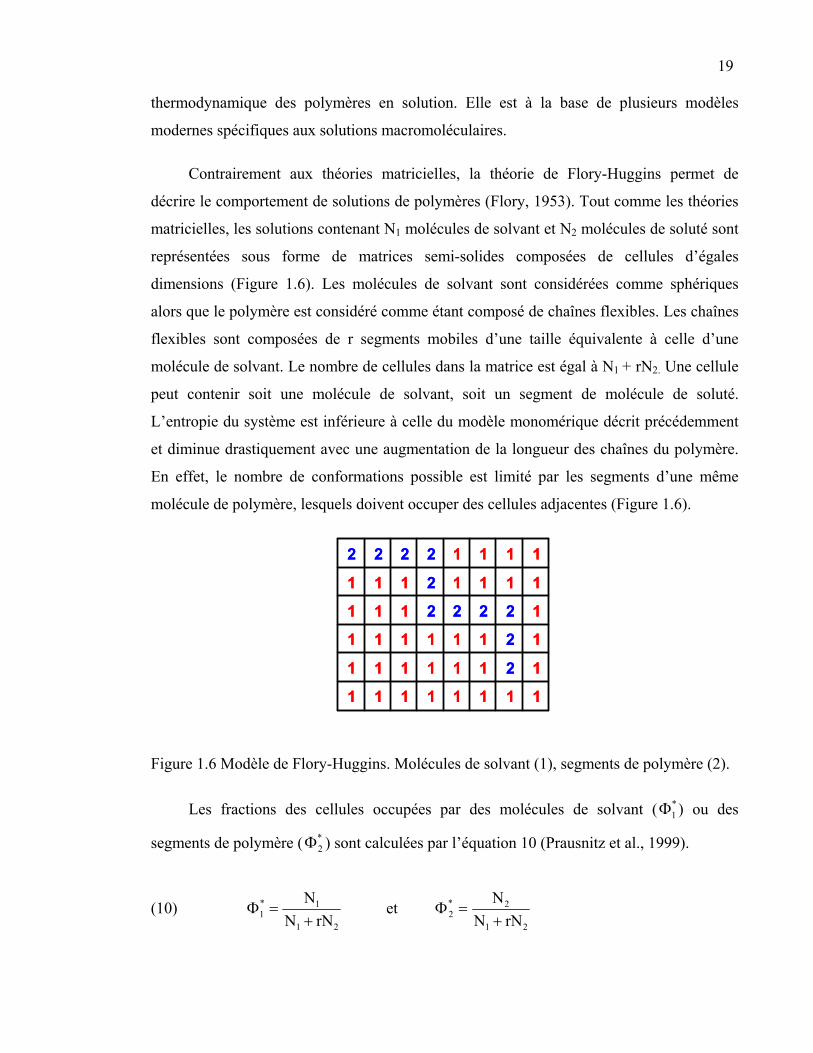
Contrairement aux théories matricielles, la théorie de Flory-Huggins permet de
décrire le comportement de solutions de polymères (Flory, 1953). Tout comme les théories
matricielles, les solutions contenant N1 molécules de solvant et N2 molécules de soluté sont
représentées sous forme de matrices semi-solides composées de cellules d’égales
dimensions (Figure 1.6). Les molécules de solvant sont considérées comme sphériques
alors que le polymère est considéré comme étant composé de chaînes flexibles. Les chaînes
flexibles sont composées de r segments mobiles d’une taille équivalente à celle d’une
molécule de solvant. Le nombre de cellules dans la matrice est égal à N1 + rN2. Une cellule
peut contenir soit une molécule de solvant, soit un segment de molécule de soluté.
L’entropie du système est inférieure à celle du modèle monomérique décrit précédemment
et diminue drastiquement avec une augmentation de la longueur des chaînes du polymère.
En effet, le nombre de conformations possible est limité par les segments d’une même
molécule de polymère, lesquels doivent occuper des cellules adjacentes (Figure 1.6).
11111111
1111111
1111111
1111
1111111
1111
2
11111111
1111111
1111111
1111
1111111
1111
2
2
2222
2
2222
Figure 1.6 Modèle de Flory-Huggins. Molécules de solvant (1), segments de polymère (2).
Les fractions des cellules occupées par des molécules de solvant ( ) ou des
segments de polymère ( ) sont calculées par l’équation 10 (Prausnitz et al., 1999).
*1Φ
*2Φ
(10) 21
1*1 rNN
N+
=Φ et 21
2*2 rNN
N+
=Φ
20
1.4.4.1 Enthalpie de mélange nulle
La théorie de base de Flory-Huggins considère que la formation d’une solution ne
demande ni ne dégage d’énergie (∆Hm=0). L’équation 6 décrivant l’énergie libre de Gibbs
peut donc être résolue uniquement par la mesure de l’entropie de mélange. L’énergie libre
de Gibbs et l’entropie combinatoire sont données par l’équation 11.
(11) A*22
*11
mm N)lnNlnN(RS
RTG
Φ+Φ−=∆
=∆
−
Bien que la théorie de Flory-Huggins tienne compte du rapport entre la taille du
polymère et la taille du solvant, elle néglige l’effet d’une différence de conformation des
molécules. Les entropies de molécules de mêmes poids moléculaires mais de structures
linéaire, ramifiée et hélicoïdale seront identiques (Prausnitz et al., 1999).
1.4.4.2 Enthalpie de mélange non nulle
Le terme χ, appelé paramètre de Flory-Huggins, a été introduit dans la théorie de base
afin de pouvoir l’appliquer aux solutions dont le ∆H de mélange n’est pas nul (Flory,
1953). C’est le signe du paramètre de Flory-Huggins χ qui permet de prédire si les
composés seront miscibles. L’enthalpie de mélange en excès est proportionnelle au volume
de la solution et au produit des fractions volumiques. L’énergie libre de Gibbs de mélange
est obtenue par l’équation 12.
(12) )rNN(lnNlnNRTN
G21
*2
*1
*22
*11
A
m +ΦΦχ+Φ+Φ=∆
Dans un système binaire, le paramètre de Flory-Huggins dépend des forces
impliquées entre le solvant et le polymère. En fait, ce paramètre permet de caractériser les
interactions solvant-solvant (χ11), segment-segment (χ22) et solvant-segment (χ12). Le
paramètre χ est calculé à l’aide de l’équation 13.
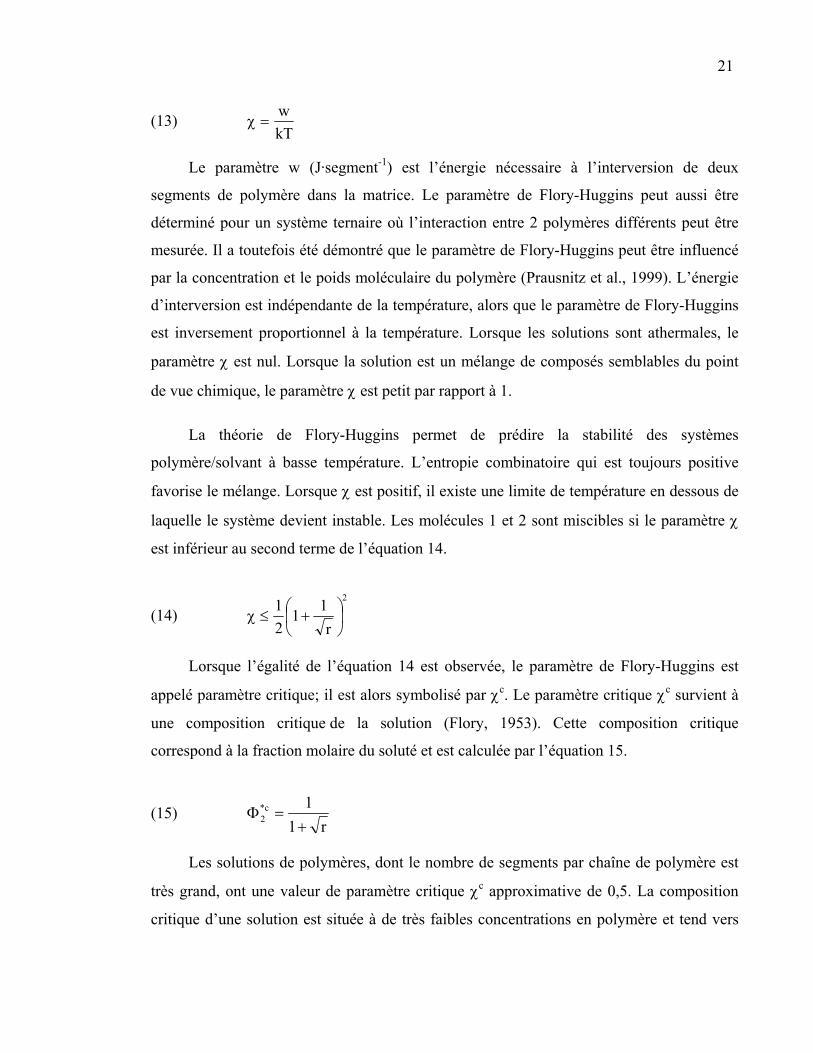
21
(13) kTw
=χ
Le paramètre w (J·segment-1) est l’énergie nécessaire à l’interversion de deux
segments de polymère dans la matrice. Le paramètre de Flory-Huggins peut aussi être
déterminé pour un système ternaire où l’interaction entre 2 polymères différents peut être
mesurée. Il a toutefois été démontré que le paramètre de Flory-Huggins peut être influencé
par la concentration et le poids moléculaire du polymère (Prausnitz et al., 1999). L’énergie
d’interversion est indépendante de la température, alors que le paramètre de Flory-Huggins
est inversement proportionnel à la température. Lorsque les solutions sont athermales, le
paramètre χ est nul. Lorsque la solution est un mélange de composés semblables du point
de vue chimique, le paramètre χ est petit par rapport à 1.
La théorie de Flory-Huggins permet de prédire la stabilité des systèmes
polymère/solvant à basse température. L’entropie combinatoire qui est toujours positive
favorise le mélange. Lorsque χ est positif, il existe une limite de température en dessous de
laquelle le système devient instable. Les molécules 1 et 2 sont miscibles si le paramètre χ
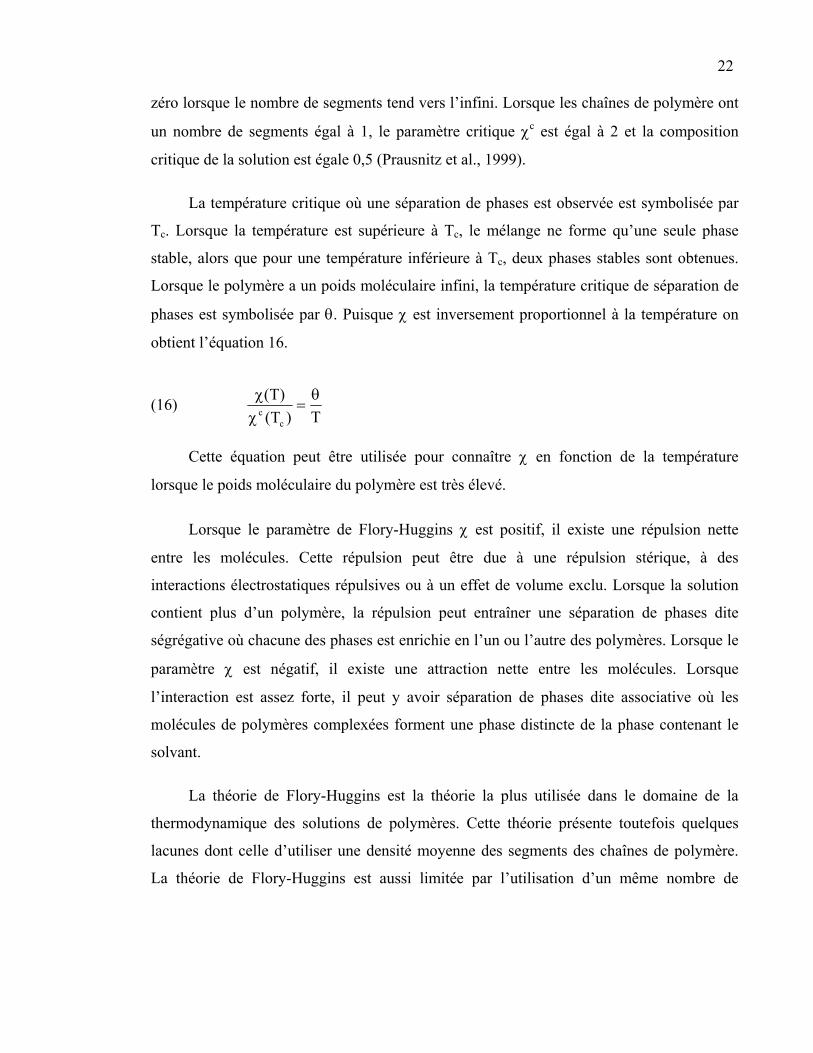
est inférieur au second terme de l’équation 14.
(14) 2
r11
21
⎟⎠
⎞⎜⎝
⎛ +≤χ
Lorsque l’égalité de l’équation 14 est observée, le paramètre de Flory-Huggins est
appelé paramètre critique; il est alors symbolisé par χc. Le paramètre critique χc survient à
une composition critique de la solution (Flory, 1953). Cette composition critique
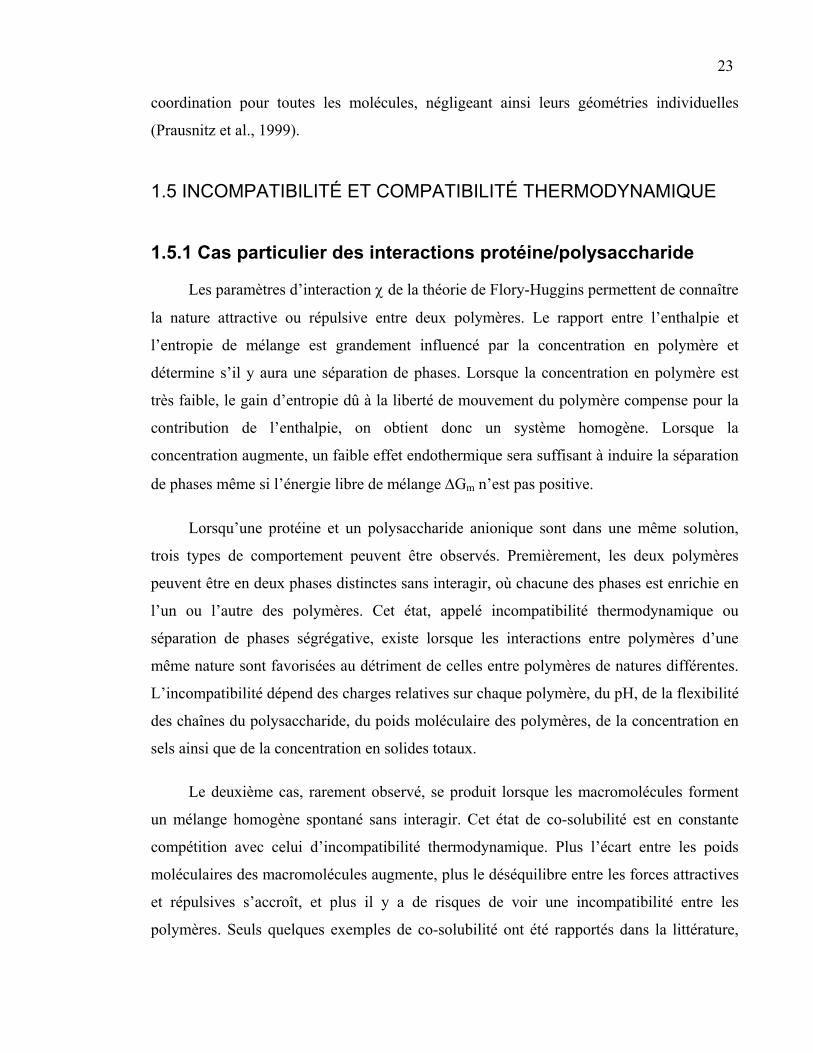
correspond à la fraction molaire du soluté et est calculée par l’équation 15.
(15) r1
1c*2 +=Φ
Les solutions de polymères, dont le nombre de segments par chaîne de polymère est
très grand, ont une valeur de paramètre critique χc approximative de 0,5. La composition
critique d’une solution est située à de très faibles concentrations en polymère et tend vers
22 zéro lorsque le nombre de segments tend vers l’infini. Lorsque les chaînes de polymère ont
un nombre de segments égal à 1, le paramètre critique χc est égal à 2 et la composition
critique de la solution est égale 0,5 (Prausnitz et al., 1999).
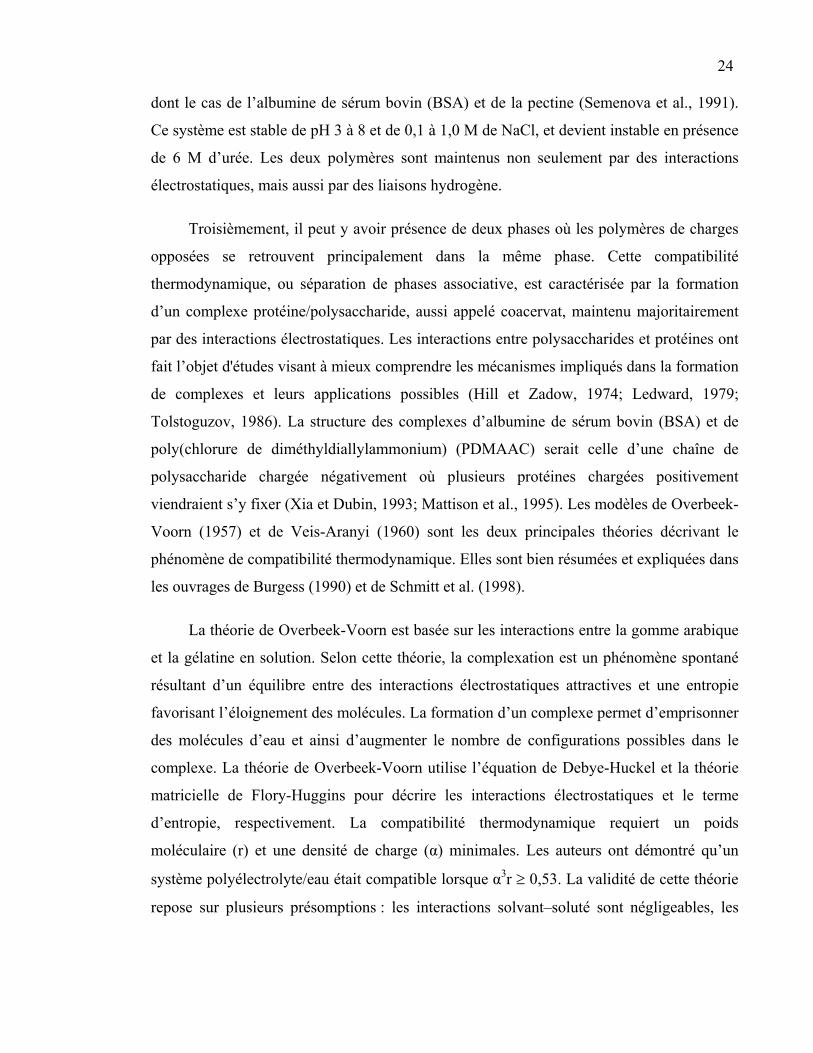
La température critique où une séparation de phases est observée est symbolisée par
Tc. Lorsque la température est supérieure à Tc, le mélange ne forme qu’une seule phase
stable, alors que pour une température inférieure à Tc, deux phases stables sont obtenues.
Lorsque le polymère a un poids moléculaire infini, la température critique de séparation de
phases est symbolisée par θ. Puisque χ est inversement proportionnel à la température on
obtient l’équation 16.
(16) T)T(
)T(
cc
θ=
χχ
Cette équation peut être utilisée pour connaître χ en fonction de la température
lorsque le poids moléculaire du polymère est très élevé.
Lorsque le paramètre de Flory-Huggins χ est positif, il existe une répulsion nette
entre les molécules. Cette répulsion peut être due à une répulsion stérique, à des
interactions électrostatiques répulsives ou à un effet de volume exclu. Lorsque la solution
contient plus d’un polymère, la répulsion peut entraîner une séparation de phases dite
ségrégative où chacune des phases est enrichie en l’un ou l’autre des polymères. Lorsque le
paramètre χ est négatif, il existe une attraction nette entre les molécules. Lorsque
l’interaction est assez forte, il peut y avoir séparation de phases dite associative où les
molécules de polymères complexées forment une phase distincte de la phase contenant le
solvant.
La théorie de Flory-Huggins est la théorie la plus utilisée dans le domaine de la
thermodynamique des solutions de polymères. Cette théorie présente toutefois quelques
lacunes dont celle d’utiliser une densité moyenne des segments des chaînes de polymère.
La théorie de Flory-Huggins est aussi limitée par l’utilisation d’un même nombre de
23 coordination pour toutes les molécules, négligeant ainsi leurs géométries individuelles
(Prausnitz et al., 1999).
1.5 INCOMPATIBILITÉ ET COMPATIBILITÉ THERMODYNAMIQUE
1.5.1 Cas particulier des interactions protéine/polysaccharide
Les paramètres d’interaction χ de la théorie de Flory-Huggins permettent de connaître
la nature attractive ou répulsive entre deux polymères. Le rapport entre l’enthalpie et
l’entropie de mélange est grandement influencé par la concentration en polymère et
détermine s’il y aura une séparation de phases. Lorsque la concentration en polymère est
très faible, le gain d’entropie dû à la liberté de mouvement du polymère compense pour la
contribution de l’enthalpie, on obtient donc un système homogène. Lorsque la
concentration augmente, un faible effet endothermique sera suffisant à induire la séparation
de phases même si l’énergie libre de mélange ∆Gm n’est pas positive.
Lorsqu’une protéine et un polysaccharide anionique sont dans une même solution,
trois types de comportement peuvent être observés. Premièrement, les deux polymères
peuvent être en deux phases distinctes sans interagir, où chacune des phases est enrichie en
l’un ou l’autre des polymères. Cet état, appelé incompatibilité thermodynamique ou
séparation de phases ségrégative, existe lorsque les interactions entre polymères d’une
même nature sont favorisées au détriment de celles entre polymères de natures différentes.
L’incompatibilité dépend des charges relatives sur chaque polymère, du pH, de la flexibilité
des chaînes du polysaccharide, du poids moléculaire des polymères, de la concentration en
sels ainsi que de la concentration en solides totaux.
Le deuxième cas, rarement observé, se produit lorsque les macromolécules forment
un mélange homogène spontané sans interagir. Cet état de co-solubilité est en constante
compétition avec celui d’incompatibilité thermodynamique. Plus l’écart entre les poids
moléculaires des macromolécules augmente, plus le déséquilibre entre les forces attractives
et répulsives s’accroît, et plus il y a de risques de voir une incompatibilité entre les
polymères. Seuls quelques exemples de co-solubilité ont été rapportés dans la littérature,
24 dont le cas de l’albumine de sérum bovin (BSA) et de la pectine (Semenova et al., 1991).
Ce système est stable de pH 3 à 8 et de 0,1 à 1,0 M de NaCl, et devient instable en présence
de 6 M d’urée. Les deux polymères sont maintenus non seulement par des interactions
électrostatiques, mais aussi par des liaisons hydrogène.
Troisièmement, il peut y avoir présence de deux phases où les polymères de charges
opposées se retrouvent principalement dans la même phase. Cette compatibilité
thermodynamique, ou séparation de phases associative, est caractérisée par la formation
d’un complexe protéine/polysaccharide, aussi appelé coacervat, maintenu majoritairement
par des interactions électrostatiques. Les interactions entre polysaccharides et protéines ont
fait l’objet d'études visant à mieux comprendre les mécanismes impliqués dans la formation
de complexes et leurs applications possibles (Hill et Zadow, 1974; Ledward, 1979;
Tolstoguzov, 1986). La structure des complexes d’albumine de sérum bovin (BSA) et de
poly(chlorure de diméthyldiallylammonium) (PDMAAC) serait celle d’une chaîne de
polysaccharide chargée négativement où plusieurs protéines chargées positivement
viendraient s’y fixer (Xia et Dubin, 1993; Mattison et al., 1995). Les modèles de Overbeek-
Voorn (1957) et de Veis-Aranyi (1960) sont les deux principales théories décrivant le
phénomène de compatibilité thermodynamique. Elles sont bien résumées et expliquées dans
les ouvrages de Burgess (1990) et de Schmitt et al. (1998).
La théorie de Overbeek-Voorn est basée sur les interactions entre la gomme arabique
et la gélatine en solution. Selon cette théorie, la complexation est un phénomène spontané
résultant d’un équilibre entre des interactions électrostatiques attractives et une entropie
favorisant l’éloignement des molécules. La formation d’un complexe permet d’emprisonner
des molécules d’eau et ainsi d’augmenter le nombre de configurations possibles dans le
complexe. La théorie de Overbeek-Voorn utilise l’équation de Debye-Huckel et la théorie
matricielle de Flory-Huggins pour décrire les interactions électrostatiques et le terme
d’entropie, respectivement. La compatibilité thermodynamique requiert un poids
moléculaire (r) et une densité de charge (α) minimales. Les auteurs ont démontré qu’un
système polyélectrolyte/eau était compatible lorsque α3r ≥ 0,53. La validité de cette théorie
repose sur plusieurs présomptions : les interactions solvant–soluté sont négligeables, les
25 charges sont distribuées uniformément dans la solution, les interactions entre les polymères
sont non spécifiques et les chaînes des polymères doivent adopter une structure enroulée au
hasard. La théorie de Nakajima-Sato (1972) reprend la théorie de Overbeek-Voorn en y
incluant un terme d’interaction de Huggins.
La théorie de Veis-Aranyi se base sur le cas d’une solution contenant deux gélatines
portant des charges de signes opposés, dont le comportement n’avait pu être décrit d’une
manière satisfaisante par la théorie de Overbeek-Voorn. Selon la théorie de Veis-Aranyi, la
complexation se produit en deux étapes. La première étape est caractérisée par la formation
spontanée d’agrégats intrapolymériques solubles sous l’action de forces électrostatiques
attractives. Un agrégat intrapolymérique est composé d’une macromolécule interagissant
avec une ou plusieurs molécules d’un ligand de taille inférieure. Ces agrégats moléculaires
occupent un volume semblable à celui occupé par la macromolécule. Ils sont maintenus par
des liens ioniques spécifiques ont une faible entropie de configuration. La complexation
proprement dite survient lors d’une deuxième étape qui peut durer jusqu’à quelques jours.
Cette étape est favorisée par un gain d’entropie lors de la dilution de la phase contenant les
agrégats solubles, lesquels se réorganisent aléatoirement dans une phase concentrée en
complexes interpolymériques insolubles. La théorie de Veis-Aranyi tient compte des
interactions soluté-solvant en incluant le paramètre χ12 de Flory-Huggins. Le terme
électrostatique utilisé dans la théorie de Overbeek-Voorn est remplacé par un terme tenant
compte de la densité de charge du polymère et de sa fraction volumique. Ce terme
représente la différence d’énergie libre lors du transfert d’un segment de chaîne, d’un
milieu dilué à un milieu concentré.
La théorie de Tainaka (1979) a été développée sur les bases de la théorie de Veis-
Aranyi. Elle est plus générale puisqu’elle n’est pas limitée aux systèmes à faible densité de
charges. Le paramètre de Flory-Huggins, qui est utilisé pour la phase diluée dans la théorie
de Veis-Aranyi, est maintenant aussi appliqué à la phase concentrée. Contrairement à la
théorie de Veis-Aranyi, les interactions impliquées lors de la formation des agrégats
solubles sont non spécifiques. La deuxième étape est caractérisée par la condensation de la
phase diluée contenant les agrégats pour former une phase concentrée en complexes. Les
26 agrégats solubles sont donc présents dans les deux phases. Selon Tainaka, la force
principale conduisant à la séparation de phases est de nature électrostatique attractive. La
formation d’un complexe est favorisée par le gain d’énergie électrostatique provenant d’une
augmentation de la densité ionique lorsque des zones chargées des agrégats sont à
proximité.
1.5.2 La formation de complexes
La formation de complexes entre une protéine et un polysaccharide est un cas
particulier des interactions macromoléculaires en solution. Les interactions impliquées
entre ces biopolymères peuvent être répulsives et non spécifiques et provenir de l’effet
d’interactions électrostatiques et/ou de volume exclu. Le volume exclu désigne la
diminution de l’espace occupé dans la solution par l’un et l’autre des polymères et ce,
lorsque les interactions entre les molécules de même nature sont favorisées au dépend des
interactions entre des molécules différentes. Les interactions attractives peuvent être faibles
ou fortes, spécifiques ou non spécifiques. Les liaisons covalentes sont spécifiques
contrairement aux liaisons ioniques, aux forces de van der Waals, aux interactions
hydrophobes et aux liaisons hydrogène. Il peut y avoir une interaction électrostatique entre
des macromolécules d’une charge nette de même signe par l’intermédiaire de zones portant
des charges de signe opposé (Xia et Dubin, 1994).
Bien que les interactions électrostatiques soient majoritaires lors de la formation des
complexes (van Oss, 1993; Samant et al., 1993), des forces d’autres natures sont impliquées
dans certains systèmes. Par exemple, la formation de complexes pectine/gélatine à un pH
supérieur au pI de la protéine et à une force ionique supérieure 0,2 pouvait s’expliquer
uniquement par la présence d’interactions électrostatiques. En fait, la présence d’une
température critique de miscibilité (20°C) du système gélatine/pectine a permis de détecter
la présence de liens hydrogène, favorisés à basse température (Chen et al., 1989). D’autre
part, le traitement thermique des complexes protéine/polysaccharide a permis d'améliorer
leur stabilité lors de variations de pH ou de force ionique, et cette amélioration a été
associée à des interactions hydrophobes (Chen et al., 1989). Les observations effectuées
27 dans le cadre de telles études restent à confirmer par la caractérisation des interactions
protéine/polysaccharide impliquées.
1.5.3 Facteurs influençant la nature des complexes
1.5.3.1 Charge des macromolécules
La formation de complexes est influencée majoritairement par la nature et la densité
des charges présentes sur les deux macromolécules. Une faible densité de charges inhibe la
formation des complexes, alors qu’une forte densité peut induire une précipitation ou une
gélification. La charge résiduelle nette influence la solubilité des complexes obtenus. Les
complexes sont solubles lorsque la charge d’une des macromolécules en excès permet
d’interagir avec le solvant. Les complexes sont insolubles lorsque les charges des
macromolécules sont égales et opposées; ils peuvent être solubilisés par un titrage acide,
effectué à faible force ionique (Xia et Dubin, 1994; Mattison et al., 1995; Tolstoguzov,
1997).
1.5.3.2 Le pH
Le pH agit sur la charge des complexes en influençant le degré d’ionisation des
groupes amines et carboxyliques. Une forte concentration en sels inhibe la formation de
complexes en créant un effet d’écran électrostatique. De même, une force ionique
insuffisante inhibe la complexation. En effet, la forte charge portée par les macromolécules
induit une modification de leur configuration de manière à favoriser la formation d’agrégats
et ce, au détriment des complexes (Singh et Burgess, 1989; Burgess, 1990). Le ratio
protéine/polysaccharide est un troisième facteur influençant la charge nette et les propriétés
du complexe obtenu. Ce ratio est le facteur ayant le plus d’influence sur la solubilité des
complexes.
28
1.5.3.3 Nature du polysaccharide
Les polysaccharides anioniques n’ont pas tous le même degré de compatibilité avec
les protéines. Les polysaccharides sulfatés se lient plus fortement à une protéine au dessus
de son point isoélectrique, que les polysaccharides carboxylés. Ceci s’explique par la force
de l’interaction entre les groupes OSO3- et NH3
+ qui permet la formation de complexes
même lorsque la protéine et le polysaccharide sont tous deux chargés négativement. Les
polysaccharides qui possèdent des groupes carboxylés ne complexent pas les protéines
globulaires à une force ionique supérieure à 0,2, ou encore à des valeurs de pH largement
supérieures au point isoélectrique des protéines. L’action de ces polysaccharides se
caractérise principalement par la diminution des interactions protéine/protéine.
1.5.3.4 Poids moléculaire
Lorsque les interactions électrostatiques entre protéine et polysaccharide sont très
fortes, l’effet du poids moléculaire du polysaccharide sur la quantité de protéines
complexées est négligeable (Morr et Ha, 1993). Lorsque ces interactions sont faibles, un
polysaccharide de poids moléculaire élevé complexe une plus grande quantité de protéines;
le plus grand espace occupé dans la solution favorise alors le contact avec la protéine
(Semenova, 1996). Les protéines d’un grand poids moléculaire ont tendance à former des
gels ou des précipités plutôt que des complexes. Les molécules de faible poids moléculaire
interagissent par appariement ionique, plutôt que par complexation, conduisant à la
formation d’agrégats moléculaires.
1.5.3.5 Influence du milieu sur la structure
La température influence la formation de complexes en favorisant les interactions
hydrophobes et covalentes à haute température et les liens hydrogène à basse température
(Stainsby, 1980). L’application d’une pression hydrostatique facilite aussi la formation de
complexes. En effet, ce traitement mène à la dénaturation partielle des protéines et permet
l'exposition de sites réactifs, initialement enfouis dans la molécule (Dickinson et
Pawlowski, 1996). Dans le cas des hautes pressions dynamiques, elles réduisent la taille des
29 complexes par l’action de forces de turbulence, de cavitation et de cisaillement (Le Hénaff,
1996). La durée d’un traitement de cisaillement influence également la taille des
complexes. Plus il est long, plus les probabilités de collisions augmentent et plus les
complexes auront une grande taille (Schmitt et al., 1998).
1.5.3.6 Méthode de fabrication
Les complexes ont des propriétés différentes selon le mode de fabrication. Les
complexes titrés « T » sont formés lorsque le mélange des solutions de protéine et
polysaccharide s’effectue à un pH où les molécules portent des charges nettes de même
signe suivi par une acidification lente (polysaccharide anionique). Les complexes mélangés
« M » sont obtenus en mélangeant les solutions de protéine et polysaccharide à pH acide,
où les deux molécules portent des charges nettes de signes opposés (Tolstoguzov, 1986).
Les complexes M sont moins solubles que les complexes T puisqu’ils sont formés
rapidement en limitant la structuration de la solution. La formation de complexes est un
phénomène réversible, les complexes M peuvent donc être solubilisés en titrant la solution
protéine/polysaccharide par une base.
1.5.4 Cinétique de la séparation de phases
La compatibilité et l’incompatibilité peuvent entraîner une séparation de phases dite
associative et ségrégative, respectivement. La cinétique de ces séparations de phases varie
selon les systèmes.
La décomposition spinodale est le mécanisme de séparation de phases des solutions
en zone instable du diagramme de phases. Une énergie libre négative entraîne une
déstabilisation spontanée du système, caractérisée par l’apparition d’un réseau biphasique
interconnecté (Figure 1.7A). La décomposition spinodale débute par une augmentation
rapide du nombre des domaines structuraux de même taille, dont l’interface devient mieux
définie. Par la suite, une fluctuation périodique de la composition entraîne une croissance
des domaines structuraux, dont la concentration n’a pas encore atteint l’équilibre (Sanchez
et al., 2002).
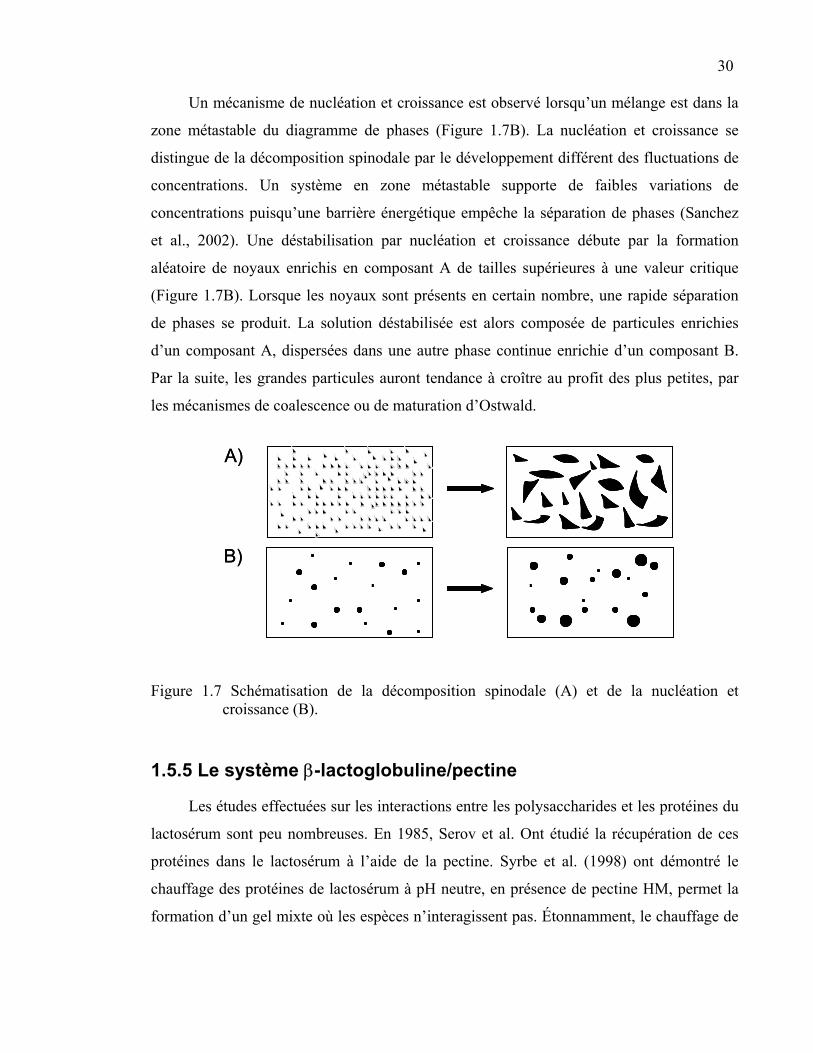
30
Un mécanisme de nucléation et croissance est observé lorsqu’un mélange est dans la
zone métastable du diagramme de phases (Figure 1.7B). La nucléation et croissance se
distingue de la décomposition spinodale par le développement différent des fluctuations de
concentrations. Un système en zone métastable supporte de faibles variations de
concentrations puisqu’une barrière énergétique empêche la séparation de phases (Sanchez
et al., 2002). Une déstabilisation par nucléation et croissance débute par la formation
aléatoire de noyaux enrichis en composant A de tailles supérieures à une valeur critique
(Figure 1.7B). Lorsque les noyaux sont présents en certain nombre, une rapide séparation
de phases se produit. La solution déstabilisée est alors composée de particules enrichies
d’un composant A, dispersées dans une autre phase continue enrichie d’un composant B.
Par la suite, les grandes particules auront tendance à croître au profit des plus petites, par
les mécanismes de coalescence ou de maturation d’Ostwald.
A)A)
B)B)
Figure 1.7 Schématisation de la décomposition spinodale (A) et de la nucléation et croissance (B).
1.5.5 Le système β-lactoglobuline/pectine
Les études effectuées sur les interactions entre les polysaccharides et les protéines du
lactosérum sont peu nombreuses. En 1985, Serov et al. Ont étudié la récupération de ces
protéines dans le lactosérum à l’aide de la pectine. Syrbe et al. (1998) ont démontré le
chauffage des protéines de lactosérum à pH neutre, en présence de pectine HM, permet la
formation d’un gel mixte où les espèces n’interagissent pas. Étonnamment, le chauffage de
31 la β-lg en présence de polypectate de sodium à pH 6,5 a plutôt induit la formation
d’agrégats protéiques de haut poids moléculaire (Ndi et al., 1996b). Un deuxième résultat
inattendu concerne la diminution de la complexation des protéines lors d’un chauffage à pH
3,5. Les auteurs attribuent ces phénomènes particuliers à la présence d’interactions
protéine/protéine et protéine/polysaccharide non caractérisées. Ndi et al. (1996a) ont
démontré que la présence de calcium influence les interactions entre les protéines de
lactosérum et la pectine LM. À pH 3,5, les ions calcium diminuent la quantité de complexes
formés en favorisant les interactions pectine/pectine alors qu’à pH 6,5, ils augmentent
l’homogénéité du gel formé en réduisant les forces de répulsion entre les deux polymères
en zone d’incompatibilité thermodynamique. D’autre part, Einhorn-Stoll et al. (1996) ont
observé une amélioration de la stabilité d'une émulsion contenant un concentré de protéines
de lactosérum en présence de pectine. Dans cette étude, la pectine LM, plus chargée, a
formé plus de complexes à l’interface huile/eau conférant ainsi une meilleure stabilité à
l’émulsion. Malgré l’intérêt suscité par les travaux portant sur le système β-lg/pectine,
aucune étude n’a porté sur la caractérisation des interactions impliquées en fonction de
différentes conditions de pH et de force ionique. Les travaux réalisés sur ce système ont
porté majoritairement sur des systèmes gélifiés.
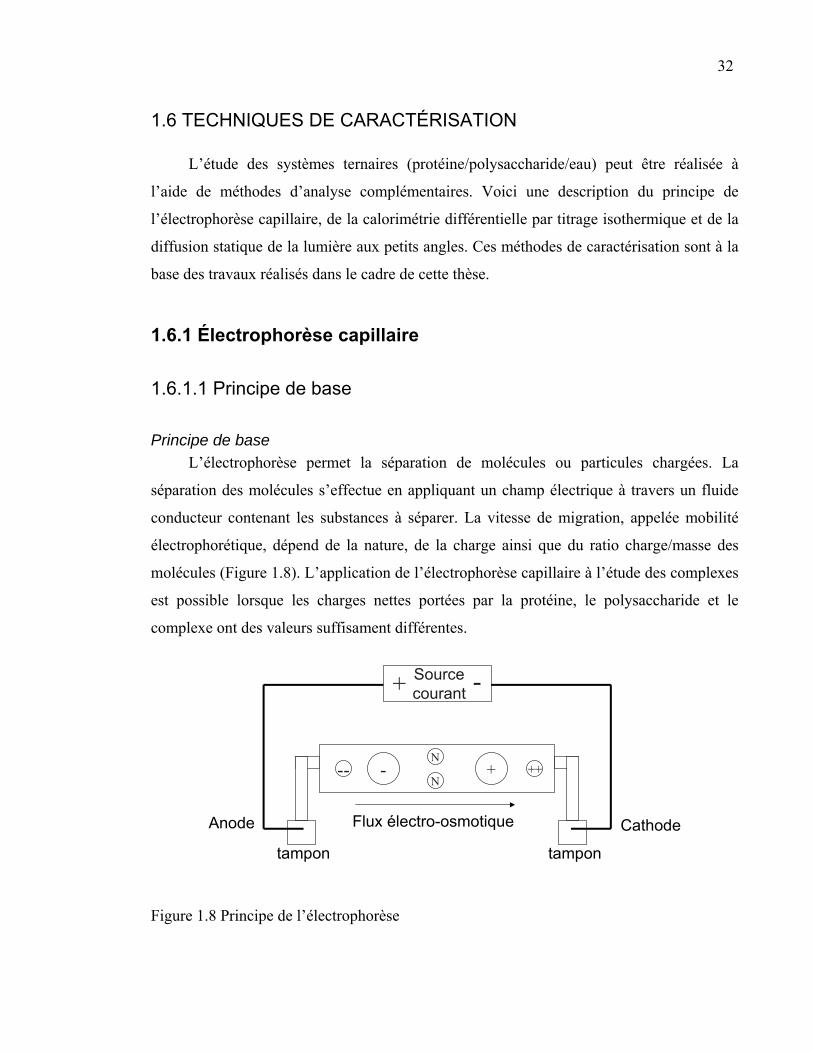
32
1.6 TECHNIQUES DE CARACTÉRISATION
L’étude des systèmes ternaires (protéine/polysaccharide/eau) peut être réalisée à
l’aide de méthodes d’analyse complémentaires. Voici une description du principe de
l’électrophorèse capillaire, de la calorimétrie différentielle par titrage isothermique et de la
diffusion statique de la lumière aux petits angles. Ces méthodes de caractérisation sont à la
base des travaux réalisés dans le cadre de cette thèse.
1.6.1 Électrophorèse capillaire
1.6.1.1 Principe de base
Principe de base L’électrophorèse permet la séparation de molécules ou particules chargées. La
séparation des molécules s’effectue en appliquant un champ électrique à travers un fluide
conducteur contenant les substances à séparer. La vitesse de migration, appelée mobilité
électrophorétique, dépend de la nature, de la charge ainsi que du ratio charge/masse des
molécules (Figure 1.8). L’application de l’électrophorèse capillaire à l’étude des complexes
est possible lorsque les charges nettes portées par la protéine, le polysaccharide et le
complexe ont des valeurs suffisament différentes.
tampon
CathodeAnode
tampon
Flux électro-osmotique
Sourcecourant -+
-- ++- +N
N
Figure 1.8 Principe de l’électrophorèse
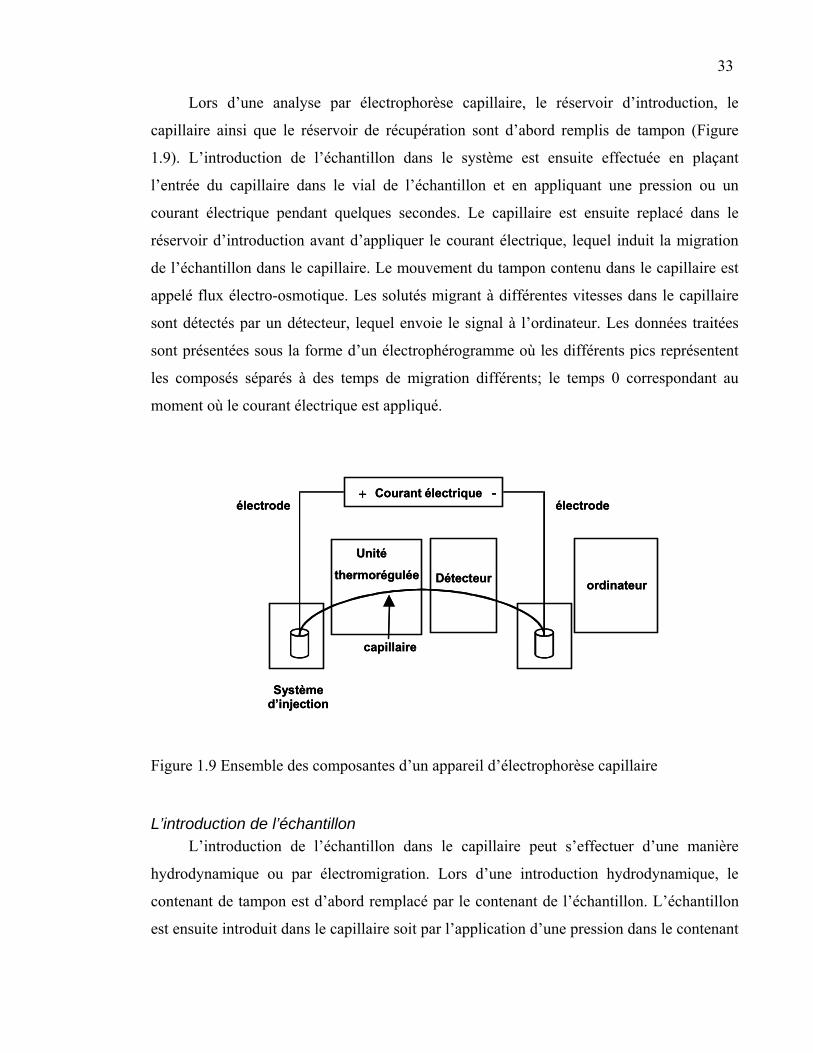
33
Lors d’une analyse par électrophorèse capillaire, le réservoir d’introduction, le
capillaire ainsi que le réservoir de récupération sont d’abord remplis de tampon (Figure
1.9). L’introduction de l’échantillon dans le système est ensuite effectuée en plaçant
l’entrée du capillaire dans le vial de l’échantillon et en appliquant une pression ou un
courant électrique pendant quelques secondes. Le capillaire est ensuite replacé dans le
réservoir d’introduction avant d’appliquer le courant électrique, lequel induit la migration
de l’échantillon dans le capillaire. Le mouvement du tampon contenu dans le capillaire est
appelé flux électro-osmotique. Les solutés migrant à différentes vitesses dans le capillaire
sont détectés par un détecteur, lequel envoie le signal à l’ordinateur. Les données traitées
sont présentées sous la forme d’un électrophérogramme où les différents pics représentent
les composés séparés à des temps de migration différents; le temps 0 correspondant au
moment où le courant électrique est appliqué.
Courant électriqueélectrode
Détecteur ordinateur
capillaire
Unité
thermorégulée
Systèmed’injection
+ -électrode
Courant électriqueélectrode
Détecteur ordinateur
capillaire
Unité
thermorégulée
Systèmed’injection
+ -électrode
Figure 1.9 Ensemble des composantes d’un appareil d’électrophorèse capillaire
L’introduction de l’échantillon L’introduction de l’échantillon dans le capillaire peut s’effectuer d’une manière
hydrodynamique ou par électromigration. Lors d’une introduction hydrodynamique, le
contenant de tampon est d’abord remplacé par le contenant de l’échantillon. L’échantillon
est ensuite introduit dans le capillaire soit par l’application d’une pression dans le contenant
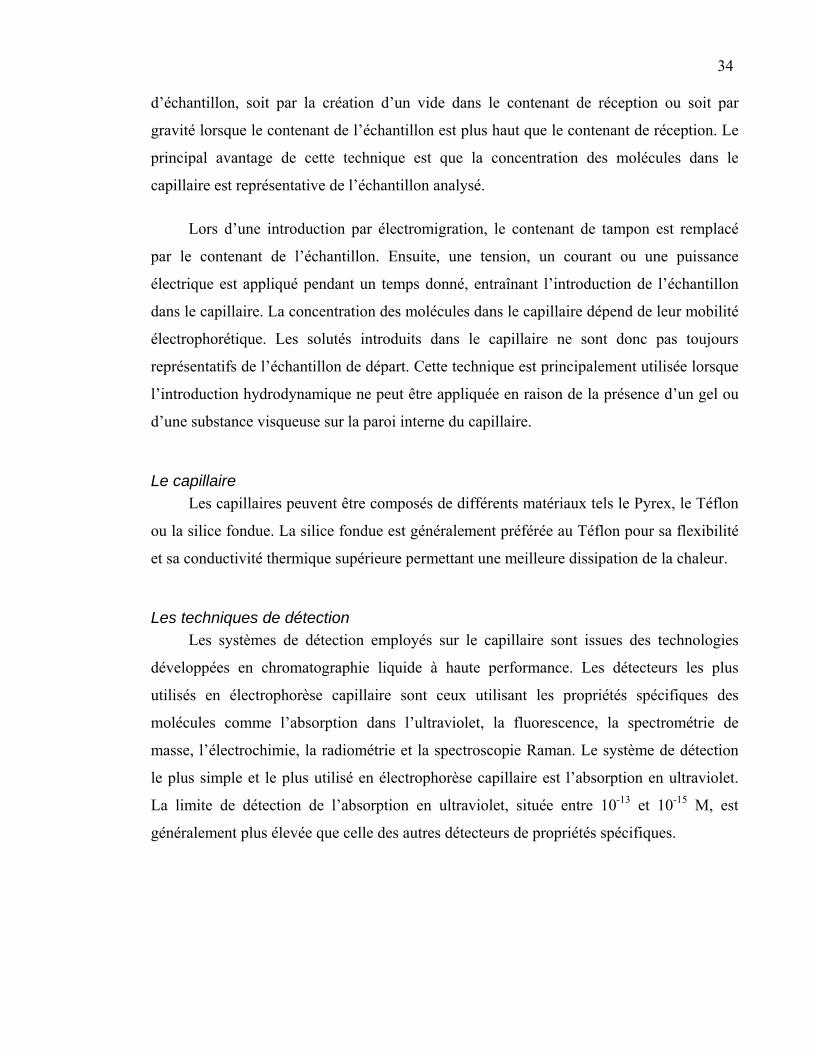
34 d’échantillon, soit par la création d’un vide dans le contenant de réception ou soit par
gravité lorsque le contenant de l’échantillon est plus haut que le contenant de réception. Le
principal avantage de cette technique est que la concentration des molécules dans le
capillaire est représentative de l’échantillon analysé.
Lors d’une introduction par électromigration, le contenant de tampon est remplacé
par le contenant de l’échantillon. Ensuite, une tension, un courant ou une puissance
électrique est appliqué pendant un temps donné, entraînant l’introduction de l’échantillon
dans le capillaire. La concentration des molécules dans le capillaire dépend de leur mobilité
électrophorétique. Les solutés introduits dans le capillaire ne sont donc pas toujours
représentatifs de l’échantillon de départ. Cette technique est principalement utilisée lorsque
l’introduction hydrodynamique ne peut être appliquée en raison de la présence d’un gel ou
d’une substance visqueuse sur la paroi interne du capillaire.
Le capillaire Les capillaires peuvent être composés de différents matériaux tels le Pyrex, le Téflon
ou la silice fondue. La silice fondue est généralement préférée au Téflon pour sa flexibilité
et sa conductivité thermique supérieure permettant une meilleure dissipation de la chaleur.
Les techniques de détection Les systèmes de détection employés sur le capillaire sont issues des technologies
développées en chromatographie liquide à haute performance. Les détecteurs les plus
utilisés en électrophorèse capillaire sont ceux utilisant les propriétés spécifiques des
molécules comme l’absorption dans l’ultraviolet, la fluorescence, la spectrométrie de
masse, l’électrochimie, la radiométrie et la spectroscopie Raman. Le système de détection
le plus simple et le plus utilisé en électrophorèse capillaire est l’absorption en ultraviolet.
La limite de détection de l’absorption en ultraviolet, située entre 10-13 et 10-15 M, est
généralement plus élevée que celle des autres détecteurs de propriétés spécifiques.
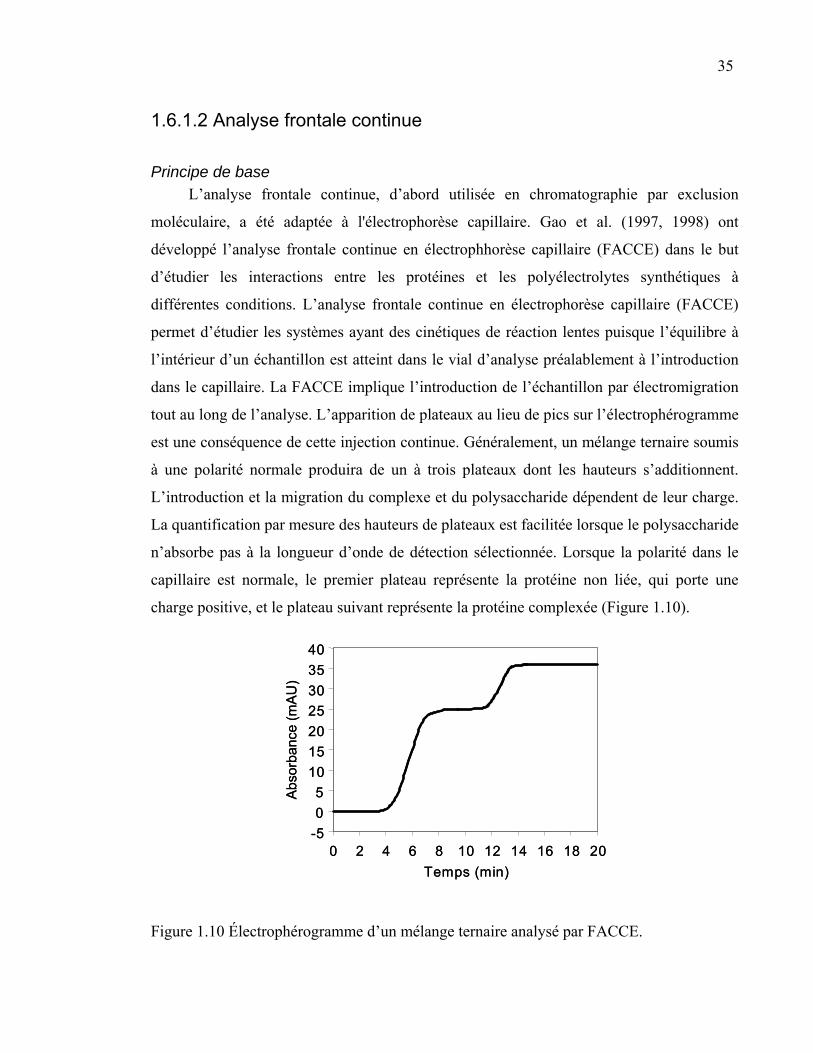
35
1.6.1.2 Analyse frontale continue
Principe de base L’analyse frontale continue, d’abord utilisée en chromatographie par exclusion
moléculaire, a été adaptée à l'électrophorèse capillaire. Gao et al. (1997, 1998) ont
développé l’analyse frontale continue en électrophhorèse capillaire (FACCE) dans le but
d’étudier les interactions entre les protéines et les polyélectrolytes synthétiques à
différentes conditions. L’analyse frontale continue en électrophorèse capillaire (FACCE)
permet d’étudier les systèmes ayant des cinétiques de réaction lentes puisque l’équilibre à
l’intérieur d’un échantillon est atteint dans le vial d’analyse préalablement à l’introduction
dans le capillaire. La FACCE implique l’introduction de l’échantillon par électromigration
tout au long de l’analyse. L’apparition de plateaux au lieu de pics sur l’électrophérogramme
est une conséquence de cette injection continue. Généralement, un mélange ternaire soumis
à une polarité normale produira de un à trois plateaux dont les hauteurs s’additionnent.
L’introduction et la migration du complexe et du polysaccharide dépendent de leur charge.
La quantification par mesure des hauteurs de plateaux est facilitée lorsque le polysaccharide
n’absorbe pas à la longueur d’onde de détection sélectionnée. Lorsque la polarité dans le
capillaire est normale, le premier plateau représente la protéine non liée, qui porte une
charge positive, et le plateau suivant représente la protéine complexée (Figure 1.10).
-505
10152025303540
0 2 4 6 8 10 12 14 16 18 20Temps (min)
Abso
rban
ce (m
AU)
-505
10152025303540
0 2 4 6 8 10 12 14 16 18 20Temps (min)
Abso
rban
ce (m
AU)
Figure 1.10 Électrophérogramme d’un mélange ternaire analysé par FACCE.
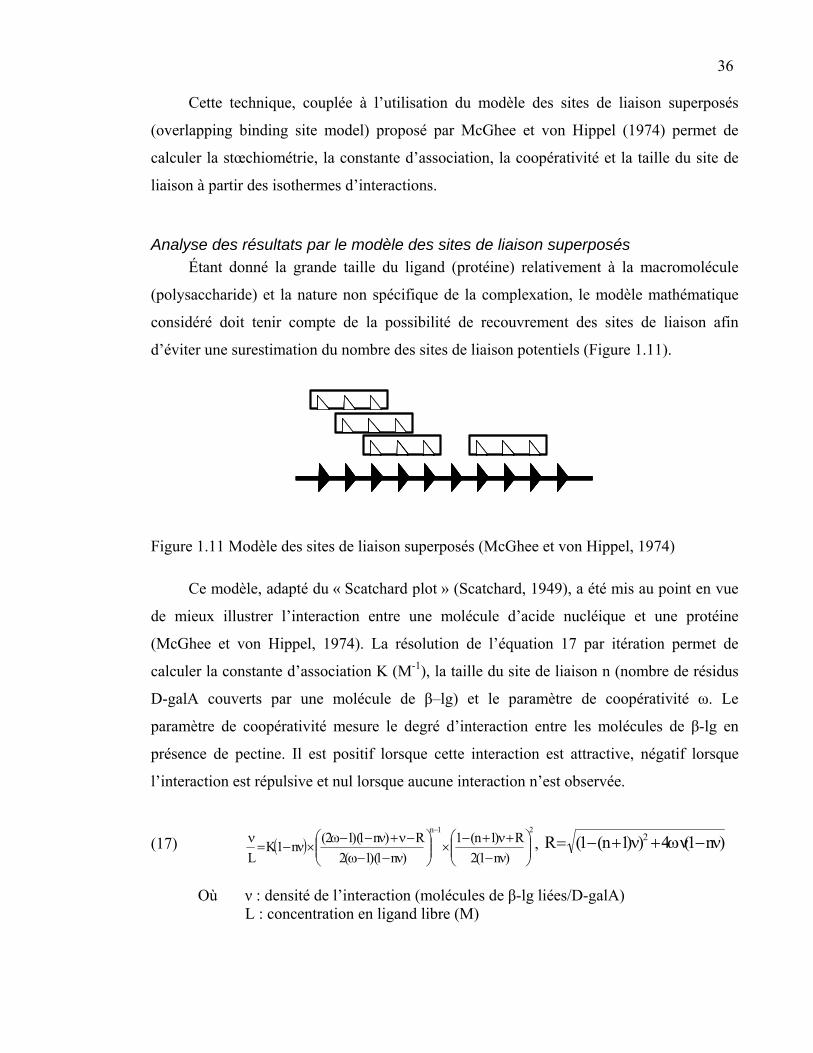
36
Cette technique, couplée à l’utilisation du modèle des sites de liaison superposés
(overlapping binding site model) proposé par McGhee et von Hippel (1974) permet de
calculer la stœchiométrie, la constante d’association, la coopérativité et la taille du site de
liaison à partir des isothermes d’interactions.
Analyse des résultats par le modèle des sites de liaison superposés Étant donné la grande taille du ligand (protéine) relativement à la macromolécule
(polysaccharide) et la nature non spécifique de la complexation, le modèle mathématique
considéré doit tenir compte de la possibilité de recouvrement des sites de liaison afin
d’éviter une surestimation du nombre des sites de liaison potentiels (Figure 1.11).
Figure 1.11 Modèle des sites de liaison superposés (McGhee et von Hippel, 1974)
Ce modèle, adapté du « Scatchard plot » (Scatchard, 1949), a été mis au point en vue
de mieux illustrer l’interaction entre une molécule d’acide nucléique et une protéine
(McGhee et von Hippel, 1974). La résolution de l’équation 17 par itération permet de
calculer la constante d’association K (M-1), la taille du site de liaison n (nombre de résidus
D-galA couverts par une molécule de β–lg) et le paramètre de coopérativité ω. Le
paramètre de coopérativité mesure le degré d’interaction entre les molécules de β-lg en
présence de pectine. Il est positif lorsque cette interaction est attractive, négatif lorsque
l’interaction est répulsive et nul lorsque aucune interaction n’est observée.
(17) ( )21n
)n1(2R)1n(1
)n1)(1(2R)n1)(12(n1K
L ⎟⎟⎠
⎞⎜⎜⎝
⎛ν−+ν+−
×⎟⎟⎠
⎞⎜⎜⎝
⎛ν−−ω−ν+ν−−ω
×ν−=ν
−
, )n1(4))1n(1(R 2 ν−ων+ν+−=
Où ν : densité de l’interaction (molécules de β-lg liées/D-galA) L : concentration en ligand libre (M)
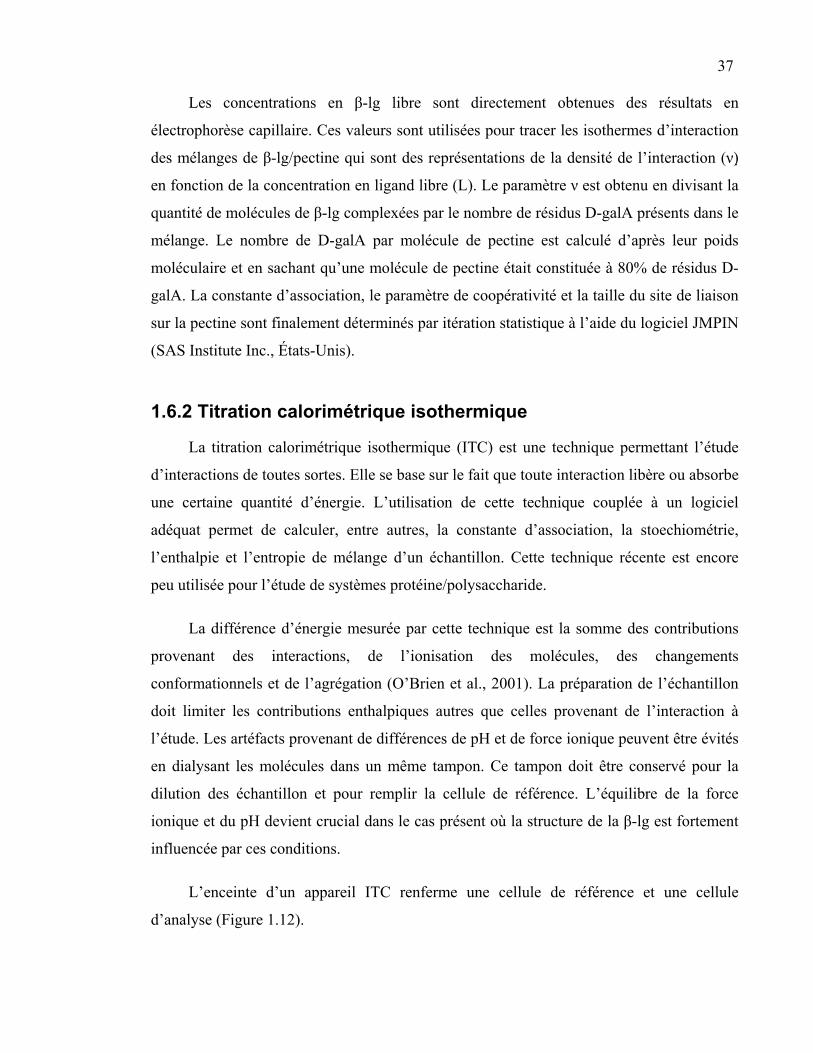
37
Les concentrations en β-lg libre sont directement obtenues des résultats en
électrophorèse capillaire. Ces valeurs sont utilisées pour tracer les isothermes d’interaction
des mélanges de β-lg/pectine qui sont des représentations de la densité de l’interaction (ν)
en fonction de la concentration en ligand libre (L). Le paramètre ν est obtenu en divisant la
quantité de molécules de β-lg complexées par le nombre de résidus D-galA présents dans le
mélange. Le nombre de D-galA par molécule de pectine est calculé d’après leur poids
moléculaire et en sachant qu’une molécule de pectine était constituée à 80% de résidus D-
galA. La constante d’association, le paramètre de coopérativité et la taille du site de liaison
sur la pectine sont finalement déterminés par itération statistique à l’aide du logiciel JMPIN
(SAS Institute Inc., États-Unis).
1.6.2 Titration calorimétrique isothermique
La titration calorimétrique isothermique (ITC) est une technique permettant l’étude
d’interactions de toutes sortes. Elle se base sur le fait que toute interaction libère ou absorbe
une certaine quantité d’énergie. L’utilisation de cette technique couplée à un logiciel
adéquat permet de calculer, entre autres, la constante d’association, la stoechiométrie,
l’enthalpie et l’entropie de mélange d’un échantillon. Cette technique récente est encore
peu utilisée pour l’étude de systèmes protéine/polysaccharide.
La différence d’énergie mesurée par cette technique est la somme des contributions
provenant des interactions, de l’ionisation des molécules, des changements
conformationnels et de l’agrégation (O’Brien et al., 2001). La préparation de l’échantillon
doit limiter les contributions enthalpiques autres que celles provenant de l’interaction à
l’étude. Les artéfacts provenant de différences de pH et de force ionique peuvent être évités
en dialysant les molécules dans un même tampon. Ce tampon doit être conservé pour la
dilution des échantillon et pour remplir la cellule de référence. L’équilibre de la force
ionique et du pH devient crucial dans le cas présent où la structure de la β-lg est fortement
influencée par ces conditions.
L’enceinte d’un appareil ITC renferme une cellule de référence et une cellule
d’analyse (Figure 1.12).
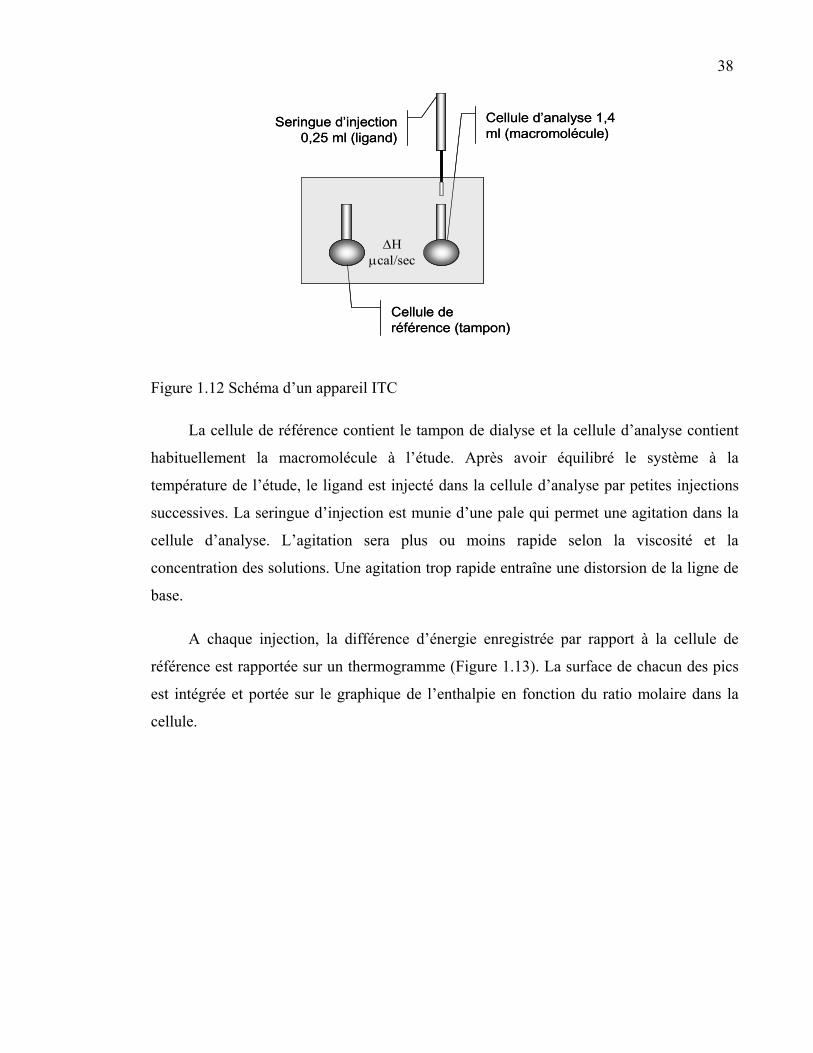
38
∆Hµcal/sec
Seringue d’injection 0,25 ml (ligand)
Cellule d’analyse 1,4 ml (macromolécule)
Cellule de référence (tampon)
∆Hµcal/sec
Seringue d’injection 0,25 ml (ligand)
Cellule d’analyse 1,4 ml (macromolécule)
Cellule de référence (tampon)
Figure 1.12 Schéma d’un appareil ITC
La cellule de référence contient le tampon de dialyse et la cellule d’analyse contient
habituellement la macromolécule à l’étude. Après avoir équilibré le système à la
température de l’étude, le ligand est injecté dans la cellule d’analyse par petites injections
successives. La seringue d’injection est munie d’une pale qui permet une agitation dans la
cellule d’analyse. L’agitation sera plus ou moins rapide selon la viscosité et la
concentration des solutions. Une agitation trop rapide entraîne une distorsion de la ligne de
base.
A chaque injection, la différence d’énergie enregistrée par rapport à la cellule de
référence est rapportée sur un thermogramme (Figure 1.13). La surface de chacun des pics
est intégrée et portée sur le graphique de l’enthalpie en fonction du ratio molaire dans la
cellule.
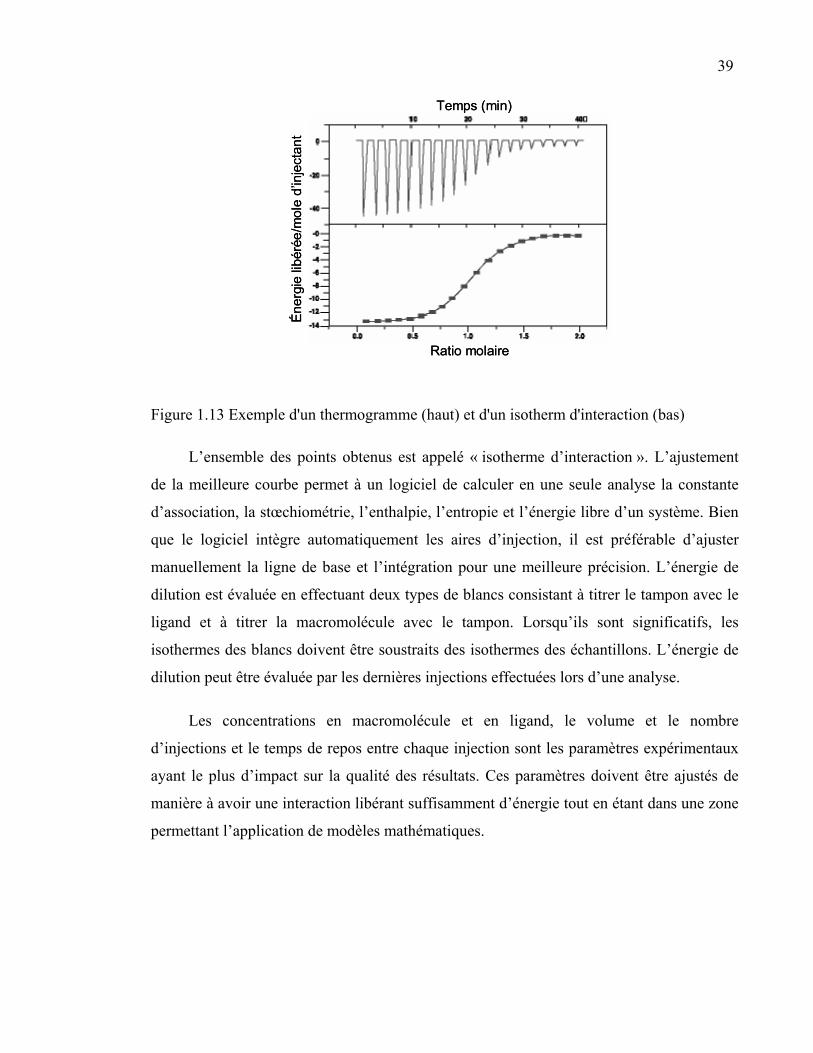
39
Ratio molaire
Éner
gie
libér
ée/m
ole
d’in
ject
ant
Temps (min)
Ratio molaire
Éner
gie
libér
ée/m
ole
d’in
ject
ant
Temps (min)
Figure 1.13 Exemple d'un thermogramme (haut) et d'un isotherm d'interaction (bas)
L’ensemble des points obtenus est appelé « isotherme d’interaction ». L’ajustement
de la meilleure courbe permet à un logiciel de calculer en une seule analyse la constante
d’association, la stœchiométrie, l’enthalpie, l’entropie et l’énergie libre d’un système. Bien
que le logiciel intègre automatiquement les aires d’injection, il est préférable d’ajuster
manuellement la ligne de base et l’intégration pour une meilleure précision. L’énergie de
dilution est évaluée en effectuant deux types de blancs consistant à titrer le tampon avec le
ligand et à titrer la macromolécule avec le tampon. Lorsqu’ils sont significatifs, les
isothermes des blancs doivent être soustraits des isothermes des échantillons. L’énergie de
dilution peut être évaluée par les dernières injections effectuées lors d’une analyse.
Les concentrations en macromolécule et en ligand, le volume et le nombre
d’injections et le temps de repos entre chaque injection sont les paramètres expérimentaux
ayant le plus d’impact sur la qualité des résultats. Ces paramètres doivent être ajustés de
manière à avoir une interaction libérant suffisamment d’énergie tout en étant dans une zone
permettant l’application de modèles mathématiques.
40
L’étendue de cette zone de validité est déterminée par la valeur sans unité « c »
(Wiseman et al., 1989). La valeur c est calculée par l’équation 18.
(18) NMKc tot ××=
Où K : constante d’association (M-1) N : paramètre stoechiométrique de l’interaction Mtot : concentration de la macromolécule dans la cellule d’analyse (M)
Plus la valeur c est grande, plus la courbe de l’isotherme aura une amplitude qui se
rapproche du ∆H de la réaction (Figure 1.14).
Éne
rgie
libé
rée/
mol
e d’
inje
ctan
t
Ratio molaire
C = 500
C = 40
C = 4
0 N 2N
∆H réaction
Éne
rgie
libé
rée/
mol
e d’
inje
ctan
t
Ratio molaire
C = 500
C = 40
C = 4
0 N 2N
∆H réaction
Figure 1.14 Isothermes d'interactions en fonction de la valeur c.
La valeur de c doit être située entre 1 et 1000 et de préférence entre 10 et 100.
Lorsque la valeur c est supérieure à 10, la concentration finale du ligand dans la cellule doit
être environ 1,5 fois celle de la macromolécule. Lorsque la valeur c est inférieure à 10, la
concentration finale dans la cellule doit être de 2 à 2,5 fois celle de la macromolécule.
Lorsque la constante d’association et la stoechiométrie d’un système sont inconnues, la
concentration en macromolécule est choisie de manière à ce qu’une chaleur minimale de 3
à 5 µcal soit dégagée lors de l’injection. La concentration en ligand dans la seringue est
généralement de 7 à 20 fois celle de la macromolécule dans la cellule. L’énergie libérée ou
absorbée en fin d’analyse doit être nulle où du moins tendre vers zéro indiquant la
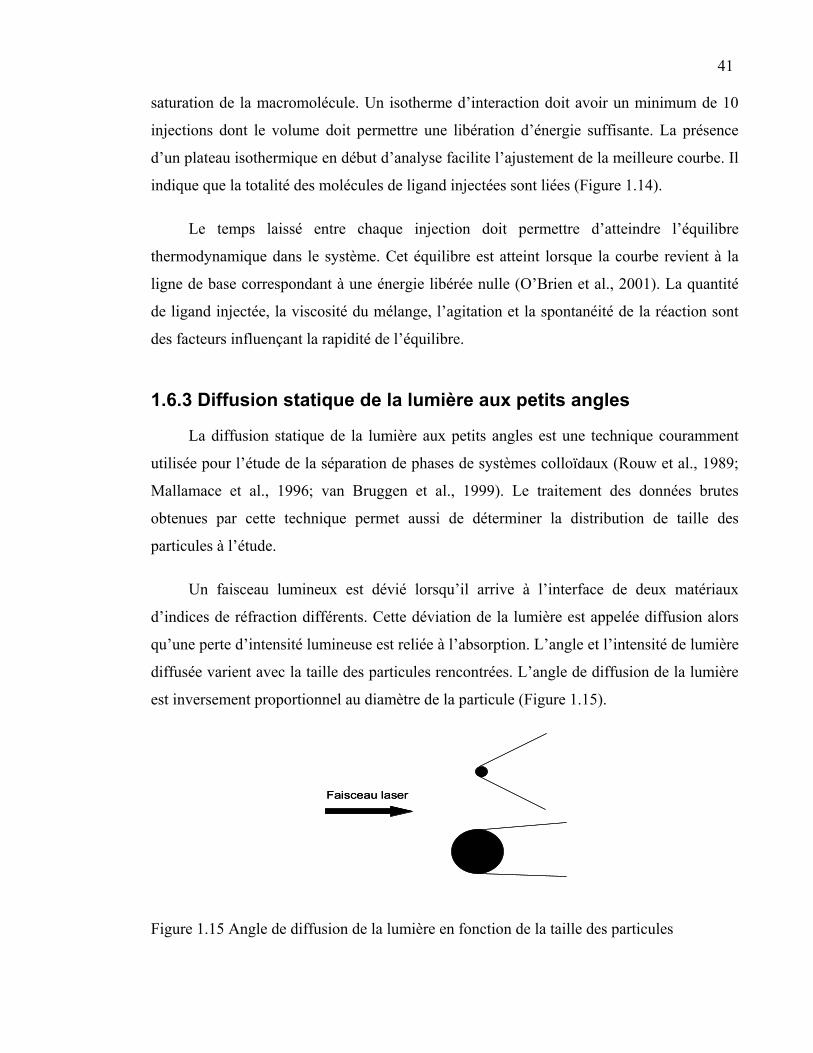
41 saturation de la macromolécule. Un isotherme d’interaction doit avoir un minimum de 10
injections dont le volume doit permettre une libération d’énergie suffisante. La présence
d’un plateau isothermique en début d’analyse facilite l’ajustement de la meilleure courbe. Il
indique que la totalité des molécules de ligand injectées sont liées (Figure 1.14).
Le temps laissé entre chaque injection doit permettre d’atteindre l’équilibre
thermodynamique dans le système. Cet équilibre est atteint lorsque la courbe revient à la
ligne de base correspondant à une énergie libérée nulle (O’Brien et al., 2001). La quantité
de ligand injectée, la viscosité du mélange, l’agitation et la spontanéité de la réaction sont
des facteurs influençant la rapidité de l’équilibre.
1.6.3 Diffusion statique de la lumière aux petits angles
La diffusion statique de la lumière aux petits angles est une technique couramment
utilisée pour l’étude de la séparation de phases de systèmes colloïdaux (Rouw et al., 1989;
Mallamace et al., 1996; van Bruggen et al., 1999). Le traitement des données brutes
obtenues par cette technique permet aussi de déterminer la distribution de taille des
particules à l’étude.
Un faisceau lumineux est dévié lorsqu’il arrive à l’interface de deux matériaux
d’indices de réfraction différents. Cette déviation de la lumière est appelée diffusion alors
qu’une perte d’intensité lumineuse est reliée à l’absorption. L’angle et l’intensité de lumière
diffusée varient avec la taille des particules rencontrées. L’angle de diffusion de la lumière
est inversement proportionnel au diamètre de la particule (Figure 1.15).
Faisceau laserFaisceau laser
Figure 1.15 Angle de diffusion de la lumière en fonction de la taille des particules
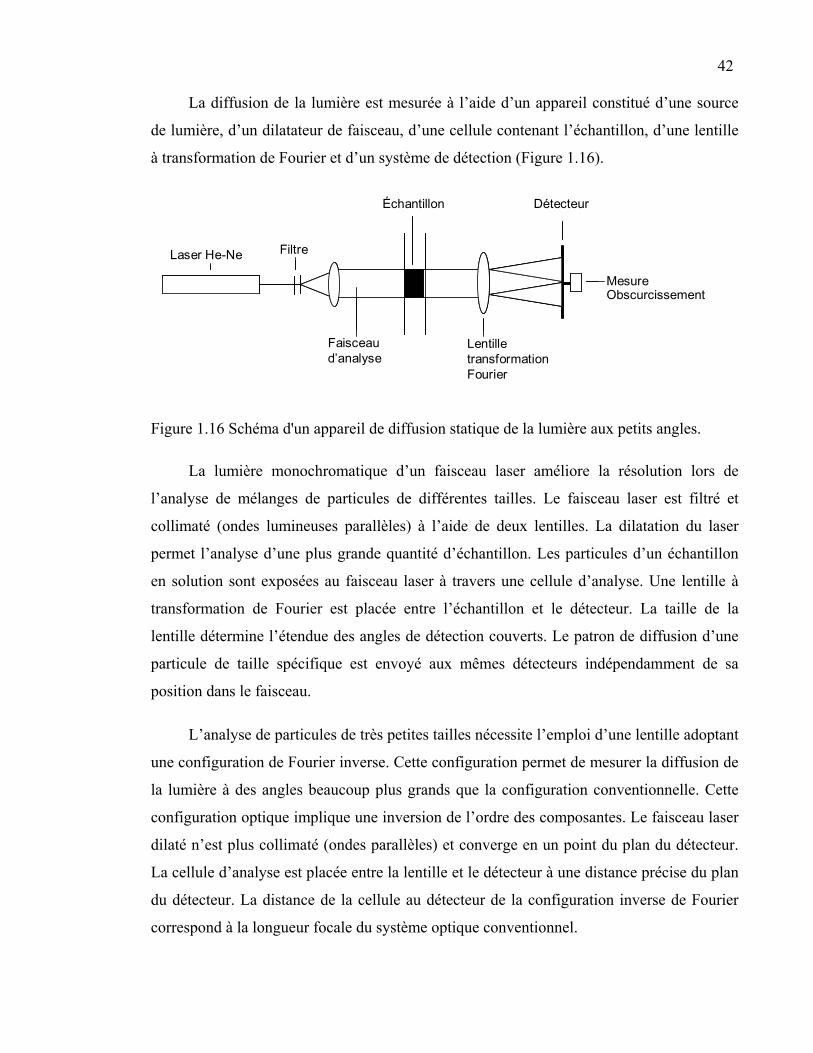
42
La diffusion de la lumière est mesurée à l’aide d’un appareil constitué d’une source
de lumière, d’un dilatateur de faisceau, d’une cellule contenant l’échantillon, d’une lentille
à transformation de Fourier et d’un système de détection (Figure 1.16).
Échantillon Détecteur
Mesure Obscurcissement
Lentille transformation Fourier
Faisceau d’analyse
FiltreLaser He-Ne
Échantillon Détecteur
Mesure Obscurcissement
Lentille transformation Fourier
Faisceau d’analyse
FiltreLaser He-Ne
Figure 1.16 Schéma d'un appareil de diffusion statique de la lumière aux petits angles.
La lumière monochromatique d’un faisceau laser améliore la résolution lors de
l’analyse de mélanges de particules de différentes tailles. Le faisceau laser est filtré et
collimaté (ondes lumineuses parallèles) à l’aide de deux lentilles. La dilatation du laser
permet l’analyse d’une plus grande quantité d’échantillon. Les particules d’un échantillon
en solution sont exposées au faisceau laser à travers une cellule d’analyse. Une lentille à
transformation de Fourier est placée entre l’échantillon et le détecteur. La taille de la
lentille détermine l’étendue des angles de détection couverts. Le patron de diffusion d’une
particule de taille spécifique est envoyé aux mêmes détecteurs indépendamment de sa
position dans le faisceau.
L’analyse de particules de très petites tailles nécessite l’emploi d’une lentille adoptant
une configuration de Fourier inverse. Cette configuration permet de mesurer la diffusion de
la lumière à des angles beaucoup plus grands que la configuration conventionnelle. Cette
configuration optique implique une inversion de l’ordre des composantes. Le faisceau laser
dilaté n’est plus collimaté (ondes parallèles) et converge en un point du plan du détecteur.
La cellule d’analyse est placée entre la lentille et le détecteur à une distance précise du plan
du détecteur. La distance de la cellule au détecteur de la configuration inverse de Fourier
correspond à la longueur focale du système optique conventionnel.
43
La lumière diffusée est détectée par un ensemble de détecteurs à différents angles.
L’acquisition d’une donnée nécessite la prise de mesures réalisées en des temps très courts.
Un logiciel permet de transformer les patrons de lumière diffusée en diamètres volumiques
moyens. La fidélité des valeurs mesurées par rapport aux valeurs prédites est évaluée par
l’erreur de la méthode des moindres carrés exprimée par le résidu.
Lorsque les particules sont sphériques et de petite taille, l’intensité de la lumière
diffusée, I(q), en fonction du vecteur d’onde, q, peut être utilisée pour caractériser la
séparation de phases d’un mélange. Le vecteur d’onde q est défini par l’équation 19.
(19) ⎟⎠⎞
⎜⎝⎛ θ
λπ
=2
sinn4q0
Où n : indice de réfraction de la phase continue λ0 : longueur d’onde de la lumière incidente dans le vide
θ : angle de détection de la lumière diffusée
Une séparation de phases entraîne l’apparition de fluctuations locales de
concentrations entraînant une modification du patron de diffusion de la lumière. Les
mécanismes de séparation de phases de décomposition spinodale et de nucléation et
croissance peuvent parfois être différenciés par la diffusion de la lumière.
Lors d’une décomposition spinodale, un maximum d’intensité de lumière diffusée
(Imax) est observé à un vecteur d’onde caractéristique (qmax). Lors des étapes initiales de la
décomposition spinodale, Imax croît exponentiellement à une valeur constante de qmax. La
taille des domaines structuraux (Λ) développés dans les phases initiales peut être évaluées
par la relation Λ=2π/qmax. Lors des étapes intermédiaires, le déplacement de qmax vers des
valeurs de q inférieures indique une augmentation de la taille des domaines structuraux.
Cette augmentation est due à une coalescence des domaines structuraux (Sanchez et al.,
2002). Lors des étapes tardives, qmax et Imax atteignent des valeurs constantes démontrant
une stabilisation du système. La décomposition spinodale est caractérisée par l’obtention
d’une seule courbe lorsque les valeurs normalisées I/Imax sont reportées en fonction des
valeurs normalisées q/qmax (Furukawa, 1984).
44
Une décroissance monotone de l’intensité lumineuse diffusée en fonction du vecteur
d’onde est la signature d’un phénomène de nucléation et croissance (Sanchez et al., 2002).
La presence d’une valeur qmax peut parfois être observée lorsqu’une couche de déplétion est
formée autour des particules de la phase diluée ou à concentration élevée où un grand
nombre de particules sont entassées dans un volume limité (Eliçabe et al., 1997, 1998).
Dans ces cas-ci, qmax se déplace vers des valeurs de q plus petites ou plus grandes selon
l’évolution de la taille des particules du système.
Lorsqu’en coordonnées bi-logarithmiques, I(q) diminue linéairement aux valeurs
élevées de q sur plus d’une décade, l’agrégation des particules est fractale. La pente en
valeur absolue de cette section linéaire correspond à la dimension fractale des agrégats
(Teixeira, 1988; Kim et Berg, 2000). Un objet fractal est caractérisé par la répétition d’une
même structure de base retrouvée à toute échelle d’observation.
45
1.7 HYPOTHÈSE, BUT ET OBJECTIFS SPÉCIFIQUES
1.7.1 Hypothèse
Les travaux ayant porté sur les interactions protéine/polysaccharide ont permis une
compréhension partielle des systèmes ternaires. Généralement, les conditions régissant la
formation de complexes protéine/polysaccharide ont été étudiées en omettant une approche
fondamentale sur la nature des interactions impliquées en fonction du pH et de la force
ionique. L’utilisation de la β-lactoglobuline dans ce domaine de recherche est intéressante
puisque cette protéine est bien caractérisée et très utilisée comme ingrédient alimentaire
pour ses bonnes valeurs nutritionnelle et fonctionnelle. Le choix de la pectine se justifie par
une utilisation répandue en industrie alimentaire, un caractère anionique ainsi que par
l’intérêt général porté au rôle de fibre alimentaire des polysaccharides naturels.
Ainsi, l’étude du modèle β-lg/pectine hautement ou faiblement méthylée en zone de
compatibilité themodynamique, à l’aide de techniques analytiques complémentaires,
permettra de mieux comprendre les interactions protéine/polysaccharide anionique
impliquées lors de la complexation à différentes conditions de pH, de force ionique et de
concentrations.
1.7.2 But
Le but de cette étude était d’acquérir des connaissances fondamentales sur les
interactions entre les protéines et les polysaccharides anioniques. Ces nouvelles
connaissances seront utiles à l’amélioration de procédés de fabrication des complexes en
tant qu’ingrédient alimentaire.
1.7.3 Objectifs spécifiques
1. Étudier les conditions de formation des complexes β-lg/pectine ainsi que la nature des
interactions impliquées en fonction du pH, du ratio et du DE de la pectine par des
46
techniques de titrage potentiométrique et d’ultrafiltration en conditions déstabilisantes
(NaCl, urée, température) (Chapitre 2).
2. Déterminer les paramètres d’interactions tels la constante d’association, les sites
d’interaction et la stoechiométrie des complexes β-lg/pectine en fonction du pH, du
ratio et du DE de la pectine par électrophorèse capillaire et par l’ultrafiltration de
complexes peptides de la β-lg/pectine (Chapitre 3).
3. Déterminer les paramètres thermodynamiques tels l’enthalpie, l’entropie, l’énergie libre
de Gibbs, la stoechiométrie et la constante d’association lors de la formation des
complexes β-lg/pectine en fonction du degré d’estérification de la pectine par une
technique de titrage isothermique calorimétrique (Chapitre 4)
4. Étudier l’évolution de la structure des complexes β-lg/pectine et la cinétique de
séparation de phases lors de la formation des complexes β-lg/pectine en fonction du pH,
du ratio et du degré d’estérification de la pectine par une technique de diffusion statique
de la lumière aux petits angles (Chapitre 5).
Les dispositifs expérimentaux mis en œuvre pour l’atteinte de ces quatre objectifs sont
présentés aux chapitres 2 à 5, respectivement.
CHAPITRE 2: Interbiopolymer complexing between β-lactoglobulin and low- or high-methoxyl pectin measured by potentiometric titration and ultrafiltration
Maude Girard, Sylvie L. Turgeon & Sylvie F. Gauthier
Centre de recherche en sciences et technologie du lait STELA
Faculté des sciences de l’agriculture et de l’alimentation
Université Laval
Québec, Qc, G1K 7P4, Canada
Publié dans Food Hydrocolloids, 2002, 16, 585-591.
48
2.1 RÉSUMÉ
Les pH de formation des complexes solubles (pHc) entre la β-lactoglobuline (β-lg) et
la pectine faiblement ou hautement méthylée (pectine LM ou HM) ont été déterminés par
titrage potentiométrique. La nature des interactions a été étudiée par des conditions
déstabilisantes telles l’emploi de chlorure de sodium ou d’urée et l’entreposage à
différentes températures. Le degré de complexation a été mesuré par l’ultrafiltration des
solutions β-lg/pectine LM ou HM à des pH entre 4,5 et 7,0. La quantité de β-lg complexée
dosée est supérieure avec la pectine LM comparativement à la pectine HM. Environ 96 et
78% des molécules de β-lg sont complexées à pH 4.5 et à un ratio protéine/polysaccharide
de 4:1 (p/p) avec la pectine LM et la pectine HM, respectivement. L’effet déstabilisant du
chlorure de sodium, de l’urée et d’une augmentation de température ont démontré que les
interactions maintenant les complexes β-lg/pectine LM ou HM sont majoritairement de
nature électrostatique et proviennent en partie de liens hydrogène.
49
2.2 ABSTRACT
The pH values leading to the formation of soluble complexes (pHc) between β-
lactoglobulin (β-lg) and low- or high-methoxyl pectin (LM- or HM-pectin) were
determined using potentiometric titrations. The nature of interactions was determined by
using sodium chloride, urea and different temperatures. The extent of complex formation
was quantified by ultrafiltration of β-lg/LM- and β-lg/HM-pectin solutions, at pH values
between 4.5 and 7.0. The amount of β-lg complexed was greater with LM- than with HM-
pectin. At pH 4.5 in deionized water and at a protein/polysaccharide 4:1 (w/w) ratio, about
96% of the β-lg complexed with LM-pectin, whereas only 78% complexed with HM-
pectin. The destabilizing effect of sodium chloride, urea and temperature has demonstrated
that interactions in the systems are mainly caused by electrostatic forces and, to a lesser
extent, hydrogen bonding.
50
2.3 INTRODUCTION
The thermodynamic compatibility between proteins and polysaccharides arises when
attractive interactions are greater than repulsive forces. Repulsive interactions are always
non-specific. They are mainly due to excluded volume effect and electrostatic interactions.
These weak interactions exist when pH is higher than the isoeletric pH (IEP) of the protein.
Attractive interactions can be specific, as in covalent linkages, or non-specific as in
electrostatic interactions, van der Waals forces, hydrophobic interactions and hydrogen
bonding (Schmitt et al., 1998). These interactions can lead to complex formation between
proteins and polysaccharides. Entropic factors, such as the structure and molecular weight
of biopolymers, influence the complexes obtained. Other factors have enthalpic origin.
Their magnitude depends on the protein/polysaccharide ratio and on the nature and density
of charges on the biopolymers. The pH and ionic strength are parameters that essentially
influence electrostatic interactions (Burgess, 1990; van Oss, 1993; Xia and Dubin, 1994).
In this study the type of interactions between β-lactoglobulin (β-lg) and high- or low-
methoxyl pectin (HM- or LM-pectin) were determined. β-lg was chosen because of its
well-known structure (Sawyer et al., 1999). It has a molecular weight of 18,350 Da and
possesses a hydrophobic core. The structure of this globular protein is stabilized by 2
disulphide bridges (McKenzie et al., 1972). The quaternary structure of β-lg is affected by
pH, mineral content and temperature. At milk pH and room temperature, the protein adopts
the dimeric form. Decreasing sodium chloride concentrations or increasing the temperature
will lead to the monomeric form (Aymard et al., 1996; Renard et al., 1998). At pH below 3
or above 8, the dimers dissociate into monomers (Ragona et al., 1997).
Pectin was chosen since this polysaccharide is widely used in food products. It is an
anionic biopolymer, which is essentially made up of D-galA residues. Pectins are classified
by their degree of esterification (DE). Pectin is said to be high-methoxyl when the
percentage of the esterified carboxyl groups is higher than 50%. Pectin is low-methoxyl,
however, when the DE value is lower than 50% (Voragen et al., 1995).
51
Many studies have been carried out on interactions between proteins and
polysaccharides (Serov et al., 1985; Gurov et al., 1988; Tolstoguzov, 1991). Subjects
studied were mainly emulsifying or gelling properties of these systems (Tolstoguzov, 1986;
Gurov and Nuss, 1986; Gurov et al., 1986; Tokaev et al., 1987; Tolstoguzov, 1991). Few
works have identified the nature of the interactions between these biopolymers in diluted
systems (Imeson et al., 1977; Xia and Dubin, 1993; Phillips and Williams, 1995;
Tolstoguzov, 1997; Antonov and Soshinsky, 2000). Most studies on β-lg/pectin were on
gelled or concentrated systems (Ndi et al., 1996a; Beaulieu et al., 2001) and the nature of
the interactions involved was often only speculated on (Einhorn-Stoll et al., 1996; Zaleska
et al., 2000; Wang and Qvist, 2000). The aim of this work was to investigate the nature of
the interactions involved between the β-lg and LM- or HM-pectin. Potentiometric titrations
and ultrafiltration were techniques chosen to determine complex formation conditions and
the amount of β-lg complexed to pectin under different conditions, respectively. Sodium
chloride and pH were used to establish the role of electrostatic interactions, while urea and
temperature were used to verify hydrogen bonding and hydrophobic interactions
respectively.
52
2.4 MATERIALS AND METHODS
2.4.1 Materials
Bovine β-lg AB (3X crystallized) was purchased from Sigma-Aldrich Canada Ltd
(Oakville, On, Canada) as 95% pure protein and used without further purification. Low-
methoxyl pectin (DE 28.3%, 94.3 kDa) and high-methoxyl pectin (DE 73.4%, 118 kDa)
were donated by Hercules Copenhagen A/S (Copenhagen, Denmark). All reagents were of
analytical grade and used as received.
2.4.2 Potentiometric Titrations
Complexation of protein with polysaccharide can be observed by potentiometric
titration of the protein acidic and basic groups (Wen and Dubin, 1997; Mattison et al.,
1998). Solutions of β-lg, LM- and HM-pectin were made in deionized water and stored
overnight at 4°C to allow complete hydration of molecules. LM- or HM-pectin solution
was added to β-lg solution to obtain β-lg:pectin weight ratios of 2:1; 4:1; 6:1; 8:1 and 10:1.
The final solutions (60 mL) contained 0.05% (w/w) β-lg. Potentiometric titrations were
performed at 22°C on the mixed β-lg-pectin solutions and on solutions of β-lg only (blank
samples) with a Mettler-Toledo DL53 titrator (Schwerzenbach, Switzerland). The pH
electrode was calibrated with pH 4.00 ± 0.01, 7.00 ± 0.01 and 10.00 ± 0.01 buffers just
before titrations. The initial pH was adjusted to 7.5 ± 0.05 with 0.01N NaOH and the
solutions were titrated to reach pH 4.5. The observed pH was noted when the value was
stable for at least 1 minute. The reproducibility of 2 repeated titrations was ± 0.05 pH units.
The charge on β-lg relative to the isoeletric point of the protein (zero) was calculated with
the equation 20 using the mass of β-lg in the solutions, the molecular weight of a β-lg
monomer and the concentration of the titrant (Mattison et al., 1998).
53
(20) Relative charge on β-lg = B/ADC×
Where A: β-lg titrated (g) B: β-lg molecular weight (g) C: Titrant concentration (mol·mL-1) D: volume of titrant (mL)
The pH initial of soluble complexes formation (pHc) corresponds to the inflexion
point on the titration curve. In order to evaluate the impact of electrostatic interactions and
hydrogen bonds on the pHc, the same solutions were prepared as described previously, but
by respectively adding 110 mM sodium chloride and 110 mM urea to aqueous phases. The
ionic nature of sodium chloride screens the electrostatic interactions. Urea is an uncharged
molecule that reduces hydrogen bonding without modifying the ionic strength (West et al.,
1997).
2.4.3 Quantification of the complexed β-lg
This method was adapted from Noiseux et al. (2001). The β-lg and pectin solutions
were rehydrated with deionized water and stored overnight at 4°C. LM- or HM-pectin was
added to β-lg solution in an Eppendorf® tube to obtain a protein/pectin weight ratio of 4:1.
The volume of the mixtures was adjusted to 500 µL with deionized water. The final
solutions contained 0.05% (w/w) β-lg and 0.0125% (w/w) pectin. The quantity of
complexed β-lg to pectin was evaluated at pH 7.0, 6.5, 6.0, 5.5, 5.0 and 4.5. As in the case
of potentiometric study, the presence of electrostatic interactions and hydrogen bonding
was evaluated at 22°C by adding 110 mM sodium chloride or 110 mM urea to solutions. To
evaluate the significance of hydrophobic interactions, the solutions prepared in water only
were also evaluated after holding overnight at 4 and 40°C.
The solutions, called total solutions, were shaken gently and 250 µL were
ultrafiltrated by centrifugation through a Microcon® device YM-100 (100 kDa MWCO,
Millipore, Bedford, MA) at 3,500 g for 30 minutes at the temperature under study. The
membrane retained the LM- and HM-pectin and the protein/pectin complexes while the
non-complexed proteins passed through the membrane. The proteins in total solutions and
54 those recovered in permeates were assayed by a bicinchoninic acid protein assay (BCA)
(Smith et al., 1985). The regenerated cellulose membrane used is low protein binding, the
amount of adsorbed protein on the membrane varies with the experimental conditions. To
take into account this phenomenon, β-lg solutions (0.05%) without pectin were treated and
filtered under the same conditions and the amount of β-lg in these ultrafiltration permeates
was considered as the 100% reference. The amount of β-lg complexed with the pectin was
determined with the equation 21.
(21) UPF
UP100CP −=
Where CP: complexed β-lg (%) UF: β-lg in ultrafiltration permeate UPF: β-lg in ultrafiltration permeate of pectin-free solution
The pHc was determined by choosing the initial pH at which there was more than
10% of β-lg complexed to pectin to take into account the error of the method showed by the
standard deviation bars on the figures. The molecular weight of the biopolymers, their
concentration in the mixtures and the amounts of protein complexed on pectin allowed us to
calculate the number of proteins and pectin molecules in the mixtures and the molecular
ratio of the complex.
2.4.4 Statistical Analysis
Effects of temperature, pH, solvent and pectin DE on the protein/pectin complexes
were analyzed as a 3 (temperature) X 6 (pH) X 3 (solvent) X 2 (pectin DE) factorial
experiment by analysis of variance performed by SAS. All the experiments were completed
in duplicate.
55
2.5 RESULTS AND DISCUSSION
2.5.1 Potentiometric Titrations
Generally, the titration curves on Figure 2.1 and Figure 2.2 show that the amount of
hydrochloric acid needed to titrate β-lg was higher with the addition of LM and, to a lesser
extent, HM-pectin. In fact, the pectin decreases the pKa of β-lg ionic groups (Mattison et
al., 1995; Wen and Dubin, 1997). As a result, the complex bears more negative charges
than the protein alone at pH 7.5 (Table 2.1). The β-lg/LM-pectin ratio had no significant
effect on the initial pH of soluble complexes formation (pHc) that is 6.1 for the 10:1; 8:1;
6:1 4:1 and 2:1 ratios (Figure 2.1A). Mattison et al. (1995) have found that the pHc of
BSA/poly(dimethyldiallylammonium chloride) was independent of ratio. Therefore, the
complex formation begins with 1 protein molecule binding to 1 chain of pectin (Mattison et
al., 1995). There are two models used to describe the binding between proteins and anionic
polysaccharide as a function of pH. The first arises at pH<IEP of the protein. The binding is
non-specific and is due to opposite net charges of the two biopolymers. The second occurs
at pH>IEP of the protein and is between chain segments of anionic polysaccharides and the
positively charged region(s) on the polypeptide chains of protein (Imeson et al., 1977;
Stainsby, 1980). Thus, the interaction between pectin and β-lg at pH>IEP occurs via local
positive patches on the protein (Park et al., 1992; Xia and Dubin, 1994; Mattison et al.,
1998). In Figure 2.1A, the curves for the 8:1 and 10:1 ratios are almost superimposed. This
means that at ratio 8:1, it takes 0.05% (w/w) β-lg in solution to saturate LM-pectin at
0.00625% (w/w). Figure 2.1B illustrates the titration curves of β-lg/HM-pectin systems.
The pKa value of the β-lg ionic groups was not decreased as much with HM-pectin as with
LM-pectin. The pHc, which is about 5.5, was not influenced by the β-lg/HM-pectin ratio.
The difference between the pHc values of complexes containing LM- or HM-pectin is due
to the dependency of these values on the polysaccharide charge density (Park et al., 1992).
The 4:1; 6:1; 8:1 and 10:1 ratios had similar curves indicating that the HM-pectin was
saturated with β-lg at a 4:1 ratio. The charge of the β-lg with HM-pectin was comparable to
the charge of protein alone (Table 2.1). This is explained by the lower content of carboxylic
56 groups in HM-pectin, which limits the possibility of electrostatic binding with β-lg. Thus,
the HM-pectin becomes saturated with proteins faster than the LM-pectin. The LM-pectin
holds more H+ than β-lg/HM-pectin which shows that LM-pectin is more strongly
complexed to β-lg than HM-pectin (Hattori et al., 2000).
To verify the nature of the interactions involved in the β-lg/LM- or HM-pectin
complexes, titrations on a 4:1 ratio were performed in 110 mM sodium chloride
(electrostatic interactions) and in 110 mM urea (hydrogen bonds). Results presented in
Figure 2.2A show that titrations done on sodium and urea containing mixtures were only
slightly modified from titrations on the protein alone. It is known that the pKa value of a
protein decreases with an increase in ionic strength (Wen and Dubin, 1997). Sodium
chloride decreased pHc from 6.1 to 5.5 for the β-lg/LM mixture. The significant
destabilizing effect of sodium chloride shows the presence of electrostatic interactions.
These interactions are known to be of greatest importance in a protein/polysaccharide
system (Tolstoguzov, 1997). Electrostatic interactions result in the loss of polymer
flexibility and mobility. However, the reaction is favored by the gain in enthalpy and
entropy due to the release of counter ions and water molecules (Piculell et al., 1995;
Tolstoguzov, 1997). The non-ionic nature of urea did not significantly influence the titrable
groups of β-lg in mixture with pectin. The screening effect of sodium chloride on β-lg/HM
complexes is illustrated by the superimposition of the β-lg and β-lg/HM-pectin curves
(Figure 2.2B). The electrostatic interactions between β-lg and HM-pectin were not strong
enough to compensate for the destabilizing effect of the sodium chloride. The inflexion
points of the titration curves were not accurate enough to determine pHc. The urea had no
significant effect on the β-lg/LM titration curves. Although, it is hard to measure the effect
on the β-lg/HM titration curves.
2.5.2 Ultrafiltration
Potentiometric titrations provided qualitative results on the complexation of β-lg with
the LM- or HM-pectin. An ultrafiltration technique was used to quantify the amounts of
complexes at different pH values. The types of interactions were determined by using 110
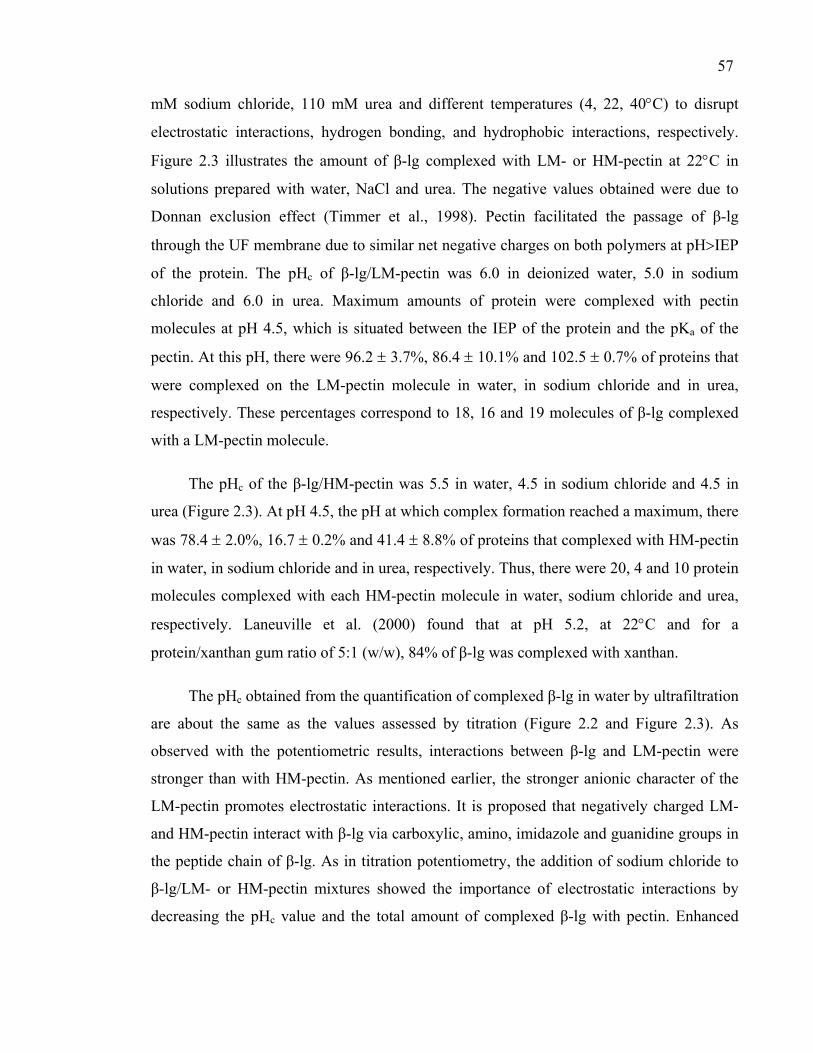
57 mM sodium chloride, 110 mM urea and different temperatures (4, 22, 40°C) to disrupt
electrostatic interactions, hydrogen bonding, and hydrophobic interactions, respectively.
Figure 2.3 illustrates the amount of β-lg complexed with LM- or HM-pectin at 22°C in
solutions prepared with water, NaCl and urea. The negative values obtained were due to
Donnan exclusion effect (Timmer et al., 1998). Pectin facilitated the passage of β-lg
through the UF membrane due to similar net negative charges on both polymers at pH>IEP
of the protein. The pHc of β-lg/LM-pectin was 6.0 in deionized water, 5.0 in sodium
chloride and 6.0 in urea. Maximum amounts of protein were complexed with pectin
molecules at pH 4.5, which is situated between the IEP of the protein and the pKa of the
pectin. At this pH, there were 96.2 ± 3.7%, 86.4 ± 10.1% and 102.5 ± 0.7% of proteins that
were complexed on the LM-pectin molecule in water, in sodium chloride and in urea,
respectively. These percentages correspond to 18, 16 and 19 molecules of β-lg complexed
with a LM-pectin molecule.
The pHc of the β-lg/HM-pectin was 5.5 in water, 4.5 in sodium chloride and 4.5 in
urea (Figure 2.3). At pH 4.5, the pH at which complex formation reached a maximum, there
was 78.4 ± 2.0%, 16.7 ± 0.2% and 41.4 ± 8.8% of proteins that complexed with HM-pectin
in water, in sodium chloride and in urea, respectively. Thus, there were 20, 4 and 10 protein
molecules complexed with each HM-pectin molecule in water, sodium chloride and urea,
respectively. Laneuville et al. (2000) found that at pH 5.2, at 22°C and for a
protein/xanthan gum ratio of 5:1 (w/w), 84% of β-lg was complexed with xanthan.
The pHc obtained from the quantification of complexed β-lg in water by ultrafiltration
are about the same as the values assessed by titration (Figure 2.2 and Figure 2.3). As
observed with the potentiometric results, interactions between β-lg and LM-pectin were
stronger than with HM-pectin. As mentioned earlier, the stronger anionic character of the
LM-pectin promotes electrostatic interactions. It is proposed that negatively charged LM-
and HM-pectin interact with β-lg via carboxylic, amino, imidazole and guanidine groups in
the peptide chain of β-lg. As in titration potentiometry, the addition of sodium chloride to
β-lg/LM- or HM-pectin mixtures showed the importance of electrostatic interactions by
decreasing the pHc value and the total amount of complexed β-lg with pectin. Enhanced
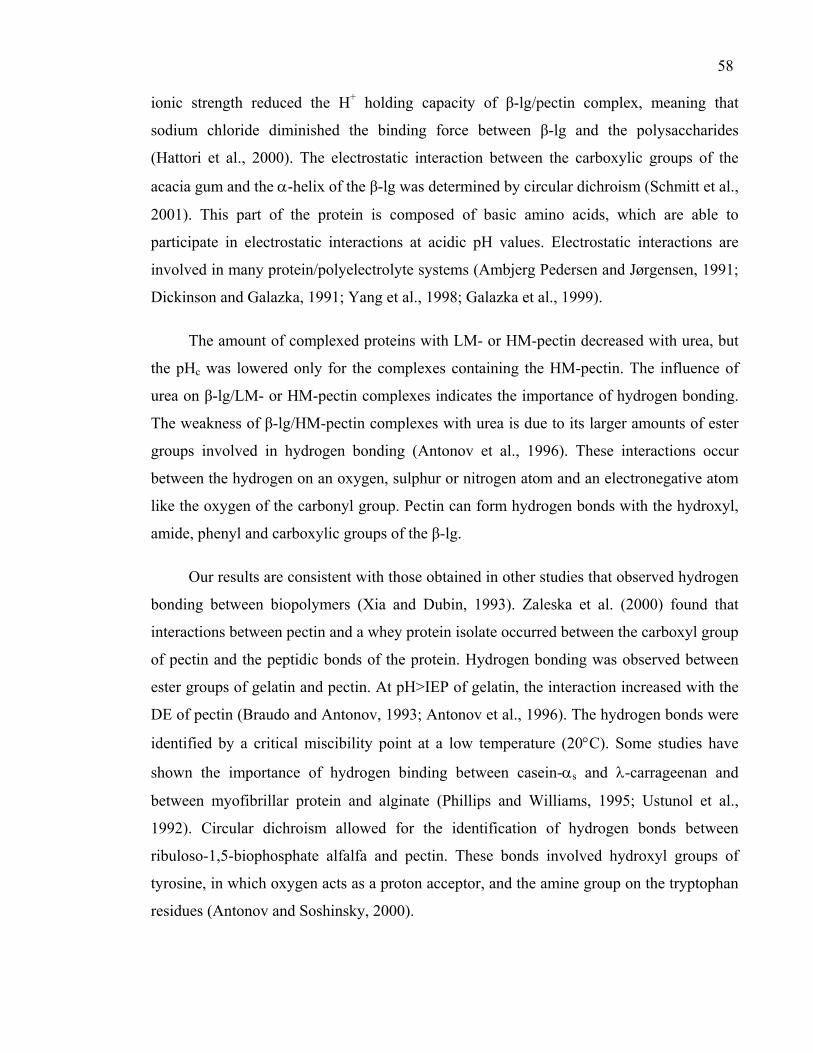
58 ionic strength reduced the H+ holding capacity of β-lg/pectin complex, meaning that
sodium chloride diminished the binding force between β-lg and the polysaccharides
(Hattori et al., 2000). The electrostatic interaction between the carboxylic groups of the
acacia gum and the α-helix of the β-lg was determined by circular dichroism (Schmitt et al.,
2001). This part of the protein is composed of basic amino acids, which are able to
participate in electrostatic interactions at acidic pH values. Electrostatic interactions are
involved in many protein/polyelectrolyte systems (Ambjerg Pedersen and Jørgensen, 1991;
Dickinson and Galazka, 1991; Yang et al., 1998; Galazka et al., 1999).
The amount of complexed proteins with LM- or HM-pectin decreased with urea, but
the pHc was lowered only for the complexes containing the HM-pectin. The influence of
urea on β-lg/LM- or HM-pectin complexes indicates the importance of hydrogen bonding.
The weakness of β-lg/HM-pectin complexes with urea is due to its larger amounts of ester
groups involved in hydrogen bonding (Antonov et al., 1996). These interactions occur
between the hydrogen on an oxygen, sulphur or nitrogen atom and an electronegative atom
like the oxygen of the carbonyl group. Pectin can form hydrogen bonds with the hydroxyl,
amide, phenyl and carboxylic groups of the β-lg.
Our results are consistent with those obtained in other studies that observed hydrogen
bonding between biopolymers (Xia and Dubin, 1993). Zaleska et al. (2000) found that
interactions between pectin and a whey protein isolate occurred between the carboxyl group
of pectin and the peptidic bonds of the protein. Hydrogen bonding was observed between
ester groups of gelatin and pectin. At pH>IEP of gelatin, the interaction increased with the
DE of pectin (Braudo and Antonov, 1993; Antonov et al., 1996). The hydrogen bonds were
identified by a critical miscibility point at a low temperature (20°C). Some studies have
shown the importance of hydrogen binding between casein-αs and λ-carrageenan and
between myofibrillar protein and alginate (Phillips and Williams, 1995; Ustunol et al.,
1992). Circular dichroism allowed for the identification of hydrogen bonds between
ribuloso-1,5-biophosphate alfalfa and pectin. These bonds involved hydroxyl groups of
tyrosine, in which oxygen acts as a proton acceptor, and the amine group on the tryptophan
residues (Antonov and Soshinsky, 2000).
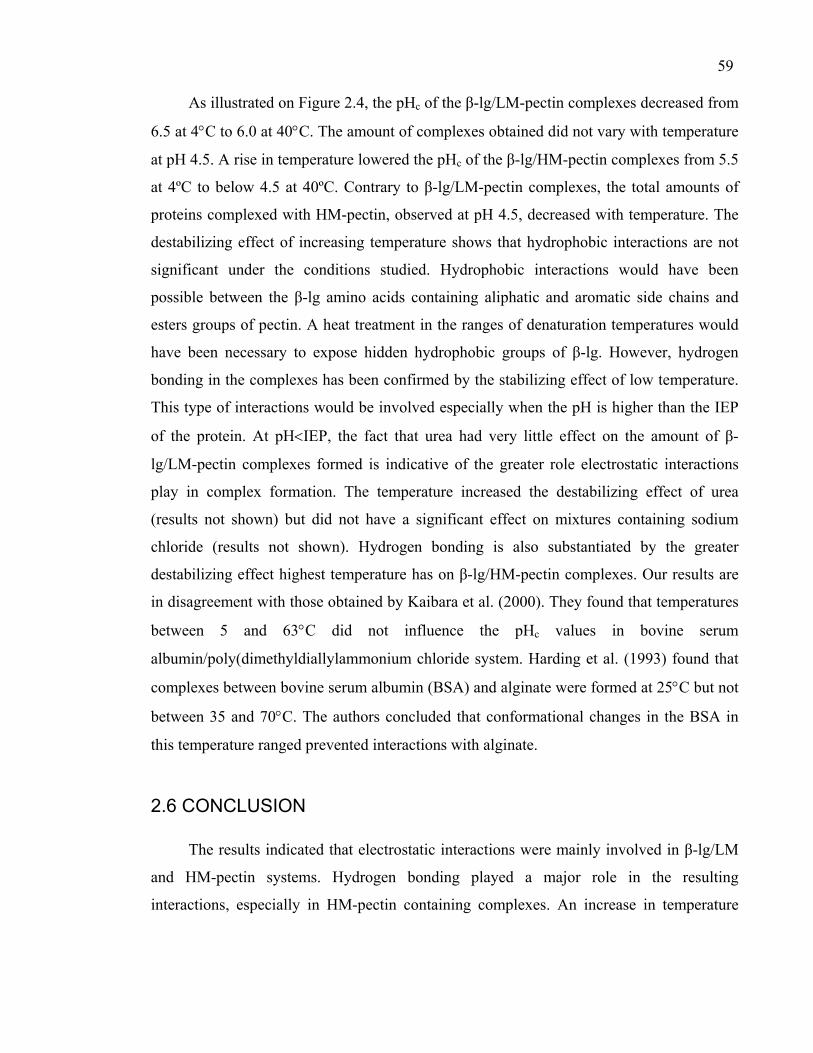
59
As illustrated on Figure 2.4, the pHc of the β-lg/LM-pectin complexes decreased from
6.5 at 4°C to 6.0 at 40°C. The amount of complexes obtained did not vary with temperature
at pH 4.5. A rise in temperature lowered the pHc of the β-lg/HM-pectin complexes from 5.5
at 4ºC to below 4.5 at 40ºC. Contrary to β-lg/LM-pectin complexes, the total amounts of
proteins complexed with HM-pectin, observed at pH 4.5, decreased with temperature. The
destabilizing effect of increasing temperature shows that hydrophobic interactions are not
significant under the conditions studied. Hydrophobic interactions would have been
possible between the β-lg amino acids containing aliphatic and aromatic side chains and
esters groups of pectin. A heat treatment in the ranges of denaturation temperatures would
have been necessary to expose hidden hydrophobic groups of β-lg. However, hydrogen
bonding in the complexes has been confirmed by the stabilizing effect of low temperature.
This type of interactions would be involved especially when the pH is higher than the IEP
of the protein. At pH<IEP, the fact that urea had very little effect on the amount of β-
lg/LM-pectin complexes formed is indicative of the greater role electrostatic interactions
play in complex formation. The temperature increased the destabilizing effect of urea
(results not shown) but did not have a significant effect on mixtures containing sodium
chloride (results not shown). Hydrogen bonding is also substantiated by the greater
destabilizing effect highest temperature has on β-lg/HM-pectin complexes. Our results are
in disagreement with those obtained by Kaibara et al. (2000). They found that temperatures
between 5 and 63°C did not influence the pHc values in bovine serum
albumin/poly(dimethyldiallylammonium chloride system. Harding et al. (1993) found that
complexes between bovine serum albumin (BSA) and alginate were formed at 25°C but not
between 35 and 70°C. The authors concluded that conformational changes in the BSA in
this temperature ranged prevented interactions with alginate.
2.6 CONCLUSION
The results indicated that electrostatic interactions were mainly involved in β-lg/LM
and HM-pectin systems. Hydrogen bonding played a major role in the resulting
interactions, especially in HM-pectin containing complexes. An increase in temperature
60 lowered the amount of complexed β-lg and confirmed the presence of hydrogen bonding.
The carboxyl groups enabled the LM-pectin to complex more protein than HM-pectin. The
error margin induced by the Donnan exclusion effect observed with ultrafiltration
membranes is unknown. Therefore, the quantitative aspect of β-lg/pectin interactions was
investigated with frontal analysis continuous capillary electrophoresis and presented in the
chapter 3.
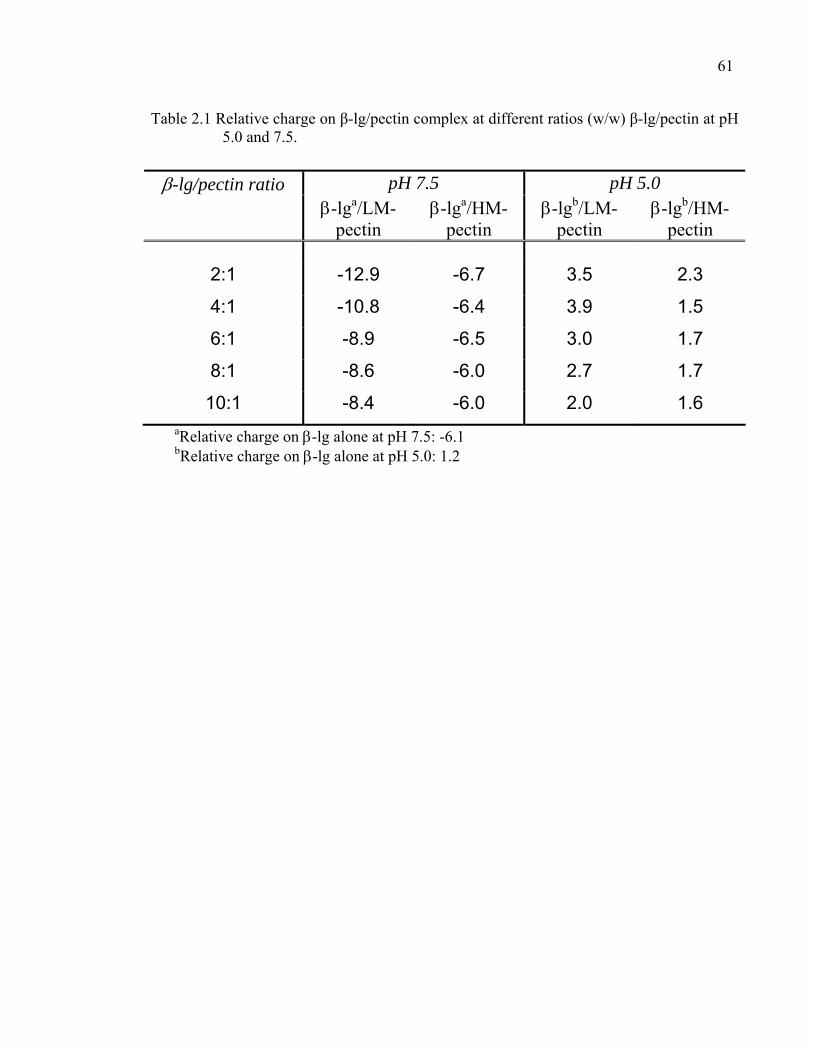
61
Table 2.1 Relative charge on β-lg/pectin complex at different ratios (w/w) β-lg/pectin at pH 5.0 and 7.5.
pH 7.5 pH 5.0 β-lg/pectin ratio β-lga/LM-
pectin β-lga/HM-
pectin β-lgb/LM-
pectin β-lgb/HM-
pectin
2:1 -12.9 -6.7 3.5 2.3
4:1 -10.8 -6.4 3.9 1.5
6:1 -8.9 -6.5 3.0 1.7
8:1 -8.6 -6.0 2.7 1.7
10:1 -8.4 -6.0 2.0 1.6 aRelative charge on β-lg alone at pH 7.5: -6.1 bRelative charge on β-lg alone at pH 5.0: 1.2
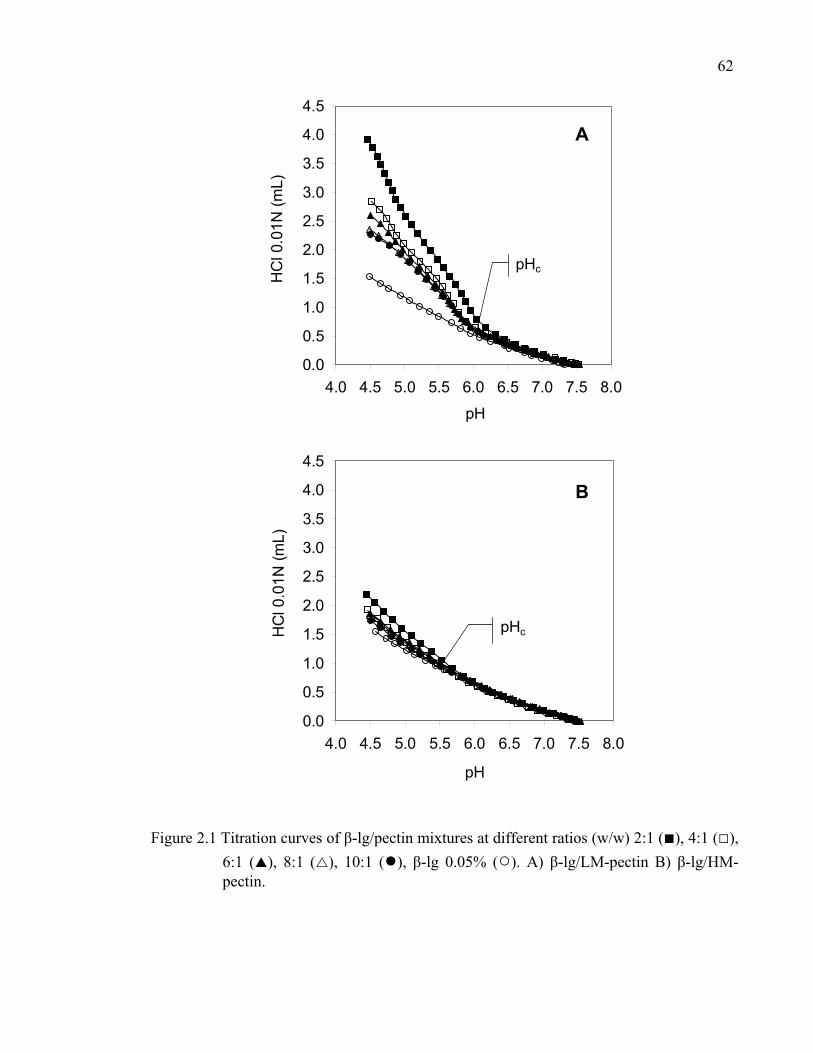
62
0.0
0.5
1.0
1.5
2.0
2.5
3.0
3.5
4.0
4.5
4.0 4.5 5.0 5.5 6.0 6.5 7.0 7.5 8.0
pH
HC
l 0.0
1N (m
L)pHc
A
0.0
0.5
1.0
1.5
2.0
2.5
3.0
3.5
4.0
4.5
4.0 4.5 5.0 5.5 6.0 6.5 7.0 7.5 8.0
pH
HC
l 0.0
1N (m
L)
pHc
B
Figure 2.1 Titration curves of β-lg/pectin mixtures at different ratios (w/w) 2:1 (■), 4:1 (□), 6:1 ( ), 8:1 ( ), 10:1 (●), β-lg 0.05% (○). A) β-lg/LM-pectin B) β-lg/HM-pectin.
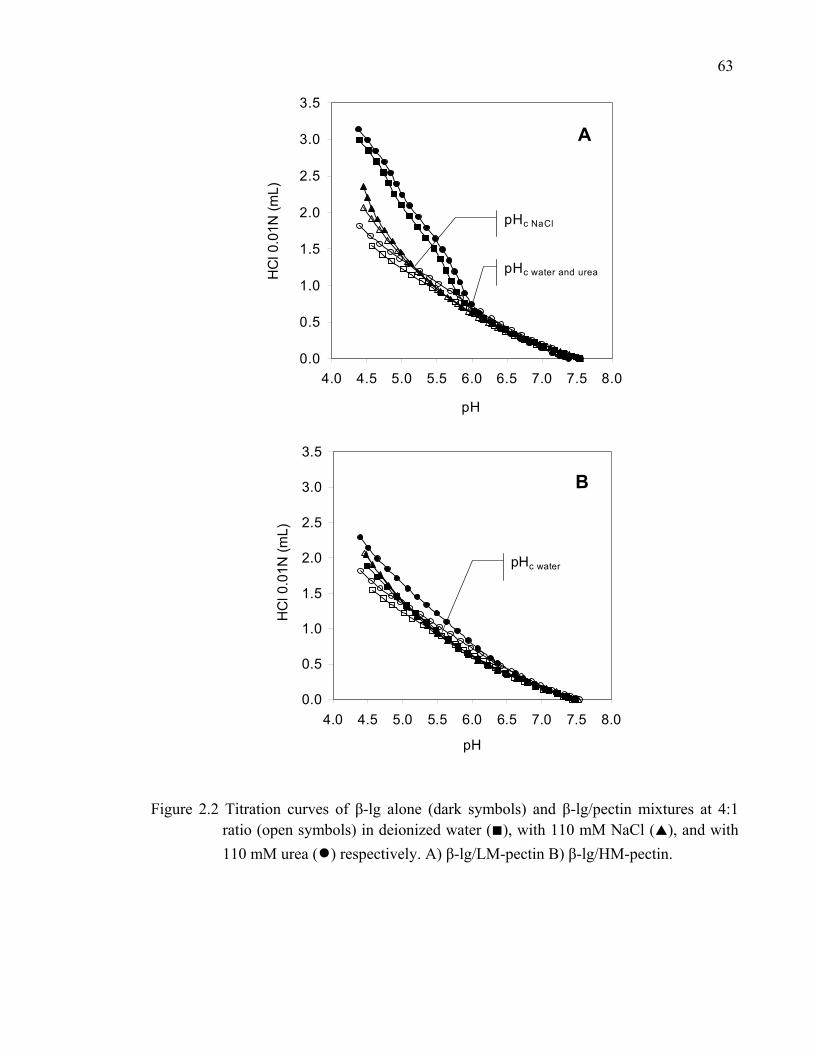
63
0.0
0.5
1.0
1.5
2.0
2.5
3.0
3.5
4.0 4.5 5.0 5.5 6.0 6.5 7.0 7.5 8.0
pH
HC
l 0.0
1N (m
L)
pHc NaCl
pHc water and urea
A
0.0
0.5
1.0
1.5
2.0
2.5
3.0
3.5
4.0 4.5 5.0 5.5 6.0 6.5 7.0 7.5 8.0
pH
HC
l 0.0
1N (m
L)
pHc water
B
Figure 2.2 Titration curves of β-lg alone (dark symbols) and β-lg/pectin mixtures at 4:1 ratio (open symbols) in deionized water (■), with 110 mM NaCl ( ), and with 110 mM urea (●) respectively. A) β-lg/LM-pectin B) β-lg/HM-pectin.
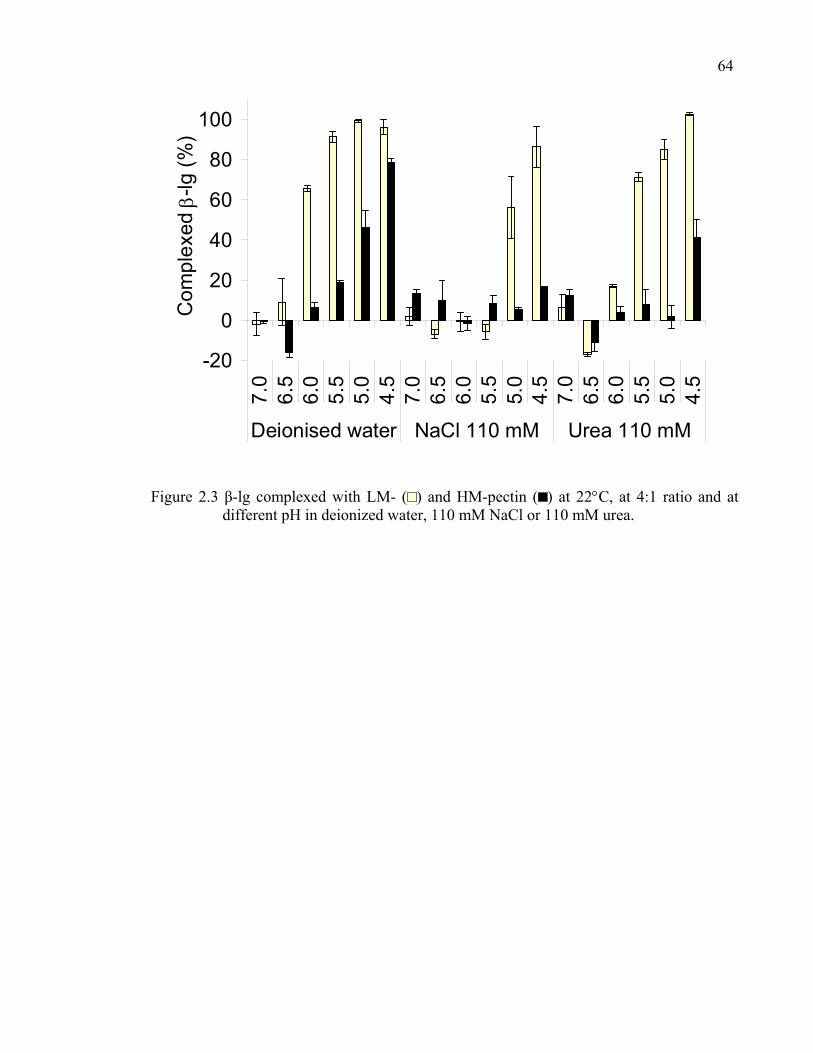
64
-20
0
20
40
60
80
100
7.0
6.5
6.0
5.5
5.0
4.5
7.0
6.5
6.0
5.5
5.0
4.5
7.0
6.5
6.0
5.5
5.0
4.5
Deionised water NaCl 110 mM Urea 110 mM
Com
plex
ed β
-lg (%
)
Figure 2.3 β-lg complexed with LM- ( ) and HM-pectin ( ) at 22°C, at 4:1 ratio and at different pH in deionized water, 110 mM NaCl or 110 mM urea.
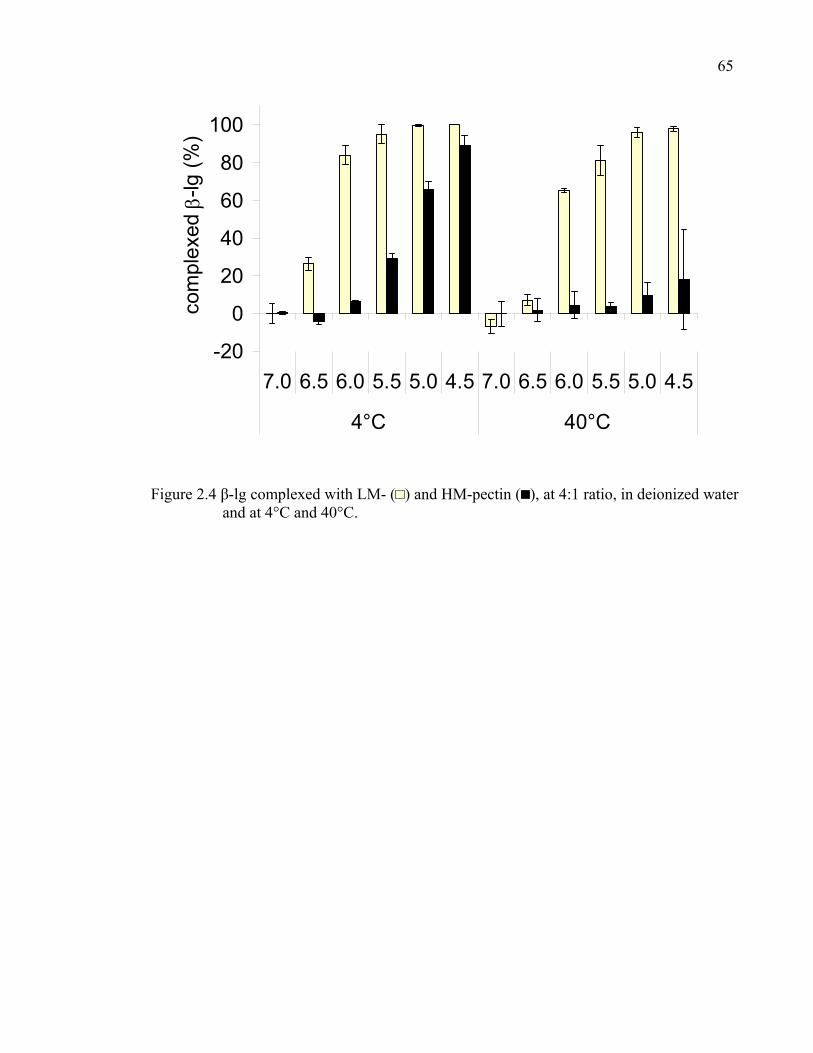
65
-20
0
20
40
60
80
100
7.0 6.5 6.0 5.5 5.0 4.5 7.0 6.5 6.0 5.5 5.0 4.5
4°C 40°C
com
plex
ed β
-lg (%
)
Figure 2.4 β-lg complexed with LM- ( ) and HM-pectin ( ), at 4:1 ratio, in deionized water and at 4°C and 40°C.
CHAPITRE 3: Quantification of the interactions between β-lactoglobulin and pectin through capillary electrophoresis analysis
Maude Girard, Sylvie L. Turgeon & Sylvie F. Gauthier
Centre de recherche en sciences et technologie du lait STELA
Faculté des sciences de l’agriculture et de l’alimentation
Université Laval
Québec, Qc, G1K 7P4, Canada
Sous presse Journal of Agricultural and Food Chemistry, 2003, 51.
67
3.1 RÉSUMÉ
Les paramètres d’interaction des complexes β-lactoglobuline (β-lg)/pectine
faiblement ou hautement méthylées (pectine LM ou HM) ont été déterminés par l’analyse
frontale continue en électrophorèse capillaire (FACCE), couplée au modèle mathématique
des sites d’interaction superposés. À pH 4, environ 23 molécules de β-lg sont liées de
manière coopérative sur la pectine LM. En se liant à la pectine LM, une molécule de β-lg
couvre en moyenne un espace de 12 résidus D-galA. La constante d’association calculée
dans ces conditions est de 1431 M-1. Les zones de la β-lg potentiellement réactives avec la
pectine ont été identifiées par une étude en ultrafiltration des interactions entre la pectine
LM et quatre peptides localisés en surface de la β-lg. Le peptide β-lg 132-148, qui
correspond à l’hélice α, et les peptides β-lg 76-83, 41-60 et 1-14 ont démontré une
interaction attractive avec la pectine. Ces zones peptidiques seraient potentiellement
impliquées lors de l’interaction de la β-lg avec la pectine.
68
3.2 ABSTRACT
Binding parameters of β-lactoglobulin (β-lg)/low- or high methoxyl pectin (LM- or
HM-pectin) complexes were determined using frontal analysis continuous capillary
electrophoresis (FACCE) and the overlapping binding site model. At pH 4, approximately
23 β-lg molecules are cooperatively complexed on LM-pectin, where each β-lg molecule
covers an average of 12 D-galA residues. The calculated binding constant under these
conditions is 1431 M-1. The interactions between pectin and four selected peptides located
on the outer surface of the β-lg were investigated using ultrafiltration in order to identify
which part of the protein was likely to interact with the pectin. The peptide β-lg 132-148,
which corresponds to the α-helix zone, and the peptides β-lg 76-83, 41-60, and 1-14
showed attractive interaction with the LM-pectin. Consequently, these peptides would
potentially be involved in the interaction between β-lg and the pectin.
69
3.3 INTRODUCTION
The use of biopolymers such as polysaccharides and proteins is increasing in the
pharmaceutical, cosmeceutical, nutraceutical and functional food industries. Interactions
between proteins and synthetic polymers have been largely investigated (Gao et al., 1997,
1998; Wang and Dubin, 1998; Hallberg and Dubin, 1998; Azegami et al., 1999; Xia et al,
1999; Kaibara et al., 2000; Hattori et al., 2000). Biopolymer interactions have been applied
in the development of intestinal patches for drug-controlled delivery (Zancong and
Mitragotri, 2002) and in polymeric nanoparticles used as carriers and protectors in oral
vaccines and gene therapy (Prokop et al., 2002).
β-lactoglobulin (β-lg) is the major protein of the bovine milk whey. This highly
nutritive protein possesses all the essential amino acids. The ability of β-lg to bind
hydrophobic ligand, such as vitamins or fatty acids, has been extensively studied.
Crystallographic studies have shown that molecules such as retinol, retinoic acid, palmitate,
and cholesterol were able to bind in the central hydrophobic calyx of the β-lg (Qin et al,
1998a; Wu et al., 1999; Sawyer and Kontopidis, 2000; Kontodipis et al., 2002). However,
the biological function of β-lg is still unknown (Kontodipis et al., 2002). The β-lg is a small
globular protein of 18,350 Da. The β-lg has a well-known structure (Sawyer et al., 1999)
containing mainly β-sheets, some β-turns and one α-helix. The quaternary structure of β-lg
is affected by pH conditions, mineral content, and temperature. The protein is monomeric at
very acidic pH (i.e., below 3) and alkaline pH (i.e., above 8), dimeric at neutral pH and
found in both states between pH 3 and 6 (Taulier and Chalikian, 2001). The presence of the
octameric form around pH 4.5 is likely to be negligible (McKenzie and Sawyer, 1967;
Taulier and Chalikian, 2001).
Pectin is a cell wall polysaccharide of plants generally extracted from apple pomace
or citrus fruits. Pectin is a soluble fiber that reduces the risks of colon cancer (Nangia-
Makker et al., 2002). This anionic polysaccharide is essentially made up of D-galA
residues. Few studies have been carried out on the quantification of β-
lactoglobulin/polysaccharide interactions. Measuring the binding parameters that
70 characterize protein/polysaccharide complexes is essential to accurately evaluate binding
conditions. Biopolymer interactions can be difficult to quantify because of the
heterogeneity of the natural material. Frontal analysis continuous capillary electrophoresis
(FACCE) was developed to study interacting homogeneous molecular weight systems (Gao
et al., 1997).
In this study, FACCE was used to separate the non-complexed (free) β-lg from the
pectin and the β-lg/pectin complexes, to plot the binding isotherms, and to calculate the
binding stoichiometry of the β-lg/pectin complexes. Results obtained with FACCE were
treated with the overlapping binding site model (McGhee and von Hippel, 1974). This
model was used to calculate the binding constant, the cooperativity parameter, and the
binding site size on the pectin.
Previous work has also revealed that interactions between β-lg and pectin occurred
via charged molecules and hydrogen bonding (Girard et al., 2002: Chapter 2). To identify
potential interacting zones on the β-lg, the interactions between four peptides on the outer
surface of β-lg and pectin were probed (Figure 3.1). The peptides β-lg 1-14 and 76-83 were
selected because of their positive net charge at acidic pH. β-lg 41-60 is a tryptic peptide
with good emulsifying properties (Turgeon et al., 1992a, b). The peptide β-lg 132-148,
which is part of the α-helix, was shown to interact with the acacia gum (Schmitt et al.,
2001).
71
3.4 MATERIALS AND METHODS
3.4.1 Materials
Bovine β-lg AB 95% pure protein (3X crystallized) was purchased from Sigma-
Aldrich Canada Ltd (Oakville, ON, Canada) and used without further purification. Peptides
β-lg 1-14 (LIVTQTMKGLDIQK), 41-60 (VYVEELKPTPEGDLEILLQK), 76-83
(TKIPAVFK), and 132-148 (ALEKFDKALKALPMHIR) were synthesized by the Eastern
Quebec Proteomics Core facility (Fastmoc technology) and used as received. Low-
methoxyl pectin (DE 28.3%, apparent molecular weight 94.3 kDa) and high-methoxyl
pectin (DE 73.4%, apparent molecular weight 105 kDa) were provided by Hercules
Copenhagen A/S (Copenhagen, Denmark). All reagents were of analytical grade and used
as received.
3.4.2 Preparation of solutions
β-lg, peptides β-lg 1-14, 41-60, 76-83, and 132-148, as well as low- or high-methoxyl
pectin (LM- or HM-pectin) were dispersed in 5 mM sodium phosphate buffer and stored
overnight at 4°C to ensure the complete hydration of molecules. The pectin and protein or
peptide solutions were mixed at molar ratios between 4:1 and 40:1 for protein/pectin
solutions and between 5:1 and 95:1 for peptide/pectin solutions keeping the pectin
concentration constant at 5 µM. All calculations involving β-lg were made using the
monomeric form as the unit. The pH of mixed protein/pectin solutions was adjusted to 4, 5,
or 6 and at pH 4 for the peptide/pectin solutions. Measures on protein/pectin solutions at
pH 5 in 50 mM sodium phosphate buffer were also carried out. The mixtures were stored
overnight at 22°C for interactions between molecules to occur.
3.4.3 Frontal analysis continuous capillary electrophoresis
Protein-polyelectrolyte interactions were studied with frontal analysis continuous
capillary electrophoresis (FACCE) (Wang and Dubin, 1998; Hattori et al., 2000). FACCE
72 is used to study slow binding kinetic systems since the equilibrium in the sample vial is
reached prior to the analysis. FACCE is an interesting technique for binding studies,
because it is not affected by the Donnan exclusion effect observed with ultrafiltration
membranes (Timmer et al., 1998; Noiseux et al., 2001; Girard et al., 2002: Chapter 2).
FACCE differs from conventional CE methods as it provides continuous sampling
throughout the analysis. Thus, each charged molecule is detected as a continuous plateau
instead of a peak. Generally 1 or 2 plateaus are obtained since the polysaccharide is often
undetected. Under a positive polarity (i.e., anode to cathode migration), the first eluting
plateau corresponds to the free protein, which is positively charged. The second plateau is
added to the first and corresponds to the protein complexed with the polysaccharide (Gao et
al., 1997). The concentration of the free protein was determined using a calibration curve
from known protein concentrations.
FACCE was carried out on a Hewlett-Packard HP3DCE provided with a UV diode
array detector (Agilent Technologies Inc, Mississauga, ON, Canada). The bare-fused-silica
capillary used (i.d. 50 mm) had a total length of 33 cm and an effective length of 24.5 cm
(Agilent Technologies Inc, Mississauga, ON, Canada). The temperature of the cassette was
maintained at 22 ± 0.1°C. The detection wavelength was 200 nm to prevent pectin from
absorbing. Before each analysis, the capillary was flushed with NaOH 0.1 N for 3 min and
equilibrated for 5 min with 5 or 50 mM sodium phosphate buffer at sample pH. The sample
was introduced electrokinetically in the capillary (intrinsic to the FACCE method) for 30
min with 9 kV applied with positive polarity. The capillary was rinsed daily with NaOH 0.1
N 15 min, followed by water for 5 min and then dried.
3.4.4 Ultrafiltration
Interactions between peptides and LM-pectin were studied with an ultrafiltration
method previously described (Noiseux et al., 2001; Girard et al., 2002: Chapter 2).
Peptide/pectin mixtures were shaken gently; 100 µL of the mixtures were ultrafiltrated by
centrifugation at 10,000 g for 25 minutes at 22°C through 10 kDa MWCO Microcon®
devices (Millipore, Bedford, MA). The membrane retained the pectin and the complexes,
73 while the free peptides passed through the membrane. The free peptides recovered in the
ultrafiltration permeate were assayed with the bicinchoninic acid assay (Smith et al., 1985).
3.4.5 Calculation of the binding parameters
Given the non-specific nature of the complexation and the large size of the ligand
(protein) relative to the macromolecule (pectin), the mathematical model used had to take
into account the possibility of overlapping binding sites. Namely, the fact that β-lg could
occupy more than one binding site on the pectin had to be considered so as to prevent any
overestimation of the potential binding sites on the pectin. According to the binding model
of McGhee and von Hippel (1974) adapted from the Scatchard plot (Scatchard, 1949),
complexation between ligand and macromolecule, including ligand-ligand interactions, can
be expressed with the equation 22.
(22) ( )21n
)n1(2R)1n(1
)n1)(1(2R)n1)(12(n1K
L ⎟⎟⎠
⎞⎜⎜⎝
⎛ν−+ν+−
×⎟⎟⎠
⎞⎜⎜⎝
⎛ν−−ω−ν+ν−−ω
×ν−=ν
−
)n1(4))1n(1(R 2 ν−ων+ν+−=
Where L is the free ligand concentration (M), K is the binding constant (M-1), n is the
average size of the binding site (D-galA residues covered with a β-lg monomer), ν is the
binding density (number of β-lg complexed per D-galA residue), and ω is the cooperativity
parameter (unitless). The cooperativity parameter assesses ligand-ligand interactions. It has
a negative value when the interactions are repulsive or anticooperative, a positive value for
attractive or cooperative interactions, and is null when no interactions are involved between
ligand molecules.
Results obtained with FACCE and UF were used to obtain the binding isotherms of
the β-lg or peptide/LM- or HM-pectin mixtures through plotting the binding density (ν
against the free β-lg concentration (L). The L parameter could be directly calculated from
the FACCE and UF results. Given that the LM- and HM-pectin used contained 80% of D-
galA and that their apparent molecular weights are known, their average D-galA content
74 was approximated to 420 and 507 residues per LM- and HM-pectin molecule, respectively.
Therefore, the ν parameter could be obtained from the total β-lg or peptide molecules
complexed divided by 420 and 507. The saturation of pectin estimated from the binding
isotherms made it possible to calculate the binding stoichiometry (N) expressed as β-lg or
peptide molecules per pectin molecule.
The binding constant, cooperativity parameter, and binding site size could be
determined by the non-linear least square fitting of ν/L plotted against ν. Each β-lg or
peptide/pectin ratio was assessed in duplicates. The JMP IN® software was used for the
curve fitting (SAS Institute Inc, USA).
75
3.5 RESULTS
Figure 3.2 shows a typical electropherogram obtained for the β-lg containing
solutions. The single plateau corresponds to the UV-absorbance of the free β-lg, which was
positively charged. Similar results obtained with UF (results not shown) confirmed that the
single plateau was not caused by similar migration times of the free and complexed protein.
The absence of the second plateau is explained by the lack of positive charges on β-
lg/pectin complexes, which prevented their introduction into the capillary.
The binding isotherms of the β-lg/LM-pectin mixtures at pH 4, 5, and 6, and in 50
mM sodium phosphate buffer at pH 5 are illustrated on Figure 3.3. The amount of β-lg
complexed with LM-pectin was negligible at pH 6. At pH 5, the amount of β-lg/LM-pectin
complexes dramatically decreased as the phosphate buffer concentration was increased
from 5 to 50 mM. At this pH, there was about 0.018 and 0.003 β-lg molecule complexed
per D-galA residue for a free β-lg concentration around 15 µM in 5 and 50 mM phosphate
buffer, respectively. At pH 4 in 5 mM phosphate buffer, 0.025 monomer of β-lg were
complexed on each D-galA residue, corresponding to the appearance of a small plateau at
free β-lg values between 15 and 20 µM. From these binding isotherms, the saturation of a
D-galA residue with β-lg could be approximated with the end of the curves. At this point,
the higher amount of complexed β-lg with an increasing protein/pectin ratio was almost
stopped indicating pectin saturation. A D-galA residue of the LM-pectin reached saturation
at 0.019 and 0.055 β-lg molecule in 5 mM phosphate buffer at pH 5 and 4 respectively. At
pH 5 in a 50 mM phosphate buffer, the saturation of a D-galA residue was reached with
0.008 β-lg molecule. Figure 3.4 shows the binding isotherms obtained with the HM-pectin.
At free β-lg concentration around 15 µM in 5 mM phosphate buffer, an average of 0.002
and 0.015 β-lg molecule is complexed on each D-galA residue at pH 5 and 4 respectively.
There were no more β-lg molecules complexed at pH 5 with a 50 mM phosphate buffer
concentration. At pH 5 and 4, the D-galA residue reached saturation at 0.003 and 0.025 β-lg
molecule, respectively. No significant complexation was noticed at pH 6 (not shown).
76
Given that there were approximately 420 and 507 D-galA residues per LM- and HM
pectin molecules respectively, the binding stoichiometry (N) of complexes could be
calculated using the pectin saturation values presented above and reported in Table 3.1. At
pH 5 and 4, approximately 23 and 8 β-lg monomers were complexed per LM-pectin
molecule and 13 and 2 β-lg monomers were complexed on the HM-pectin. The binding
constants (K) show that LM-pectin is more reactive than the HM-pectin as it was the case
with the binding isotherms. The binding constant decreased at higher pH values. The
positive cooperativity values (ω) indicate an attractive interaction between β-lg molecules,
especially as they complex with the LM-pectin at pH 5. Consequently, the β-lg molecules
would be complexed on the pectin, preferably near one another. The binding site size
values n on LM-pectin show that a β-lg monomer covers about 15 D-galA residues, except
at pH 5 where the β-lg covered approximately 50 residues. Under the same conditions, the
HM-pectin would have a binding site slightly larger than that of the LM-pectin. An
increasing concentration of the phosphate buffer leads to lower values of binding
stoichiometry, binding constant, cooperativity, and binding site size.
In order to identify the potential reactive zones on the β-lg, assays were carried out
under the most reactive conditions i.e., with LM-pectin at pH 4. FACCE was not used with
peptides because of serious migration difficulties and lack of reproducibility. The peptides
should be analyzed with a coated capillary to prevent interactions between the negative
silanol groups on the capillary wall and the positive charges of the peptides. Therefore, the
ultrafiltration technique was used to study the interactions between the four selected
peptides (i.e., β-lg 1-14, 41-60, 76-83, and 132-148) and the LM-pectin. From the free
peptide concentrations L, the binding density values ν could be determined.
Binding isotherms obtained by means of plotting the binding density against the free
peptide concentrations are presented in Figure 3.5. At a free peptide concentration around
50 µM, an average of 0.005, 0.01, 0.04, and 0.06 molecules of the peptides β-lg 1-14, 41-
60, 132-148, and 76-83, respectively, were complexed on each D-galA residue. From these
binding isotherms, the approximated saturation of a D-galA residue with peptides β-lg 1-
14, 41-60, 132-148, and 76-83 were respectively 0.02, 0.04, 0.06, and 0.07 molecule. The
77 stoichiometry values of the peptide/LM-pectin complexes are presented in Table 3.2.
Binding constants values (K) of the different peptides increased, as did the cooperativity
parameter and stoichiometry values. The cooperative values (ω) showed attractive
interactions between the peptides complexed on the LM-pectin. All peptides covered about
15 D-galA residues. Although the binding constants for the peptides β-lg 41-60 and 132-
148 were almost equivalent, the stoichiometry and the cooperative behavior for β-lg 41-60
are not as pronounced as those obtained for the peptide β-lg 132-138.
78
3.6 DISCUSSION
The β-lg/pectin complexes are maintained by ionic interactions and hydrogen
bonding (Girard et al., 2002: Chapter 2). Thus, the pectin is not complexed through the
hydrophobic zone of the protein as it was observed for small ligands, such as retinol,
retinoic acid, palmitate, and cholesterol (Sawyer and Kontopidis, 2000). The stoichiometry
of the complexes drops off with increasing pH values, because of the negative net charges
appearing over the isoelectric point (IEP) of the protein (5.1). Hence, the amount of β-lg
complexed on pectin is greatly increased under the protein’s IEP. The pH and ionic strength
are parameters that mainly influence electrostatic interactions (Burgess, 1990; van Oss,
1993; Xia and Dubin, 1994). The amount of β-lg (18 kDa) complexed on each LM-pectin
molecule (94.3 kDa) at pH 4 is quite high considering the relative molecular weights of the
molecules. Under the same conditions, isothermal titration calorimetry (ITC) revealed that
interpolymer complexes had a binding stoichiometry of 25 β-lg monomer/LM-pectin
(Girard et al., 2003: Chapter 4). Also, the plateau noticed at pH 4 may indicate that a
critical binding stoichiometry may be needed to achieve a higher complexation extent.
According to the Tainaka theory (Tainaka, 1979, 1980), protein and polyelectrolyte
complexation is a two-step process. The first step corresponds to the formation of
intrapolymer complexes, whereas the second is the aggregation of the latter to obtain
interpolymer complexes. At pH 5, only 8 lg monomers were complexed with LM-pectin.
This value corresponds to the binding stoichiometry of β-lg/LM-pectin intrapolymer
complexes at pH 4 measured with ITC (Girard et al., 2003: Chapter 4). Consequently, β-
lg/LM-pectin intrapolymer complexes probably aggregate in interpolymer complexes
between pH 4 and 5.
The electrostatic nature of the interactions is confirmed by the screening effect on
both β-lg and pectin charges as the buffer concentration increases from 5 to 50 mM. The
increased ionic strength decreases the initial pH of intrapolymer and interpolymer
complexes formation. Therefore, an increase in ionic strength reduces the amount of
interpolymer complexes and consequently the binding stoichiometry and binding constants.
Even though HM-pectin had a higher molecular weight than the LM-pectin, there were
79 always fewer amounts of complexed protein molecules as well as lower binding constants.
This is explained with the higher amounts of carboxyl groups on the LM-pectin involved in
the interaction with the β-lg. FACCE has shown that 13 and 23 β-lg monomers were
complexed at pH 4 on the HM-pectin and LM-pectin respectively. The stoichiometry value
obtained with HM-pectin is almost half the value obtained previously with ITC (Girard et
al., 2003: Chapter 4). This difference could be explained by the polarizing effect of the
electric field used in CE that could decrease, to some extent, hydrogen bonding in the
complexes. Hydrogen bonding was shown to be more important in the complexes
containing HM-pectin compared to those containing LM-pectin (Girard et al., 2002:
Chapter 2). Interactions were stronger with lower pectin DE, because of the higher amount
of carboxyl groups responsible for the interactions with the β-lg. It was previously shown
with ultrafiltration that LM-pectin was more reactive with β-lg than with HM-pectin
(Girard et al., 2002: Chapter 2).
The complexation may reveal a cooperative behavior between protein molecules (Li
et al., 1996), which can be detected from both the curvature of the binding isotherm and the
fitting values. As for the binding isotherm, it was not always clear whether or not the
complexation was cooperative. However, it was obvious from the fitting values that the β-
lg molecules complexed on the LM-pectin were cooperative. The pH and ionic strength had
a moderate-to-high effect on the cooperative behavior of β-lg/LM- or HM-pectin mixture
complexes. The higher cooperativity at pH 5 in 5 mM phosphate buffer can be explained by
the protein’s weak net charge around its IEP, which promotes β-lg/β-lg interaction. The
lower cooperative behavior observed at pH>IEP is explained by the net negative charge of
the protein resulting in coulombic repulsion between the β-lg molecules. Moreover, the
lower cooperativity observed at pH 4 is also explained by repulsive forces between the
positively charged β-lg molecules. The screening effect by the higher buffer concentrations
lowered the attraction between the molecules and then the cooperativity. The
noncooperative behavior of β-lg with HM-pectin at pH 5 can be explained by the lower
amounts of carboxylic groups. These groups are sufficiently dispersed on the backbone of
the pectin to prevent the protein molecules from complexing near one another. A previous
study showed that the β-lg was highly cooperative (ω = 128) with sodium polystyrene
80 sulfonate (NaPSS) at pH 7.5 in 100 mM phosphate buffer and least cooperative (ω = 3) at
pH 6.7 in 50 mM of the same buffer (Gao et al., 1998).
There is a tendency for the HM-pectin to have a larger binding site size. This trend is
hard to explain since β-lg was expected to occupy the same volume while complexing on
LM- or on HM-pectin. The larger binding site size observed at pH 5 for LM- and HM-
pectin can be explained by β-lg/β-lg interactions around protein’s IEP. A β-lg molecule
interacting with other protein molecules may occupy a larger space on the pectin. This is in
agreement with the higher cooperativity observed at this pH value for LM-pectin. The
binding site size of the β-lg/sodium poly (2-acrylamido-2-methylpropanesulfonate)
complexes was dependent of both pH and ionic strength (Hattori et al., 2000). However, the
binding site size of the β-lg/NaPSS complexes was independent of the pH and ionic
strength because of the hydrophobic interactions involved (Gao et al., 1998).
The negatively charged macromolecules would interact with β-lg at more than one
binding site (Fogolari et al., 2000). Consequently, the pectin is likely to interact through
more than one amino acid zones on the β-lg. Circular dichroism revealed the involvement
of the α-helix of β-lg in the interaction with acacia gum (Schmitt et al., 2001). However,
this technique could not be used to identify interacting zones having no particular
secondary structures. The potential interacting zones on the β-lg are supposed to be
positively charged and located on the outer surface of the protein.
Ultrafiltration and the overlapping binding site model were used to determine the
binding parameters of the four selected β-lg peptides/LM-pectin complexes. The β-lg
peptides had their stoichiometry, binding constants, and cooperativity parameter in
decreasing order: 76-83, 132-148, 41-60, and 1-14. The primary structures of the peptides
can explain these reactivity differences. The peptide β-lg 76-83 was the most reactive,
because of its small size and its 2+ net charge from the Lys77 and Lys83 residues. The
second most reactive peptide was the β-lg 132-148 with a 3+ net charge. It had 5 positive
charges coming from the Lys135, Lys138, Lys141, His146, and Arg148 residues and 2 negative
charges originating from the Glu134 and Asp137 amino acids that are still not protonated at
pH 4 (Fogolari et al., 2000). According to its net charge, the peptide β-lg 132-148 should be
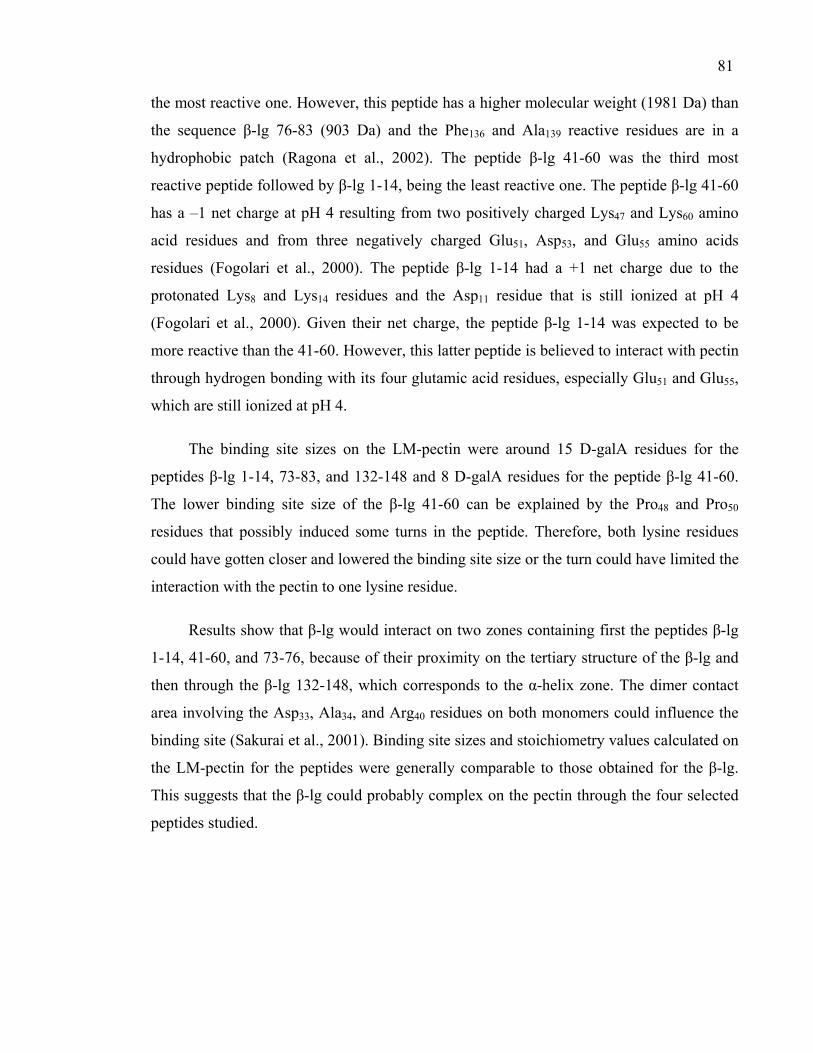
81 the most reactive one. However, this peptide has a higher molecular weight (1981 Da) than
the sequence β-lg 76-83 (903 Da) and the Phe136 and Ala139 reactive residues are in a
hydrophobic patch (Ragona et al., 2002). The peptide β-lg 41-60 was the third most
reactive peptide followed by β-lg 1-14, being the least reactive one. The peptide β-lg 41-60
has a –1 net charge at pH 4 resulting from two positively charged Lys47 and Lys60 amino
acid residues and from three negatively charged Glu51, Asp53, and Glu55 amino acids
residues (Fogolari et al., 2000). The peptide β-lg 1-14 had a +1 net charge due to the
protonated Lys8 and Lys14 residues and the Asp11 residue that is still ionized at pH 4
(Fogolari et al., 2000). Given their net charge, the peptide β-lg 1-14 was expected to be
more reactive than the 41-60. However, this latter peptide is believed to interact with pectin
through hydrogen bonding with its four glutamic acid residues, especially Glu51 and Glu55,
which are still ionized at pH 4.
The binding site sizes on the LM-pectin were around 15 D-galA residues for the
peptides β-lg 1-14, 73-83, and 132-148 and 8 D-galA residues for the peptide β-lg 41-60.
The lower binding site size of the β-lg 41-60 can be explained by the Pro48 and Pro50
residues that possibly induced some turns in the peptide. Therefore, both lysine residues
could have gotten closer and lowered the binding site size or the turn could have limited the
interaction with the pectin to one lysine residue.
Results show that β-lg would interact on two zones containing first the peptides β-lg
1-14, 41-60, and 73-76, because of their proximity on the tertiary structure of the β-lg and
then through the β-lg 132-148, which corresponds to the α-helix zone. The dimer contact
area involving the Asp33, Ala34, and Arg40 residues on both monomers could influence the
binding site (Sakurai et al., 2001). Binding site sizes and stoichiometry values calculated on
the LM-pectin for the peptides were generally comparable to those obtained for the β-lg.
This suggests that the β-lg could probably complex on the pectin through the four selected
peptides studied.

82
3.7 CONCLUSION
The higher amounts of carboxyl groups enabled the LM-pectin to complex more
proteins than HM-pectin. The β-lg could possibly complex on pectin through its amino acid
zones 76-83, 132-148, 41-60, and 1-14. FACCE used with the overlapping binding site
model is an efficient tool to carry out binding studies involving biopolymers such as
proteins and polysaccharides. However, studies with peptides should be performed with
coated capillaries to prevent their interaction with the capillary wall. FACCE is an
inexpensive technique, because it requires only a small sample and no UF devices. FACCE
was successfully used to obtain quantitative data on the β-lg/pectin complexes. The effect
of the electric field on the dissociation of weak electrostatic complexes should be not
neglected. Consequently, binding parameters and some thermodynamic aspects were
assessed with isothermal titration calorimetry and presented in the Chapter 4.
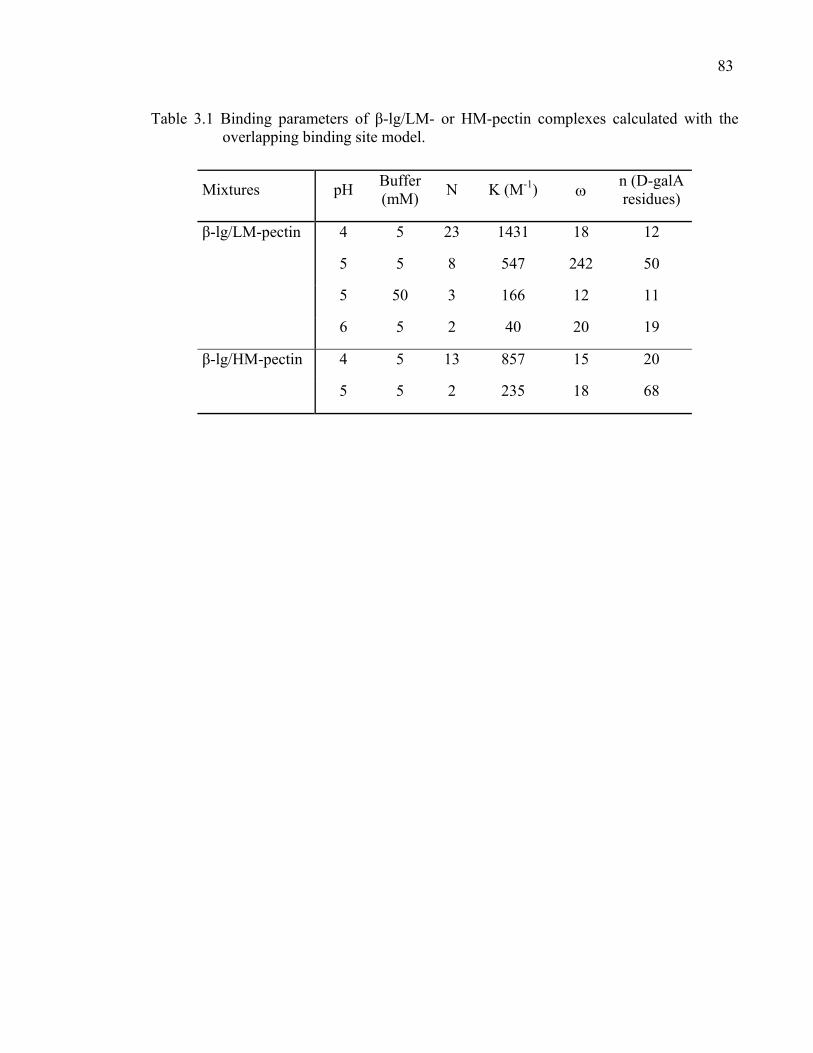
83
Table 3.1 Binding parameters of β-lg/LM- or HM-pectin complexes calculated with the overlapping binding site model.
Mixtures pH Buffer (mM) N K (M-1) ω n (D-galA
residues)
4 5 23 1431 18 12
5 5 8 547 242 50
β-lg/LM-pectin
5 50 3 166 12 11
6 5 2 40 20 19
4 5 13 857 15 20 β-lg/HM-pectin
5 5 2 235 18 68
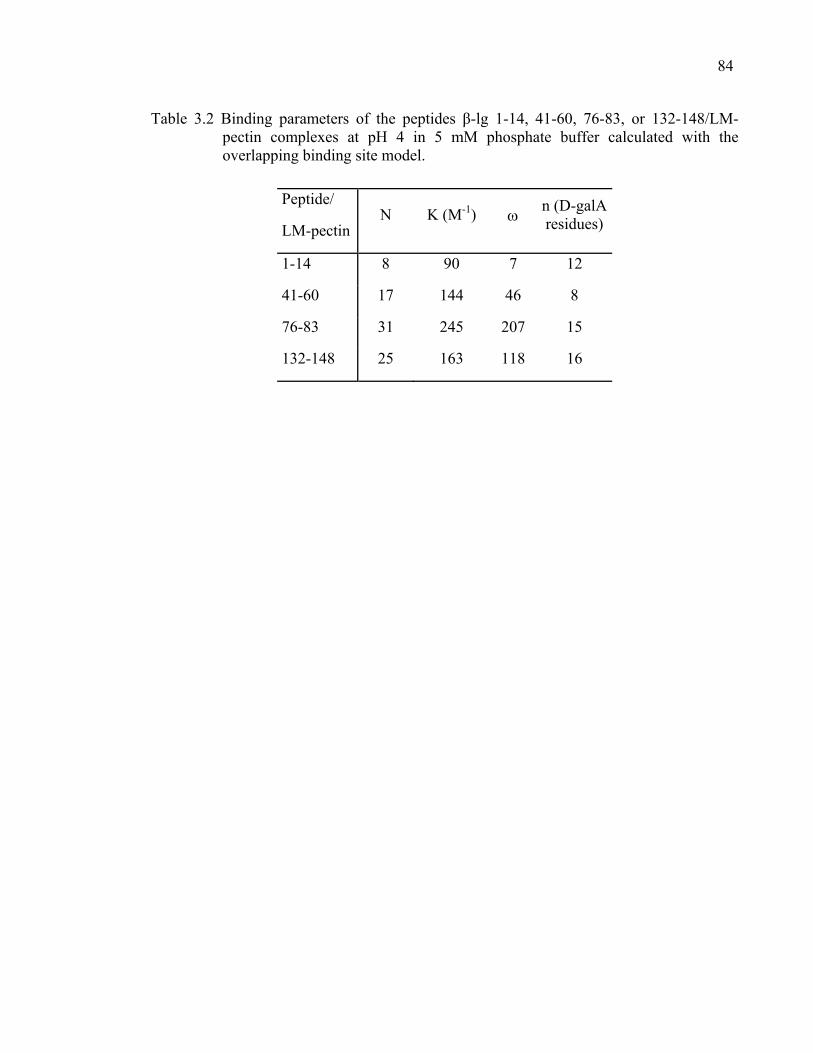
84
Table 3.2 Binding parameters of the peptides β-lg 1-14, 41-60, 76-83, or 132-148/LM-pectin complexes at pH 4 in 5 mM phosphate buffer calculated with the overlapping binding site model.
Peptide/
LM-pectinN K (M-1) ω n (D-galA
residues)
1-14 8 90 7 12
41-60 17 144 46 8
76-83 31 245 207 15
132-148 25 163 118 16
85
1-14
132-148
41-60
76-83
1-14
132-148
41-60
76-83
Figure 3.1 Localization of the selected peptides on the β-lactoglobulin molecule. β-lg structure was from Qin et al. (1998b) and was reproduced (3BLG image) from Protein Data Bank Server.
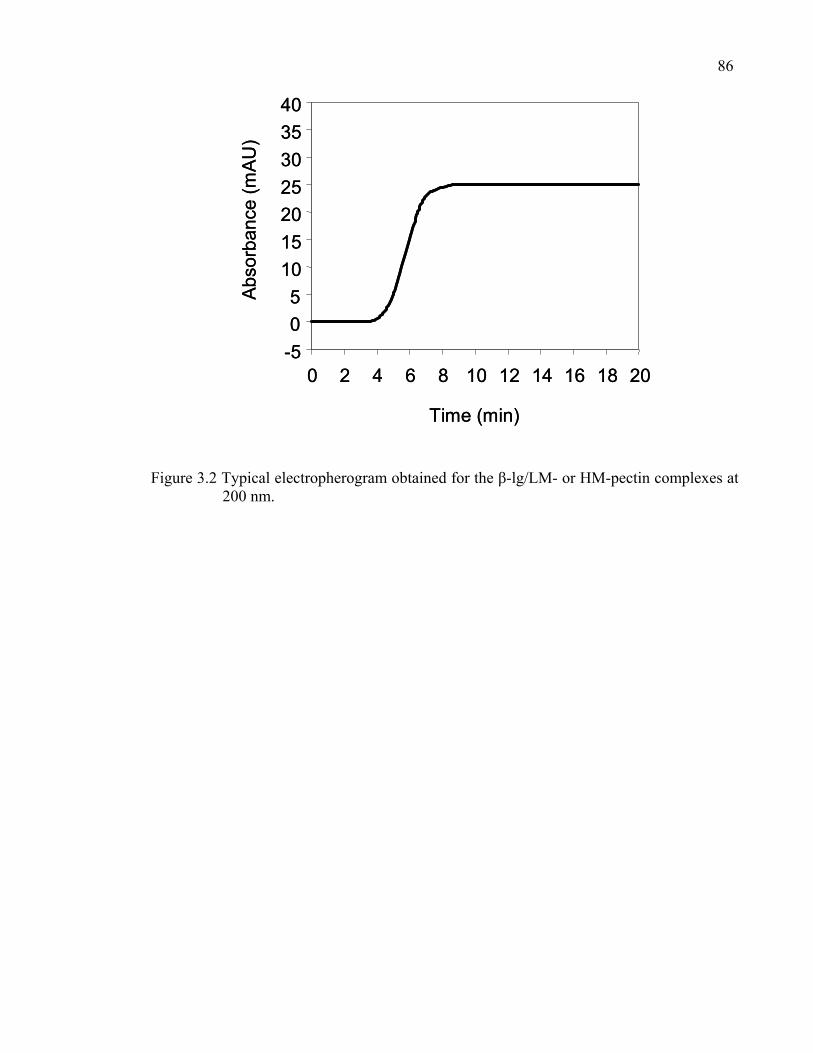
86
-505
10152025303540
0 2 4 6 8 10 12 14 16 18 2
Time (min)
Abso
rban
ce (m
AU)
0-505
10152025303540
0 2 4 6 8 10 12 14 16 18 2
Time (min)
Abso
rban
ce (m
AU)
0
Figure 3.2 Typical electropherogram obtained for the β-lg/LM- or HM-pectin complexes at 200 nm.
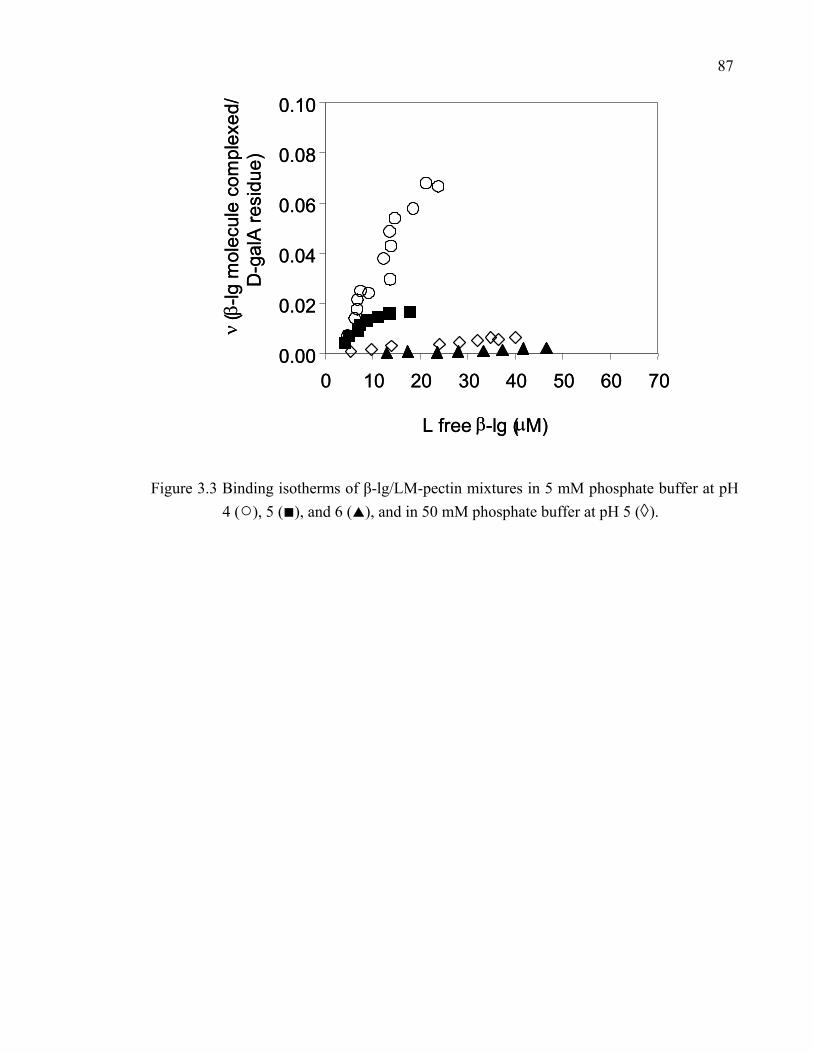
87
0.00
0.02
0.04
0.06
0.08
0.10
0 10 20 30 40 50 60 7
L free β-lg (µM)
ν(β
-lg m
olec
ule
com
plex
ed/
D-g
alA
resi
due)
00.00
0.02
0.04
0.06
0.08
0.10
0 10 20 30 40 50 60 7
L free β-lg (µM)
ν(β
-lg m
olec
ule
com
plex
ed/
D-g
alA
resi
due)
0
Figure 3.3 Binding isotherms of β-lg/LM-pectin mixtures in 5 mM phosphate buffer at pH 4 (○), 5 (■), and 6 ( ), and in 50 mM phosphate buffer at pH 5 (◊).
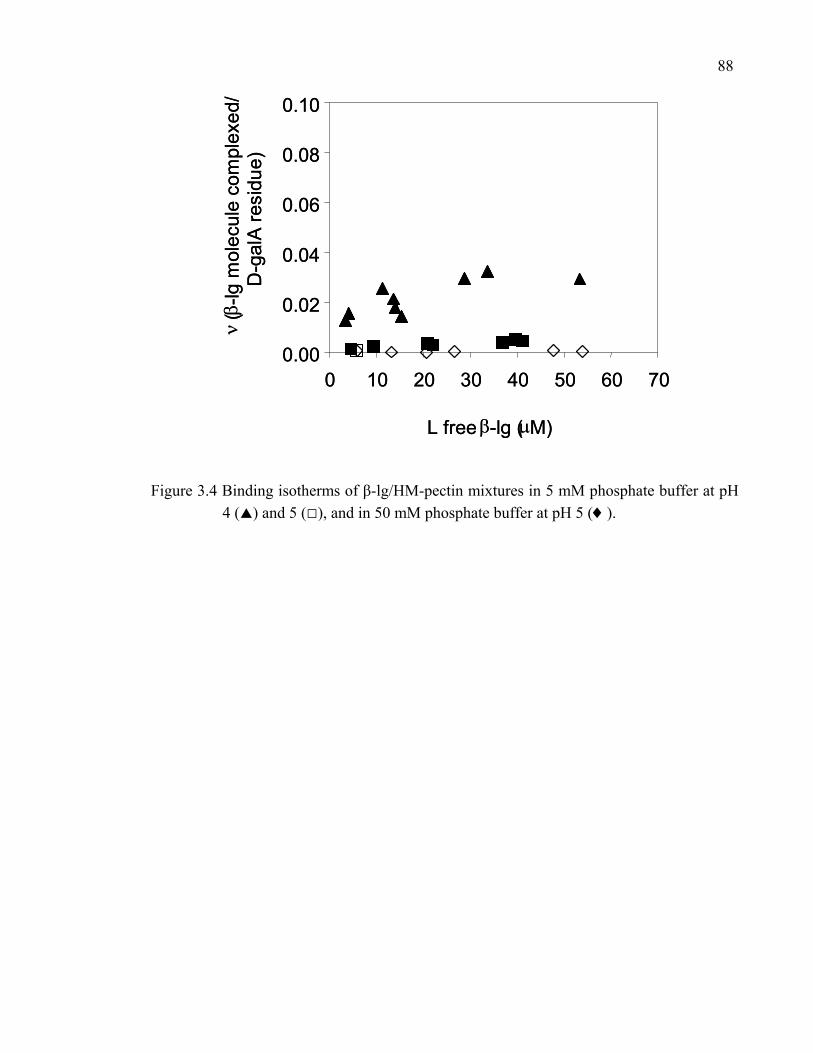
88
0.00
0.02
0.04
0.06
0.08
0.10
0 10 20 30 40 50 60 7
L free β-lg (µM)
ν(β
-lg m
olec
ule
com
plex
ed/
D-g
alA
resi
due)
00.00
0.02
0.04
0.06
0.08
0.10
0 10 20 30 40 50 60 7
L free β-lg (µM)
ν(β
-lg m
olec
ule
com
plex
ed/
D-g
alA
resi
due)
0
Figure 3.4 Binding isotherms of β-lg/HM-pectin mixtures in 5 mM phosphate buffer at pH 4 ( ) and 5 (□), and in 50 mM phosphate buffer at pH 5 (♦).
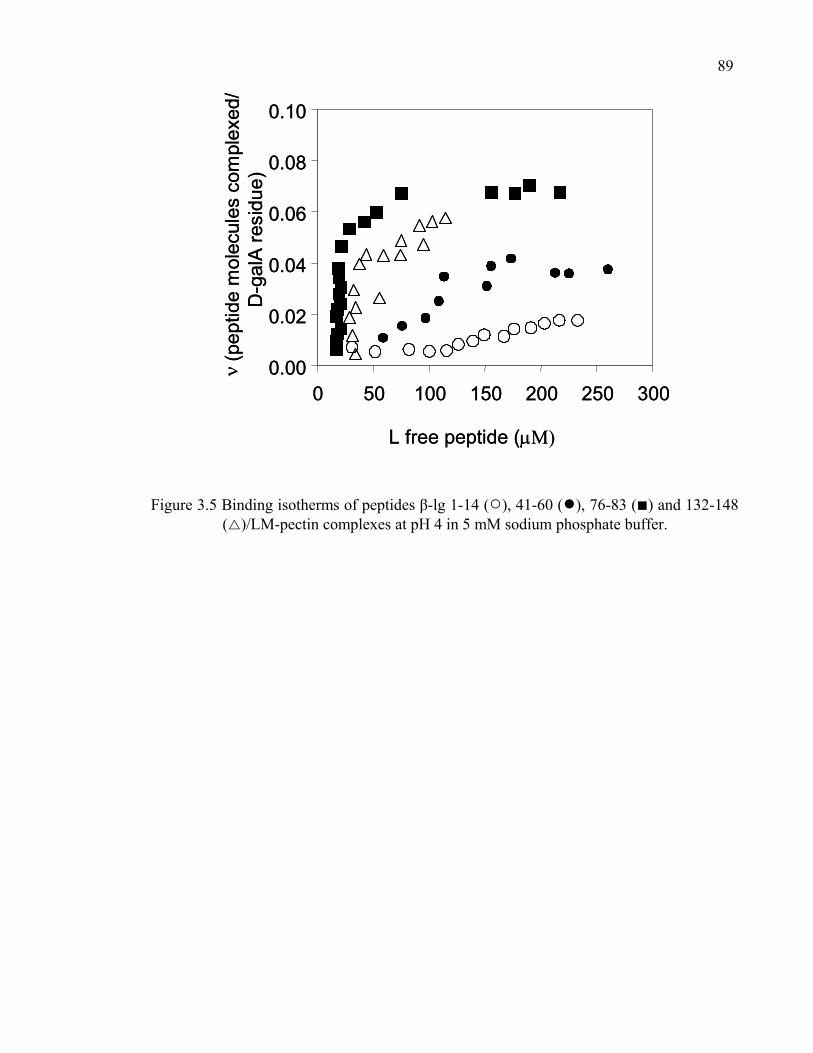
89
0.00
0.02
0.04
0.06
0.08
0.10
0 50 100 150 200 250 300
L free peptide (µM)
ν(p
eptid
e m
olec
ules
com
plex
ed/
D-g
alA
resi
due)
0.00
0.02
0.04
0.06
0.08
0.10
0 50 100 150 200 250 300
L free peptide (µM)
ν(p
eptid
e m
olec
ules
com
plex
ed/
D-g
alA
resi
due)
Figure 3.5 Binding isotherms of peptides β-lg 1-14 (○), 41-60 (●), 76-83 (■) and 132-148 ( )/LM-pectin complexes at pH 4 in 5 mM sodium phosphate buffer.
CHAPITRE 4: Thermodynamic parameters of β-lactoglobulin/pectin complexes assessed by isothermal titration calorimetry
Maude Girard, Sylvie L. Turgeon & Sylvie F. Gauthier
Centre de recherche en sciences et technologie du lait STELA
Faculté des sciences de l’agriculture et de l’alimentation
Université Laval
Québec, Qc, G1K 7P4, Canada
Publié dans Journal of Agricultural and Food Chemistry 2003, 51, 4450-4455.
91
4.1 RÉSUMÉ
Le titrage calorimétrique isothermique (ITC) a été utilisé pour déterminer la constante
d’association, la stoechiométrie, l’enthalpie et l’entropie des complexes β-lactoglobuline
(β-lg)/pectine faiblement ou hautement méthylée (pectine LM ou HM) à pH 4 et à 22°C.
D’après les isothermes d’interaction, la complexation entre la β-lg et la pectine s’effectue
en deux étapes correspondant à la formation de complexes intrapolymères suivie par une
agrégation en complexes interpolymères. La complexation entre la β-lg et la pectine LM ou
HM est spontanée lors de la formation des complexes intra et interpolymères avec une
énergie libre de Gibbs approximative de -10 kcal·mol-1. La formation des complexes
intrapolymères est conduite par une enthalpie favorable alors que l’agrégation en
complexes interpolymères est le résultat de facteurs enthalpique et entropique. Les valeurs
négatives d’enthalpie mesurées en ITC pourraient être dues en partie à des changements
conformationnels de la pectine et de la β-lg lors de l’interaction.
92
4.2 ABSTRACT
Isothermal titration calorimetry (ITC) was used to determine the binding constant,
stoichiometry, enthalpy, and entropy of β-lactoglobulin (β-lg)/low- or high-methoxyl pectin
(LM- or HM-pectin) complexes at 22°C and at pH 4. The binding isotherms revealed the
formation of soluble intrapolymer complexes further followed by their aggregation in
interpolymer complexes. The interaction between β-lg and LM- or HM-pectin in intra and
interpolymer complexes occurred spontaneously with a Gibbs free energy around -10
kcal·mol-1. The intrapolymer complexes were enthalpically driven, whereas enthalpic and
entropic factors were involved in the formation of interpolymer complexes. Because ITC
did not allow dissociating different enthalpic contributions, the values measured as pectin
and β-lg interacted could partially be attributed to conformational changes.
93
4.3 INTRODUCTION
The β-lactoglobulin (β-lg) is a small globular protein of 18,350 Da. The β-lg has a
well-known structure containing mainly β-sheets, some β-turns, and one α-helix (Sawyer et
al., 1999). Its quaternary structure is influenced by pH, mineral content, and temperature.
This protein is monomeric at pH below 3 or above 8, dimeric at neutral pH, and found in
both states between pH 4 and 6 (Taulier and Chalikian, 2001). The β-lg may form a few
octamers around pH 4.5 (Pessen et al., 1985), but some authors are doubtful about the
existence of such an assembly (McKenzie and Sawyer, 1967; Taulier and Chalikian, 2001).
Pectin is a cell-wall polysaccharide, generally extracted from apple pomace or citrus fruits.
This anionic polysaccharide is essentially made up of D-galA residus. High-methoxyl
pectin (HM-pectin) occurs when more than 50% of its carboxylic groups are esterified,
whereas low-methoxyl pectin (LM-pectin) is found when less than 50% of these groups are
esterified (Voragen et al., 1995).
The interactions between proteins and polysaccharides can lead to the formation of
complexes. These complexes, or coacervates, have many applications, including fat
substitution (Laneuville et al., 2000), protein separation (Dubin et al., 1994),
microencapsulation (Burgess, 1994), and enzyme immobilization (Kokufuta, 1992). The
nature of protein/polysaccharide complexes is influenced by entropic factors, such as the
structure, and the molecular weight of biopolymers. The complexes are also influenced by
enthalpic forces, which are regulated by the protein/polysaccharide ratio and the nature and
density of charges on the biopolymers. Many studies on protein/polysaccharide interactions
have been carried out (Serov et al., 1985; Gurov et al., 1988; Tolstoguzov, 1991, 2002).
Ultrafiltration used with destabilizing agents showed that interactions between β-lg and
pectin occurred through ionic and hydrogen bonds, whereas the hydrophobic interactions
were negligible (Girard et al., 2002: Chapter 2). The measurement of thermodynamic
parameters, such as binding constant, enthalpy, entropy, and binding stoichiometry of
interactions, is essential to accurately evaluate binding conditions. Binding parameters from
biopolymer systems are sometimes hard to quantify because of the heterogeneity of the
natural material. Consequently, few quantitative studies have been carried out on the
94 interactions between β-lg and polysaccharides (Girard et al., 2003: Chapter 3).
Thermodynamic quantities involved in biopolymer interactions are often indirectly
determined through non-calorimetric experimental methods (O’Brien et al., 2001). These
methods involve the calculation of thermodynamic parameters from theoretical
relationships.
Enthalpy variations (i.e., gain and loss) are the easiest thermodynamic parameters to
measure during complexation. Isothermal titration calorimetry (ITC) is currently the only
technique used to directly measure the enthalpy for many ternary mixtures (O’Brien et al.,
2001). ITC was used to study the interaction between β-lg and LM- or HM-pectin at pH 4
in 5 mM of sodium phosphate buffer. To our knowledge, this technique has not yet been
used to carry out a binding study involving two biopolymers having heterogeneous
molecular weights.
95
4.4 MATERIALS AND METHODS
4.4.1 Materials
Bovine β-lg A & B (3X crystallized) was purchased from Sigma-Aldrich Canada Ltd
(Oakville, On, Canada) as 95% pure protein. Low-methoxyl pectin (DE 28.3%, apparent
molecular weight 94.3 kDa) and high-methoxyl pectin (DE 73.4%, apparent molecular
weight 118 kDa) were donated by Hercules Copenhagen A/S (Copenhagen, Denmark). All
reagents were of analytical grade and used as received.
4.4.2 Preparation of solutions
To eliminate excess salts, β-lg and LM- and HM-pectin were dialyzed against
deionized water for 24 hours at 4°C. Afterwards, β-lg and LM- or HM-pectin were dialyzed
extensively in the same beaker against a 5-mM phosphate buffer (pH 4) to equilibrate the
pH and ionic strength of the solutions. The weak concentration of the buffer was used to
prevent dissociation of β-lg and pectin complexes, which are very sensitive to ionic
strength as demonstrated earlier (Girard et al., 2002: Chapter 2). The dialysis buffer was
preserved for ITC experiments. The dialysis was critical to avoid inaccuracies inherent to
buffer mismatching. Ionic strength or pH differences could have lead to modifications in
the dimer/monomer equilibrium of the β-lg (Taulier and Chalikian, 2001; Sakurai et al.,
2001). The β-lg, LM- and HM-pectin solutions and buffer were filtrated through a 0.22-µm
membrane to eliminate insoluble particles. The concentration of dialyzed β-lg was
measured with the bicinchoninic acid protein assay (Smith et al., 1985). The LM- and HM-
pectin concentrations were assayed with the phenol-sulfuric acid method (Dubois et al.,
1956). A dialysis buffer was used as solvent to adjust the LM- or HM-pectin and β-lg
solutions around 10 and 1500 µM (monomeric equivalent) respectively. All solutions were
degassed 10 minutes at 20°C prior to ITC measurements by means of a device provided
with the ITC apparatus.
96
4.4.3 Isothermal titration calorimetry (ITC)
An isothermal titration calorimeter (VP-ITC, Microcal Inc., Northampton, MA) was
used to measure enthalpy values. After setting the temperature of solutions at 20°C in the
degassing device, the apparatus was equilibrated at 22°C for at least half an hour before the
measurement. The LM- or HM-pectin solution in the 1.445-mL reaction cell was titrated
with 50 successive 5-µL injections of β-lg solution. Each addition lasted 12 s with an
interval of 800 s between consecutive injections. This long resting time between injections
was necessary to reach thermodynamic equilibrium between injections. This equilibrium
was attained when no more energy was released or absorbed in the reaction cell. The
solution in the reaction cell was stirred at 310 rpm throughout the experiments. The heats of
dilution from the blank titration of the β-lg into the buffer solution and the buffer into
pectin solution were subtracted from the raw data. Measurements were carried out in
duplicates.
Thermodynamic parameters, including binding constant (K), enthalpy (∆H), entropy
(∆S), and binding stoichiometry (N) (molar ratio monomeric β-lg/pectin), were calculated
by iterative curve fitting of the binding isotherms. The “2-binding-site” model from the
software Microcal ORIGIN provided with the ITC apparatus was used. The Gibbs free
energy was calculated from the equation ∆G = ∆H - T∆S.
4.4.4 Overlapping binding site model
An earlier binding study, involving the β-lg and pectin under similar experimental
conditions, was carried out using a capillary electrophoresis (CE) method. The free β-lg
was separated from the complexed β-lg by means of an electric field (Girard et al., 2003:
Chapter 3). Raw data obtained with CE were subsequently treated with the mathematical
overlapping-binding-site model (McGhee and von Hippel, 1974). According to this model,
complexation between ligand and macromolecule including interacting ligand molecules
can be expressed with the equation 22 (Chapter 3). The binding density of the overlapping
binding site model has to be lower or equal to 1. Since more than one protein molecule is
97 expected to complex on a pectin molecule, the D-galA residue was used as the interacting
unit instead of the whole pectin molecule used with the ORIGIN software.
ITC calorimetric data were transformed to obtain the binding density “ν” and free β-
lg concentration “L” values (Tomme et al., 1996). For each injection, the volume in the cell
“vol” (L), the energy released “Q” (J), the enthalpy ∆H (J·mol-1), the β-lg amount “Xc”
(mol), the β-lg concentration “∆Xt” (M), and the pectin concentration “Mt” (M) were
calculated. Consequently, the maximum energy value “Qmax” (J), the complexed ligand
concentration “Xb” (M), and the complexed β-lg concentration were calculated with
equations 22, 23 and 24.
(23) volHXtmaxQ 1 ×∆×∆=
Where ∆Xt1 is the β-lg concentration after the first injection
(24) maxQ/)QXt(Xb ×∆=
(25) vol/XcXt =
Given the apparent molecular weights and the fact that pectin contains 80% of D-
galA residues, the average content of D-galA residues was estimated at 420 and 507 per
LM- and HM-pectin molecule, respectively. The binding parameters L (M) and ν (β-lg
molecules complexed/D-galA residue) were calculated with equations 26 and 27.
(26) XbXtL −=
(27) galADNvolMt/)volNXb( AA −×××××=ν
Where NA is the Avogadro number and D-galA is the average content of D-galA in a
pectin molecule.
The non-linear curve fitting of ν/L plotted against ν was used to obtain K, n and ω
values. The JMP IN® software was used for the curve fittings and statistics (SAS Institute

98 Inc, USA). The ITC binding data according to the overlapping binding site model were then
compared to CE data.
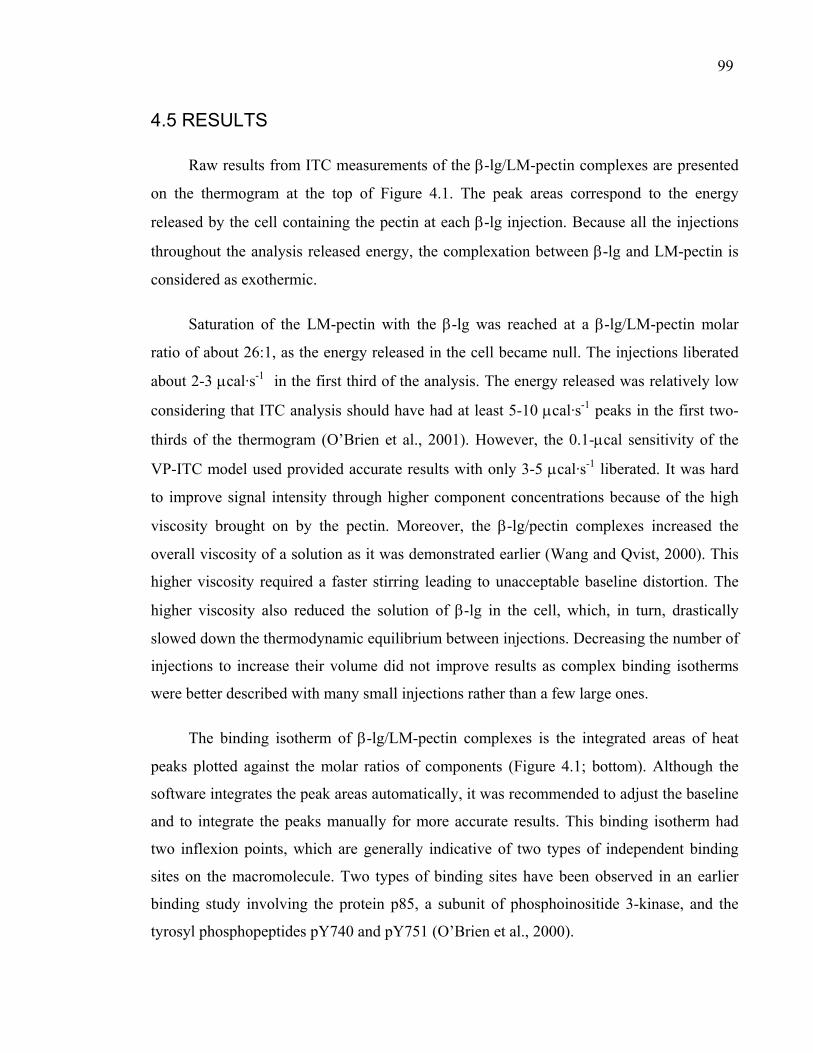
99
4.5 RESULTS
Raw results from ITC measurements of the β-lg/LM-pectin complexes are presented
on the thermogram at the top of Figure 4.1. The peak areas correspond to the energy
released by the cell containing the pectin at each β-lg injection. Because all the injections
throughout the analysis released energy, the complexation between β-lg and LM-pectin is
considered as exothermic.
Saturation of the LM-pectin with the β-lg was reached at a β-lg/LM-pectin molar
ratio of about 26:1, as the energy released in the cell became null. The injections liberated
about 2-3 µcal·s-1 in the first third of the analysis. The energy released was relatively low
considering that ITC analysis should have had at least 5-10 µcal·s-1 peaks in the first two-
thirds of the thermogram (O’Brien et al., 2001). However, the 0.1-µcal sensitivity of the
VP-ITC model used provided accurate results with only 3-5 µcal·s-1 liberated. It was hard
to improve signal intensity through higher component concentrations because of the high
viscosity brought on by the pectin. Moreover, the β-lg/pectin complexes increased the
overall viscosity of a solution as it was demonstrated earlier (Wang and Qvist, 2000). This
higher viscosity required a faster stirring leading to unacceptable baseline distortion. The
higher viscosity also reduced the solution of β-lg in the cell, which, in turn, drastically
slowed down the thermodynamic equilibrium between injections. Decreasing the number of
injections to increase their volume did not improve results as complex binding isotherms
were better described with many small injections rather than a few large ones.
The binding isotherm of β-lg/LM-pectin complexes is the integrated areas of heat
peaks plotted against the molar ratios of components (Figure 4.1; bottom). Although the
software integrates the peak areas automatically, it was recommended to adjust the baseline
and to integrate the peaks manually for more accurate results. This binding isotherm had
two inflexion points, which are generally indicative of two types of independent binding
sites on the macromolecule. Two types of binding sites have been observed in an earlier
binding study involving the protein p85, a subunit of phosphoinositide 3-kinase, and the
tyrosyl phosphopeptides pY740 and pY751 (O’Brien et al., 2000).
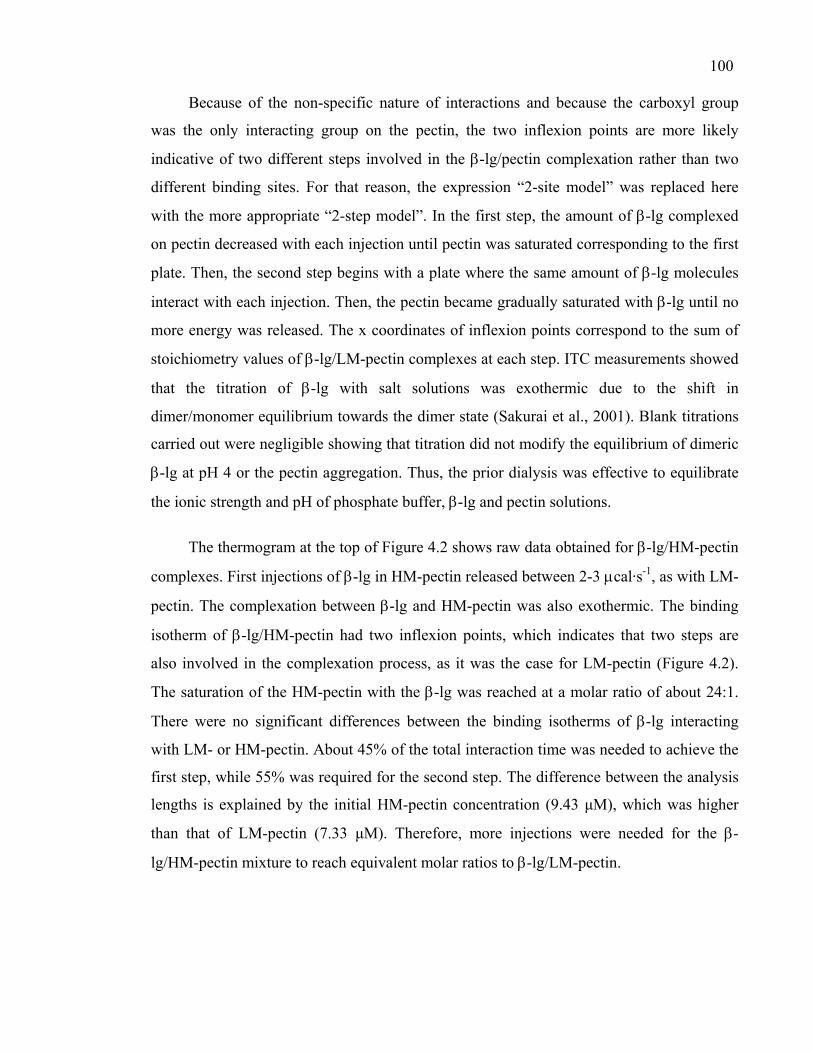
100
Because of the non-specific nature of interactions and because the carboxyl group
was the only interacting group on the pectin, the two inflexion points are more likely
indicative of two different steps involved in the β-lg/pectin complexation rather than two
different binding sites. For that reason, the expression “2-site model” was replaced here
with the more appropriate “2-step model”. In the first step, the amount of β-lg complexed
on pectin decreased with each injection until pectin was saturated corresponding to the first
plate. Then, the second step begins with a plate where the same amount of β-lg molecules
interact with each injection. Then, the pectin became gradually saturated with β-lg until no
more energy was released. The x coordinates of inflexion points correspond to the sum of
stoichiometry values of β-lg/LM-pectin complexes at each step. ITC measurements showed
that the titration of β-lg with salt solutions was exothermic due to the shift in
dimer/monomer equilibrium towards the dimer state (Sakurai et al., 2001). Blank titrations
carried out were negligible showing that titration did not modify the equilibrium of dimeric
β-lg at pH 4 or the pectin aggregation. Thus, the prior dialysis was effective to equilibrate
the ionic strength and pH of phosphate buffer, β-lg and pectin solutions.
The thermogram at the top of Figure 4.2 shows raw data obtained for β-lg/HM-pectin
complexes. First injections of β-lg in HM-pectin released between 2-3 µcal·s-1, as with LM-
pectin. The complexation between β-lg and HM-pectin was also exothermic. The binding
isotherm of β-lg/HM-pectin had two inflexion points, which indicates that two steps are
also involved in the complexation process, as it was the case for LM-pectin (Figure 4.2).
The saturation of the HM-pectin with the β-lg was reached at a molar ratio of about 24:1.
There were no significant differences between the binding isotherms of β-lg interacting
with LM- or HM-pectin. About 45% of the total interaction time was needed to achieve the
first step, while 55% was required for the second step. The difference between the analysis
lengths is explained by the initial HM-pectin concentration (9.43 µM), which was higher
than that of LM-pectin (7.33 µM). Therefore, more injections were needed for the β-
lg/HM-pectin mixture to reach equivalent molar ratios to β-lg/LM-pectin.
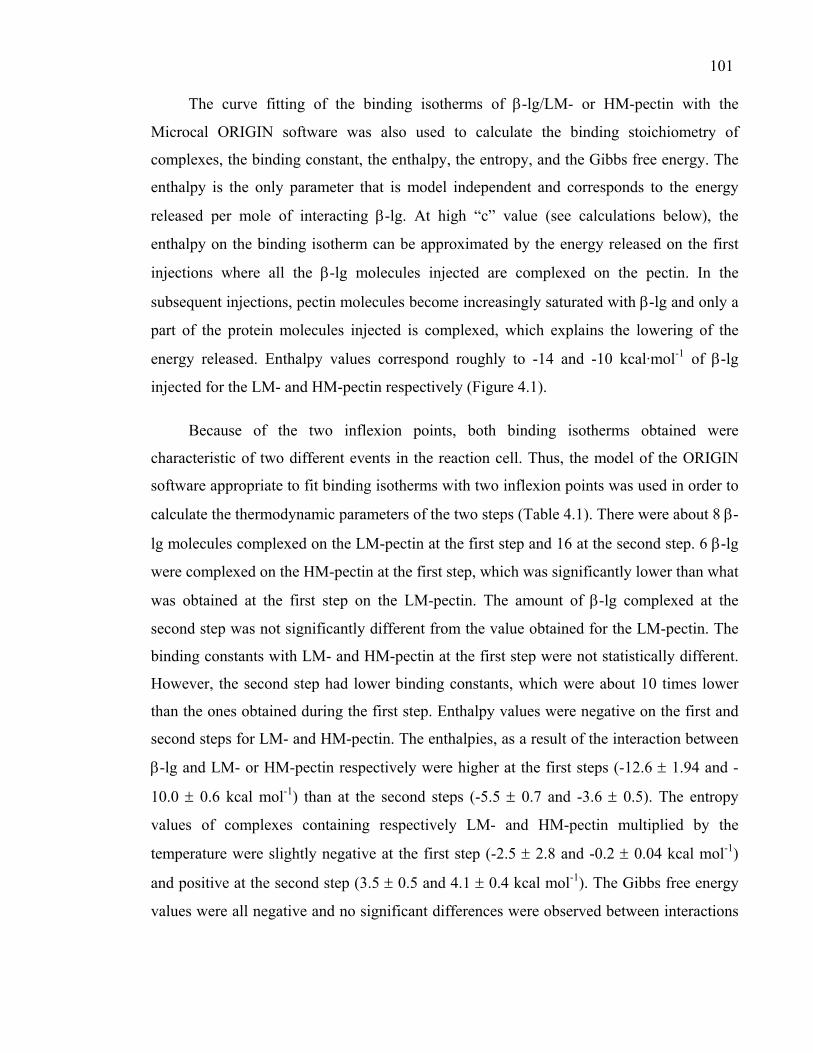
101
The curve fitting of the binding isotherms of β-lg/LM- or HM-pectin with the
Microcal ORIGIN software was also used to calculate the binding stoichiometry of
complexes, the binding constant, the enthalpy, the entropy, and the Gibbs free energy. The
enthalpy is the only parameter that is model independent and corresponds to the energy
released per mole of interacting β-lg. At high “c” value (see calculations below), the
enthalpy on the binding isotherm can be approximated by the energy released on the first
injections where all the β-lg molecules injected are complexed on the pectin. In the
subsequent injections, pectin molecules become increasingly saturated with β-lg and only a
part of the protein molecules injected is complexed, which explains the lowering of the
energy released. Enthalpy values correspond roughly to -14 and -10 kcal·mol-1 of β-lg
injected for the LM- and HM-pectin respectively (Figure 4.1).
Because of the two inflexion points, both binding isotherms obtained were
characteristic of two different events in the reaction cell. Thus, the model of the ORIGIN
software appropriate to fit binding isotherms with two inflexion points was used in order to
calculate the thermodynamic parameters of the two steps (Table 4.1). There were about 8 β-
lg molecules complexed on the LM-pectin at the first step and 16 at the second step. 6 β-lg
were complexed on the HM-pectin at the first step, which was significantly lower than what
was obtained at the first step on the LM-pectin. The amount of β-lg complexed at the
second step was not significantly different from the value obtained for the LM-pectin. The
binding constants with LM- and HM-pectin at the first step were not statistically different.
However, the second step had lower binding constants, which were about 10 times lower
than the ones obtained during the first step. Enthalpy values were negative on the first and
second steps for LM- and HM-pectin. The enthalpies, as a result of the interaction between
β-lg and LM- or HM-pectin respectively were higher at the first steps (-12.6 ± 1.94 and -
10.0 ± 0.6 kcal mol-1) than at the second steps (-5.5 ± 0.7 and -3.6 ± 0.5). The entropy
values of complexes containing respectively LM- and HM-pectin multiplied by the
temperature were slightly negative at the first step (-2.5 ± 2.8 and -0.2 ± 0.04 kcal mol-1)
and positive at the second step (3.5 ± 0.5 and 4.1 ± 0.4 kcal mol-1). The Gibbs free energy
values were all negative and no significant differences were observed between interactions
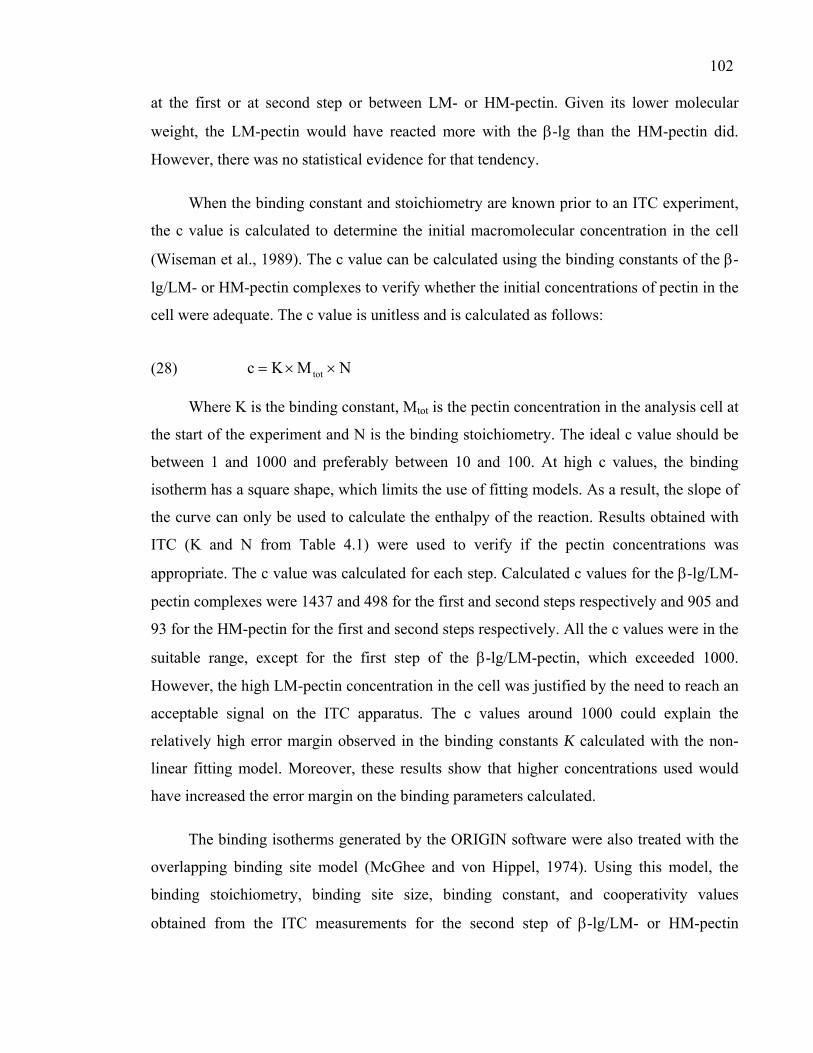
102 at the first or at second step or between LM- or HM-pectin. Given its lower molecular
weight, the LM-pectin would have reacted more with the β-lg than the HM-pectin did.
However, there was no statistical evidence for that tendency.
When the binding constant and stoichiometry are known prior to an ITC experiment,
the c value is calculated to determine the initial macromolecular concentration in the cell
(Wiseman et al., 1989). The c value can be calculated using the binding constants of the β-
lg/LM- or HM-pectin complexes to verify whether the initial concentrations of pectin in the
cell were adequate. The c value is unitless and is calculated as follows:
(28) NMKc tot ××=
Where K is the binding constant, Mtot is the pectin concentration in the analysis cell at
the start of the experiment and N is the binding stoichiometry. The ideal c value should be
between 1 and 1000 and preferably between 10 and 100. At high c values, the binding
isotherm has a square shape, which limits the use of fitting models. As a result, the slope of
the curve can only be used to calculate the enthalpy of the reaction. Results obtained with
ITC (K and N from Table 4.1) were used to verify if the pectin concentrations was
appropriate. The c value was calculated for each step. Calculated c values for the β-lg/LM-
pectin complexes were 1437 and 498 for the first and second steps respectively and 905 and
93 for the HM-pectin for the first and second steps respectively. All the c values were in the
suitable range, except for the first step of the β-lg/LM-pectin, which exceeded 1000.
However, the high LM-pectin concentration in the cell was justified by the need to reach an
acceptable signal on the ITC apparatus. The c values around 1000 could explain the
relatively high error margin observed in the binding constants K calculated with the non-
linear fitting model. Moreover, these results show that higher concentrations used would
have increased the error margin on the binding parameters calculated.
The binding isotherms generated by the ORIGIN software were also treated with the
overlapping binding site model (McGhee and von Hippel, 1974). Using this model, the
binding stoichiometry, binding site size, binding constant, and cooperativity values
obtained from the ITC measurements for the second step of β-lg/LM- or HM-pectin
103 complexation were calculated. Binding parameters for the first step were not calculated
because not enough points were available for the non-linear fitting (Figure 4.3). Therefore,
the non linear least square fitting was achieved for values of ν between 0.015 and 0.025 and
between 0.010 and 0.030 for complexes with LM- and HM-pectin respectively.
Results obtained with the overlapping binding site model followed the same
tendencies observed with the ORIGIN software. The overlapping model made it possible to
calculate the binding site size covered by 1 β-lg molecule, which was 14 and 22 D-galA
residues for LM- and HM-pectin respectively. The interpolymer complexes had a binding
constant of 2128 M-1 with LM-pectin which was higher than the value 1233 M-1 obtained
with the HM-pectin. One can see that the binding constants calculated with the overlapping
binding model were much lower than those obtained with the ORIGIN software. In fact, the
overlapping binding site model uses the main repetitive unit of the pectin (D-galA residues)
in the calculation as the interacting unit, whereas the ORIGIN software considers the whole
pectin molecule. Consequently, the amount of interacting units is much higher in the
overlapping binding model, which leads to lower binding constants. The β-lg complexed
with LM- or HM-pectin did not show any significant cooperative behavior.
104
4.6 DISCUSSION
The negative Gibbs free energy values show the spontaneous character of the
interaction between β-lg and LM- or HM-pectin. However, the relatively long period
needed for the system to reach equilibrium between injections showed that the β-lg/pectin
complexes have a slow binding kinetics.
The existence of two steps involved in the β-lg/LM- or HM-pectin complexation
process is in agreement with the Tainaka theory (Tainaka, 1979, 1980), which states that
the complexes are formed in two steps passing from the molecular to the aggregated state.
The Tainaka theory is adapted from the Veis-Aranyi theory (Veis and Aranyi, 1960) and
can be applied to systems regardless of their charges density. The first step would
correspond to the formation of soluble intrapolymer complexes (C1) between β-lg and
pectin molecules. The second step would imply the aggregation of these intrapolymer
complexes forming insoluble interpolymer complexes (C2). The isoenthalpic plateau
observed in the binding isotherms ends when the β-lg/pectin ratio required to induce
intrapolymer complex aggregation is reached. A light scattering study carried out on
poly(vinyl alcohol) sulfate/proteins salt free systems at different ratios revealed that
intrapolymer complexes did not aggregate as long as proteins were in excess (Tsuboi et al.,
1996).
The lower stoichiometries and higher binding constants of C1 compared to C2 are the
result of lower levels β-lg in the cell that can interact with pectin and the higher proportion
of complexed β-lg on the pectin, respectively. The first step was obviously enthalpically
driven principally because of the direct interaction between the β-lg and pectin ionized
carboxylic groups, which were shown to be located mainly in the smooth region of the
pectin (Voragen et al., 1995). The unfavorable entropy observed at the first complexation
step is in agreement with the Tainaka theory, which states that C1 have poor
conformational entropy. It was previously shown that the formation of
protein/polyelectrolyte complexes was driven by electrostatic interactions that could be
105 partially encountered by a loss in polyelectrolyte conformational freedom (Mattison et al.,
1999).
According to the Tainaka theory, the process called complexation begins at the
second step where C1 aggregate to form C2. Results show that enthalpic and entropic
contributions support this second step. The favorable enthalpic contribution would result
from the interaction of β-lg with the residual net negative charge on the C1. The
overlapping of intrapolymer complexes leads to an electrostatic energy gain resulting from
the increased ion density in the overlapped domain (Tainaka, 1979, 1980; Burgess, 1990).
The positive entropic contribution at the second step essentially the product of the
rearrangement of C2 in the solution and of the dilution of the concentrated phase containing
the C2 (Veis and Aranyi, 1960; Piculell and Lindman, 1992; Tolstoguzov, 1997). The
presence of C1 and C2 was also observed with the BSA/PDMDAAC (bovine serum
albumin/poly(dimethyldiallylammonium chloride) mixture (Mattison et al., 1995; Xia et
Dubin, 1993). The enthalpy values measured with ITC are the sum of contributions coming
from the interaction between β-lg and pectin, conformational changes, and aggregation of
molecules (O’Brien et al., 2001). Hence, the enthalpy value measured could have been
either overestimated or underestimated depending on the possible conformational changes
in the molecules.
Monte Carlo simulations showed that at low ionic strengths, a polyelectrolyte chain
would wrap around an oppositely charged spherical particle (Chodanowsky and Stoll, 2001;
Brynda et al., 2002). The entropically favorable release of counterions and water molecules
at the time of complexation (Piculell and Lindman, 1992; Tolstoguzov, 1997) may have
been compensated by the negative entropy arising from conformational changes in the
pectin. The exothermic reaction observed between maltodextrin and SDS can be explained
by conformational changes in the maltodextrin (Wangsakan et al., 2001).
Measures with circular dichroism revealed the partial disappearance of the β-lg α-
helix as it interacts with the acacia gum at pH 4.2 (Schmitt et al., 2001). Conformational
changes are also suspected on the ribulose diphosphate carboxylase and on the 11s broad
bean globulin once complexed with the LM-pectin (Tolstoguzov, 1991). A contribution to
106 enthalpy could also come from the possible aggregation of proteins around pH 4. To verify
the accuracy of the binding parameters obtained with ITC, the calorimetric data treated with
the overlapping binding site model were compared to those obtained with CE in a previous
study (Girard et al., 2003: Chapter 3).
The total stoichiometry values for ITC and CE were respectively 25 and 23
monomers of β-lg complexed per LM-pectin molecule. However, the stoichiometry values
calculated for the β-lg/HM-pectin complexes were higher with ITC (21) than with CE (13).
This could be explained by a partial dissociation of β-lg/HM-pectin complexes during the
CE analysis due to the electric field. The lower binding constant obtained at the second step
is indicative of weaker interactions in β-lg/HM-pectin interpolymer complexes compared to
those obtained with LM-pectin. A previous study using ultrafiltration and destabilizing
agents demonstrated that β-lg/HM-pectin interpolymer complexes were more likely
dissociated with higher pH values or ionic strengths than β-lg/LM-pectin complexes
(Girard et al., 2002: Chapter 2). The binding constant at the second step of the β-lg/LM- or
HM-pectin complexes obtained with ITC were respectively 2128 and 1233 M-1 compared
with 1431 and 857 M-1 calculated with capillary electrophoresis for the same mixture
(Girard et al., 2003: Chapter 3). The binding constant values obtained by ITC, were higher
than those found with capillary electrophoresis. This binding parameter calculated from
enthalpy values may have been overestimated, because of conformational changes involved
in pectin and β-lg molecules as they are complexing. The binding site sizes calculated with
ITC (14 and 22 D-galA) were similar to those obtained with capillary electrophoresis (12
and 20 D-galA) for the LM- and HM-pectin respectively (Girard et al., 2003: Chapter 3).
Contrary to what was observed with capillary electrophoresis, the β-lg complexed with
LM- or HM-pectin did not show any significant cooperative behavior. The complexes
analyzed with capillary electrophoresis were “T” as the β-lg and pectin solutions were
mixed before the acidification. The ITC complexes were “M” since β-lg and pectin
solutions were at pH 4 before mixing. The “T” and “M” complexes were shown to have
cooperative and non-cooperative behaviors respectively (Tolstoguzov, 1986).
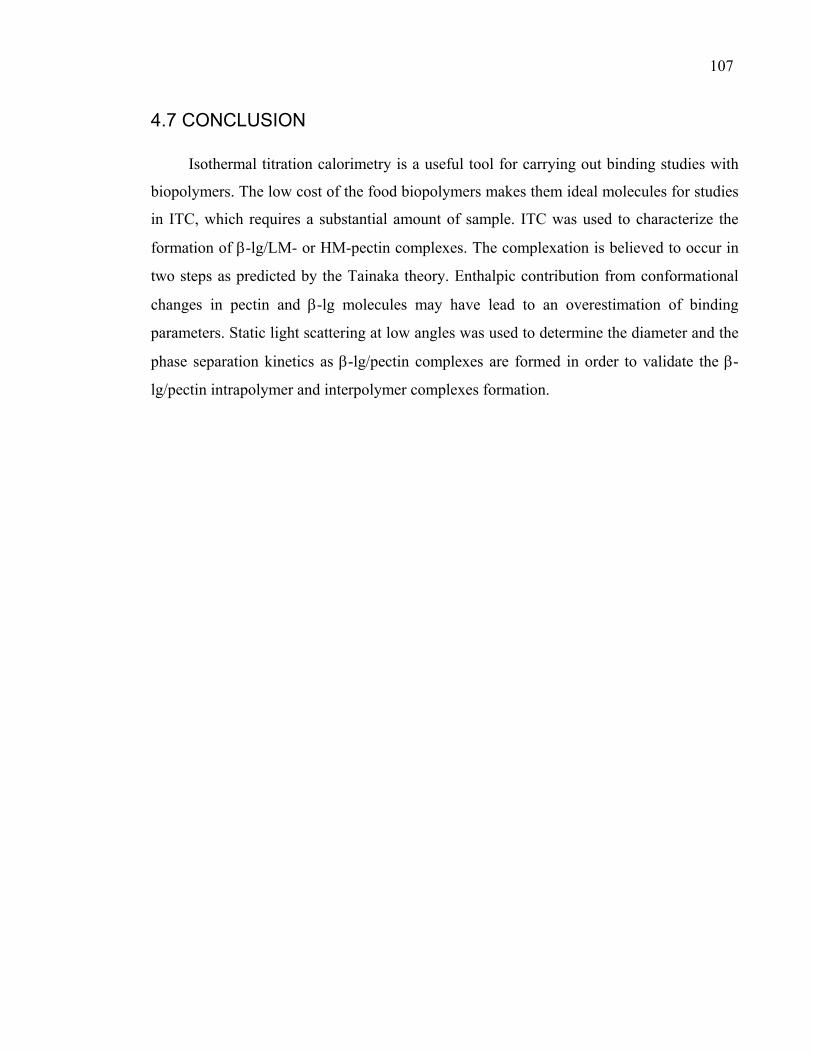
107
4.7 CONCLUSION
Isothermal titration calorimetry is a useful tool for carrying out binding studies with
biopolymers. The low cost of the food biopolymers makes them ideal molecules for studies
in ITC, which requires a substantial amount of sample. ITC was used to characterize the
formation of β-lg/LM- or HM-pectin complexes. The complexation is believed to occur in
two steps as predicted by the Tainaka theory. Enthalpic contribution from conformational
changes in pectin and β-lg molecules may have lead to an overestimation of binding
parameters. Static light scattering at low angles was used to determine the diameter and the
phase separation kinetics as β-lg/pectin complexes are formed in order to validate the β-
lg/pectin intrapolymer and interpolymer complexes formation.
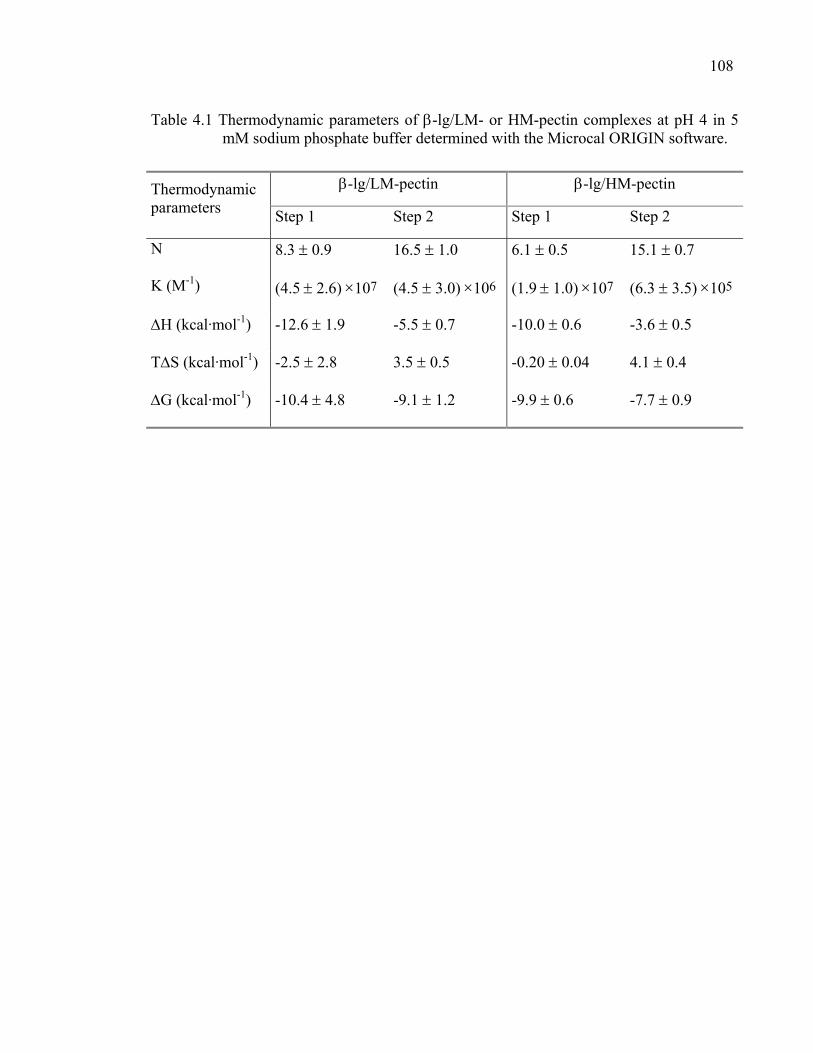
108
Table 4.1 Thermodynamic parameters of β-lg/LM- or HM-pectin complexes at pH 4 in 5 mM sodium phosphate buffer determined with the Microcal ORIGIN software.
β-lg/LM-pectin β-lg/HM-pectin Thermodynamic parameters Step 1 Step 2 Step 1 Step 2
N 8.3 ± 0.9 16.5 ± 1.0 6.1 ± 0.5 15.1 ± 0.7
K (M-1) (4.5 ± 2.6) ×107 (4.5 ± 3.0) ×106 (1.9 ± 1.0) ×107 (6.3 ± 3.5) ×105
∆H (kcal·mol-1) -12.6 ± 1.9 -5.5 ± 0.7 -10.0 ± 0.6 -3.6 ± 0.5
T∆S (kcal·mol-1) -2.5 ± 2.8 3.5 ± 0.5 -0.20 ± 0.04 4.1 ± 0.4
∆G (kcal·mol-1) -10.4 ± 4.8 -9.1 ± 1.2 -9.9 ± 0.6 -7.7 ± 0.9
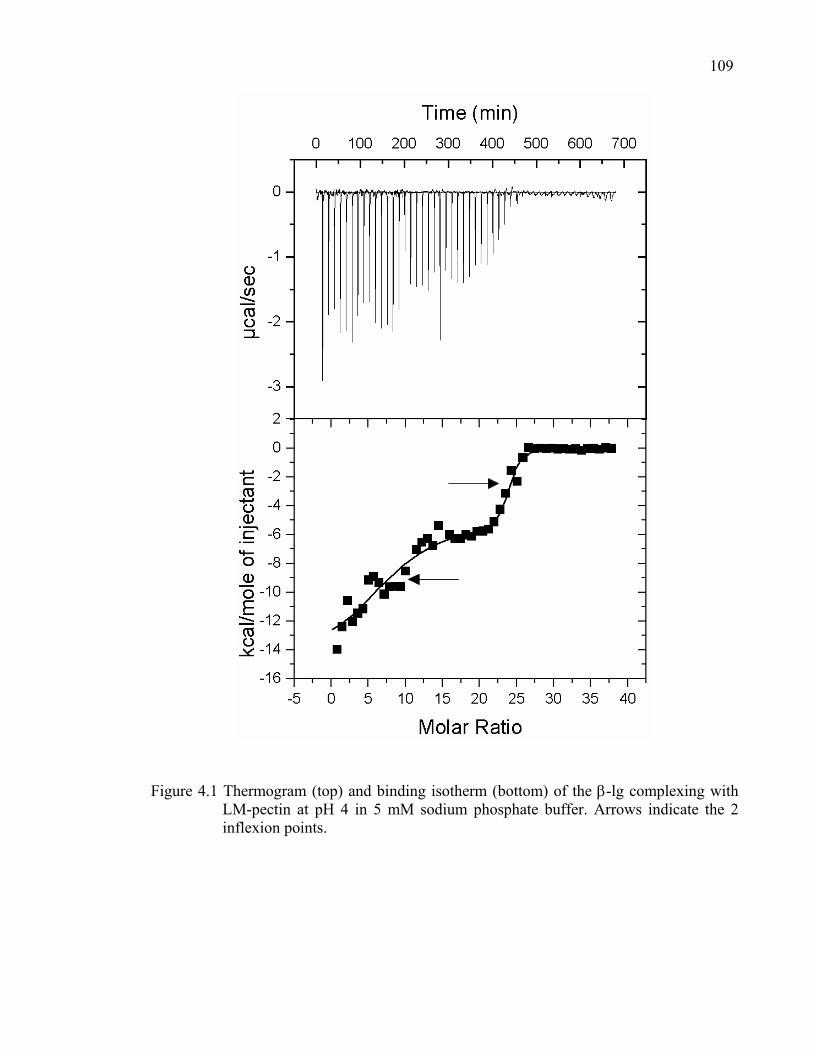
109
Figure 4.1 Thermogram (top) and binding isotherm (bottom) of the β-lg complexing with LM-pectin at pH 4 in 5 mM sodium phosphate buffer. Arrows indicate the 2 inflexion points.
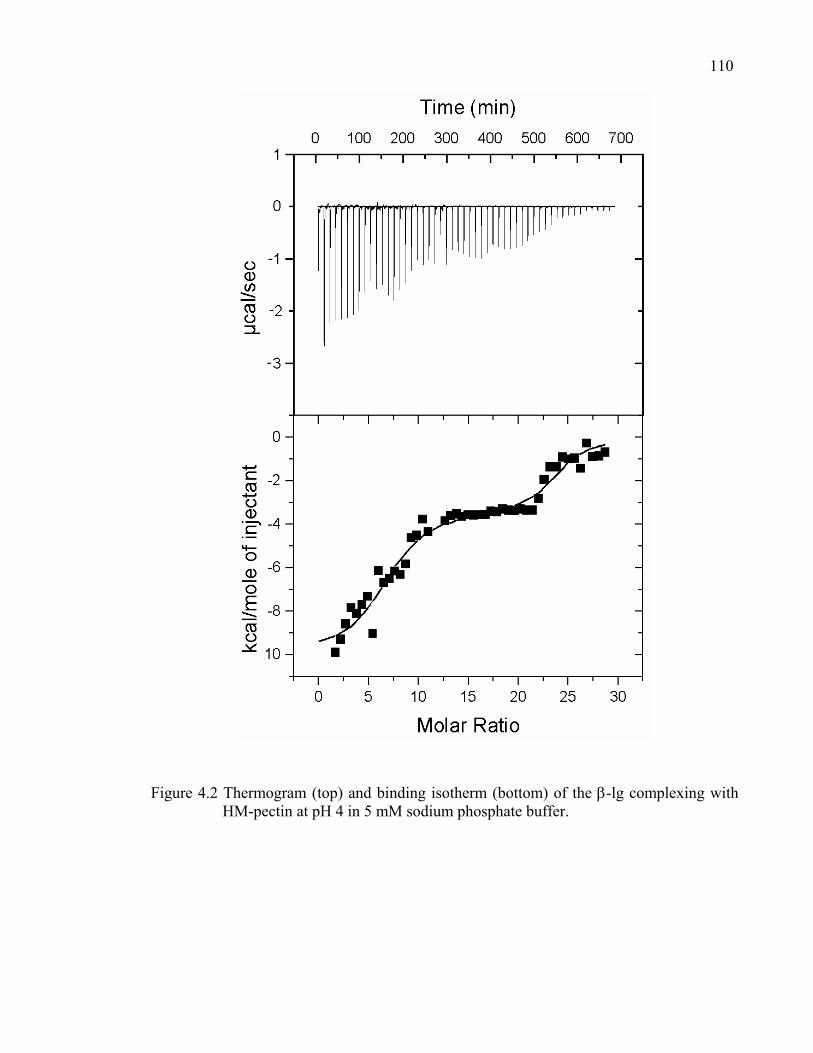
110
Figure 4.2 Thermogram (top) and binding isotherm (bottom) of the β-lg complexing with HM-pectin at pH 4 in 5 mM sodium phosphate buffer.
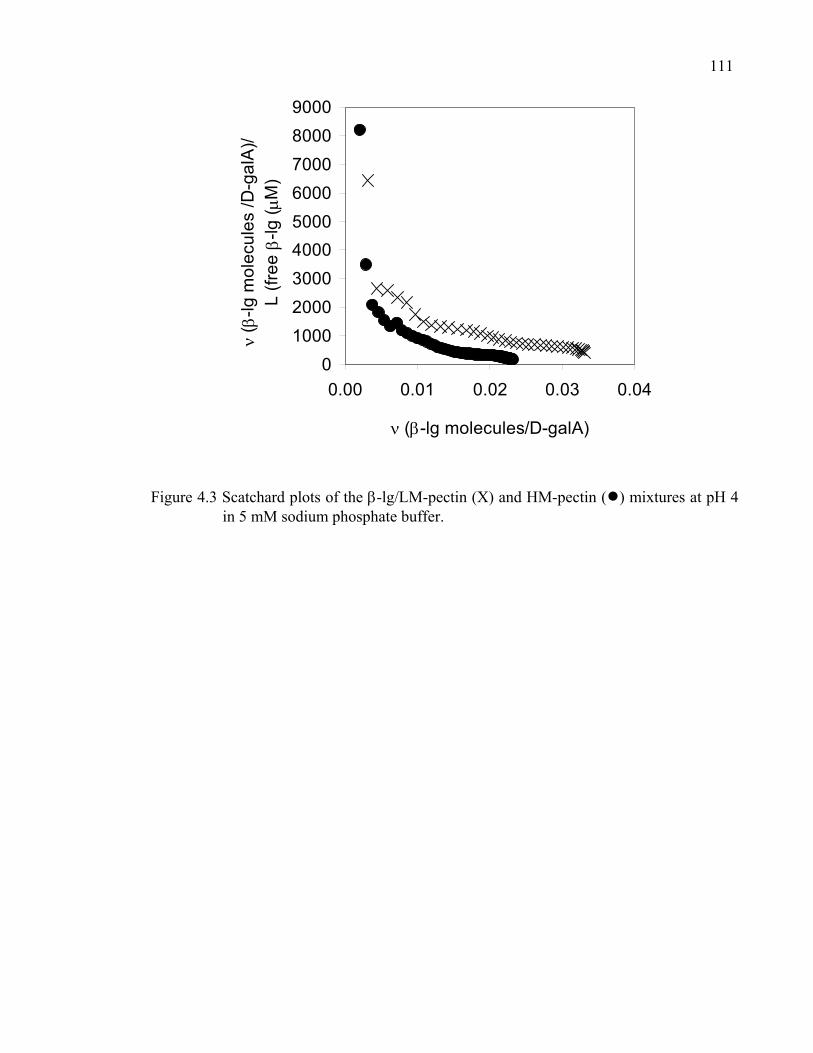
111
0100020003000400050006000700080009000
0.00 0.01 0.02 0.03 0.04
ν (β-lg molecules/D-galA)
ν ( β
-lg m
olec
ules
/D-g
alA
)/L
(free
β-lg
( µM
)
Figure 4.3 Scatchard plots of the β-lg/LM-pectin (X) and HM-pectin (●) mixtures at pH 4 in 5 mM sodium phosphate buffer.
CHAPITRE 5: Associative phase separation of β-lactoglobulin/pectin solutions: A kinetic study by small angle static light scattering
Maude Girarda, Christian Sanchezb, Sandra Laneuvillea, Sylvie L. Turgeona
& Sylvie F. Gauthiera
aCentre de recherche en sciences et technologie du lait STELA
Faculté des sciences de l’agriculture et de l’alimentation
Université Laval
Québec, Qc, G1K 7P4, Canada
bLaboratoire de Physico-Chimie et Génie Alimentaires
ENSAIA-INPL, 2 avenue de la Forêt-de-Haye BP176, 54505
Vandoeuvre-lès-Nancy Cedex, France.
soumis au journal Langmuir
113
5.1 RÉSUMÉ
Une séparation de phases a été observée lors de la formation de complexes
interpolymères β-lactoglobuline (β-lg)/pectine faiblement ou hautement méthylée (pectine
LM ou HM). Cette séparation de phases a été caractérisée par la diffusion statique de la
lumière aux petits angles lors de la formation des complexes sous l’action acidifiante de la
glucono-δ-lactone (GDL). L’absence d’un vecteur d’onde maximal (qmax) et la décroissance
monotone de l’intensité de la lumière diffusée (I(q)) avec une augmentation du vecteur
d’onde (q) ont été associés avec un mécanisme de déstabilisation par nucléation et
croissance. La formation de complexes solubles a été initiée à des pHc de 6,4 et de 5,0 avec
la pectine faiblement ou hautement méthylée (LM ou HM), respectivement. Une
augmentation de I(q) aux valeurs de q intermédiaires a démontré une organisation locale
des complexes résultant de la formation d’une grande quantité de petits complexes. Cette
formation de petits complexes ainsi qu’une sédimentation des complexes interpolymères
insolubles expliquent la diminution du diamètre moyen et de la dimension fractale des
complexes β-lg/pectine LM. La structure des complexes lors de l’acidification a été
confirmée par microscopie en contraste de phases.
114
5.2 ABSTRACT
Interpolymer complexation between β-lactoglobulin (β-lg) and pectin led to phase
separation. Static light scattering was used to monitor the phase separation of β-lg/low-
methoxyl or high-methoxyl-pectin (LM- or HM-pectin) mixtures as they were slowly
acidified from pH 7 to 4 with glucono-δ-lactone (GDL). The absence of a scattering angle
peak (qmax) and the monotonic decrease in light scattered intensity with the wave vector
were associated with a nucleation and growth phase separation mechanism. The formation
of intrapolymer complexes was initiated at pH 6.4 with the LM-pectin and at pH 5.0 with
the HM-pectin. Local ordering with increasing amounts of small complexes was observed
as scattered light intensity was increased at intermediate q values. The formation of large
amounts of small complexes and sedimentation would be responsible for the decrease in the
number mean diameter and fractal dimension of β-lg/LM-pectin over time. The structure of
complexes as solutions were acidified were observed with phase contrast microscopy.
115
5.3 INTRODUCTION
Polymer interactions are used in a variety of fields (i.e., medical, biochemical, food
science, and polymer chemistry). Interactions between oppositely charged proteins and
polysaccharides are of interest in food science, especially with respect to functional foods.
The nature of interactions, whether repulsive or attractive, will lead to different behavior
and properties. Attractive interactions are mainly involved in the complexation or
coacervation process. Such molecular assembly is initiated as electrostatic interactions
induce a molecular aggregate called intrapolymer complex whose diameter is
approximately equivalent to the larger interacting molecule (Tsuboi et al., 1996). The
formation of intrapolymer complexes is believed to be initiated at a critical pH called the
pHc (Wen and Dubin, 1997; Mattison et al., 1998). As intrapolymer complexes are
sufficiently neutralized, they aggregate to form interpolymer complexes (Tainaka, 1979,
1980). Interpolymer complexes are formed at a second critical pH known as the pHφ (Wen
and Dubin, 1997; Mattison et al., 1998). Interpolymer complex formation is followed by a
phase separation as the complexes become neutral and insoluble. Neutralization of
assemblies leads to a phase separation where one phase is enriched with interpolymer
complexes and the other is made up of intrapolymer complexes and the solvent.
The phase separation mechanism of many colloidal systems was investigated with
static light scattering (Rouw et al., 1989; Mallamace et al., 1996; van Bruggen et al., 1999).
Phase separation of a mixture can be studied with the evolution of light scattered intensity
I(q) as a function of the scattering angle (q). Few phase separation studies were carried out
on biopolymer mixtures (Sanchez et al., 2002; Tromp et al., 1995; Tuinier et al., 2000). The
phase separation follows a nucleation and growth or a spinodal decomposition
destabilization mechanism. Spinodal decomposition arises when a mixture is in the
unstable zone of the phase diagram. Therefore, the negative free energy leads to a
spontaneous destabilization as soon as molecules are mixed (Tromp et al, 1995). The early
stage of spinodal decomposition is characterized by an exponential growth of maximum
light intensity scattered (Imax) with time, while the scattering angle peak (qmax) remains
constant. Later in the process, qmax is displaced toward lower q values indicating a
116
coarsening of the structural domains. Finally, Imax and qmax are stabilized as the system
reaches equilibrium.
A nucleation and growth destabilization mechanism occurs when a mixture is in the
metastable zone of the phase diagram. There, an energy barrier has to be overcome before
phase separation can occur. The absence of a qmax value and a monotonic decrease in the
light intensity scattered with q is considered as a characteristic of a nucleation and growth
mechanism (Sanchez et al., 2002). However, such a destabilizing mechanism can occur
with the occurrence of a qmax value. This situation is expected at low concentrations as a
depletion layer is formed around the particles, and at high concentrations, due to the
correlation produced by the location of individual scatterers in a constrained space (Eliçabe
et al., 1997, 1998). In the later stages, qmax can be displaced toward higher or lower q values
depending on the evolution of the structural domains.
Using isothermal titration calorimetric, we recently showed that complexation
between β-lg and pectin (at pH 4) involves two steps with different enthalpic/entropic
contributions (Girard et al., 2003: Chapter 4). In the present study, light scattering was used
to provide information on the β-lg and pectin complexation process, including the two steps
previously identified with microcalorimetry. Glucono-δ-lactone (GDL) was used as an
acidifying agent to study complex formation throughout a slow acidification process. Phase
contrast microscopic observations were performed to validate the structural information
obtained using static light scattering data.
β-lactoglobulin (β-lg) was chosen because of its well-known structure (Sawyer et al.,
1999). This globular protein has a molecular weight of 18,350 Da and a hydrophobic core.
β-lg is monomeric at acidic pH (below 3) or alkaline pH (above 8), dimeric at neutral pH,
and found in both states between pH 4 and 6 (Taulier and Chalikian, 2001). The presence of
the octameric form around pH 4.5 (Pessen et al., 1985) is however challenged (McKenzie
and Sawyer, 1967; Taulier and Chalikian, 2001). Pectin is a cell-wall anionic
polysaccharide, generally extracted from apple pomace or citrus fruits. The pectin
backbone has smooth regions made up of a chain of D-galacturonic residues (D-galA). In

117
the hairy regions, the main chain of D-galA is interrupted with rhamnose residues, where
branching of neutral sugar chains can occur.
118
5.4 MATERIALS AND METHODS
5.4.1 Materials
Bovine β-lg AB (3X crystallized) was purchased from Sigma-Aldrich Canada Ltd
(Oakville, On, Canada) as 95% pure protein. Low-methoxyl pectin (DE 28.3%, apparent
molecular weight 94.3 kDa) and high-methoxyl pectin (DE 73.4%, apparent molecular
weight 118 kDa) were donated by Hercules Copenhagen A/S (Copenhagen, Denmark). All
reagents were of analytical grade and used as received.
5.4.2 Preparation of solutions
β-lg, low- or high-methoxyl pectin (LM- or HM-pectin) were dialyzed against
deionized water for 72 hours at 4°C. The concentration of dialyzed β-lg was determined
using the bicinchoninic acid protein assay (Smith et al., 1985). The LM- and HM-pectin
concentrations were assayed using the phenol-sulfuric acid method (Dubois et al., 1956).
The β-lg solution was mixed with the LM- or the HM-pectin at 2:1 and 5:1 weight ratios.
The total solid contents were 0.5 and 0.1% (w/w) for the microscopic observation and light
scattering experiments, respectively. The pH of the solutions was adjusted to 7 with 0.1 or
0.01 N NaOH. Solutions of β-lg, LM- and HM-pectin were filtrated through a 0.22-µm
microfilter (Millipore, Bedford, MA) before microscopic and light scattering experiments.
5.4.3 Optical microscopy
Solutions of β-lg and β-lg/LM- or HM-pectin mixtures were acidified from pH 7 to 4
with HCl 0.1 N. At each 0.1 pH unit, solutions were left standing for 15 minutes and then
micrographed. Solutions were observed using the phase-contrast Olympus microscope at
X40 magnification (BX51 TRF model, Olympus Opticals Co, Ltd, Melvillle NY, USA).
The camera (Photometrics CoolSNAP fx, Image Processing Solutions, Inc., North Reading,
MA, USA) mounted on the microscope was used to micrograph solutions in order to follow
the phase separation once β-lg/pectin complexes were formed.
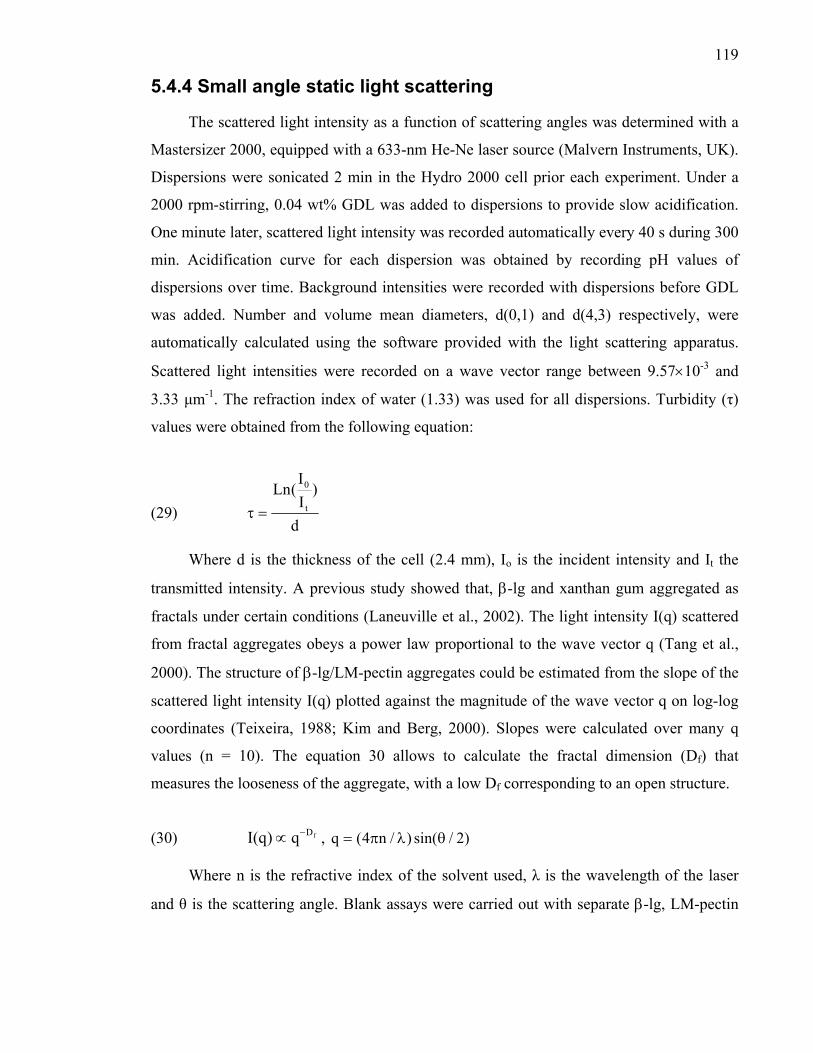
119
5.4.4 Small angle static light scattering
The scattered light intensity as a function of scattering angles was determined with a
Mastersizer 2000, equipped with a 633-nm He-Ne laser source (Malvern Instruments, UK).
Dispersions were sonicated 2 min in the Hydro 2000 cell prior each experiment. Under a
2000 rpm-stirring, 0.04 wt% GDL was added to dispersions to provide slow acidification.
One minute later, scattered light intensity was recorded automatically every 40 s during 300
min. Acidification curve for each dispersion was obtained by recording pH values of
dispersions over time. Background intensities were recorded with dispersions before GDL
was added. Number and volume mean diameters, d(0,1) and d(4,3) respectively, were
automatically calculated using the software provided with the light scattering apparatus.
Scattered light intensities were recorded on a wave vector range between 9.57×10⁻³ and
3.33 µm-1. The refraction index of water (1.33) was used for all dispersions. Turbidity (τ)
values were obtained from the following equation:
(29) d
)II
(Lnt
0
=τ
Where d is the thickness of the cell (2.4 mm), Io is the incident intensity and It the
transmitted intensity. A previous study showed that, β-lg and xanthan gum aggregated as
fractals under certain conditions (Laneuville et al., 2002). The light intensity I(q) scattered
from fractal aggregates obeys a power law proportional to the wave vector q (Tang et al.,
2000). The structure of β-lg/LM-pectin aggregates could be estimated from the slope of the
scattered light intensity I(q) plotted against the magnitude of the wave vector q on log-log
coordinates (Teixeira, 1988; Kim and Berg, 2000). Slopes were calculated over many q
values (n = 10). The equation 30 allows to calculate the fractal dimension (Df) that
measures the looseness of the aggregate, with a low Df corresponding to an open structure.
(30) , fDq)q(I −∝ )2/sin()/n4(q θλπ=
Where n is the refractive index of the solvent used, λ is the wavelength of the laser
and θ is the scattering angle. Blank assays were carried out with separate β-lg, LM-pectin
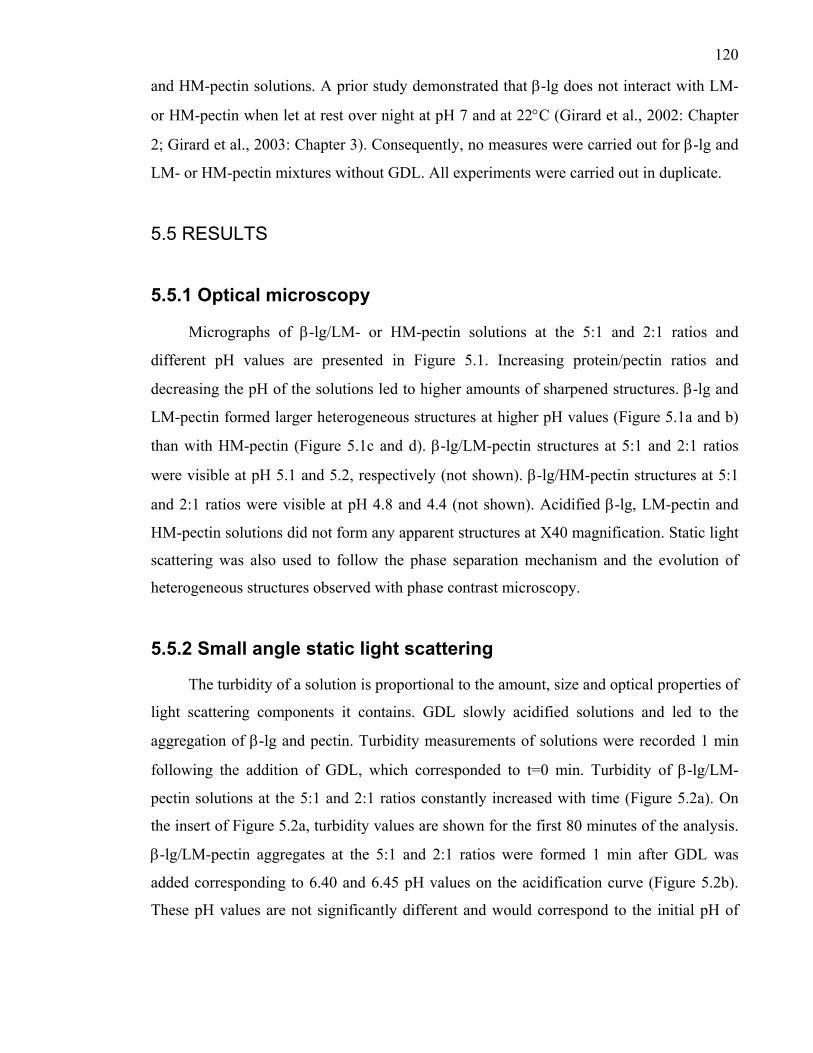
120
and HM-pectin solutions. A prior study demonstrated that β-lg does not interact with LM-
or HM-pectin when let at rest over night at pH 7 and at 22°C (Girard et al., 2002: Chapter
2; Girard et al., 2003: Chapter 3). Consequently, no measures were carried out for β-lg and
LM- or HM-pectin mixtures without GDL. All experiments were carried out in duplicate.
5.5 RESULTS
5.5.1 Optical microscopy
Micrographs of β-lg/LM- or HM-pectin solutions at the 5:1 and 2:1 ratios and
different pH values are presented in Figure 5.1. Increasing protein/pectin ratios and
decreasing the pH of the solutions led to higher amounts of sharpened structures. β-lg and
LM-pectin formed larger heterogeneous structures at higher pH values (Figure 5.1a and b)
than with HM-pectin (Figure 5.1c and d). β-lg/LM-pectin structures at 5:1 and 2:1 ratios
were visible at pH 5.1 and 5.2, respectively (not shown). β-lg/HM-pectin structures at 5:1
and 2:1 ratios were visible at pH 4.8 and 4.4 (not shown). Acidified β-lg, LM-pectin and
HM-pectin solutions did not form any apparent structures at X40 magnification. Static light
scattering was also used to follow the phase separation mechanism and the evolution of
heterogeneous structures observed with phase contrast microscopy.
5.5.2 Small angle static light scattering
The turbidity of a solution is proportional to the amount, size and optical properties of
light scattering components it contains. GDL slowly acidified solutions and led to the
aggregation of β-lg and pectin. Turbidity measurements of solutions were recorded 1 min
following the addition of GDL, which corresponded to t=0 min. Turbidity of β-lg/LM-
pectin solutions at the 5:1 and 2:1 ratios constantly increased with time (Figure 5.2a). On
the insert of Figure 5.2a, turbidity values are shown for the first 80 minutes of the analysis.
β-lg/LM-pectin aggregates at the 5:1 and 2:1 ratios were formed 1 min after GDL was
added corresponding to 6.40 and 6.45 pH values on the acidification curve (Figure 5.2b).
These pH values are not significantly different and would correspond to the initial pH of
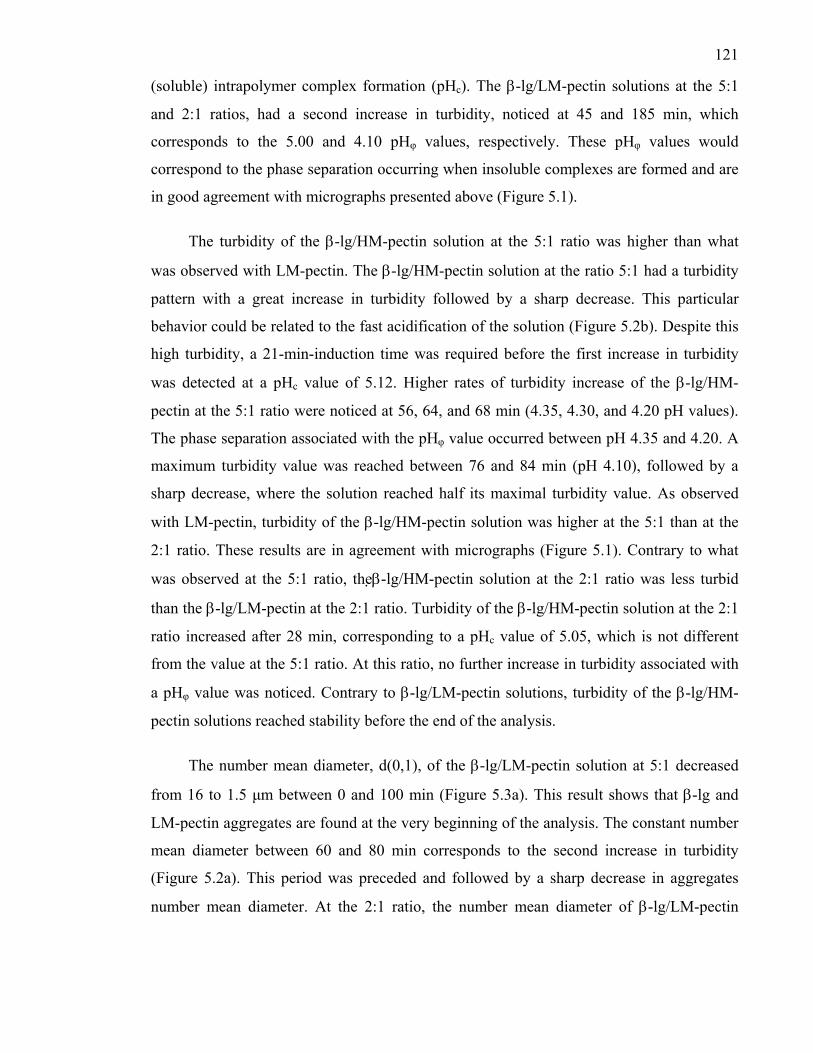
121
(soluble) intrapolymer complex formation (pHc). The β-lg/LM-pectin solutions at the 5:1
and 2:1 ratios, had a second increase in turbidity, noticed at 45 and 185 min, which
corresponds to the 5.00 and 4.10 pHφ values, respectively. These pHφ values would
correspond to the phase separation occurring when insoluble complexes are formed and are
in good agreement with micrographs presented above (Figure 5.1).
The turbidity of the β-lg/HM-pectin solution at the 5:1 ratio was higher than what
was observed with LM-pectin. The β-lg/HM-pectin solution at the ratio 5:1 had a turbidity
pattern with a great increase in turbidity followed by a sharp decrease. This particular
behavior could be related to the fast acidification of the solution (Figure 5.2b). Despite this
high turbidity, a 21-min-induction time was required before the first increase in turbidity
was detected at a pHc value of 5.12. Higher rates of turbidity increase of the β-lg/HM-
pectin at the 5:1 ratio were noticed at 56, 64, and 68 min (4.35, 4.30, and 4.20 pH values).
The phase separation associated with the pHφ value occurred between pH 4.35 and 4.20. A
maximum turbidity value was reached between 76 and 84 min (pH 4.10), followed by a
sharp decrease, where the solution reached half its maximal turbidity value. As observed
with LM-pectin, turbidity of the β-lg/HM-pectin solution was higher at the 5:1 than at the
2:1 ratio. These results are in agreement with micrographs (Figure 5.1). Contrary to what
was observed at the 5:1 ratio, theβ-lg/HM-pectin solution at the 2:1 ratio was less turbid
than the β-lg/LM-pectin at the 2:1 ratio. Turbidity of the β-lg/HM-pectin solution at the 2:1
ratio increased after 28 min, corresponding to a pHc value of 5.05, which is not different
from the value at the 5:1 ratio. At this ratio, no further increase in turbidity associated with
a pHφ value was noticed. Contrary to β-lg/LM-pectin solutions, turbidity of the β-lg/HM-
pectin solutions reached stability before the end of the analysis.
The number mean diameter, d(0,1), of the β-lg/LM-pectin solution at 5:1 decreased
from 16 to 1.5 µm between 0 and 100 min (Figure 5.3a). This result shows that β-lg and
LM-pectin aggregates are found at the very beginning of the analysis. The constant number
mean diameter between 60 and 80 min corresponds to the second increase in turbidity
(Figure 5.2a). This period was preceded and followed by a sharp decrease in aggregates
number mean diameter. At the 2:1 ratio, the number mean diameter of β-lg/LM-pectin
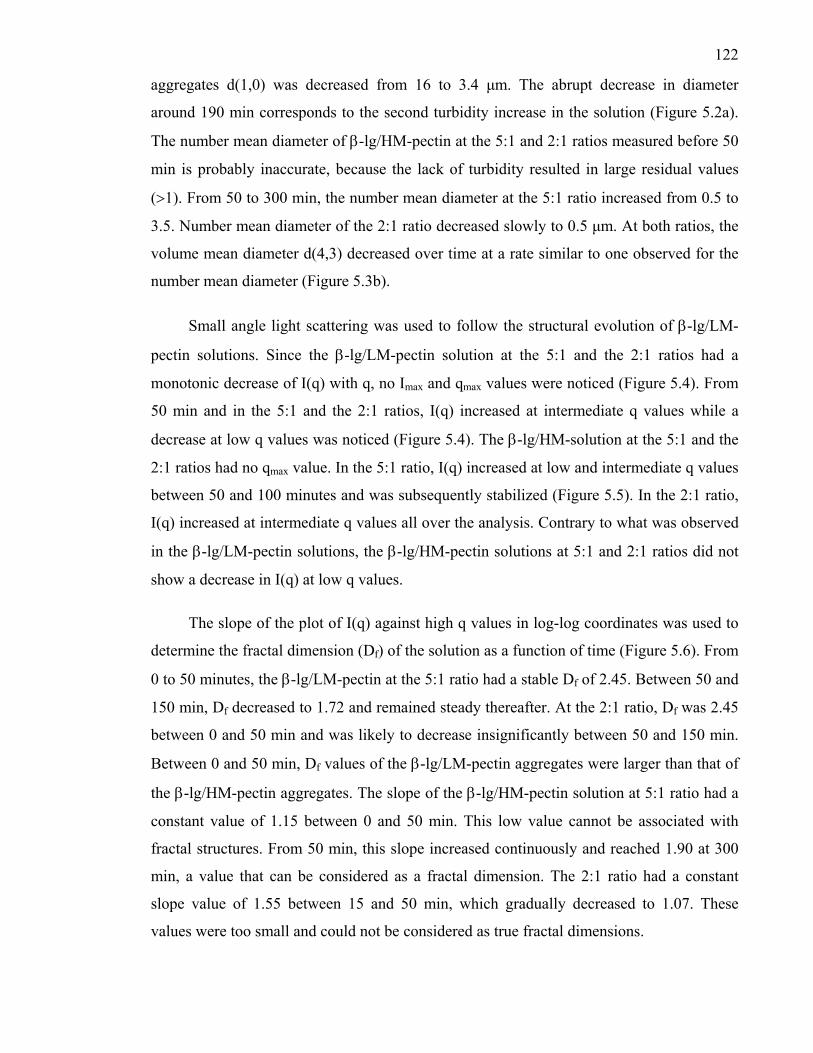
122
aggregates d(1,0) was decreased from 16 to 3.4 µm. The abrupt decrease in diameter
around 190 min corresponds to the second turbidity increase in the solution (Figure 5.2a).
The number mean diameter of β-lg/HM-pectin at the 5:1 and 2:1 ratios measured before 50
min is probably inaccurate, because the lack of turbidity resulted in large residual values
(>1). From 50 to 300 min, the number mean diameter at the 5:1 ratio increased from 0.5 to
3.5. Number mean diameter of the 2:1 ratio decreased slowly to 0.5 µm. At both ratios, the
volume mean diameter d(4,3) decreased over time at a rate similar to one observed for the
number mean diameter (Figure 5.3b).
Small angle light scattering was used to follow the structural evolution of β-lg/LM-
pectin solutions. Since the β-lg/LM-pectin solution at the 5:1 and the 2:1 ratios had a
monotonic decrease of I(q) with q, no Imax and qmax values were noticed (Figure 5.4). From
50 min and in the 5:1 and the 2:1 ratios, I(q) increased at intermediate q values while a
decrease at low q values was noticed (Figure 5.4). The β-lg/HM-solution at the 5:1 and the
2:1 ratios had no qmax value. In the 5:1 ratio, I(q) increased at low and intermediate q values
between 50 and 100 minutes and was subsequently stabilized (Figure 5.5). In the 2:1 ratio,
I(q) increased at intermediate q values all over the analysis. Contrary to what was observed
in the β-lg/LM-pectin solutions, the β-lg/HM-pectin solutions at 5:1 and 2:1 ratios did not
show a decrease in I(q) at low q values.
The slope of the plot of I(q) against high q values in log-log coordinates was used to
determine the fractal dimension (Df) of the solution as a function of time (Figure 5.6). From
0 to 50 minutes, the β-lg/LM-pectin at the 5:1 ratio had a stable Df of 2.45. Between 50 and
150 min, Df decreased to 1.72 and remained steady thereafter. At the 2:1 ratio, Df was 2.45
between 0 and 50 min and was likely to decrease insignificantly between 50 and 150 min.
Between 0 and 50 min, Df values of the β-lg/LM-pectin aggregates were larger than that of
the β-lg/HM-pectin aggregates. The slope of the β-lg/HM-pectin solution at 5:1 ratio had a
constant value of 1.15 between 0 and 50 min. This low value cannot be associated with
fractal structures. From 50 min, this slope increased continuously and reached 1.90 at 300
min, a value that can be considered as a fractal dimension. The 2:1 ratio had a constant
slope value of 1.55 between 15 and 50 min, which gradually decreased to 1.07. These
values were too small and could not be considered as true fractal dimensions.
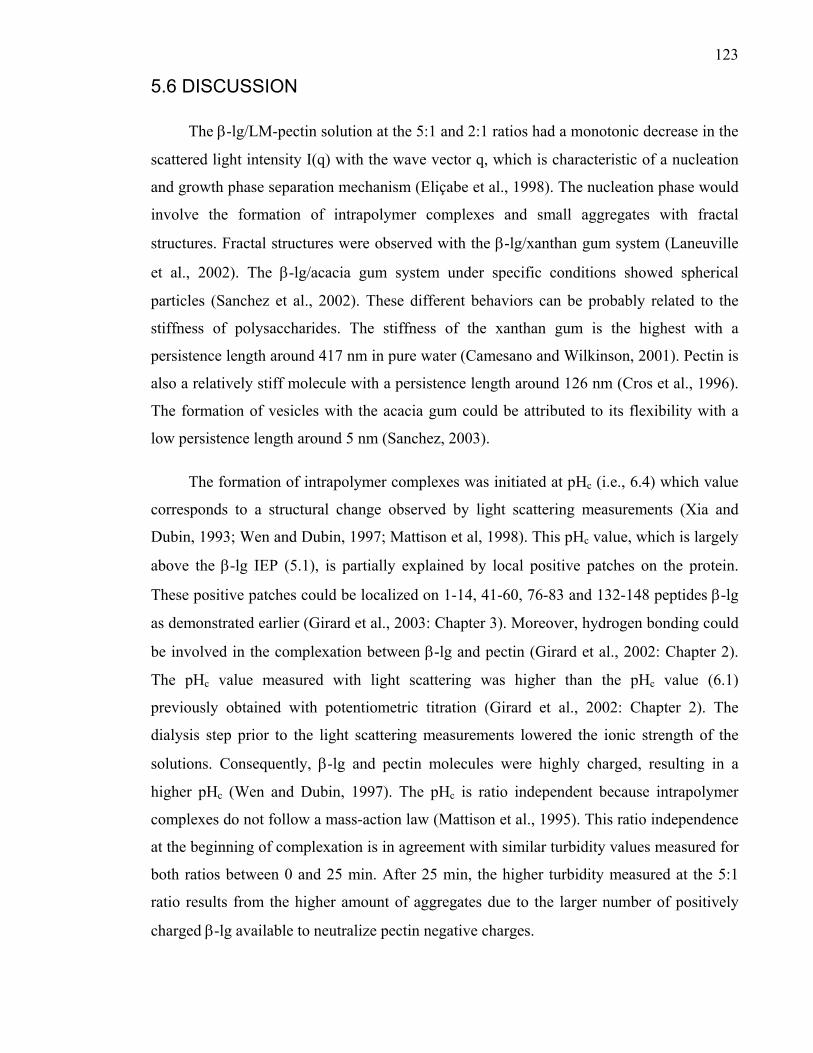
123
5.6 DISCUSSION
The β-lg/LM-pectin solution at the 5:1 and 2:1 ratios had a monotonic decrease in the
scattered light intensity I(q) with the wave vector q, which is characteristic of a nucleation
and growth phase separation mechanism (Eliçabe et al., 1998). The nucleation phase would
involve the formation of intrapolymer complexes and small aggregates with fractal
structures. Fractal structures were observed with the β-lg/xanthan gum system (Laneuville
et al., 2002). The β-lg/acacia gum system under specific conditions showed spherical
particles (Sanchez et al., 2002). These different behaviors can be probably related to the
stiffness of polysaccharides. The stiffness of the xanthan gum is the highest with a
persistence length around 417 nm in pure water (Camesano and Wilkinson, 2001). Pectin is
also a relatively stiff molecule with a persistence length around 126 nm (Cros et al., 1996).
The formation of vesicles with the acacia gum could be attributed to its flexibility with a
low persistence length around 5 nm (Sanchez, 2003).
The formation of intrapolymer complexes was initiated at pHc (i.e., 6.4) which value
corresponds to a structural change observed by light scattering measurements (Xia and
Dubin, 1993; Wen and Dubin, 1997; Mattison et al, 1998). This pHc value, which is largely
above the β-lg IEP (5.1), is partially explained by local positive patches on the protein.
These positive patches could be localized on 1-14, 41-60, 76-83 and 132-148 peptides β-lg
as demonstrated earlier (Girard et al., 2003: Chapter 3). Moreover, hydrogen bonding could
be involved in the complexation between β-lg and pectin (Girard et al., 2002: Chapter 2).
The pHc value measured with light scattering was higher than the pHc value (6.1)
previously obtained with potentiometric titration (Girard et al., 2002: Chapter 2). The
dialysis step prior to the light scattering measurements lowered the ionic strength of the
solutions. Consequently, β-lg and pectin molecules were highly charged, resulting in a
higher pHc (Wen and Dubin, 1997). The pHc is ratio independent because intrapolymer
complexes do not follow a mass-action law (Mattison et al., 1995). This ratio independence
at the beginning of complexation is in agreement with similar turbidity values measured for
both ratios between 0 and 25 min. After 25 min, the higher turbidity measured at the 5:1
ratio results from the higher amount of aggregates due to the larger number of positively
charged β-lg available to neutralize pectin negative charges.
124
The fact that the diameters and the Df decreased and the turbidity increased between 0
and 45 min is indicative of the formation of a substantial amount of equal-size complexes
or small aggregates. The formation of such assemblies corresponds to the induction time
following the nucleation phase, where nuclei have to reach a critical size. This induction
time was previously observed with small aggregates that had to reach a critical
neutralization before they aggregate into larger interpolymer complexes (Tsuboi et al.,
1996). Balsara et al. (1996) demonstrated that polyolefin clusters formed at the end of the
early stage of nucleation have the characteristics of critical nuclei as the phase separation
kinetics increased dramatically after their formation.
The second increase in turbidity of the β-lg/LM-pectin solution at the 5:1 ratio may
result from a phase separation that transiently increases turbidity (Sanchez et al., 2002). The
phase separation arising around 45 min, which corresponded to a pHφ value of 5.00, is
associated with the aggregation of intrapolymer complexes called the growth phase. β-
lg/LM-pectin intrapolymer complexes at the 2:1 ratio are believed to aggregate after 185
min when the pHφ value is 4.10. This pHφ value is much lower than the pHφ of 5.00
obtained for the 5:1 ratio. In fact, the pHφ was expected to decrease with lower
protein/pectin ratios, because of the fewer positive charges from β-lg that are available to
neutralize the higher amount of pectin negative charges (Mattison et al., 1995). This result
was also observed on micrographs where the 2:1 ratio had a lower amount of aggregated
structures than the 5:1 ratio. The two steps involved in the complexation, known as the
intrapolymer and interpolymer complex formation, were previously shown with isothermal
titration calorimetry for the same β-lg/LM-pectin system at pH 4 (Girard et al., 2003:
Chapter 4).
During the growth phase, the number and volume mean diameters and fractal
dimensions of the β-lg/LM-pectin aggregates at the 2:1 and the 5:1 ratios decreased with
acidification. The number and volume mean diameters and Df decreased more slowly and
to a lesser extent in the 2:1 ratio than in the 5:1 ratio. This is explained by the lower
formation of small assemblies at the 2:1 ratio than at the 5:1 ratio because of the fewer β-lg
molecules available to interact with the pectin. The higher number mean diameter at the 2:1
ratio compared to that at the 5:1 ratio can be explained by a bridging phenomenon resulting
125
from the non-saturation of pectin negative charges with β-lg molecules (Wangsakan et al.,
2001). These diameter and Df decreases may be explained by the formation of small
assemblies, the increasing insoluble interpolymer complexes sedimentation, and/or a
multiple scattering phenomenon resulting from the great obscuration with the acidification
of the solution. The formation of a higher amount of small assemblies is a realistic
hypothesis supported by a nucleation and growth mechanism. The increase in the amount of
aggregates with lower pH values is in agreement with micrographs presented earlier.
Moreover, the shoulder observed at t = 50 min with I(q) increasing at intermediate q values
is consequential to the increase in the amounts of complexes and aggregates with lower pH
values. Given that the fractal dimension is affected by the system equilibrium, an increase
in the amount of small assemblies could lead to a decrease in the slope of I(q) in function of
q in log-log coordinates, and consequently in the Df value over time. The decrease of the Df
value after 50 min can also be explained by the intrapolymer complexes having a more
compact structure than the interpolymer complexes. The turbidity values are still increasing
at the end of the analysis for both ratios and indicate that the interaction between β-lg and
LM-pectin was not at equilibrium. The ongoing nucleation process broadens size
distribution and decreases its mean value, while the total number of particles increases
(Moschiar et al., 1991). Sedimentation could also explain the lowering of the volume mean
diameter, the lowering of I(q) at low q values, and the difference with isothermal titration
calorimetry results, which showed a higher binding stoichiometry in interpolymer
complexes (Girard et al, 2003: Chapter 4). The vertical shifting of I(q) plotted against q
curves was observed with aggregated hematite and attributed to sedimentation (Bushell and
Amal, 2000). The existence of a multiple scattering phenomenon for the 2:1 ratio is
unlikely since the turbidity of the solution was relatively low.
The β-lg/HM-pectin solutions at the 5:1 and 2:1 ratios exhibited a monotonic
decrease in I(q) with the wave vector. Consequently, the structuring of the β-lg/HM-pectin
solution likely occurred through a nucleation and growth mechanism. According to
turbidity measurements and microscopic observations, intrapolymer and interpolymer
complexes are more slowly formed with HM-pectin than with LM-pectin. The difference
between the pHc values of intrapolymer complexes containing LM- or HM-pectin is
126
attributed to the difference in the polysaccharide charge density (Park et al., 1992). The first
signs of turbidity in the β-lg/HM-pectin solutions at the 5:1 and 2:1 ratios were observed
later than with LM-pectin (i.e. at 21 and 28 min and at a pHc of 5.1). Despite the prior
dialysis step, this pHc value obtained with HM-pectin is lower than the pHc value of 5.5,
which was determined with potentiometric titration (Girard et al., 2002: Chapter 2).
The constant Df and number mean diameter of the β-lg/HM-pectin at the 5:1 and the
2:1 ratio, along with the increase in turbidity, are indicative of the formation of large
amounts of assemblies of similar size. The high volume mean diameters observed between
0 and 50 min could be attributed to flocculation. The low values of Df between 0 and 50
min are associated with the induction time, characteristic of a nucleation and growth
mechanism, where only very small aggregated structures are formed as shown on
micrographs.
β-lg/HM-pectin aggregates at 5:1 ratio, which were small at the beginning, grew over
time, and became more compact with higher Df values. The phase separation occurred
around 64 min with a pHφ of 4.30 as critical nuclei were formed, associated with an
increase in turbidity, in number mean diameter, and in fractal dimension. The absence of
pHφ value at the 2:1 ratio confirms that the system is more in the nucleation phase of the
process than in the growth phase. Because of the small size of aggregates at the 2:1 ratio, as
shown on the micrographs, the slopes of I(q) according to q in log-log coordinates could
not be associated with fractal structures. The slope values around 1 obtained for the β-
lg/HM-pectin solution at 5:1 and 2:1 ratios could be associated with rod-like structures. On
the other hand, measurements on the β-lg/HM-pectin solution may have been carried out in
the wrong window of observation. Consequently, the structure of such small structures
could be more accurately determined with small angle neutron scattering. A shoulder of
I(q) was visible at intermediate q values for the 5:1 and 2:1 ratios indicating a local
ordering of increasing complex and aggregate amounts. Since I(q) plotted against q curves
did not decrease with time at low q values, sedimentation is believed to be of less
importance than with LM-pectin.
127
5.7 CONCLUSION
Small angle static light scattering revealed that acidification-induced complexation
between β-lg and pectin follows a nucleation and growth mechanism. Also, it was shown
that complexation is a two-step process involving the formation of intrapolymer and
interpolymer complexes. Complexes obtained through acidification of β-lg/LM-pectin
solutions had fractal structures. According to the evolution of the Df value, intrapolymer
complexes have a more compact structure than interpolymer complexes. The β-lg/HM-
pectin complexes could be associated with rod-like structures. Such small structures could
be studied with small angle neutron scattering. Acidification of solutions increased the
amounts of small assemblies leading to a structuration of the systems. Phase contrast
microscopy confirmed the results obtained from light scattering measurements. This study
allows a better understanding of protein/polysaccharide acidified solutions and could be
used to improve the β-lg/pectin complexes production as microencapsulation devices.
Further studies are needed to verify the impact of the GDL used as an acidifying agent to
induce the complexation of β-lg and pectin.
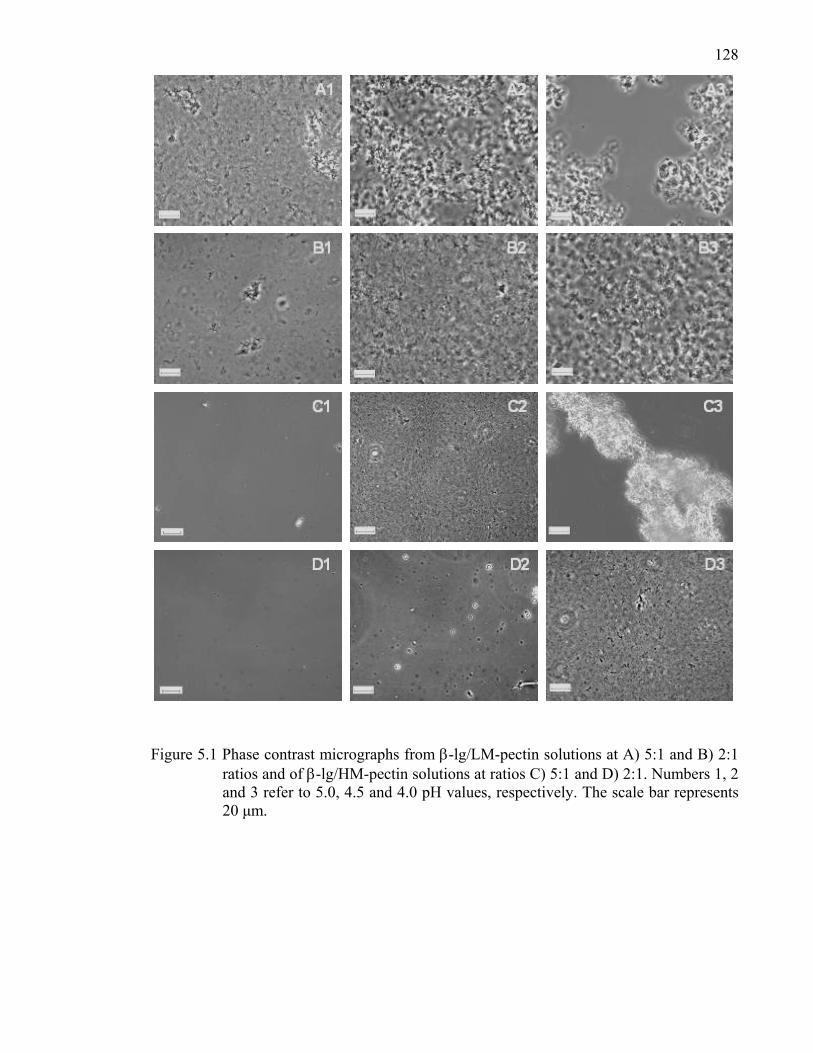
128
Figure 5.1 Phase contrast micrographs from β-lg/LM-pectin solutions at A) 5:1 and B) 2:1 ratios and of β-lg/HM-pectin solutions at ratios C) 5:1 and D) 2:1. Numbers 1, 2 and 3 refer to 5.0, 4.5 and 4.0 pH values, respectively. The scale bar represents 20 µm.
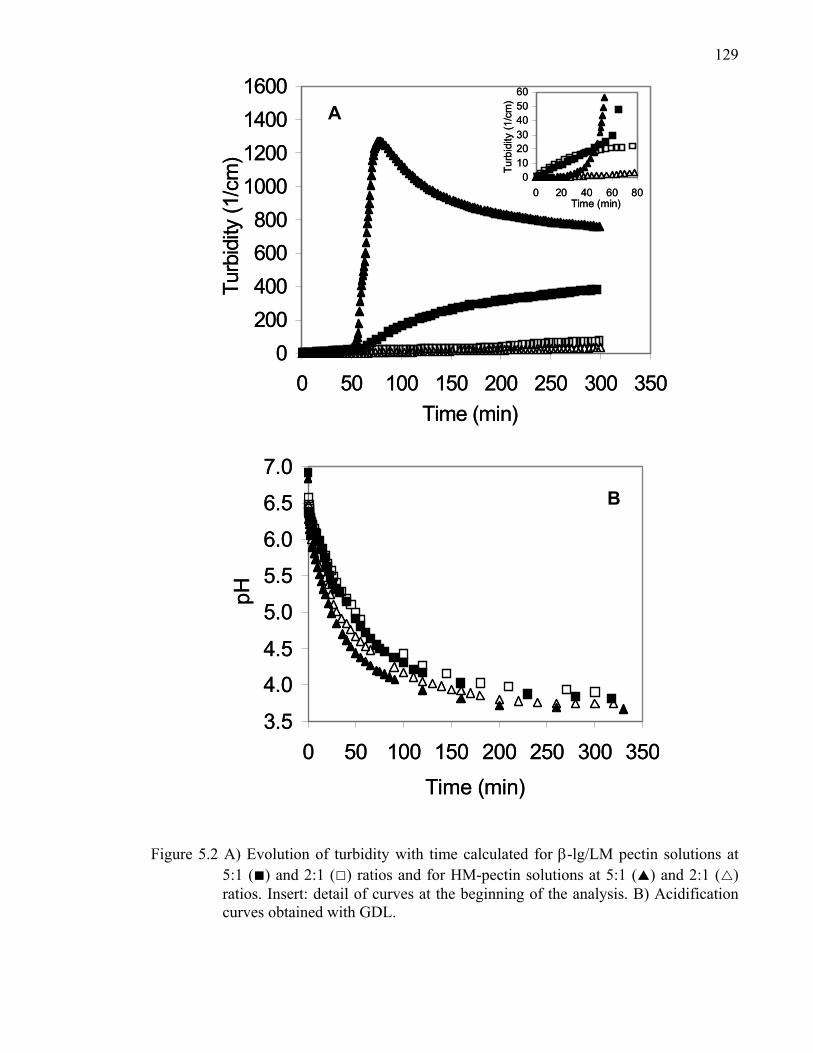
129
0200400600800
1000120014001600
0 50 100 150 200 250 300 350Time (min)
Turb
idity
(1/c
m)
0102030405060
0 20 40 60 80Time (min)
Turb
idity
(1/c
m)
0200400600800
1000120014001600
0 50 100 150 200 250 300 350Time (min)
Turb
idity
(1/c
m)
0102030405060
0 20 40 60 80Time (min)
Turb
idity
(1/c
m)
A
3.5
4.0
4.5
5.0
5.5
6.0
6.5
7.0
0 50 100 150 200 250 300 350Time (min)
pH
B
3.5
4.0
4.5
5.0
5.5
6.0
6.5
7.0
0 50 100 150 200 250 300 350Time (min)
pH
B
B
Figure 5.2 A) Evolution of turbidity with time calculated for β-lg/LM pectin solutions at 5:1 (■) and 2:1 (□) ratios and for HM-pectin solutions at 5:1 ( ) and 2:1 ( ) ratios. Insert: detail of curves at the beginning of the analysis. B) Acidification curves obtained with GDL.
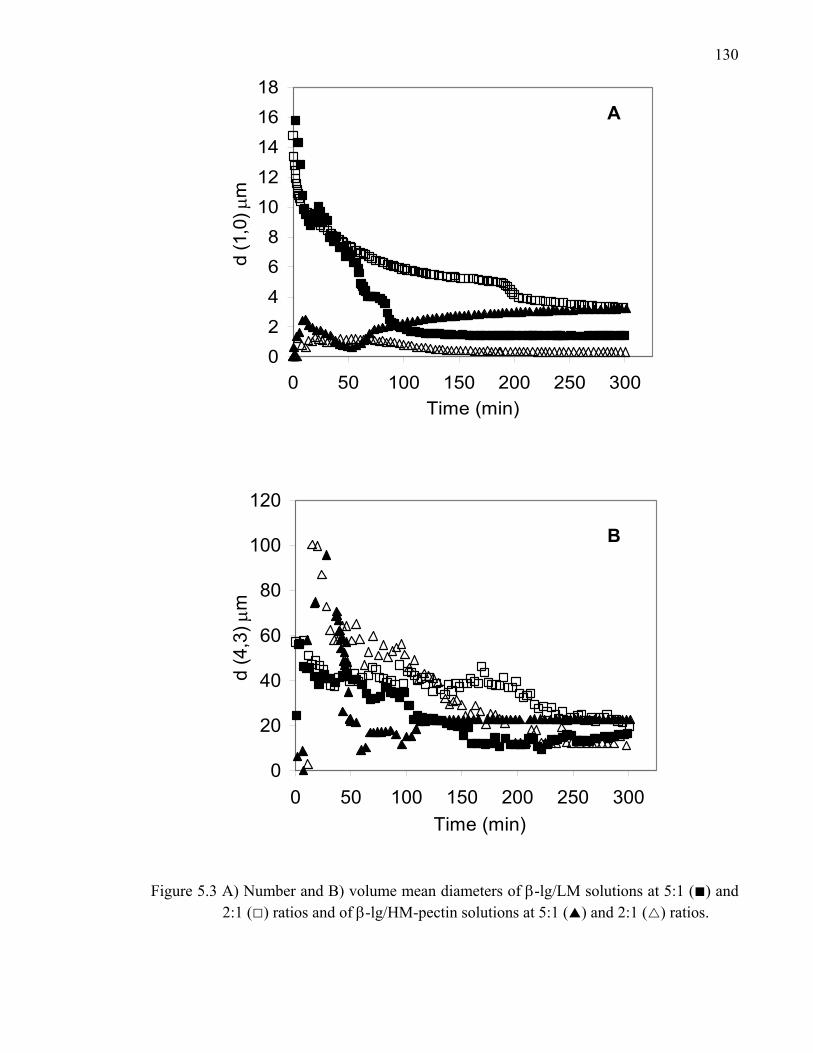
130
02468
1012141618
0 50 100 150 200 250 300Time (min)
d (1
,0) µ
m
A
0
20
40
60
80
100
120
0 50 100 150 200 250 300Time (min)
d (4
,3) µ
m
B
Figure 5.3 A) Number and B) volume mean diameters of β-lg/LM solutions at 5:1 (■) and 2:1 (□) ratios and of β-lg/HM-pectin solutions at 5:1 ( ) and 2:1 ( ) ratios.
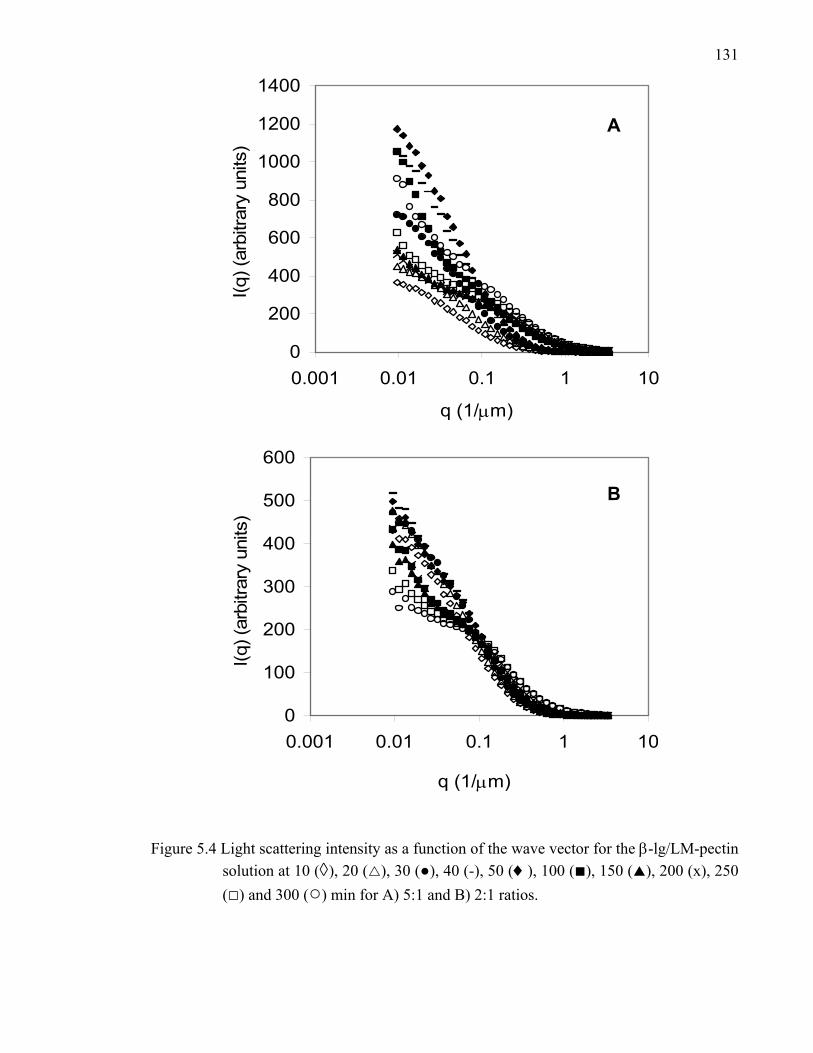
131
0
200
400
600
800
1000
1200
1400
0.001 0.01 0.1 1 10
q (1/µm)
I(q) (
arbi
trary
uni
ts)
A
0
100
200
300
400
500
600
0.001 0.01 0.1 1 10
q (1/µm)
I(q) (
arbi
trary
uni
ts)
B
Figure 5.4 Light scattering intensity as a function of the wave vector for the β-lg/LM-pectin solution at 10 (◊), 20 ( ), 30 (●), 40 (-), 50 (♦), 100 (■), 150 ( ), 200 (x), 250 (□) and 300 (○) min for A) 5:1 and B) 2:1 ratios.
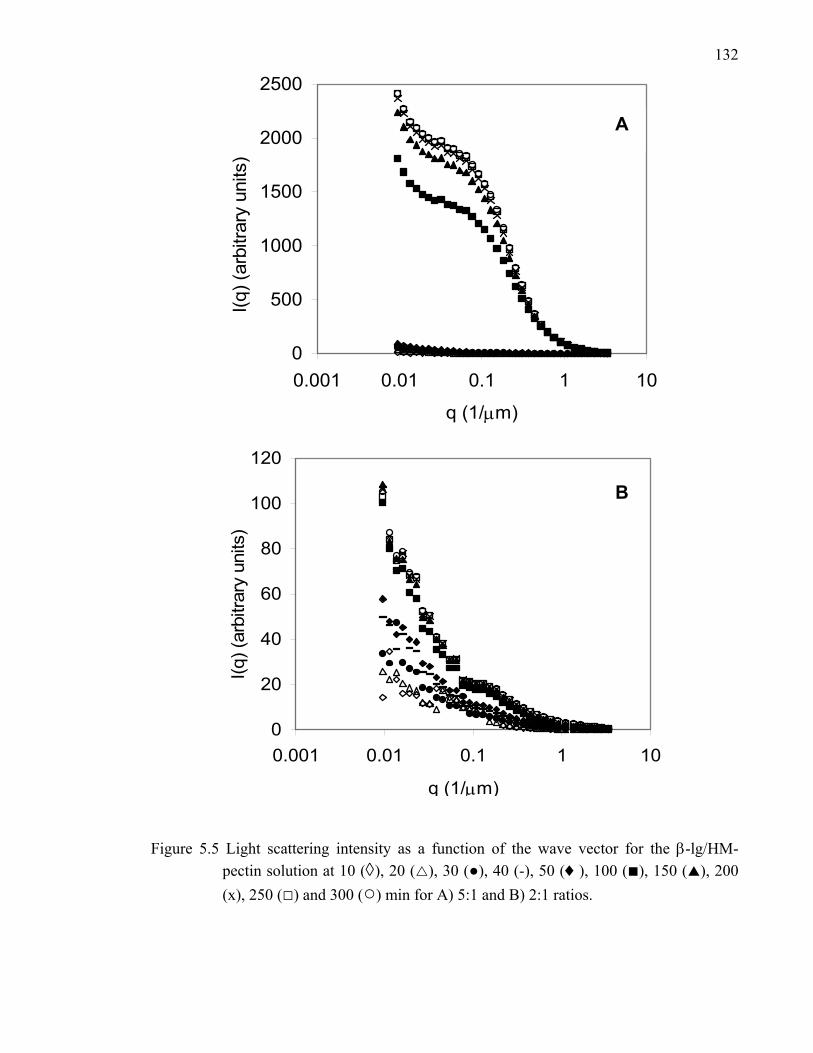
132
0
500
1000
1500
2000
2500
0.001 0.01 0.1 1 10
q (1/µm)
I(q) (
arbi
trary
uni
ts)
A
0
20
40
60
80
100
120
0.001 0.01 0.1 1 10
q (1/µm)
I(q) (
arbi
trary
uni
ts)
B
Figure 5.5 Light scattering intensity as a function of the wave vector for the β-lg/HM-pectin solution at 10 (◊), 20 ( ), 30 (●), 40 (-), 50 (♦), 100 (■), 150 ( ), 200 (x), 250 (□) and 300 (○) min for A) 5:1 and B) 2:1 ratios.
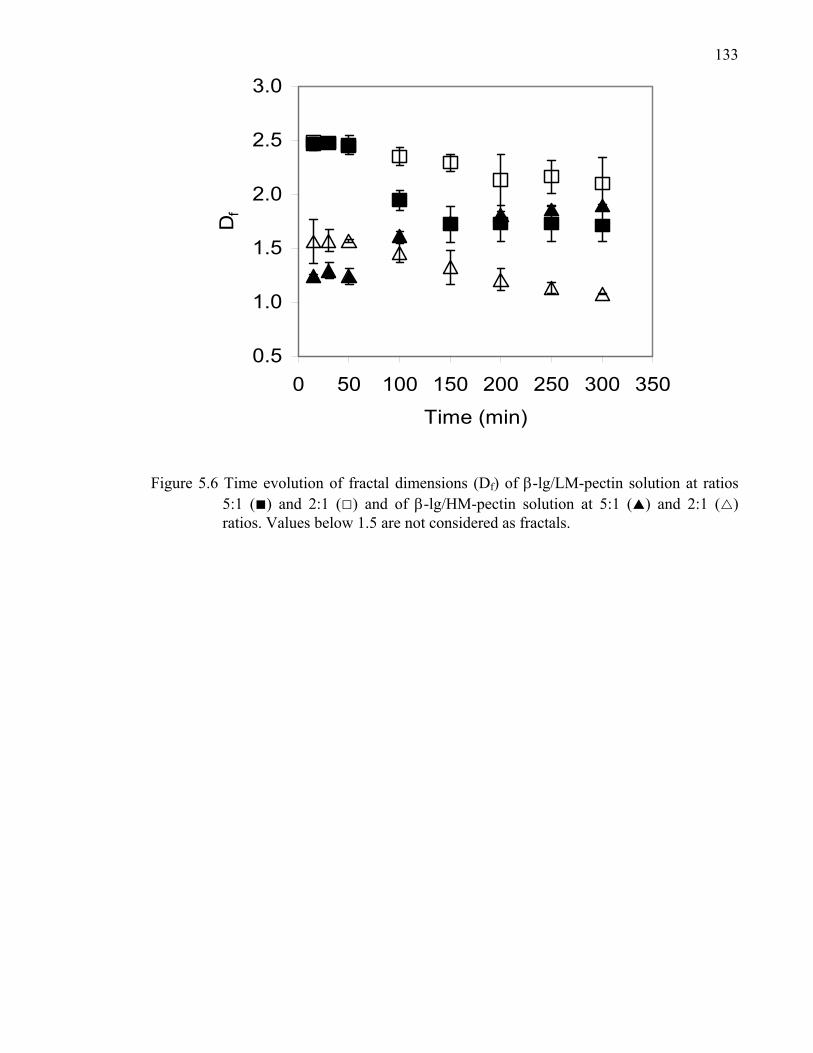
133
0.5
1.0
1.5
2.0
2.5
3.0
0 50 100 150 200 250 300 350
Time (min)
Df
Figure 5.6 Time evolution of fractal dimensions (Df) of β-lg/LM-pectin solution at ratios 5:1 (■) and 2:1 (□) and of β-lg/HM-pectin solution at 5:1 ( ) and 2:1 ( ) ratios. Values below 1.5 are not considered as fractals.

134
CHAPITRE 6: Conclusion générale
135
L’hypothèse de travail était que l’utilisation d’un modèle β-lg/pectine hautement ou
faiblement méthylée permettra de caractériser les interactions protéine/polysaccharide
anionique impliquées lors d’une complexation à pH acide à différentes conditions de pH, de
force ionique, et de concentration. Cette hypothèse a été vérifiée par l’utilisation du
système β-lg/pectine tout au long du projet en effectuant des liens entre la nature des
biopolymères utilisés et les résultats obtenus. La généralisation des résultats obtenus à
d’autres systèmes nécessite la prise en compte de nombreux facteurs, décrits au chapitre 1,
influençant la formation et la structure des complexes.
Le but du projet a été atteint puisque des connaissances fondamentales sur les
interactions entre les protéines et les polysaccharides anioniques ont été acquises à l’aide du
système modèle β-lactoglobuline/pectine en zone de compatibilité thermodynamique.
L’utilisation de méthodes de caractérisation complémentaires à permis de dresser un
portrait global des complexes β-lg/pectine.
Les pH de formation des complexes solubles (pHc) entre la β-lg et la pectine LM ou
HM ont été déterminés par titrage potentiométrique. L’initiation de la formation des
complexes est indépendante du ratio et diminue avec une augmentation de la force ionique
ou du DE de la pectine. La dissociation des complexes en présence de chlorure de sodium,
d’urée ou lors d’une augmentation de température à démontré que les interactions
maintenant les complexes β-lg/pectine LM ou HM sont majoritairement de nature
électrostatique et en partie de due à des liens hydrogène. Les complexes β-lg/pectine HM
ont une proportion de liens hydrogène plus importante que les complexes avec la pectine
LM.
La constante d’association, la stoechiométrie, la taille du site de liaison et la
coopérativité des complexes β-lg/pectine LM ou HM ont été déterminés par l’analyse
frontale continue en électrophorèse capillaire (FACCE) et le modèle des sites d’interaction
superposés. Les complexes formés avec la pectine LM ont démontré une coopérativité qui
n’a pas été observée avec la pectine HM. L’espace occupé par une molécule de β-lg est
d’environ 15 résidus D-galA à pH 4 et 6, alors qu’elle augmente à environ 50 résidus à
l’approche du point isoélectrique de la β-lg. L’ensemble des résultats obtenus jusqu’à
136
maintenant démontre que l’interaction entre la β-lg et la pectine diminue avec une
augmentation du pH, de la force ionique, de la température et du DE de la pectine. Les
peptides β-lg 132-148, 76-83, 41-60 et 1-14 sont potentiellement impliqués lors de
l’interaction avec la pectine en occupant un espace sur la pectine comparable à celui de la
β-lg. La présence de plus d’une zone réactive en surface de la β-lg lui permettrait de se lier
à plus d’une molécule de pectine.
Le titrage calorimétrique isothermique (ITC) a permis d’obtenir la constante
d’association, la stoechiométrie, l’enthalpie et l’entropie des complexes β-lg/pectine LM ou
HM à pH 4. Ainsi, la validation des résultats obtenus en électrophorèse capillaire a pu être
effectuée. Les résultats ont démontré que la complexation entre la β-lg et la pectine
s’effectue en deux étapes, correspondant à la formation de complexes intrapolymères
solubles suivie par leur agrégation en complexes interpolymères insolubles. La
complexation entre la β-lg et la pectine est spontanée lors de la formation des complexes
solubles et insolubles. La formation des complexes solubles est conduite par l’enthalpie
favorable alors que l’agrégation en complexes insolubles est le résultat de facteurs
enthalpique et entropique favorables. La première étape est peu influencée par le DE de la
pectine puisqu’à part la stoechiométrie, aucun des paramètres n’est significativement
différent. Lors de la deuxième étape, les complexes β-lg/pectine LM ont une
stoechiométrie, une constante d’association et une enthalpie dégagée plus élevées. Les
valeurs négatives d’enthalpie mesurées en ITC pourraient s’expliquer, en partie, par des
changements conformationnels de la pectine et de la β-lg lors de l’interaction.
Le suivi de l’évolution des complexes sous l’action acidifiante de la glucono-δ-
lactone (GDL) par diffusion statique de la lumière a confirmé les deux étapes de formation
des complexes qui avaient été observées par ITC. La nucléation et croissance est le
mécanisme de déstabilisation rencontré lors de la séparation de phase induite par la
complexation. Une augmentation de la quantité des complexes tout au long de
l’acidification donne lieu à une certaine organisation locale des systèmes. En accord avec
les mesures par titrage potentiométrique, la formation des complexes solubles est
indépendante du ratio. Cependant, un ratio plus élevé augmente la quantité de complexes
formés. Les complexes formés avec la pectine LM ont été obtenus en début d’acidification,
137
alors que ceux avec la pectine HM ont nécessité une acidification plus poussée. La
sédimentation des complexes contenant la pectine LM était plus importante qu’avec la
pectine HM démontrant la meilleure solubilité de ces derniers complexes. La microscopie
en contraste de phases a permis de visualiser la formation des complexes β-lg/pectine LM
ou pectine HM à différents ratios et pH, et de confirmer les résultats obtenus par diffusion
statique de la lumière.
En plus des résultats obtenus, le projet a permis de mettre en lumière l’utilisation de
techniques inhabituelles en sciences alimentaires. L’électrophorèse capillaire et le titrage
isothermique calorimétrique sont des techniques qui pourront être appliquées à d’autres
études d’interactions impliquant des molécules de poids moléculaires hétérogènes.
L’électrophorèse capillaire est un outil performant dans les conditions utilisées lorsque les
complexes formés sont de grandes tailles, les interactions fortes et lorsque le
polysaccharide porte une charge négative. Lorsque ces conditions ne sont pas rencontrées,
l’utilisation de l’ultrafiltration, malgré l’effet d’exclusion de Donnan, est une alternative
mieux adaptée. Ces techniques sont toutefois assez longues puisque l’élaboration d’un
isotherme d’interactions nécessite autant d’analyses qu’il y a de points. Selon moi, le titrage
isothermique calorimétrique est la technique la plus intéressante pour l’étude d’interactions
moléculaires. Cette technique est très rapide et présente un grand potentiel d’application
pour les interactions de toutes sortes. Le principal désavantage de cette technique est la
grande quantité de matériel nécessaire à sa réalisation. Cependant, ce facteur est souvent
peu limitant en sciences alimentaires. L’utilisation de cette technique requiert une bonne
connaissance des phénomènes qui, en plus de l’interaction, peuvent induire un dégagement
ou une absorption d’énergie dans le système à l’étude. En générale, la validité de ce travail
repose sur l’utilisation de multiples techniques permettant de vérifier d’une manière
rigoureuse la majorité des résultats obtenus. La faiblesse de cette étude est de ne pas tenir
compte de la distribution du poids moléculaire de la pectine et de la structure quaternaire de
la β-lactoglobuline lors du calcul de paramètres quantitatifs. Par conséquant, l’ensemble des
résultats obtenus permet de caractériser le système β-lg/pectine en solution de façon semi-
quantitative.
138
Les résultats présentés dans cette thèse pourront être complétés par l’étude de l’effet
de la complexation β-lg/pectine sur l’équilibre dimère/monomère de la β-lg et sur la
structure des deux macromolécules. L’influence de la nature de l’acidifiant sur le
mécanisme de formation et la structure des complexes pourra aussi être investiguée. Les
résultats peuvent aussi être exploités dans des projets plus appliqués portant, par exemple,
sur l’élaboration de complexes protéine/polysaccharide en tant qu’ingrédient alimentaire.
La grande fragilité des complexes semble être le principal obstacle à surmonter. La
comparaison entre les résultats obtenus en milieu dilué et le comportement des protéines et
polysaccharides en système concentré ou gélifié serait aussi une voie intéressante.
139
Bibliographie Ambjerg Pedersen, H.C.; Jørgensen, B.B. Influence of pectin on the stability of casein
solutions studied in dependence of varying pH and salt concentration. Food
Hydrocoll. 1991, 5, 323-328.
Antonov, Y.A.; Lashko, N.P.; Golotova, T.; Malovikova, A.; Markovich, O. Effect of
structural features of pectins and alginates on their thermodynamic compatibility
with gelatin in aqueous media. Food Hydrocoll. 1996, 10, 1-9.
Antonov, Y.A.; Soshinsky, A.A. Interactions and compatibility of ribuloso-1,5-
bisphosphate carboxylase/oxygenase from alfalfa with pectin in aqueous medium.
Int. J. Biol. Macromol. 2000, 27, 279-285.
Aymard, P.; Durand, D.; Nicolai, T. The effect of temperature and ionic strength on the
dimerisation of β-lactoglobulin. Int. J. Biol. Macromol. 1996, 19, 213-221.
Axelos, M.A.V.; Thibault, J.-F. Influence of the Substituents of the Carboxyl Groups and
of the Rhamnose Content on the Solution Properties and Flexibility of Pectins. Int.
J. Biol. Macromol. 1991, 13, 77-82.
Azegami, S.; Tsuboi, A.; Izumi, T.; Hirata, M.; Dubin, P.L.; Wang, B.; Kokufuta, E.
Formation of an intrapolymer complex from human serum albumin and
poly(ethylene glycol). Langmuir 1999, 15, 940-947.
Balsara, N.P.; Lin, C.; Hammouda, B. Early stages of nucleation and growth in a polymer
blend. Phys. Rev. Lett. 1996, 77, 3847-3850.
Barker, J.A. Lattice theories of the liquid state, Pergamon Press: Oxford, 1963, 133 pp.
Beaulieu, M.; Turgeon, S.L.; Doublier, J.-L. Rheology, texture and microstructure of whey
proteins/low methoxyl pectins mixed gels with added calcium. Int. Dairy J. 2001,
11, 961-967.
Braudo, E.E.; Antonov, Y.A. Non-coulombic complex formation of protein as a structure
forming factor in food systems. In Food proteins, structure and functionality,
Schwenke, VCH:Weinheim, 1993, pp 210-215.
140
Brynda, M.; Chodanowski, P.; Stoll, S. Polyelectrolyte-particle complex formation.
Polyelectrolyte linear charge density and ionic concentration effects. Monte Carlo
simulations. Colloid Polym. Sci. 2002, 280, 789-797.
Burgess, D.J. Practical analysis of complex coacervate systems. J. Colloid Interface Sci.
1990, 140, 227-138.
Burgess, D.J. Complex coacervation: micro-capsule formation. In Macromolecular
complexes in chemistry and biology. Springer-Verlag: Berlin, 1994, pp 285-325.
Burton, B.A.; Brant, D.A. Comparative Flexibility, Extension and Conformation of some
Simple Polysaccharide Chains. Biopolymers 1983, 22, 1769-1792.
Bushell, G.; Amal, R. Measurement of fractal aggregates of polydisperse particles using
small-angle light scattering. J. Colloid Interf. Sci. 2000, 221, 186-194.
Camesano, T.A.; Wilkinson, K.J. Single molecule study of xanthan conformation using
atomic force microscopy. Biomacromolecules 2001, 2, 1184-1191.
Cayot, P.; Lorient, D. Structures et technofonctions des protéines du lait, Arilait
Recherches: Paris, 1998, pp 37-182.
Chen, W.S.; Henry, G.A.; Gaud, S.M.; Miller, M.S.; Kaiser, J.M.; Balmaceda, E.A.;
Morgan, R.G.; Baer, C.C.; Borwankar, R.P.; Hellgeth, L.C.; Strandholm, J.J.;
Hasenhuettl, G.L.; Kerwin, P.J.; Chen, C.C.; Kratochvil, J.F.; Lloyd, W.L.;
inventors : Kraft Inc., assignee. 1989. Microfragmented ionic
polysaccharide/protein complexes solutions. U.S. Patent 4,559,233.
Chodanowski, P.; Stoll, S. Polyelectrolyte adsorption on charged particles: ionic
concentration and particle size effect-A Monte Carlo approach. J. Chem. Phys.
2001, 115, 4951-4960.
Cros, S.; Garnier, C.; Axelos, M.A.V.; Imberty, A. Solution conformations of pectin
polysaccharides: Determination by small angle neutron scattering, viscometry, and
molecular modeling. Biopolymers 1996, 39, 339-352.
De Wit, J.N. Structure and functional behavior of whey proteins. Neth. Milk Dairy J. 1981,
35, 47-64.
141
Dickinson, E.; Pawlowski, K. Effect of high-pressure treatment of protein on the rheology
of flocculated emulsions containing protein and polysaccharide. J Agric. Food
Chem. 1996, 44, 2992-3000.
Dickinson, E.; Galazka, V.B. Emulsion stabilisation by ionic and covalent complexes of β-
lactoglobulin with polysaccharides. Food Hydrocoll. 1991, 5, 281-296.
Dickinson, E.; McClement, D.J. Molecular Basis of Protein Functionality. In Advances in
Food Colloids, Blackie Academic: London, 1996, pp 27-76.
Dubin, P.L.; Gao, J.; Mattison, K. Protein purification by selective phase separation with
polyelectrolytes. Sep. Purif. Methods 1994, 23, 1-16.
Dubois, M.; Gilles, K.A.; Hamilton, J.K.; Rebers, P.S.; Smith, F. Colorimetric method for
determination of sugars and related substances. Anal. Chem. 1956, 28, 350-356.
Einhorn-Stoll, U.; Glasenapp, N.; Kunzek, H. Modified pectins in whey protein emulsions.
Narhung 1996, 2, s60-67.
Eliçabe, G.E.; Larrondo, H.A.; Williams, R.J.J. Polymerization-induced phase separation: a
maximum in the intensity of scattered light associated with a nucleation and growth
mechanism. Macromolecules 1997, 30, 6550-6555.
Eliçabe, G.E.; Larrondo H.A.; Williams R.J.J. Light scattering in the course of a
polymerization-induced phase separation by a nucleation and growth mechanism.
Macromolecules 1998, 31, 8173-8182.
Flory, P.J. Thermodynamics of high polymer solutions. J. Chem. Phys. 1942, 10, 51-61.
Flory, P.J. Principles of Polymer Chemistry, Cornell University Press: New York, 1953, pp
495-593.
Foegeding, E.A.; Kuhn, P.R.; Hardin, C.C. Specific divalent cation-induced changes during
gelation of β-lactoglobulin. J. Agric. Food Chem. 1992, 40, 2092-2097.
Fogolari, F.; Ragona, L.; Licciardi, S.; Romagnoli, S.; Michelutti, R.; Ugolini, R.; Molinari,
H. Electrostatic properties of bovine β-lactoglobulin. Proteins 2000, 39, 317-330.
142
Furukawa, H. Dynamic-scaling theory for phase-separating unmixing mixtures: growth
rates of droplets and scaling properties of autocorrelation functions, Physica 1984,
123A, 497-515.
Galazka, V.B.; Smith, D.; Ledward, D.A.; Dickinson, E. Complexes of bovine serum
albumin with sulphated polysaccharides: effects of pH, ionic strength and high
pressure treatment. Food Chem.1999, 64, 303-310.
Gao, J.Y.; Dubin, P.L.; Muhoberac, B.B. Measurement of the binding of proteins to
polyelectrolytes by frontal analysis continuous capillary electrophoresis. Anal.
Chem. 1997, 69, 2945-2951.
Gao, J.Y.; Dubin, P.L.; Muhoberac, B.B. Capillary electrophoresis and dynamic light
scattering studies of structures and binding characteristics of protein-polyelectrolyte
complexes. J. Phys. Chem. B 1998, 102, 5529-5535.
Girard, M.; Turgeon, S.L.; Gauthier, S.F. Interbiopolymer complexing between β-
lactoglobulin and low- or high-methoxyl pectin measured by potentiometric titration
and ultrafiltration. Food Hydrocoll. 2002, 16, 585-591.
Girard, M.; Turgeon, S.L.; Gauthier, S.F. Quantification of the interactions between β-
lactoglobulin and pectin through capillary electrophoresis analysis. J. Agric. Food
Chem. 2003 in press.
Girard, M.; Turgeon, S.L.; Gauthier, S.F. Thermodynamic parameters of β-
lactoglobulin/pectin complexes assessed by isothermal titration calorimetry. J.
Agric. Food Chem. 2003, 51, 4450-4455.
Gurov, A.N.; Gurova, N.V.; Tolstoguzov, V.B. Estimation of emulsifying properties of
proteins and their complexes with anionic polysaccharides. Narhung 1986, 30, 424-
428.
Gurov, A.N.; Nuss, P.V. Protein-polysaccharide complexes as surfactants. Narhung 1986,
30, 349-353.
Gurov, A.N.; Gurova, N.V.; Leontiev, A.L.; Tolstoguzov, V.B. Equilibrium and non-
equilibrium complexes between serum albumin and dextran sulfate- I. Complexing
143
conditions and composition of non-equilibrium complexes. Food Hydrocoll.1988, 2,
267-283.
Hallberg, R.K.; Dubin, P.L. Effect of pH on the binding of β-lactoglobulin to sodium
poly(styrenesulfonate). J. Phys. Chem. B 1998, 102, 8629-8633.
Harding, S.; Jumel, K.; Kelly, R.; Gudo, E.; Horton J.C.; Mitchell J.R. The structure and
nature of protein-polysaccharide complexes. In Food Protein, Structure and
Functionality, VCH: Weinheim, 1993, pp 216-226.
Hattori, T.; Hallberg, R.; Dubin, P.L. Roles of electrostatic interactions and polymer
structure in the binding of β-lactoglobulin to anionic polyelectrolyte: measurement
of binding constants by frontal analysis continuous capillary electrophoresis.
Langmuir 2000, 16, 9738-9743.
Hiemenz, P.C; Rajagopalan, R. Principles of colloid and surface science 3rd Edition, Marcel
Dekker: New York, 1997, 670 pp.
Hill, R.D.; Zadow, J.G. The Precipitation of Whey Proteins by Carboxymethylcellulose of
Differing Degrees of Substitution. J. Dairy Sci. 1974, 41, 373-380.
Huggins, M.L. Theory of solutions of high polymers. J. Am. Chem. Phys. 1942, 64, 1712-
1719.
Imeson, A.P.; Ledward, D.A.; Mitchell, J.R. On the nature on the interaction between some
anionic polysaccharides and proteins. J. Sci. Food Agric. 1977, 28, 669-672.
Israelachvili, J. Intermolecular and surface forces 2nd Edition, Academic Press: London,
1992, 450 pp.
Jeyarajah, S.; Allen, J.C. Calcium binding and salt-induced structural changes of native and
preheated β-lactoglobulin. J. Agric. Food Chem. 1994, 42, 80-85.
Kaibara, K.; Okasaki, T.; Bohidar, H.B.; Dubin, P.L. pH-induced coacervation in
complexes of bovine serum albumin and cationic polyelectrolytes.
Biomacromolecules 2000, 1, 100-107.
Kella, N.K.; Kinsella, J.E. Structural stability of β-lactoglobulin in the presence of
kosmotropic salts. Int..J. Peptide Protein Res. 1988, 32, 396-405.
144
Kim, A.Y.; Berg, J.C. Fractal heteroaggregation of oppositely charged colloids. J. Colloid
Interf. Sci. 2000, 229, 607-614.
Kokufuta, E. Functional immobilized biocatalysts. Prog. Polym. Sci. 1992, 17, 647-697.
Kontopidis, G.; Holt, C.; Sawyer, L. The ligand-binding site of bovine β-Lactoglobulin:
evidence for a function? J. Mol. Biol. 2002, 318, 1043-1055.
Kuhn, P.R.; Foegeding, E.A. Mineral salt effects on whey protein gelation. J. Agric. Food
Chem. 1991, 39, 1013-1016.
Laneuville, S.I.; Paquin, P.; Turgeon, S.L. Effect of preparation conditions on the
characteristics of whey protein-xanthan gum complexes. Food Hydrocoll. 2000, 14,
305-314.
Laneuville, S.I.; Sanchez, C.; Turgeon S.L.; Hardy, J.; Paquin, P. Study of β-
lactoglobulin/xanthan gum complexation by small angle light scattering. Annual
Meeting of the American Dairy Science Association and American Society of
Animal Science, Quebec city, July 21-25, 2002.
Le Hénaff, S. Microparticules de complexes de protéines de lactosérum et de xanthane
comme substitut de matière grasse. Mémoire de maîtrise, 1996, Université Laval,
Québec.
Ledward, D.A. Protein-Polysaccharide Interactions. In Polysaccharides in Food,
Butterworth & Co ltd: London, 1979, pp 205-217.
Li, Y.; Mattison, K.; Dubin, P.L.; Havel, H.A.; Edwards, S.L. Light scattering studies of the
binding of bovine serum albumin to a cationic polyelectrolyte. Biopolymers 1996,
38, 527-533.
Mallamace, F.; Micali, N.; Trusso, S. A light scattering study of spinodal decomposition
systems containing surfactant molecules. J. Phys.: Condens. Matter 1996, 8, A81-
A101.
Mattison, K.W.; Brittain, I.J.; Dubin, P.L. Protein-polyelectrolyte phase boundaries.
Biotechnol. Prog. 1995, 11, 632-637.
145
Mattison, K.W.; Dubin, P.L.; Brittain, I.J. Complex formation between bovine serum
albumin and strong polyelectrolytes: effects of polymer charge density. J. Phys.
Chem. B 1998, 102, 3830-3836.
Mattison, K.; Wang, Y.; Grymonpré, K.; Dubin, P.L. Micro- and macro-phase behavior in
protein-polyelectrolyte systems. Macromol. Symp. 1999, 140, 53-76.
McGhee, J.D.; von Hippel, P.H. Theoretical aspects of DNA-protein interactions:
Cooperative and non-cooperative binding of large ligands to a one-dimensional
homogeneous lattice. J. Mol. Biol. 1974, 86, 469-489.
McKenzie, H.A.; Sawyer, W.H. Effect of pH on β-lactoglobulins. Nature 1967, 214, 1101-
1104.
McKenzie, H.A.; Ralston, G.B.; Shaw, D.C. Location of sulfhydryl and disulfide groups in
bovine β-lactoglobulins and effects of urea. Biochemistry 1972, 11, 4534-4547.
Morr, C.V.; Ha, E.Y.W. Whey protein concentrates and isolates: processing and functional
properties. Crit. Rev. Food Sci. Nutr. 1993, 33, 431-476.
Moschiar, S.M.; Riccardi, C.C.; Williams, R.J.J.; Verchere, D.; Sautereau, H.; Pascault, J.P.
Rubber-modified epoxies. 3. Analysis of experimental trends through a phase-
separation model. J. Appl. Polym. Sci. 1991, 42, 717-735.
Nakajima, A.; Sato, H. Phase relationships of an equivalent mixture of sulfated polyvinyl
alcohol and aminoacetalyzed polyvinyl alcohol in microsalt aqueous solution.
Biopolymers 1972, 10, 1345-1355.
Nangia-Makker, P.; Conklin, J.; Hogan, V.; Raz, A. Carbohydrate-binding proteins in
cancer, and their ligands as therapeutic agents. Trends Molec. Med. 2002, 8, 187-
192.
Ndi, E.E.; Swanson, B.G.; Barbosa-Canovas, G.V.; Luedecke L.O. Rheology and
microstructure of β-lactoglobulin/sodium polypectate gels. J. Agric. Food Chem.
1996a, 44, 86-92.
146
Ndi, E.E.; Swanson, B.G.; Dunker, A.K.; Luedecke, L.O. Relation of β-lactoglobulin-
Sodium Polypectate to Bulk Macromolecular Concentration, J. Food Sci. 1996b, 61,
69-73.
Noiseux, I.; Gauthier, S.F.; Turgeon, S.L. Interactions between bovine β-lactoglobulin and
peptides under different physicochemical conditions. J. Agric. Food Chem. 2001,
50, 1587-1592.
O’Brien, R.; Rugman, P.; Renzoni, D.; Layton, M.; Handa, R.; Hilyard, K.; Waterfield,
M.D.; Driscoll, P.C.; Ladbury, J.E. Alternative modes of binding of proteins with
tandem SH2 domains. Protein Sci. 2000, 9, 570-579.
O’Brien, R.; Ladbury, J.E.; Chowdhry, B.Z. Isothermal titration calorimetry. In A practical
approach to protein-ligand interactions: Hydrodynamics and calorimetry, IRL
Press: Oxford, 2001, pp 263-286.
Overbeek, J.T.J.; Voorn, M.J. Phase separation in polyeletrcolyte solutions. Theory of
complex coacervation. J. Cell. Comp. Physiol. 1957, 49 (S1) 7.
Park, J.M.; Muhoberac, B.B.; Dubin, P.L.; Xia, J. Effects of protein charge heterogeneity in
protein-polyelectrolyte complexation. Macromolecules 1992, 25, 290-295.
Pessen, H.; Purcell, J.M.; Farrel H.M., Jr. Proton relaxation rates of water in dilute
solutions of β-lactoglobulin. Determination of cross relaxation and correlation with
structural changes by the use of two genetic variants of self-associating globular
protein. Biochim. Biophys. Acta. 1985, 828, 1-12.
Phillips, G.O.; Williams, P.A. Interactions of hydrocolloids in food systems. In Ingredient
interactions, effects on food quality; Marcel Dekker, Inc.: New York, 1995, pp 131-
169.
Piculell, L.; Lindman, B. Association and segregation in aqueous polymer/polymer,
polymer/surfactant and surfactant/surfactant mixtures: similarities and differences.
Adv. Colloid Interface Sci. 1992, 41, 149-178.
147
Piculell, L.; Bergfeldt, K.; Nilsson, S. Factors determining phase behaviour of multi-
component polymer systems. In Biopolymer Mixtures; Nottingham University
Press: Nottingham, 1995, pp 13-36.
Prausnitz, J.M.; Lichtenthaler, R.N.; de Azevedo, E.G. Molecular Thermodynamics of
Fluid-Phase Equilibria 3rd Edition, Prentice-Hall inc.: New Jersey, 1999, pp 9-117,
213-453.
Prokop, A.; Kozlov, E.; Newman, G.W.; Newman, M.J. Water-based nanoparticulate
polymeric system for protein delivery: permeability control and vaccine application.
Biotechnol. Bioeng. 2002, 78, 459-466.
Qin, B.Y.; Bewley, M.C.; Creamer, L.K.; Baker, H.M.; Baker, E.N.; Jameson, G.B.
Structural basis of the Tanford transition of bovine β-lactoglobulin. Biochemistry
1998b, 37, 14014-14023.
Qin, B.Y.; Creamer, L.K.; Baker, E.D.; Jameson, G.B. 12-Bromododecanoic acid binds
inside the calyx of bovine β-lactoglobulin. FEBS Lett. 1998a, 438, 272-278.
Ragona, L.; Pusterla, F.; Zetta, L.; Monaco, H.L.; Molinari, H. Identification of a conserved
hydrophobic cluster in partially folded bovine β-lactoglobulin at pH 2. Fold. Des.
1997, 2, 281-290.
Ragona, L.; Catalano, M.; Zetta, L.; Longhi, R.; Fogolari, F.; Molinari, H. Peptide models
of folding initiation sites of bovine β-lactoglobulin: Identification of nativelike
hydrophobic interactions involving G and H strands. Biochemistry 2002, 41, 2786-
2796.
Renard, C.M.G.C.; Thibault, J-F. Structure and properties of apple and sugar-beet pectins
extracted by chelating agents. Carbohydr. Res. 1993, 244, 99-114.
Renard, D.; Lefebvre, J.; Griffin, M.-C.-A.; Griffin, W.-G. Effects of pH and salt
environment on the association of β-lactoglobulin revealed by intrinsic fluorescence
studies. Int. J. Biol. Macromol. 1998, 22, 41-49.
148
Rouw, P.W.; Woutersen, A.T.J.M.; Ackerson, B.J.; De Kruif, C.G. Adhesive hard sphere
solutions V. Observation of spinodal decomposition in a colloid solution. Phys. A
1989, 156, 876-898.
Sakurai, K.; Oobatake, M.; Goto, Y. Salt-dependent monomer-dimer equilibrium of bovine
β-lactoglobulin at pH 3. Protein Sci. 2001, 10, 2325-2335.
Samant, S.K.; Singhal, R.S.; Kulkarni, P.R.; Rege, D.V. Protein-polysaccharide
interactions: a new approach in food formulation. Int. J. Food Sci. Technol. 1993,
28, 547-562.
Sanchez, C.; Mekhloufi, G.; Schmitt, C.; Renard, D.; Robert, P.; Lehr, C.-M.; Lamprecht,
A.; Hardy, J. Self-assembly of β-lactoglobulin and acacia gum in aqueous solvent:
Structure and phase-ordering kinetics. Langmuir 2002, 18, 10323-10333.
Sanchez, C. Communication personnelle, 2003.
Sawyer, L.; Kontopidis, G. The core lipocalin, bovine β-lactoglobulin. Biochim. Biophys.
Acta 2000, 1482, 136-148.
Sawyer, L.; Kontopidis, G; Wu, S.-Y. β-lactoglobulin - A three-dimensional perspective.
Int. J. Food Sci. Technol. 1999, 34, 409-418.
Scatchard, G. The attractions of proteins for small molecules and ions. Ann. N.Y. Acad. Sci.
1949, 51, 660-672.
Schmitt, C.; Sanchez, C.; Desobry-Banon, S.; Hardy, J. Structure and functional properties
of protein-polysaccharide complexes: a review. Crit. Rev. Food Sci. Nutr. 1998, 38,
689-753.
Schmitt, C.; Sanchez. C.; Despond, S.; Renard, D.; Robert, P.; Hardy, J. Structural
modification of β-lactoglobulin as induced by complex coacervation with acacia
gum. In J. Food Colloids-Fundamentals of Formulation, Royal Society of
Chemistry: Cambridge, 2001, pp 323-331.
Semenova, M.G.; Bolotina, V.S.; Dmitochenko, A.P. The factors affecting the
compatibility of serum albumin and pectinate in aqueous medium. Carbohydr.
Polym. 1991, 15, 367-385.
149
Semenova, M.G. Factor determining the character of biopolymer-biopolymer interactions
in multicomponent aqueous solutions modeling food systems. In Macromolecular
Interactions in Food Technology,ACS Symposium Series 650: Washington DC,
1996, pp 37-49.
Singh, O.N.; Burgess, D.J. Characterization of albumin-alginic acid complex coacervation.
J. Pharm.Pharmacol. 1989, 41, 670-673.
Serov, A.N.; Antonov, Y.A.; Tolstoguzov, V.B. Isolation of lactic whey proteins in the
form of complexes with apple pectin. Narhung, 1985, 1, 19-30.
Smith, P.K.; Krohn, R.I.; Hermanson, G.T.; Mallia, A.K.; Gartner, F.H.; Provenzano, M.D.;
Fujimoto, E.K.; Goeke, B.J.; Klenk, D.C. Measurement of protein using
bicinchoninic acid. Anal. Chem. 1985, 150, 76-85.
Stainsby, G. Proteinaceous gelling systems and their complexes with polysaccharides. Food
Chem. 1980, 6, 3-14.
Syrbe, A.; Bauer, W.J.; Klostermeyer, H. Polymer science concepts in dairy systems-An
overview of milk protein and food hydrocolloids interaction. Int. Dairy J. 1998, 8,
179-193.
Tainaka, K.-I. Study of complex coacervation in low concentration by virial expansion
method. I. Salt free systems. J. Phys. Soc. Jpn 1979, 46, 1899-1906.
Tainaka, K.-I. Effect of counterions on complex coacervation. Biopolymers 1980, 19, 1289-
1298.
Tang, S.; Preece, J.M.; McFarlane, C.M.; Zhang, Z. Fractal morphology and breakage of
DLCA and RLCA aggregates. J. Colloid Interf. Sci. 2000, 221, 114-123.
Taulier, N.; Chalikian, T.V. Characterization of pH-induced transitions of β-lactoglobulin:
ultrasonic, densimetric, and spectroscopic studies. J. Mol. Biol. 2001, 314, 873-889.
Teixeira, J. Small-angle scattering by fractal systems. J. Appl. Cryst. 1988, 21, 781-785.
Timmer, J.M.K.; Speelmans, M.P.J.; van der Horst, H.C. Separation of amino acids by
nanofiltration and ultrafiltration membranes, Sep. Purif. Technol. 1998, 14, 133-
134.
150
Tokaev, E.S.; Gurov, A.N.; Rogov, I.A.; Tolstoguzov, V.B. Properties of oil/water
emulsions stabilized by casein-acid polysaccharide mixtures. Narhung 1987, 31,
825-834.
Tolstoguzov, V.B. Functional properties of protein-polysaccharide mixtures. In Functional
properties of food macromolecules, Elsevier Applied Science: London, 1986, pp
385-415.
Tolstoguzov, V.B. Functional properties of food proteins and role of protein-polysaccharide
interaction. Food Hydrocoll. 1991, 4, 429-468.
Tolstoguzov, V.B. Protein-polysaccharide interactions. In Food proteins and their
applications, Marcel Dekker, Inc.: New York, 1997, pp 171-198.
Tolstogulzov, V.B. Thermodynamic aspects of biopolymer functionality in biological
systems, foods, and beverages. Crit. Rev. Biotechnol. 2002, 22, 89-174.
Tomme, P.; Creagh, A.L.; Kilburn, D.G.; Haynes, C.A. Interaction of polysaccharides with
the N-terminal cellulose-binding domain of Cellulomonas fimi CenC: 1. Binding
specificity and calorimetric analysis. Biochem. 1996, 35, 13885-13894.
Tromp, R.H.; Rennie, A.R., Jones, R.A.L. Kinetics of the simultaneous phase separation
and gelation in solutions of dextran and gelatin. Macromolecules 1995, 28, 4129-
4138.
Tsuboi, A.; Izumi, T.; Hirata, M.; Xia J.; Dubin, P.L.; Kokufuta, E. Complexation of
proteins with a strong polyanion in an aqueous salt-free system. Langmuir 1996, 12,
6295-6303.
Tuinier, R.; Dhont, J.K.G.; De Kruif, C.G. Depletion-induced phase separation of
aggregated whey protein colloids by an exocellular polysaccharide. Langmuir 2000,
16, 1497-1507.
Turgeon, S.L.; Gauthier, S.F.; Mollé, D.; Léonil J. Interfacial properties of tryptic peptides
of β-lactoglobulin. J. Agric. Food Chem. 1992a, 40, 669-675.
Turgeon, S.L.; Gauthier, S.F.; Paquin, P. Emulsifying property of whey peptide fractions as
a function of pH and ionic strength. J. Food Sci. 1992b, 57, 601-604.
151
Ustunol, Z.; Xiong, Y.L.; Means, W.J.; Decker, E.A. Forces involved in mixed pork
myofibrillar protein and calcium alginate gels. J. Agric. Food Chem. 1992, 40, 577-
580.
van Bruggen, M.P.B; Dhont, J.K.G; Lekkerkerker, H.N.W. Morphology and kinetics of the
isotropic-nematic phase transition in solutions of hard rods. Macromolecules 1999,
32, 2256-2264.
van Oss, C.J. Acid-base interfacial interactions in aqueous media. Colloids Surf. A 1993,
78, 1-49.
Veis, A.; Aranyi, C. Phase separation in polyelectrolyte systems. I. Complex coacervates of
gelatin. J. Phys. Chem. 1960, 64, 1203-1210.
Voragen, A.G.J.; Pilnik, W.; Thibault, J.-F.; Axelos, M.A.V.; Renard, C.M.G.C. Pectins. In
Food Polysaccharides and their Applications, Marcel Dekker Inc.: New York,
1995, pp 287-339.
Walkinshaw, M.D.; Arnott, S. Conformation and interactions of pectins. II: models for
junction zones in pectinic acid and calcium pectate gels. J. Mol. Biol. 1981, 153,
1075-1085.
Wang, Y.; Dubin, P.L. Protein binding on polyelectrolyte-treated glass: Effect of
microscopic structure of adsorbed polyelectrolyte. J. Chromatogr. 1998, 808, 61-70.
Wang, Q.; Qvist, K.B. Investigation of the composite system of β-lactoglobulin and pectin
in aqueous solutions. Food Res. Int. 2000, 33, 683-690.
Wangsakan, A.; Chinachoti, P.; McClements, D.J. Maltodextrin-anionic surfactant
interactions: isothermal titration calorimetry and surface tension study. J. Agric.
Food Chem. 2001, 49, 5039-5045.
Wen, Y-P.; Dubin, P.L. Potentiometric studies of the interaction of bovine serum albumin
and poly(dimethyldiallylamonium chloride). Macromolecules 1997, 30, 7856-7861.
West, S.M.; Guise, A.D.; Chaudhuri, J.B. A comparison of the denaturants urea and
guanidine hydrochloride on protein refolding. Trans. Inst. Chem. Eng. 1997, 75, 50-
56.
152
Wiseman, T.; Williston, S.; Brands, J.F.; Lin, L.-N. Rapid measurement of binding
constants and heats of binding using a new titration calorimeter. Anal. Biochem.
1989, 179, 131-137.
Wu, S.-Y.; Pérez, M.D.; Puyol, P.; Sawyer, L. β-lactoglobulin binds palmitate within its
central cavity. J. Biol. Chem. 1999, 274, 170-174.
Xia, J.; Dubin, P.L. Dynamic and electrophoretic light scattering of a water-soluble
complex formed between pepsin and poly(ethylene glycol). Macromolecules 1993,
26, 6688-6690.
Xia, J.; Dubin, P.L. Protein-polyelectrolyte complexes. In: Macromolecular Complexes in
Chemistry and Biology, Springer Verlag: Berlin, 1994, pp 247-271.
Xia, J.; Dubin P.L.; Kokufuta, E.; Havel, H.; Muhoberac, B.B. Light scattering, CD, and
ligand binding studies of ferrihemoglobin-polyelectrolyte complexes. Biopolymers
1999, 50, 153-161.
Yang, C-C.; Chen, C-C.; Chang, H-M. Separation of egg white lysozyme by anionic
polysaccharides. J. Food Sci. 1998, 63, 962-965.
Zaleska, H., Ring, S.G., Tomasik, P. Apple pectin complexes with whey protein isolate,
Food Hydrocoll. 2000, 14, 377-382.
Zancong, S.; Mitragotri, S. Intestinal patches for oral drug delivery. Pharm. Res. 2002, 19,
391-395.