Electronic Supplementary Information - The Royal … Anton Paar DMA 602 H vibrating tube densimeter...
101
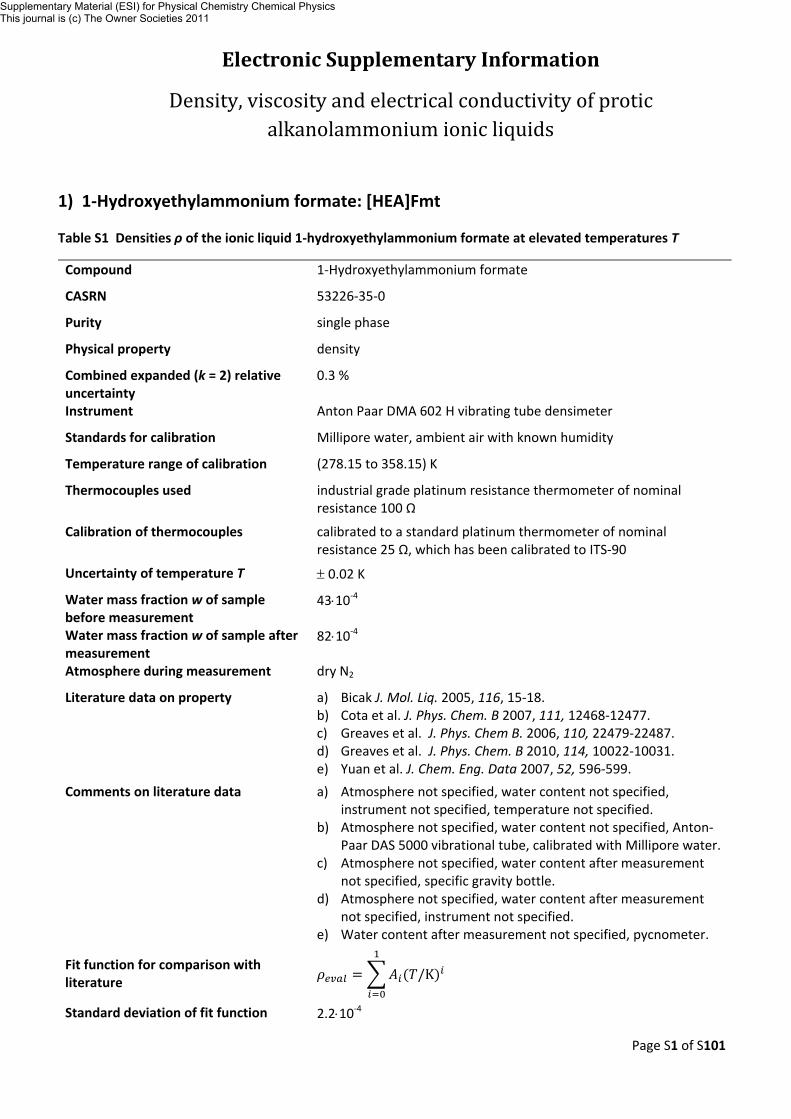
Page S1 of S101 Electronic Supplementary Information Density, viscosity and electrical conductivity of protic alkanolammonium ionic liquids 1) 1‐Hydroxyethylammonium formate: [HEA]Fmt Table S1 Densities ρ of the ionic liquid 1‐hydroxyethylammonium formate at elevated temperatures T Compound 1‐Hydroxyethylammonium formate CASRN 53226‐35‐0 Purity single phase Physical property density Combined expanded (k = 2) relative uncertainty 0.3 % Instrument Anton Paar DMA 602 H vibrating tube densimeter Standards for calibration Millipore water, ambient air with known humidity Temperature range of calibration (278.15 to 358.15) K Thermocouples used industrial grade platinum resistance thermometer of nominal resistance 100 Ω Calibration of thermocouples calibrated to a standard platinum thermometer of nominal resistance 25 Ω, which has been calibrated to ITS‐90 Uncertainty of temperature T ± 0.02 K Water mass fraction w of sample before measurement 43⋅10 ‐4 Water mass fraction w of sample after measurement 82⋅10 ‐4 Atmosphere during measurement dry N 2 Literature data on property a) Bicak J. Mol. Liq. 2005, 116, 15‐18. b) Cota et al. J. Phys. Chem. B 2007, 111, 12468‐12477. c) Greaves et al. J. Phys. Chem B. 2006, 110, 22479‐22487. d) Greaves et al. J. Phys. Chem. B 2010, 114, 10022‐10031. e) Yuan et al. J. Chem. Eng. Data 2007, 52, 596‐599. Comments on literature data a) Atmosphere not specified, water content not specified, instrument not specified, temperature not specified. b) Atmosphere not specified, water content not specified, Anton‐ Paar DAS 5000 vibrational tube, calibrated with Millipore water. c) Atmosphere not specified, water content after measurement not specified, specific gravity bottle. d) Atmosphere not specified, water content after measurement not specified, instrument not specified. e) Water content after measurement not specified, pycnometer. Fit function for comparison with literature ߩ௩ ൌ ܣ ሺ/Kሻ ଵ ୀ Standard deviation of fit function 2.2⋅10 ‐4 Supplementary Material (ESI) for Physical Chemistry Chemical Physics This journal is (c) The Owner Societies 2011
-
Upload
truongngoc -
Category
Documents
-
view
217 -
download
2
Transcript of Electronic Supplementary Information - The Royal … Anton Paar DMA 602 H vibrating tube densimeter...
Page S1 of S101
Electronic Supplementary Information
Density, viscosity and electrical conductivity of protic alkanolammonium ionic liquids
1) 1‐Hydroxyethylammonium formate: [HEA]Fmt
Table S1 Densities ρ of the ionic liquid 1‐hydroxyethylammonium formate at elevated temperatures T
Compound 1‐Hydroxyethylammonium formate
CASRN 53226‐35‐0
Purity single phase
Physical property density
Combined expanded (k = 2) relative uncertainty
0.3 %
Instrument Anton Paar DMA 602 H vibrating tube densimeter
Standards for calibration Millipore water, ambient air with known humidity
Temperature range of calibration (278.15 to 358.15) K
Thermocouples used industrial grade platinum resistance thermometer of nominal resistance 100 Ω
Calibration of thermocouples calibrated to a standard platinum thermometer of nominal resistance 25 Ω, which has been calibrated to ITS‐90
Uncertainty of temperature T ± 0.02 K
Water mass fraction w of sample before measurement
43⋅10‐4
Water mass fraction w of sample after measurement
82⋅10‐4
Atmosphere during measurement dry N2
Literature data on property a) Bicak J. Mol. Liq. 2005, 116, 15‐18. b) Cota et al. J. Phys. Chem. B 2007, 111, 12468‐12477. c) Greaves et al. J. Phys. Chem B. 2006, 110, 22479‐22487. d) Greaves et al. J. Phys. Chem. B 2010, 114, 10022‐10031. e) Yuan et al. J. Chem. Eng. Data 2007, 52, 596‐599.
Comments on literature data a) Atmosphere not specified, water content not specified, instrument not specified, temperature not specified.
b) Atmosphere not specified, water content not specified, Anton‐Paar DAS 5000 vibrational tube, calibrated with Millipore water.
c) Atmosphere not specified, water content after measurement not specified, specific gravity bottle.
d) Atmosphere not specified, water content after measurement not specified, instrument not specified.
e) Water content after measurement not specified, pycnometer.
Fit function for comparison with literature /K
Standard deviation of fit function 2.2⋅10‐4
Supplementary Material (ESI) for Physical Chemistry Chemical PhysicsThis journal is (c) The Owner Societies 2011
Page S2 of S101
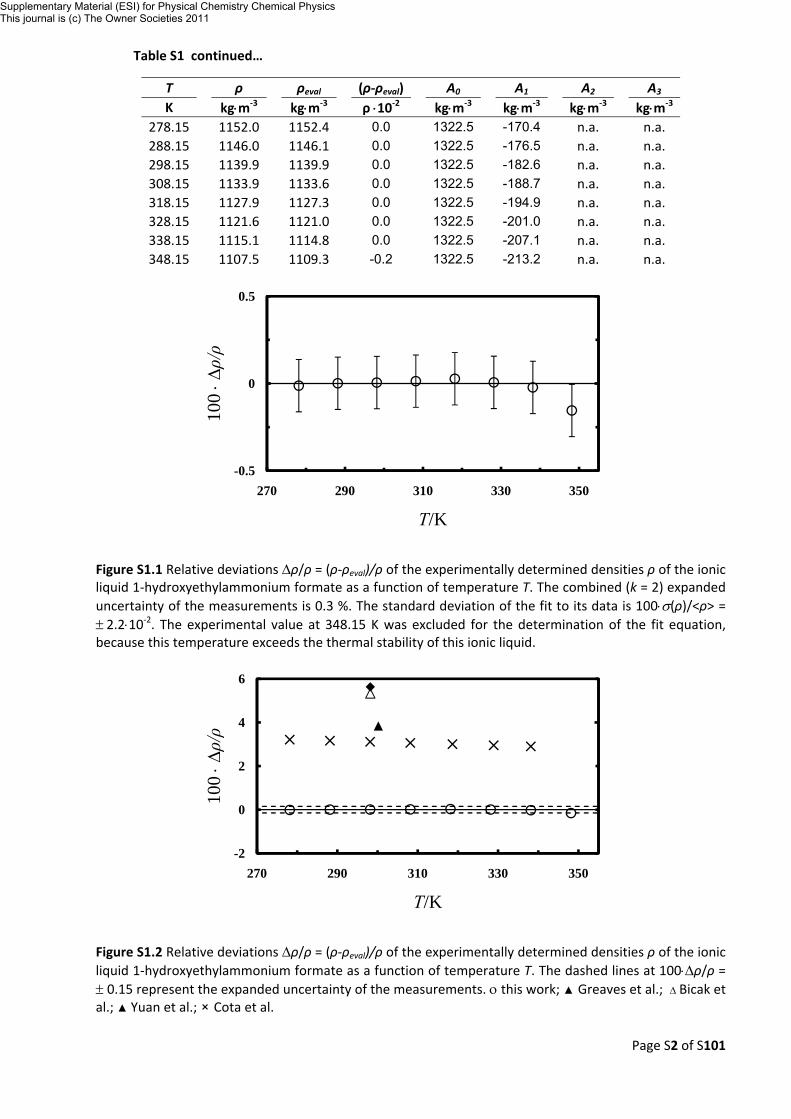
Table S1 continued…
T
ρ
ρeval (ρ‐ρeval) A0 A1 A2
A3 K kg⋅m‐3 kg⋅m‐3 ρ ⋅10‐2 kg⋅m‐3 kg⋅m‐3 kg⋅m‐3 kg⋅m‐3
278.15 1152.0 1152.4
0.0 1322.5 -170.4 n.a.
n.a. 288.15 1146.0 1146.1 0.0 1322.5 -176.5 n.a. n.a. 298.15 1139.9 1139.9 0.0 1322.5 -182.6 n.a. n.a. 308.15 1133.9 1133.6 0.0 1322.5 -188.7 n.a. n.a. 318.15 1127.9 1127.3 0.0 1322.5 -194.9 n.a. n.a. 328.15 1121.6 1121.0 0.0 1322.5 -201.0 n.a. n.a. 338.15 1115.1 1114.8 0.0 1322.5 -207.1 n.a. n.a. 348.15 1107.5 1109.3 -0.2 1322.5 -213.2 n.a. n.a.
Figure S1.1 Relative deviations Δρ/ρ = (ρ‐ρeval)/ρ of the experimentally determined densities ρ of the ionic liquid 1‐hydroxyethylammonium formate as a function of temperature T. The combined (k = 2) expanded uncertainty of the measurements is 0.3 %. The standard deviation of the fit to its data is 100⋅σ(ρ)/<ρ> = ± 2.2⋅10‐2. The experimental value at 348.15 K was excluded for the determination of the fit equation, because this temperature exceeds the thermal stability of this ionic liquid.
Figure S1.2 Relative deviations Δρ/ρ = (ρ‐ρeval)/ρ of the experimentally determined densities ρ of the ionic liquid 1‐hydroxyethylammonium formate as a function of temperature T. The dashed lines at 100⋅Δρ/ρ = ± 0.15 represent the expanded uncertainty of the measurements. ο this work; ▲ Greaves et al.; ∆ Bicak et al.; ▲ Yuan et al.; × Cota et al.
-5
0
5
-0.5
0
0.5
270 290 310 330 350
100 ⋅Δρ/ρ
T/K
-2
4
-2
0
2
4
6
270 290 310 330 350
100 ⋅Δρ/ρ
T/K
Supplementary Material (ESI) for Physical Chemistry Chemical PhysicsThis journal is (c) The Owner Societies 2011
Page S3 of S101
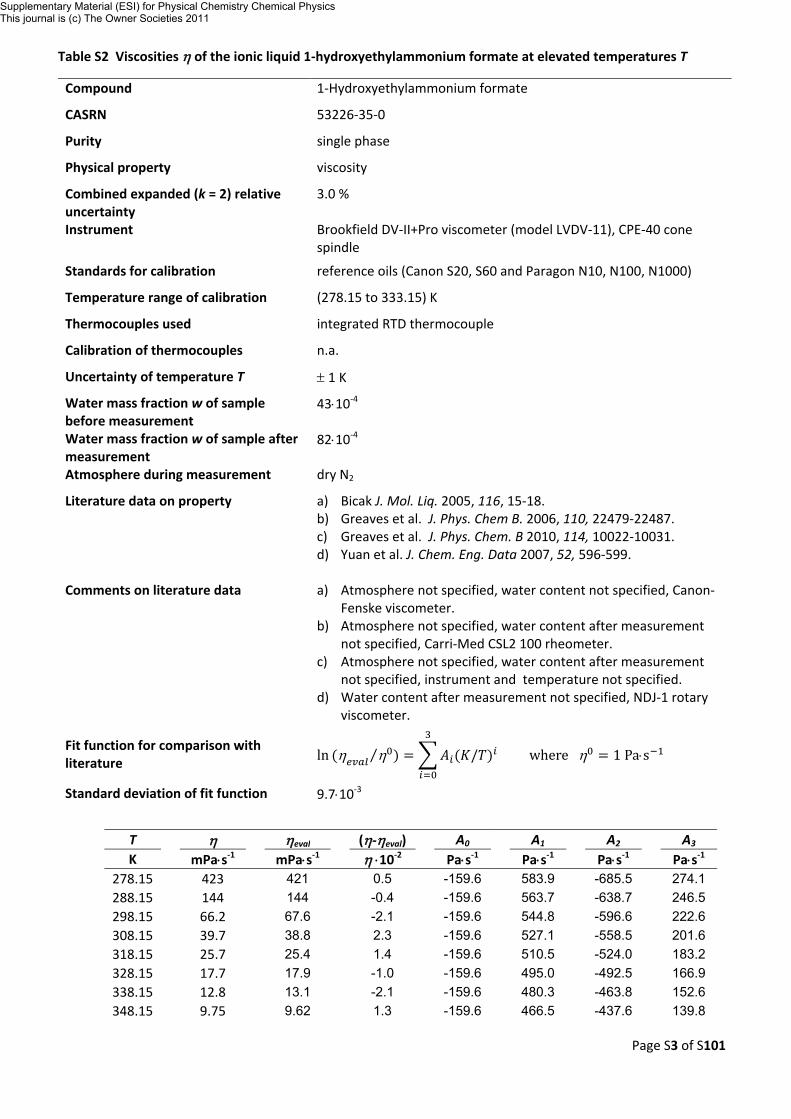
Table S2 Viscosities η of the ionic liquid 1‐hydroxyethylammonium formate at elevated temperatures T
Compound 1‐Hydroxyethylammonium formate
CASRN 53226‐35‐0
Purity single phase
Physical property viscosity
Combined expanded (k = 2) relative uncertainty
3.0 %
Instrument Brookfield DV‐II+Pro viscometer (model LVDV‐11), CPE‐40 cone spindle
Standards for calibration reference oils (Canon S20, S60 and Paragon N10, N100, N1000)
Temperature range of calibration (278.15 to 333.15) K
Thermocouples used integrated RTD thermocouple
Calibration of thermocouples n.a.
Uncertainty of temperature T ± 1 K
Water mass fraction w of sample before measurement
43⋅10‐4
Water mass fraction w of sample after measurement
82⋅10‐4
Atmosphere during measurement dry N2
Literature data on property a) Bicak J. Mol. Liq. 2005, 116, 15‐18. b) Greaves et al. J. Phys. Chem B. 2006, 110, 22479‐22487. c) Greaves et al. J. Phys. Chem. B 2010, 114, 10022‐10031. d) Yuan et al. J. Chem. Eng. Data 2007, 52, 596‐599.
Comments on literature data a) Atmosphere not specified, water content not specified, Canon‐
Fenske viscometer. b) Atmosphere not specified, water content after measurement
not specified, Carri‐Med CSL2 100 rheometer. c) Atmosphere not specified, water content after measurement
not specified, instrument and temperature not specified. d) Water content after measurement not specified, NDJ‐1 rotary
viscometer.
Fit function for comparison with literature ln η η⁄ / where η 1 Pa⋅s
Standard deviation of fit function 9.7⋅10‐3
T
η
ηeval (η‐ηeval) A0 A1 A2
A3 K mPa⋅s‐1 mPa⋅s‐1 η ⋅10‐2 Pa⋅s‐1 Pa⋅s‐1 Pa⋅s‐1 Pa⋅s‐1
278.15 423 421
0.5 -159.6 583.9 -685.5
274.1 288.15 144 144 -0.4 -159.6 563.7 -638.7 246.5 298.15 66.2 67.6 -2.1 -159.6 544.8 -596.6 222.6 308.15 39.7 38.8 2.3 -159.6 527.1 -558.5 201.6 318.15 25.7 25.4 1.4 -159.6 510.5 -524.0 183.2 328.15 17.7 17.9 -1.0 -159.6 495.0 -492.5 166.9 338.15 12.8 13.1 -2.1 -159.6 480.3 -463.8 152.6 348.15 9.75 9.62 1.3 -159.6 466.5 -437.6 139.8
Supplementary Material (ESI) for Physical Chemistry Chemical PhysicsThis journal is (c) The Owner Societies 2011
Page S4 of S101
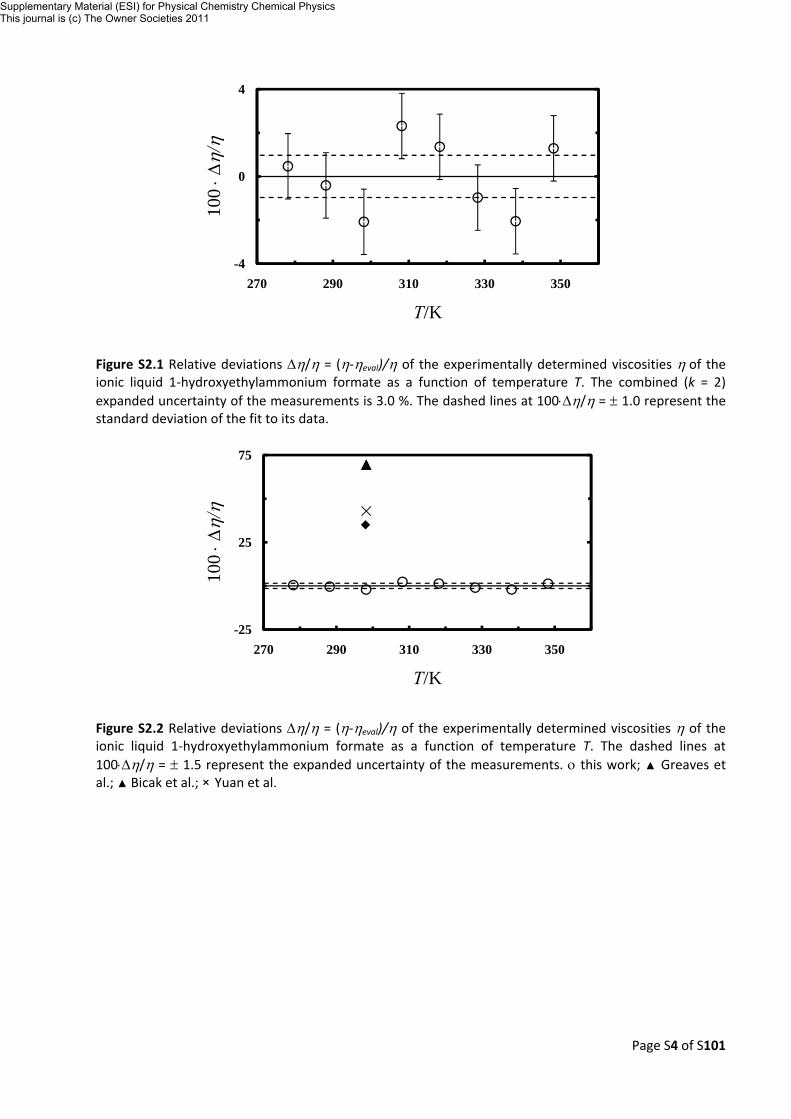
Figure S2.1 Relative deviations Δη/η = (η‐ηeval)/η of the experimentally determined viscosities η of the ionic liquid 1‐hydroxyethylammonium formate as a function of temperature T. The combined (k = 2) expanded uncertainty of the measurements is 3.0 %. The dashed lines at 100⋅Δη/η = ± 1.0 represent the standard deviation of the fit to its data.
Figure S2.2 Relative deviations Δη/η = (η‐ηeval)/η of the experimentally determined viscosities η of the ionic liquid 1‐hydroxyethylammonium formate as a function of temperature T. The dashed lines at 100⋅Δη/η = ± 1.5 represent the expanded uncertainty of the measurements. ο this work; ▲ Greaves et al.; ▲ Bicak et al.; × Yuan et al.
-4
0
4
-4
0
4
270 290 310 330 350
100 ⋅Δ
η/η
T/K
-25
25
75
-25
25
75
270 290 310 330 350
100 ⋅Δ
η/η
T/K
Supplementary Material (ESI) for Physical Chemistry Chemical PhysicsThis journal is (c) The Owner Societies 2011
Page S5 of S101
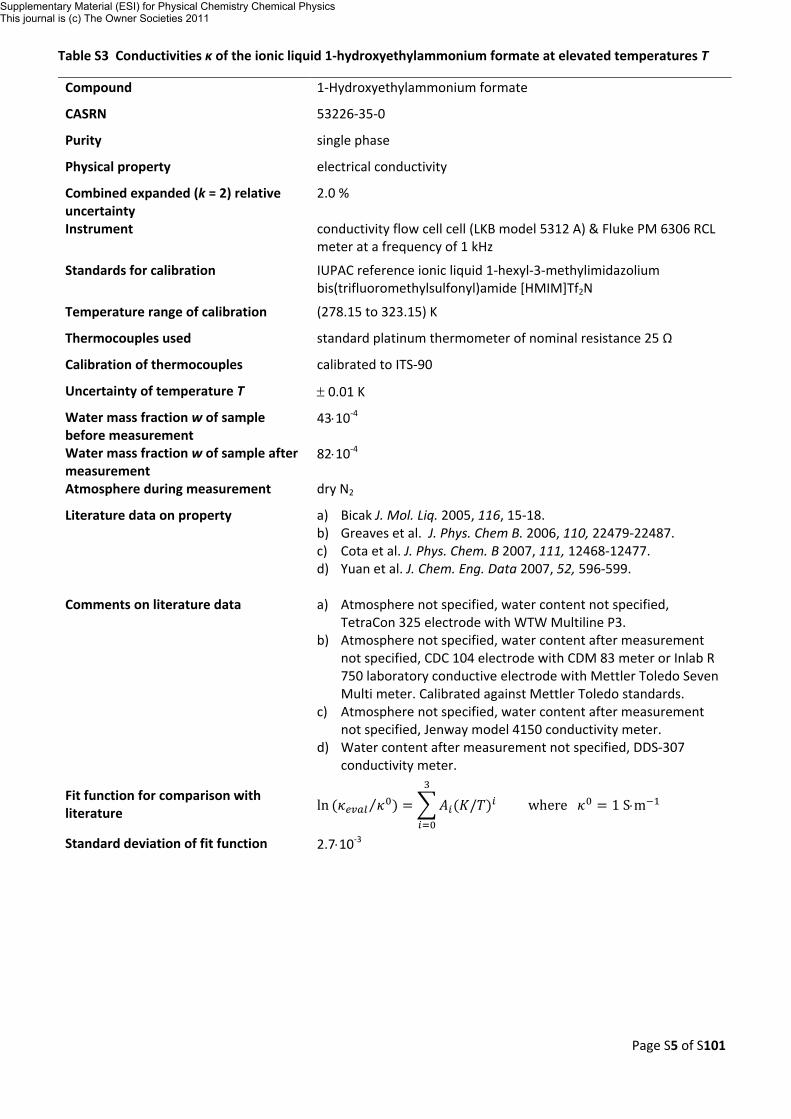
Table S3 Conductivities κ of the ionic liquid 1‐hydroxyethylammonium formate at elevated temperatures T
Compound 1‐Hydroxyethylammonium formate
CASRN 53226‐35‐0
Purity single phase
Physical property electrical conductivity
Combined expanded (k = 2) relative uncertainty
2.0 %
Instrument conductivity flow cell cell (LKB model 5312 A) & Fluke PM 6306 RCL meter at a frequency of 1 kHz
Standards for calibration IUPAC reference ionic liquid 1‐hexyl‐3‐methylimidazolium bis(trifluoromethylsulfonyl)amide [HMIM]Tf2N
Temperature range of calibration (278.15 to 323.15) K
Thermocouples used standard platinum thermometer of nominal resistance 25 Ω
Calibration of thermocouples calibrated to ITS‐90
Uncertainty of temperature T ± 0.01 K
Water mass fraction w of sample before measurement
43⋅10‐4
Water mass fraction w of sample after measurement
82⋅10‐4
Atmosphere during measurement dry N2
Literature data on property a) Bicak J. Mol. Liq. 2005, 116, 15‐18. b) Greaves et al. J. Phys. Chem B. 2006, 110, 22479‐22487. c) Cota et al. J. Phys. Chem. B 2007, 111, 12468‐12477. d) Yuan et al. J. Chem. Eng. Data 2007, 52, 596‐599.
Comments on literature data a) Atmosphere not specified, water content not specified,
TetraCon 325 electrode with WTW Multiline P3. b) Atmosphere not specified, water content after measurement
not specified, CDC 104 electrode with CDM 83 meter or Inlab R 750 laboratory conductive electrode with Mettler Toledo Seven Multi meter. Calibrated against Mettler Toledo standards.
c) Atmosphere not specified, water content after measurement not specified, Jenway model 4150 conductivity meter.
d) Water content after measurement not specified, DDS‐307 conductivity meter.
Fit function for comparison with literature ln ⁄ / where 1 S⋅m
Standard deviation of fit function 2.7⋅10‐3
Supplementary Material (ESI) for Physical Chemistry Chemical PhysicsThis journal is (c) The Owner Societies 2011
Page S6 of S101
Table S3 continued…
T
κ
κeval (κ‐ κeval) A0 A1 A2
A3 K S⋅m‐1 S⋅m‐1 κ ⋅10‐2 S⋅m‐1 S⋅m‐1 S⋅m‐1 S⋅m‐1
278.15 0.229 0.229
-0.2 -9.1 38.0 -36.9
6.5 288.15 0.397 0.395 0.4 -9.1 36.6 -34.3 5.8 298.15 0.632 0.631 0.1 -9.1 35.4 -32.1 5.3 308.15 0.942 0.945 -0.3 -9.1 34.3 -30.0 4.8 318.15 1.331 1.334 -0.3 -9.1 33.2 -28.2 4.3 328.15 1.787 1.792 -0.3 -9.1 32.2 -26.5 3.9 338.15 2.329 2.305 1.1 -9.1 31.2 -24.9 3.6 348.15 2.837 2.852 -0.5 -9.1 30.3 -23.5 3.3
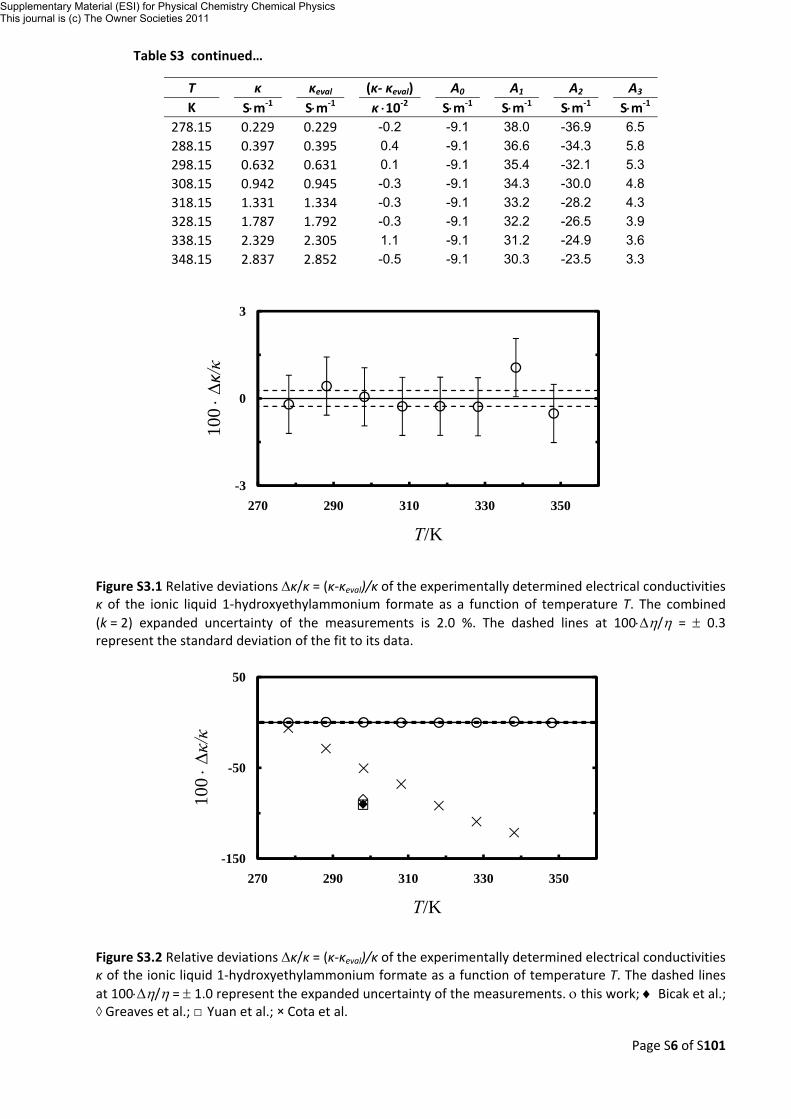
Figure S3.1 Relative deviations Δκ/κ = (κ‐κeval)/κ of the experimentally determined electrical conductivities κ of the ionic liquid 1‐hydroxyethylammonium formate as a function of temperature T. The combined (k = 2) expanded uncertainty of the measurements is 2.0 %. The dashed lines at 100⋅Δη/η = ± 0.3 represent the standard deviation of the fit to its data.
Figure S3.2 Relative deviations Δκ/κ = (κ‐κeval)/κ of the experimentally determined electrical conductivities κ of the ionic liquid 1‐hydroxyethylammonium formate as a function of temperature T. The dashed lines at 100⋅Δη/η = ± 1.0 represent the expanded uncertainty of the measurements. ο this work; ♦ Bicak et al.; ◊ Greaves et al.; □ Yuan et al.; × Cota et al.
-3
0
3
-3
0
3
270 290 310 330 350
100 ⋅Δ
κ/κ
T/K
-150
-50
50
-150
-50
50
270 290 310 330 350
100 ⋅Δκ/κ
T/K
Supplementary Material (ESI) for Physical Chemistry Chemical PhysicsThis journal is (c) The Owner Societies 2011
Page S7 of S101
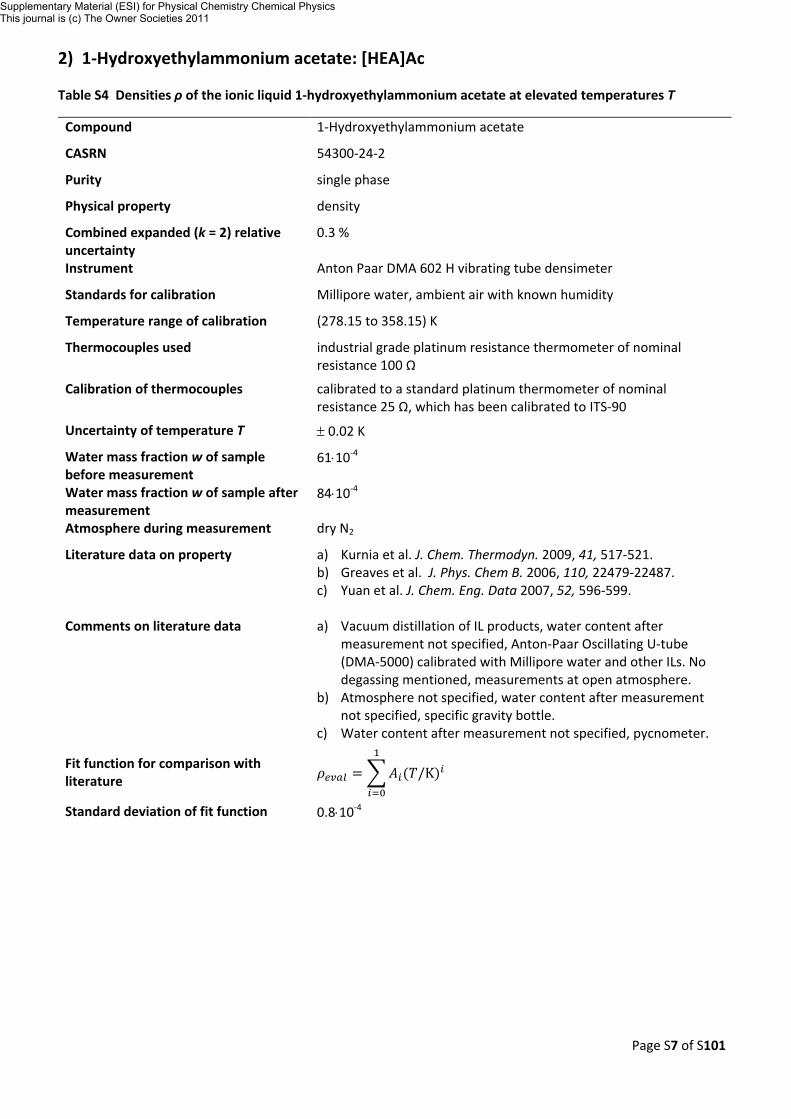
2) 1‐Hydroxyethylammonium acetate: [HEA]Ac
Table S4 Densities ρ of the ionic liquid 1‐hydroxyethylammonium acetate at elevated temperatures T
Compound 1‐Hydroxyethylammonium acetate
CASRN 54300‐24‐2
Purity single phase
Physical property density
Combined expanded (k = 2) relative uncertainty
0.3 %
Instrument Anton Paar DMA 602 H vibrating tube densimeter
Standards for calibration Millipore water, ambient air with known humidity
Temperature range of calibration (278.15 to 358.15) K
Thermocouples used industrial grade platinum resistance thermometer of nominal resistance 100 Ω
Calibration of thermocouples calibrated to a standard platinum thermometer of nominal resistance 25 Ω, which has been calibrated to ITS‐90
Uncertainty of temperature T ± 0.02 K
Water mass fraction w of sample before measurement
61⋅10‐4
Water mass fraction w of sample after measurement
84⋅10‐4
Atmosphere during measurement dry N2
Literature data on property a) Kurnia et al. J. Chem. Thermodyn. 2009, 41, 517‐521. b) Greaves et al. J. Phys. Chem B. 2006, 110, 22479‐22487. c) Yuan et al. J. Chem. Eng. Data 2007, 52, 596‐599.
Comments on literature data a) Vacuum distillation of IL products, water content after
measurement not specified, Anton‐Paar Oscillating U‐tube (DMA‐5000) calibrated with Millipore water and other ILs. No degassing mentioned, measurements at open atmosphere.
b) Atmosphere not specified, water content after measurement not specified, specific gravity bottle.
c) Water content after measurement not specified, pycnometer.
Fit function for comparison with literature /K
Standard deviation of fit function 0.8⋅10‐4
Supplementary Material (ESI) for Physical Chemistry Chemical PhysicsThis journal is (c) The Owner Societies 2011
Page S8 of S101
Table S4 continued…
T
ρ
ρeval (ρ‐ρeval) A0 A1 A2
A3 K kg⋅m‐3 kg⋅m‐3 ρ ⋅10‐2 kg⋅m‐3 kg⋅m‐3 kg⋅m‐3 kg⋅m‐3
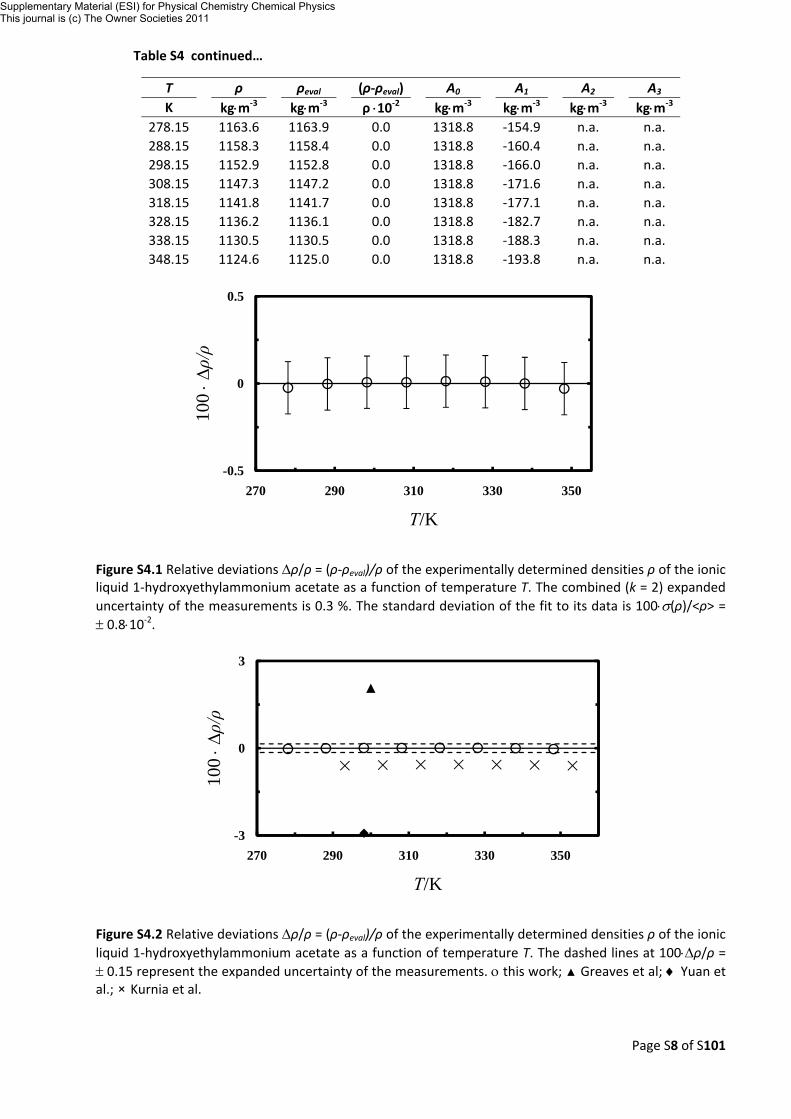
278.15 1163.6 1163.9
0.0 1318.8 ‐154.9 n.a.
n.a. 288.15 1158.3 1158.4 0.0 1318.8 ‐160.4 n.a. n.a. 298.15 1152.9 1152.8 0.0 1318.8 ‐166.0 n.a. n.a. 308.15 1147.3 1147.2 0.0 1318.8 ‐171.6 n.a. n.a. 318.15 1141.8 1141.7 0.0 1318.8 ‐177.1 n.a. n.a. 328.15 1136.2 1136.1 0.0 1318.8 ‐182.7 n.a. n.a. 338.15 1130.5 1130.5 0.0 1318.8 ‐188.3 n.a. n.a. 348.15 1124.6 1125.0 0.0 1318.8 ‐193.8 n.a. n.a.
Figure S4.1 Relative deviations Δρ/ρ = (ρ‐ρeval)/ρ of the experimentally determined densities ρ of the ionic liquid 1‐hydroxyethylammonium acetate as a function of temperature T. The combined (k = 2) expanded uncertainty of the measurements is 0.3 %. The standard deviation of the fit to its data is 100⋅σ(ρ)/<ρ> = ± 0.8⋅10‐2.
Figure S4.2 Relative deviations Δρ/ρ = (ρ‐ρeval)/ρ of the experimentally determined densities ρ of the ionic liquid 1‐hydroxyethylammonium acetate as a function of temperature T. The dashed lines at 100⋅Δρ/ρ = ± 0.15 represent the expanded uncertainty of the measurements. ο this work; ▲ Greaves et al; ♦ Yuan et al.; × Kurnia et al.
-0.04
0
0.04
-0.5
0
0.5
270 290 310 330 350
100 ⋅Δρ/ρ
T/K
-3
0
3
-3
0
3
270 290 310 330 350
100 ⋅Δρ/ρ
T/K
Supplementary Material (ESI) for Physical Chemistry Chemical PhysicsThis journal is (c) The Owner Societies 2011
Page S9 of S101
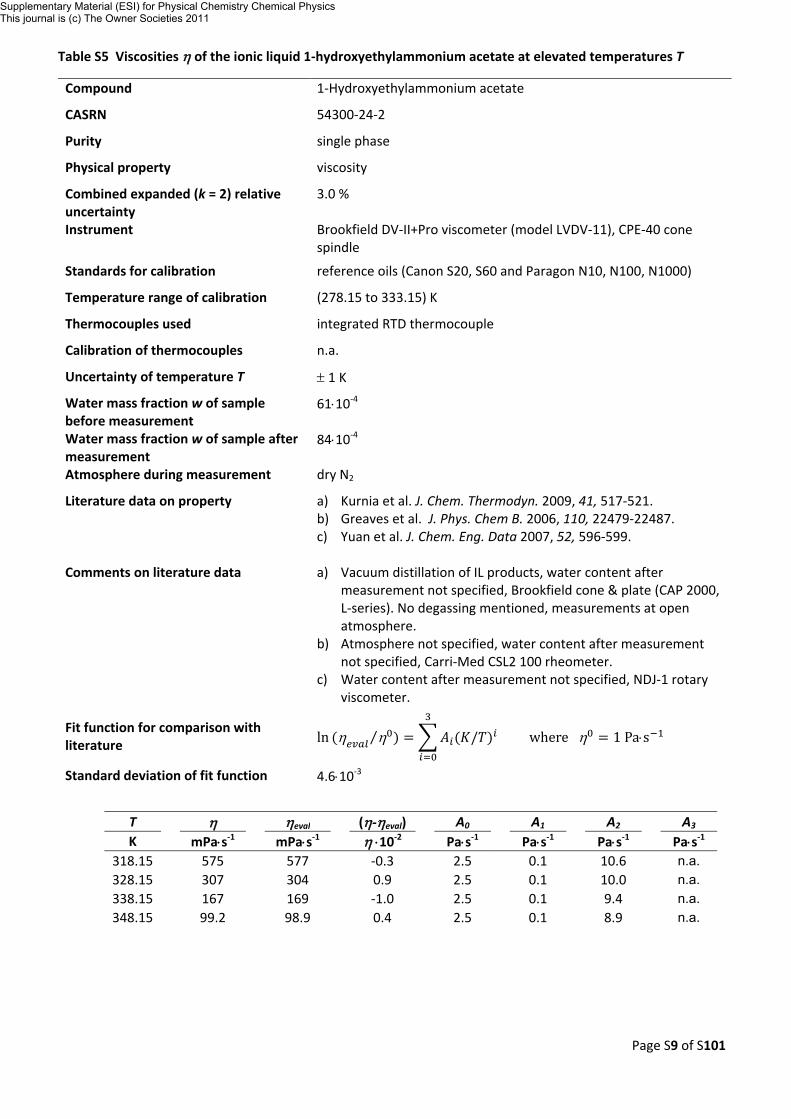
Table S5 Viscosities η of the ionic liquid 1‐hydroxyethylammonium acetate at elevated temperatures T
Compound 1‐Hydroxyethylammonium acetate
CASRN 54300‐24‐2
Purity single phase
Physical property viscosity
Combined expanded (k = 2) relative uncertainty
3.0 %
Instrument Brookfield DV‐II+Pro viscometer (model LVDV‐11), CPE‐40 cone spindle
Standards for calibration reference oils (Canon S20, S60 and Paragon N10, N100, N1000)
Temperature range of calibration (278.15 to 333.15) K
Thermocouples used integrated RTD thermocouple
Calibration of thermocouples n.a.
Uncertainty of temperature T ± 1 K
Water mass fraction w of sample before measurement
61⋅10‐4
Water mass fraction w of sample after measurement
84⋅10‐4
Atmosphere during measurement dry N2
Literature data on property a) Kurnia et al. J. Chem. Thermodyn. 2009, 41, 517‐521. b) Greaves et al. J. Phys. Chem B. 2006, 110, 22479‐22487. c) Yuan et al. J. Chem. Eng. Data 2007, 52, 596‐599.
Comments on literature data a) Vacuum distillation of IL products, water content after
measurement not specified, Brookfield cone & plate (CAP 2000, L‐series). No degassing mentioned, measurements at open atmosphere.
b) Atmosphere not specified, water content after measurement not specified, Carri‐Med CSL2 100 rheometer.
c) Water content after measurement not specified, NDJ‐1 rotary viscometer.
Fit function for comparison with literature ln η η⁄ / where η 1 Pa⋅s
Standard deviation of fit function 4.6⋅10‐3
T
η
ηeval (η‐ηeval) A0 A1 A2
A3 K mPa⋅s‐1 mPa⋅s‐1 η ⋅10‐2 Pa⋅s‐1 Pa⋅s‐1 Pa⋅s‐1 Pa⋅s‐1
318.15 575 577
‐0.3 2.5 0.1 10.6
n.a. 328.15 307 304 0.9 2.5 0.1 10.0 n.a. 338.15 167 169 ‐1.0 2.5 0.1 9.4 n.a. 348.15 99.2 98.9 0.4 2.5 0.1 8.9 n.a.
Supplementary Material (ESI) for Physical Chemistry Chemical PhysicsThis journal is (c) The Owner Societies 2011
Page S10 of S101
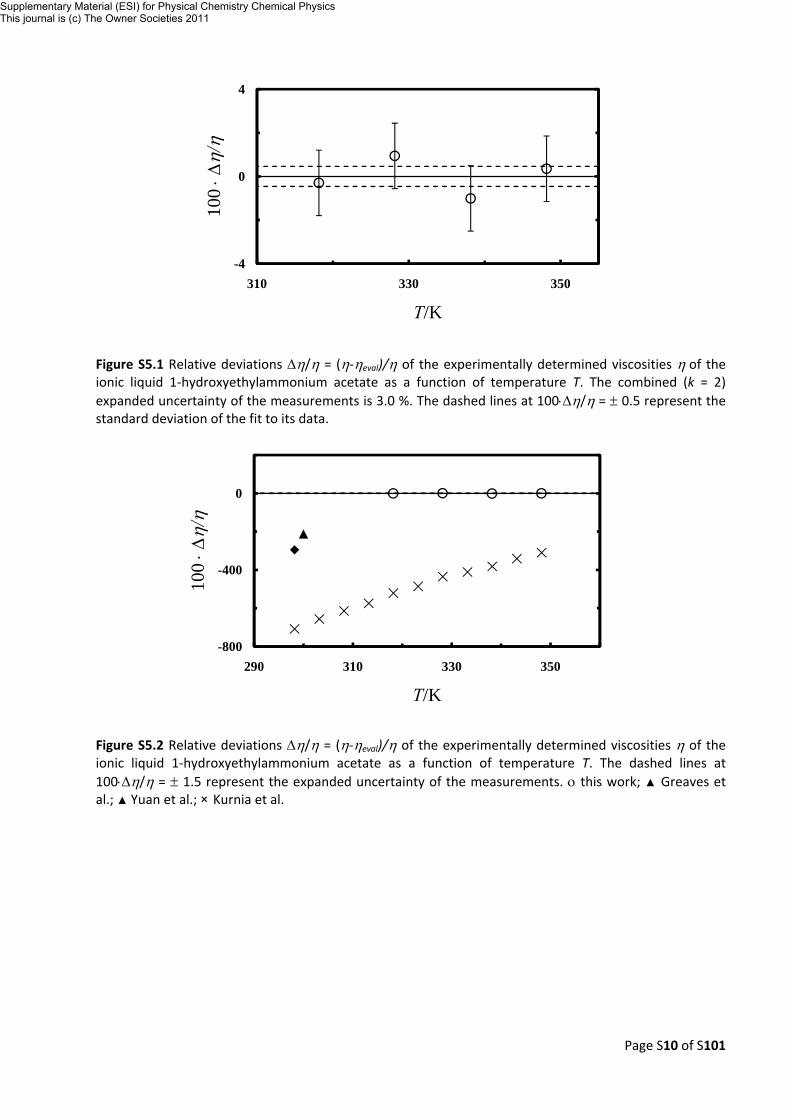
Figure S5.1 Relative deviations Δη/η = (η‐ηeval)/η of the experimentally determined viscosities η of the ionic liquid 1‐hydroxyethylammonium acetate as a function of temperature T. The combined (k = 2) expanded uncertainty of the measurements is 3.0 %. The dashed lines at 100⋅Δη/η = ± 0.5 represent the standard deviation of the fit to its data.
Figure S5.2 Relative deviations Δη/η = (η‐ηeval)/η of the experimentally determined viscosities η of the ionic liquid 1‐hydroxyethylammonium acetate as a function of temperature T. The dashed lines at 100⋅Δη/η = ± 1.5 represent the expanded uncertainty of the measurements. ο this work; ▲ Greaves et al.; ▲ Yuan et al.; × Kurnia et al.
-4
0
4
-4
0
4
310 330 350
100 ⋅Δ
η/η
T/K
-800
-400
0
-800
-400
0
290 310 330 350
100 ⋅Δ
η/η
T/K
Supplementary Material (ESI) for Physical Chemistry Chemical PhysicsThis journal is (c) The Owner Societies 2011
Page S11 of S101
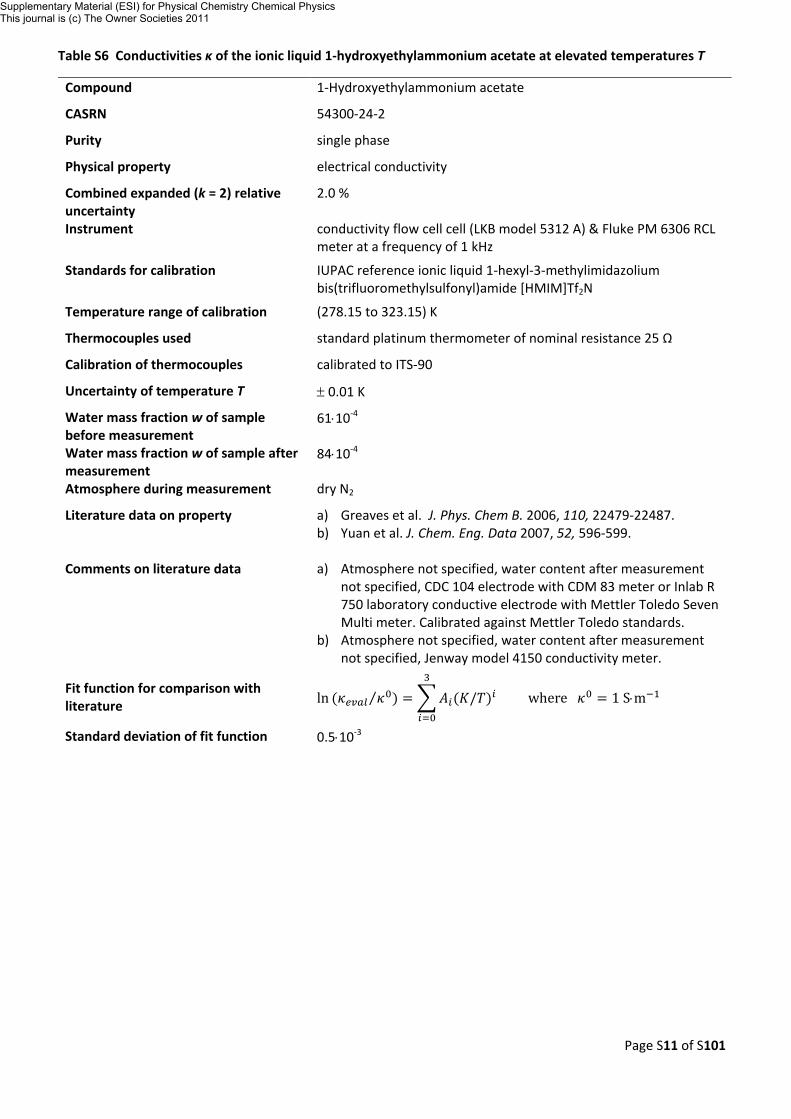
Table S6 Conductivities κ of the ionic liquid 1‐hydroxyethylammonium acetate at elevated temperatures T
Compound 1‐Hydroxyethylammonium acetate
CASRN 54300‐24‐2
Purity single phase
Physical property electrical conductivity
Combined expanded (k = 2) relative uncertainty
2.0 %
Instrument conductivity flow cell cell (LKB model 5312 A) & Fluke PM 6306 RCL meter at a frequency of 1 kHz
Standards for calibration IUPAC reference ionic liquid 1‐hexyl‐3‐methylimidazolium bis(trifluoromethylsulfonyl)amide [HMIM]Tf2N
Temperature range of calibration (278.15 to 323.15) K
Thermocouples used standard platinum thermometer of nominal resistance 25 Ω
Calibration of thermocouples calibrated to ITS‐90
Uncertainty of temperature T ± 0.01 K
Water mass fraction w of sample before measurement
61⋅10‐4
Water mass fraction w of sample after measurement
84⋅10‐4
Atmosphere during measurement dry N2
Literature data on property a) Greaves et al. J. Phys. Chem B. 2006, 110, 22479‐22487. b) Yuan et al. J. Chem. Eng. Data 2007, 52, 596‐599.
Comments on literature data a) Atmosphere not specified, water content after measurement
not specified, CDC 104 electrode with CDM 83 meter or Inlab R 750 laboratory conductive electrode with Mettler Toledo Seven Multi meter. Calibrated against Mettler Toledo standards.
b) Atmosphere not specified, water content after measurement not specified, Jenway model 4150 conductivity meter.
Fit function for comparison with literature ln ⁄ / where 1 S⋅m
Standard deviation of fit function 0.5⋅10‐3
Supplementary Material (ESI) for Physical Chemistry Chemical PhysicsThis journal is (c) The Owner Societies 2011
Page S12 of S101
Table S6 continued…
T
κ
κeval (κ‐ κeval) A0 A1 A2
A3 K S⋅m‐1 S⋅m‐1 κ ⋅10‐2 S⋅m‐1 S⋅m‐1 S⋅m‐1 S⋅m‐1
278.15 0.003 0.003
0.0 8.8 ‐18.4 24.5
‐20.7 288.15 0.008 0.008 0.0 8.8 ‐17.8 22.8 ‐18.6 298.15 0.021 0.021 0.0 8.8 ‐17.2 21.3 ‐16.8 308.15 0.045 0.045 0.0 8.8 ‐16.6 20.0 ‐15.2 318.15 0.089 0.089 -0.2 8.8 ‐16.1 18.7 ‐13.8 328.15 0.162 0.162 0.2 8.8 ‐15.6 17.6 ‐12.6 338.15 0.272 0.272 -0.1 8.8 ‐15.1 16.6 ‐11.5 348.15 0.432 0.432 0.0 8.8 ‐14.7 15.6 ‐10.6
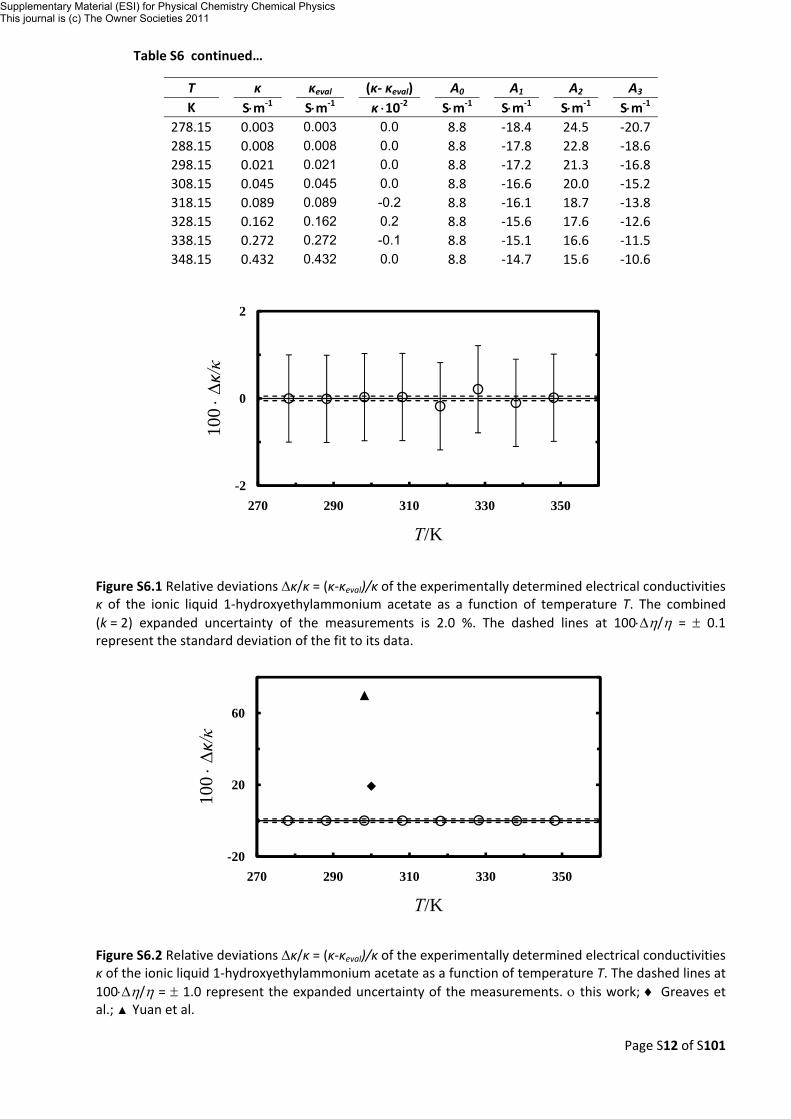
Figure S6.1 Relative deviations Δκ/κ = (κ‐κeval)/κ of the experimentally determined electrical conductivities κ of the ionic liquid 1‐hydroxyethylammonium acetate as a function of temperature T. The combined (k = 2) expanded uncertainty of the measurements is 2.0 %. The dashed lines at 100⋅Δη/η = ± 0.1 represent the standard deviation of the fit to its data.
Figure S6.2 Relative deviations Δκ/κ = (κ‐κeval)/κ of the experimentally determined electrical conductivities κ of the ionic liquid 1‐hydroxyethylammonium acetate as a function of temperature T. The dashed lines at 100⋅Δη/η = ± 1.0 represent the expanded uncertainty of the measurements. ο this work; ♦ Greaves et al.; ▲ Yuan et al.
-2
0
2
-2
0
2
270 290 310 330 350
100 ⋅Δ
κ/κ
T/K
‐20
20
60
-20
20
60
270 290 310 330 350
100 ⋅Δ
κ/κ
T/K
Supplementary Material (ESI) for Physical Chemistry Chemical PhysicsThis journal is (c) The Owner Societies 2011
Page S13 of S101
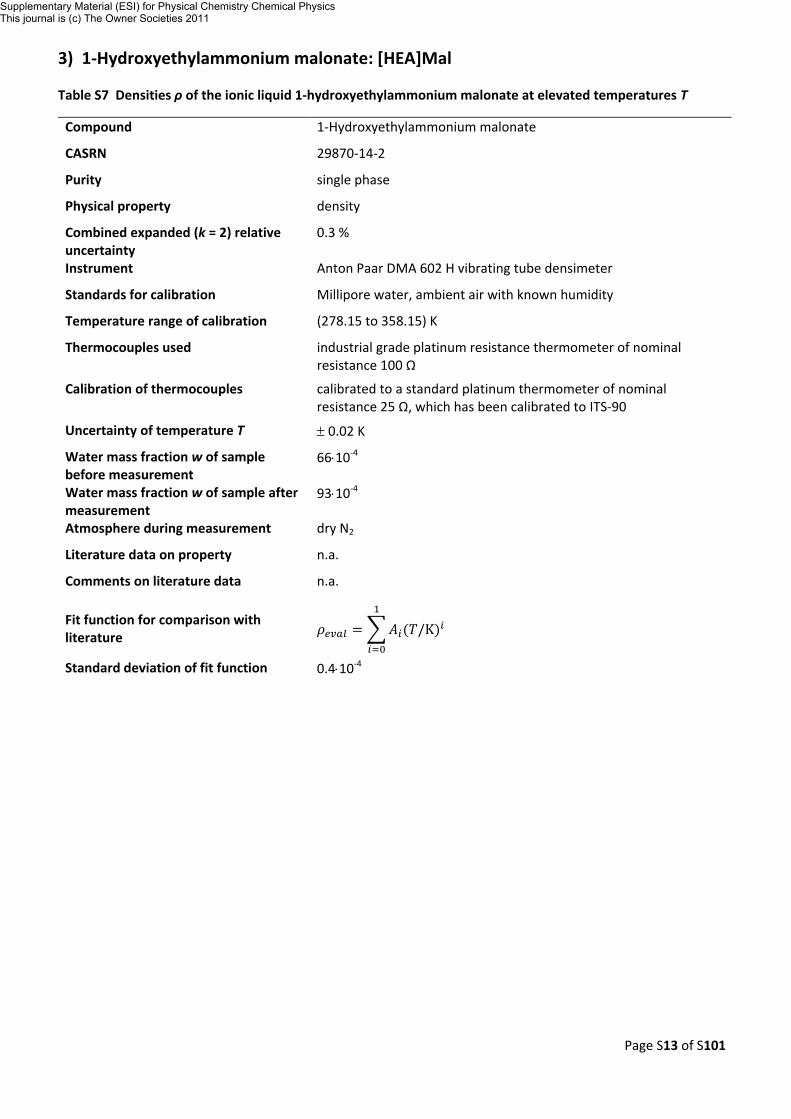
3) 1‐Hydroxyethylammonium malonate: [HEA]Mal
Table S7 Densities ρ of the ionic liquid 1‐hydroxyethylammonium malonate at elevated temperatures T
Compound 1‐Hydroxyethylammonium malonate
CASRN 29870‐14‐2
Purity single phase
Physical property density
Combined expanded (k = 2) relative uncertainty
0.3 %
Instrument Anton Paar DMA 602 H vibrating tube densimeter
Standards for calibration Millipore water, ambient air with known humidity
Temperature range of calibration (278.15 to 358.15) K
Thermocouples used industrial grade platinum resistance thermometer of nominal resistance 100 Ω
Calibration of thermocouples calibrated to a standard platinum thermometer of nominal resistance 25 Ω, which has been calibrated to ITS‐90
Uncertainty of temperature T ± 0.02 K
Water mass fraction w of sample before measurement
66⋅10‐4
Water mass fraction w of sample after measurement
93⋅10‐4
Atmosphere during measurement dry N2
Literature data on property n.a.
Comments on literature data n.a.
Fit function for comparison with literature /K
Standard deviation of fit function 0.4⋅10‐4
Supplementary Material (ESI) for Physical Chemistry Chemical PhysicsThis journal is (c) The Owner Societies 2011
Page S14 of S101
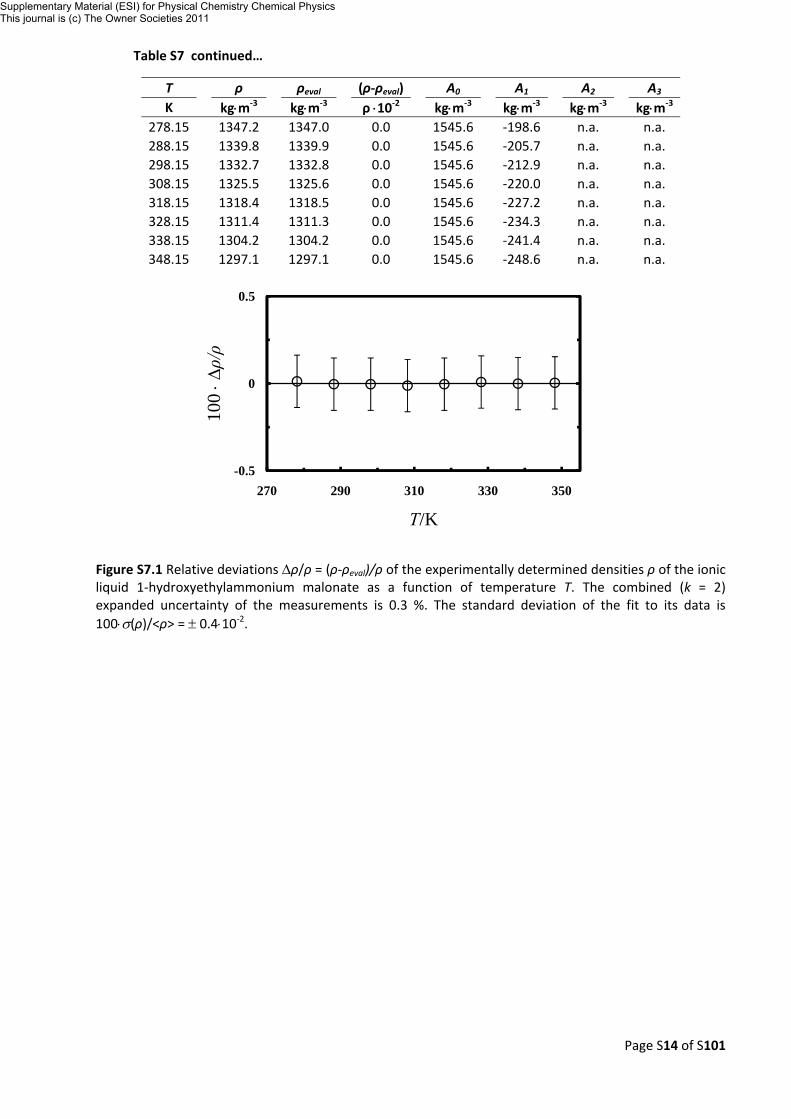
Table S7 continued…
T
ρ
ρeval (ρ‐ρeval) A0 A1 A2
A3 K kg⋅m‐3 kg⋅m‐3 ρ ⋅10‐2 kg⋅m‐3 kg⋅m‐3 kg⋅m‐3 kg⋅m‐3
278.15 1347.2 1347.0
0.0 1545.6 ‐198.6 n.a.
n.a. 288.15 1339.8 1339.9 0.0 1545.6 ‐205.7 n.a. n.a. 298.15 1332.7 1332.8 0.0 1545.6 ‐212.9 n.a. n.a. 308.15 1325.5 1325.6 0.0 1545.6 ‐220.0 n.a. n.a. 318.15 1318.4 1318.5 0.0 1545.6 ‐227.2 n.a. n.a. 328.15 1311.4 1311.3 0.0 1545.6 ‐234.3 n.a. n.a. 338.15 1304.2 1304.2 0.0 1545.6 ‐241.4 n.a. n.a. 348.15 1297.1 1297.1 0.0 1545.6 ‐248.6 n.a. n.a.
Figure S7.1 Relative deviations Δρ/ρ = (ρ‐ρeval)/ρ of the experimentally determined densities ρ of the ionic liquid 1‐hydroxyethylammonium malonate as a function of temperature T. The combined (k = 2) expanded uncertainty of the measurements is 0.3 %. The standard deviation of the fit to its data is 100⋅σ(ρ)/<ρ> = ± 0.4⋅10‐2.
-0.04
0
0.04
-0.5
0
0.5
270 290 310 330 350
100 ⋅Δρ/ρ
T/K
Supplementary Material (ESI) for Physical Chemistry Chemical PhysicsThis journal is (c) The Owner Societies 2011
Page S15 of S101
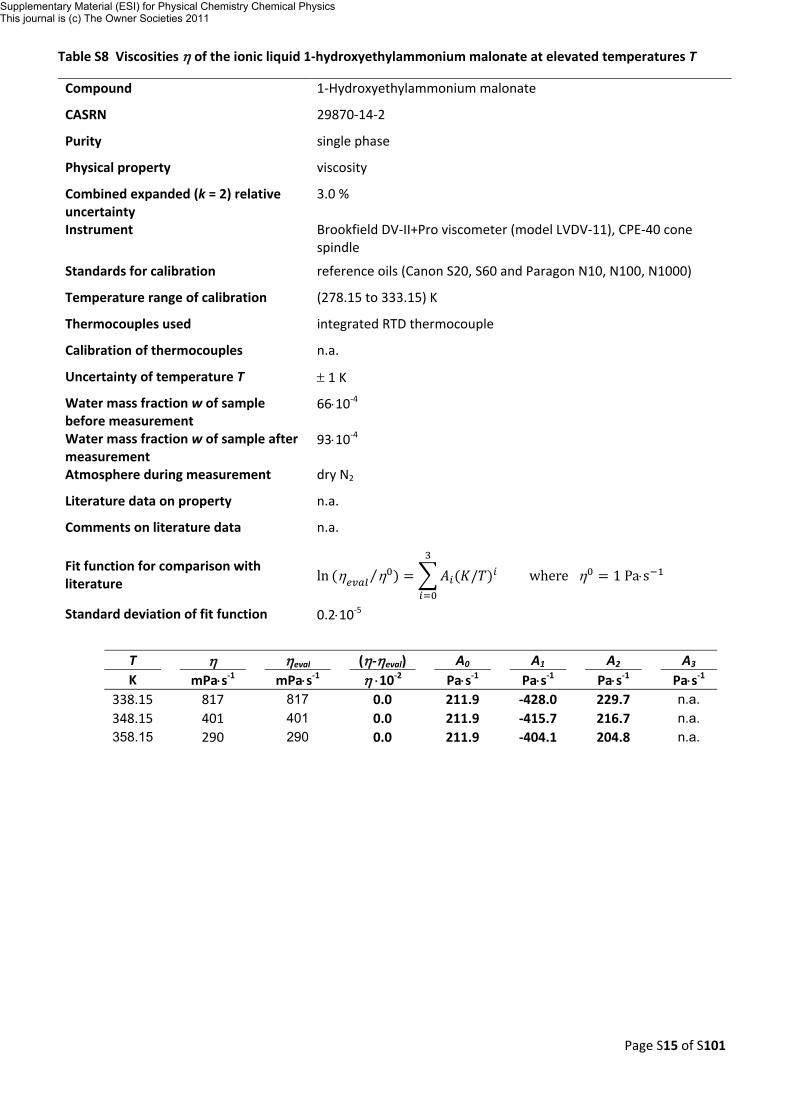
Table S8 Viscosities η of the ionic liquid 1‐hydroxyethylammonium malonate at elevated temperatures T
Compound 1‐Hydroxyethylammonium malonate
CASRN 29870‐14‐2
Purity single phase
Physical property viscosity
Combined expanded (k = 2) relative uncertainty
3.0 %
Instrument Brookfield DV‐II+Pro viscometer (model LVDV‐11), CPE‐40 cone spindle
Standards for calibration reference oils (Canon S20, S60 and Paragon N10, N100, N1000)
Temperature range of calibration (278.15 to 333.15) K
Thermocouples used integrated RTD thermocouple
Calibration of thermocouples n.a.
Uncertainty of temperature T ± 1 K
Water mass fraction w of sample before measurement
66⋅10‐4
Water mass fraction w of sample after measurement
93⋅10‐4
Atmosphere during measurement dry N2
Literature data on property n.a.
Comments on literature data n.a.
Fit function for comparison with literature ln η η⁄ / where η 1 Pa⋅s
Standard deviation of fit function 0.2⋅10‐5
T
η
ηeval (η‐ηeval) A0 A1 A2
A3 K mPa⋅s‐1 mPa⋅s‐1 η ⋅10‐2 Pa⋅s‐1 Pa⋅s‐1 Pa⋅s‐1 Pa⋅s‐1
338.15 817 817
0.0 211.9 ‐428.0 229.7
n.a. 348.15 401 401 0.0 211.9 ‐415.7 216.7 n.a. 358.15 290 290 0.0 211.9 ‐404.1 204.8 n.a.
Supplementary Material (ESI) for Physical Chemistry Chemical PhysicsThis journal is (c) The Owner Societies 2011
Page S16 of S101
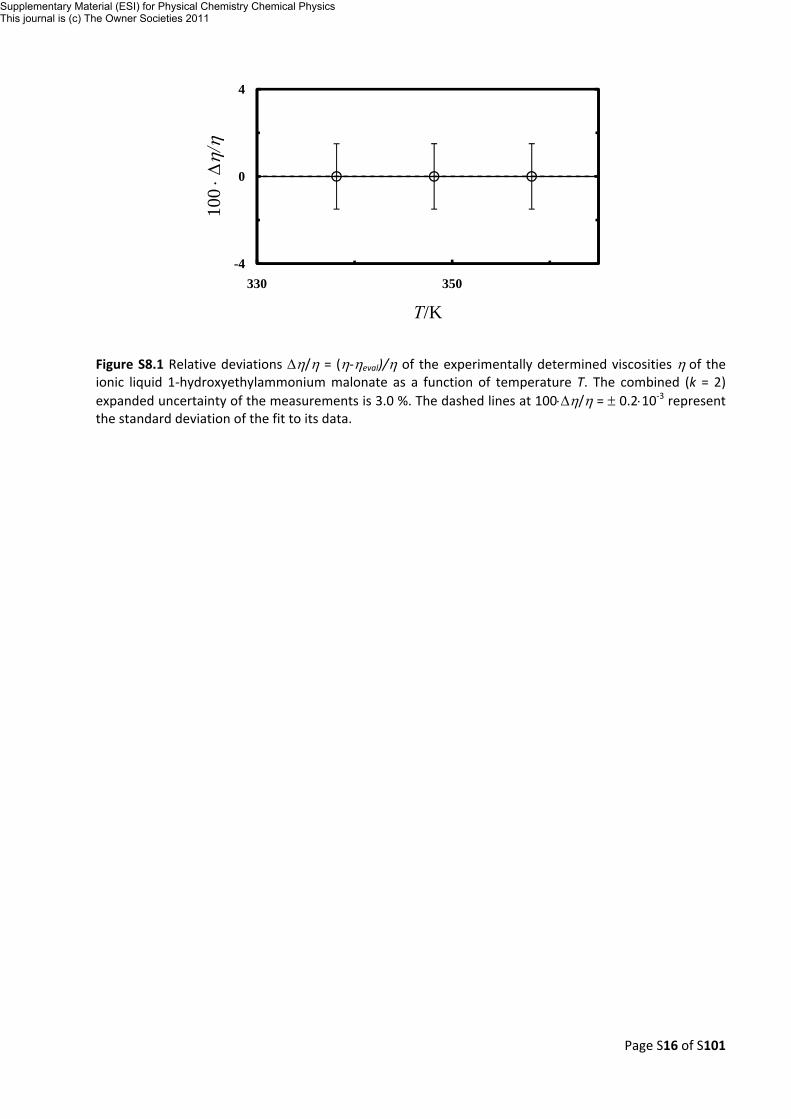
Figure S8.1 Relative deviations Δη/η = (η‐ηeval)/η of the experimentally determined viscosities η of the ionic liquid 1‐hydroxyethylammonium malonate as a function of temperature T. The combined (k = 2) expanded uncertainty of the measurements is 3.0 %. The dashed lines at 100⋅Δη/η = ± 0.2⋅10‐3 represent the standard deviation of the fit to its data.
-4
0
4
-4
0
4
330 350
100 ⋅Δ
η/η
T/K
Supplementary Material (ESI) for Physical Chemistry Chemical PhysicsThis journal is (c) The Owner Societies 2011
Page S17 of S101
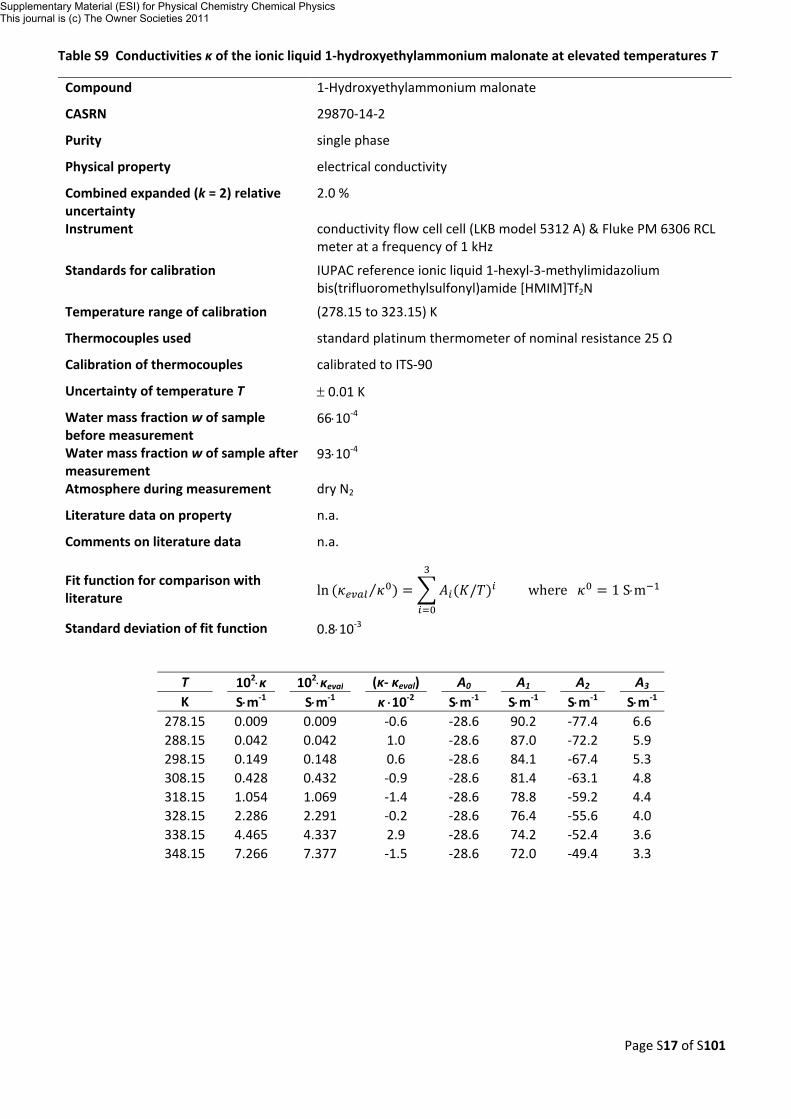
Table S9 Conductivities κ of the ionic liquid 1‐hydroxyethylammonium malonate at elevated temperatures T
Compound 1‐Hydroxyethylammonium malonate
CASRN 29870‐14‐2
Purity single phase
Physical property electrical conductivity
Combined expanded (k = 2) relative uncertainty
2.0 %
Instrument conductivity flow cell cell (LKB model 5312 A) & Fluke PM 6306 RCL meter at a frequency of 1 kHz
Standards for calibration IUPAC reference ionic liquid 1‐hexyl‐3‐methylimidazolium bis(trifluoromethylsulfonyl)amide [HMIM]Tf2N
Temperature range of calibration (278.15 to 323.15) K
Thermocouples used standard platinum thermometer of nominal resistance 25 Ω
Calibration of thermocouples calibrated to ITS‐90
Uncertainty of temperature T ± 0.01 K
Water mass fraction w of sample before measurement
66⋅10‐4
Water mass fraction w of sample after measurement
93⋅10‐4
Atmosphere during measurement dry N2
Literature data on property n.a.
Comments on literature data n.a.
Fit function for comparison with literature ln ⁄ / where 1 S⋅m
Standard deviation of fit function 0.8⋅10‐3
T
102⋅κ 102⋅κeval
(κ‐ κeval) A0 A1 A2 A3
K S⋅m‐1 S⋅m‐1 κ ⋅10‐2 S⋅m‐1 S⋅m‐1 S⋅m‐1 S⋅m‐1
278.15 0.009 0.009
‐0.6 ‐28.6 90.2 ‐77.4
6.6 288.15 0.042 0.042 1.0 ‐28.6 87.0 ‐72.2 5.9 298.15 0.149 0.148 0.6 ‐28.6 84.1 ‐67.4 5.3 308.15 0.428 0.432 ‐0.9 ‐28.6 81.4 ‐63.1 4.8 318.15 1.054 1.069 ‐1.4 ‐28.6 78.8 ‐59.2 4.4 328.15 2.286 2.291 ‐0.2 ‐28.6 76.4 ‐55.6 4.0 338.15 4.465 4.337 2.9 ‐28.6 74.2 ‐52.4 3.6 348.15 7.266 7.377 ‐1.5 ‐28.6 72.0 ‐49.4 3.3
Supplementary Material (ESI) for Physical Chemistry Chemical PhysicsThis journal is (c) The Owner Societies 2011
Page S18 of S101
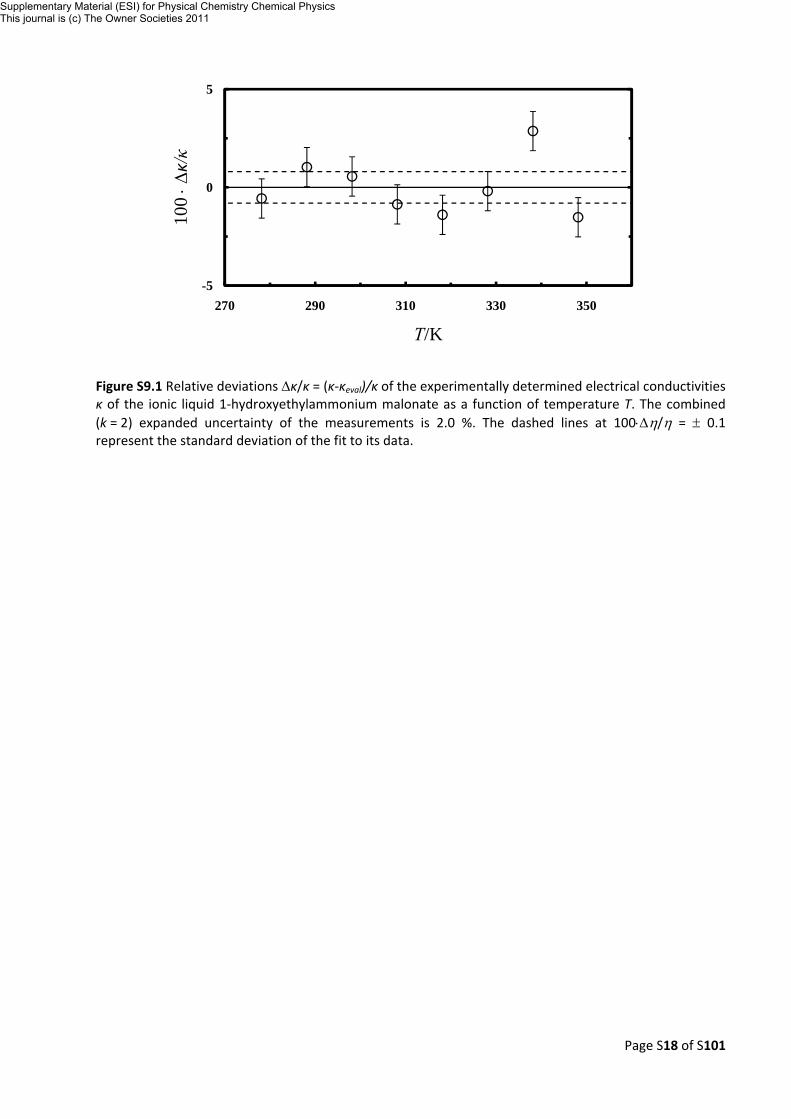
Figure S9.1 Relative deviations Δκ/κ = (κ‐κeval)/κ of the experimentally determined electrical conductivities κ of the ionic liquid 1‐hydroxyethylammonium malonate as a function of temperature T. The combined (k = 2) expanded uncertainty of the measurements is 2.0 %. The dashed lines at 100⋅Δη/η = ± 0.1 represent the standard deviation of the fit to its data.
-5
0
5
-5
0
5
270 290 310 330 350
100 ⋅Δ
κ/κ
T/K
Supplementary Material (ESI) for Physical Chemistry Chemical PhysicsThis journal is (c) The Owner Societies 2011
Page S19 of S101
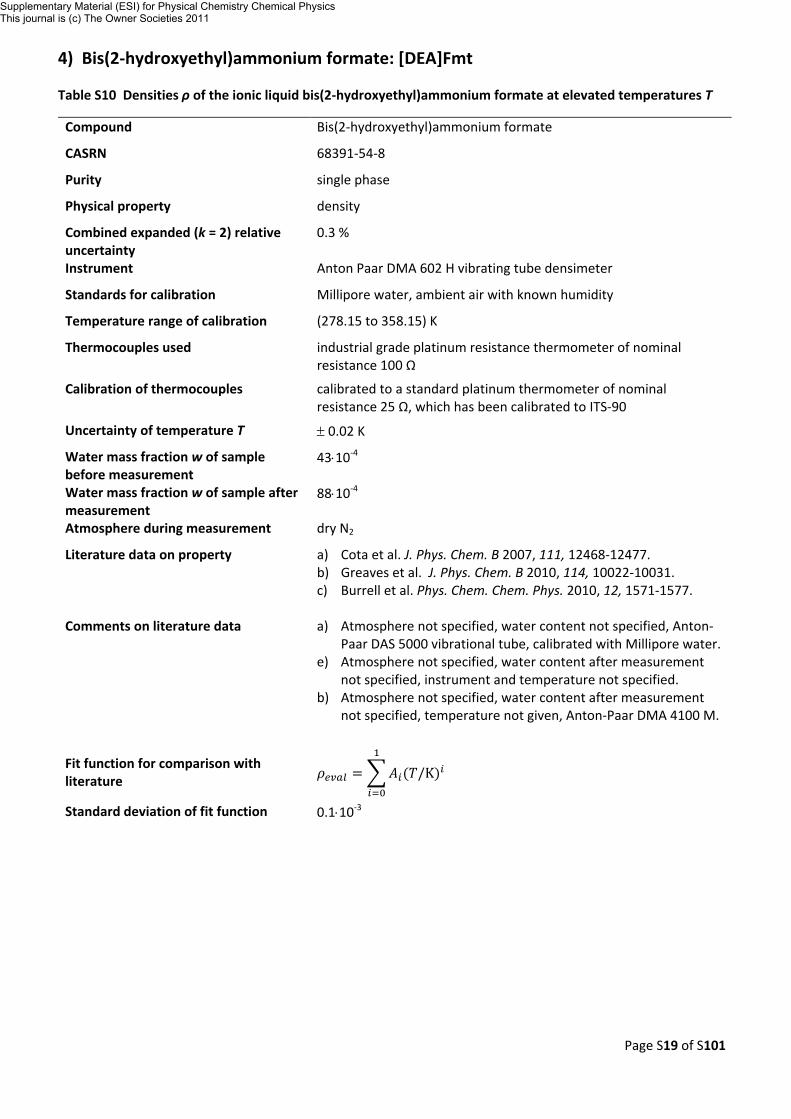
4) Bis(2‐hydroxyethyl)ammonium formate: [DEA]Fmt
Table S10 Densities ρ of the ionic liquid bis(2‐hydroxyethyl)ammonium formate at elevated temperatures T
Compound Bis(2‐hydroxyethyl)ammonium formate
CASRN 68391‐54‐8
Purity single phase
Physical property density
Combined expanded (k = 2) relative uncertainty
0.3 %
Instrument Anton Paar DMA 602 H vibrating tube densimeter
Standards for calibration Millipore water, ambient air with known humidity
Temperature range of calibration (278.15 to 358.15) K
Thermocouples used industrial grade platinum resistance thermometer of nominal resistance 100 Ω
Calibration of thermocouples calibrated to a standard platinum thermometer of nominal resistance 25 Ω, which has been calibrated to ITS‐90
Uncertainty of temperature T ± 0.02 K
Water mass fraction w of sample before measurement
43⋅10‐4
Water mass fraction w of sample after measurement
88⋅10‐4
Atmosphere during measurement dry N2
Literature data on property a) Cota et al. J. Phys. Chem. B 2007, 111, 12468‐12477. b) Greaves et al. J. Phys. Chem. B 2010, 114, 10022‐10031. c) Burrell et al. Phys. Chem. Chem. Phys. 2010, 12, 1571‐1577.
Comments on literature data a) Atmosphere not specified, water content not specified, Anton‐
Paar DAS 5000 vibrational tube, calibrated with Millipore water. e) Atmosphere not specified, water content after measurement
not specified, instrument and temperature not specified. b) Atmosphere not specified, water content after measurement
not specified, temperature not given, Anton‐Paar DMA 4100 M.
Fit function for comparison with literature /K
Standard deviation of fit function 0.1⋅10‐3
Supplementary Material (ESI) for Physical Chemistry Chemical PhysicsThis journal is (c) The Owner Societies 2011
Page S20 of S101
Table S10 continued…
T
ρ
ρeval (ρ‐ρeval) A0 A1 A2
A3 K kg⋅m‐3 kg⋅m‐3 ρ ⋅10‐2 kg⋅m‐3 kg⋅m‐3 kg⋅m‐3 kg⋅m‐3
278.15 1230.7 1230.9
0.0 1394.2 ‐163.3 n.a.
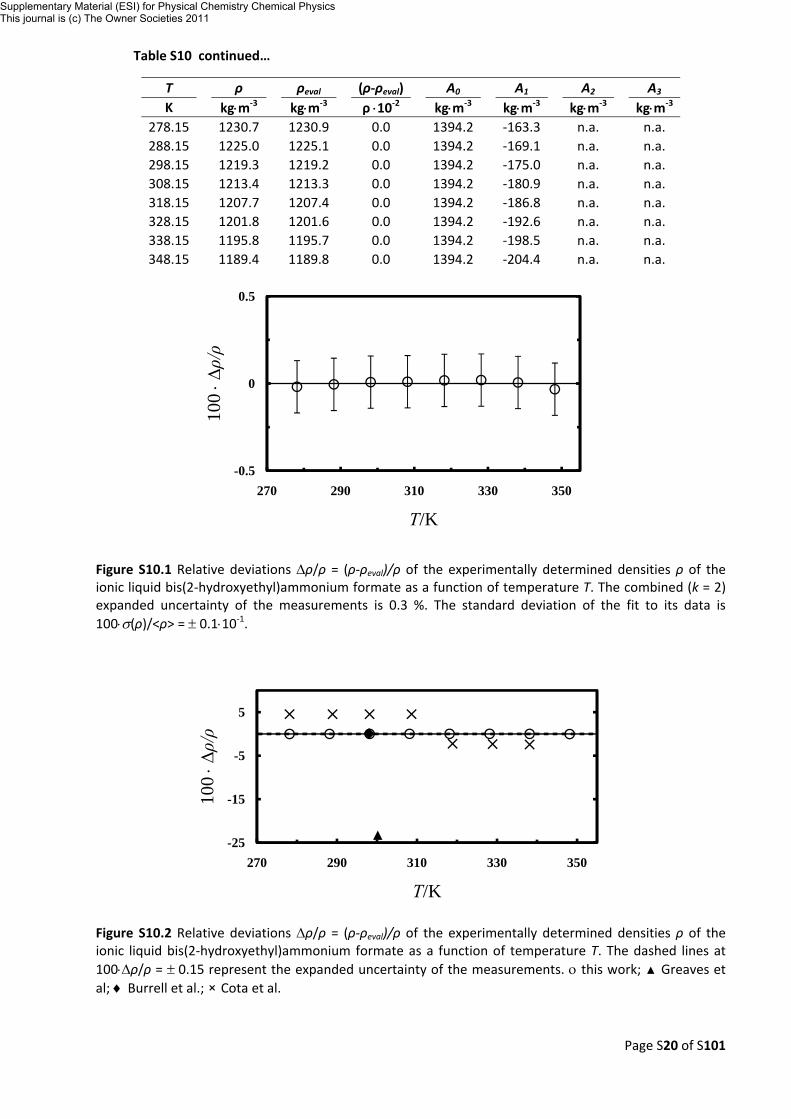
n.a. 288.15 1225.0 1225.1 0.0 1394.2 ‐169.1 n.a. n.a. 298.15 1219.3 1219.2 0.0 1394.2 ‐175.0 n.a. n.a. 308.15 1213.4 1213.3 0.0 1394.2 ‐180.9 n.a. n.a. 318.15 1207.7 1207.4 0.0 1394.2 ‐186.8 n.a. n.a. 328.15 1201.8 1201.6 0.0 1394.2 ‐192.6 n.a. n.a. 338.15 1195.8 1195.7 0.0 1394.2 ‐198.5 n.a. n.a. 348.15 1189.4 1189.8 0.0 1394.2 ‐204.4 n.a. n.a.
Figure S10.1 Relative deviations Δρ/ρ = (ρ‐ρeval)/ρ of the experimentally determined densities ρ of the ionic liquid bis(2‐hydroxyethyl)ammonium formate as a function of temperature T. The combined (k = 2) expanded uncertainty of the measurements is 0.3 %. The standard deviation of the fit to its data is 100⋅σ(ρ)/<ρ> = ± 0.1⋅10‐1.
Figure S10.2 Relative deviations Δρ/ρ = (ρ‐ρeval)/ρ of the experimentally determined densities ρ of the ionic liquid bis(2‐hydroxyethyl)ammonium formate as a function of temperature T. The dashed lines at 100⋅Δρ/ρ = ± 0.15 represent the expanded uncertainty of the measurements. ο this work; ▲ Greaves et al; ♦ Burrell et al.; × Cota et al.
-0.04
0
0.04
-0.5
0
0.5
270 290 310 330 350
100 ⋅Δρ/ρ
T/K
-25
-15
-5
5
-25
-15
-5
5
270 290 310 330 350
100 ⋅Δρ/ρ
T/K
Supplementary Material (ESI) for Physical Chemistry Chemical PhysicsThis journal is (c) The Owner Societies 2011
Page S21 of S101
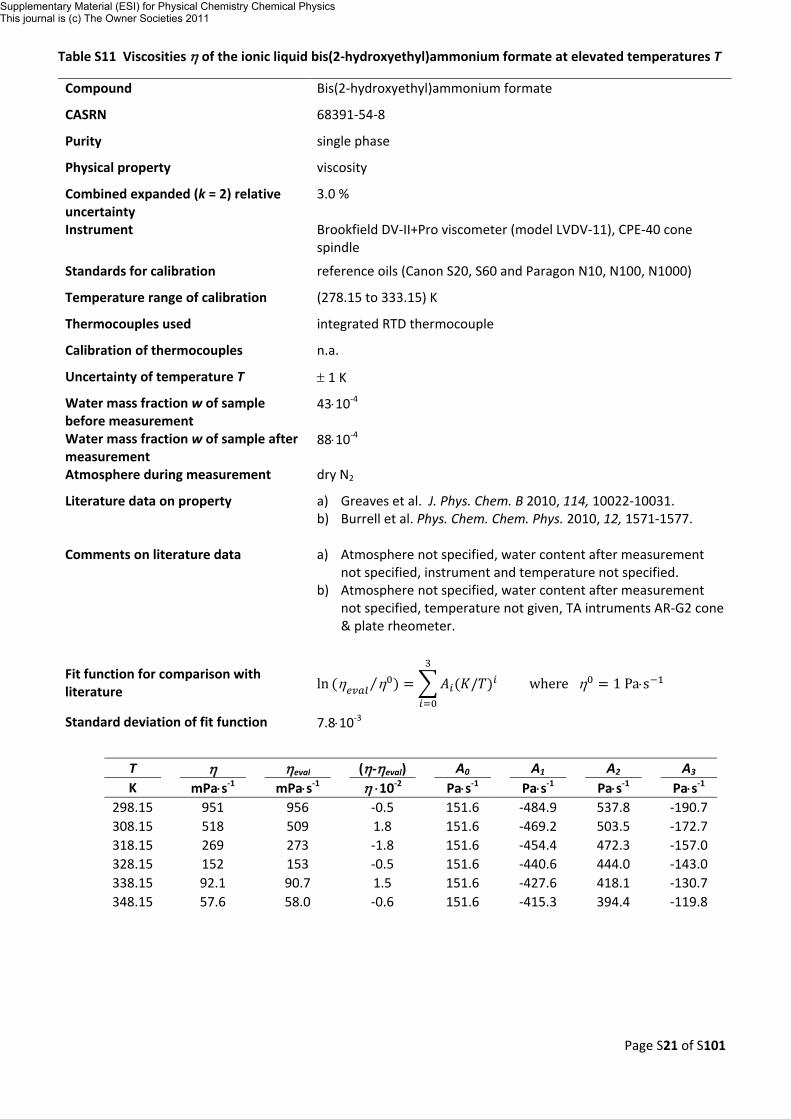
Table S11 Viscosities η of the ionic liquid bis(2‐hydroxyethyl)ammonium formate at elevated temperatures T
Compound Bis(2‐hydroxyethyl)ammonium formate
CASRN 68391‐54‐8
Purity single phase
Physical property viscosity
Combined expanded (k = 2) relative uncertainty
3.0 %
Instrument Brookfield DV‐II+Pro viscometer (model LVDV‐11), CPE‐40 cone spindle
Standards for calibration reference oils (Canon S20, S60 and Paragon N10, N100, N1000)
Temperature range of calibration (278.15 to 333.15) K
Thermocouples used integrated RTD thermocouple
Calibration of thermocouples n.a.
Uncertainty of temperature T ± 1 K
Water mass fraction w of sample before measurement
43⋅10‐4
Water mass fraction w of sample after measurement
88⋅10‐4
Atmosphere during measurement dry N2
Literature data on property a) Greaves et al. J. Phys. Chem. B 2010, 114, 10022‐10031. b) Burrell et al. Phys. Chem. Chem. Phys. 2010, 12, 1571‐1577.
Comments on literature data a) Atmosphere not specified, water content after measurement
not specified, instrument and temperature not specified. b) Atmosphere not specified, water content after measurement
not specified, temperature not given, TA intruments AR‐G2 cone & plate rheometer.
Fit function for comparison with literature ln η η⁄ / where η 1 Pa⋅s
Standard deviation of fit function 7.8⋅10‐3
T
η
ηeval (η‐ηeval) A0 A1 A2
A3 K mPa⋅s‐1 mPa⋅s‐1 η ⋅10‐2 Pa⋅s‐1 Pa⋅s‐1 Pa⋅s‐1 Pa⋅s‐1
298.15 951 956
‐0.5 151.6 ‐484.9 537.8
‐190.7 308.15 518 509 1.8 151.6 ‐469.2 503.5 ‐172.7 318.15 269 273 ‐1.8 151.6 ‐454.4 472.3 ‐157.0 328.15 152 153 ‐0.5 151.6 ‐440.6 444.0 ‐143.0 338.15 92.1 90.7 1.5 151.6 ‐427.6 418.1 ‐130.7 348.15 57.6 58.0 ‐0.6 151.6 ‐415.3 394.4 ‐119.8
Supplementary Material (ESI) for Physical Chemistry Chemical PhysicsThis journal is (c) The Owner Societies 2011
Page S22 of S101
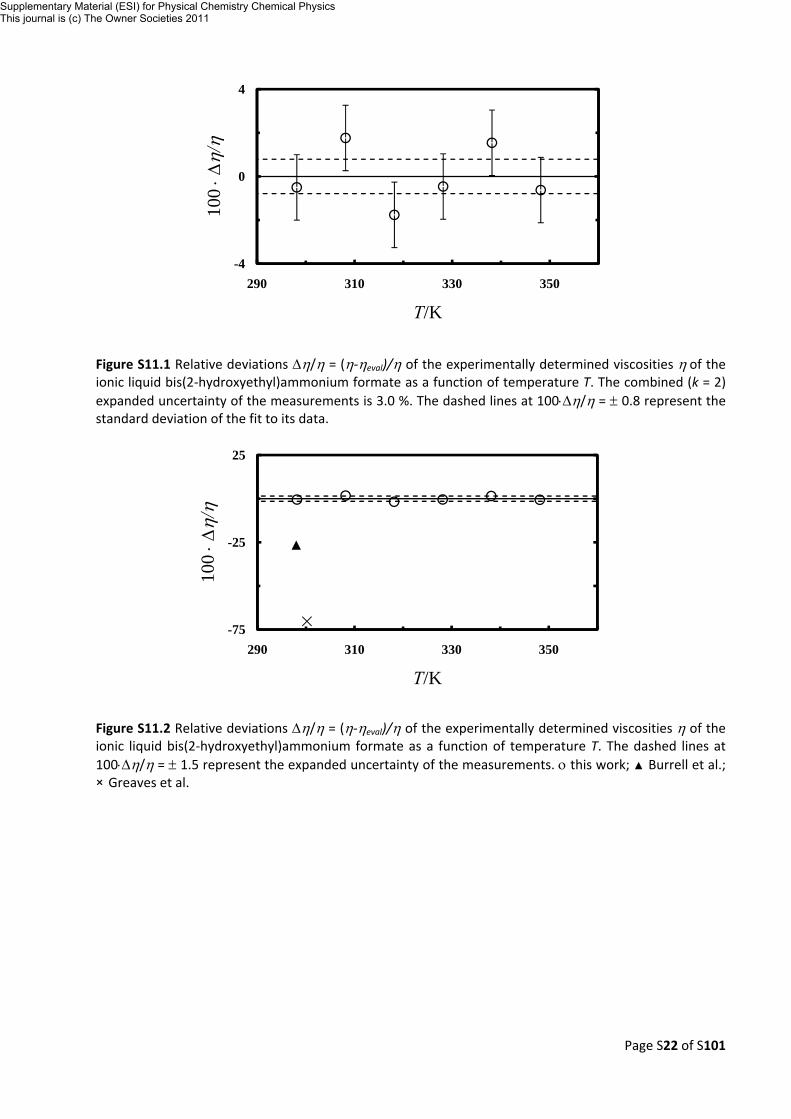
Figure S11.1 Relative deviations Δη/η = (η‐ηeval)/η of the experimentally determined viscosities η of the ionic liquid bis(2‐hydroxyethyl)ammonium formate as a function of temperature T. The combined (k = 2) expanded uncertainty of the measurements is 3.0 %. The dashed lines at 100⋅Δη/η = ± 0.8 represent the standard deviation of the fit to its data.
Figure S11.2 Relative deviations Δη/η = (η‐ηeval)/η of the experimentally determined viscosities η of the ionic liquid bis(2‐hydroxyethyl)ammonium formate as a function of temperature T. The dashed lines at 100⋅Δη/η = ± 1.5 represent the expanded uncertainty of the measurements. ο this work; ▲ Burrell et al.; × Greaves et al.
-4
0
4
-4
0
4
290 310 330 350
100 ⋅Δ
η/η
T/K
-75
-50
-25
0
25
-75
-25
25
290 310 330 350
100 ⋅Δ
η/η
T/K
Supplementary Material (ESI) for Physical Chemistry Chemical PhysicsThis journal is (c) The Owner Societies 2011
Page S23 of S101
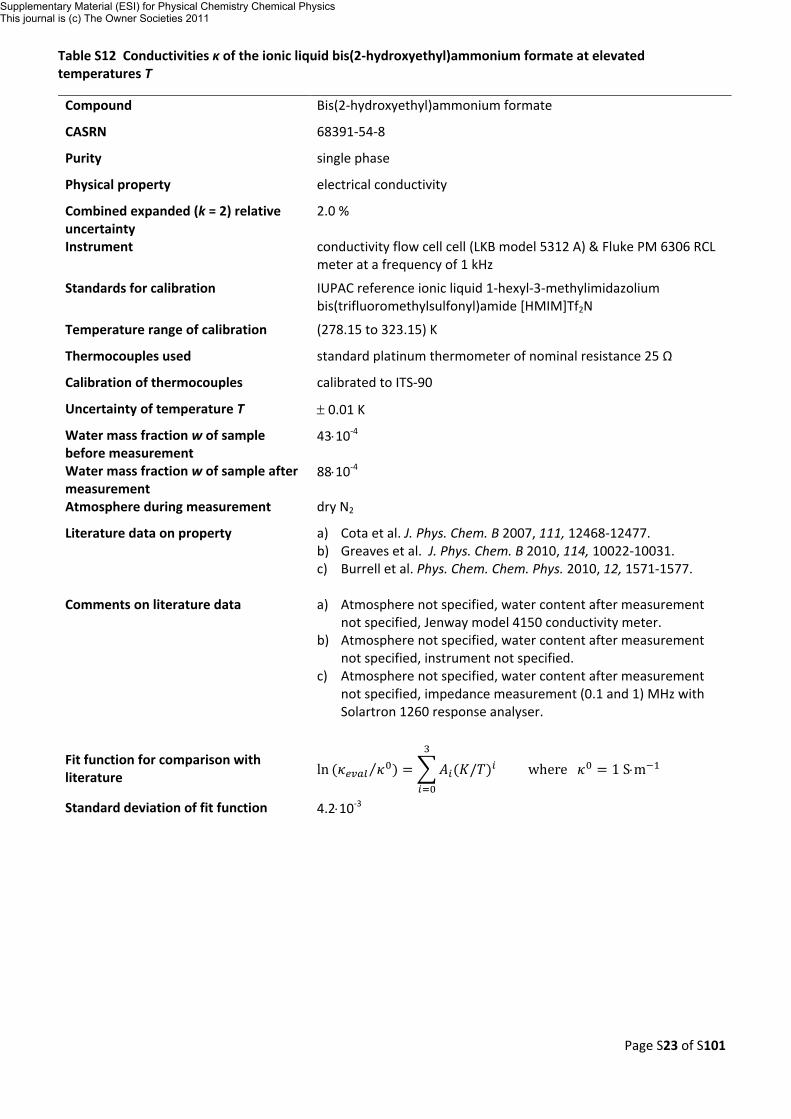
Table S12 Conductivities κ of the ionic liquid bis(2‐hydroxyethyl)ammonium formate at elevated temperatures T
Compound Bis(2‐hydroxyethyl)ammonium formate
CASRN 68391‐54‐8
Purity single phase
Physical property electrical conductivity
Combined expanded (k = 2) relative uncertainty
2.0 %
Instrument conductivity flow cell cell (LKB model 5312 A) & Fluke PM 6306 RCL meter at a frequency of 1 kHz
Standards for calibration IUPAC reference ionic liquid 1‐hexyl‐3‐methylimidazolium bis(trifluoromethylsulfonyl)amide [HMIM]Tf2N
Temperature range of calibration (278.15 to 323.15) K
Thermocouples used standard platinum thermometer of nominal resistance 25 Ω
Calibration of thermocouples calibrated to ITS‐90
Uncertainty of temperature T ± 0.01 K
Water mass fraction w of sample before measurement
43⋅10‐4
Water mass fraction w of sample after measurement
88⋅10‐4
Atmosphere during measurement dry N2
Literature data on property a) Cota et al. J. Phys. Chem. B 2007, 111, 12468‐12477. b) Greaves et al. J. Phys. Chem. B 2010, 114, 10022‐10031. c) Burrell et al. Phys. Chem. Chem. Phys. 2010, 12, 1571‐1577.
Comments on literature data a) Atmosphere not specified, water content after measurement
not specified, Jenway model 4150 conductivity meter. b) Atmosphere not specified, water content after measurement
not specified, instrument not specified. c) Atmosphere not specified, water content after measurement
not specified, impedance measurement (0.1 and 1) MHz with Solartron 1260 response analyser.
Fit function for comparison with literature ln ⁄ / where 1 S⋅m
Standard deviation of fit function 4.2⋅10‐3
Supplementary Material (ESI) for Physical Chemistry Chemical PhysicsThis journal is (c) The Owner Societies 2011
Page S24 of S101
Table S12 continued…
T
κ
κeval (κ‐ κeval) A0 A1 A2
A3 K S⋅m‐1 S⋅m‐1 κ ⋅10‐2 S⋅m‐1 S⋅m‐1 S⋅m‐1 S⋅m‐1
278.15 0.010 0.010
0.0 7.7 ‐17.0 24.3
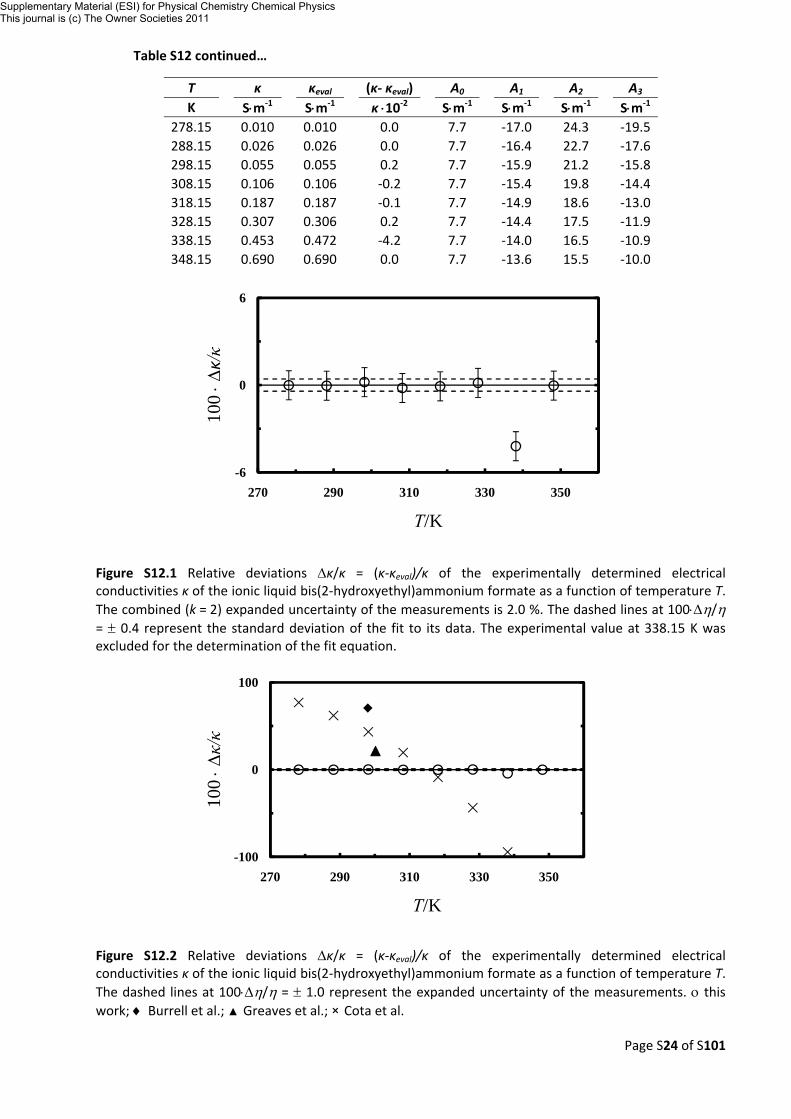
‐19.5 288.15 0.026 0.026 0.0 7.7 ‐16.4 22.7 ‐17.6 298.15 0.055 0.055 0.2 7.7 ‐15.9 21.2 ‐15.8 308.15 0.106 0.106 ‐0.2 7.7 ‐15.4 19.8 ‐14.4 318.15 0.187 0.187 ‐0.1 7.7 ‐14.9 18.6 ‐13.0 328.15 0.307 0.306 0.2 7.7 ‐14.4 17.5 ‐11.9 338.15 0.453 0.472 ‐4.2 7.7 ‐14.0 16.5 ‐10.9 348.15 0.690 0.690 0.0 7.7 ‐13.6 15.5 ‐10.0
Figure S12.1 Relative deviations Δκ/κ = (κ‐κeval)/κ of the experimentally determined electrical conductivities κ of the ionic liquid bis(2‐hydroxyethyl)ammonium formate as a function of temperature T. The combined (k = 2) expanded uncertainty of the measurements is 2.0 %. The dashed lines at 100⋅Δη/η = ± 0.4 represent the standard deviation of the fit to its data. The experimental value at 338.15 K was excluded for the determination of the fit equation.
Figure S12.2 Relative deviations Δκ/κ = (κ‐κeval)/κ of the experimentally determined electrical conductivities κ of the ionic liquid bis(2‐hydroxyethyl)ammonium formate as a function of temperature T. The dashed lines at 100⋅Δη/η = ± 1.0 represent the expanded uncertainty of the measurements. ο this work; ♦ Burrell et al.; ▲ Greaves et al.; × Cota et al.
-6
0
6
-6
0
6
270 290 310 330 350
100 ⋅Δ
κ/κ
T/K
-100
0
100
-100
0
100
270 290 310 330 350
100 ⋅Δκ/κ
T/K
Supplementary Material (ESI) for Physical Chemistry Chemical PhysicsThis journal is (c) The Owner Societies 2011
Page S25 of S101
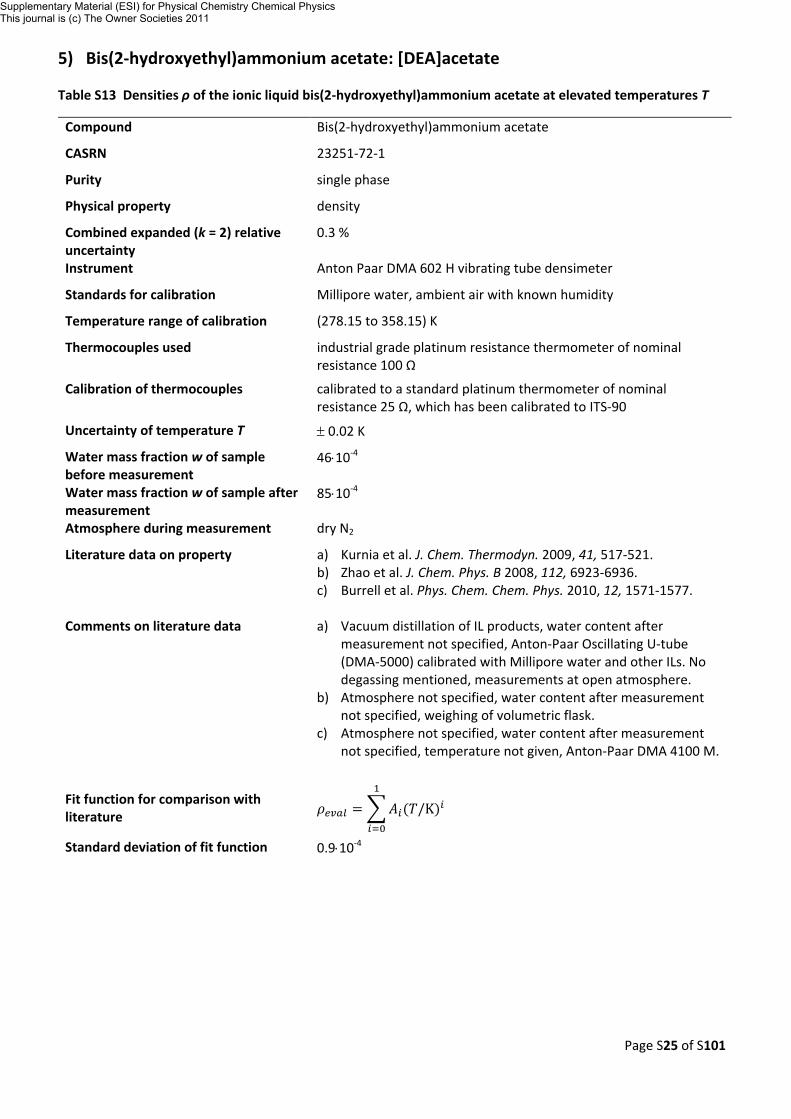
5) Bis(2‐hydroxyethyl)ammonium acetate: [DEA]acetate
Table S13 Densities ρ of the ionic liquid bis(2‐hydroxyethyl)ammonium acetate at elevated temperatures T
Compound Bis(2‐hydroxyethyl)ammonium acetate
CASRN 23251‐72‐1
Purity single phase
Physical property density
Combined expanded (k = 2) relative uncertainty
0.3 %
Instrument Anton Paar DMA 602 H vibrating tube densimeter
Standards for calibration Millipore water, ambient air with known humidity
Temperature range of calibration (278.15 to 358.15) K
Thermocouples used industrial grade platinum resistance thermometer of nominal resistance 100 Ω
Calibration of thermocouples calibrated to a standard platinum thermometer of nominal resistance 25 Ω, which has been calibrated to ITS‐90
Uncertainty of temperature T ± 0.02 K
Water mass fraction w of sample before measurement
46⋅10‐4
Water mass fraction w of sample after measurement
85⋅10‐4
Atmosphere during measurement dry N2
Literature data on property a) Kurnia et al. J. Chem. Thermodyn. 2009, 41, 517‐521. b) Zhao et al. J. Chem. Phys. B 2008, 112, 6923‐6936. c) Burrell et al. Phys. Chem. Chem. Phys. 2010, 12, 1571‐1577.
Comments on literature data a) Vacuum distillation of IL products, water content after
measurement not specified, Anton‐Paar Oscillating U‐tube (DMA‐5000) calibrated with Millipore water and other ILs. No degassing mentioned, measurements at open atmosphere.
b) Atmosphere not specified, water content after measurement not specified, weighing of volumetric flask.
c) Atmosphere not specified, water content after measurement not specified, temperature not given, Anton‐Paar DMA 4100 M.
Fit function for comparison with literature /K
Standard deviation of fit function 0.9⋅10‐4
Supplementary Material (ESI) for Physical Chemistry Chemical PhysicsThis journal is (c) The Owner Societies 2011
Page S26 of S101
Table S13 continued…
T
ρ
ρeval (ρ‐ρeval) A0 A1 A2
A3 K kg⋅m‐3 kg⋅m‐3 ρ ⋅10‐2 kg⋅m‐3 kg⋅m‐3 kg⋅m‐3 kg⋅m‐3
278.15 1190.4 1190.6
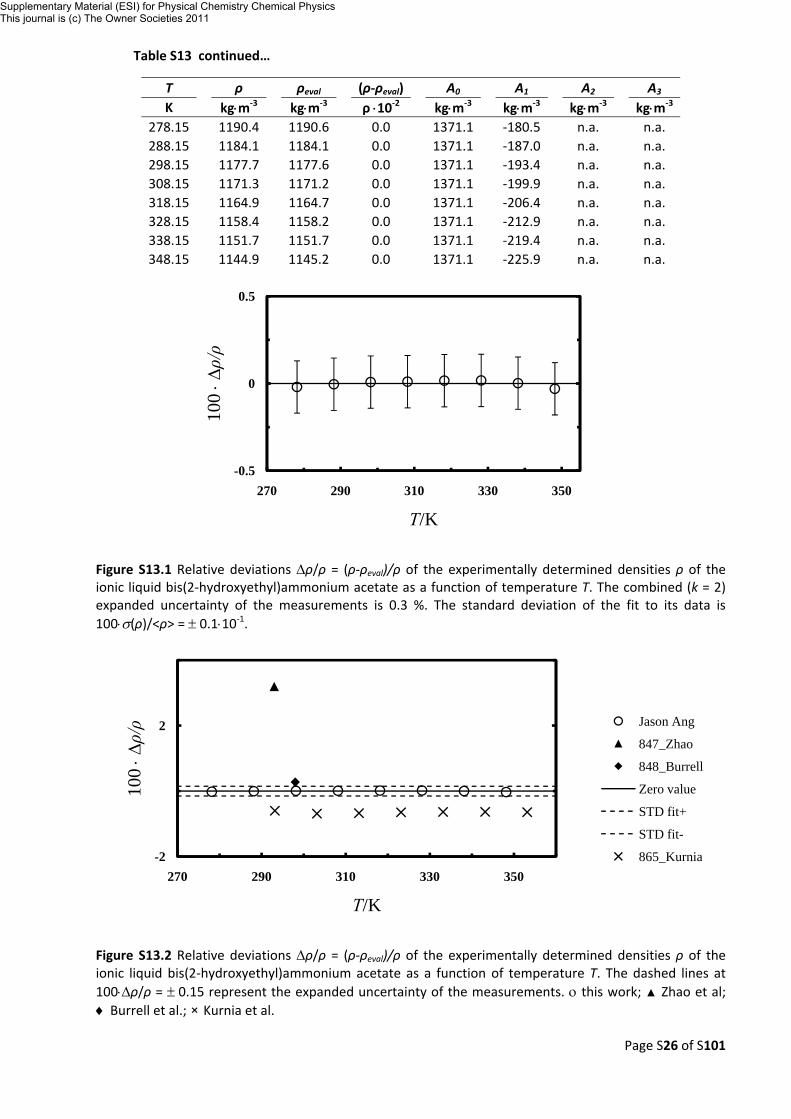
0.0 1371.1 ‐180.5 n.a.
n.a. 288.15 1184.1 1184.1 0.0 1371.1 ‐187.0 n.a. n.a. 298.15 1177.7 1177.6 0.0 1371.1 ‐193.4 n.a. n.a. 308.15 1171.3 1171.2 0.0 1371.1 ‐199.9 n.a. n.a. 318.15 1164.9 1164.7 0.0 1371.1 ‐206.4 n.a. n.a. 328.15 1158.4 1158.2 0.0 1371.1 ‐212.9 n.a. n.a. 338.15 1151.7 1151.7 0.0 1371.1 ‐219.4 n.a. n.a. 348.15 1144.9 1145.2 0.0 1371.1 ‐225.9 n.a. n.a.
Figure S13.1 Relative deviations Δρ/ρ = (ρ‐ρeval)/ρ of the experimentally determined densities ρ of the ionic liquid bis(2‐hydroxyethyl)ammonium acetate as a function of temperature T. The combined (k = 2) expanded uncertainty of the measurements is 0.3 %. The standard deviation of the fit to its data is 100⋅σ(ρ)/<ρ> = ± 0.1⋅10‐1.
Figure S13.2 Relative deviations Δρ/ρ = (ρ‐ρeval)/ρ of the experimentally determined densities ρ of the ionic liquid bis(2‐hydroxyethyl)ammonium acetate as a function of temperature T. The dashed lines at 100⋅Δρ/ρ = ± 0.15 represent the expanded uncertainty of the measurements. ο this work; ▲ Zhao et al; ♦ Burrell et al.; × Kurnia et al.
-0.04
0
0.04
-0.5
0
0.5
270 290 310 330 350
100 ⋅Δρ/ρ
T/K
-2
2
-2
2
270 290 310 330 350
100 ⋅Δρ/ρ
T/K
Jason Ang
847_Zhao
848_Burrell
Zero value
STD fit+
STD fit-
865_Kurnia
Supplementary Material (ESI) for Physical Chemistry Chemical PhysicsThis journal is (c) The Owner Societies 2011
Page S27 of S101
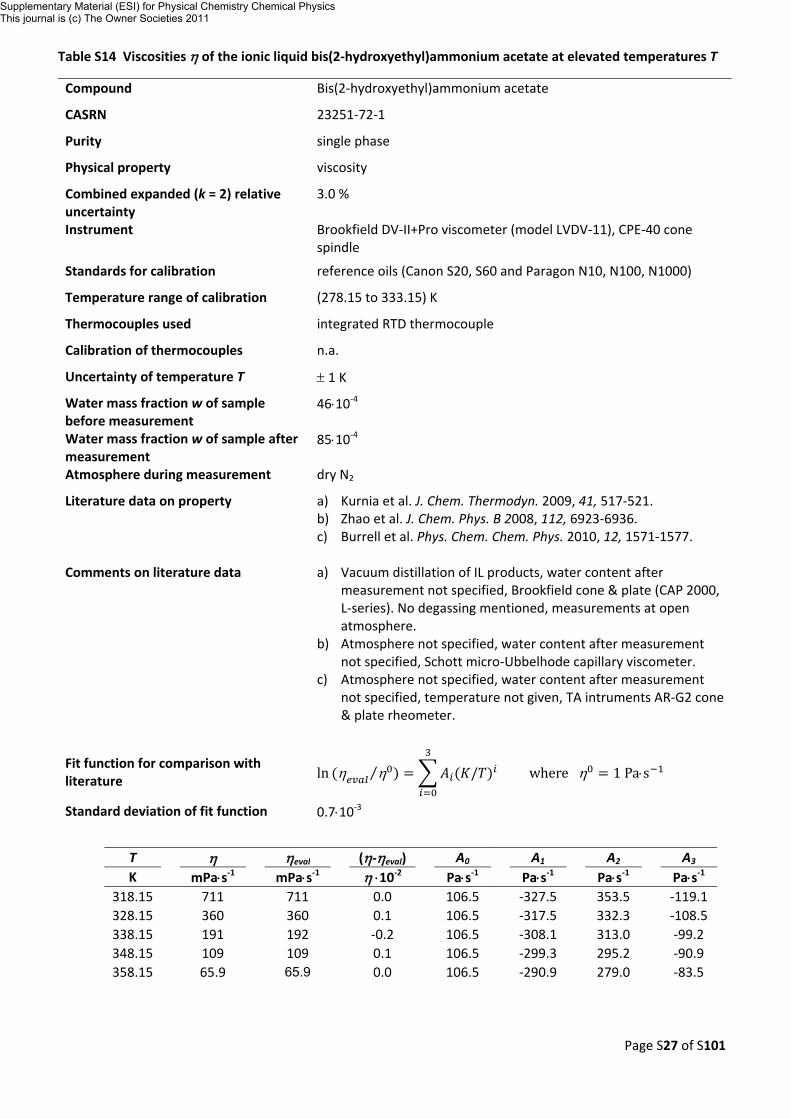
Table S14 Viscosities η of the ionic liquid bis(2‐hydroxyethyl)ammonium acetate at elevated temperatures T
Compound Bis(2‐hydroxyethyl)ammonium acetate
CASRN 23251‐72‐1
Purity single phase
Physical property viscosity
Combined expanded (k = 2) relative uncertainty
3.0 %
Instrument Brookfield DV‐II+Pro viscometer (model LVDV‐11), CPE‐40 cone spindle
Standards for calibration reference oils (Canon S20, S60 and Paragon N10, N100, N1000)
Temperature range of calibration (278.15 to 333.15) K
Thermocouples used integrated RTD thermocouple
Calibration of thermocouples n.a.
Uncertainty of temperature T ± 1 K
Water mass fraction w of sample before measurement
46⋅10‐4
Water mass fraction w of sample after measurement
85⋅10‐4
Atmosphere during measurement dry N2
Literature data on property a) Kurnia et al. J. Chem. Thermodyn. 2009, 41, 517‐521. b) Zhao et al. J. Chem. Phys. B 2008, 112, 6923‐6936. c) Burrell et al. Phys. Chem. Chem. Phys. 2010, 12, 1571‐1577.
Comments on literature data a) Vacuum distillation of IL products, water content after
measurement not specified, Brookfield cone & plate (CAP 2000, L‐series). No degassing mentioned, measurements at open atmosphere.
b) Atmosphere not specified, water content after measurement not specified, Schott micro‐Ubbelhode capillary viscometer.
c) Atmosphere not specified, water content after measurement not specified, temperature not given, TA intruments AR‐G2 cone & plate rheometer.
Fit function for comparison with literature ln η η⁄ / where η 1 Pa⋅s
Standard deviation of fit function 0.7⋅10‐3
T
η
ηeval (η‐ηeval) A0 A1 A2
A3 K mPa⋅s‐1 mPa⋅s‐1 η ⋅10‐2 Pa⋅s‐1 Pa⋅s‐1 Pa⋅s‐1 Pa⋅s‐1
318.15 711 711
0.0 106.5 ‐327.5 353.5
‐119.1 328.15 360 360 0.1 106.5 ‐317.5 332.3 ‐108.5 338.15 191 192 ‐0.2 106.5 ‐308.1 313.0 ‐99.2 348.15 109 109 0.1 106.5 ‐299.3 295.2 ‐90.9 358.15 65.9 65.9 0.0 106.5 ‐290.9 279.0 ‐83.5
Supplementary Material (ESI) for Physical Chemistry Chemical PhysicsThis journal is (c) The Owner Societies 2011
Page S28 of S101
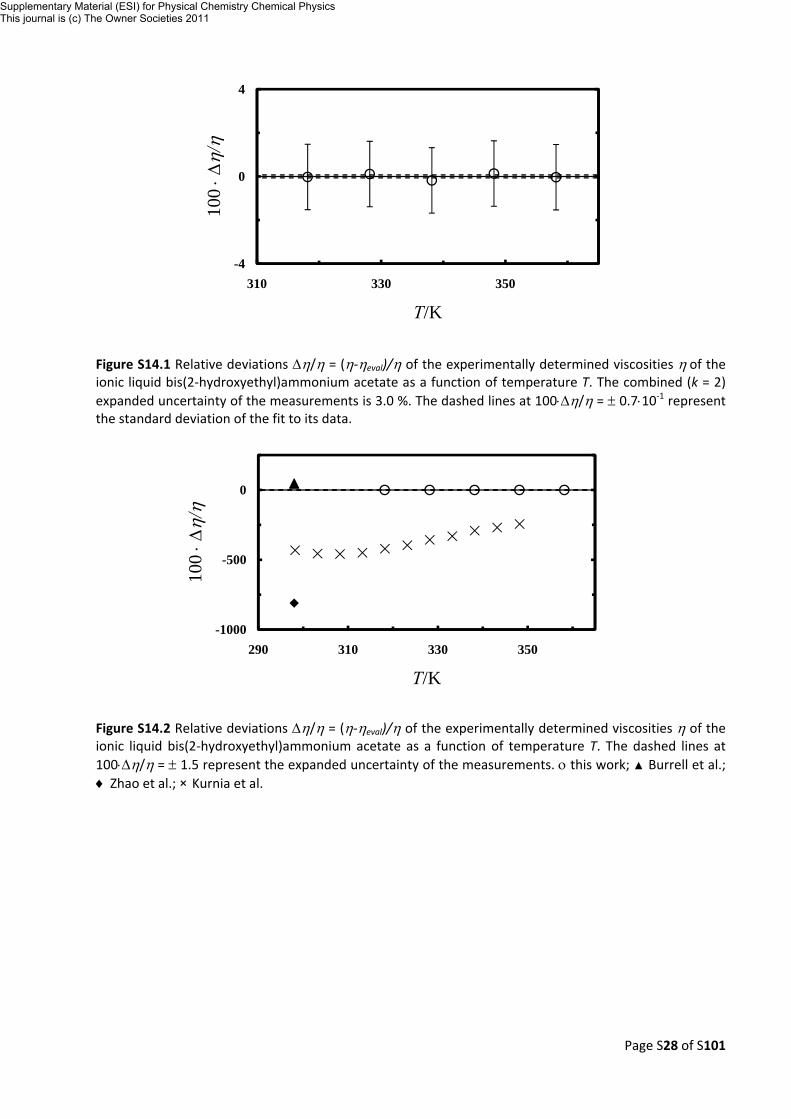
Figure S14.1 Relative deviations Δη/η = (η‐ηeval)/η of the experimentally determined viscosities η of the ionic liquid bis(2‐hydroxyethyl)ammonium acetate as a function of temperature T. The combined (k = 2) expanded uncertainty of the measurements is 3.0 %. The dashed lines at 100⋅Δη/η = ± 0.7⋅10‐1 represent the standard deviation of the fit to its data.
Figure S14.2 Relative deviations Δη/η = (η‐ηeval)/η of the experimentally determined viscosities η of the ionic liquid bis(2‐hydroxyethyl)ammonium acetate as a function of temperature T. The dashed lines at 100⋅Δη/η = ± 1.5 represent the expanded uncertainty of the measurements. ο this work; ▲ Burrell et al.; ♦ Zhao et al.; × Kurnia et al.
-4
0
4
-4
0
4
310 330 350
100 ⋅Δ
η/η
T/K
-1000
-500
0
-1000
-500
0
290 310 330 350
100 ⋅Δ
η/η
T/K
Supplementary Material (ESI) for Physical Chemistry Chemical PhysicsThis journal is (c) The Owner Societies 2011
Page S29 of S101
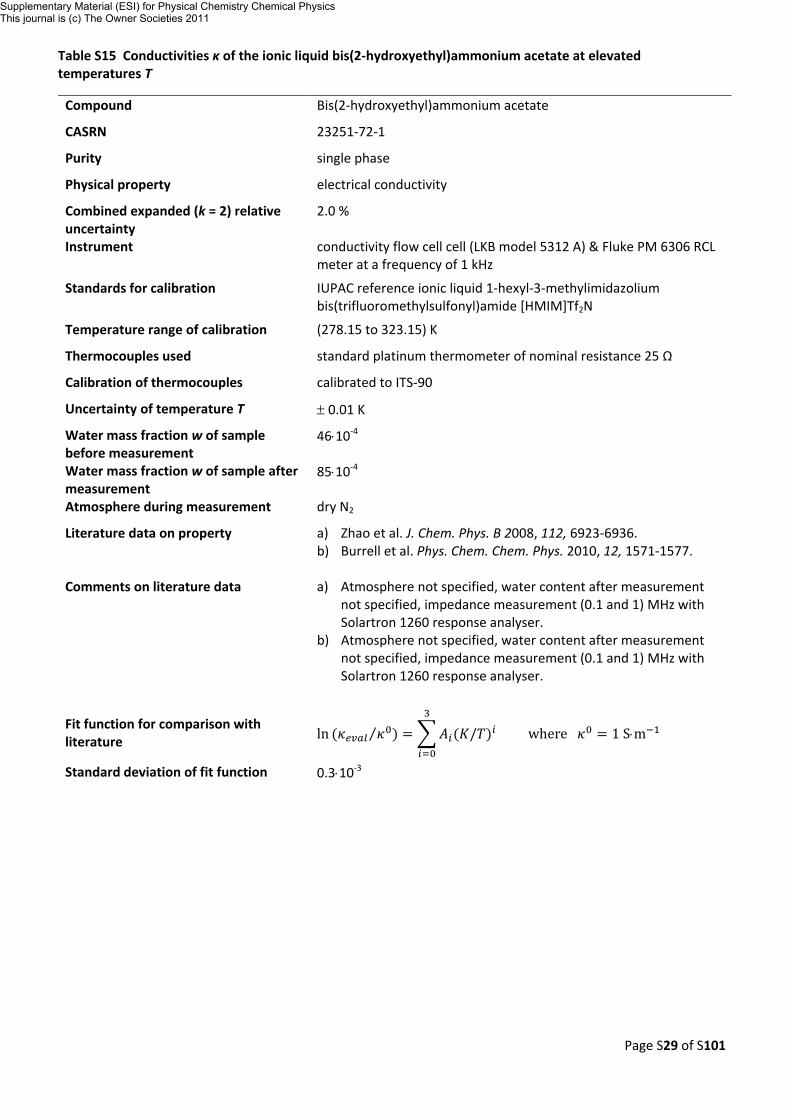
Table S15 Conductivities κ of the ionic liquid bis(2‐hydroxyethyl)ammonium acetate at elevated temperatures T
Compound Bis(2‐hydroxyethyl)ammonium acetate
CASRN 23251‐72‐1
Purity single phase
Physical property electrical conductivity
Combined expanded (k = 2) relative uncertainty
2.0 %
Instrument conductivity flow cell cell (LKB model 5312 A) & Fluke PM 6306 RCL meter at a frequency of 1 kHz
Standards for calibration IUPAC reference ionic liquid 1‐hexyl‐3‐methylimidazolium bis(trifluoromethylsulfonyl)amide [HMIM]Tf2N
Temperature range of calibration (278.15 to 323.15) K
Thermocouples used standard platinum thermometer of nominal resistance 25 Ω
Calibration of thermocouples calibrated to ITS‐90
Uncertainty of temperature T ± 0.01 K
Water mass fraction w of sample before measurement
46⋅10‐4
Water mass fraction w of sample after measurement
85⋅10‐4
Atmosphere during measurement dry N2
Literature data on property a) Zhao et al. J. Chem. Phys. B 2008, 112, 6923‐6936. b) Burrell et al. Phys. Chem. Chem. Phys. 2010, 12, 1571‐1577.
Comments on literature data a) Atmosphere not specified, water content after measurement
not specified, impedance measurement (0.1 and 1) MHz with Solartron 1260 response analyser.
b) Atmosphere not specified, water content after measurement not specified, impedance measurement (0.1 and 1) MHz with Solartron 1260 response analyser.
Fit function for comparison with literature ln ⁄ / where 1 S⋅m
Standard deviation of fit function 0.3⋅10‐3
Supplementary Material (ESI) for Physical Chemistry Chemical PhysicsThis journal is (c) The Owner Societies 2011
Page S30 of S101
Table S15 continued…
T
κ
κeval (κ‐ κeval) A0 A1 A2
A3 K S⋅m‐1 S⋅m‐1 κ ⋅10‐2 S⋅m‐1 S⋅m‐1 S⋅m‐1 S⋅m‐1
278.15 0.002 0.002
0.0 5.0 ‐5.9 10.2
‐15.6 288.15 0.005 0.005 0.0 5.0 ‐5.7 9.5 ‐14.0 298.15 0.013 0.013 0.0 5.0 ‐5.6 8.8 ‐12.6 308.15 0.028 0.028 -0.1 5.0 ‐5.4 8.3 ‐11.4 318.15 0.057 0.057 0.1 5.0 ‐5.2 7.8 ‐10.4 328.15 0.105 0.105 0.0 5.0 ‐5.0 7.3 ‐9.5 338.15 0.181 0.181 0.0 5.0 ‐4.9 6.9 ‐8.7 348.15 0.291 0.291 0.0 5.0 ‐4.8 6.5 ‐7.9
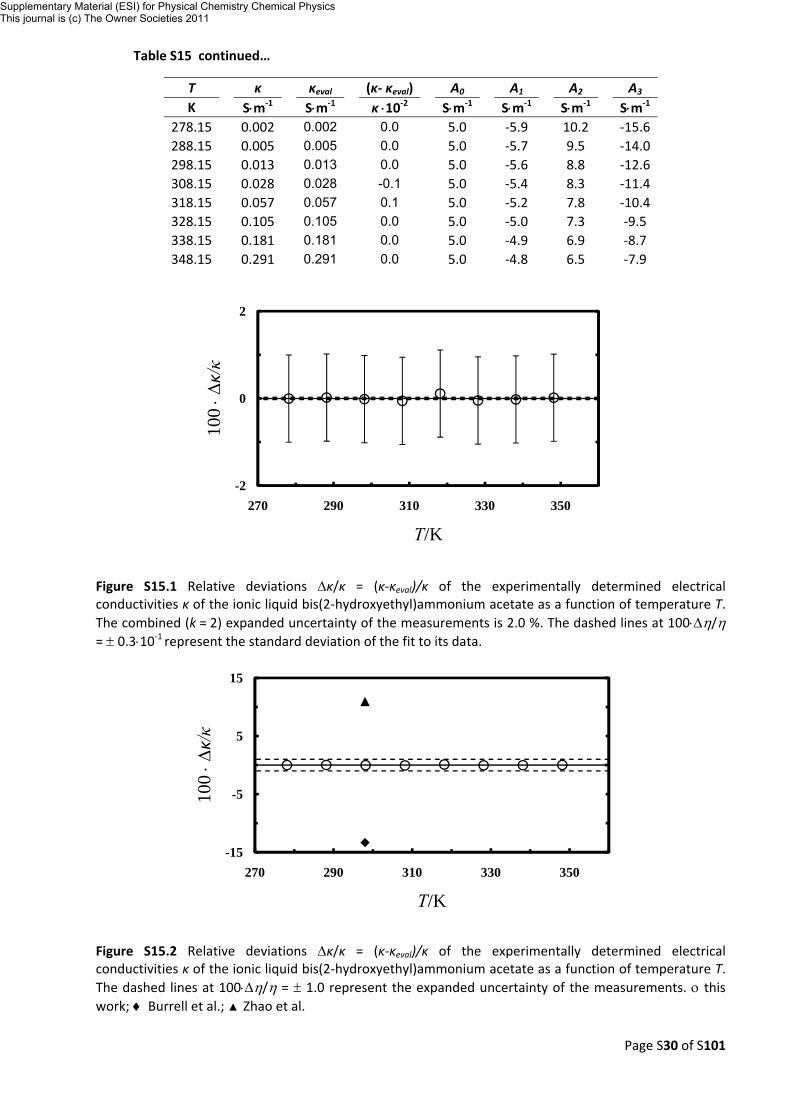
Figure S15.1 Relative deviations Δκ/κ = (κ‐κeval)/κ of the experimentally determined electrical conductivities κ of the ionic liquid bis(2‐hydroxyethyl)ammonium acetate as a function of temperature T. The combined (k = 2) expanded uncertainty of the measurements is 2.0 %. The dashed lines at 100⋅Δη/η = ± 0.3⋅10‐1 represent the standard deviation of the fit to its data.
Figure S15.2 Relative deviations Δκ/κ = (κ‐κeval)/κ of the experimentally determined electrical conductivities κ of the ionic liquid bis(2‐hydroxyethyl)ammonium acetate as a function of temperature T. The dashed lines at 100⋅Δη/η = ± 1.0 represent the expanded uncertainty of the measurements. ο this work; ♦ Burrell et al.; ▲ Zhao et al.
-2
0
2
-2
0
2
270 290 310 330 350
100 ⋅Δ
κ/κ
T/K
‐15
0
15
-15
-5
5
15
270 290 310 330 350
100 ⋅Δ
κ/κ
T/K
Supplementary Material (ESI) for Physical Chemistry Chemical PhysicsThis journal is (c) The Owner Societies 2011

Page S31 of S101
6) Bis(2‐hydroxyethyl)ammonium malonate: [DEA]Mal
Table S16 Densities ρ of the ionic liquid bis(2‐hydroxyethyl)ammonium malonate at elevated temperatures T
Compound Bis(2‐hydroxyethyl)ammonium malonate
CASRN 29870‐26‐6
Purity single phase
Physical property density
Combined expanded (k = 2) relative uncertainty
0.3 %
Instrument Anton Paar DMA 602 H vibrating tube densimeter
Standards for calibration Millipore water, ambient air with known humidity
Temperature range of calibration (278.15 to 358.15) K
Thermocouples used industrial grade platinum resistance thermometer of nominal resistance 100 Ω
Calibration of thermocouples calibrated to a standard platinum thermometer of nominal resistance 25 Ω, which has been calibrated to ITS‐90
Uncertainty of temperature T ± 0.02 K
Water mass fraction w of sample before measurement
39⋅10‐3
Water mass fraction w of sample after measurement
44⋅10‐3
Atmosphere during measurement dry N2
Literature data on property n.a.
Comments on literature data n.a.
Fit function for comparison with literature /K
Standard deviation of fit function 0.5⋅10‐4
T
ρ
ρeval (ρ‐ρeval) A0 A1 A2
A3 K kg⋅m‐3 kg⋅m‐3 ρ ⋅10‐2 kg⋅m‐3 kg⋅m‐3 kg⋅m‐3 kg⋅m‐3
278.15 1253.4 1253.5
0.0 1429.9 ‐176.4 n.a.
n.a. 288.15 1247.1 1247.2 0.0 1429.9 ‐182.8 n.a. n.a. 298.15 1240.9 1240.8 0.0 1429.9 ‐189.1 n.a. n.a. 308.15 1234.5 1234.5 0.0 1429.9 ‐195.5 n.a. n.a. 318.15 1228.2 1228.1 0.0 1429.9 ‐201.8 n.a. n.a. 328.15 1222.0 1221.8 0.0 1429.9 ‐208.2 n.a. n.a. 338.15 1215.6 1215.4 0.0 1429.9 ‐214.5 n.a. n.a. 348.15 1208.8 1209.1 0.0 1429.9 ‐220.8 n.a. n.a.
Supplementary Material (ESI) for Physical Chemistry Chemical PhysicsThis journal is (c) The Owner Societies 2011

Page S32 of S101
Figure S16.1 Relative deviations Δρ/ρ = (ρ‐ρeval)/ρ of the experimentally determined densities ρ of the ionic liquid bis(2‐hydroxyethyl)ammonium malonate as a function of temperature T. The combined (k = 2) expanded uncertainty of the measurements is 0.3 %. The standard deviation of the fit to its data is 100⋅σ(ρ)/<ρ> = ± 0.5⋅10‐2.
-0.04
0
0.04
-0.5
0
0.5
270 290 310 330 350
100 ⋅Δρ/ρ
T/K
Supplementary Material (ESI) for Physical Chemistry Chemical PhysicsThis journal is (c) The Owner Societies 2011

Page S33 of S101
Table S17 Viscosities η of the ionic liquid bis(2‐hydroxyethyl)ammonium malonate at elevated temperatures T
Compound Bis(2‐hydroxyethyl)ammonium malonate
CASRN 29870‐26‐6
Purity single phase
Physical property viscosity
Combined expanded (k = 2) relative uncertainty
3.0 %
Instrument Brookfield DV‐II+Pro viscometer (model LVDV‐11), CPE‐40 cone spindle
Standards for calibration reference oils (Canon S20, S60 and Paragon N10, N100, N1000)
Temperature range of calibration (278.15 to 333.15) K
Thermocouples used integrated RTD thermocouple
Calibration of thermocouples n.a.
Uncertainty of temperature T ± 1 K
Water mass fraction w of sample before measurement
39⋅10‐3
Water mass fraction w of sample after measurement
44⋅10‐3
Atmosphere during measurement dry N2
Literature data on property n.a.
Comments on literature data n.a.
Fit function for comparison with literature ln η η⁄ / where η 1 Pa⋅s
Standard deviation of fit function 1.5⋅10‐3
T
η
ηeval (η‐ηeval) A0 A1 A2
A3 K mPa⋅s‐1 mPa⋅s‐1 η ⋅10‐2 Pa⋅s‐1 Pa⋅s‐1 Pa⋅s‐1 Pa⋅s‐1
328.15 489 489
0.1 15.0 ‐25.5 23.6
n.a. 338.15 262 262 ‐0.3 15.0 ‐24.8 22.3 n.a. 348.15 152 152 0.3 15.0 ‐24.1 21.0 n.a. 358.15 93.2 93.3 ‐0.1 15.0 ‐23.4 19.8 n.a.
Supplementary Material (ESI) for Physical Chemistry Chemical PhysicsThis journal is (c) The Owner Societies 2011
Page S34 of S101
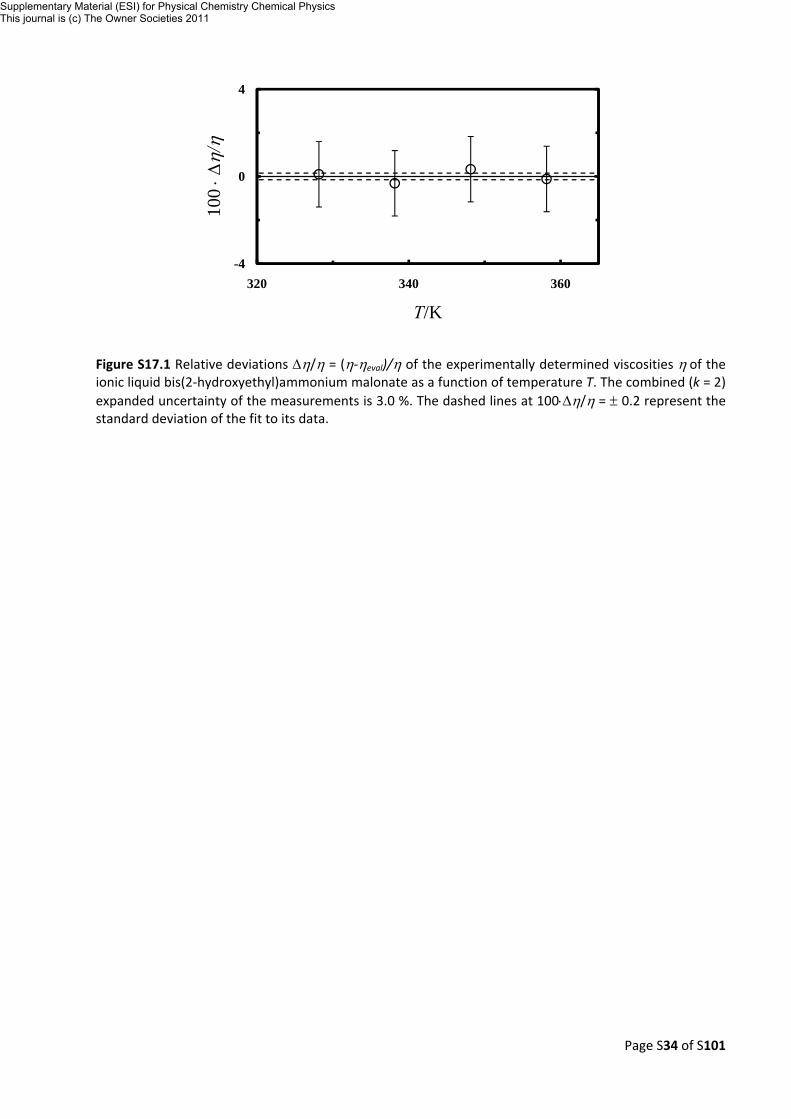
Figure S17.1 Relative deviations Δη/η = (η‐ηeval)/η of the experimentally determined viscosities η of the ionic liquid bis(2‐hydroxyethyl)ammonium malonate as a function of temperature T. The combined (k = 2) expanded uncertainty of the measurements is 3.0 %. The dashed lines at 100⋅Δη/η = ± 0.2 represent the standard deviation of the fit to its data.
-4
0
4
-4
0
4
320 340 360
100 ⋅Δ
η/η
T/K
Supplementary Material (ESI) for Physical Chemistry Chemical PhysicsThis journal is (c) The Owner Societies 2011
Page S35 of S101
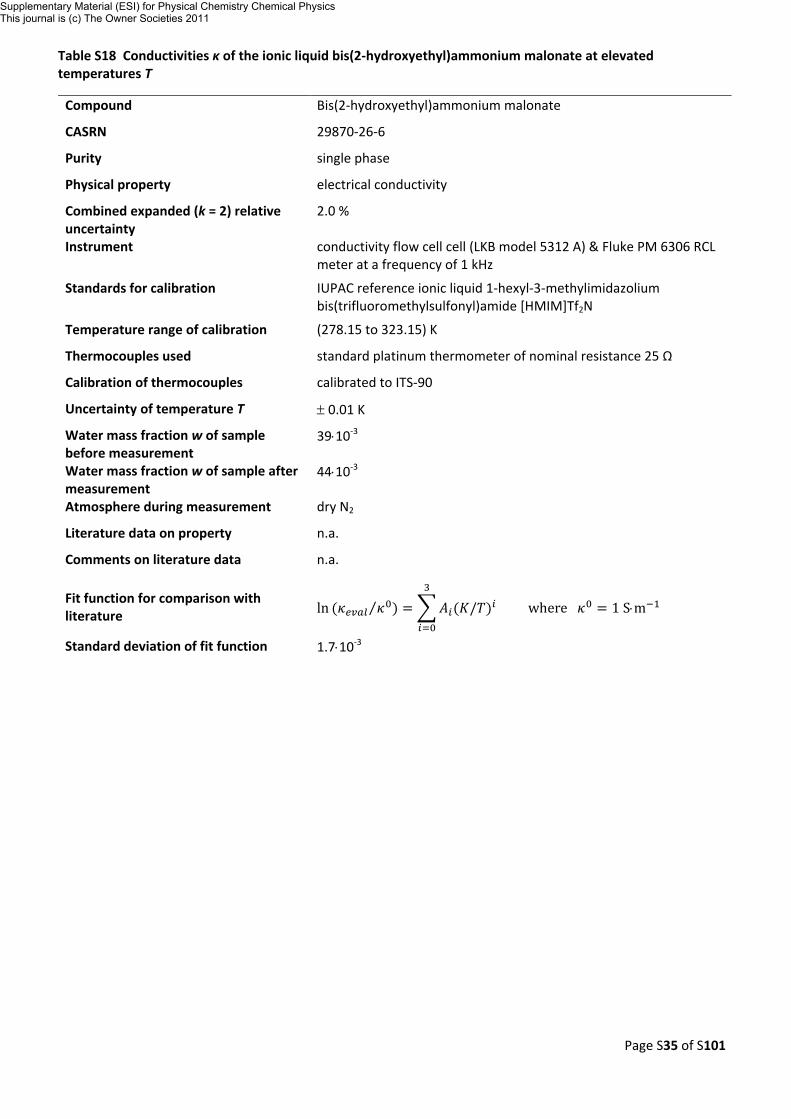
Table S18 Conductivities κ of the ionic liquid bis(2‐hydroxyethyl)ammonium malonate at elevated temperatures T
Compound Bis(2‐hydroxyethyl)ammonium malonate
CASRN 29870‐26‐6
Purity single phase
Physical property electrical conductivity
Combined expanded (k = 2) relative uncertainty
2.0 %
Instrument conductivity flow cell cell (LKB model 5312 A) & Fluke PM 6306 RCL meter at a frequency of 1 kHz
Standards for calibration IUPAC reference ionic liquid 1‐hexyl‐3‐methylimidazolium bis(trifluoromethylsulfonyl)amide [HMIM]Tf2N
Temperature range of calibration (278.15 to 323.15) K
Thermocouples used standard platinum thermometer of nominal resistance 25 Ω
Calibration of thermocouples calibrated to ITS‐90
Uncertainty of temperature T ± 0.01 K
Water mass fraction w of sample before measurement
39⋅10‐3
Water mass fraction w of sample after measurement
44⋅10‐3
Atmosphere during measurement dry N2
Literature data on property n.a.
Comments on literature data n.a.
Fit function for comparison with literature ln ⁄ / where 1 S⋅m
Standard deviation of fit function 1.7⋅10‐3
Supplementary Material (ESI) for Physical Chemistry Chemical PhysicsThis journal is (c) The Owner Societies 2011
Page S36 of S101
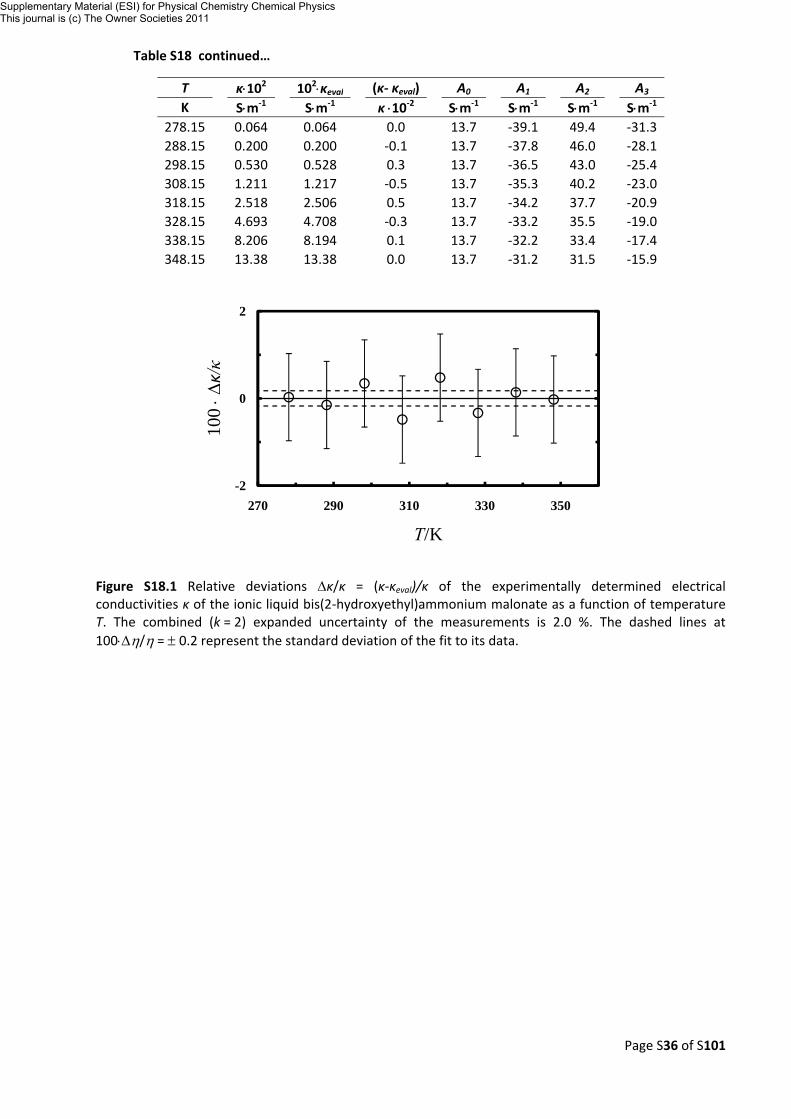
Table S18 continued…
T
κ⋅102 102⋅κeval
(κ‐ κeval) A0 A1 A2 A3
K S⋅m‐1 S⋅m‐1 κ ⋅10‐2 S⋅m‐1 S⋅m‐1 S⋅m‐1 S⋅m‐1 278.15 0.064 0.064
0.0 13.7 ‐39.1 49.4
‐31.3 288.15 0.200 0.200 ‐0.1 13.7 ‐37.8 46.0 ‐28.1 298.15 0.530 0.528 0.3 13.7 ‐36.5 43.0 ‐25.4 308.15 1.211 1.217 ‐0.5 13.7 ‐35.3 40.2 ‐23.0 318.15 2.518 2.506 0.5 13.7 ‐34.2 37.7 ‐20.9 328.15 4.693 4.708 ‐0.3 13.7 ‐33.2 35.5 ‐19.0 338.15 8.206 8.194 0.1 13.7 ‐32.2 33.4 ‐17.4 348.15 13.38 13.38 0.0 13.7 ‐31.2 31.5 ‐15.9
Figure S18.1 Relative deviations Δκ/κ = (κ‐κeval)/κ of the experimentally determined electrical conductivities κ of the ionic liquid bis(2‐hydroxyethyl)ammonium malonate as a function of temperature T. The combined (k = 2) expanded uncertainty of the measurements is 2.0 %. The dashed lines at 100⋅Δη/η = ± 0.2 represent the standard deviation of the fit to its data.
-2
0
2
-2
0
2
270 290 310 330 350
100 ⋅Δ
κ/κ
T/K
Supplementary Material (ESI) for Physical Chemistry Chemical PhysicsThis journal is (c) The Owner Societies 2011
Page S37 of S101
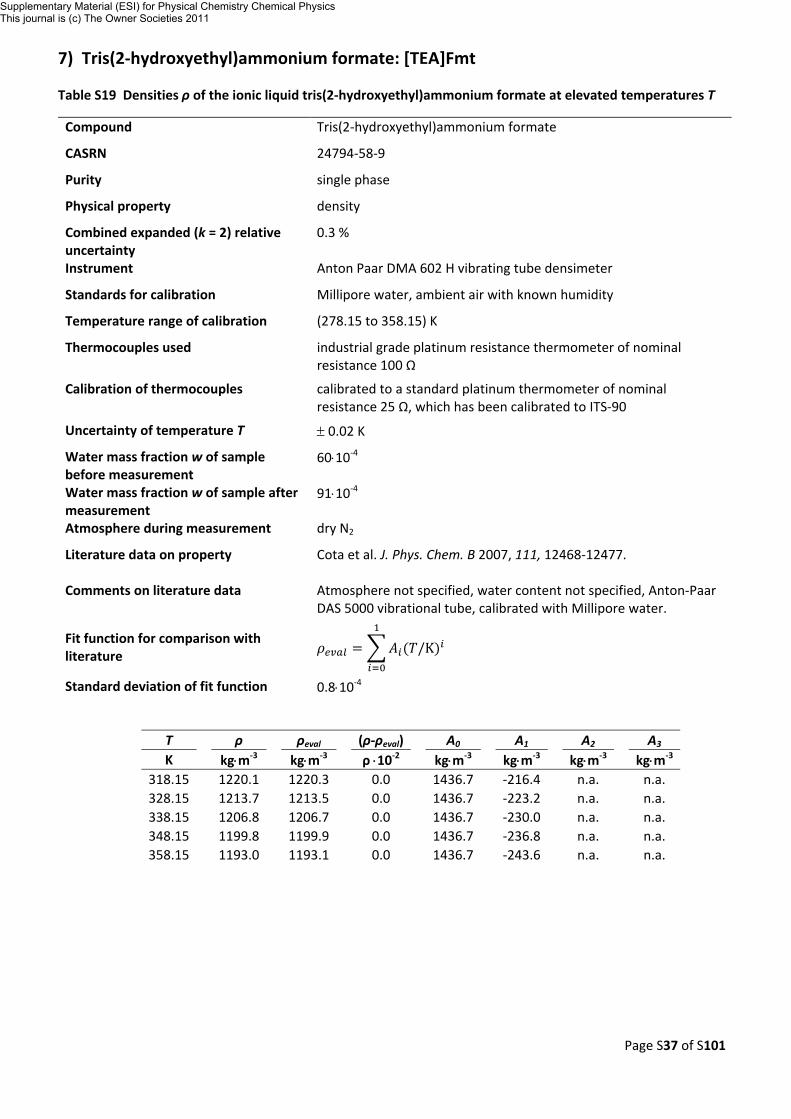
7) Tris(2‐hydroxyethyl)ammonium formate: [TEA]Fmt
Table S19 Densities ρ of the ionic liquid tris(2‐hydroxyethyl)ammonium formate at elevated temperatures T
Compound Tris(2‐hydroxyethyl)ammonium formate
CASRN 24794‐58‐9
Purity single phase
Physical property density
Combined expanded (k = 2) relative uncertainty
0.3 %
Instrument Anton Paar DMA 602 H vibrating tube densimeter
Standards for calibration Millipore water, ambient air with known humidity
Temperature range of calibration (278.15 to 358.15) K
Thermocouples used industrial grade platinum resistance thermometer of nominal resistance 100 Ω
Calibration of thermocouples calibrated to a standard platinum thermometer of nominal resistance 25 Ω, which has been calibrated to ITS‐90
Uncertainty of temperature T ± 0.02 K
Water mass fraction w of sample before measurement
60⋅10‐4
Water mass fraction w of sample after measurement
91⋅10‐4
Atmosphere during measurement dry N2
Literature data on property Cota et al. J. Phys. Chem. B 2007, 111, 12468‐12477.
Comments on literature data Atmosphere not specified, water content not specified, Anton‐Paar DAS 5000 vibrational tube, calibrated with Millipore water.
Fit function for comparison with literature /K
Standard deviation of fit function 0.8⋅10‐4
T
ρ
ρeval (ρ‐ρeval) A0 A1 A2
A3 K kg⋅m‐3 kg⋅m‐3 ρ ⋅10‐2 kg⋅m‐3 kg⋅m‐3 kg⋅m‐3 kg⋅m‐3
318.15 1220.1 1220.3
0.0 1436.7 ‐216.4 n.a.
n.a. 328.15 1213.7 1213.5 0.0 1436.7 ‐223.2 n.a. n.a. 338.15 1206.8 1206.7 0.0 1436.7 ‐230.0 n.a. n.a. 348.15 1199.8 1199.9 0.0 1436.7 ‐236.8 n.a. n.a. 358.15 1193.0 1193.1 0.0 1436.7 ‐243.6 n.a. n.a.
Supplementary Material (ESI) for Physical Chemistry Chemical PhysicsThis journal is (c) The Owner Societies 2011
Page S38 of S101
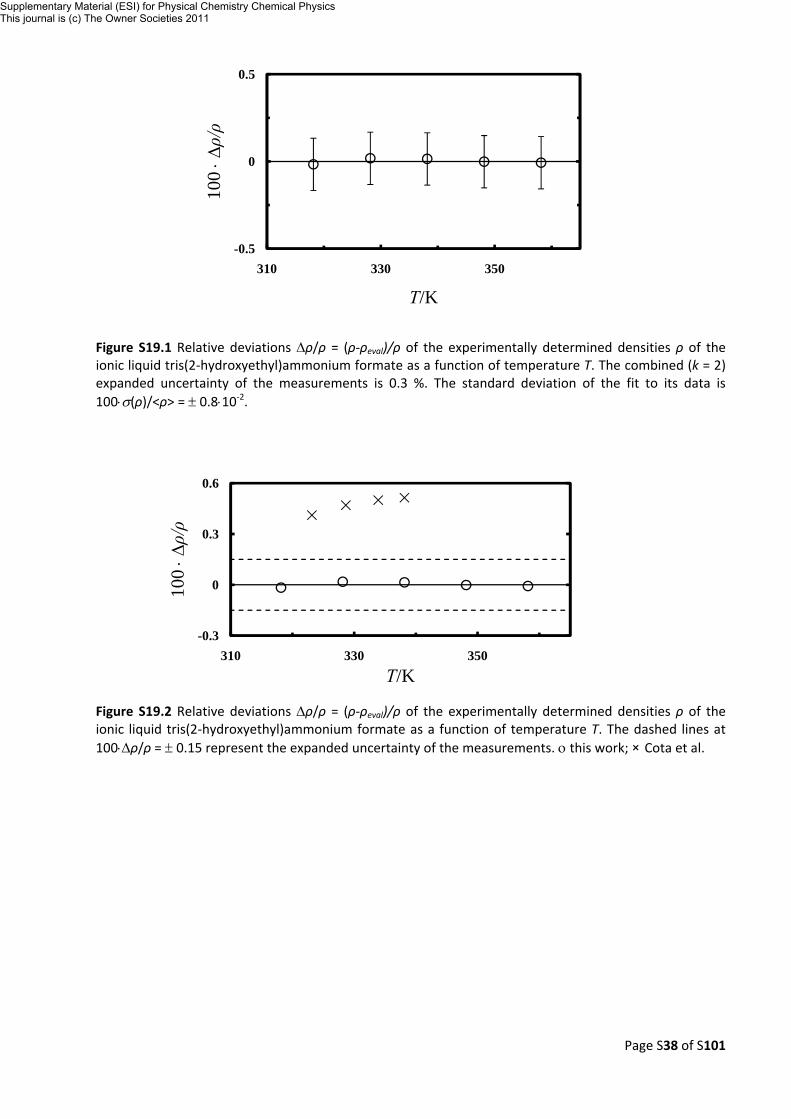
Figure S19.1 Relative deviations Δρ/ρ = (ρ‐ρeval)/ρ of the experimentally determined densities ρ of the ionic liquid tris(2‐hydroxyethyl)ammonium formate as a function of temperature T. The combined (k = 2) expanded uncertainty of the measurements is 0.3 %. The standard deviation of the fit to its data is 100⋅σ(ρ)/<ρ> = ± 0.8⋅10‐2.
Figure S19.2 Relative deviations Δρ/ρ = (ρ‐ρeval)/ρ of the experimentally determined densities ρ of the ionic liquid tris(2‐hydroxyethyl)ammonium formate as a function of temperature T. The dashed lines at 100⋅Δρ/ρ = ± 0.15 represent the expanded uncertainty of the measurements. ο this work; × Cota et al.
-0.02
0
0.02
-0.5
0
0.5
310 330 350
100 ⋅Δρ/ρ
T/K
-0.3
0
0.3
0.6
-0.3
0
0.3
0.6
310 330 350
100 ⋅Δρ/ρ
T/K
Supplementary Material (ESI) for Physical Chemistry Chemical PhysicsThis journal is (c) The Owner Societies 2011
Page S39 of S101
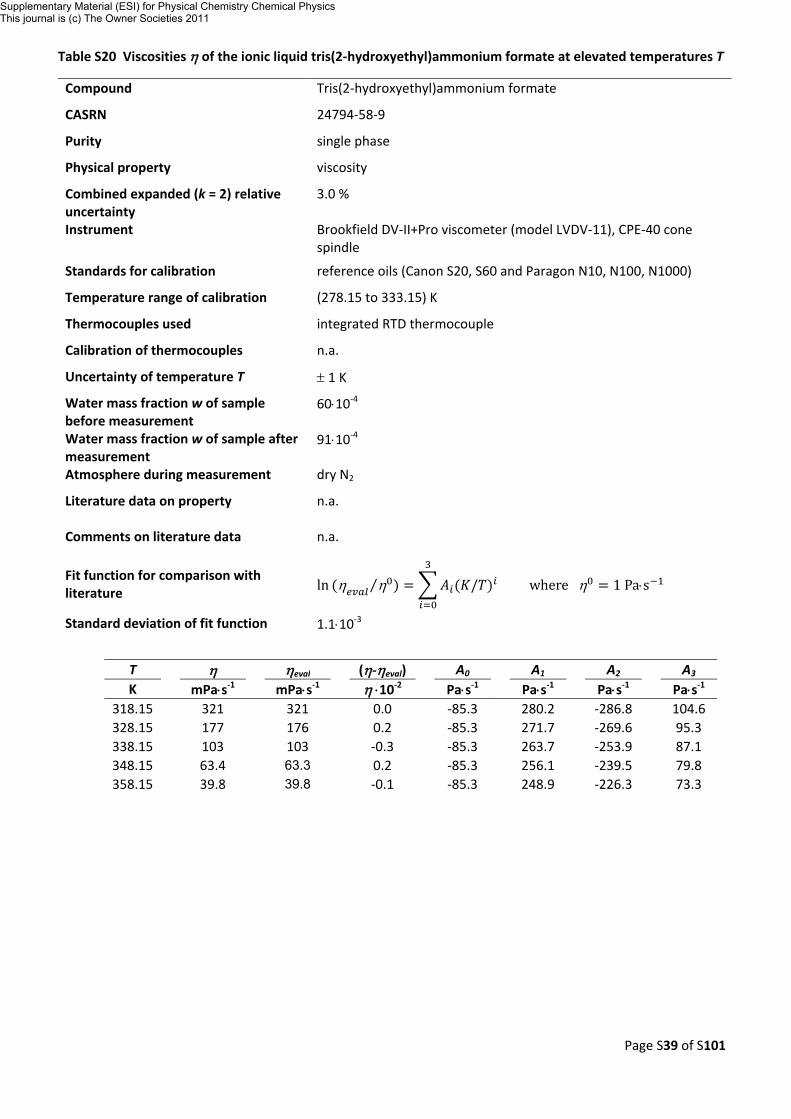
Table S20 Viscosities η of the ionic liquid tris(2‐hydroxyethyl)ammonium formate at elevated temperatures T
Compound Tris(2‐hydroxyethyl)ammonium formate
CASRN 24794‐58‐9
Purity single phase
Physical property viscosity
Combined expanded (k = 2) relative uncertainty
3.0 %
Instrument Brookfield DV‐II+Pro viscometer (model LVDV‐11), CPE‐40 cone spindle
Standards for calibration reference oils (Canon S20, S60 and Paragon N10, N100, N1000)
Temperature range of calibration (278.15 to 333.15) K
Thermocouples used integrated RTD thermocouple
Calibration of thermocouples n.a.
Uncertainty of temperature T ± 1 K
Water mass fraction w of sample before measurement
60⋅10‐4
Water mass fraction w of sample after measurement
91⋅10‐4
Atmosphere during measurement dry N2
Literature data on property n.a.
Comments on literature data n.a.
Fit function for comparison with literature ln η η⁄ / where η 1 Pa⋅s
Standard deviation of fit function 1.1⋅10‐3
T
η
ηeval (η‐ηeval) A0 A1 A2
A3 K mPa⋅s‐1 mPa⋅s‐1 η ⋅10‐2 Pa⋅s‐1 Pa⋅s‐1 Pa⋅s‐1 Pa⋅s‐1
318.15 321 321
0.0 ‐85.3 280.2 ‐286.8
104.6 328.15 177 176 0.2 ‐85.3 271.7 ‐269.6 95.3 338.15 103 103 ‐0.3 ‐85.3 263.7 ‐253.9 87.1 348.15 63.4 63.3 0.2 ‐85.3 256.1 ‐239.5 79.8 358.15 39.8 39.8 ‐0.1 ‐85.3 248.9 ‐226.3 73.3
Supplementary Material (ESI) for Physical Chemistry Chemical PhysicsThis journal is (c) The Owner Societies 2011
Page S40 of S101
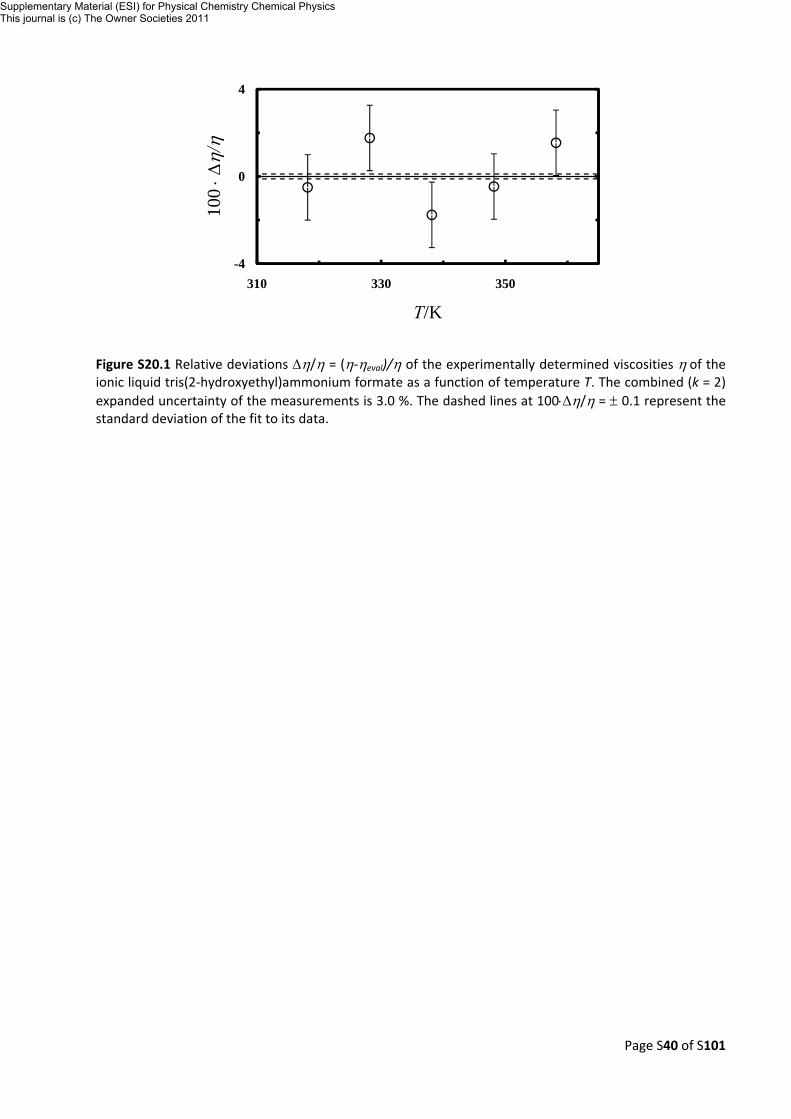
Figure S20.1 Relative deviations Δη/η = (η‐ηeval)/η of the experimentally determined viscosities η of the ionic liquid tris(2‐hydroxyethyl)ammonium formate as a function of temperature T. The combined (k = 2) expanded uncertainty of the measurements is 3.0 %. The dashed lines at 100⋅Δη/η = ± 0.1 represent the standard deviation of the fit to its data.
-4
0
4
-4
0
4
310 330 350
100 ⋅Δ
η/η
T/K
Supplementary Material (ESI) for Physical Chemistry Chemical PhysicsThis journal is (c) The Owner Societies 2011
Page S41 of S101
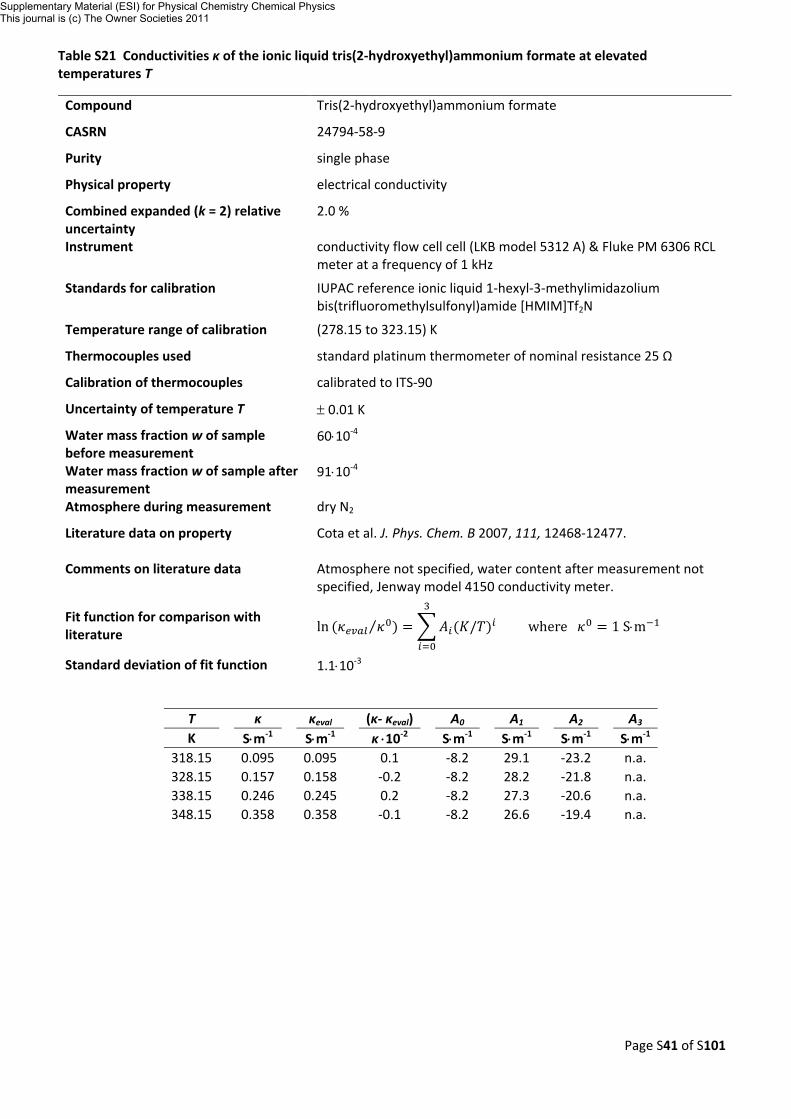
Table S21 Conductivities κ of the ionic liquid tris(2‐hydroxyethyl)ammonium formate at elevated temperatures T
Compound Tris(2‐hydroxyethyl)ammonium formate
CASRN 24794‐58‐9
Purity single phase
Physical property electrical conductivity
Combined expanded (k = 2) relative uncertainty
2.0 %
Instrument conductivity flow cell cell (LKB model 5312 A) & Fluke PM 6306 RCL meter at a frequency of 1 kHz
Standards for calibration IUPAC reference ionic liquid 1‐hexyl‐3‐methylimidazolium bis(trifluoromethylsulfonyl)amide [HMIM]Tf2N
Temperature range of calibration (278.15 to 323.15) K
Thermocouples used standard platinum thermometer of nominal resistance 25 Ω
Calibration of thermocouples calibrated to ITS‐90
Uncertainty of temperature T ± 0.01 K
Water mass fraction w of sample before measurement
60⋅10‐4
Water mass fraction w of sample after measurement
91⋅10‐4
Atmosphere during measurement dry N2
Literature data on property Cota et al. J. Phys. Chem. B 2007, 111, 12468‐12477.
Comments on literature data Atmosphere not specified, water content after measurement not specified, Jenway model 4150 conductivity meter.
Fit function for comparison with literature ln ⁄ / where 1 S⋅m
Standard deviation of fit function 1.1⋅10‐3
T
κ
κeval (κ‐ κeval) A0 A1 A2
A3 K S⋅m‐1 S⋅m‐1 κ ⋅10‐2 S⋅m‐1 S⋅m‐1 S⋅m‐1 S⋅m‐1
318.15 0.095 0.095
0.1 ‐8.2 29.1 ‐23.2
n.a. 328.15 0.157 0.158 ‐0.2 ‐8.2 28.2 ‐21.8 n.a. 338.15 0.246 0.245 0.2 ‐8.2 27.3 ‐20.6 n.a. 348.15 0.358 0.358 ‐0.1 ‐8.2 26.6 ‐19.4 n.a.
Supplementary Material (ESI) for Physical Chemistry Chemical PhysicsThis journal is (c) The Owner Societies 2011
Page S42 of S101
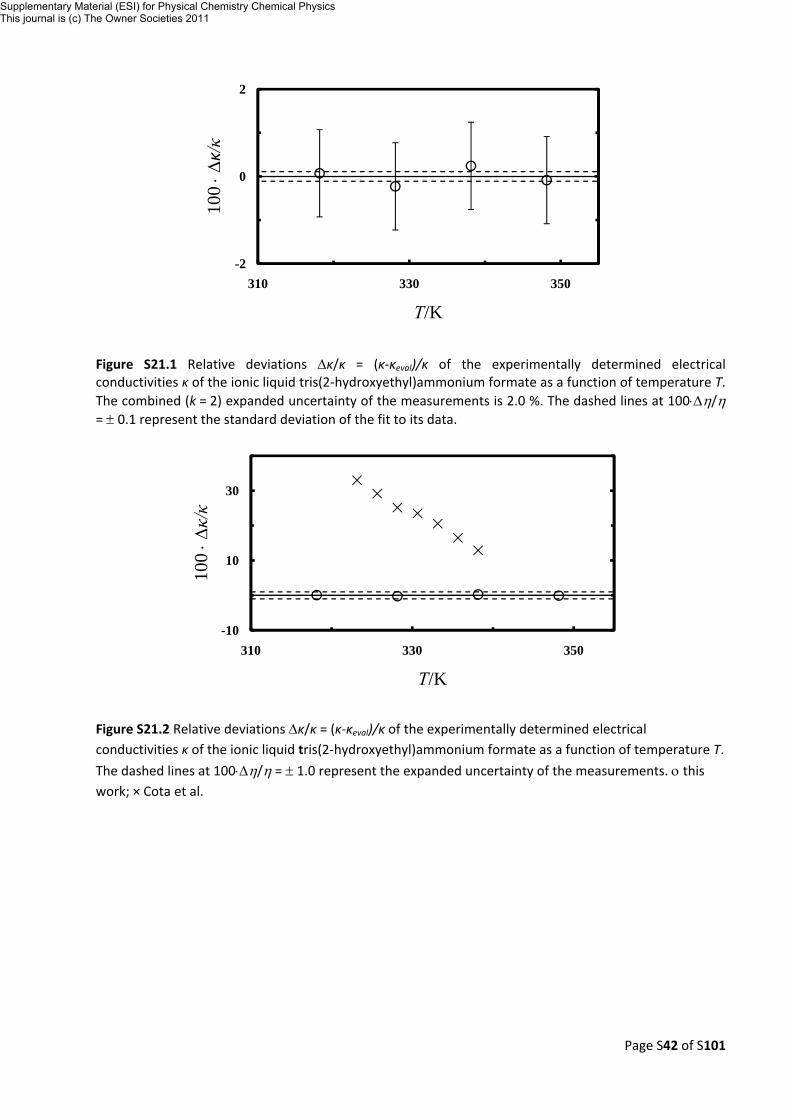
Figure S21.1 Relative deviations Δκ/κ = (κ‐κeval)/κ of the experimentally determined electrical conductivities κ of the ionic liquid tris(2‐hydroxyethyl)ammonium formate as a function of temperature T. The combined (k = 2) expanded uncertainty of the measurements is 2.0 %. The dashed lines at 100⋅Δη/η = ± 0.1 represent the standard deviation of the fit to its data.
Figure S21.2 Relative deviations Δκ/κ = (κ‐κeval)/κ of the experimentally determined electrical conductivities κ of the ionic liquid tris(2‐hydroxyethyl)ammonium formate as a function of temperature T.
The dashed lines at 100⋅Δη/η = ± 1.0 represent the expanded uncertainty of the measurements. ο this work; × Cota et al.
-2
0
2
-2
0
2
310 330 350
100 ⋅Δ
κ/κ
T/K
-10
10
30
-10
10
30
310 330 350
100 ⋅Δκ/κ
T/K
Supplementary Material (ESI) for Physical Chemistry Chemical PhysicsThis journal is (c) The Owner Societies 2011
Page S43 of S101
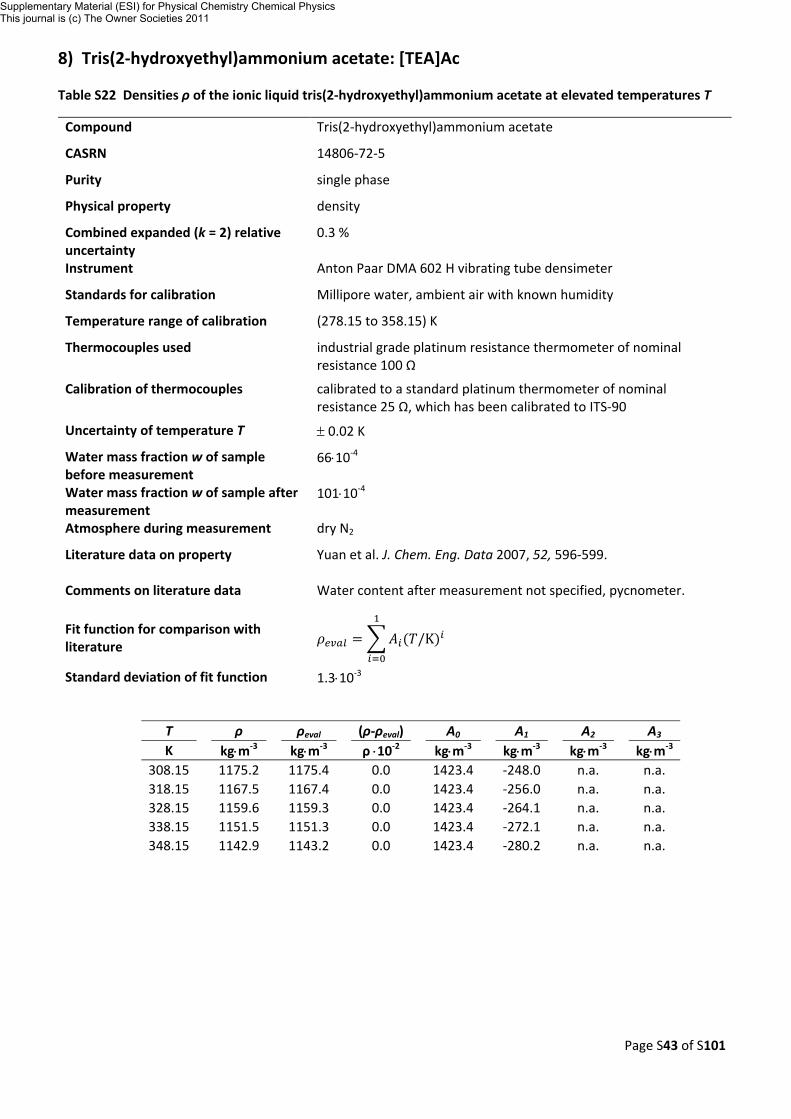
8) Tris(2‐hydroxyethyl)ammonium acetate: [TEA]Ac
Table S22 Densities ρ of the ionic liquid tris(2‐hydroxyethyl)ammonium acetate at elevated temperatures T
Compound Tris(2‐hydroxyethyl)ammonium acetate
CASRN 14806‐72‐5
Purity single phase
Physical property density
Combined expanded (k = 2) relative uncertainty
0.3 %
Instrument Anton Paar DMA 602 H vibrating tube densimeter
Standards for calibration Millipore water, ambient air with known humidity
Temperature range of calibration (278.15 to 358.15) K
Thermocouples used industrial grade platinum resistance thermometer of nominal resistance 100 Ω
Calibration of thermocouples calibrated to a standard platinum thermometer of nominal resistance 25 Ω, which has been calibrated to ITS‐90
Uncertainty of temperature T ± 0.02 K
Water mass fraction w of sample before measurement
66⋅10‐4
Water mass fraction w of sample after measurement
101⋅10‐4
Atmosphere during measurement dry N2
Literature data on property Yuan et al. J. Chem. Eng. Data 2007, 52, 596‐599.
Comments on literature data Water content after measurement not specified, pycnometer.
Fit function for comparison with literature /K
Standard deviation of fit function 1.3⋅10‐3
T
ρ
ρeval (ρ‐ρeval) A0 A1 A2
A3 K kg⋅m‐3 kg⋅m‐3 ρ ⋅10‐2 kg⋅m‐3 kg⋅m‐3 kg⋅m‐3 kg⋅m‐3
308.15 1175.2 1175.4
0.0 1423.4 ‐248.0 n.a.
n.a. 318.15 1167.5 1167.4 0.0 1423.4 ‐256.0 n.a. n.a. 328.15 1159.6 1159.3 0.0 1423.4 ‐264.1 n.a. n.a. 338.15 1151.5 1151.3 0.0 1423.4 ‐272.1 n.a. n.a. 348.15 1142.9 1143.2 0.0 1423.4 ‐280.2 n.a. n.a.
Supplementary Material (ESI) for Physical Chemistry Chemical PhysicsThis journal is (c) The Owner Societies 2011
Page S44 of S101
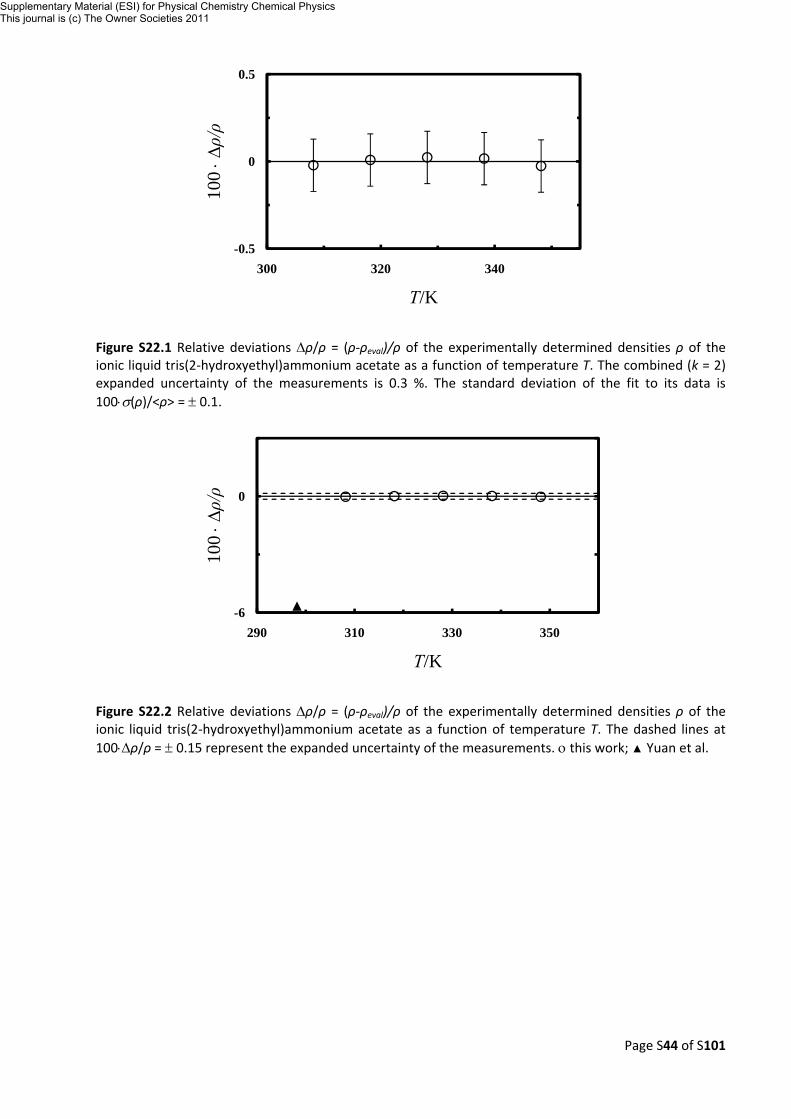
Figure S22.1 Relative deviations Δρ/ρ = (ρ‐ρeval)/ρ of the experimentally determined densities ρ of the ionic liquid tris(2‐hydroxyethyl)ammonium acetate as a function of temperature T. The combined (k = 2) expanded uncertainty of the measurements is 0.3 %. The standard deviation of the fit to its data is 100⋅σ(ρ)/<ρ> = ± 0.1.
Figure S22.2 Relative deviations Δρ/ρ = (ρ‐ρeval)/ρ of the experimentally determined densities ρ of the ionic liquid tris(2‐hydroxyethyl)ammonium acetate as a function of temperature T. The dashed lines at 100⋅Δρ/ρ = ± 0.15 represent the expanded uncertainty of the measurements. ο this work; ▲ Yuan et al.
-0.04
0
0.04
-0.5
0
0.5
300 320 340
100 ⋅Δρ/ρ
T/K
-6
-3
0
3
-6
0
290 310 330 350
100 ⋅Δρ/ρ
T/K
Supplementary Material (ESI) for Physical Chemistry Chemical PhysicsThis journal is (c) The Owner Societies 2011
Page S45 of S101
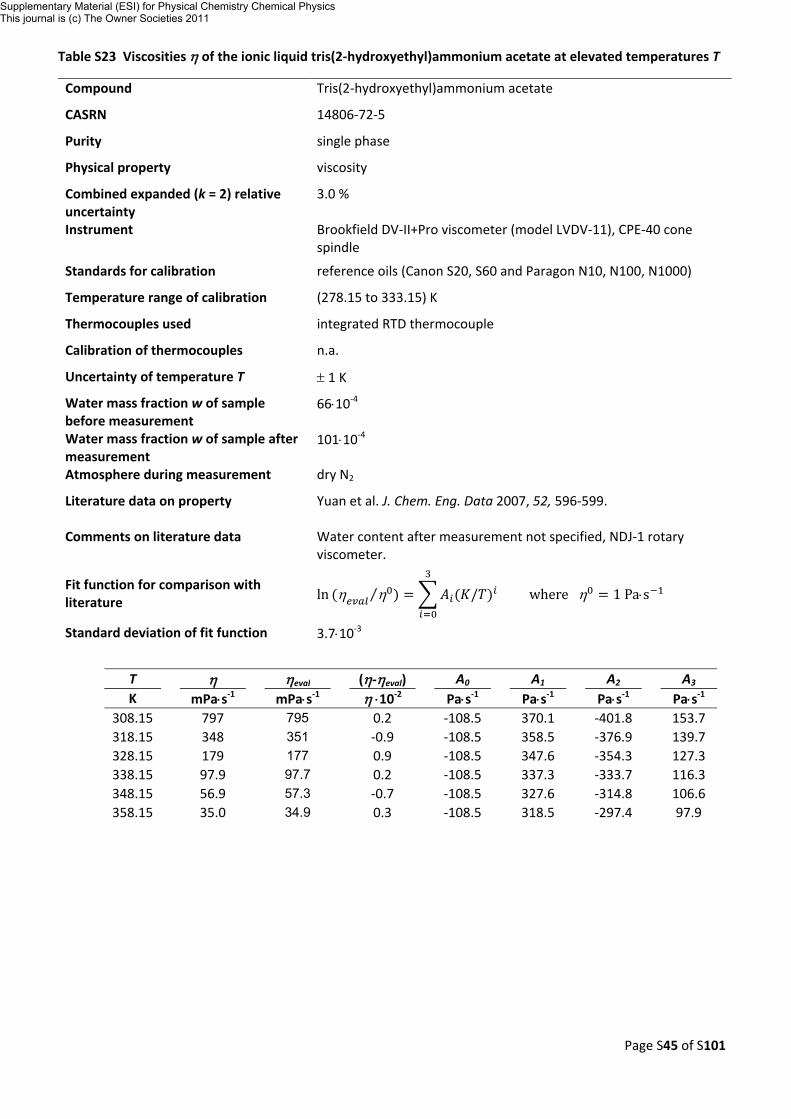
Table S23 Viscosities η of the ionic liquid tris(2‐hydroxyethyl)ammonium acetate at elevated temperatures T
Compound Tris(2‐hydroxyethyl)ammonium acetate
CASRN 14806‐72‐5
Purity single phase
Physical property viscosity
Combined expanded (k = 2) relative uncertainty
3.0 %
Instrument Brookfield DV‐II+Pro viscometer (model LVDV‐11), CPE‐40 cone spindle
Standards for calibration reference oils (Canon S20, S60 and Paragon N10, N100, N1000)
Temperature range of calibration (278.15 to 333.15) K
Thermocouples used integrated RTD thermocouple
Calibration of thermocouples n.a.
Uncertainty of temperature T ± 1 K
Water mass fraction w of sample before measurement
66⋅10‐4
Water mass fraction w of sample after measurement
101⋅10‐4
Atmosphere during measurement dry N2
Literature data on property Yuan et al. J. Chem. Eng. Data 2007, 52, 596‐599.
Comments on literature data Water content after measurement not specified, NDJ‐1 rotary viscometer.
Fit function for comparison with literature ln η η⁄ / where η 1 Pa⋅s
Standard deviation of fit function 3.7⋅10‐3
T
η
ηeval (η‐ηeval) A0 A1 A2
A3 K mPa⋅s‐1 mPa⋅s‐1 η ⋅10‐2 Pa⋅s‐1 Pa⋅s‐1 Pa⋅s‐1 Pa⋅s‐1
308.15 797 795
0.2 ‐108.5 370.1 ‐401.8
153.7 318.15 348 351 ‐0.9 ‐108.5 358.5 ‐376.9 139.7 328.15 179 177 0.9 ‐108.5 347.6 ‐354.3 127.3 338.15 97.9 97.7 0.2 ‐108.5 337.3 ‐333.7 116.3 348.15 56.9 57.3 ‐0.7 ‐108.5 327.6 ‐314.8 106.6 358.15 35.0 34.9 0.3 ‐108.5 318.5 ‐297.4 97.9
Supplementary Material (ESI) for Physical Chemistry Chemical PhysicsThis journal is (c) The Owner Societies 2011
Page S46 of S101
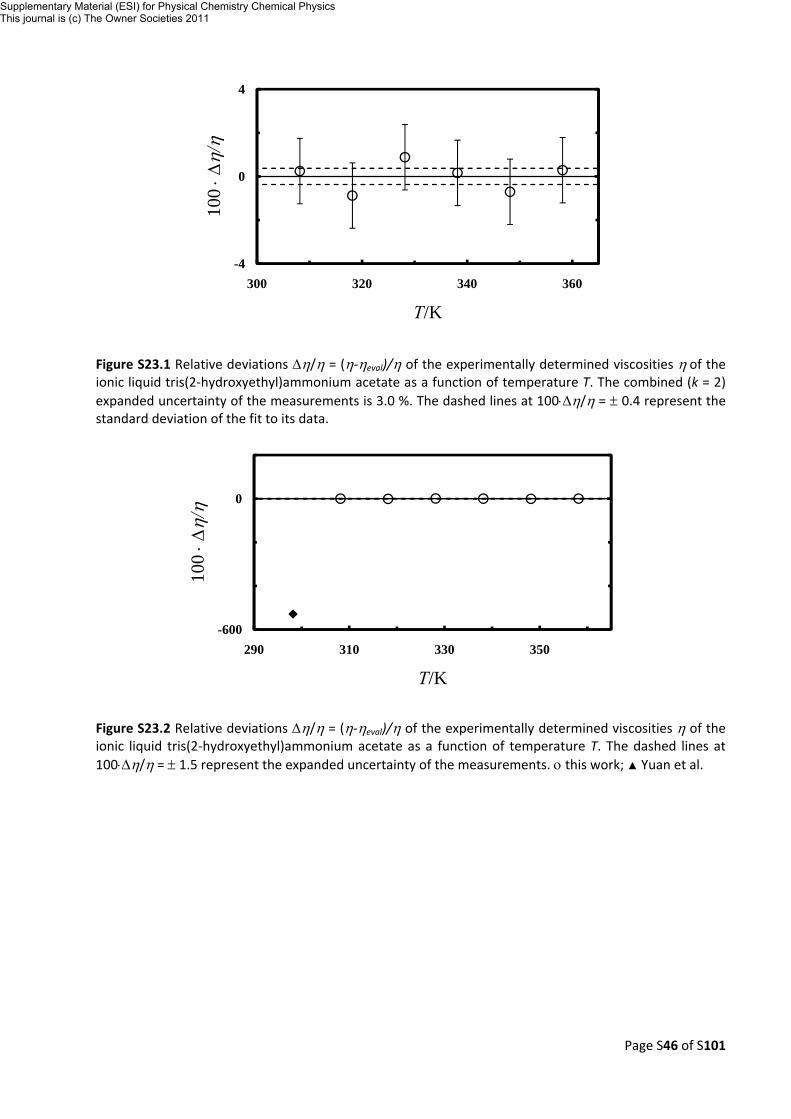
Figure S23.1 Relative deviations Δη/η = (η‐ηeval)/η of the experimentally determined viscosities η of the ionic liquid tris(2‐hydroxyethyl)ammonium acetate as a function of temperature T. The combined (k = 2) expanded uncertainty of the measurements is 3.0 %. The dashed lines at 100⋅Δη/η = ± 0.4 represent the standard deviation of the fit to its data.
Figure S23.2 Relative deviations Δη/η = (η‐ηeval)/η of the experimentally determined viscosities η of the ionic liquid tris(2‐hydroxyethyl)ammonium acetate as a function of temperature T. The dashed lines at 100⋅Δη/η = ± 1.5 represent the expanded uncertainty of the measurements. ο this work; ▲ Yuan et al.
-4
0
4
-4
0
4
300 320 340 360
100 ⋅Δ
η/η
T/K
-600
0
-600
0
290 310 330 350
100 ⋅Δ
η/η
T/K
Supplementary Material (ESI) for Physical Chemistry Chemical PhysicsThis journal is (c) The Owner Societies 2011
Page S47 of S101
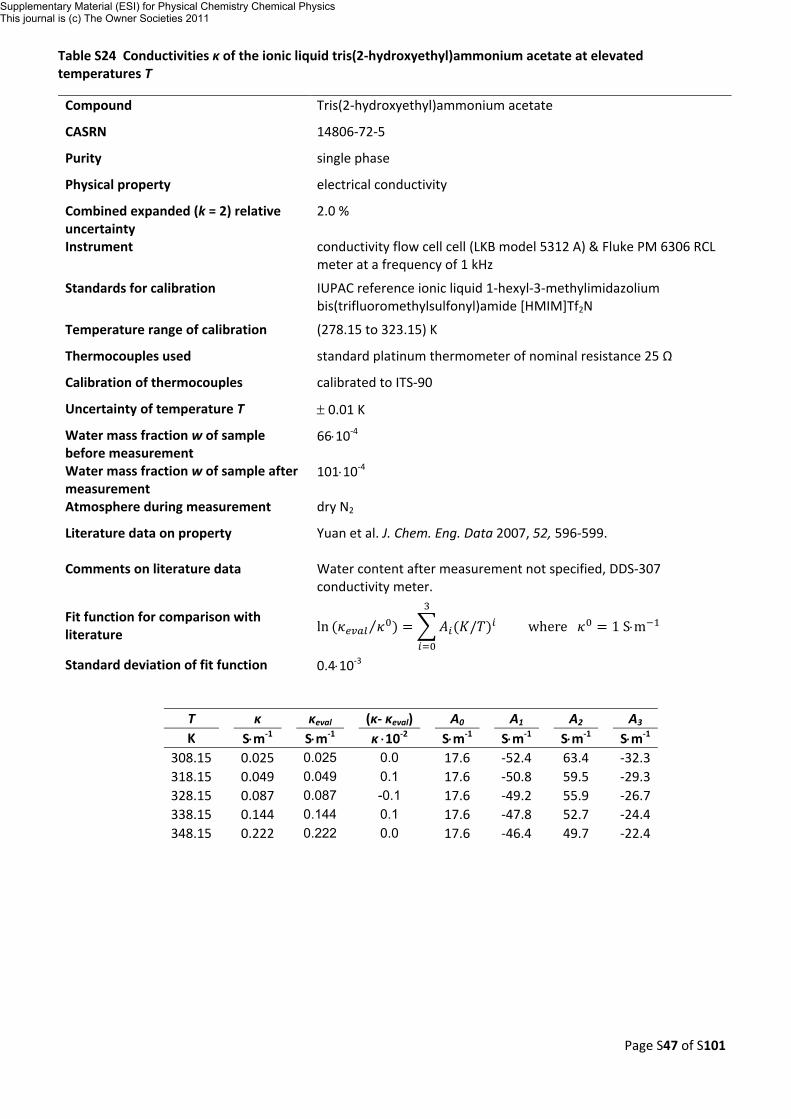
Table S24 Conductivities κ of the ionic liquid tris(2‐hydroxyethyl)ammonium acetate at elevated temperatures T
Compound Tris(2‐hydroxyethyl)ammonium acetate
CASRN 14806‐72‐5
Purity single phase
Physical property electrical conductivity
Combined expanded (k = 2) relative uncertainty
2.0 %
Instrument conductivity flow cell cell (LKB model 5312 A) & Fluke PM 6306 RCL meter at a frequency of 1 kHz
Standards for calibration IUPAC reference ionic liquid 1‐hexyl‐3‐methylimidazolium bis(trifluoromethylsulfonyl)amide [HMIM]Tf2N
Temperature range of calibration (278.15 to 323.15) K
Thermocouples used standard platinum thermometer of nominal resistance 25 Ω
Calibration of thermocouples calibrated to ITS‐90
Uncertainty of temperature T ± 0.01 K
Water mass fraction w of sample before measurement
66⋅10‐4
Water mass fraction w of sample after measurement
101⋅10‐4
Atmosphere during measurement dry N2
Literature data on property Yuan et al. J. Chem. Eng. Data 2007, 52, 596‐599.
Comments on literature data Water content after measurement not specified, DDS‐307 conductivity meter.
Fit function for comparison with literature ln ⁄ / where 1 S⋅m
Standard deviation of fit function 0.4⋅10‐3
T
κ
κeval (κ‐ κeval) A0 A1 A2
A3 K S⋅m‐1 S⋅m‐1 κ ⋅10‐2 S⋅m‐1 S⋅m‐1 S⋅m‐1 S⋅m‐1
308.15 0.025 0.025
0.0 17.6 ‐52.4 63.4
‐32.3 318.15 0.049 0.049 0.1 17.6 ‐50.8 59.5 ‐29.3 328.15 0.087 0.087 -0.1 17.6 ‐49.2 55.9 ‐26.7 338.15 0.144 0.144 0.1 17.6 ‐47.8 52.7 ‐24.4 348.15 0.222 0.222 0.0 17.6 ‐46.4 49.7 ‐22.4
Supplementary Material (ESI) for Physical Chemistry Chemical PhysicsThis journal is (c) The Owner Societies 2011
Page S48 of S101
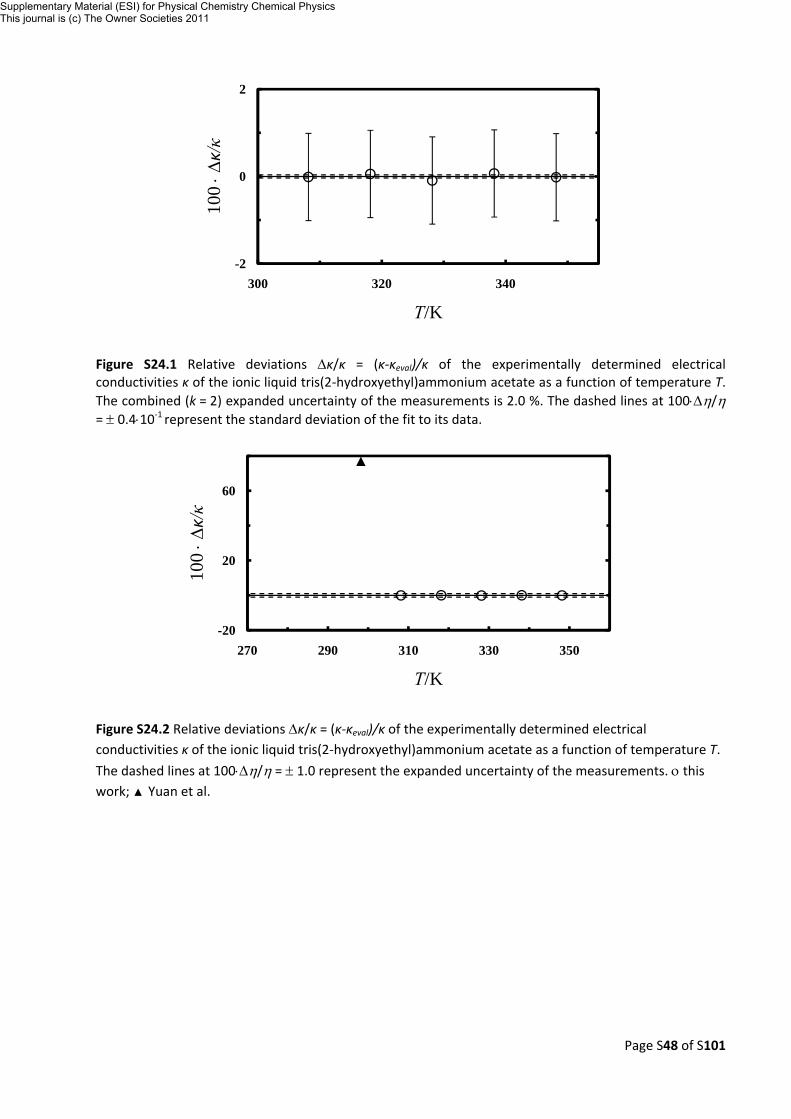
Figure S24.1 Relative deviations Δκ/κ = (κ‐κeval)/κ of the experimentally determined electrical conductivities κ of the ionic liquid tris(2‐hydroxyethyl)ammonium acetate as a function of temperature T. The combined (k = 2) expanded uncertainty of the measurements is 2.0 %. The dashed lines at 100⋅Δη/η = ± 0.4⋅10‐1 represent the standard deviation of the fit to its data.
Figure S24.2 Relative deviations Δκ/κ = (κ‐κeval)/κ of the experimentally determined electrical conductivities κ of the ionic liquid tris(2‐hydroxyethyl)ammonium acetate as a function of temperature T.
The dashed lines at 100⋅Δη/η = ± 1.0 represent the expanded uncertainty of the measurements. ο this work; ▲ Yuan et al.
-2
0
2
-2
0
2
300 320 340
100 ⋅Δ
κ/κ
T/K
‐20
20
60
-20
20
60
270 290 310 330 350
100 ⋅Δ
κ/κ
T/K
Supplementary Material (ESI) for Physical Chemistry Chemical PhysicsThis journal is (c) The Owner Societies 2011
Page S49 of S101
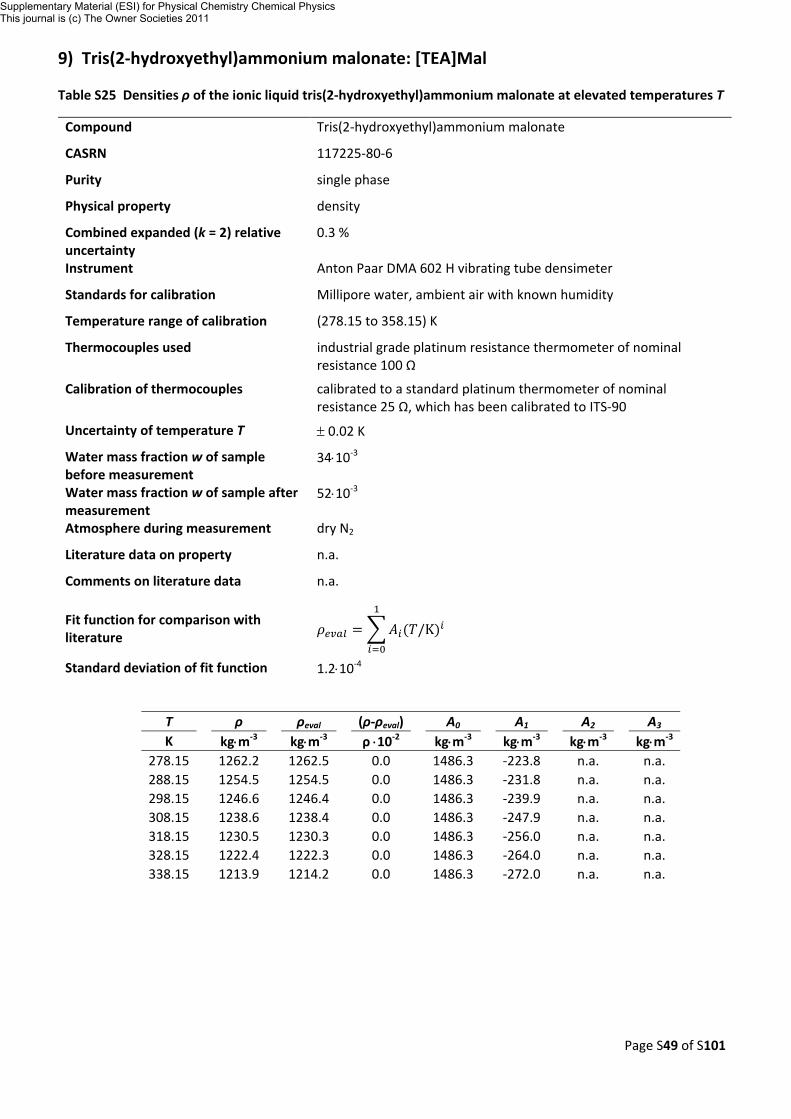
9) Tris(2‐hydroxyethyl)ammonium malonate: [TEA]Mal
Table S25 Densities ρ of the ionic liquid tris(2‐hydroxyethyl)ammonium malonate at elevated temperatures T
Compound Tris(2‐hydroxyethyl)ammonium malonate
CASRN 117225‐80‐6
Purity single phase
Physical property density
Combined expanded (k = 2) relative uncertainty
0.3 %
Instrument Anton Paar DMA 602 H vibrating tube densimeter
Standards for calibration Millipore water, ambient air with known humidity
Temperature range of calibration (278.15 to 358.15) K
Thermocouples used industrial grade platinum resistance thermometer of nominal resistance 100 Ω
Calibration of thermocouples calibrated to a standard platinum thermometer of nominal resistance 25 Ω, which has been calibrated to ITS‐90
Uncertainty of temperature T ± 0.02 K
Water mass fraction w of sample before measurement
34⋅10‐3
Water mass fraction w of sample after measurement
52⋅10‐3
Atmosphere during measurement dry N2
Literature data on property n.a.
Comments on literature data n.a.
Fit function for comparison with literature /K
Standard deviation of fit function 1.2⋅10‐4
T
ρ
ρeval (ρ‐ρeval) A0 A1 A2
A3 K kg⋅m‐3 kg⋅m‐3 ρ ⋅10‐2 kg⋅m‐3 kg⋅m‐3 kg⋅m‐3 kg⋅m‐3
278.15 1262.2 1262.5
0.0 1486.3 ‐223.8 n.a.
n.a. 288.15 1254.5 1254.5 0.0 1486.3 ‐231.8 n.a. n.a. 298.15 1246.6 1246.4 0.0 1486.3 ‐239.9 n.a. n.a. 308.15 1238.6 1238.4 0.0 1486.3 ‐247.9 n.a. n.a. 318.15 1230.5 1230.3 0.0 1486.3 ‐256.0 n.a. n.a. 328.15 1222.4 1222.3 0.0 1486.3 ‐264.0 n.a. n.a. 338.15 1213.9 1214.2 0.0 1486.3 ‐272.0 n.a. n.a.
Supplementary Material (ESI) for Physical Chemistry Chemical PhysicsThis journal is (c) The Owner Societies 2011
Page S50 of S101
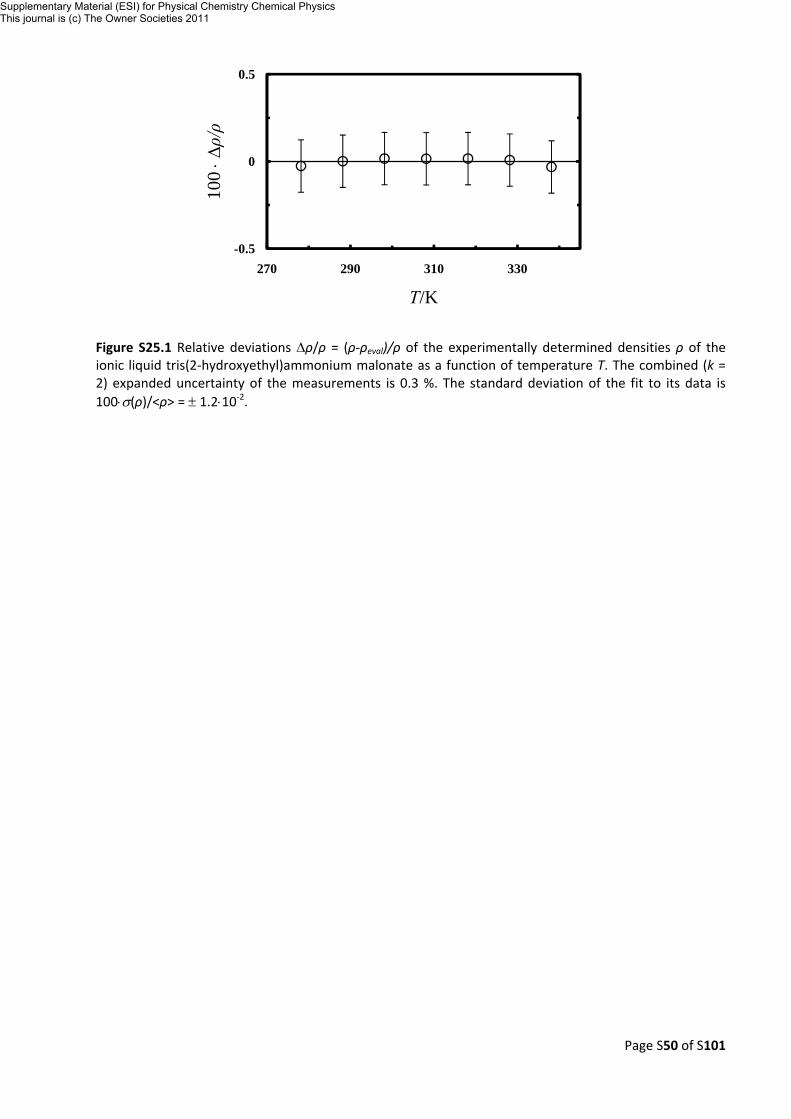
Figure S25.1 Relative deviations Δρ/ρ = (ρ‐ρeval)/ρ of the experimentally determined densities ρ of the ionic liquid tris(2‐hydroxyethyl)ammonium malonate as a function of temperature T. The combined (k = 2) expanded uncertainty of the measurements is 0.3 %. The standard deviation of the fit to its data is 100⋅σ(ρ)/<ρ> = ± 1.2⋅10‐2.
-0.04
0
0.04
-0.5
0
0.5
270 290 310 330
100 ⋅Δρ/ρ
T/K
Supplementary Material (ESI) for Physical Chemistry Chemical PhysicsThis journal is (c) The Owner Societies 2011
Page S51 of S101
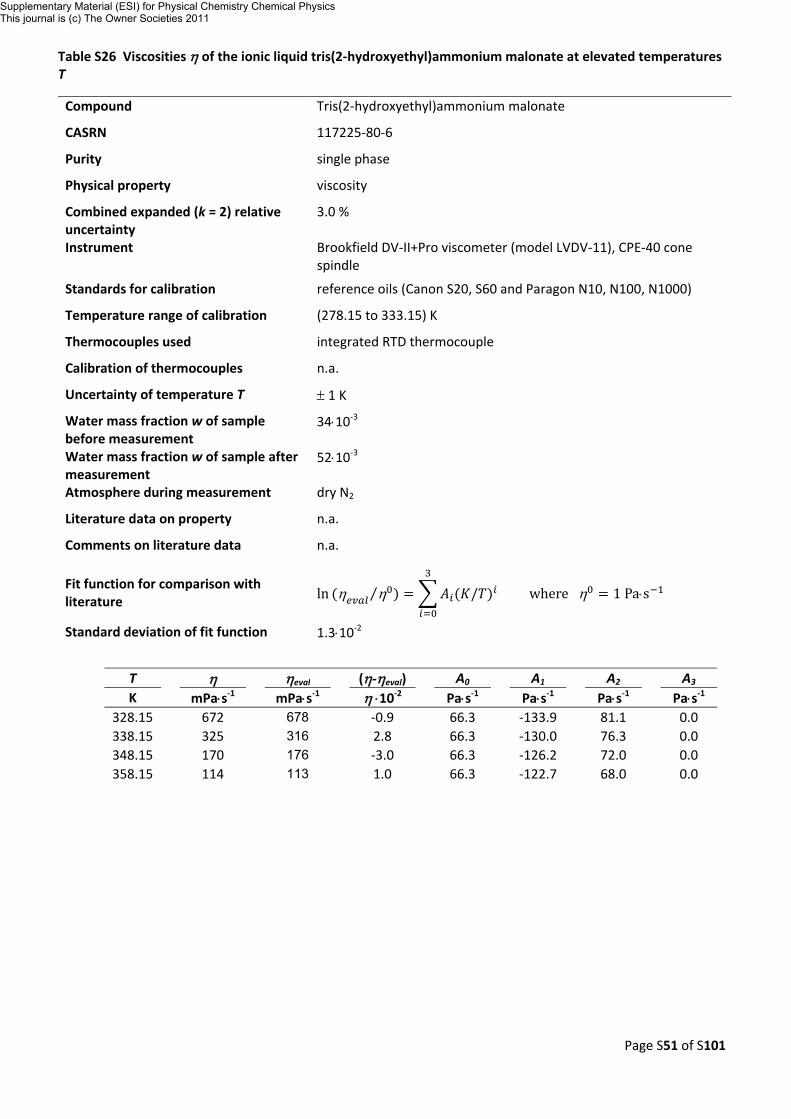
Table S26 Viscosities η of the ionic liquid tris(2‐hydroxyethyl)ammonium malonate at elevated temperatures T
Compound Tris(2‐hydroxyethyl)ammonium malonate
CASRN 117225‐80‐6
Purity single phase
Physical property viscosity
Combined expanded (k = 2) relative uncertainty
3.0 %
Instrument Brookfield DV‐II+Pro viscometer (model LVDV‐11), CPE‐40 cone spindle
Standards for calibration reference oils (Canon S20, S60 and Paragon N10, N100, N1000)
Temperature range of calibration (278.15 to 333.15) K
Thermocouples used integrated RTD thermocouple
Calibration of thermocouples n.a.
Uncertainty of temperature T ± 1 K
Water mass fraction w of sample before measurement
34⋅10‐3
Water mass fraction w of sample after measurement
52⋅10‐3
Atmosphere during measurement dry N2
Literature data on property n.a.
Comments on literature data n.a.
Fit function for comparison with literature ln η η⁄ / where η 1 Pa⋅s
Standard deviation of fit function 1.3⋅10‐2
T
η
ηeval (η‐ηeval) A0 A1 A2
A3 K mPa⋅s‐1 mPa⋅s‐1 η ⋅10‐2 Pa⋅s‐1 Pa⋅s‐1 Pa⋅s‐1 Pa⋅s‐1
328.15 672 678
‐0.9 66.3 ‐133.9 81.1
0.0 338.15 325 316 2.8 66.3 ‐130.0 76.3 0.0 348.15 170 176 ‐3.0 66.3 ‐126.2 72.0 0.0 358.15 114 113 1.0 66.3 ‐122.7 68.0 0.0
Supplementary Material (ESI) for Physical Chemistry Chemical PhysicsThis journal is (c) The Owner Societies 2011
Page S52 of S101
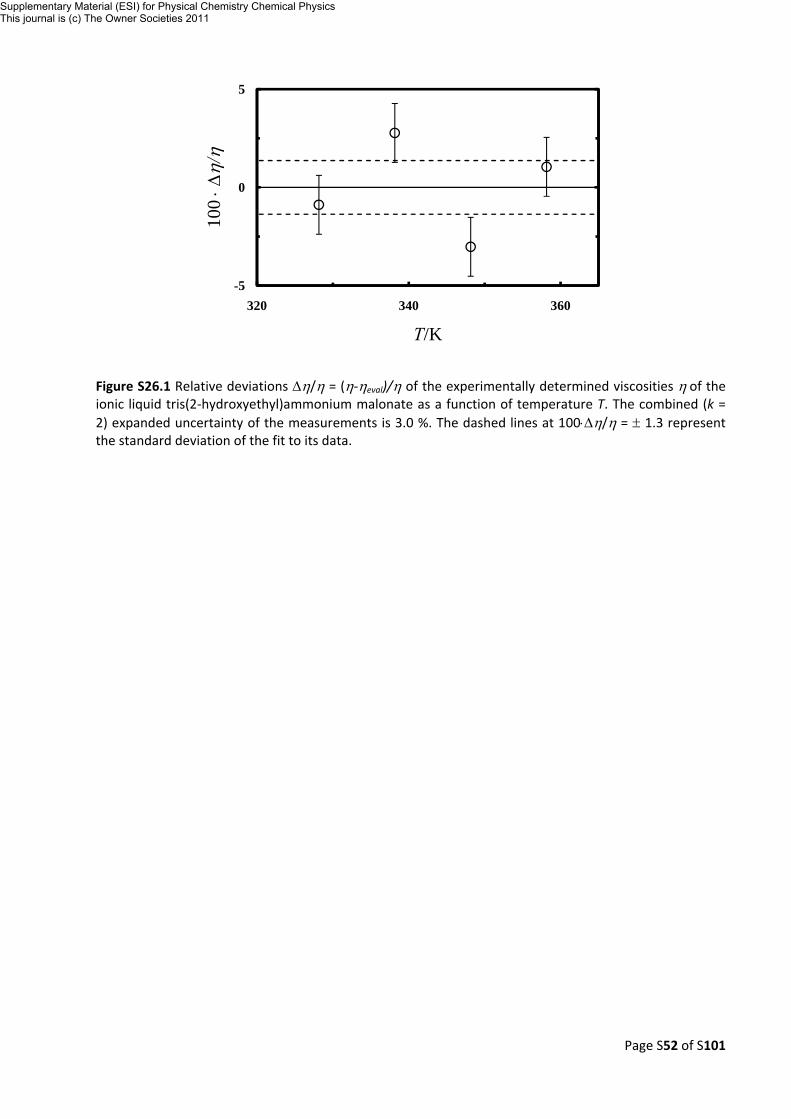
Figure S26.1 Relative deviations Δη/η = (η‐ηeval)/η of the experimentally determined viscosities η of the ionic liquid tris(2‐hydroxyethyl)ammonium malonate as a function of temperature T. The combined (k = 2) expanded uncertainty of the measurements is 3.0 %. The dashed lines at 100⋅Δη/η = ± 1.3 represent the standard deviation of the fit to its data.
-5
0
5
-5
0
5
320 340 360
100 ⋅Δ
η/η
T/K
Supplementary Material (ESI) for Physical Chemistry Chemical PhysicsThis journal is (c) The Owner Societies 2011
Page S53 of S101
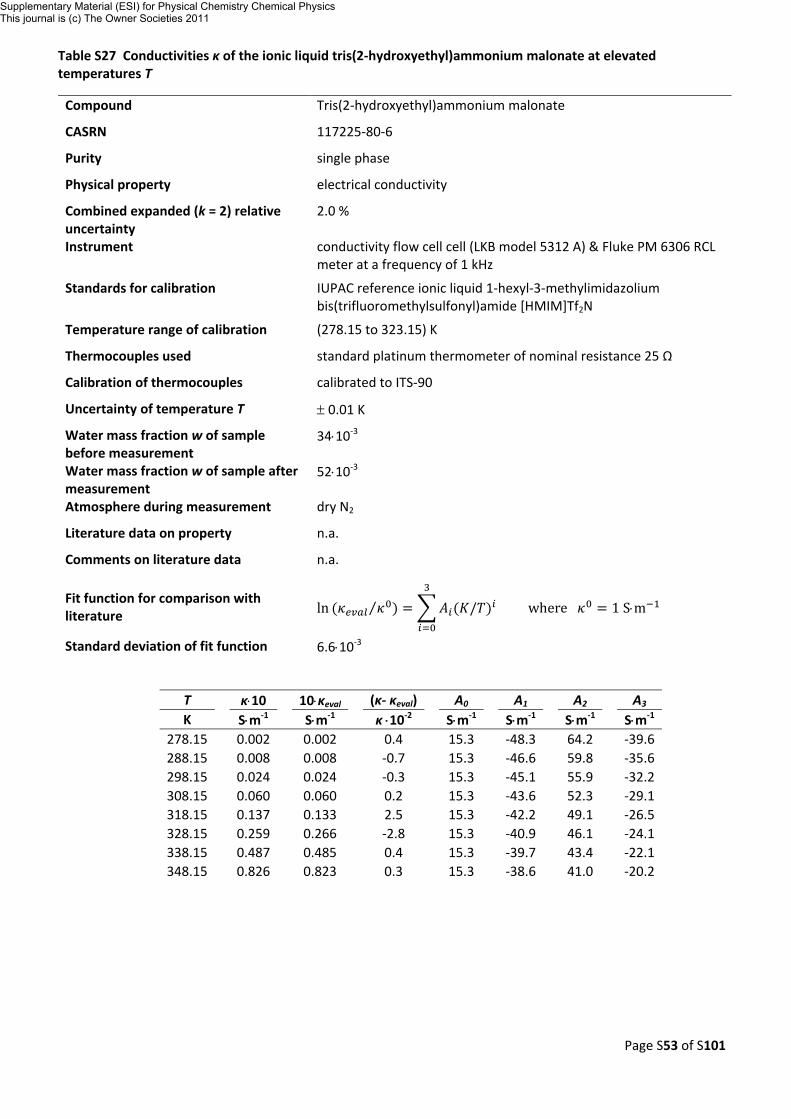
Table S27 Conductivities κ of the ionic liquid tris(2‐hydroxyethyl)ammonium malonate at elevated temperatures T
Compound Tris(2‐hydroxyethyl)ammonium malonate
CASRN 117225‐80‐6
Purity single phase
Physical property electrical conductivity
Combined expanded (k = 2) relative uncertainty
2.0 %
Instrument conductivity flow cell cell (LKB model 5312 A) & Fluke PM 6306 RCL meter at a frequency of 1 kHz
Standards for calibration IUPAC reference ionic liquid 1‐hexyl‐3‐methylimidazolium bis(trifluoromethylsulfonyl)amide [HMIM]Tf2N
Temperature range of calibration (278.15 to 323.15) K
Thermocouples used standard platinum thermometer of nominal resistance 25 Ω
Calibration of thermocouples calibrated to ITS‐90
Uncertainty of temperature T ± 0.01 K
Water mass fraction w of sample before measurement
34⋅10‐3
Water mass fraction w of sample after measurement
52⋅10‐3
Atmosphere during measurement dry N2
Literature data on property n.a.
Comments on literature data n.a.
Fit function for comparison with literature ln ⁄ / where 1 S⋅m
Standard deviation of fit function 6.6⋅10‐3
T
κ⋅10 10⋅κeval
(κ‐ κeval) A0 A1 A2 A3
K S⋅m‐1 S⋅m‐1 κ ⋅10‐2 S⋅m‐1 S⋅m‐1 S⋅m‐1 S⋅m‐1 278.15 0.002 0.002
0.4 15.3 ‐48.3 64.2
‐39.6 288.15 0.008 0.008 ‐0.7 15.3 ‐46.6 59.8 ‐35.6 298.15 0.024 0.024 ‐0.3 15.3 ‐45.1 55.9 ‐32.2 308.15 0.060 0.060 0.2 15.3 ‐43.6 52.3 ‐29.1 318.15 0.137 0.133 2.5 15.3 ‐42.2 49.1 ‐26.5 328.15 0.259 0.266 ‐2.8 15.3 ‐40.9 46.1 ‐24.1 338.15 0.487 0.485 0.4 15.3 ‐39.7 43.4 ‐22.1 348.15 0.826 0.823 0.3 15.3 ‐38.6 41.0 ‐20.2
Supplementary Material (ESI) for Physical Chemistry Chemical PhysicsThis journal is (c) The Owner Societies 2011

Page S54 of S101
Figure S27.1 Relative deviations Δκ/κ = (κ‐κeval)/κ of the experimentally determined electrical conductivities κ of the ionic liquid tris(2‐hydroxyethyl)ammonium malonate as a function of temperature T. The combined (k = 2) expanded uncertainty of the measurements is 2.0 %. The dashed lines at 100⋅Δη/η = ± 0.6 represent the standard deviation of the fit to its data.
-5
0
5
-5
0
5
270 290 310 330 350
100 ⋅Δ
κ/κ
T/K
Supplementary Material (ESI) for Physical Chemistry Chemical PhysicsThis journal is (c) The Owner Societies 2011
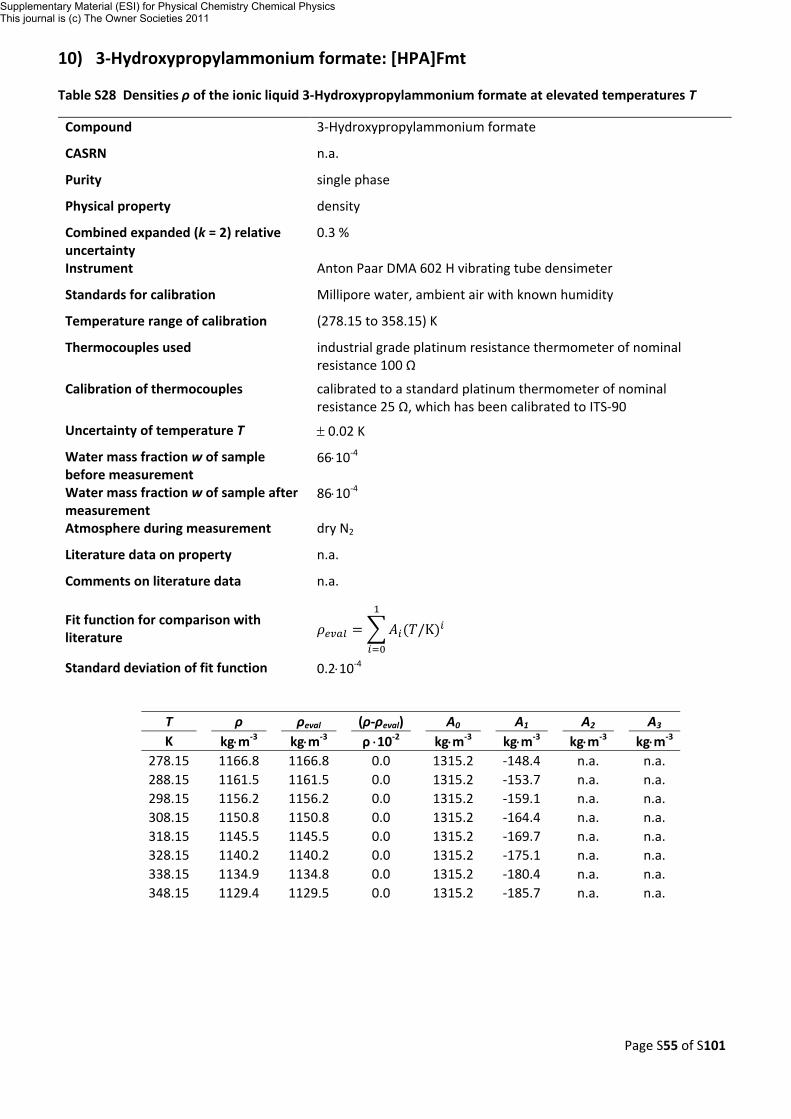
Page S55 of S101
10) 3‐Hydroxypropylammonium formate: [HPA]Fmt
Table S28 Densities ρ of the ionic liquid 3‐Hydroxypropylammonium formate at elevated temperatures T
Compound 3‐Hydroxypropylammonium formate
CASRN n.a.
Purity single phase
Physical property density
Combined expanded (k = 2) relative uncertainty
0.3 %
Instrument Anton Paar DMA 602 H vibrating tube densimeter
Standards for calibration Millipore water, ambient air with known humidity
Temperature range of calibration (278.15 to 358.15) K
Thermocouples used industrial grade platinum resistance thermometer of nominal resistance 100 Ω
Calibration of thermocouples calibrated to a standard platinum thermometer of nominal resistance 25 Ω, which has been calibrated to ITS‐90
Uncertainty of temperature T ± 0.02 K
Water mass fraction w of sample before measurement
66⋅10‐4
Water mass fraction w of sample after measurement
86⋅10‐4
Atmosphere during measurement dry N2
Literature data on property n.a.
Comments on literature data n.a.
Fit function for comparison with literature /K
Standard deviation of fit function 0.2⋅10‐4
T
ρ
ρeval (ρ‐ρeval) A0 A1 A2
A3 K kg⋅m‐3 kg⋅m‐3 ρ ⋅10‐2 kg⋅m‐3 kg⋅m‐3 kg⋅m‐3 kg⋅m‐3
278.15 1166.8 1166.8
0.0 1315.2 ‐148.4 n.a.
n.a. 288.15 1161.5 1161.5 0.0 1315.2 ‐153.7 n.a. n.a. 298.15 1156.2 1156.2 0.0 1315.2 ‐159.1 n.a. n.a. 308.15 1150.8 1150.8 0.0 1315.2 ‐164.4 n.a. n.a. 318.15 1145.5 1145.5 0.0 1315.2 ‐169.7 n.a. n.a. 328.15 1140.2 1140.2 0.0 1315.2 ‐175.1 n.a. n.a. 338.15 1134.9 1134.8 0.0 1315.2 ‐180.4 n.a. n.a. 348.15 1129.4 1129.5 0.0 1315.2 ‐185.7 n.a. n.a.
Supplementary Material (ESI) for Physical Chemistry Chemical PhysicsThis journal is (c) The Owner Societies 2011

Page S56 of S101
Figure S28.1 Relative deviations Δρ/ρ = (ρ‐ρeval)/ρ of the experimentally determined densities ρ of the ionic liquid 3‐hydroxypropylammonium formate as a function of temperature T. The combined (k = 2) expanded uncertainty of the measurements is 0.3 %. The standard deviation of the fit to its data is 100⋅σ(ρ)/<ρ> = ± 0.2⋅10‐2.
-0.04
0
0.04
-0.5
0
0.5
270 290 310 330 350
100 ⋅Δρ/ρ
T/K
Supplementary Material (ESI) for Physical Chemistry Chemical PhysicsThis journal is (c) The Owner Societies 2011
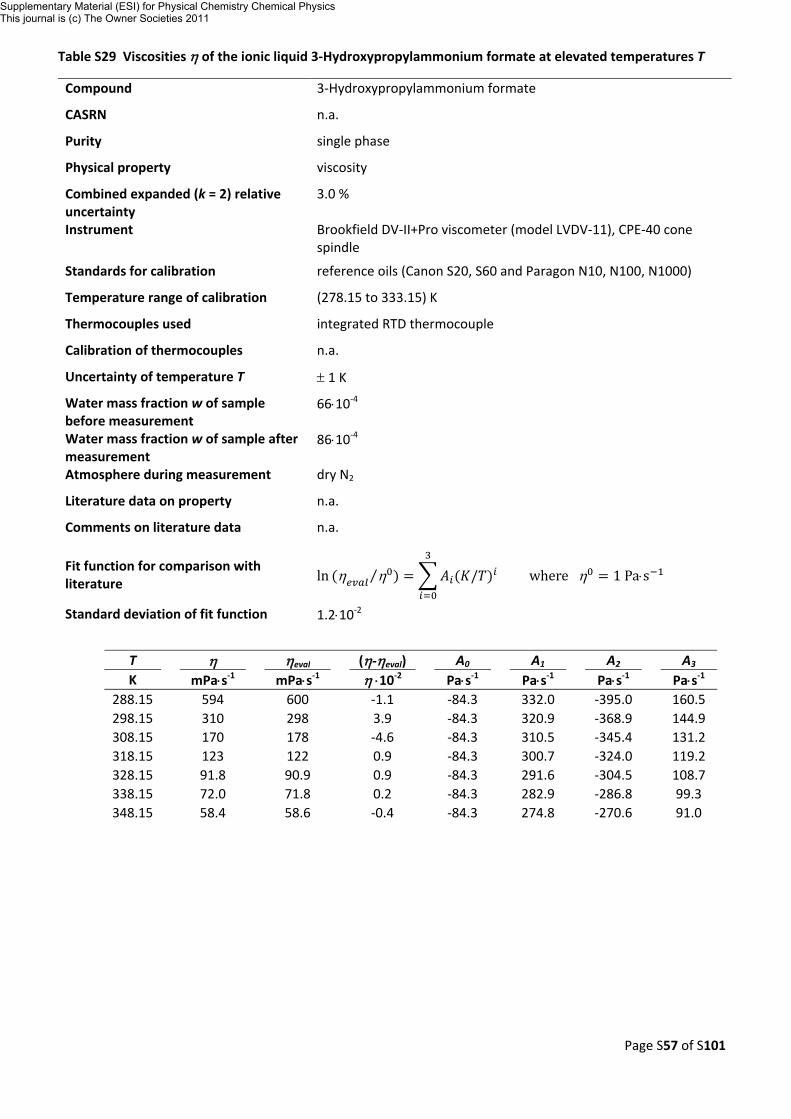
Page S57 of S101
Table S29 Viscosities η of the ionic liquid 3‐Hydroxypropylammonium formate at elevated temperatures T
Compound 3‐Hydroxypropylammonium formate
CASRN n.a.
Purity single phase
Physical property viscosity
Combined expanded (k = 2) relative uncertainty
3.0 %
Instrument Brookfield DV‐II+Pro viscometer (model LVDV‐11), CPE‐40 cone spindle
Standards for calibration reference oils (Canon S20, S60 and Paragon N10, N100, N1000)
Temperature range of calibration (278.15 to 333.15) K
Thermocouples used integrated RTD thermocouple
Calibration of thermocouples n.a.
Uncertainty of temperature T ± 1 K
Water mass fraction w of sample before measurement
66⋅10‐4
Water mass fraction w of sample after measurement
86⋅10‐4
Atmosphere during measurement dry N2
Literature data on property n.a.
Comments on literature data n.a.
Fit function for comparison with literature ln η η⁄ / where η 1 Pa⋅s
Standard deviation of fit function 1.2⋅10‐2
T
η
ηeval (η‐ηeval) A0 A1 A2
A3 K mPa⋅s‐1 mPa⋅s‐1 η ⋅10‐2 Pa⋅s‐1 Pa⋅s‐1 Pa⋅s‐1 Pa⋅s‐1
288.15 594 600
‐1.1 ‐84.3 332.0 ‐395.0
160.5 298.15 310 298 3.9 ‐84.3 320.9 ‐368.9 144.9 308.15 170 178 ‐4.6 ‐84.3 310.5 ‐345.4 131.2 318.15 123 122 0.9 ‐84.3 300.7 ‐324.0 119.2 328.15 91.8 90.9 0.9 ‐84.3 291.6 ‐304.5 108.7 338.15 72.0 71.8 0.2 ‐84.3 282.9 ‐286.8 99.3 348.15 58.4 58.6 ‐0.4 ‐84.3 274.8 ‐270.6 91.0
Supplementary Material (ESI) for Physical Chemistry Chemical PhysicsThis journal is (c) The Owner Societies 2011
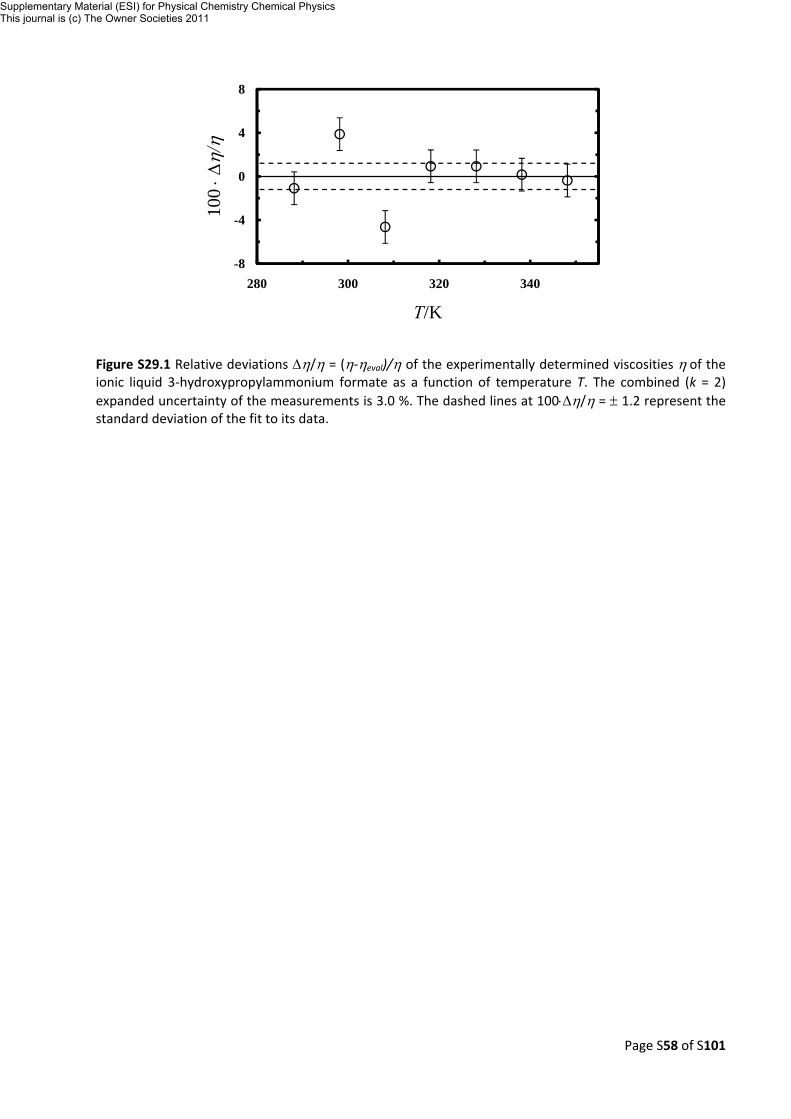
Page S58 of S101
Figure S29.1 Relative deviations Δη/η = (η‐ηeval)/η of the experimentally determined viscosities η of the ionic liquid 3‐hydroxypropylammonium formate as a function of temperature T. The combined (k = 2) expanded uncertainty of the measurements is 3.0 %. The dashed lines at 100⋅Δη/η = ± 1.2 represent the standard deviation of the fit to its data.
-8
-4
0
4
8
-8
-4
0
4
8
280 300 320 340
100 ⋅Δ
η/η
T/K
Supplementary Material (ESI) for Physical Chemistry Chemical PhysicsThis journal is (c) The Owner Societies 2011
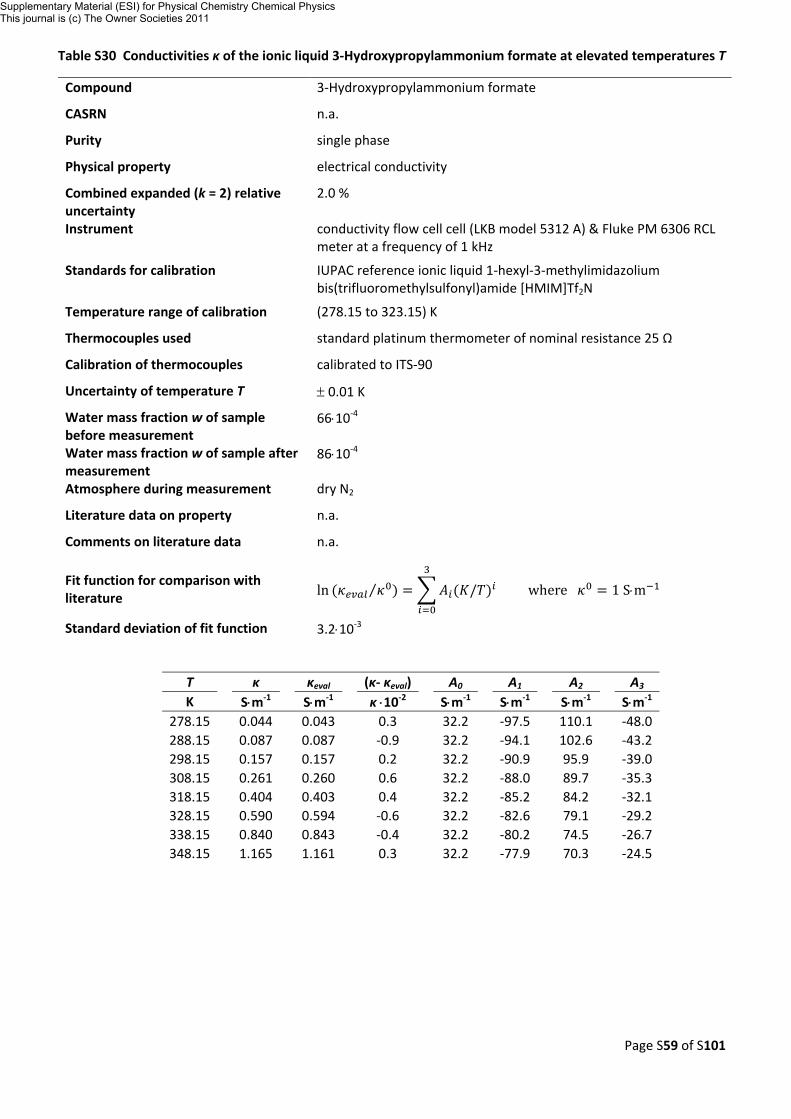
Page S59 of S101
Table S30 Conductivities κ of the ionic liquid 3‐Hydroxypropylammonium formate at elevated temperatures T
Compound 3‐Hydroxypropylammonium formate
CASRN n.a.
Purity single phase
Physical property electrical conductivity
Combined expanded (k = 2) relative uncertainty
2.0 %
Instrument conductivity flow cell cell (LKB model 5312 A) & Fluke PM 6306 RCL meter at a frequency of 1 kHz
Standards for calibration IUPAC reference ionic liquid 1‐hexyl‐3‐methylimidazolium bis(trifluoromethylsulfonyl)amide [HMIM]Tf2N
Temperature range of calibration (278.15 to 323.15) K
Thermocouples used standard platinum thermometer of nominal resistance 25 Ω
Calibration of thermocouples calibrated to ITS‐90
Uncertainty of temperature T ± 0.01 K
Water mass fraction w of sample before measurement
66⋅10‐4
Water mass fraction w of sample after measurement
86⋅10‐4
Atmosphere during measurement dry N2
Literature data on property n.a.
Comments on literature data n.a.
Fit function for comparison with literature ln ⁄ / where 1 S⋅m
Standard deviation of fit function 3.2⋅10‐3
T
κ
κeval (κ‐ κeval) A0 A1 A2
A3 K S⋅m‐1 S⋅m‐1 κ ⋅10‐2 S⋅m‐1 S⋅m‐1 S⋅m‐1 S⋅m‐1
278.15 0.044 0.043
0.3 32.2 ‐97.5 110.1
‐48.0 288.15 0.087 0.087 ‐0.9 32.2 ‐94.1 102.6 ‐43.2 298.15 0.157 0.157 0.2 32.2 ‐90.9 95.9 ‐39.0 308.15 0.261 0.260 0.6 32.2 ‐88.0 89.7 ‐35.3 318.15 0.404 0.403 0.4 32.2 ‐85.2 84.2 ‐32.1 328.15 0.590 0.594 ‐0.6 32.2 ‐82.6 79.1 ‐29.2 338.15 0.840 0.843 ‐0.4 32.2 ‐80.2 74.5 ‐26.7 348.15 1.165 1.161 0.3 32.2 ‐77.9 70.3 ‐24.5
Supplementary Material (ESI) for Physical Chemistry Chemical PhysicsThis journal is (c) The Owner Societies 2011

Page S60 of S101
Figure S30.1 Relative deviations Δκ/κ = (κ‐κeval)/κ of the experimentally determined electrical conductivities κ of the ionic liquid 3‐hydroxypropylammonium formate as a function of temperature T. The combined (k = 2) expanded uncertainty of the measurements is 2.0 %. The dashed lines at 100⋅Δη/η = ± 0.3 represent the standard deviation of the fit to its data.
-2
0
2
-2
0
2
270 290 310 330 350
100 ⋅Δ
κ/κ
T/K
Supplementary Material (ESI) for Physical Chemistry Chemical PhysicsThis journal is (c) The Owner Societies 2011

Page S61 of S101
11) 3‐Hydroxypropylammonium acetate: [HPA]Ac
Table S31 Densities ρ of the ionic liquid 3‐Hydroxypropylammonium acetate at elevated temperatures T
Compound 3‐Hydroxypropylammonium acetate
CASRN n.a.
Purity single phase
Physical property density
Combined expanded (k = 2) relative uncertainty
0.3 %
Instrument Anton Paar DMA 602 H vibrating tube densimeter
Standards for calibration Millipore water, ambient air with known humidity
Temperature range of calibration (278.15 to 358.15) K
Thermocouples used industrial grade platinum resistance thermometer of nominal resistance 100 Ω
Calibration of thermocouples calibrated to a standard platinum thermometer of nominal resistance 25 Ω, which has been calibrated to ITS‐90
Uncertainty of temperature T ± 0.02 K
Water mass fraction w of sample before measurement
72⋅10‐4
Water mass fraction w of sample after measurement
98⋅10‐4
Atmosphere during measurement dry N2
Literature data on property n.a.
Comments on literature data n.a.
Fit function for comparison with literature /K
Standard deviation of fit function 0.3⋅10‐4
T
ρ
ρeval (ρ‐ρeval) A0 A1 A2
A3 K kg⋅m‐3 kg⋅m‐3 ρ ⋅10‐2 kg⋅m‐3 kg⋅m‐3 kg⋅m‐3 kg⋅m‐3
278.15 1127.6 1127.6
0.0 1275.4 ‐147.8 n.a.
n.a. 288.15 1122.3 1122.3 0.0 1275.4 ‐153.1 n.a. n.a. 298.15 1117.0 1117.0 0.0 1275.4 ‐158.4 n.a. n.a. 308.15 1111.7 1111.7 0.0 1275.4 ‐163.7 n.a. n.a. 318.15 1106.5 1106.4 0.0 1275.4 ‐169.0 n.a. n.a. 328.15 1101.2 1101.1 0.0 1275.4 ‐174.3 n.a. n.a. 338.15 1095.8 1095.8 0.0 1275.4 ‐179.7 n.a. n.a. 348.15 1090.3 1090.5 0.0 1275.4 ‐185.0 n.a. n.a.
Supplementary Material (ESI) for Physical Chemistry Chemical PhysicsThis journal is (c) The Owner Societies 2011

Page S62 of S101
Figure S31.1 Relative deviations Δρ/ρ = (ρ‐ρeval)/ρ of the experimentally determined densities ρ of the ionic liquid 3‐hydroxypropylammonium acetate as a function of temperature T. The combined (k = 2) expanded uncertainty of the measurements is 0.3 %. The standard deviation of the fit to its data is 100⋅σ(ρ)/<ρ> = ± 0.3⋅10‐2.
-0.04
0
0.04
-0.5
0
0.5
270 290 310 330 350
100 ⋅Δρ/ρ
T/K
Supplementary Material (ESI) for Physical Chemistry Chemical PhysicsThis journal is (c) The Owner Societies 2011
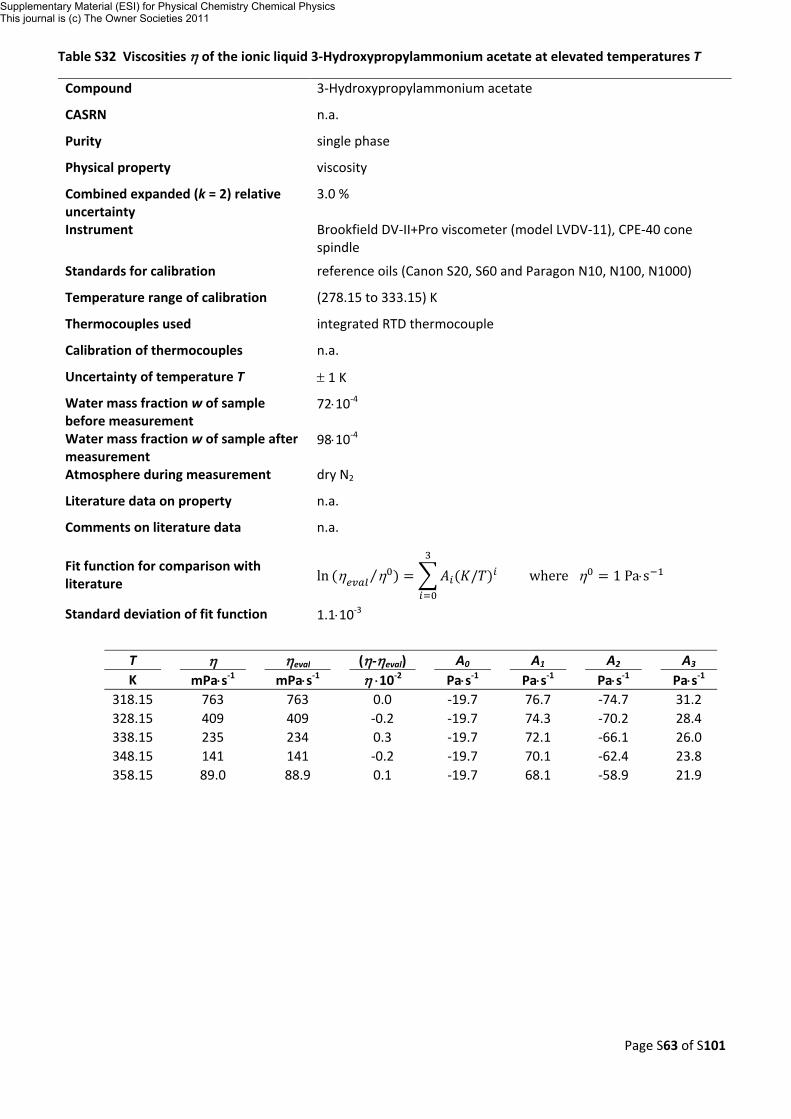
Page S63 of S101
Table S32 Viscosities η of the ionic liquid 3‐Hydroxypropylammonium acetate at elevated temperatures T
Compound 3‐Hydroxypropylammonium acetate
CASRN n.a.
Purity single phase
Physical property viscosity
Combined expanded (k = 2) relative uncertainty
3.0 %
Instrument Brookfield DV‐II+Pro viscometer (model LVDV‐11), CPE‐40 cone spindle
Standards for calibration reference oils (Canon S20, S60 and Paragon N10, N100, N1000)
Temperature range of calibration (278.15 to 333.15) K
Thermocouples used integrated RTD thermocouple
Calibration of thermocouples n.a.
Uncertainty of temperature T ± 1 K
Water mass fraction w of sample before measurement
72⋅10‐4
Water mass fraction w of sample after measurement
98⋅10‐4
Atmosphere during measurement dry N2
Literature data on property n.a.
Comments on literature data n.a.
Fit function for comparison with literature ln η η⁄ / where η 1 Pa⋅s
Standard deviation of fit function 1.1⋅10‐3
T
η
ηeval (η‐ηeval) A0 A1 A2
A3 K mPa⋅s‐1 mPa⋅s‐1 η ⋅10‐2 Pa⋅s‐1 Pa⋅s‐1 Pa⋅s‐1 Pa⋅s‐1
318.15 763 763
0.0 ‐19.7 76.7 ‐74.7
31.2 328.15 409 409 ‐0.2 ‐19.7 74.3 ‐70.2 28.4 338.15 235 234 0.3 ‐19.7 72.1 ‐66.1 26.0 348.15 141 141 ‐0.2 ‐19.7 70.1 ‐62.4 23.8 358.15 89.0 88.9 0.1 ‐19.7 68.1 ‐58.9 21.9
Supplementary Material (ESI) for Physical Chemistry Chemical PhysicsThis journal is (c) The Owner Societies 2011
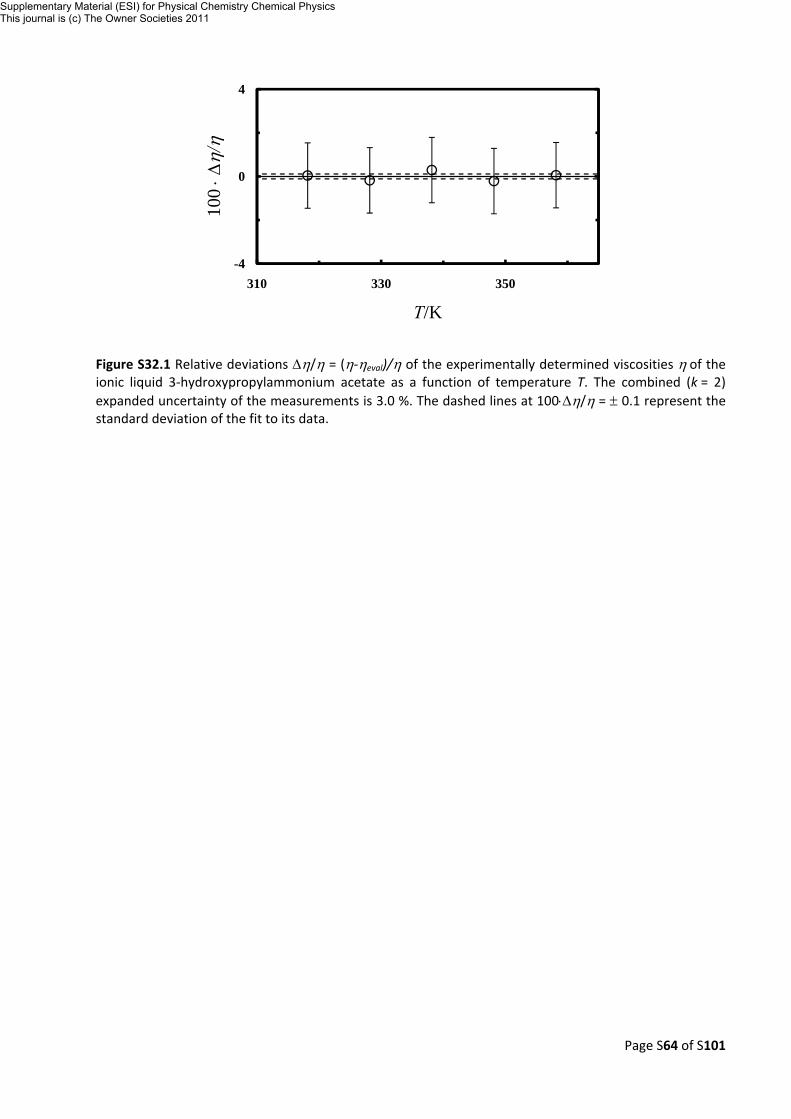
Page S64 of S101
Figure S32.1 Relative deviations Δη/η = (η‐ηeval)/η of the experimentally determined viscosities η of the ionic liquid 3‐hydroxypropylammonium acetate as a function of temperature T. The combined (k = 2) expanded uncertainty of the measurements is 3.0 %. The dashed lines at 100⋅Δη/η = ± 0.1 represent the standard deviation of the fit to its data.
-4
0
4
-4
0
4
310 330 350
100 ⋅Δ
η/η
T/K
Supplementary Material (ESI) for Physical Chemistry Chemical PhysicsThis journal is (c) The Owner Societies 2011

Page S65 of S101
Table S33 Conductivities κ of the ionic liquid 3‐Hydroxypropylammonium acetate at elevated temperatures T
Compound 3‐Hydroxypropylammonium acetate
CASRN n.a.
Purity single phase
Physical property electrical conductivity
Combined expanded (k = 2) relative uncertainty
2.0 %
Instrument conductivity flow cell cell (LKB model 5312 A) & Fluke PM 6306 RCL meter at a frequency of 1 kHz
Standards for calibration IUPAC reference ionic liquid 1‐hexyl‐3‐methylimidazolium bis(trifluoromethylsulfonyl)amide [HMIM]Tf2N
Temperature range of calibration (278.15 to 323.15) K
Thermocouples used standard platinum thermometer of nominal resistance 25 Ω
Calibration of thermocouples calibrated to ITS‐90
Uncertainty of temperature T ± 0.01 K
Water mass fraction w of sample before measurement
72⋅10‐4
Water mass fraction w of sample after measurement
98⋅10‐4
Atmosphere during measurement dry N2
Literature data on property n.a.
Comments on literature data n.a.
Fit function for comparison with literature ln ⁄ / where 1 S⋅m
Standard deviation of fit function 0.3⋅10‐3
T
κ
κeval (κ‐ κeval) A0 A1 A2
A3 K S⋅m‐1 S⋅m‐1 κ ⋅10‐2 S⋅m‐1 S⋅m‐1 S⋅m‐1 S⋅m‐1
278.15 0.002 0.002
0.0 12.0 ‐27.6 29.4
‐20.0 288.15 0.005 0.005 ‐0.1 12.0 ‐26.7 27.4 ‐18.0 298.15 0.012 0.012 0.0 12.0 ‐25.8 25.6 ‐16.2 308.15 0.025 0.025 0.0 12.0 ‐24.9 24.0 ‐14.7 318.15 0.048 0.048 0.1 12.0 ‐24.1 22.5 ‐13.3 328.15 0.085 0.085 0.0 12.0 ‐23.4 21.1 ‐12.2 338.15 0.141 0.141 ‐0.1 12.0 ‐22.7 19.9 ‐11.1 348.15 0.222 0.222 0.0 12.0 ‐22.1 18.8 ‐10.2
Supplementary Material (ESI) for Physical Chemistry Chemical PhysicsThis journal is (c) The Owner Societies 2011
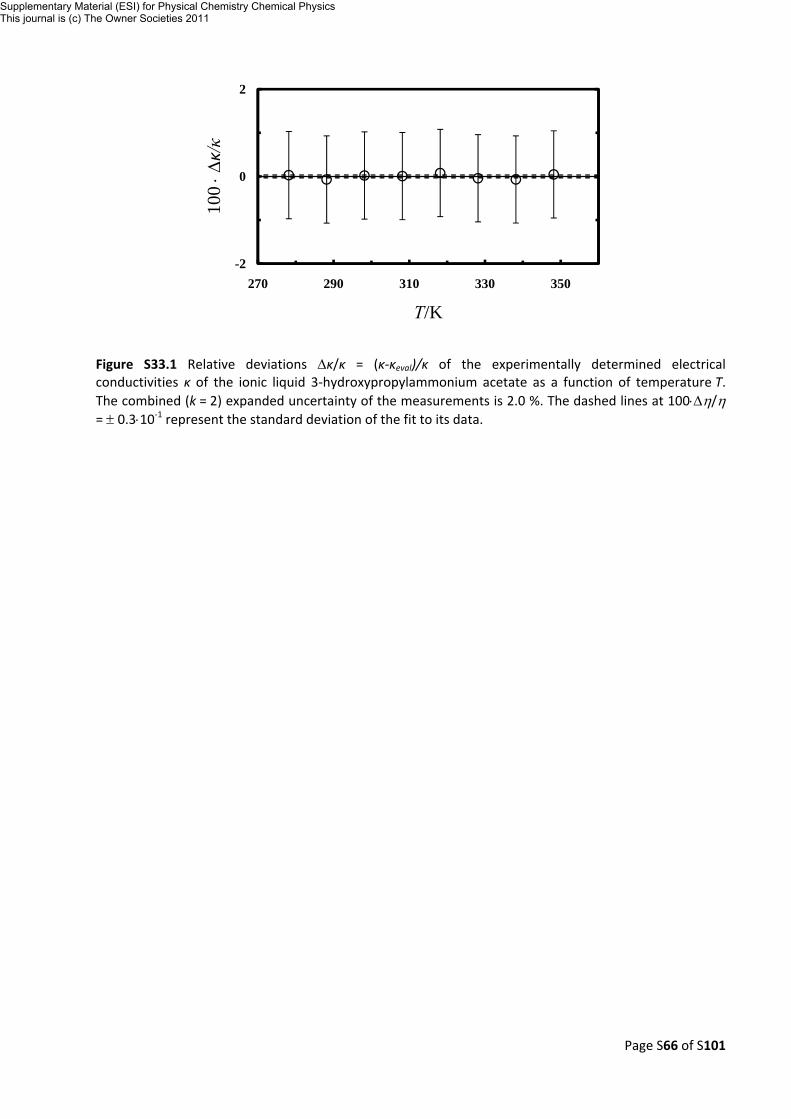
Page S66 of S101
Figure S33.1 Relative deviations Δκ/κ = (κ‐κeval)/κ of the experimentally determined electrical conductivities κ of the ionic liquid 3‐hydroxypropylammonium acetate as a function of temperature T. The combined (k = 2) expanded uncertainty of the measurements is 2.0 %. The dashed lines at 100⋅Δη/η = ± 0.3⋅10‐1 represent the standard deviation of the fit to its data.
-2
0
2
-2
0
2
270 290 310 330 350
100 ⋅Δ
κ/κ
T/K
Supplementary Material (ESI) for Physical Chemistry Chemical PhysicsThis journal is (c) The Owner Societies 2011

Page S67 of S101
12) 3‐Hydroxypropylammonium malonate: [HPA]Mal
Table S34 Densities ρ of the ionic liquid 3‐Hydroxypropylammonium malonate at elevated temperatures T
Compound 3‐Hydroxypropylammonium malonate
CASRN n.a.
Purity single phase
Physical property density
Combined expanded (k = 2) relative uncertainty
0.3 %
Instrument Anton Paar DMA 602 H vibrating tube densimeter
Standards for calibration Millipore water, ambient air with known humidity
Temperature range of calibration (278.15 to 358.15) K
Thermocouples used industrial grade platinum resistance thermometer of nominal resistance 100 Ω
Calibration of thermocouples calibrated to a standard platinum thermometer of nominal resistance 25 Ω, which has been calibrated to ITS‐90
Uncertainty of temperature T ± 0.02 K
Water mass fraction w of sample before measurement
64⋅10‐4
Water mass fraction w of sample after measurement
94⋅10‐4
Atmosphere during measurement dry N2
Literature data on property n.a.
Comments on literature data n.a.
Fit function for comparison with literature /K
Standard deviation of fit function 0.1⋅10‐3
T
ρ
ρeval (ρ‐ρeval) A0 A1 A2
A3 K kg⋅m‐3 kg⋅m‐3 ρ ⋅10‐2 kg⋅m‐3 kg⋅m‐3 kg⋅m‐3 kg⋅m‐3
278.15 1268.3 1268.4
0.0 1441.3 ‐173.0 n.a.
n.a. 288.15 1262.0 1262.1 0.0 1441.3 ‐179.2 n.a. n.a. 298.15 1255.9 1255.9 0.0 1441.3 ‐185.4 n.a. n.a. 308.15 1249.7 1249.7 0.0 1441.3 ‐191.6 n.a. n.a. 318.15 1243.7 1243.5 0.0 1441.3 ‐197.8 n.a. n.a. 328.15 1237.7 1237.3 0.0 1441.3 ‐204.1 n.a. n.a. 338.15 1230.6 1231.1 0.0 1441.3 ‐210.3 n.a. n.a.
Supplementary Material (ESI) for Physical Chemistry Chemical PhysicsThis journal is (c) The Owner Societies 2011

Page S68 of S101
Figure S34.1 Relative deviations Δρ/ρ = (ρ‐ρeval)/ρ of the experimentally determined densities ρ of the ionic liquid 3‐hydroxypropylammonium malonate as a function of temperature T. The combined (k = 2) expanded uncertainty of the measurements is 0.3 %. The standard deviation of the fit to its data is 100⋅σ(ρ)/<ρ> = ± 0.1⋅10‐1.
-0.04
0
0.04
-0.5
0
0.5
270 290 310 330
100 ⋅Δρ/ρ
T/K
Supplementary Material (ESI) for Physical Chemistry Chemical PhysicsThis journal is (c) The Owner Societies 2011
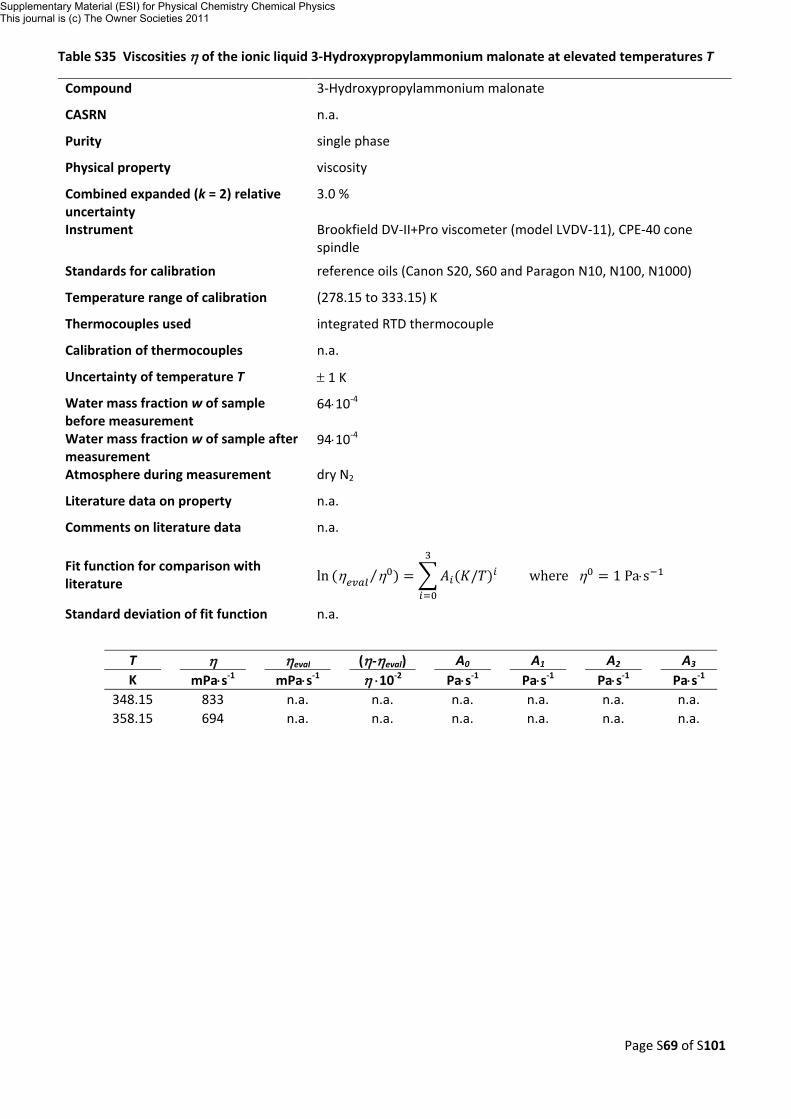
Page S69 of S101
Table S35 Viscosities η of the ionic liquid 3‐Hydroxypropylammonium malonate at elevated temperatures T
Compound 3‐Hydroxypropylammonium malonate
CASRN n.a.
Purity single phase
Physical property viscosity
Combined expanded (k = 2) relative uncertainty
3.0 %
Instrument Brookfield DV‐II+Pro viscometer (model LVDV‐11), CPE‐40 cone spindle
Standards for calibration reference oils (Canon S20, S60 and Paragon N10, N100, N1000)
Temperature range of calibration (278.15 to 333.15) K
Thermocouples used integrated RTD thermocouple
Calibration of thermocouples n.a.
Uncertainty of temperature T ± 1 K
Water mass fraction w of sample before measurement
64⋅10‐4
Water mass fraction w of sample after measurement
94⋅10‐4
Atmosphere during measurement dry N2
Literature data on property n.a.
Comments on literature data n.a.
Fit function for comparison with literature ln η η⁄ / where η 1 Pa⋅s
Standard deviation of fit function n.a.
T
η
ηeval (η‐ηeval) A0 A1 A2
A3 K mPa⋅s‐1 mPa⋅s‐1 η ⋅10‐2 Pa⋅s‐1 Pa⋅s‐1 Pa⋅s‐1 Pa⋅s‐1
348.15 833 n.a.
n.a. n.a. n.a. n.a.
n.a. 358.15 694 n.a. n.a. n.a. n.a. n.a. n.a.
Supplementary Material (ESI) for Physical Chemistry Chemical PhysicsThis journal is (c) The Owner Societies 2011
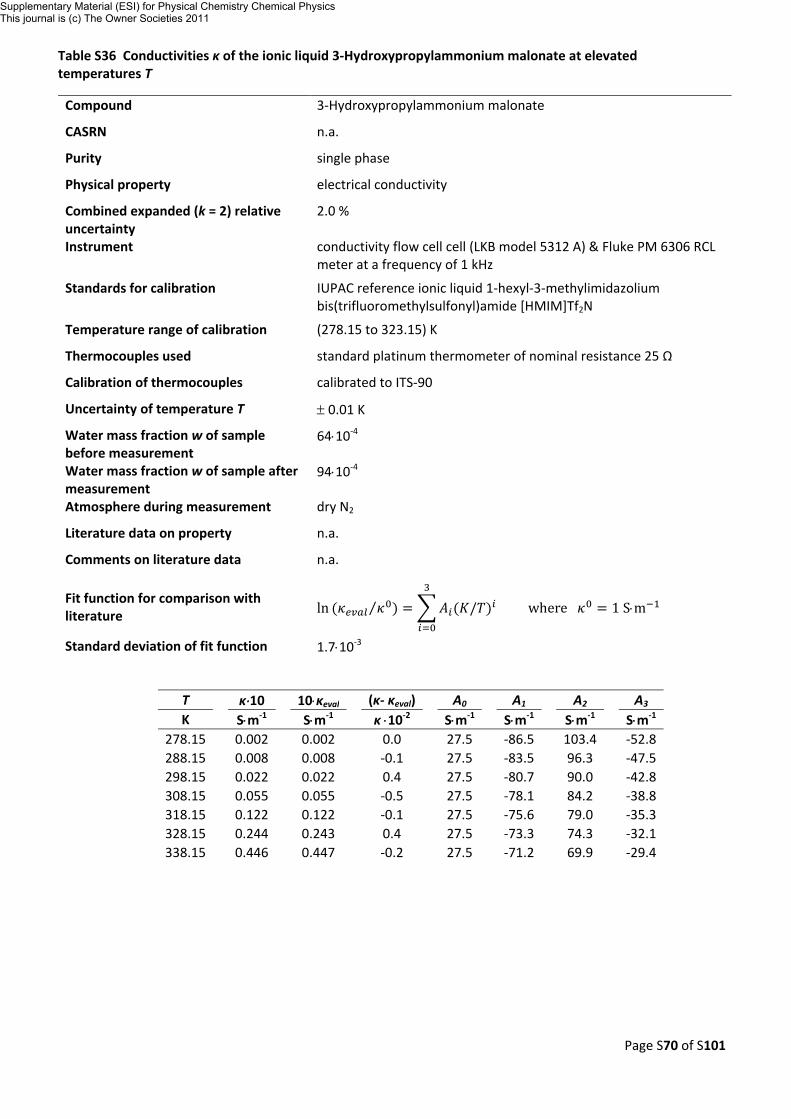
Page S70 of S101
Table S36 Conductivities κ of the ionic liquid 3‐Hydroxypropylammonium malonate at elevated temperatures T
Compound 3‐Hydroxypropylammonium malonate
CASRN n.a.
Purity single phase
Physical property electrical conductivity
Combined expanded (k = 2) relative uncertainty
2.0 %
Instrument conductivity flow cell cell (LKB model 5312 A) & Fluke PM 6306 RCL meter at a frequency of 1 kHz
Standards for calibration IUPAC reference ionic liquid 1‐hexyl‐3‐methylimidazolium bis(trifluoromethylsulfonyl)amide [HMIM]Tf2N
Temperature range of calibration (278.15 to 323.15) K
Thermocouples used standard platinum thermometer of nominal resistance 25 Ω
Calibration of thermocouples calibrated to ITS‐90
Uncertainty of temperature T ± 0.01 K
Water mass fraction w of sample before measurement
64⋅10‐4
Water mass fraction w of sample after measurement
94⋅10‐4
Atmosphere during measurement dry N2
Literature data on property n.a.
Comments on literature data n.a.
Fit function for comparison with literature ln ⁄ / where 1 S⋅m
Standard deviation of fit function 1.7⋅10‐3
T
κ⋅10 10⋅κeval
(κ‐ κeval) A0 A1 A2 A3
K S⋅m‐1 S⋅m‐1 κ ⋅10‐2 S⋅m‐1 S⋅m‐1 S⋅m‐1 S⋅m‐1 278.15 0.002 0.002
0.0 27.5 ‐86.5 103.4
‐52.8 288.15 0.008 0.008 ‐0.1 27.5 ‐83.5 96.3 ‐47.5 298.15 0.022 0.022 0.4 27.5 ‐80.7 90.0 ‐42.8 308.15 0.055 0.055 ‐0.5 27.5 ‐78.1 84.2 ‐38.8 318.15 0.122 0.122 ‐0.1 27.5 ‐75.6 79.0 ‐35.3 328.15 0.244 0.243 0.4 27.5 ‐73.3 74.3 ‐32.1 338.15 0.446 0.447 ‐0.2 27.5 ‐71.2 69.9 ‐29.4
Supplementary Material (ESI) for Physical Chemistry Chemical PhysicsThis journal is (c) The Owner Societies 2011
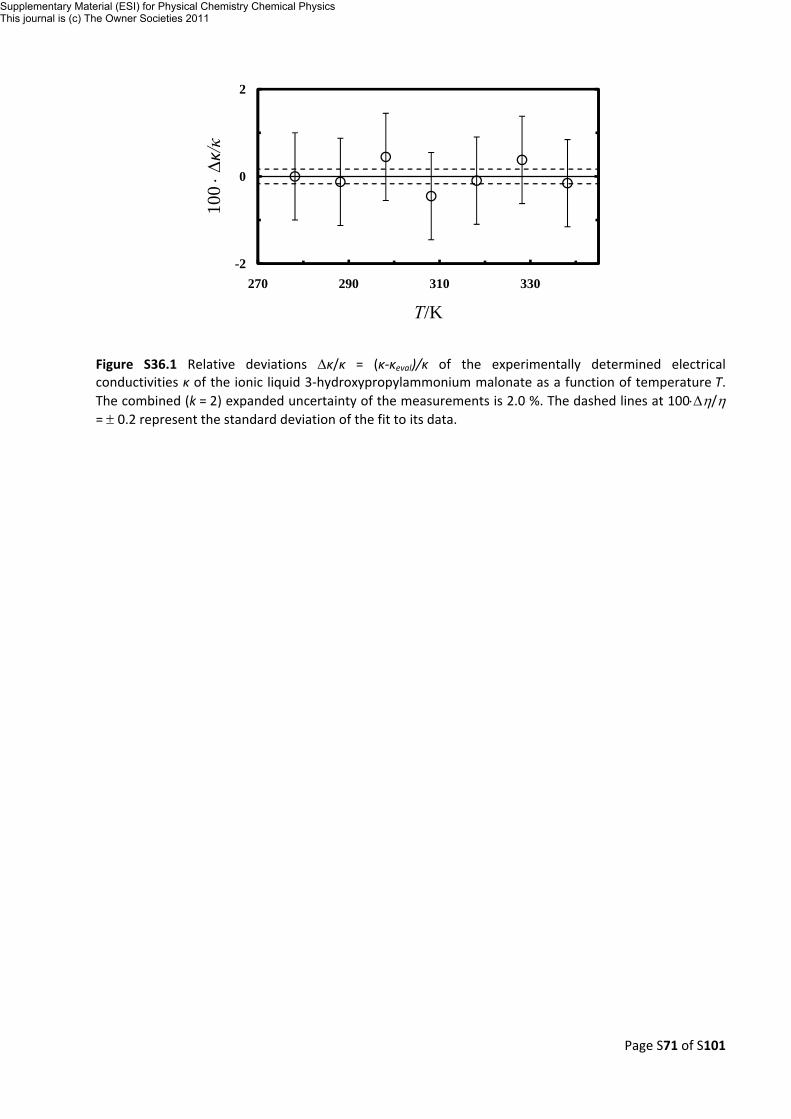
Page S71 of S101
Figure S36.1 Relative deviations Δκ/κ = (κ‐κeval)/κ of the experimentally determined electrical conductivities κ of the ionic liquid 3‐hydroxypropylammonium malonate as a function of temperature T. The combined (k = 2) expanded uncertainty of the measurements is 2.0 %. The dashed lines at 100⋅Δη/η = ± 0.2 represent the standard deviation of the fit to its data.
-2
0
2
-2
0
2
270 290 310 330
100 ⋅Δ
κ/κ
T/K
Supplementary Material (ESI) for Physical Chemistry Chemical PhysicsThis journal is (c) The Owner Societies 2011

Page S72 of S101
13) Diallylammonium formate: [DAA]Fmt
Table S37 Densities ρ of the ionic liquid diallylammonium formate at elevated temperatures T
Compound Diallylammonium formate
CASRN n.a.
Purity single phase
Physical property density
Combined expanded (k = 2) relative uncertainty
0.3 %
Instrument Anton Paar DMA 602 H vibrating tube densimeter
Standards for calibration Millipore water, ambient air with known humidity
Temperature range of calibration (278.15 to 358.15) K
Thermocouples used industrial grade platinum resistance thermometer of nominal resistance 100 Ω
Calibration of thermocouples calibrated to a standard platinum thermometer of nominal resistance 25 Ω, which has been calibrated to ITS‐90
Uncertainty of temperature T ± 0.02 K
Water mass fraction w of sample before measurement
69⋅10‐5
Water mass fraction w of sample after measurement
209⋅10‐5
Atmosphere during measurement dry N2
Literature data on property n.a.
Comments on literature data n.a.
Fit function for comparison with literature /K
Standard deviation of fit function 0.4⋅10‐4
T
ρ
ρeval (ρ‐ρeval) A0 A1 A2
A3 K kg⋅m‐3 kg⋅m‐3 ρ ⋅10‐2 kg⋅m‐3 kg⋅m‐3 kg⋅m‐3 kg⋅m‐3
278.15 952.1 952.1
0.0 1186.6 ‐234.5 n.a.
n.a. 288.15 943.7 943.7 0.0 1186.6 ‐242.9 n.a. n.a. 298.15 935.4 935.3 0.0 1186.6 ‐251.3 n.a. n.a. 308.15 926.8 926.9 0.0 1186.6 ‐259.7 n.a. n.a. 318.15 918.5 918.4 0.0 1186.6 ‐268.2 n.a. n.a. 328.15 910.1 910.0 0.0 1186.6 ‐276.6 n.a. n.a. 338.15 901.5 901.6 0.0 1186.6 ‐285.0 n.a. n.a.
Supplementary Material (ESI) for Physical Chemistry Chemical PhysicsThis journal is (c) The Owner Societies 2011

Page S73 of S101
Figure S37.1 Relative deviations Δρ/ρ = (ρ‐ρeval)/ρ of the experimentally determined densities ρ of the ionic liquid diallylammonium formate as a function of temperature T. The combined (k = 2) expanded uncertainty of the measurements is 0.3 %. The standard deviation of the fit to its data is 100⋅σ(ρ)/<ρ> = ± 0.2⋅10‐2.
-0.04
0
0.04
-0.5
0
0.5
270 290 310 330
100 ⋅Δρ/ρ
T/K
Supplementary Material (ESI) for Physical Chemistry Chemical PhysicsThis journal is (c) The Owner Societies 2011
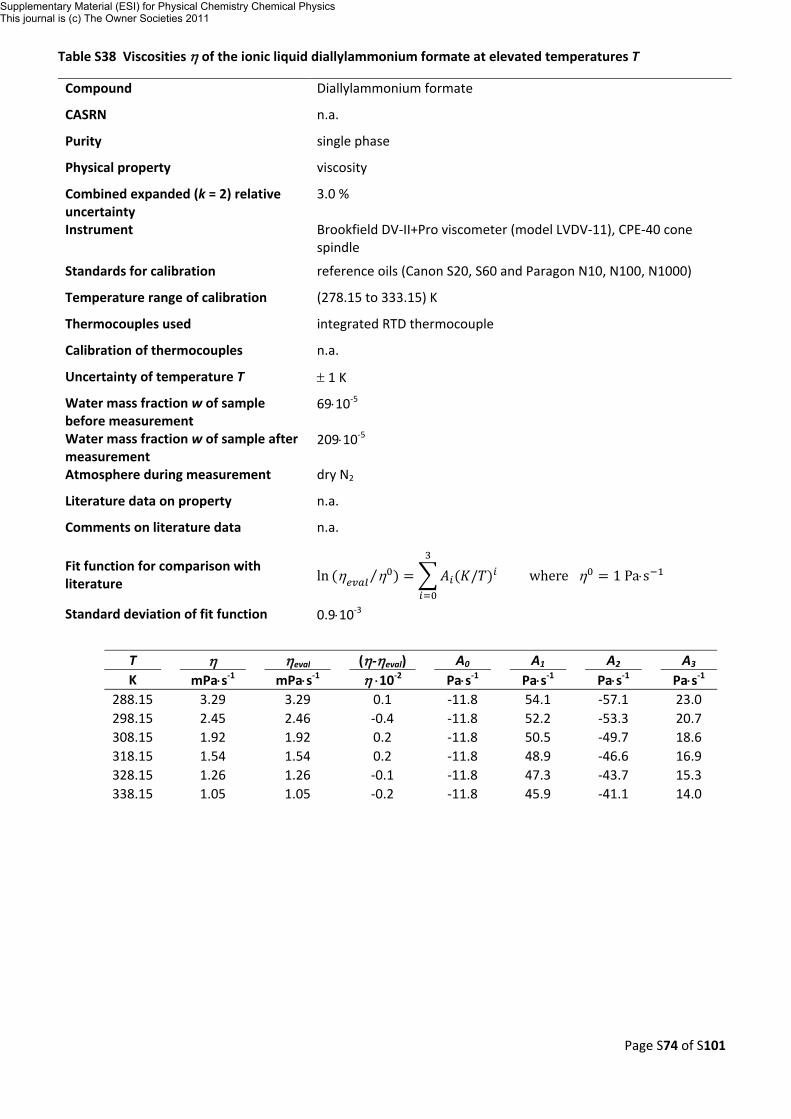
Page S74 of S101
Table S38 Viscosities η of the ionic liquid diallylammonium formate at elevated temperatures T
Compound Diallylammonium formate
CASRN n.a.
Purity single phase
Physical property viscosity
Combined expanded (k = 2) relative uncertainty
3.0 %
Instrument Brookfield DV‐II+Pro viscometer (model LVDV‐11), CPE‐40 cone spindle
Standards for calibration reference oils (Canon S20, S60 and Paragon N10, N100, N1000)
Temperature range of calibration (278.15 to 333.15) K
Thermocouples used integrated RTD thermocouple
Calibration of thermocouples n.a.
Uncertainty of temperature T ± 1 K
Water mass fraction w of sample before measurement
69⋅10‐5
Water mass fraction w of sample after measurement
209⋅10‐5
Atmosphere during measurement dry N2
Literature data on property n.a.
Comments on literature data n.a.
Fit function for comparison with literature ln η η⁄ / where η 1 Pa⋅s
Standard deviation of fit function 0.9⋅10‐3
T
η
ηeval (η‐ηeval) A0 A1 A2
A3 K mPa⋅s‐1 mPa⋅s‐1 η ⋅10‐2 Pa⋅s‐1 Pa⋅s‐1 Pa⋅s‐1 Pa⋅s‐1
288.15 3.29 3.29
0.1 ‐11.8 54.1 ‐57.1
23.0 298.15 2.45 2.46 ‐0.4 ‐11.8 52.2 ‐53.3 20.7 308.15 1.92 1.92 0.2 ‐11.8 50.5 ‐49.7 18.6 318.15 1.54 1.54 0.2 ‐11.8 48.9 ‐46.6 16.9 328.15 1.26 1.26 ‐0.1 ‐11.8 47.3 ‐43.7 15.3 338.15 1.05 1.05 ‐0.2 ‐11.8 45.9 ‐41.1 14.0
Supplementary Material (ESI) for Physical Chemistry Chemical PhysicsThis journal is (c) The Owner Societies 2011
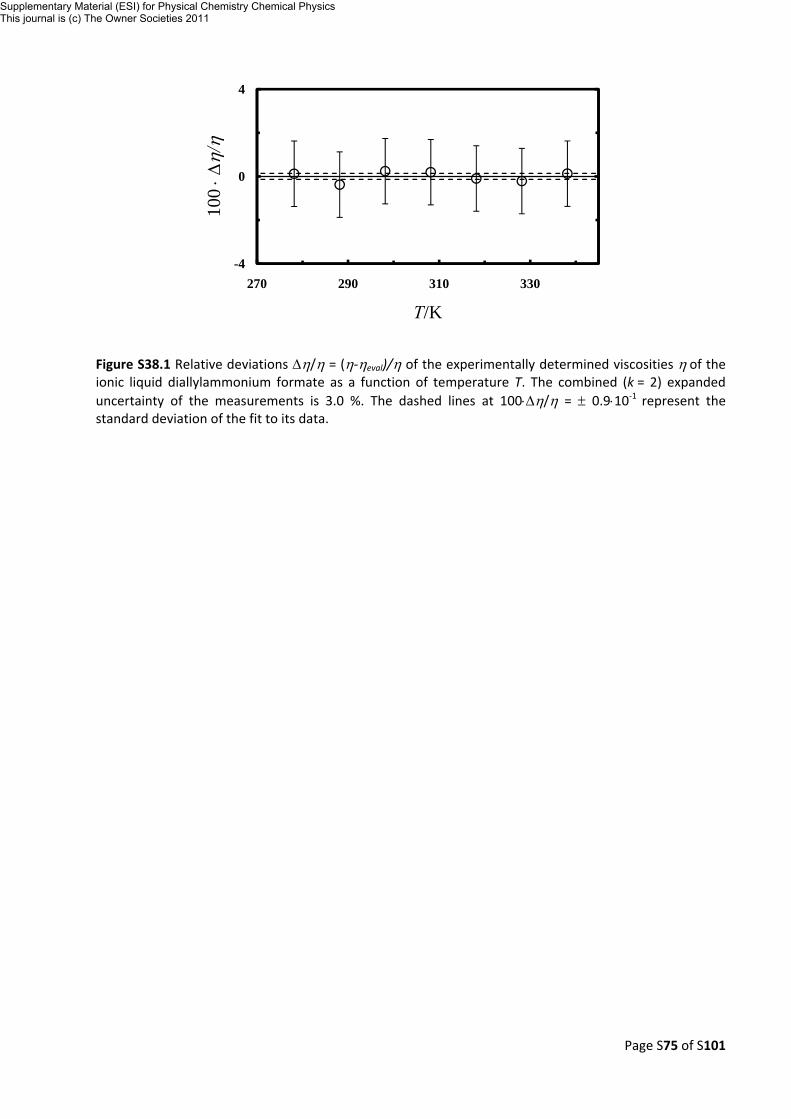
Page S75 of S101
Figure S38.1 Relative deviations Δη/η = (η‐ηeval)/η of the experimentally determined viscosities η of the ionic liquid diallylammonium formate as a function of temperature T. The combined (k = 2) expanded uncertainty of the measurements is 3.0 %. The dashed lines at 100⋅Δη/η = ± 0.9⋅10‐1 represent the standard deviation of the fit to its data.
-4
0
4
-4
0
4
270 290 310 330
100 ⋅Δ
η/η
T/K
Supplementary Material (ESI) for Physical Chemistry Chemical PhysicsThis journal is (c) The Owner Societies 2011

Page S76 of S101
Table S39 Conductivities κ of the ionic liquid diallylammonium formate at elevated temperatures T
Compound Diallylammonium formate
CASRN n.a.
Purity single phase
Physical property electrical conductivity
Combined expanded (k = 2) relative uncertainty
2.0 %
Instrument conductivity flow cell cell (LKB model 5312 A) & Fluke PM 6306 RCL meter at a frequency of 1 kHz
Standards for calibration IUPAC reference ionic liquid 1‐hexyl‐3‐methylimidazolium bis(trifluoromethylsulfonyl)amide [HMIM]Tf2N
Temperature range of calibration (278.15 to 323.15) K
Thermocouples used standard platinum thermometer of nominal resistance 25 Ω
Calibration of thermocouples calibrated to ITS‐90
Uncertainty of temperature T ± 0.01 K
Water mass fraction w of sample before measurement
69⋅10‐5
Water mass fraction w of sample after measurement
209⋅10‐5
Atmosphere during measurement dry N2
Literature data on property n.a.
Comments on literature data n.a.
Fit function for comparison with literature ln ⁄ / where 1 S⋅m
Standard deviation of fit function 0.2⋅10‐3
T
10⋅κ 10⋅κeval
(κ‐ κeval) A0 A1 A2 A3
K S⋅m‐1 S⋅m‐1 κ ⋅10‐2 S⋅m‐1 S⋅m‐1 S⋅m‐1 S⋅m‐1
278.15 0.004 0.004
‐0.1 ‐20.2 50.4 ‐57.4
19.3 288.15 0.005 0.005 0.3 ‐20.2 48.7 ‐53.5 17.4 298.15 0.006 0.006 ‐0.4 ‐20.2 47.0 ‐49.9 15.7 308.15 0.007 0.007 0.4 ‐20.2 45.5 ‐46.7 14.2 318.15 0.008 0.008 ‐0.2 ‐20.2 44.1 ‐43.9 12.9 328.15 0.010 0.010 0.1 ‐20.2 42.7 ‐41.2 11.8 338.15 0.011 0.011 0.0 ‐20.2 41.5 ‐38.8 10.8
Supplementary Material (ESI) for Physical Chemistry Chemical PhysicsThis journal is (c) The Owner Societies 2011

Page S77 of S101
Figure S39.1 Relative deviations Δκ/κ = (κ‐κeval)/κ of the experimentally determined electrical conductivities κ of the ionic liquid diallylammonium formate as a function of temperature T. The combined (k = 2) expanded uncertainty of the measurements is 2.0 %. The dashed lines at 100⋅Δη/η = ± 0.2⋅10‐1 represent the standard deviation of the fit to its data.
-2
0
2
-2
0
2
270 290 310 330
100 ⋅Δ
κ/κ
T/K
Supplementary Material (ESI) for Physical Chemistry Chemical PhysicsThis journal is (c) The Owner Societies 2011
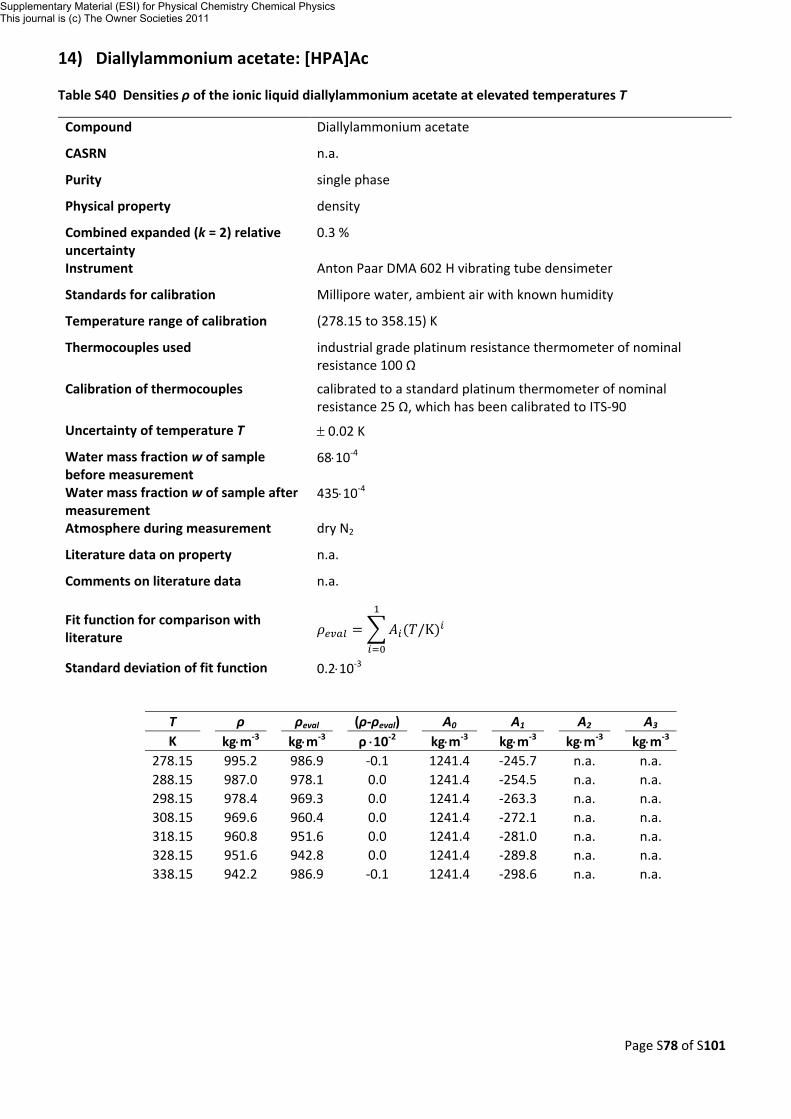
Page S78 of S101
14) Diallylammonium acetate: [HPA]Ac
Table S40 Densities ρ of the ionic liquid diallylammonium acetate at elevated temperatures T
Compound Diallylammonium acetate
CASRN n.a.
Purity single phase
Physical property density
Combined expanded (k = 2) relative uncertainty
0.3 %
Instrument Anton Paar DMA 602 H vibrating tube densimeter
Standards for calibration Millipore water, ambient air with known humidity
Temperature range of calibration (278.15 to 358.15) K
Thermocouples used industrial grade platinum resistance thermometer of nominal resistance 100 Ω
Calibration of thermocouples calibrated to a standard platinum thermometer of nominal resistance 25 Ω, which has been calibrated to ITS‐90
Uncertainty of temperature T ± 0.02 K
Water mass fraction w of sample before measurement
68⋅10‐4
Water mass fraction w of sample after measurement
435⋅10‐4
Atmosphere during measurement dry N2
Literature data on property n.a.
Comments on literature data n.a.
Fit function for comparison with literature /K
Standard deviation of fit function 0.2⋅10‐3
T
ρ
ρeval (ρ‐ρeval) A0 A1 A2
A3 K kg⋅m‐3 kg⋅m‐3 ρ ⋅10‐2 kg⋅m‐3 kg⋅m‐3 kg⋅m‐3 kg⋅m‐3
278.15 995.2 986.9
‐0.1 1241.4 ‐245.7 n.a.
n.a. 288.15 987.0 978.1 0.0 1241.4 ‐254.5 n.a. n.a. 298.15 978.4 969.3 0.0 1241.4 ‐263.3 n.a. n.a. 308.15 969.6 960.4 0.0 1241.4 ‐272.1 n.a. n.a. 318.15 960.8 951.6 0.0 1241.4 ‐281.0 n.a. n.a. 328.15 951.6 942.8 0.0 1241.4 ‐289.8 n.a. n.a. 338.15 942.2 986.9 ‐0.1 1241.4 ‐298.6 n.a. n.a.
Supplementary Material (ESI) for Physical Chemistry Chemical PhysicsThis journal is (c) The Owner Societies 2011
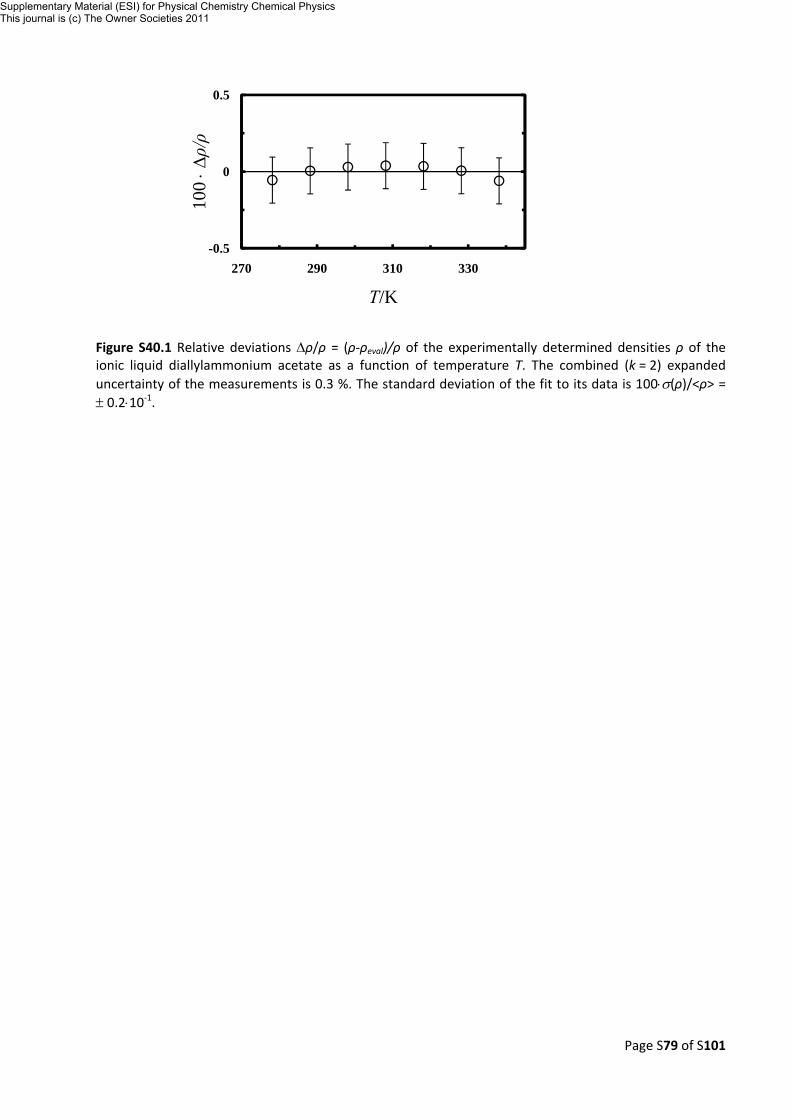
Page S79 of S101
Figure S40.1 Relative deviations Δρ/ρ = (ρ‐ρeval)/ρ of the experimentally determined densities ρ of the ionic liquid diallylammonium acetate as a function of temperature T. The combined (k = 2) expanded uncertainty of the measurements is 0.3 %. The standard deviation of the fit to its data is 100⋅σ(ρ)/<ρ> = ± 0.2⋅10‐1.
-0.04
0
0.04
-0.5
0
0.5
270 290 310 330
100 ⋅Δρ/ρ
T/K
Supplementary Material (ESI) for Physical Chemistry Chemical PhysicsThis journal is (c) The Owner Societies 2011
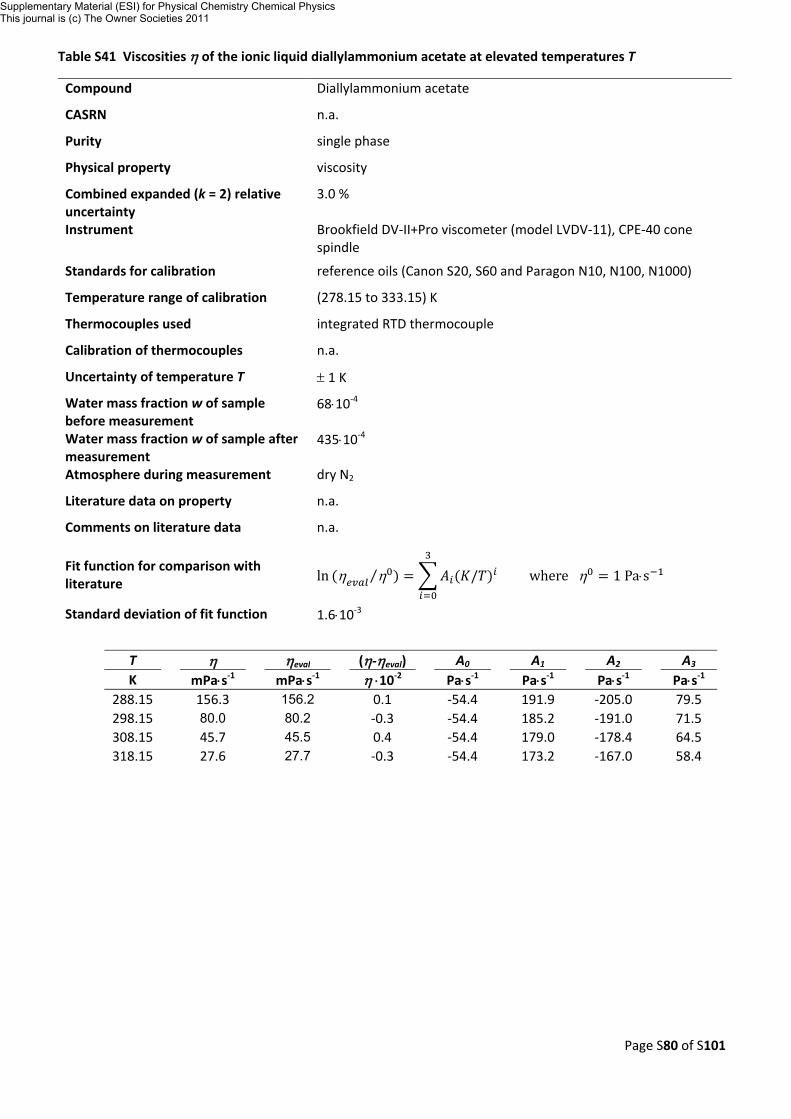
Page S80 of S101
Table S41 Viscosities η of the ionic liquid diallylammonium acetate at elevated temperatures T
Compound Diallylammonium acetate
CASRN n.a.
Purity single phase
Physical property viscosity
Combined expanded (k = 2) relative uncertainty
3.0 %
Instrument Brookfield DV‐II+Pro viscometer (model LVDV‐11), CPE‐40 cone spindle
Standards for calibration reference oils (Canon S20, S60 and Paragon N10, N100, N1000)
Temperature range of calibration (278.15 to 333.15) K
Thermocouples used integrated RTD thermocouple
Calibration of thermocouples n.a.
Uncertainty of temperature T ± 1 K
Water mass fraction w of sample before measurement
68⋅10‐4
Water mass fraction w of sample after measurement
435⋅10‐4
Atmosphere during measurement dry N2
Literature data on property n.a.
Comments on literature data n.a.
Fit function for comparison with literature ln η η⁄ / where η 1 Pa⋅s
Standard deviation of fit function 1.6⋅10‐3
T
η
ηeval (η‐ηeval) A0 A1 A2
A3 K mPa⋅s‐1 mPa⋅s‐1 η ⋅10‐2 Pa⋅s‐1 Pa⋅s‐1 Pa⋅s‐1 Pa⋅s‐1
288.15 156.3 156.2
0.1 ‐54.4 191.9 ‐205.0
79.5 298.15 80.0 80.2 ‐0.3 ‐54.4 185.2 ‐191.0 71.5 308.15 45.7 45.5 0.4 ‐54.4 179.0 ‐178.4 64.5 318.15 27.6 27.7 ‐0.3 ‐54.4 173.2 ‐167.0 58.4
Supplementary Material (ESI) for Physical Chemistry Chemical PhysicsThis journal is (c) The Owner Societies 2011
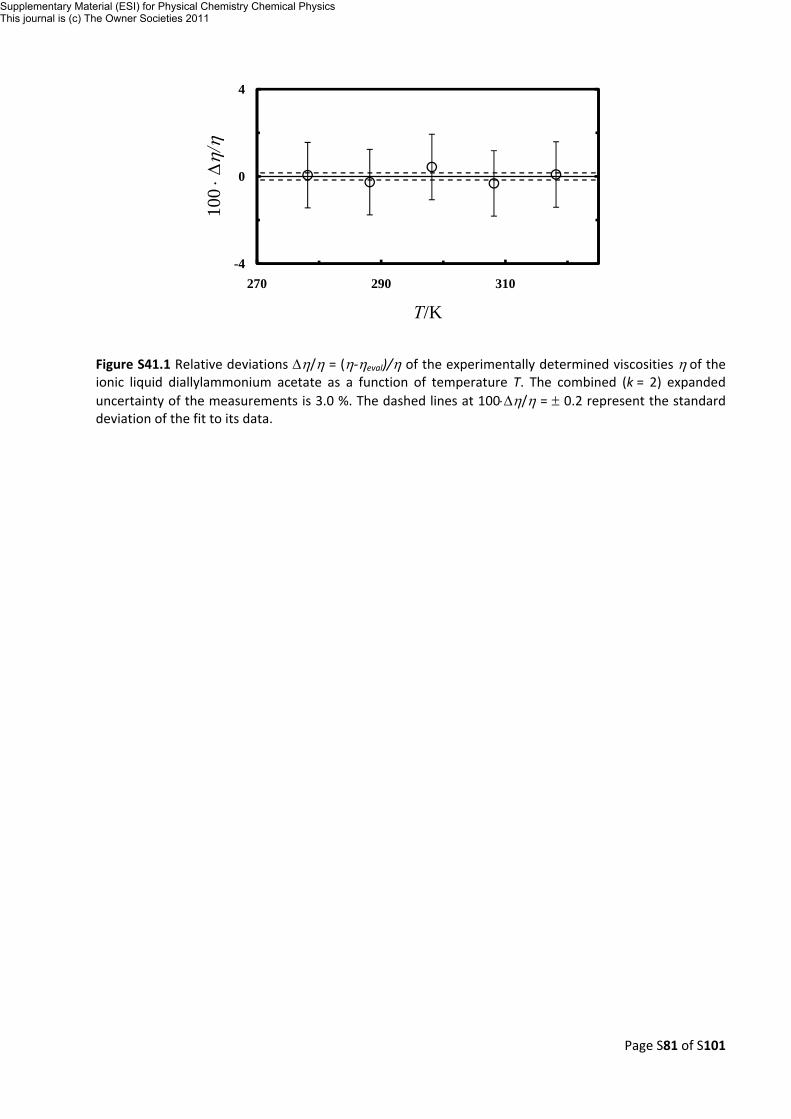
Page S81 of S101
Figure S41.1 Relative deviations Δη/η = (η‐ηeval)/η of the experimentally determined viscosities η of the ionic liquid diallylammonium acetate as a function of temperature T. The combined (k = 2) expanded uncertainty of the measurements is 3.0 %. The dashed lines at 100⋅Δη/η = ± 0.2 represent the standard deviation of the fit to its data.
-4
0
4
-4
0
4
270 290 310
100 ⋅Δ
η/η
T/K
Supplementary Material (ESI) for Physical Chemistry Chemical PhysicsThis journal is (c) The Owner Societies 2011
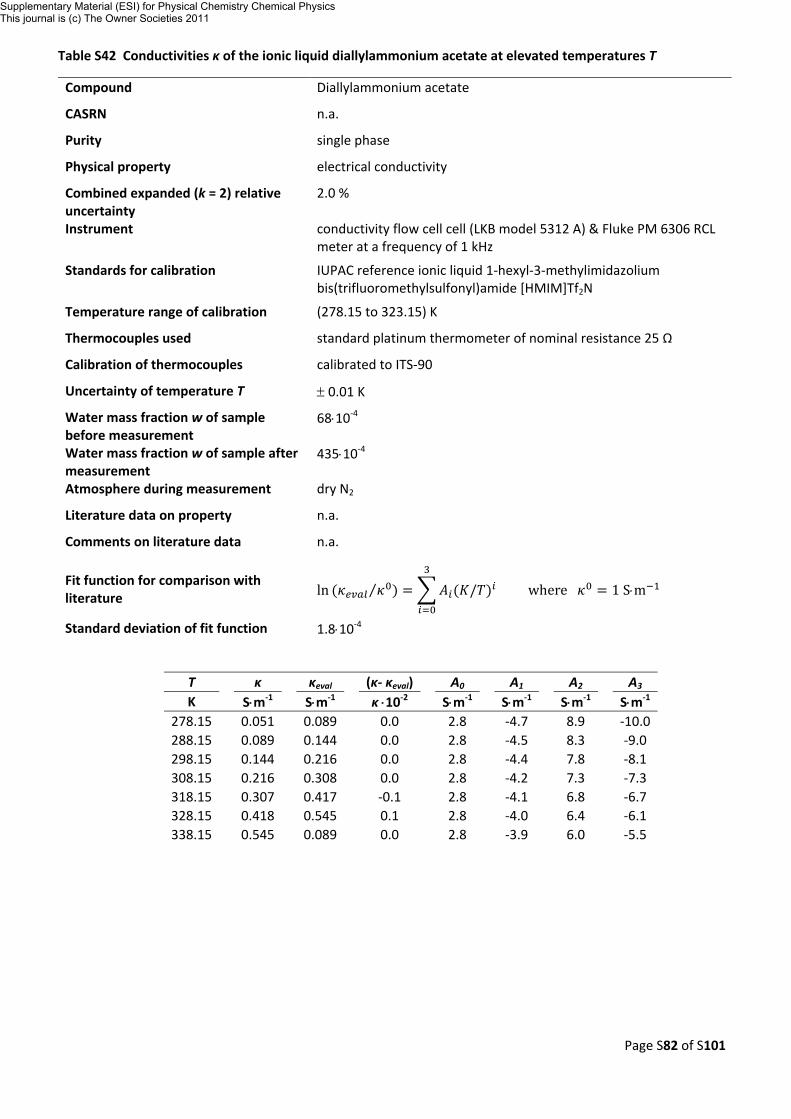
Page S82 of S101
Table S42 Conductivities κ of the ionic liquid diallylammonium acetate at elevated temperatures T
Compound Diallylammonium acetate
CASRN n.a.
Purity single phase
Physical property electrical conductivity
Combined expanded (k = 2) relative uncertainty
2.0 %
Instrument conductivity flow cell cell (LKB model 5312 A) & Fluke PM 6306 RCL meter at a frequency of 1 kHz
Standards for calibration IUPAC reference ionic liquid 1‐hexyl‐3‐methylimidazolium bis(trifluoromethylsulfonyl)amide [HMIM]Tf2N
Temperature range of calibration (278.15 to 323.15) K
Thermocouples used standard platinum thermometer of nominal resistance 25 Ω
Calibration of thermocouples calibrated to ITS‐90
Uncertainty of temperature T ± 0.01 K
Water mass fraction w of sample before measurement
68⋅10‐4
Water mass fraction w of sample after measurement
435⋅10‐4
Atmosphere during measurement dry N2
Literature data on property n.a.
Comments on literature data n.a.
Fit function for comparison with literature ln ⁄ / where 1 S⋅m
Standard deviation of fit function 1.8⋅10‐4
T
κ
κeval (κ‐ κeval) A0 A1 A2
A3 K S⋅m‐1 S⋅m‐1 κ ⋅10‐2 S⋅m‐1 S⋅m‐1 S⋅m‐1 S⋅m‐1
278.15 0.051 0.089
0.0 2.8 ‐4.7 8.9
‐10.0 288.15 0.089 0.144 0.0 2.8 ‐4.5 8.3 ‐9.0 298.15 0.144 0.216 0.0 2.8 ‐4.4 7.8 ‐8.1 308.15 0.216 0.308 0.0 2.8 ‐4.2 7.3 ‐7.3 318.15 0.307 0.417 ‐0.1 2.8 ‐4.1 6.8 ‐6.7 328.15 0.418 0.545 0.1 2.8 ‐4.0 6.4 ‐6.1 338.15 0.545 0.089 0.0 2.8 ‐3.9 6.0 ‐5.5
Supplementary Material (ESI) for Physical Chemistry Chemical PhysicsThis journal is (c) The Owner Societies 2011
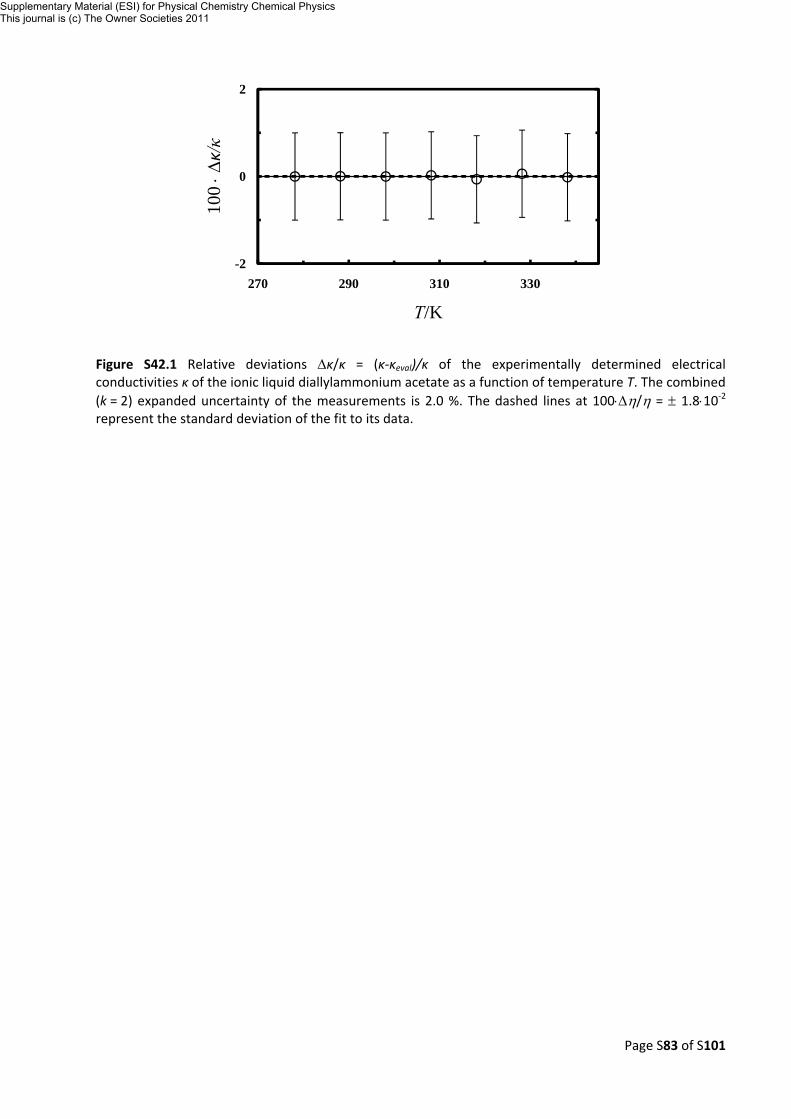
Page S83 of S101
Figure S42.1 Relative deviations Δκ/κ = (κ‐κeval)/κ of the experimentally determined electrical conductivities κ of the ionic liquid diallylammonium acetate as a function of temperature T. The combined (k = 2) expanded uncertainty of the measurements is 2.0 %. The dashed lines at 100⋅Δη/η = ± 1.8⋅10‐2
represent the standard deviation of the fit to its data.
-2
0
2
-2
0
2
270 290 310 330
100 ⋅Δ
κ/κ
T/K
Supplementary Material (ESI) for Physical Chemistry Chemical PhysicsThis journal is (c) The Owner Societies 2011
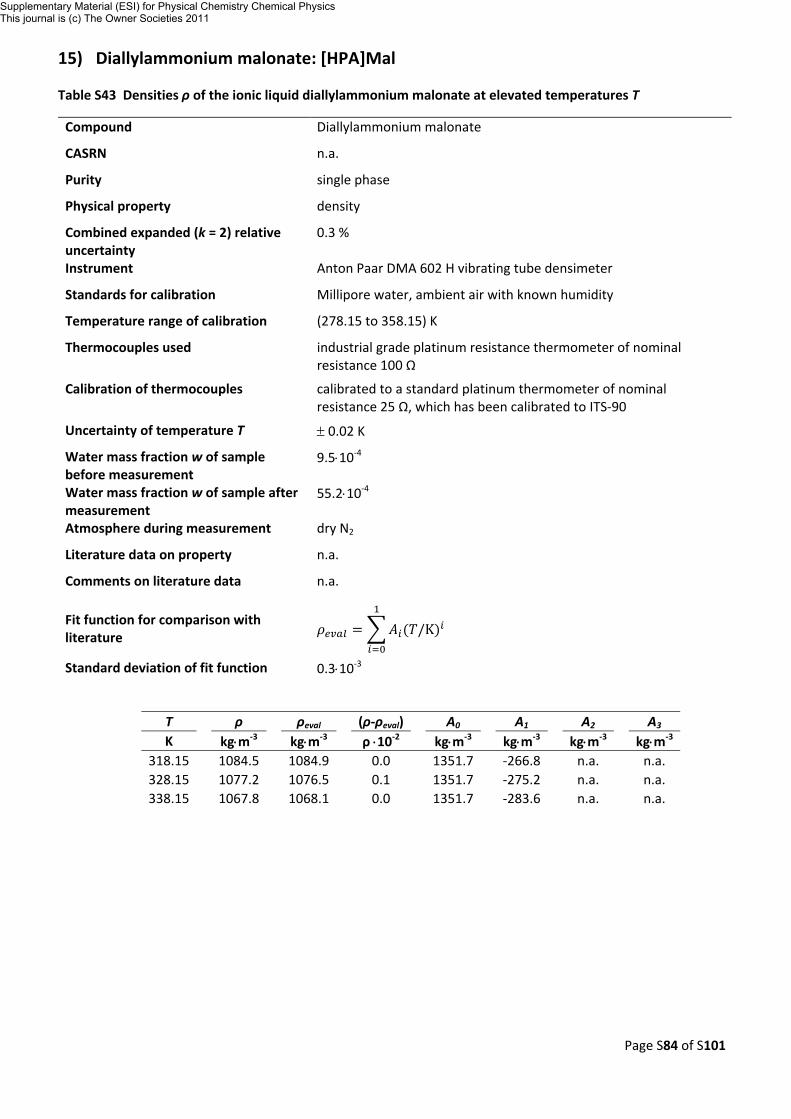
Page S84 of S101
15) Diallylammonium malonate: [HPA]Mal
Table S43 Densities ρ of the ionic liquid diallylammonium malonate at elevated temperatures T
Compound Diallylammonium malonate
CASRN n.a.
Purity single phase
Physical property density
Combined expanded (k = 2) relative uncertainty
0.3 %
Instrument Anton Paar DMA 602 H vibrating tube densimeter
Standards for calibration Millipore water, ambient air with known humidity
Temperature range of calibration (278.15 to 358.15) K
Thermocouples used industrial grade platinum resistance thermometer of nominal resistance 100 Ω
Calibration of thermocouples calibrated to a standard platinum thermometer of nominal resistance 25 Ω, which has been calibrated to ITS‐90
Uncertainty of temperature T ± 0.02 K
Water mass fraction w of sample before measurement
9.5⋅10‐4
Water mass fraction w of sample after measurement
55.2⋅10‐4
Atmosphere during measurement dry N2
Literature data on property n.a.
Comments on literature data n.a.
Fit function for comparison with literature /K
Standard deviation of fit function 0.3⋅10‐3
T
ρ
ρeval (ρ‐ρeval) A0 A1 A2
A3 K kg⋅m‐3 kg⋅m‐3 ρ ⋅10‐2 kg⋅m‐3 kg⋅m‐3 kg⋅m‐3 kg⋅m‐3
318.15 1084.5 1084.9
0.0 1351.7 ‐266.8 n.a.
n.a. 328.15 1077.2 1076.5 0.1 1351.7 ‐275.2 n.a. n.a. 338.15 1067.8 1068.1 0.0 1351.7 ‐283.6 n.a. n.a.
Supplementary Material (ESI) for Physical Chemistry Chemical PhysicsThis journal is (c) The Owner Societies 2011
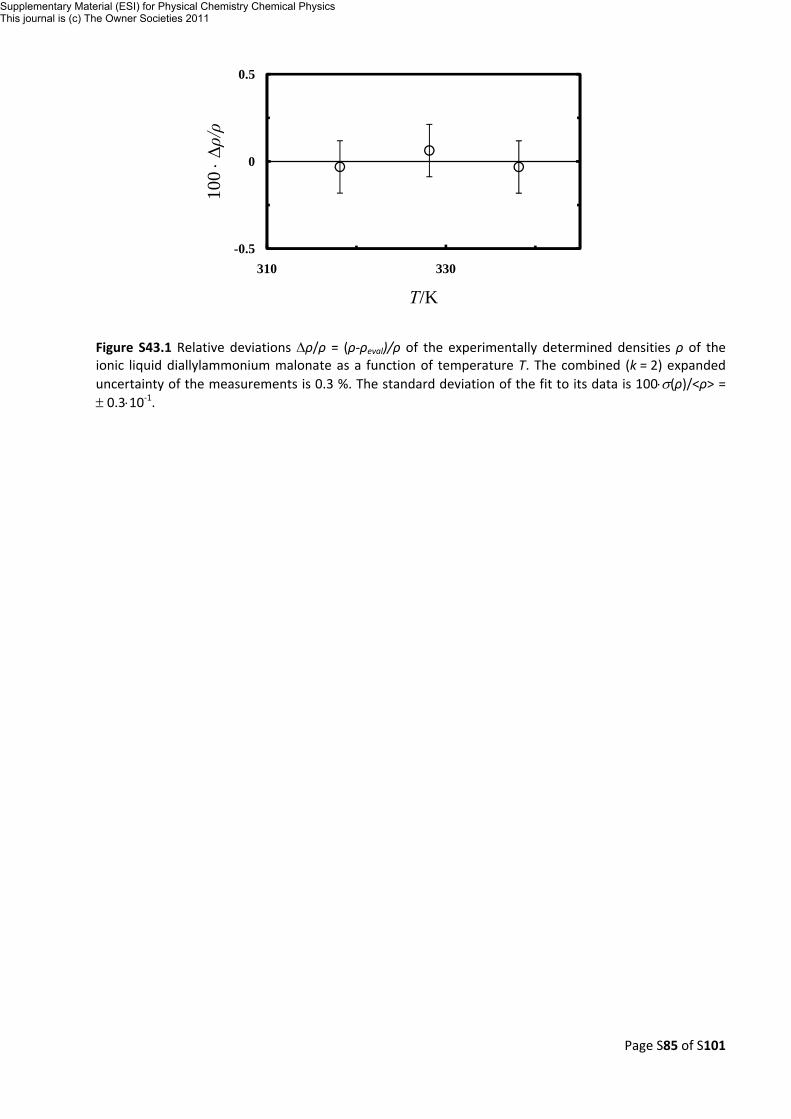
Page S85 of S101
Figure S43.1 Relative deviations Δρ/ρ = (ρ‐ρeval)/ρ of the experimentally determined densities ρ of the ionic liquid diallylammonium malonate as a function of temperature T. The combined (k = 2) expanded uncertainty of the measurements is 0.3 %. The standard deviation of the fit to its data is 100⋅σ(ρ)/<ρ> = ± 0.3⋅10‐1.
-0.04
0
0.04
-0.5
0
0.5
310 330
100 ⋅Δρ/ρ
T/K
Supplementary Material (ESI) for Physical Chemistry Chemical PhysicsThis journal is (c) The Owner Societies 2011
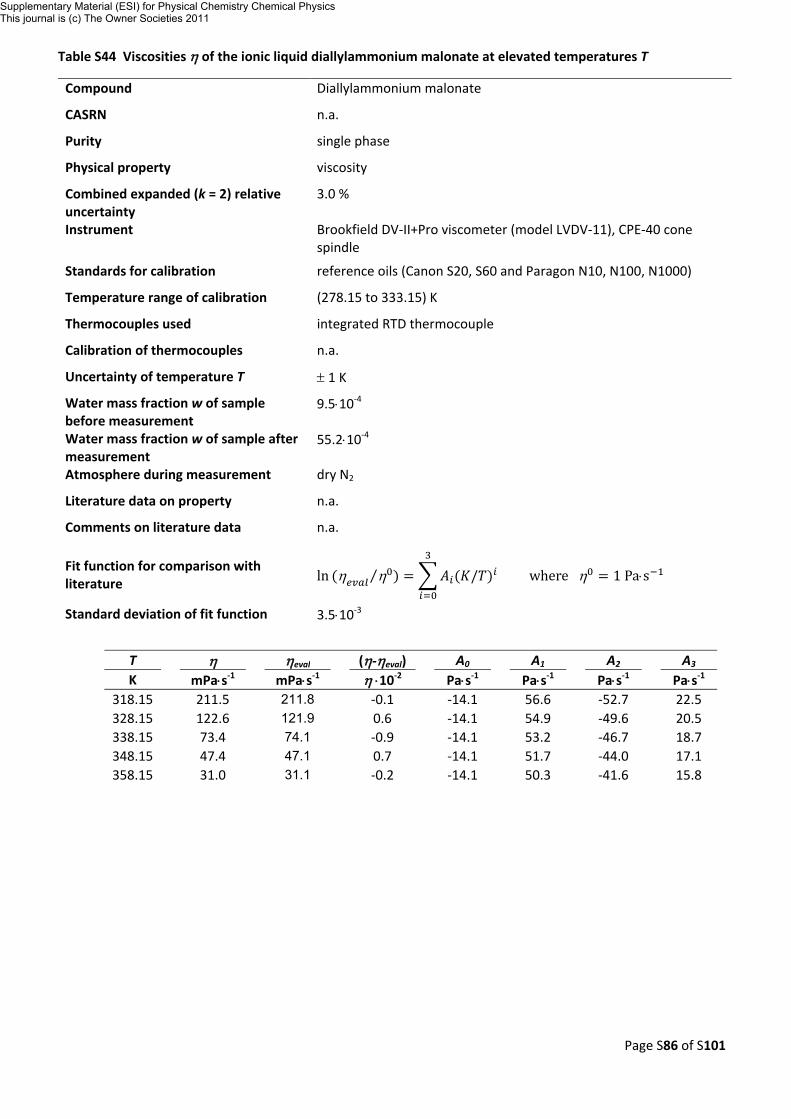
Page S86 of S101
Table S44 Viscosities η of the ionic liquid diallylammonium malonate at elevated temperatures T
Compound Diallylammonium malonate
CASRN n.a.
Purity single phase
Physical property viscosity
Combined expanded (k = 2) relative uncertainty
3.0 %
Instrument Brookfield DV‐II+Pro viscometer (model LVDV‐11), CPE‐40 cone spindle
Standards for calibration reference oils (Canon S20, S60 and Paragon N10, N100, N1000)
Temperature range of calibration (278.15 to 333.15) K
Thermocouples used integrated RTD thermocouple
Calibration of thermocouples n.a.
Uncertainty of temperature T ± 1 K
Water mass fraction w of sample before measurement
9.5⋅10‐4
Water mass fraction w of sample after measurement
55.2⋅10‐4
Atmosphere during measurement dry N2
Literature data on property n.a.
Comments on literature data n.a.
Fit function for comparison with literature ln η η⁄ / where η 1 Pa⋅s
Standard deviation of fit function 3.5⋅10‐3
T
η
ηeval (η‐ηeval) A0 A1 A2
A3 K mPa⋅s‐1 mPa⋅s‐1 η ⋅10‐2 Pa⋅s‐1 Pa⋅s‐1 Pa⋅s‐1 Pa⋅s‐1
318.15 211.5 211.8
‐0.1 ‐14.1 56.6 ‐52.7
22.5 328.15 122.6 121.9 0.6 ‐14.1 54.9 ‐49.6 20.5 338.15 73.4 74.1 ‐0.9 ‐14.1 53.2 ‐46.7 18.7 348.15 47.4 47.1 0.7 ‐14.1 51.7 ‐44.0 17.1 358.15 31.0 31.1 ‐0.2 ‐14.1 50.3 ‐41.6 15.8
Supplementary Material (ESI) for Physical Chemistry Chemical PhysicsThis journal is (c) The Owner Societies 2011
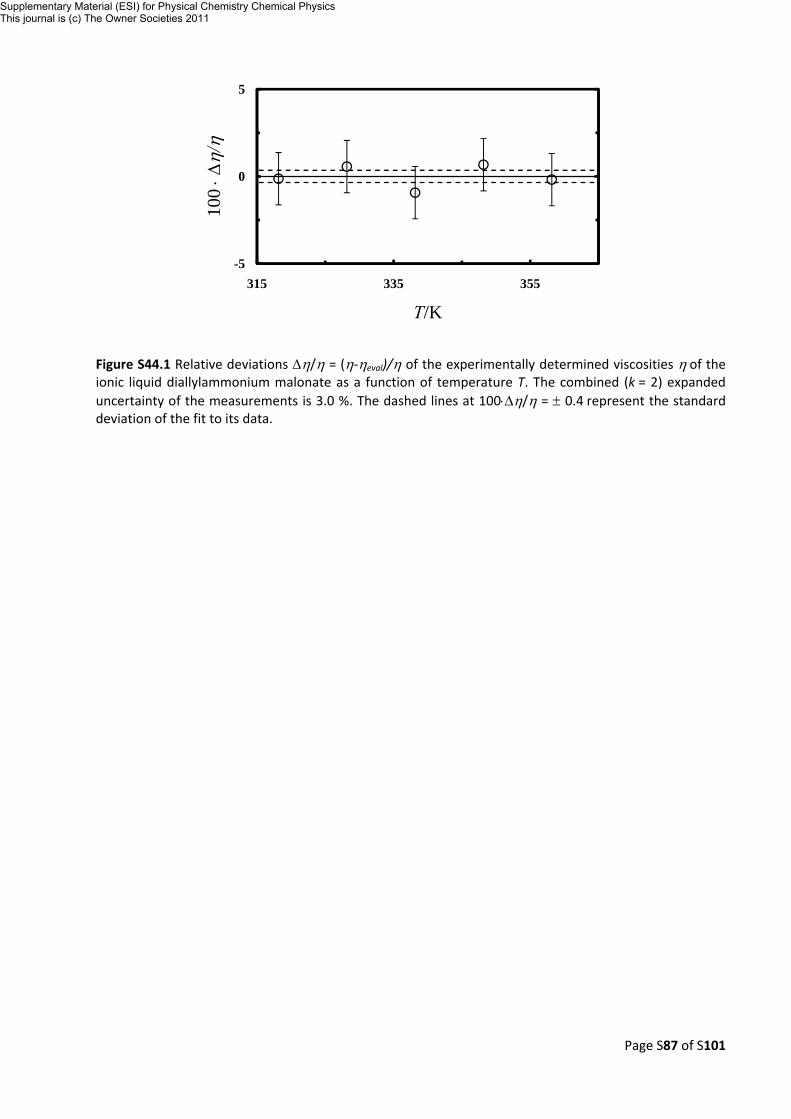
Page S87 of S101
Figure S44.1 Relative deviations Δη/η = (η‐ηeval)/η of the experimentally determined viscosities η of the ionic liquid diallylammonium malonate as a function of temperature T. The combined (k = 2) expanded uncertainty of the measurements is 3.0 %. The dashed lines at 100⋅Δη/η = ± 0.4 represent the standard deviation of the fit to its data.
-5
0
5
-5
0
5
315 335 355
100 ⋅Δ
η/η
T/K
Supplementary Material (ESI) for Physical Chemistry Chemical PhysicsThis journal is (c) The Owner Societies 2011
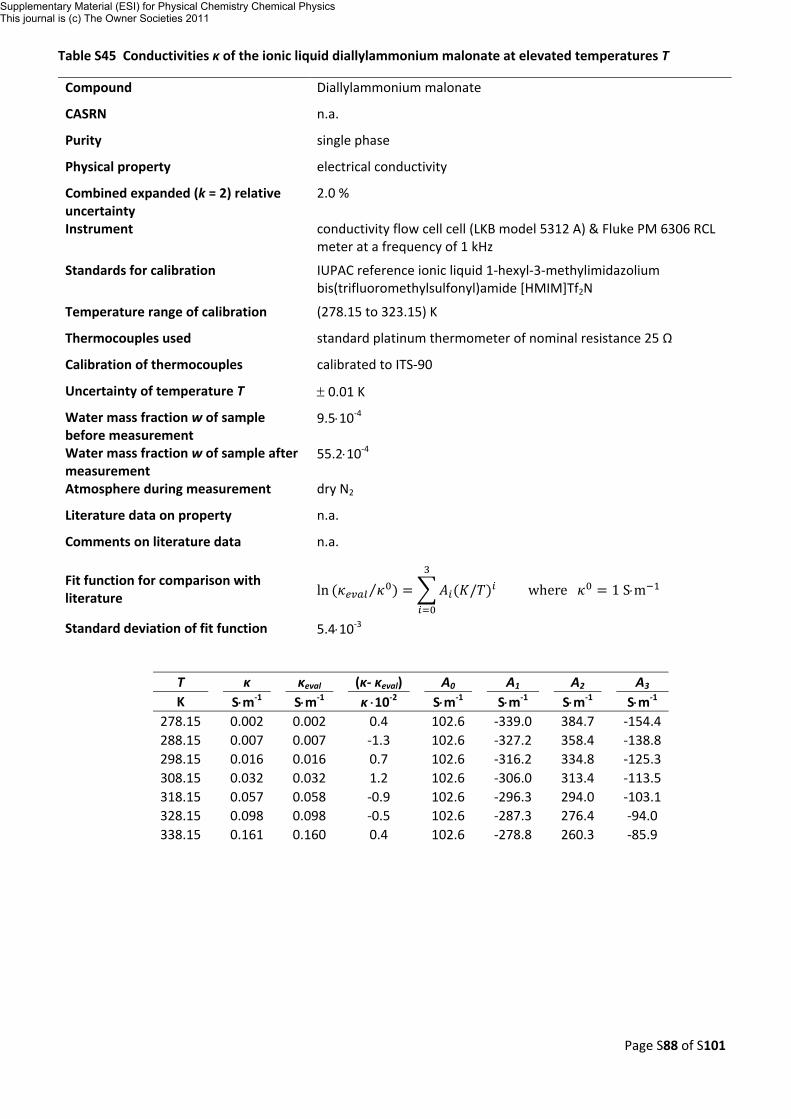
Page S88 of S101
Table S45 Conductivities κ of the ionic liquid diallylammonium malonate at elevated temperatures T
Compound Diallylammonium malonate
CASRN n.a.
Purity single phase
Physical property electrical conductivity
Combined expanded (k = 2) relative uncertainty
2.0 %
Instrument conductivity flow cell cell (LKB model 5312 A) & Fluke PM 6306 RCL meter at a frequency of 1 kHz
Standards for calibration IUPAC reference ionic liquid 1‐hexyl‐3‐methylimidazolium bis(trifluoromethylsulfonyl)amide [HMIM]Tf2N
Temperature range of calibration (278.15 to 323.15) K
Thermocouples used standard platinum thermometer of nominal resistance 25 Ω
Calibration of thermocouples calibrated to ITS‐90
Uncertainty of temperature T ± 0.01 K
Water mass fraction w of sample before measurement
9.5⋅10‐4
Water mass fraction w of sample after measurement
55.2⋅10‐4
Atmosphere during measurement dry N2
Literature data on property n.a.
Comments on literature data n.a.
Fit function for comparison with literature ln ⁄ / where 1 S⋅m
Standard deviation of fit function 5.4⋅10‐3
T
κ
κeval (κ‐ κeval) A0 A1 A2
A3 K S⋅m‐1 S⋅m‐1 κ ⋅10‐2 S⋅m‐1 S⋅m‐1 S⋅m‐1 S⋅m‐1
278.15 0.002 0.002
0.4 102.6 ‐339.0 384.7
‐154.4288.15 0.007 0.007 ‐1.3 102.6 ‐327.2 358.4 ‐138.8298.15 0.016 0.016 0.7 102.6 ‐316.2 334.8 ‐125.3308.15 0.032 0.032 1.2 102.6 ‐306.0 313.4 ‐113.5318.15 0.057 0.058 ‐0.9 102.6 ‐296.3 294.0 ‐103.1328.15 0.098 0.098 ‐0.5 102.6 ‐287.3 276.4 ‐94.0 338.15 0.161 0.160 0.4 102.6 ‐278.8 260.3 ‐85.9
Supplementary Material (ESI) for Physical Chemistry Chemical PhysicsThis journal is (c) The Owner Societies 2011
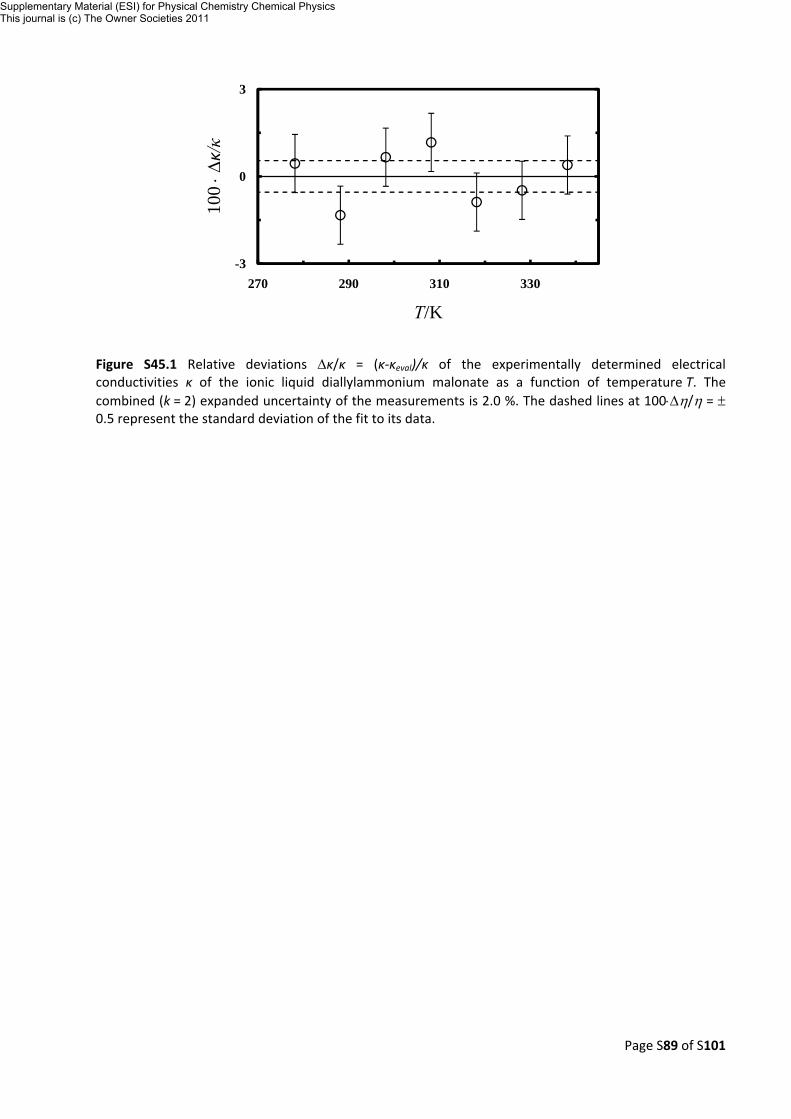
Page S89 of S101
Figure S45.1 Relative deviations Δκ/κ = (κ‐κeval)/κ of the experimentally determined electrical conductivities κ of the ionic liquid diallylammonium malonate as a function of temperature T. The combined (k = 2) expanded uncertainty of the measurements is 2.0 %. The dashed lines at 100⋅Δη/η = ± 0.5 represent the standard deviation of the fit to its data.
-3
0
3
-3
0
3
270 290 310 330
100 ⋅Δ
κ/κ
T/K
Supplementary Material (ESI) for Physical Chemistry Chemical PhysicsThis journal is (c) The Owner Societies 2011
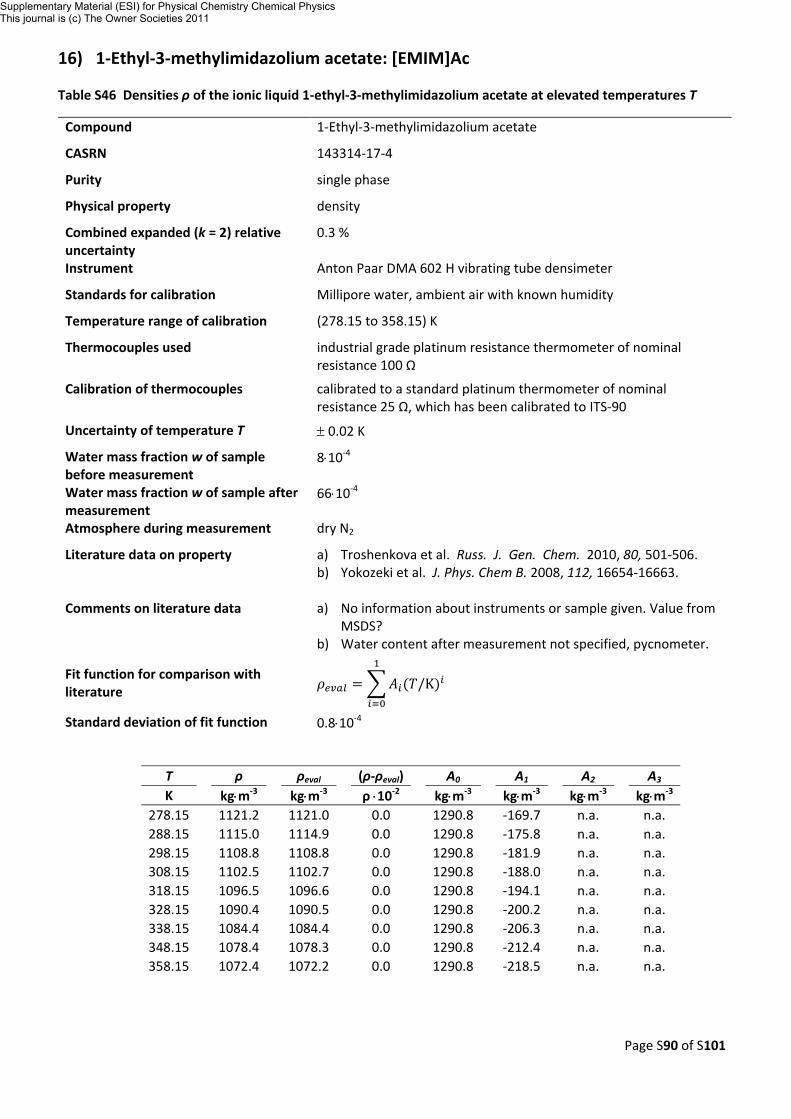
Page S90 of S101
16) 1‐Ethyl‐3‐methylimidazolium acetate: [EMIM]Ac
Table S46 Densities ρ of the ionic liquid 1‐ethyl‐3‐methylimidazolium acetate at elevated temperatures T
Compound 1‐Ethyl‐3‐methylimidazolium acetate
CASRN 143314‐17‐4
Purity single phase
Physical property density
Combined expanded (k = 2) relative uncertainty
0.3 %
Instrument Anton Paar DMA 602 H vibrating tube densimeter
Standards for calibration Millipore water, ambient air with known humidity
Temperature range of calibration (278.15 to 358.15) K
Thermocouples used industrial grade platinum resistance thermometer of nominal resistance 100 Ω
Calibration of thermocouples calibrated to a standard platinum thermometer of nominal resistance 25 Ω, which has been calibrated to ITS‐90
Uncertainty of temperature T ± 0.02 K
Water mass fraction w of sample before measurement
8⋅10‐4
Water mass fraction w of sample after measurement
66⋅10‐4
Atmosphere during measurement dry N2
Literature data on property a) Troshenkova et al. Russ. J. Gen. Chem. 2010, 80, 501‐506. b) Yokozeki et al. J. Phys. Chem B. 2008, 112, 16654‐16663.
Comments on literature data a) No information about instruments or sample given. Value from
MSDS? b) Water content after measurement not specified, pycnometer.
Fit function for comparison with literature /K
Standard deviation of fit function 0.8⋅10‐4
T
ρ
ρeval (ρ‐ρeval) A0 A1 A2
A3 K kg⋅m‐3 kg⋅m‐3 ρ ⋅10‐2 kg⋅m‐3 kg⋅m‐3 kg⋅m‐3 kg⋅m‐3
278.15 1121.2 1121.0
0.0 1290.8 ‐169.7 n.a.
n.a. 288.15 1115.0 1114.9 0.0 1290.8 ‐175.8 n.a. n.a. 298.15 1108.8 1108.8 0.0 1290.8 ‐181.9 n.a. n.a. 308.15 1102.5 1102.7 0.0 1290.8 ‐188.0 n.a. n.a. 318.15 1096.5 1096.6 0.0 1290.8 ‐194.1 n.a. n.a. 328.15 1090.4 1090.5 0.0 1290.8 ‐200.2 n.a. n.a. 338.15 1084.4 1084.4 0.0 1290.8 ‐206.3 n.a. n.a. 348.15 1078.4 1078.3 0.0 1290.8 ‐212.4 n.a. n.a. 358.15 1072.4 1072.2 0.0 1290.8 ‐218.5 n.a. n.a.
Supplementary Material (ESI) for Physical Chemistry Chemical PhysicsThis journal is (c) The Owner Societies 2011
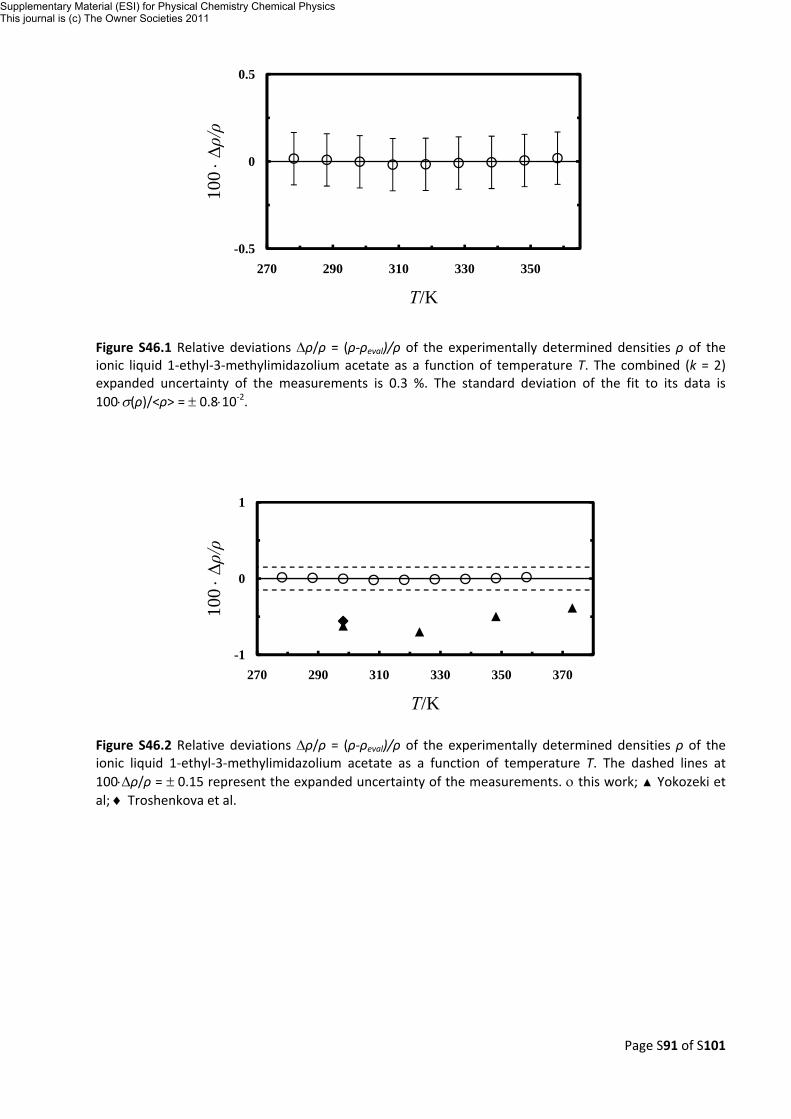
Page S91 of S101
Figure S46.1 Relative deviations Δρ/ρ = (ρ‐ρeval)/ρ of the experimentally determined densities ρ of the ionic liquid 1‐ethyl‐3‐methylimidazolium acetate as a function of temperature T. The combined (k = 2) expanded uncertainty of the measurements is 0.3 %. The standard deviation of the fit to its data is 100⋅σ(ρ)/<ρ> = ± 0.8⋅10‐2.
Figure S46.2 Relative deviations Δρ/ρ = (ρ‐ρeval)/ρ of the experimentally determined densities ρ of the ionic liquid 1‐ethyl‐3‐methylimidazolium acetate as a function of temperature T. The dashed lines at 100⋅Δρ/ρ = ± 0.15 represent the expanded uncertainty of the measurements. ο this work; ▲ Yokozeki et al; ♦ Troshenkova et al.
-0.04
0
0.04
-0.5
0
0.5
270 290 310 330 350
100 ⋅Δρ/ρ
T/K
-1
0
1
-1
0
1
270 290 310 330 350 370
100 ⋅Δρ/ρ
T/K
Supplementary Material (ESI) for Physical Chemistry Chemical PhysicsThis journal is (c) The Owner Societies 2011
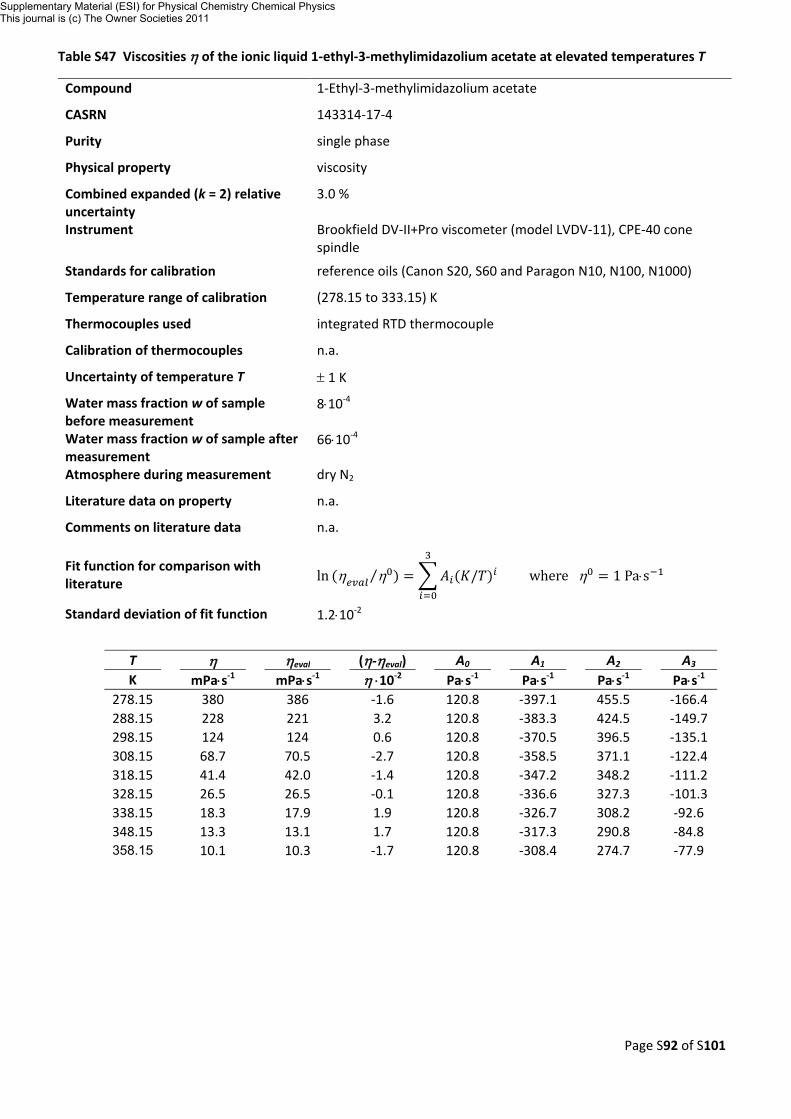
Page S92 of S101
Table S47 Viscosities η of the ionic liquid 1‐ethyl‐3‐methylimidazolium acetate at elevated temperatures T
Compound 1‐Ethyl‐3‐methylimidazolium acetate
CASRN 143314‐17‐4
Purity single phase
Physical property viscosity
Combined expanded (k = 2) relative uncertainty
3.0 %
Instrument Brookfield DV‐II+Pro viscometer (model LVDV‐11), CPE‐40 cone spindle
Standards for calibration reference oils (Canon S20, S60 and Paragon N10, N100, N1000)
Temperature range of calibration (278.15 to 333.15) K
Thermocouples used integrated RTD thermocouple
Calibration of thermocouples n.a.
Uncertainty of temperature T ± 1 K
Water mass fraction w of sample before measurement
8⋅10‐4
Water mass fraction w of sample after measurement
66⋅10‐4
Atmosphere during measurement dry N2
Literature data on property n.a.
Comments on literature data n.a.
Fit function for comparison with literature ln η η⁄ / where η 1 Pa⋅s
Standard deviation of fit function 1.2⋅10‐2
T
η
ηeval (η‐ηeval) A0 A1 A2
A3 K mPa⋅s‐1 mPa⋅s‐1 η ⋅10‐2 Pa⋅s‐1 Pa⋅s‐1 Pa⋅s‐1 Pa⋅s‐1
278.15 380 386
‐1.6 120.8 ‐397.1 455.5
‐166.4 288.15 228 221 3.2 120.8 ‐383.3 424.5 ‐149.7 298.15 124 124 0.6 120.8 ‐370.5 396.5 ‐135.1 308.15 68.7 70.5 ‐2.7 120.8 ‐358.5 371.1 ‐122.4 318.15 41.4 42.0 ‐1.4 120.8 ‐347.2 348.2 ‐111.2 328.15 26.5 26.5 ‐0.1 120.8 ‐336.6 327.3 ‐101.3 338.15 18.3 17.9 1.9 120.8 ‐326.7 308.2 ‐92.6 348.15 13.3 13.1 1.7 120.8 ‐317.3 290.8 ‐84.8 358.15 10.1 10.3 ‐1.7 120.8 ‐308.4 274.7 ‐77.9
Supplementary Material (ESI) for Physical Chemistry Chemical PhysicsThis journal is (c) The Owner Societies 2011

Page S93 of S101
Figure S47.1 Relative deviations Δη/η = (η‐ηeval)/η of the experimentally determined viscosities η of the ionic liquid 1‐ethyl‐3‐methylimidazolium acetate as a function of temperature T. The combined (k = 2) expanded uncertainty of the measurements is 3.0 %. The dashed lines at 100⋅Δη/η = ± 1.2 represent the standard deviation of the fit to its data.
-6
0
6
-6
0
6
270 290 310 330 350
100 ⋅Δ
η/η
T/K
Supplementary Material (ESI) for Physical Chemistry Chemical PhysicsThis journal is (c) The Owner Societies 2011
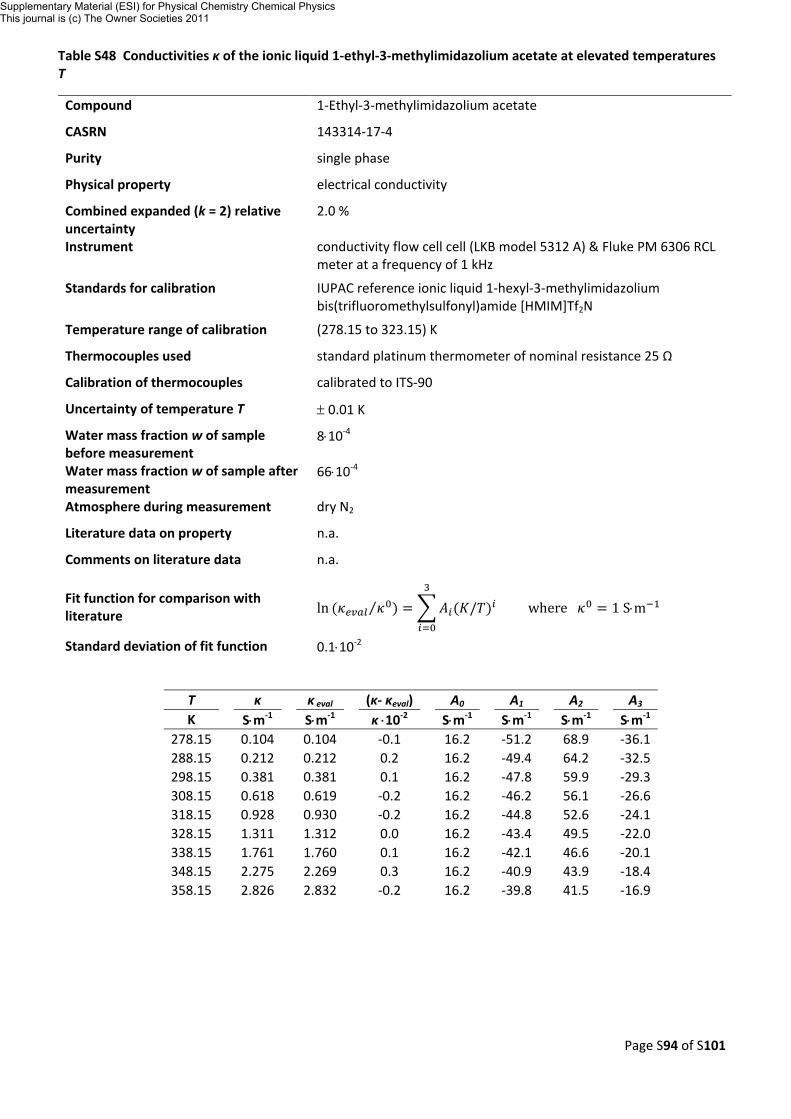
Page S94 of S101
Table S48 Conductivities κ of the ionic liquid 1‐ethyl‐3‐methylimidazolium acetate at elevated temperatures T
Compound 1‐Ethyl‐3‐methylimidazolium acetate
CASRN 143314‐17‐4
Purity single phase
Physical property electrical conductivity
Combined expanded (k = 2) relative uncertainty
2.0 %
Instrument conductivity flow cell cell (LKB model 5312 A) & Fluke PM 6306 RCL meter at a frequency of 1 kHz
Standards for calibration IUPAC reference ionic liquid 1‐hexyl‐3‐methylimidazolium bis(trifluoromethylsulfonyl)amide [HMIM]Tf2N
Temperature range of calibration (278.15 to 323.15) K
Thermocouples used standard platinum thermometer of nominal resistance 25 Ω
Calibration of thermocouples calibrated to ITS‐90
Uncertainty of temperature T ± 0.01 K
Water mass fraction w of sample before measurement
8⋅10‐4
Water mass fraction w of sample after measurement
66⋅10‐4
Atmosphere during measurement dry N2
Literature data on property n.a.
Comments on literature data n.a.
Fit function for comparison with literature ln ⁄ / where 1 S⋅m
Standard deviation of fit function 0.1⋅10‐2
T
κ
κ eval (κ‐ κeval) A0 A1 A2
A3 K S⋅m‐1 S⋅m‐1 κ ⋅10‐2 S⋅m‐1 S⋅m‐1 S⋅m‐1 S⋅m‐1
278.15 0.104 0.104
‐0.1 16.2 ‐51.2 68.9
‐36.1 288.15 0.212 0.212 0.2 16.2 ‐49.4 64.2 ‐32.5 298.15 0.381 0.381 0.1 16.2 ‐47.8 59.9 ‐29.3 308.15 0.618 0.619 ‐0.2 16.2 ‐46.2 56.1 ‐26.6 318.15 0.928 0.930 ‐0.2 16.2 ‐44.8 52.6 ‐24.1 328.15 1.311 1.312 0.0 16.2 ‐43.4 49.5 ‐22.0 338.15 1.761 1.760 0.1 16.2 ‐42.1 46.6 ‐20.1 348.15 2.275 2.269 0.3 16.2 ‐40.9 43.9 ‐18.4 358.15 2.826 2.832 ‐0.2 16.2 ‐39.8 41.5 ‐16.9
Supplementary Material (ESI) for Physical Chemistry Chemical PhysicsThis journal is (c) The Owner Societies 2011
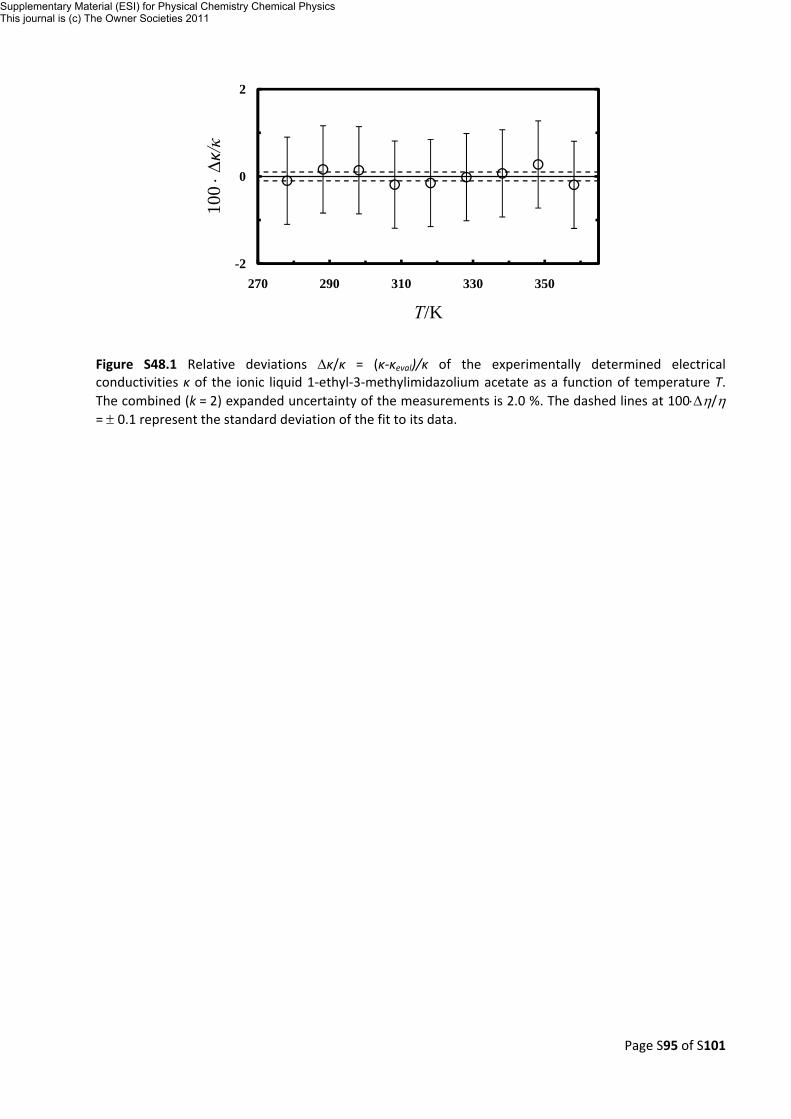
Page S95 of S101
Figure S48.1 Relative deviations Δκ/κ = (κ‐κeval)/κ of the experimentally determined electrical conductivities κ of the ionic liquid 1‐ethyl‐3‐methylimidazolium acetate as a function of temperature T. The combined (k = 2) expanded uncertainty of the measurements is 2.0 %. The dashed lines at 100⋅Δη/η = ± 0.1 represent the standard deviation of the fit to its data.
-5
0
5
-2
0
2
270 290 310 330 350
100 ⋅Δ
κ/κ
T/K
Supplementary Material (ESI) for Physical Chemistry Chemical PhysicsThis journal is (c) The Owner Societies 2011
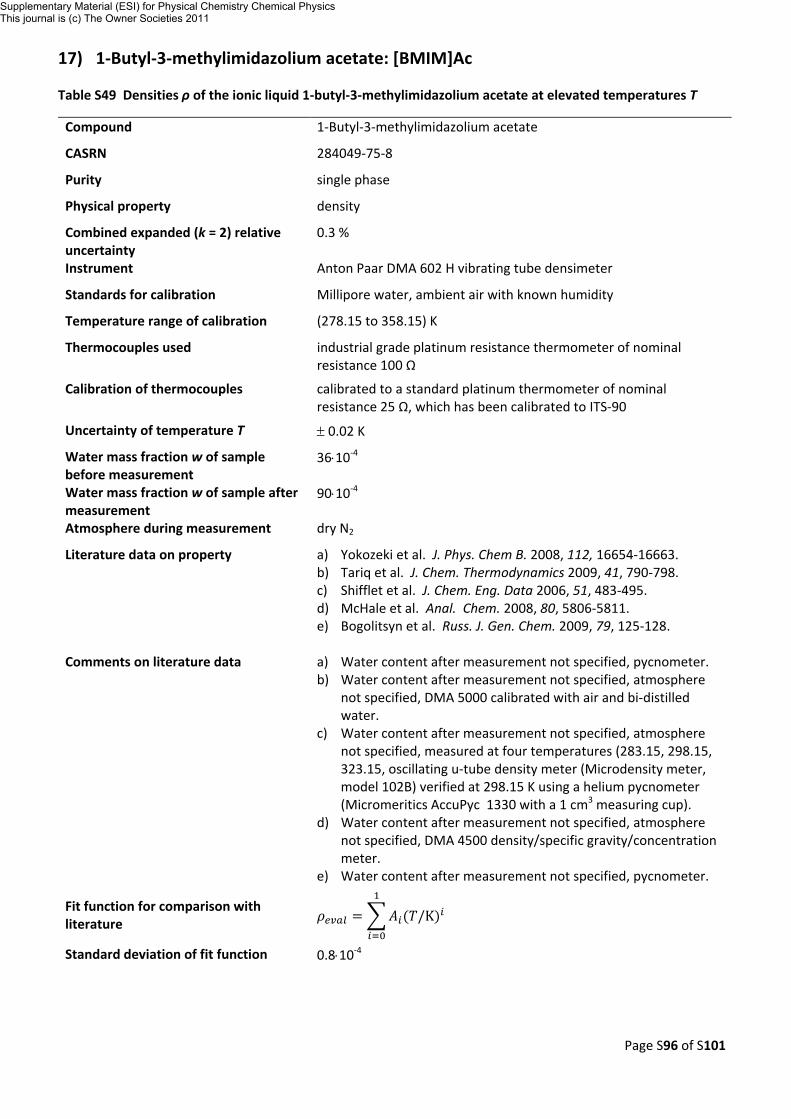
Page S96 of S101
17) 1‐Butyl‐3‐methylimidazolium acetate: [BMIM]Ac
Table S49 Densities ρ of the ionic liquid 1‐butyl‐3‐methylimidazolium acetate at elevated temperatures T
Compound 1‐Butyl‐3‐methylimidazolium acetate
CASRN 284049‐75‐8
Purity single phase
Physical property density
Combined expanded (k = 2) relative uncertainty
0.3 %
Instrument Anton Paar DMA 602 H vibrating tube densimeter
Standards for calibration Millipore water, ambient air with known humidity
Temperature range of calibration (278.15 to 358.15) K
Thermocouples used industrial grade platinum resistance thermometer of nominal resistance 100 Ω
Calibration of thermocouples calibrated to a standard platinum thermometer of nominal resistance 25 Ω, which has been calibrated to ITS‐90
Uncertainty of temperature T ± 0.02 K
Water mass fraction w of sample before measurement
36⋅10‐4
Water mass fraction w of sample after measurement
90⋅10‐4
Atmosphere during measurement dry N2
Literature data on property a) Yokozeki et al. J. Phys. Chem B. 2008, 112, 16654‐16663. b) Tariq et al. J. Chem. Thermodynamics 2009, 41, 790‐798. c) Shifflet et al. J. Chem. Eng. Data 2006, 51, 483‐495. d) McHale et al. Anal. Chem. 2008, 80, 5806‐5811. e) Bogolitsyn et al. Russ. J. Gen. Chem. 2009, 79, 125‐128.
Comments on literature data a) Water content after measurement not specified, pycnometer.
b) Water content after measurement not specified, atmosphere not specified, DMA 5000 calibrated with air and bi‐distilled water.
c) Water content after measurement not specified, atmosphere not specified, measured at four temperatures (283.15, 298.15, 323.15, oscillating u‐tube density meter (Microdensity meter, model 102B) verified at 298.15 K using a helium pycnometer (Micromeritics AccuPyc 1330 with a 1 cm3 measuring cup).
d) Water content after measurement not specified, atmosphere not specified, DMA 4500 density/specific gravity/concentration meter.
e) Water content after measurement not specified, pycnometer.
Fit function for comparison with literature /K
Standard deviation of fit function 0.8⋅10‐4
Supplementary Material (ESI) for Physical Chemistry Chemical PhysicsThis journal is (c) The Owner Societies 2011
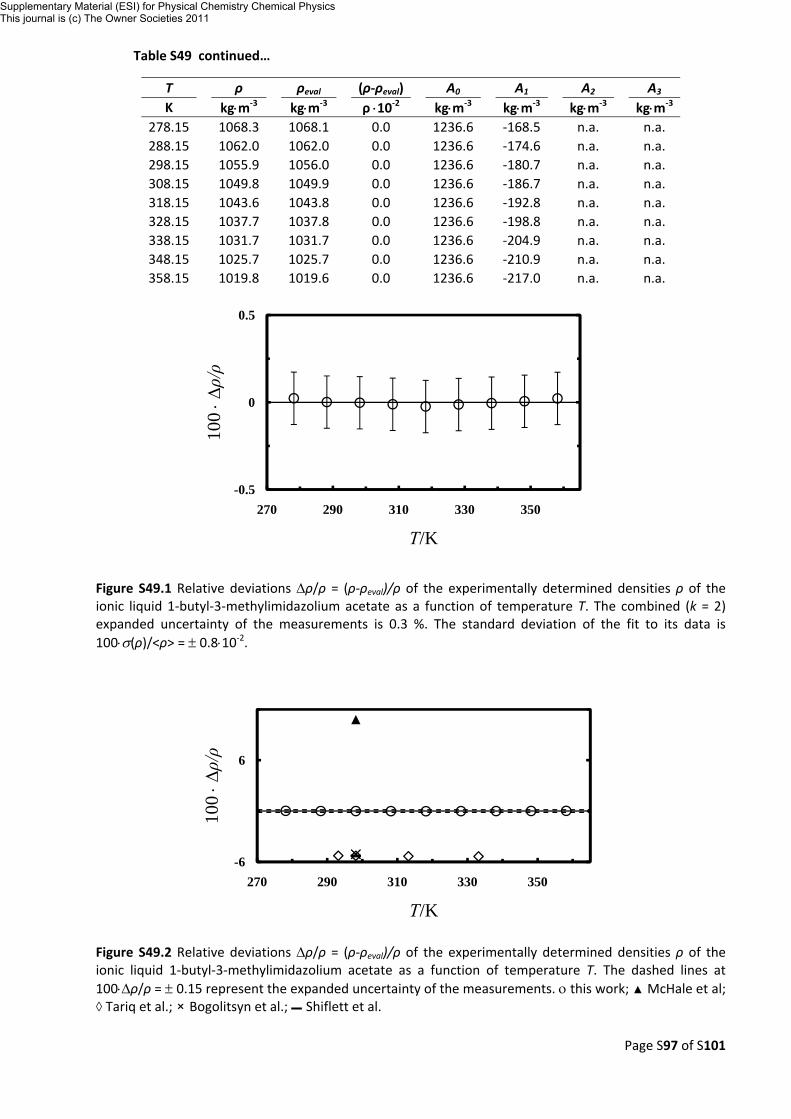
Page S97 of S101
Table S49 continued…
T
ρ
ρeval (ρ‐ρeval) A0 A1 A2
A3 K kg⋅m‐3 kg⋅m‐3 ρ ⋅10‐2 kg⋅m‐3 kg⋅m‐3 kg⋅m‐3 kg⋅m‐3
278.15 1068.3 1068.1
0.0 1236.6 ‐168.5 n.a.
n.a. 288.15 1062.0 1062.0 0.0 1236.6 ‐174.6 n.a. n.a. 298.15 1055.9 1056.0 0.0 1236.6 ‐180.7 n.a. n.a. 308.15 1049.8 1049.9 0.0 1236.6 ‐186.7 n.a. n.a. 318.15 1043.6 1043.8 0.0 1236.6 ‐192.8 n.a. n.a. 328.15 1037.7 1037.8 0.0 1236.6 ‐198.8 n.a. n.a. 338.15 1031.7 1031.7 0.0 1236.6 ‐204.9 n.a. n.a. 348.15 1025.7 1025.7 0.0 1236.6 ‐210.9 n.a. n.a. 358.15 1019.8 1019.6 0.0 1236.6 ‐217.0 n.a. n.a.
Figure S49.1 Relative deviations Δρ/ρ = (ρ‐ρeval)/ρ of the experimentally determined densities ρ of the ionic liquid 1‐butyl‐3‐methylimidazolium acetate as a function of temperature T. The combined (k = 2) expanded uncertainty of the measurements is 0.3 %. The standard deviation of the fit to its data is 100⋅σ(ρ)/<ρ> = ± 0.8⋅10‐2.
Figure S49.2 Relative deviations Δρ/ρ = (ρ‐ρeval)/ρ of the experimentally determined densities ρ of the ionic liquid 1‐butyl‐3‐methylimidazolium acetate as a function of temperature T. The dashed lines at 100⋅Δρ/ρ = ± 0.15 represent the expanded uncertainty of the measurements. ο this work; ▲ McHale et al; ◊ Tariq et al.; × Bogolitsyn et al.; ▬ Shiflett et al.
-0.04
0
0.04
-0.5
0
0.5
270 290 310 330 350
100 ⋅Δρ/ρ
T/K
-6
6
-6
6
270 290 310 330 350
100 ⋅Δρ/ρ
T/K
Supplementary Material (ESI) for Physical Chemistry Chemical PhysicsThis journal is (c) The Owner Societies 2011
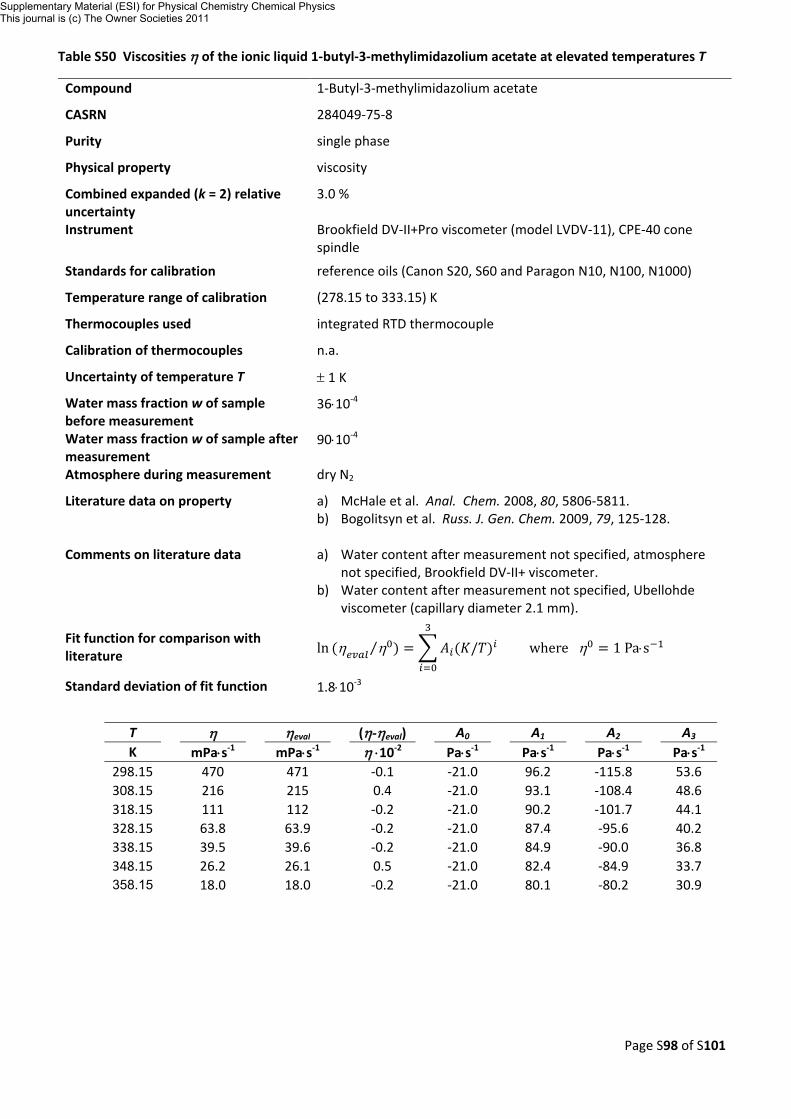
Page S98 of S101
Table S50 Viscosities η of the ionic liquid 1‐butyl‐3‐methylimidazolium acetate at elevated temperatures T
Compound 1‐Butyl‐3‐methylimidazolium acetate
CASRN 284049‐75‐8
Purity single phase
Physical property viscosity
Combined expanded (k = 2) relative uncertainty
3.0 %
Instrument Brookfield DV‐II+Pro viscometer (model LVDV‐11), CPE‐40 cone spindle
Standards for calibration reference oils (Canon S20, S60 and Paragon N10, N100, N1000)
Temperature range of calibration (278.15 to 333.15) K
Thermocouples used integrated RTD thermocouple
Calibration of thermocouples n.a.
Uncertainty of temperature T ± 1 K
Water mass fraction w of sample before measurement
36⋅10‐4
Water mass fraction w of sample after measurement
90⋅10‐4
Atmosphere during measurement dry N2
Literature data on property a) McHale et al. Anal. Chem. 2008, 80, 5806‐5811. b) Bogolitsyn et al. Russ. J. Gen. Chem. 2009, 79, 125‐128.
Comments on literature data a) Water content after measurement not specified, atmosphere
not specified, Brookfield DV‐II+ viscometer. b) Water content after measurement not specified, Ubellohde
viscometer (capillary diameter 2.1 mm).
Fit function for comparison with literature ln η η⁄ / where η 1 Pa⋅s
Standard deviation of fit function 1.8⋅10‐3
T
η
ηeval (η‐ηeval) A0 A1 A2
A3 K mPa⋅s‐1 mPa⋅s‐1 η ⋅10‐2 Pa⋅s‐1 Pa⋅s‐1 Pa⋅s‐1 Pa⋅s‐1
298.15 470 471
‐0.1 ‐21.0 96.2 ‐115.8
53.6 308.15 216 215 0.4 ‐21.0 93.1 ‐108.4 48.6 318.15 111 112 ‐0.2 ‐21.0 90.2 ‐101.7 44.1 328.15 63.8 63.9 ‐0.2 ‐21.0 87.4 ‐95.6 40.2 338.15 39.5 39.6 ‐0.2 ‐21.0 84.9 ‐90.0 36.8 348.15 26.2 26.1 0.5 ‐21.0 82.4 ‐84.9 33.7 358.15 18.0 18.0 ‐0.2 ‐21.0 80.1 ‐80.2 30.9
Supplementary Material (ESI) for Physical Chemistry Chemical PhysicsThis journal is (c) The Owner Societies 2011
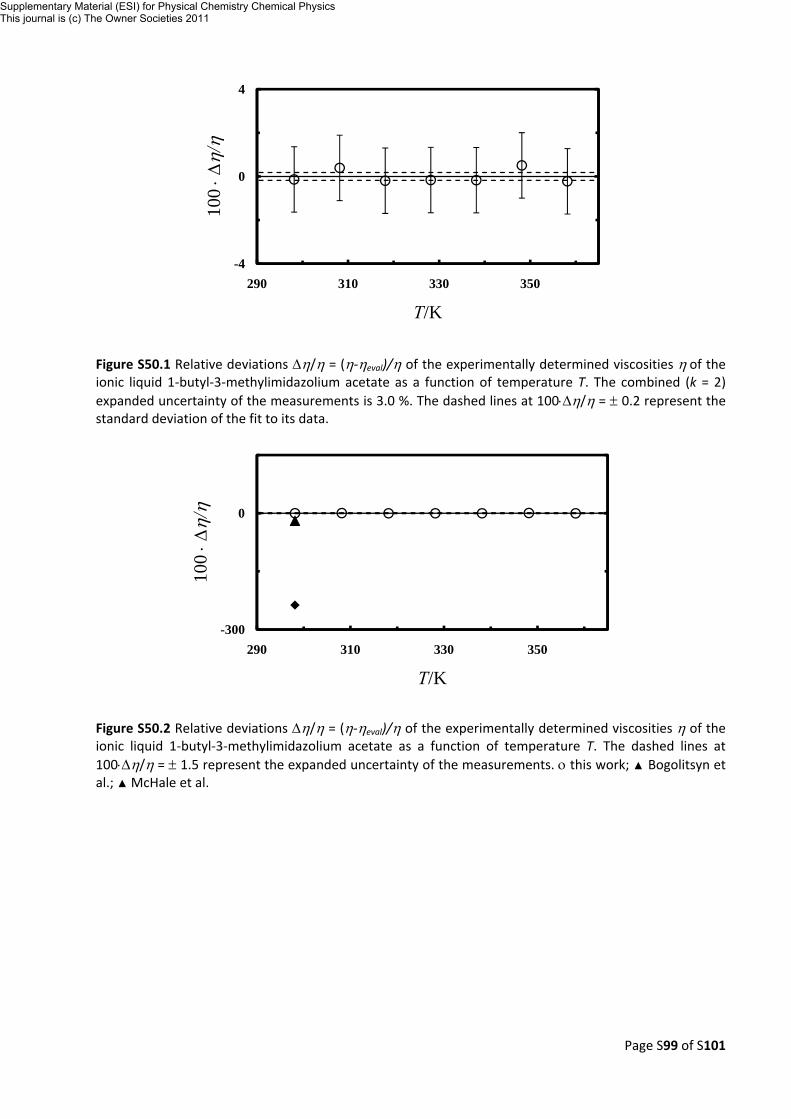
Page S99 of S101
Figure S50.1 Relative deviations Δη/η = (η‐ηeval)/η of the experimentally determined viscosities η of the ionic liquid 1‐butyl‐3‐methylimidazolium acetate as a function of temperature T. The combined (k = 2) expanded uncertainty of the measurements is 3.0 %. The dashed lines at 100⋅Δη/η = ± 0.2 represent the standard deviation of the fit to its data.
Figure S50.2 Relative deviations Δη/η = (η‐ηeval)/η of the experimentally determined viscosities η of the ionic liquid 1‐butyl‐3‐methylimidazolium acetate as a function of temperature T. The dashed lines at 100⋅Δη/η = ± 1.5 represent the expanded uncertainty of the measurements. ο this work; ▲ Bogolitsyn et al.; ▲ McHale et al.
-4
0
4
-4
0
4
290 310 330 350
100 ⋅Δ
η/η
T/K
-300
0
-300
0
290 310 330 350
100 ⋅Δ
η/η
T/K
Supplementary Material (ESI) for Physical Chemistry Chemical PhysicsThis journal is (c) The Owner Societies 2011
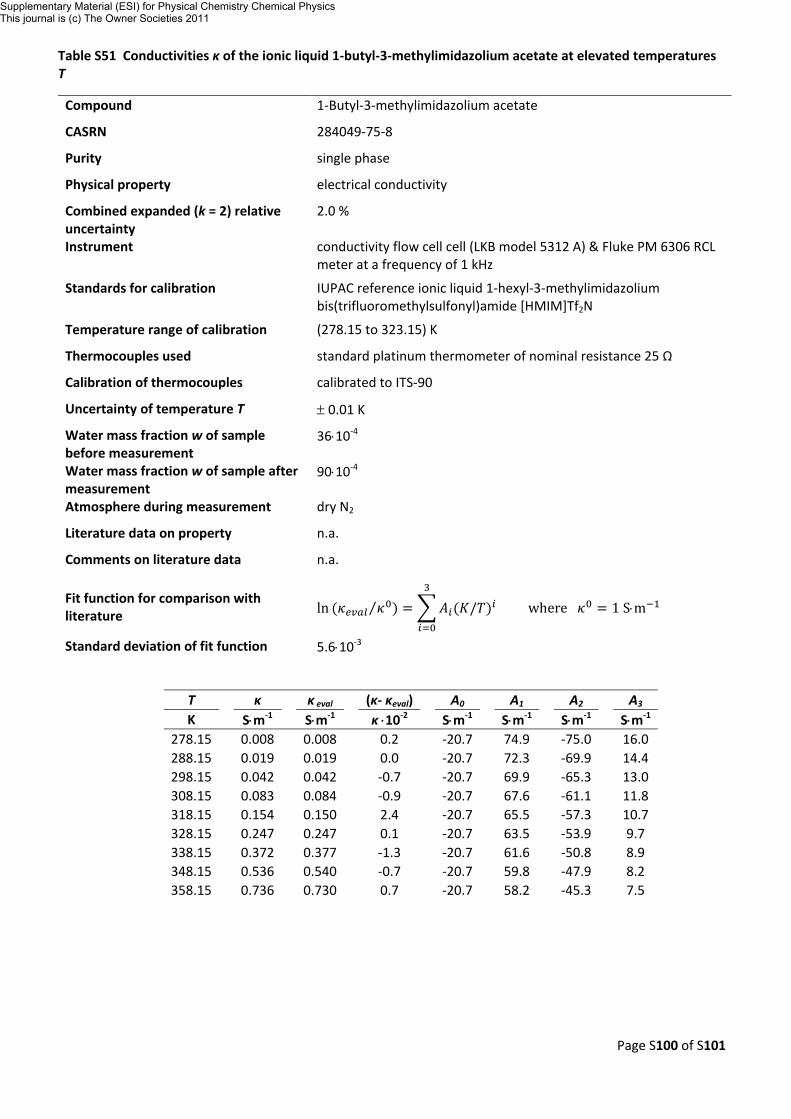
Page S100 of S101
Table S51 Conductivities κ of the ionic liquid 1‐butyl‐3‐methylimidazolium acetate at elevated temperatures T
Compound 1‐Butyl‐3‐methylimidazolium acetate
CASRN 284049‐75‐8
Purity single phase
Physical property electrical conductivity
Combined expanded (k = 2) relative uncertainty
2.0 %
Instrument conductivity flow cell cell (LKB model 5312 A) & Fluke PM 6306 RCL meter at a frequency of 1 kHz
Standards for calibration IUPAC reference ionic liquid 1‐hexyl‐3‐methylimidazolium bis(trifluoromethylsulfonyl)amide [HMIM]Tf2N
Temperature range of calibration (278.15 to 323.15) K
Thermocouples used standard platinum thermometer of nominal resistance 25 Ω
Calibration of thermocouples calibrated to ITS‐90
Uncertainty of temperature T ± 0.01 K
Water mass fraction w of sample before measurement
36⋅10‐4
Water mass fraction w of sample after measurement
90⋅10‐4
Atmosphere during measurement dry N2
Literature data on property n.a.
Comments on literature data n.a.
Fit function for comparison with literature ln ⁄ / where 1 S⋅m
Standard deviation of fit function 5.6⋅10‐3
T
κ
κ eval (κ‐ κeval) A0 A1 A2
A3 K S⋅m‐1 S⋅m‐1 κ ⋅10‐2 S⋅m‐1 S⋅m‐1 S⋅m‐1 S⋅m‐1
278.15 0.008 0.008
0.2 ‐20.7 74.9 ‐75.0
16.0 288.15 0.019 0.019 0.0 ‐20.7 72.3 ‐69.9 14.4 298.15 0.042 0.042 ‐0.7 ‐20.7 69.9 ‐65.3 13.0 308.15 0.083 0.084 ‐0.9 ‐20.7 67.6 ‐61.1 11.8 318.15 0.154 0.150 2.4 ‐20.7 65.5 ‐57.3 10.7 328.15 0.247 0.247 0.1 ‐20.7 63.5 ‐53.9 9.7 338.15 0.372 0.377 ‐1.3 ‐20.7 61.6 ‐50.8 8.9 348.15 0.536 0.540 ‐0.7 ‐20.7 59.8 ‐47.9 8.2 358.15 0.736 0.730 0.7 ‐20.7 58.2 ‐45.3 7.5
Supplementary Material (ESI) for Physical Chemistry Chemical PhysicsThis journal is (c) The Owner Societies 2011

Page S101 of S101
Figure S51.1 Relative deviations Δκ/κ = (κ‐κeval)/κ of the experimentally determined electrical conductivities κ of the ionic liquid 1‐butyl‐3‐methylimidazolium acetate as a function of temperature T. The combined (k = 2) expanded uncertainty of the measurements is 2.0 %. The dashed lines at 100⋅Δη/η = ± 0.6 represent the standard deviation of the fit to its data.
-4
0
4
-4
0
4
270 290 310 330 350
100 ⋅Δ
κ/κ
T/K
Supplementary Material (ESI) for Physical Chemistry Chemical PhysicsThis journal is (c) The Owner Societies 2011


![Index [assets.cambridge.org]assets.cambridge.org/.../index/9781107011687_index.pdf · Index Aβ see amyloid-β ABILHAND questionnaire 591 abundance, in motor system 602–5 acarbose](https://static.fdocument.org/doc/165x107/5f031f417e708231d407a572/index-index-a-see-amyloid-abilhand-questionnaire-591-abundance-in-motor.jpg)


![Index [application.wiley-vch.de] · 1388 Index aldol condensation 477 – ultrasonic conditions 602 aldol cyclization 484 ... – Michael–aldol–dehydration 64 – Mukaiyama 247,](https://static.fdocument.org/doc/165x107/5f07e4047e708231d41f4542/index-1388-index-aldol-condensation-477-a-ultrasonic-conditions-602-aldol.jpg)