Electronic supplementary information (ESI) - rsc. · PDF fileand penicillin / streptomycin...
39
Electronic supplementary information (ESI) Injectable hyperbranched poly(β-amino ester) hydrogels with on-demand degradation profile to match wound healing process Qian Xu a , Linru Guo b , Sigen A a , Yongsheng Gao a , Dezhong Zhou a , Udo Greiser a , Jack Creagh-Flynn a , Hong Zhang a , Yixiao Dong a , Lara Cutlar a , Fagang Wang c , Wenguang Liu b , Wei Wang b,a & Wenxin Wang a,b a Charles Institute of Dermatology, School of Medicine, University College Dublin (UCD), Dublin 4, Ireland. b Department of Polymer Materials, School of Materials Science and Engineering, Tianjin University, Tianjin 300350, China. c Department of Burn & Plastic Surgery, Shandong Provincial Hospital Affiliated to Shandong University, Jinan 250001, China. Corresponding authors: Dr. Wei Wang, email: [email protected]; Dr. Wenxin Wang, email: [email protected]. This supporting information file includes: Materials and Methods Supplementary Tables 1 and 2 Supplementary Figures 1 to 28 Supplementary movie 1: A movie showing the performance of injectable 700- EDA/HA-SH hydrogel into wound site and the gelation occurs in less than 1 min. Electronic Supplementary Material (ESI) for Chemical Science. This journal is © The Royal Society of Chemistry 2018
Transcript of Electronic supplementary information (ESI) - rsc. · PDF fileand penicillin / streptomycin...
Electronic supplementary information (ESI)
Injectable hyperbranched poly(β-amino ester) hydrogels with on-demand degradation profile to match wound healing process
Qian Xua, Linru Guob, Sigen Aa, Yongsheng Gaoa, Dezhong Zhoua, Udo Greisera,
Jack Creagh-Flynna, Hong Zhanga, Yixiao Donga, Lara Cutlara, Fagang Wangc,
Wenguang Liub, Wei Wangb,a & Wenxin Wanga,b
a Charles Institute of Dermatology, School of Medicine, University College Dublin
(UCD), Dublin 4, Ireland.
b Department of Polymer Materials, School of Materials Science and Engineering,
Tianjin University, Tianjin 300350, China.
c Department of Burn & Plastic Surgery, Shandong Provincial Hospital Affiliated to
Shandong University, Jinan 250001, China.
Corresponding authors:
Dr. Wei Wang, email: [email protected];
Dr. Wenxin Wang, email: [email protected].
This supporting information file includes:
Materials and Methods
Supplementary Tables 1 and 2
Supplementary Figures 1 to 28
Supplementary movie 1: A movie showing the performance of injectable 700-
EDA/HA-SH hydrogel into wound site and the gelation occurs in less than 1 min.
Electronic Supplementary Material (ESI) for Chemical Science.This journal is © The Royal Society of Chemistry 2018
Materials and Methods
Materials
Poly(ethylene glycol) diacrylate (PEGDA, Mn = 258, 575, and 700 g/mol),
ethylenediamine (EDA), and hexamethylenediamine (HDA) were purchased from
Sigma-Aldrich. Dimethyl sulfoxide (DMSO) and diethyl ether from Fisher Scientific
were used as received. Picrylsulfonic acid (TNBS) solution and tert-butyl carbazate
(t-BC) were purchased from Sigma-Aldrich. Staphylococcus aureus (ATCC 29213)
and Escherichia coli (ATCC 25922) were purchased from Fisher Scientific. LB Broth,
and chitosan (medium molecular weight) were purchased from Sigma-Aldrich.
Thiolated hyaluronic acid (HA-SH, HyStem™, Glycosan) was purchased from
BioTime Inc., Alameda, CA. Streptozotocin (STZ) were purchased from Sigma-
Aldrich. Dulbecco’s Modified Eagle’s Medium (DMEM), fetal bovine serum (FBS),
and penicillin / streptomycin were purchased from Invitrogen.
Design and synthesis of HP-PBAEs
HP-PBAEs were synthesized by the “A2 + B4” Michael addition between acrylate
and amine under mild conditions. The feed ratio of diacrylate to amine was set as
2.5:1 and the reaction was conducted at 80 oC. Typically, 2.5 mmol PEGDA (30 wt%,
DMSO) and 0.5 mmol EDA (10 wt%, DMSO) were mixed to carry out the reaction.
The final products were purified by tri-precipitation in diethyl ether to achieve the
pure polymers.
Characterization of HP-PBAEs
The number average molecular weight (Mn), weight average molecular weight (Mw)
and polydispersity index (PDI) were monitored by an Agilent 1260 Infinite gel
permeation chromatography (GPC) system with a refractive index detector (RI). GPC
columns (ResiPore 4.6 × 250 mm) were eluted with DMF and 0.1% LiBr at a flow
rate of 0.67 mL/min at 80 oC. The Mark-Houwink plot alpha values were obtained by
analyzing purified HP-PBAEs by an Agilent 1260 Infinite GPC system equipped with
a refractive index detector (RI), a viscometer detector (VS) and a dual angle light
scattering detector (LS 15o and LS 90o). GPC columns (PolarGel-M, 7.5 × 300 mm)
were eluted with DMF and 0.1% LiBr at a flow rate of 1 mL/min at 60 oC. Proton
nuclear magnetic resonance (1H-NMR) was used to determine the chemical structure
and composition of the polymers with the chloroform-d (CDCl3) as the solvent. 1H-
NMR spectrum was performed on a 400 MHz Varian NMR system spectrometer and
the results were analyzed using MestReNova processing software.
The TNBS assay was performed to determine the primary amine residue of all five
polymers. The t-BC in a series of concentrations (0, 5, 10, 15, 20, 25, 30 mM) was
prepared as the standard sample. TNBS work solution (6 mM, 0.1 mM borate buffer)
was prepared. Polymers were diluted in water (10 mg/mL). 25 μL polymer solutions
or standard samples were mixed with 0.5 mL TNBS work solution and allowed to
react for 1 h. A volume of 50 μL was transferred into a 96-well plate and diluted with
100 μL HCl (0.5 M). The quantitative data were measured by a spectrophotometer
plate reader (SpectraMax) at 340 nm. The standard curve from t-BC was used to
determine the amount of primary amine residue. All experiments were conducted in
triplicate.
Degradation of HP-PBAEs macromers
258-HDA is not soluble in water; 258-EDA can only make a highest concentration of
10 wt%); the rest macromers are highly soluble. Then five types of HP-PBAEs, 258-
EDA, 575-EDA, 575-HDA, 700-EDA and 700-HDA were prepared in PBS with a
concentration of 10 mg/mL. These solutions were placed in a 37 oC water bath. 1 mL
of the solution was removed and lyophilized at each time point. The freeze-dried
polymers were dissolved in DMF and then purified by Al2O3 column to remove the
phosphate. Next, the polymer solution was filtered prior to GPC testing.
Injectable HP-PBAE/HA-SH hydrogels’ fabrication
Injectable HP-PBAE/HA-SH hydrogels were fabricated as follows. Firstly, HP-
PBAEs (258-EDA, 575-EDA, 575-HDA, 700-EDA, and 700-HDA) were diluted
separately with deionized water to yield a concentration of 10 wt%. Secondly, 100 μL
diluted HP-PBEAs were added into 100 μL, 1 wt% HA-SH. The mixture was gently
vortexed for 10 seconds to promote both compounds’ homogeneous distribution to in
situ form a hydrogel. Gelation time was measured by the following protocol
(according to Ref.1): aqueous 1% HA-SH and HP-PBAE solutions were prepared. 50
μL aqueous 1% HA-SH and 50 μL HP-PBAE solutions were mixed in a 96-well plate
with a magnetic stir bar at 155 rpm using a hot plate/stirrer. The gelation time is
defined as the time when the mixture becomes a globule. Each condition was
conducted in quadruplicate.
Characterization of injectable HP-PBAE/HA-SH gelation process by rheometer
Gelation process was characterized by TA Discovery Hybrid Rheometers. 200 μL
mixed solution was added to spread on a parallel plate with a frequency of 1 rad/s and
a strain of 0.5%. The storage modulus G’ and loss modulus G” were monitored with
time. Angular frequency, strain dependent storage, and loss modulus at different
concentrations were evaluated. Angular frequency sweep tests were obtained over a
wide frequency range (strain = 1%, frequency = 0.1-60 rad/s) after each time sweep.
Strain sweep tests were performed at the range of 0.01-100% (frequency = 1 rad/s) to
determine the viscoelastic regime of the hydrogels.
Injectable HP-PBAE/HA-SH hydrogels swelling and degradation profile
Swelling ratio was used to introduce hydrogel water retention capacity:
Swelling ratio = Wt / W0 × 100%
Weight of sample at scheduled time was recorded as Wt, and the initial weight of
sample as W0. 5 wt% of different HP-PBAE/HA-SH hydrogels were prepared and
then added into TranswellⓇ permeable inserts (BD. Bio Coat, PET track-etched
membrane, 3.0 μm). The inserts were then put into 6-well plates and 15 mL PBS was
added into each well. The whole system was incubated in a shaker at 37 oC at 150 rpm.
At scheduled time intervals, the PBS buffer was removed and the weights of swollen
hydrogels were recorded. The degradation of the hydrogel was also monitored
indirectly by swelling experiments until hydrogels had totally disappeared. The
degradation was defined as the changes in hydrogel swelling ratios. Experiments were
performed five times for each type of hydrogel at the same condition.
Bacteriostatic test of HP-PBAEs
To examine the bacteriostatic property, Staphylococcus aureus and Escherichia coli
were used in this study. Bacteria were cultured in LB Broth and obtained at OD600 =
0.8. 50 μL bacterial suspension was added into 5 mL sterile LB Broth in tubes. 10 mg
of 5 types of HP-PBAEs were added into the mixed bacteria suspension. 10 mg
chitosan was used as a comparative control and 1% Virkon was used as positive
control, 10 μL PBS was used as negative control. Each condition was replicated four
times. All tubes were put into 37 oC in a shaker with 220 rpm. Samples were taken
and measured at the absorbance of 600 nm utilizing a Spectrophotometer plate reader
(SpectraMax) at 1, 2, and 4 h after incubation.
The relative viability can be calculated according to the following equation:
Bacterial viability =
Abs of experimental group - Abs of positiveAbs of negative - Abs of positive
× 100%
In vitro cytotoxicity analysis
Rat ADSCs were extracted from rat adipose tissue following the previously reported
method2. 3T3 cell line was purchased from Sigma-Aldrich. Cells were cultured in
DMEM supplemented with 10% FBS and 1% penicillin/streptomycin.
For in vitro polymer cytotoxicity study, ADSCs, and 3T3 fibroblasts were used. 5 ×
103 cells were seeded per well and cultured for 24 h in 96-well plates to permit cell
attachment. Then, the cells were exposed to different concentrations of HP-PBAEs or
separately incubated with degradation products of macromers. An alamarBlue assay
was used to assess both cells’ viability after 24 h of incubation with macromers and
degradation products. The absorbance of 570/600 nm was measured utilizing a
Spectrophotometer plate reader.
To evaluate cytotoxicity of the hydrogels, an indirect permeable contact TranswellⓇ
(Corning, Polycarbonate Membrane TranswellⓇ Inserts, membrane pore size 8.0μm)
was utilized. Both cells mentioned above were separately seeded into 48-well
TranswellⓇ well plates (20 × 103 per well) and incubated for 24 h. 20 μL of the
prepared gels were placed into the upper chamber of the wells and 2 mL media was
added into the lower chamber (n = 4 per group). An alamarBlue assay was used to
assess cell viability of both cell lines for 24 and 48 h post-indirect contact.
Cytotoxicity of five types of HP-PBAEs macromers, degradation products of the
macromers, and HP-PBAE/HA-SH hydrogels were evaluated with ADSCs and 3T3
fibroblasts in vitro (except 258-HDA because of its non-solubility).
Subcutaneous implantation
Subcutaneous implantation was used to test the in vivo biosafety and biodegradation
of the soluble hydrogels. After anesthesia with an intraperitoneal injection of 8%
chloral hydrate, four 1 cm full-thickness transverse incisions were made on both sides
of the shaved dorsum of SD rats. 100 μL prepared hydrogels were implanted
subcutaneously and incisions were closed with 5-0 nylon suture (Ethicon, Somerville,
NJ) and covered with a sterile occlusive dressing (Tegaderm: 3M, St. Paul, MN).
Wounds were examined every three days and harvested at 3, 7, 11, and 14 days post-
wounding. Residual hydrogels were taken and weighted (4 samples for each
condition).
Diabetic animal model
STZ injection was used to chemically induce nondiabetic SD rats to develop type 1
diabetes. SD rats were injected via cauda vein with 45 mg/kg of STZ dissolved in a
0.1 M sodium citrate buffer. The serum glucose levels were tested 7 days post-
injection with a blood glucose meter (OneTouch Ultra® Blood Glucose Monitoring
System) and every 7 days during the experiments. Diabetes was verified by serum
glucose levels > 16.7 mmol/L for at least 4 weeks after the injection.
Humanized excisional wound model
A splinted excisional wound model was used to prevent wound contraction and mimic
the human wound healing process through re-epithelialization and granulation tissue
formation. Briefly, after anesthesia, dorsal hair was shaved. Four 1.1 cm diameter
circular full thickness wounds were created. Wounds were circumscribed by silicone
rings sutured onto the surface of the skin surrounding the excision with 5-0 nylon.
To validate the efficacy, nondiabetic and diabetic rats were randomized into the
following four treatment groups, respectively: PBS solution (blank), direct local
ADSCs injection, 575-EDA/HA-SH/ADSCs, and 700-EDA/HA-SH/ADSCs hydrogel
treatment groups. All the hydrogels were prepared with a final polymer concentration
of 5 wt%.
For the ADSCs injection group, 200 μL (2.5 × 10⁶ /mL) cell suspension was injected
subcutaneously around the wound edge. For the injectable hydrogel encapsulated with
ADSCs (2.5 × 10⁶ /mL) groups, 200 μL solution (mixed by ADSCs, HA-SH, and 575-
EDA or 700-EDA solutions) was injected directly onto wound surfaces and hydrogels
were formed in situ within 1 min (Supplementary movie 1).
Digital photographs were taken at days 0, 11, 21 post-procedures and the wound area
was measured by ImageJ software. Percentage of wound closure rate was defined as:
(origin wound area - residual wound area at day ‘X’) / origin wound area × 100%.
Results were determined through assessment of digital wound images by two blinded
evaluators.
Histological analysis
Wound tissues were sampled at scheduled time points and were immediately fixed in
4% formaldehyde/PBS solution overnight, dehydrated with a graded series of ethanol
and embedded in paraffin. The sectioned samples with a thickness of 5 μm were then
stained by hematoxylin and eosin (H&E, Sigma-Aldrich), and Masson’s trichrome
(Sigma-Aldrich) and visualized by an optical microscope.
Newly formed dermis thickness, was measured based on Masson’s trichrome stained
sections using the ImageJ software (n = 8 wounds for each condition) with a
minimum of 6 measurements per sample. Percentage of neo-dermis thickness was
calculated as (thickness of neo-dermis/thickness of the surrounded normal dermis) ×
100%.
Immunohistochemistry and immunofluorescence
For immunohistochemical staining, 5 μm thickness paraffin sections were
deparaffinized, washed three times in PBS for 5 min and blocked with 5% serum for
30 min. Then, the slides were immunostained using anti-Keratin 10 (1:300), CD31
(1:200), α-SMA (1:25), VEGF (1:50), CD11b (1:100), TNF-α (1:200), and IL-1β
(1:200) antibodies. All antibodies were purchased from Abcam Inc. For each
condition, five high power microscopic fields at 400× were examined for each
separate wound sample by three blinded evaluators.
The expression of inflammatory cytokines was quantified by counting positively
stained cells. The number of blood vessels was counted by CD31-positive or α-SMA
positive staining vasculatures per area. Re-epithelialization rate was defined as: the
sum of newly formed epidermis length of both sides/original wound length × 100%.
For immunofluorescent staining, 5 μm thickness paraffin sections were deparaffinized,
washed three times in PBS for 5 min and blocked with 5% serum for 30 min.
Immunofluorescence was performed after sections’ fixation in acetone at -20 oC using
anti-Keratin 10 (1:300), CD31 (1:200), α-SMA (1:25), VEGF (1:50), CD11b (1:100),
TNF-α (1:200), and IL-1β (1:200) antibodies. Nuclei were stained with DAPI. All
antibodies were purchased from Abcam Inc. Immunofluorescence images were
acquired with an AxioCam HRm camera mounted on a Zeiss Imager M2 microscope.
Statistical analysis
Unless specified otherwise, all values are expressed as mean ± standard deviation
(SD). Statistical differences between two groups were determined using the student’s
unpaired t test. A p value < 0.05 was considered statistically significant.

References
1 T. Ito, Y. Yeo, C. B. Highley, E. Bellas, C. A. Benitez and D. S. Kohane,
Biomaterials, 2007, 28, 975–983.
2 Y. Dong, W. U. Hassan, R. Kennedy, U. Greiser, A. Pandit, Y. Garcia and W.
Wang, Acta Biomater., 2014, 10, 2076–2085.
Supplementary Table 1
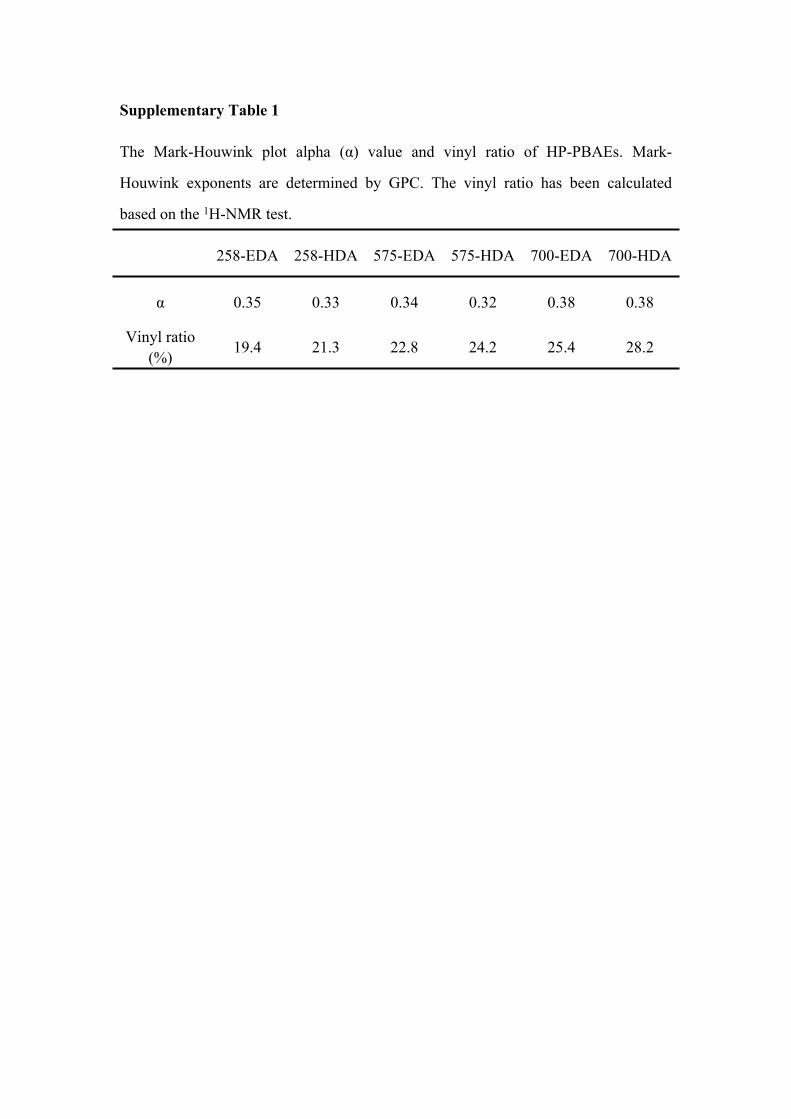
The Mark-Houwink plot alpha (α) value and vinyl ratio of HP-PBAEs. Mark-
Houwink exponents are determined by GPC. The vinyl ratio has been calculated
based on the 1H-NMR test.
258-EDA 258-HDA 575-EDA 575-HDA 700-EDA 700-HDA
α 0.35 0.33 0.34 0.32 0.38 0.38
Vinyl ratio (%) 19.4 21.3 22.8 24.2 25.4 28.2
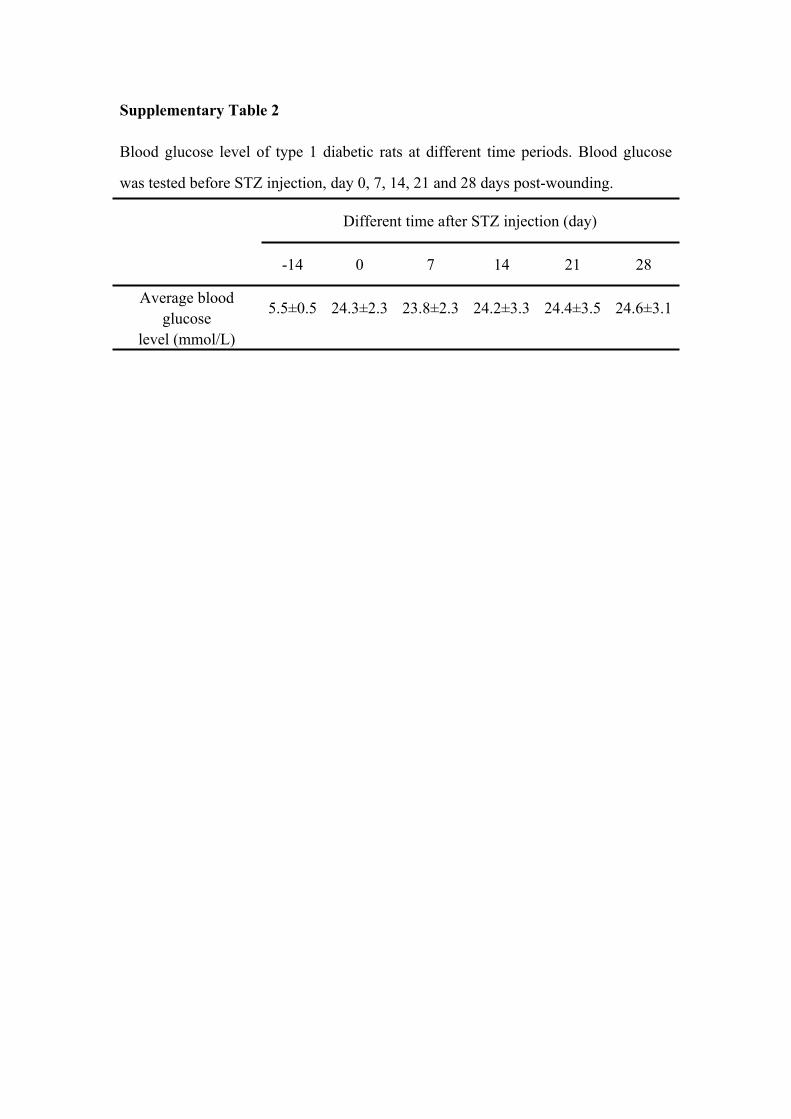
Supplementary Table 2
Blood glucose level of type 1 diabetic rats at different time periods. Blood glucose
was tested before STZ injection, day 0, 7, 14, 21 and 28 days post-wounding.
Different time after STZ injection (day)
-14 0 7 14 21 28
Average blood glucose
level (mmol/L)
5.5±0.5 24.3±2.3 23.8±2.3 24.2±3.3 24.4±3.5 24.6±3.1
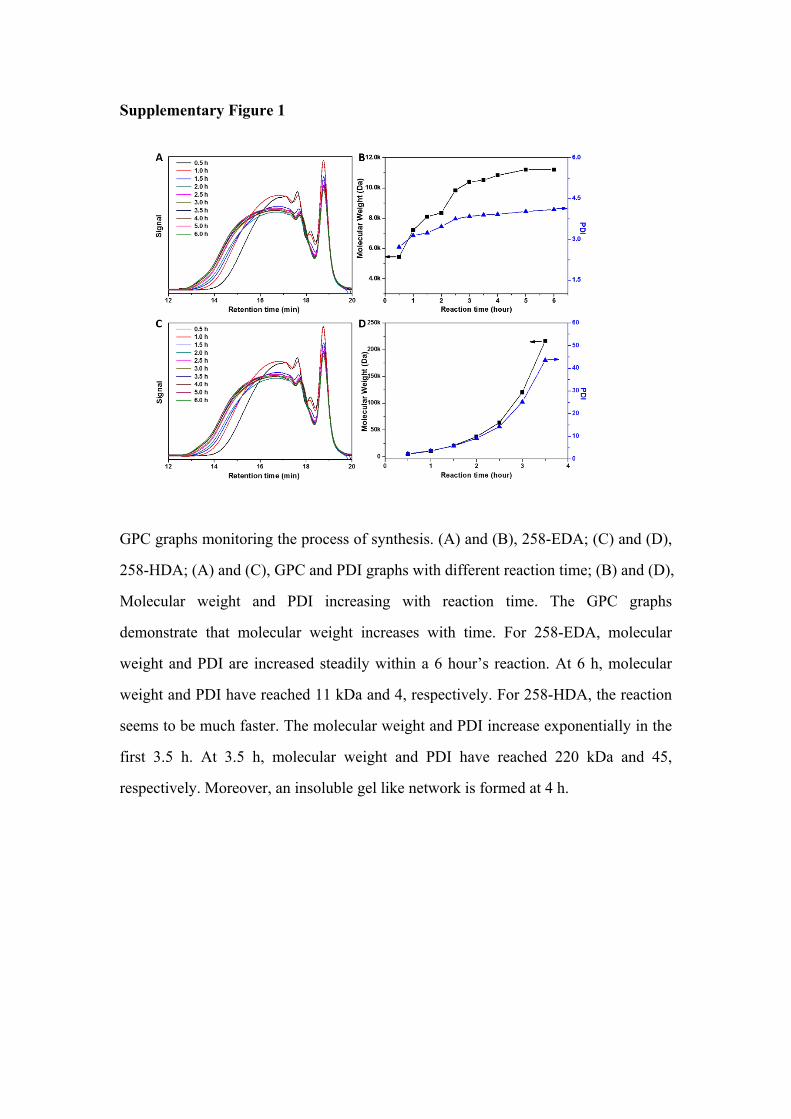
Supplementary Figure 1
GPC graphs monitoring the process of synthesis. (A) and (B), 258-EDA; (C) and (D),
258-HDA; (A) and (C), GPC and PDI graphs with different reaction time; (B) and (D),
Molecular weight and PDI increasing with reaction time. The GPC graphs
demonstrate that molecular weight increases with time. For 258-EDA, molecular
weight and PDI are increased steadily within a 6 hour’s reaction. At 6 h, molecular
weight and PDI have reached 11 kDa and 4, respectively. For 258-HDA, the reaction
seems to be much faster. The molecular weight and PDI increase exponentially in the
first 3.5 h. At 3.5 h, molecular weight and PDI have reached 220 kDa and 45,
respectively. Moreover, an insoluble gel like network is formed at 4 h.
Supplementary Figure 2
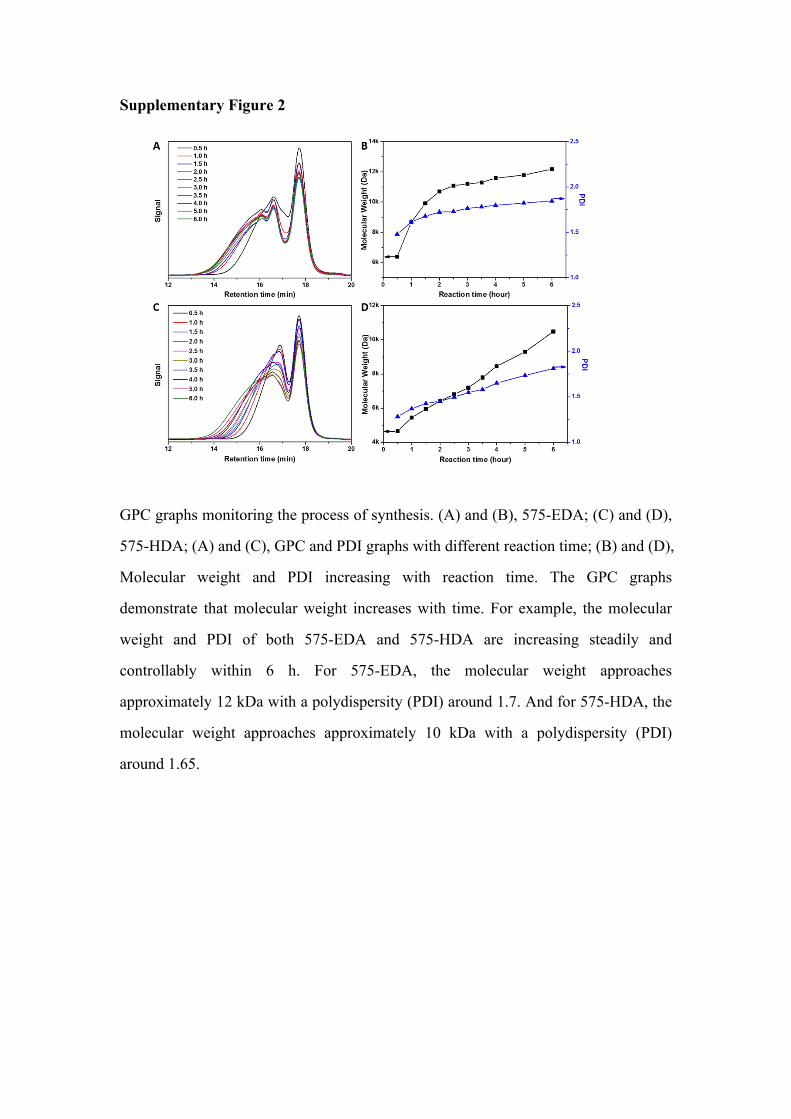
GPC graphs monitoring the process of synthesis. (A) and (B), 575-EDA; (C) and (D),
575-HDA; (A) and (C), GPC and PDI graphs with different reaction time; (B) and (D),
Molecular weight and PDI increasing with reaction time. The GPC graphs
demonstrate that molecular weight increases with time. For example, the molecular
weight and PDI of both 575-EDA and 575-HDA are increasing steadily and
controllably within 6 h. For 575-EDA, the molecular weight approaches
approximately 12 kDa with a polydispersity (PDI) around 1.7. And for 575-HDA, the
molecular weight approaches approximately 10 kDa with a polydispersity (PDI)
around 1.65.
Supplementary Figure 3
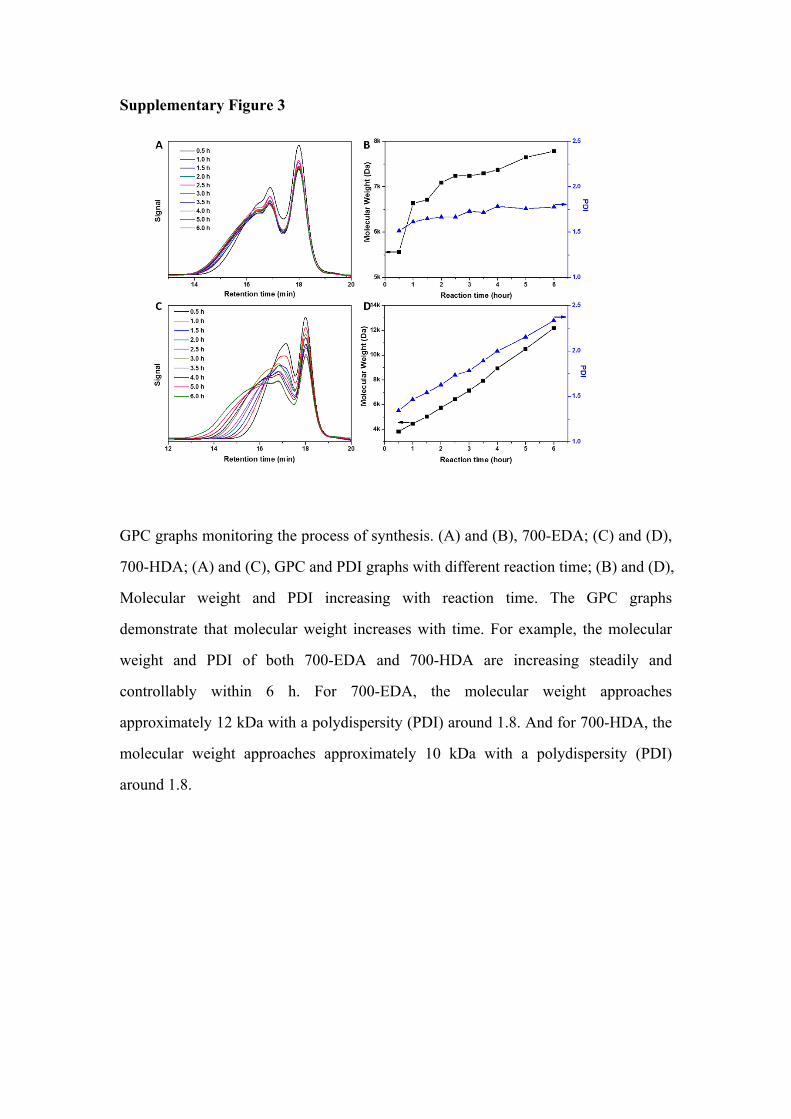
GPC graphs monitoring the process of synthesis. (A) and (B), 700-EDA; (C) and (D),
700-HDA; (A) and (C), GPC and PDI graphs with different reaction time; (B) and (D),
Molecular weight and PDI increasing with reaction time. The GPC graphs
demonstrate that molecular weight increases with time. For example, the molecular
weight and PDI of both 700-EDA and 700-HDA are increasing steadily and
controllably within 6 h. For 700-EDA, the molecular weight approaches
approximately 12 kDa with a polydispersity (PDI) around 1.8. And for 700-HDA, the
molecular weight approaches approximately 10 kDa with a polydispersity (PDI)
around 1.8.
Supplementary Figure 4
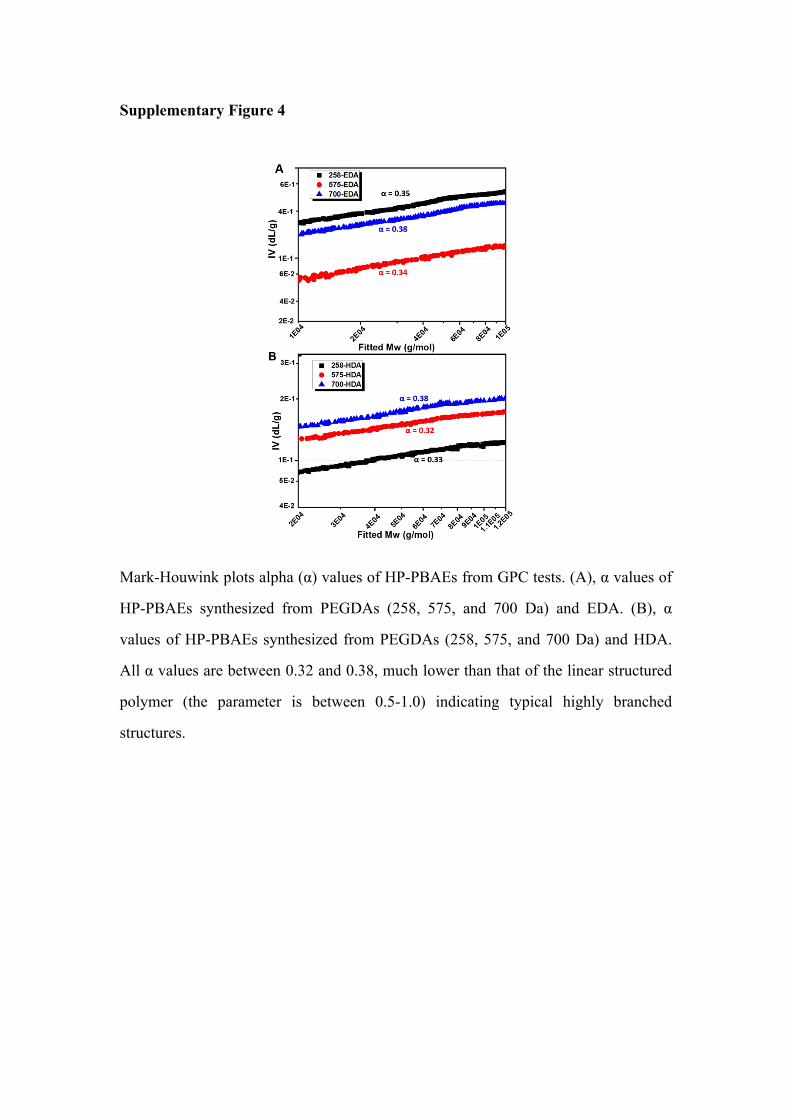
Mark-Houwink plots alpha (α) values of HP-PBAEs from GPC tests. (A), α values of
HP-PBAEs synthesized from PEGDAs (258, 575, and 700 Da) and EDA. (B), α
values of HP-PBAEs synthesized from PEGDAs (258, 575, and 700 Da) and HDA.
All α values are between 0.32 and 0.38, much lower than that of the linear structured
polymer (the parameter is between 0.5-1.0) indicating typical highly branched
structures.
Supplementary Figure 5
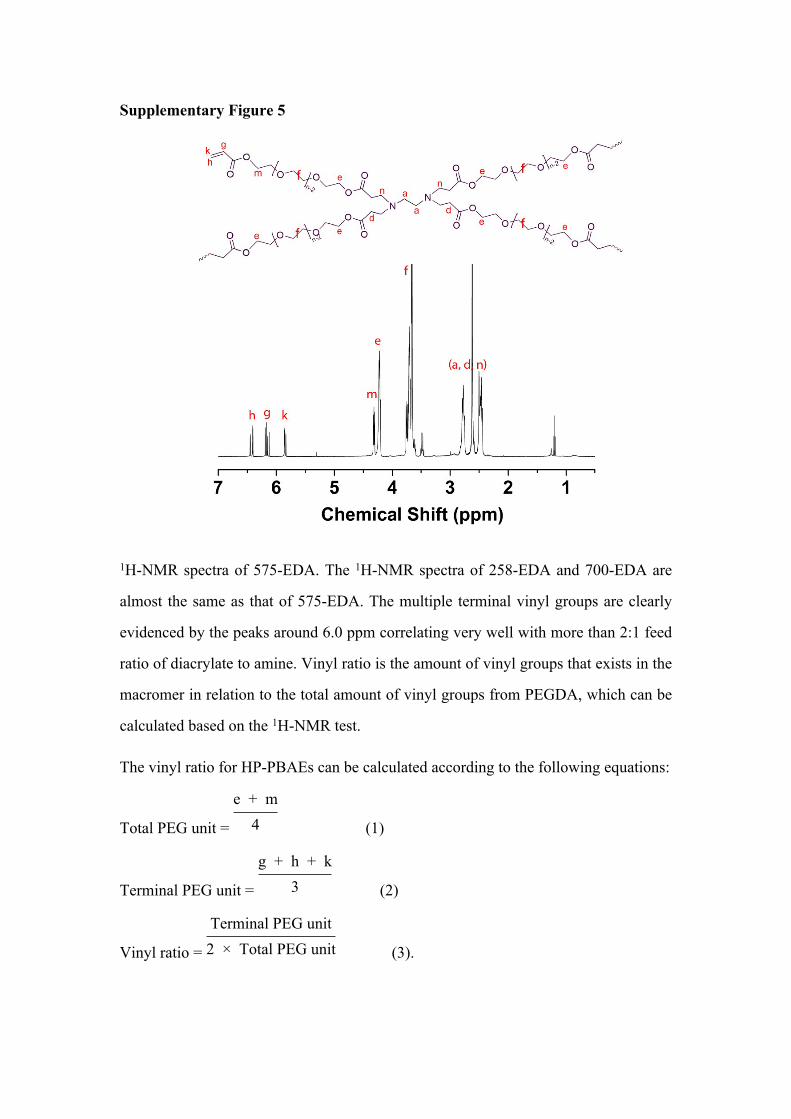
1H-NMR spectra of 575-EDA. The 1H-NMR spectra of 258-EDA and 700-EDA are
almost the same as that of 575-EDA. The multiple terminal vinyl groups are clearly
evidenced by the peaks around 6.0 ppm correlating very well with more than 2:1 feed
ratio of diacrylate to amine. Vinyl ratio is the amount of vinyl groups that exists in the
macromer in relation to the total amount of vinyl groups from PEGDA, which can be
calculated based on the 1H-NMR test.
The vinyl ratio for HP-PBAEs can be calculated according to the following equations:
Total PEG unit = (1)
e + m4
Terminal PEG unit = (2)
g + h + k3
Vinyl ratio = (3).
Terminal PEG unit2 × Total PEG unit
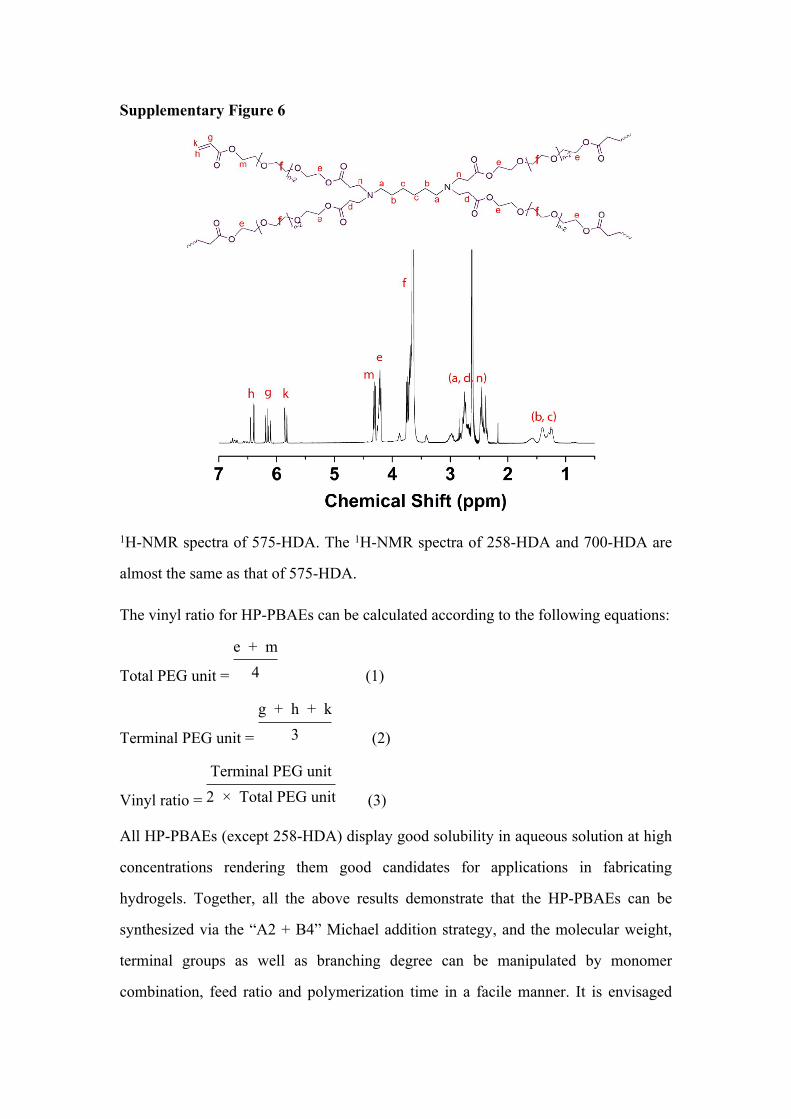
Supplementary Figure 6
1H-NMR spectra of 575-HDA. The 1H-NMR spectra of 258-HDA and 700-HDA are
almost the same as that of 575-HDA.
The vinyl ratio for HP-PBAEs can be calculated according to the following equations:
Total PEG unit = (1)
e + m4
Terminal PEG unit = (2)
g + h + k3
Vinyl ratio = (3)
Terminal PEG unit2 × Total PEG unit
All HP-PBAEs (except 258-HDA) display good solubility in aqueous solution at high
concentrations rendering them good candidates for applications in fabricating
hydrogels. Together, all the above results demonstrate that the HP-PBAEs can be
synthesized via the “A2 + B4” Michael addition strategy, and the molecular weight,
terminal groups as well as branching degree can be manipulated by monomer
combination, feed ratio and polymerization time in a facile manner. It is envisaged
that this versatile polymerization platform can be further expanded to other monomer
systems to develop diverse functional HP-PBAEs.
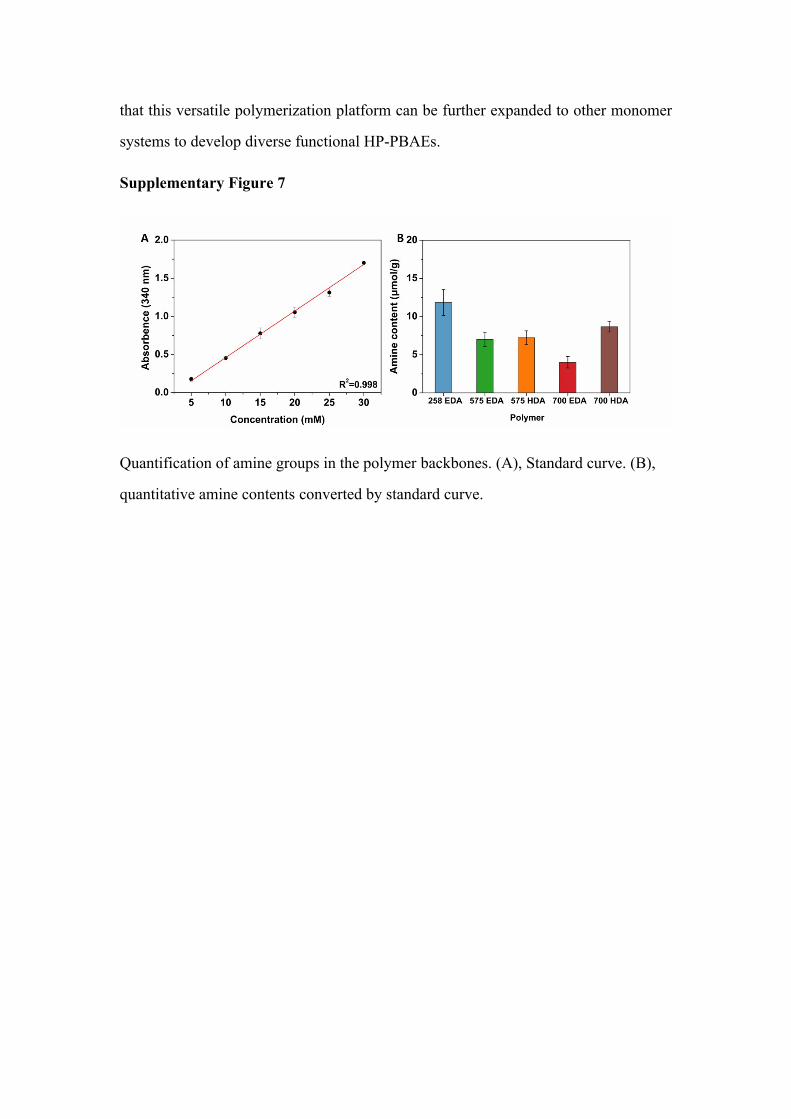
Supplementary Figure 7
Quantification of amine groups in the polymer backbones. (A), Standard curve. (B),
quantitative amine contents converted by standard curve.
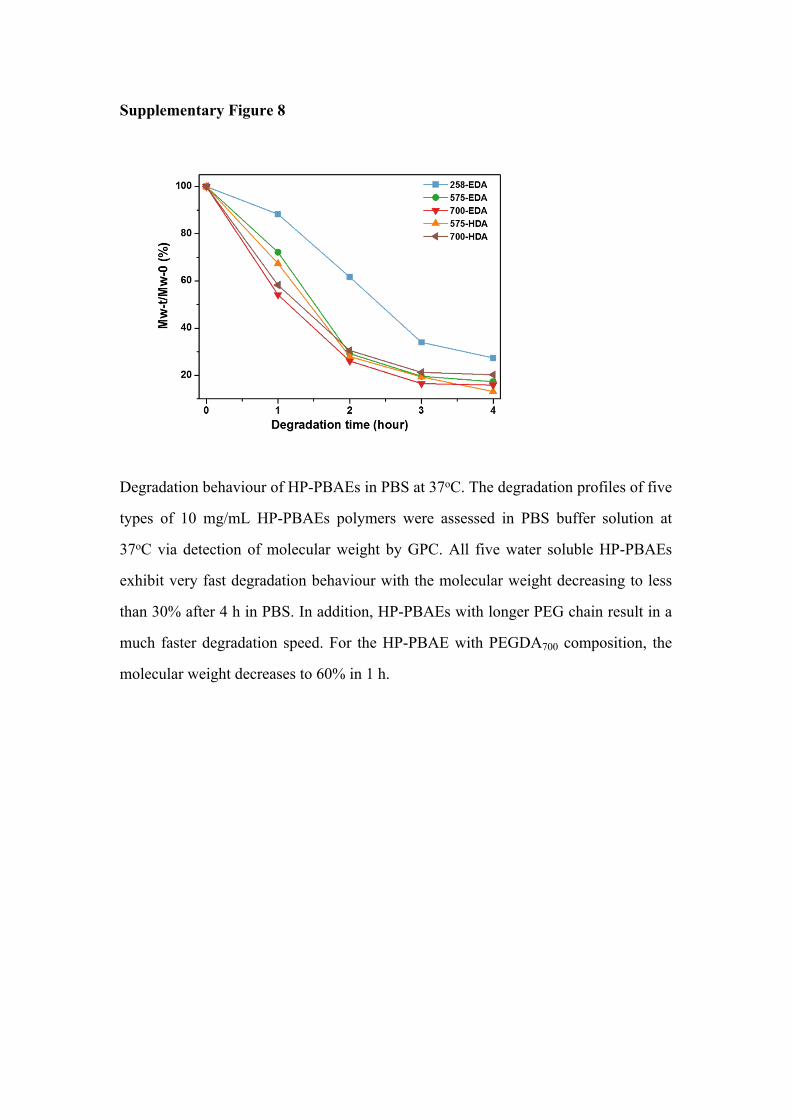
Supplementary Figure 8
Degradation behaviour of HP-PBAEs in PBS at 37oC. The degradation profiles of five
types of 10 mg/mL HP-PBAEs polymers were assessed in PBS buffer solution at
37oC via detection of molecular weight by GPC. All five water soluble HP-PBAEs
exhibit very fast degradation behaviour with the molecular weight decreasing to less
than 30% after 4 h in PBS. In addition, HP-PBAEs with longer PEG chain result in a
much faster degradation speed. For the HP-PBAE with PEGDA700 composition, the
molecular weight decreases to 60% in 1 h.
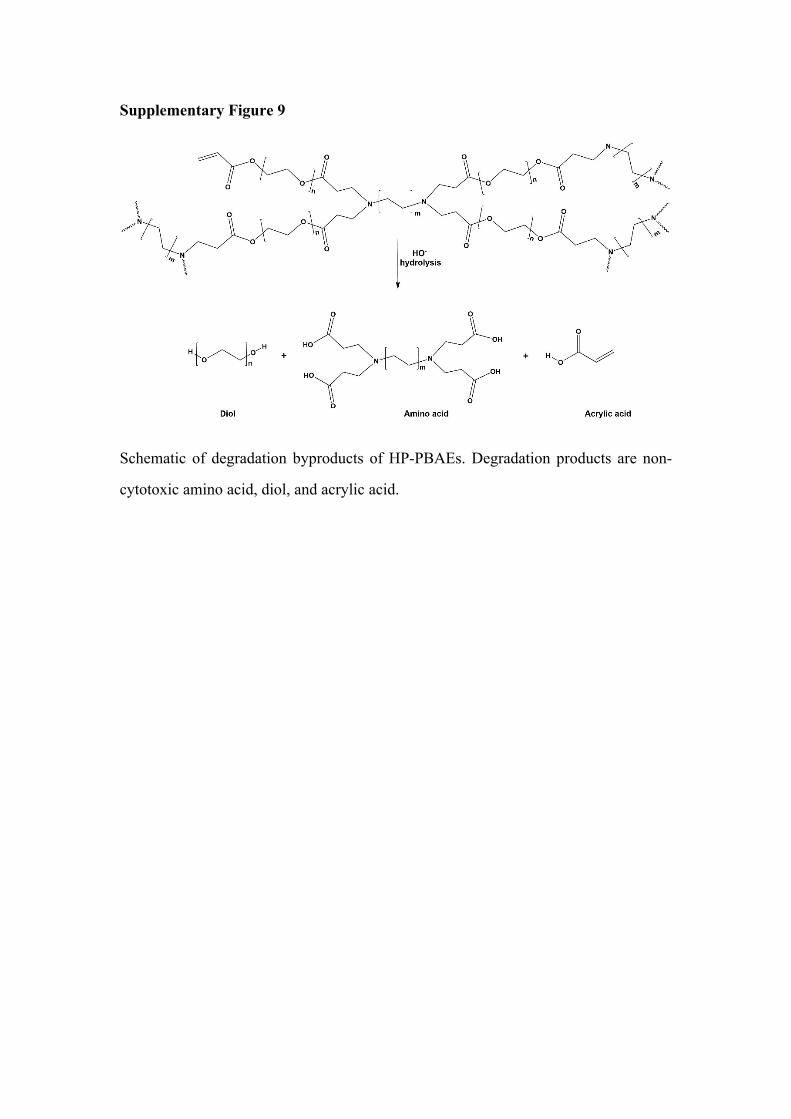
Supplementary Figure 9
Schematic of degradation byproducts of HP-PBAEs. Degradation products are non-
cytotoxic amino acid, diol, and acrylic acid.
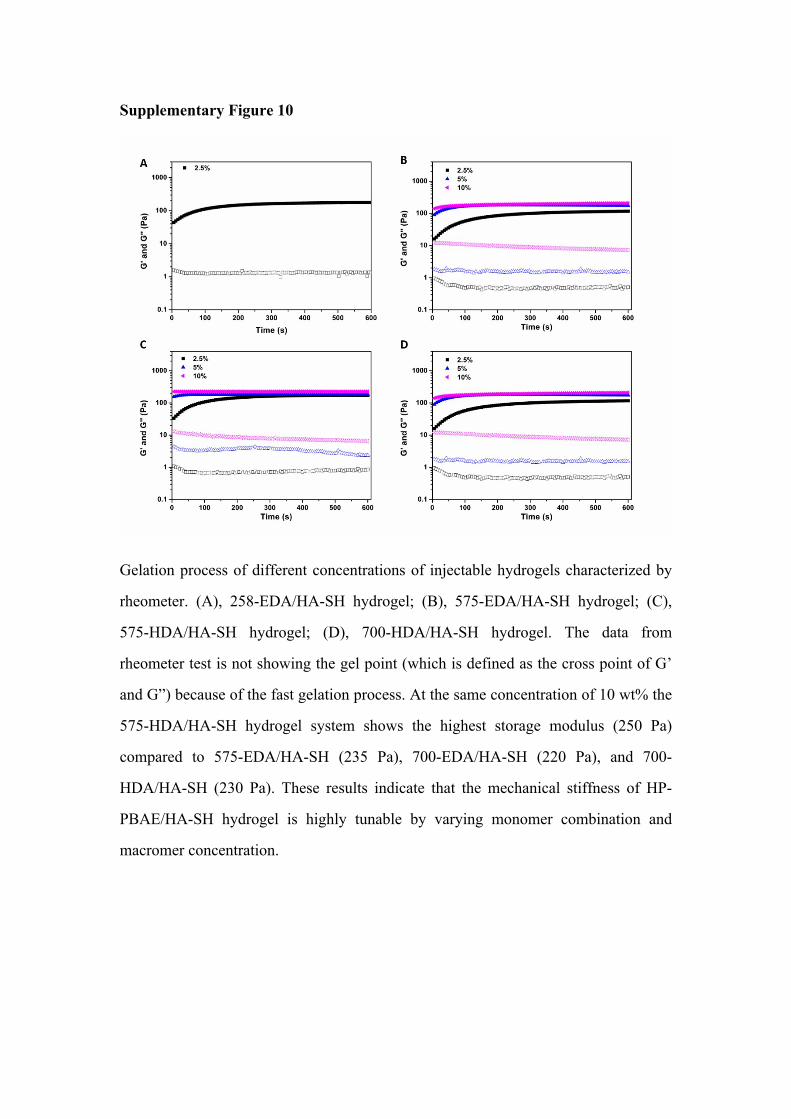
Supplementary Figure 10
Gelation process of different concentrations of injectable hydrogels characterized by
rheometer. (A), 258-EDA/HA-SH hydrogel; (B), 575-EDA/HA-SH hydrogel; (C),
575-HDA/HA-SH hydrogel; (D), 700-HDA/HA-SH hydrogel. The data from
rheometer test is not showing the gel point (which is defined as the cross point of G’
and G”) because of the fast gelation process. At the same concentration of 10 wt% the
575-HDA/HA-SH hydrogel system shows the highest storage modulus (250 Pa)
compared to 575-EDA/HA-SH (235 Pa), 700-EDA/HA-SH (220 Pa), and 700-
HDA/HA-SH (230 Pa). These results indicate that the mechanical stiffness of HP-
PBAE/HA-SH hydrogel is highly tunable by varying monomer combination and
macromer concentration.
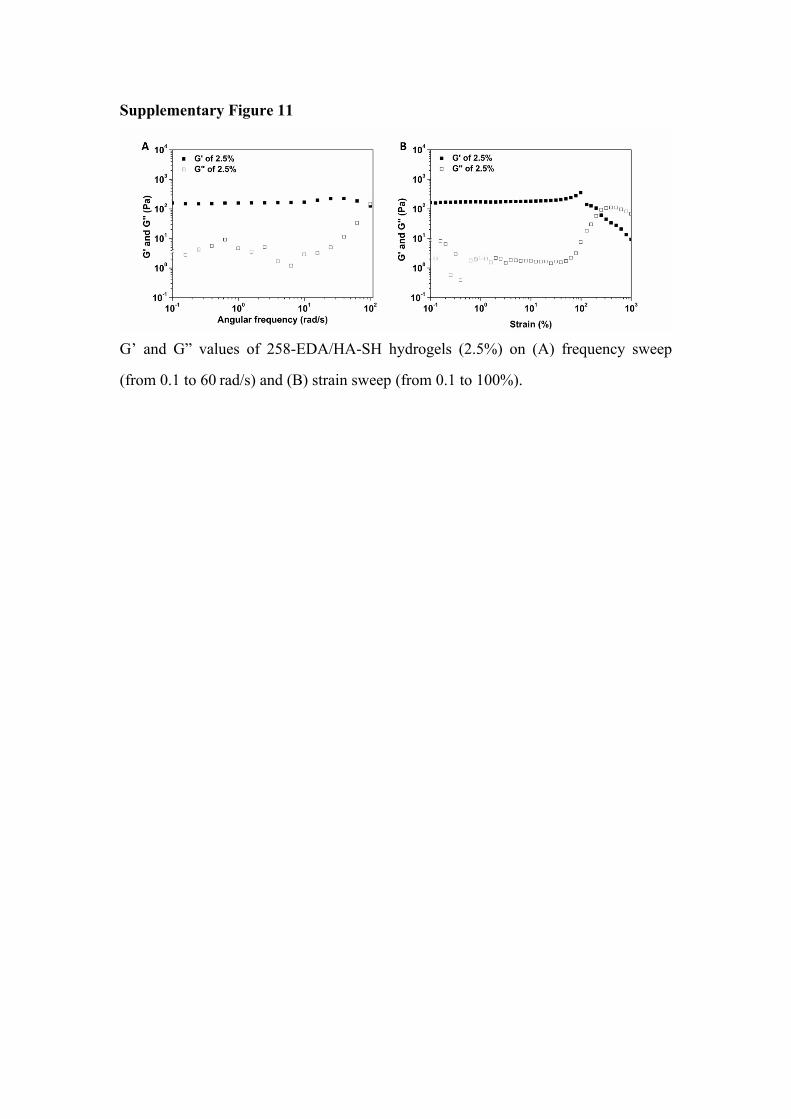
Supplementary Figure 11
G’ and G” values of 258-EDA/HA-SH hydrogels (2.5%) on (A) frequency sweep
(from 0.1 to 60 rad/s) and (B) strain sweep (from 0.1 to 100%).
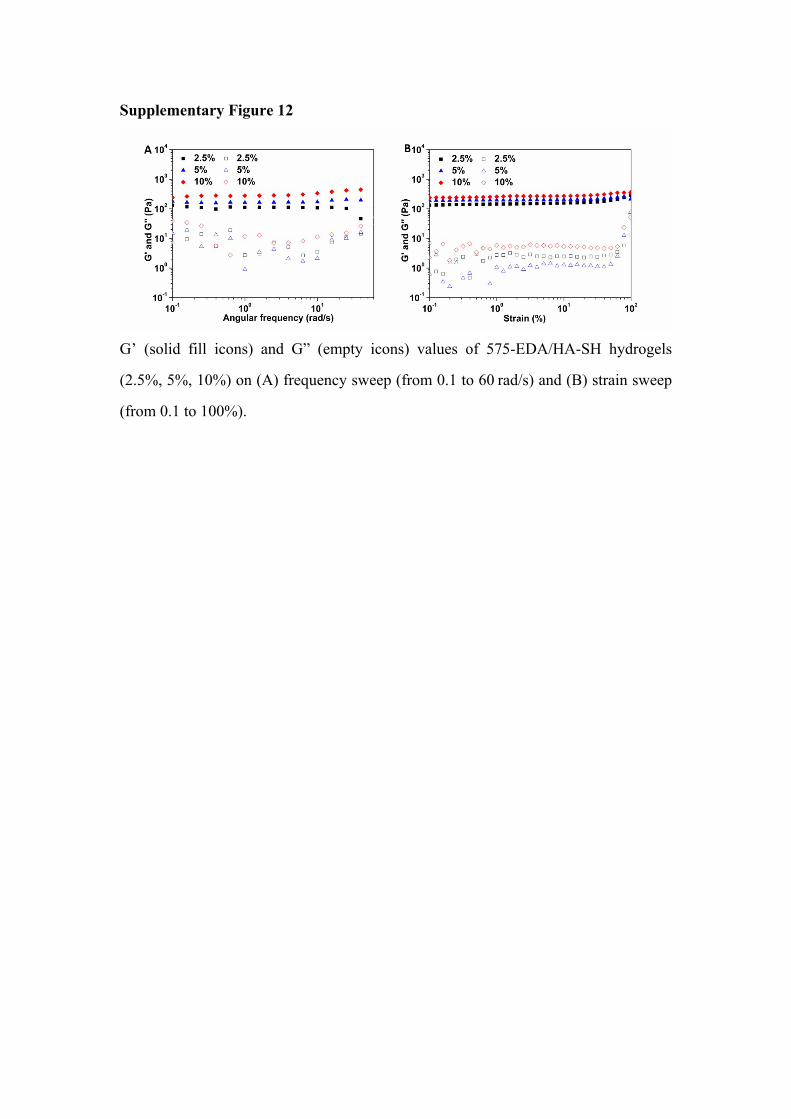
Supplementary Figure 12
G’ (solid fill icons) and G” (empty icons) values of 575-EDA/HA-SH hydrogels
(2.5%, 5%, 10%) on (A) frequency sweep (from 0.1 to 60 rad/s) and (B) strain sweep
(from 0.1 to 100%).
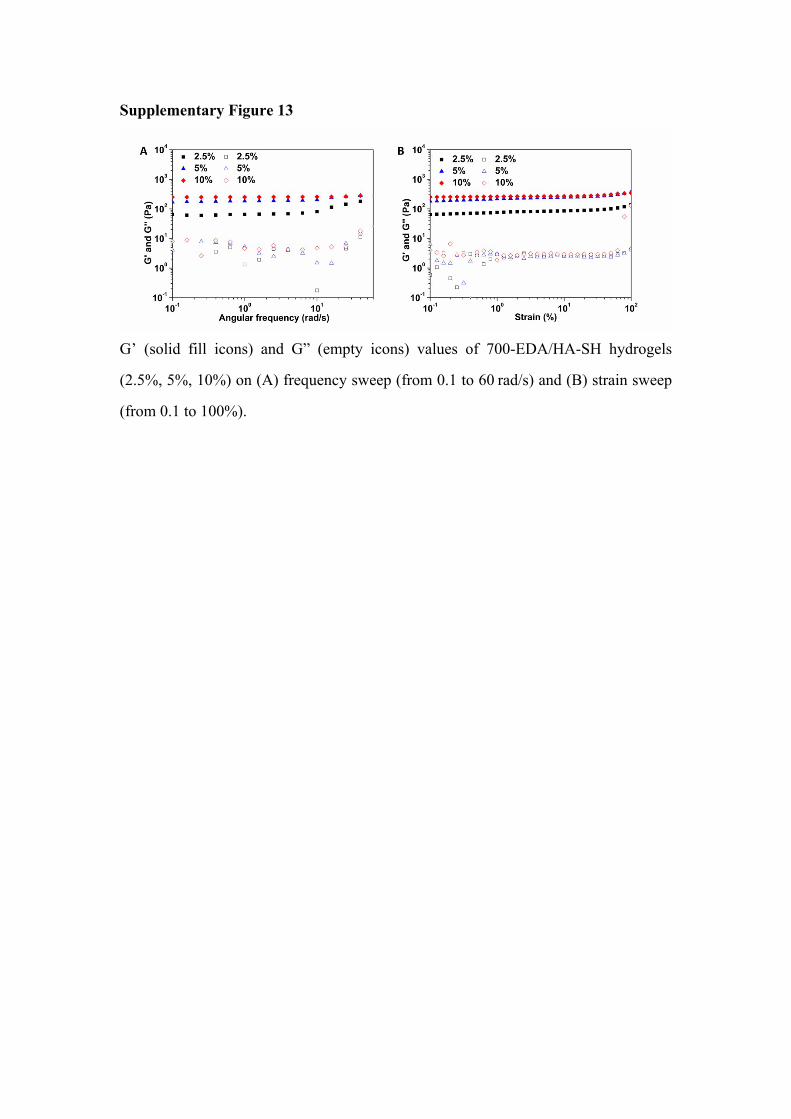
Supplementary Figure 13
G’ (solid fill icons) and G” (empty icons) values of 700-EDA/HA-SH hydrogels
(2.5%, 5%, 10%) on (A) frequency sweep (from 0.1 to 60 rad/s) and (B) strain sweep
(from 0.1 to 100%).
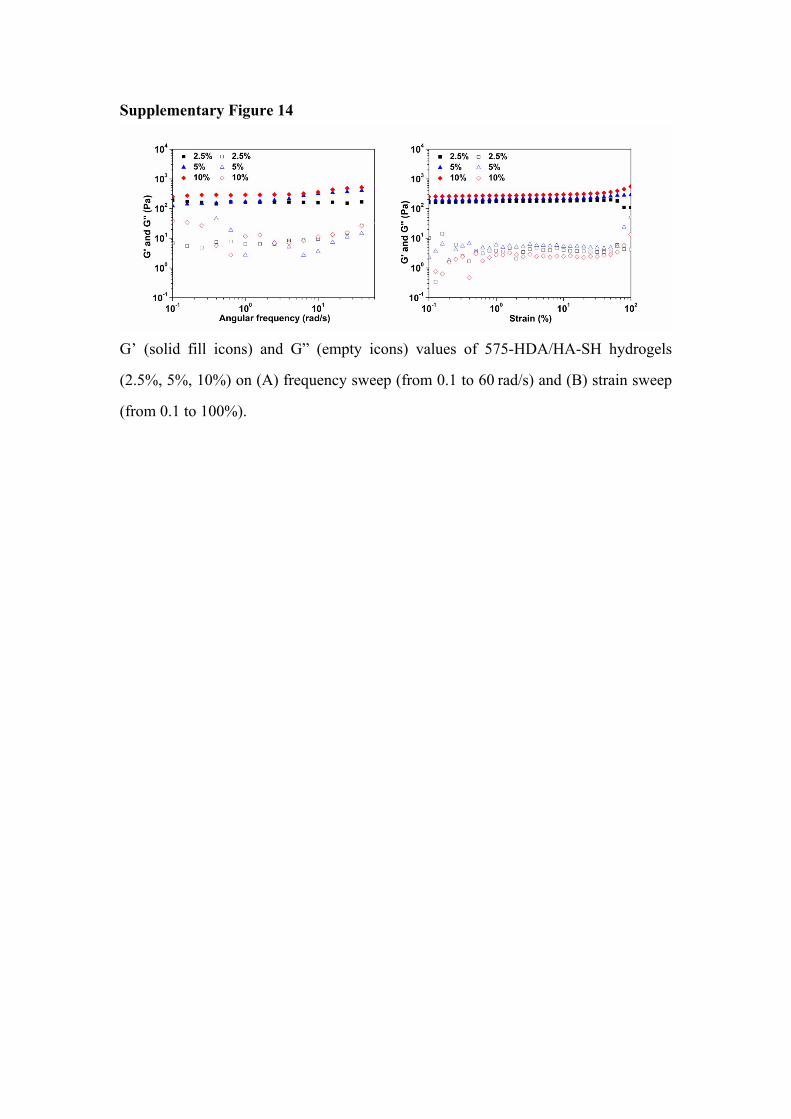
Supplementary Figure 14
G’ (solid fill icons) and G” (empty icons) values of 575-HDA/HA-SH hydrogels
(2.5%, 5%, 10%) on (A) frequency sweep (from 0.1 to 60 rad/s) and (B) strain sweep
(from 0.1 to 100%).
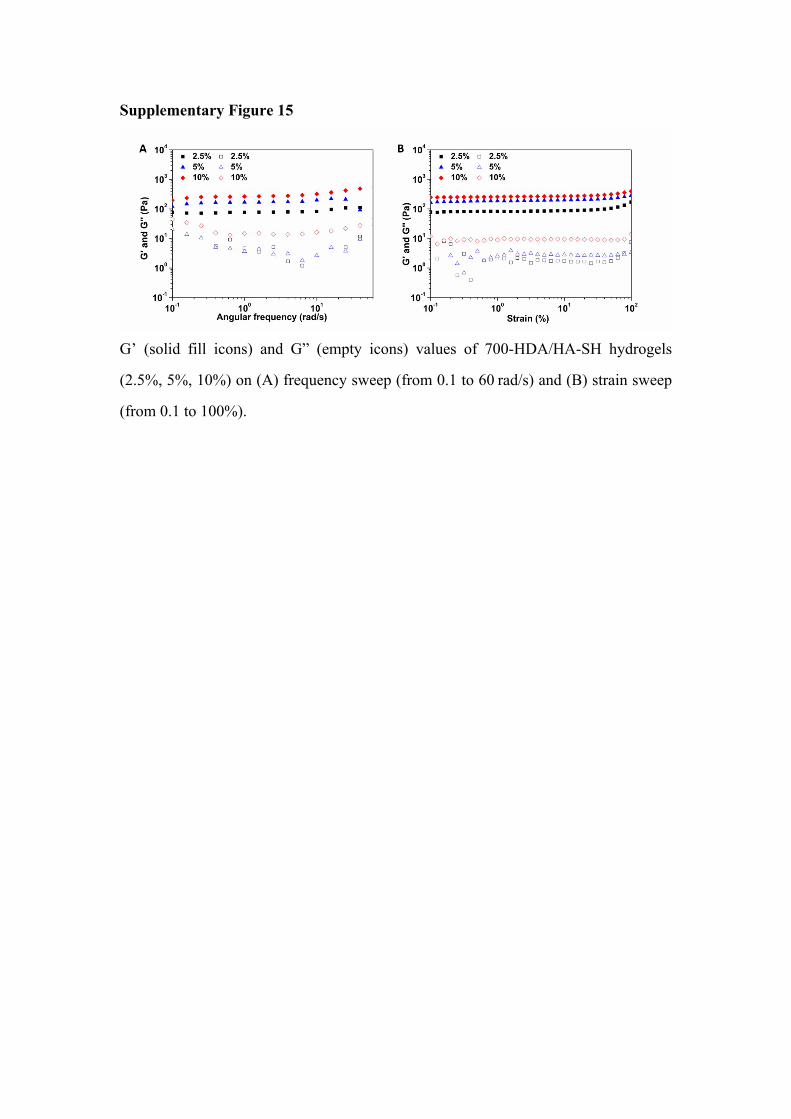
Supplementary Figure 15
G’ (solid fill icons) and G” (empty icons) values of 700-HDA/HA-SH hydrogels
(2.5%, 5%, 10%) on (A) frequency sweep (from 0.1 to 60 rad/s) and (B) strain sweep
(from 0.1 to 100%).
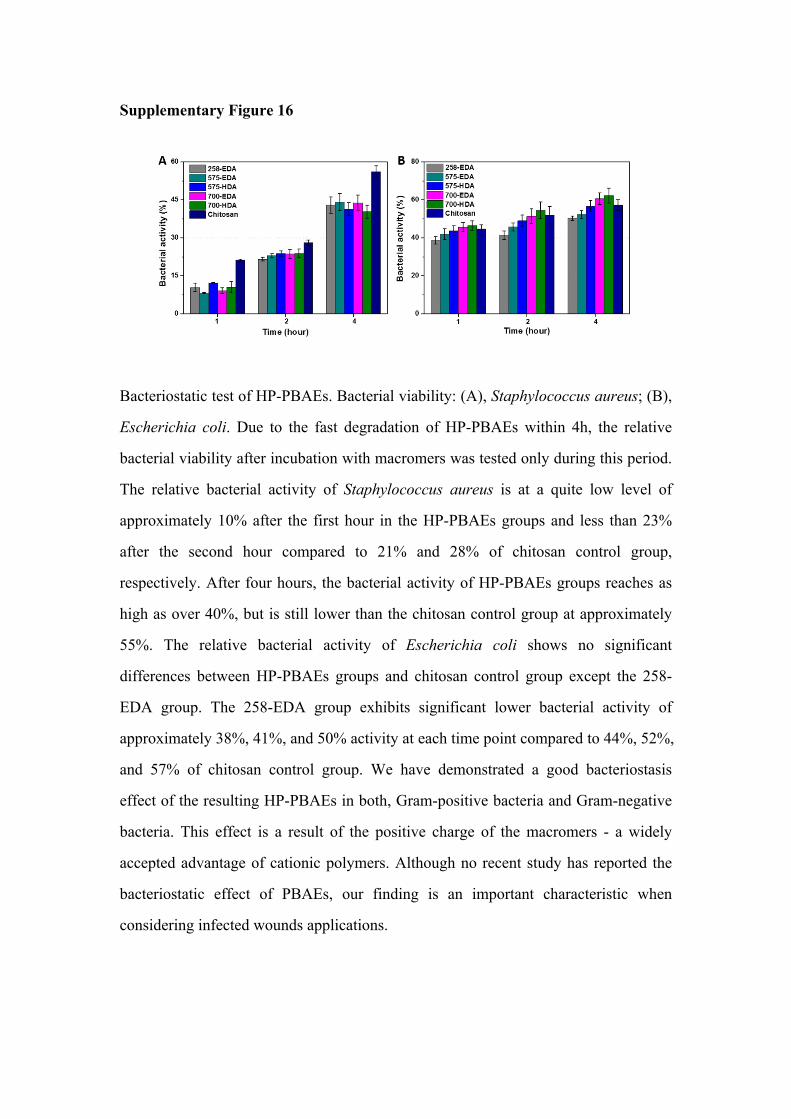
Supplementary Figure 16
Bacteriostatic test of HP-PBAEs. Bacterial viability: (A), Staphylococcus aureus; (B),
Escherichia coli. Due to the fast degradation of HP-PBAEs within 4h, the relative
bacterial viability after incubation with macromers was tested only during this period.
The relative bacterial activity of Staphylococcus aureus is at a quite low level of
approximately 10% after the first hour in the HP-PBAEs groups and less than 23%
after the second hour compared to 21% and 28% of chitosan control group,
respectively. After four hours, the bacterial activity of HP-PBAEs groups reaches as
high as over 40%, but is still lower than the chitosan control group at approximately
55%. The relative bacterial activity of Escherichia coli shows no significant
differences between HP-PBAEs groups and chitosan control group except the 258-
EDA group. The 258-EDA group exhibits significant lower bacterial activity of
approximately 38%, 41%, and 50% activity at each time point compared to 44%, 52%,
and 57% of chitosan control group. We have demonstrated a good bacteriostasis
effect of the resulting HP-PBAEs in both, Gram-positive bacteria and Gram-negative
bacteria. This effect is a result of the positive charge of the macromers - a widely
accepted advantage of cationic polymers. Although no recent study has reported the
bacteriostatic effect of PBAEs, our finding is an important characteristic when
considering infected wounds applications.
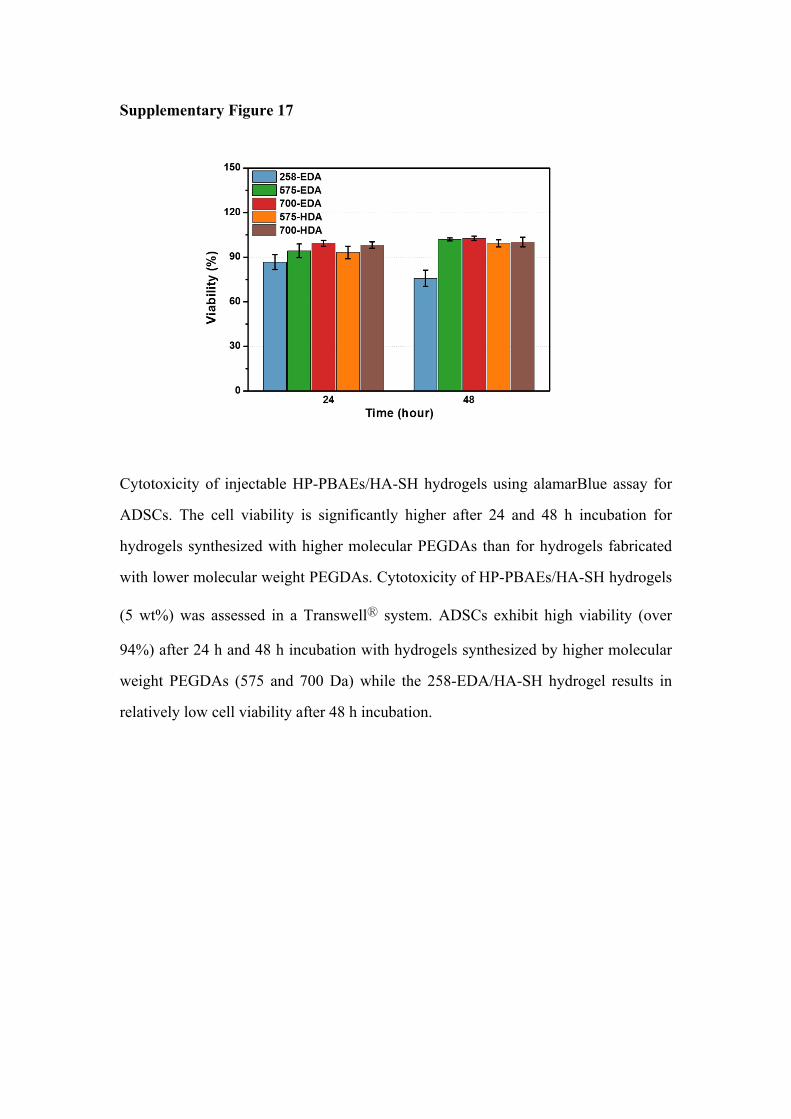
Supplementary Figure 17
Cytotoxicity of injectable HP-PBAEs/HA-SH hydrogels using alamarBlue assay for
ADSCs. The cell viability is significantly higher after 24 and 48 h incubation for
hydrogels synthesized with higher molecular PEGDAs than for hydrogels fabricated
with lower molecular weight PEGDAs. Cytotoxicity of HP-PBAEs/HA-SH hydrogels
(5 wt%) was assessed in a TranswellⓇ system. ADSCs exhibit high viability (over
94%) after 24 h and 48 h incubation with hydrogels synthesized by higher molecular
weight PEGDAs (575 and 700 Da) while the 258-EDA/HA-SH hydrogel results in
relatively low cell viability after 48 h incubation.
Supplementary Figure 18
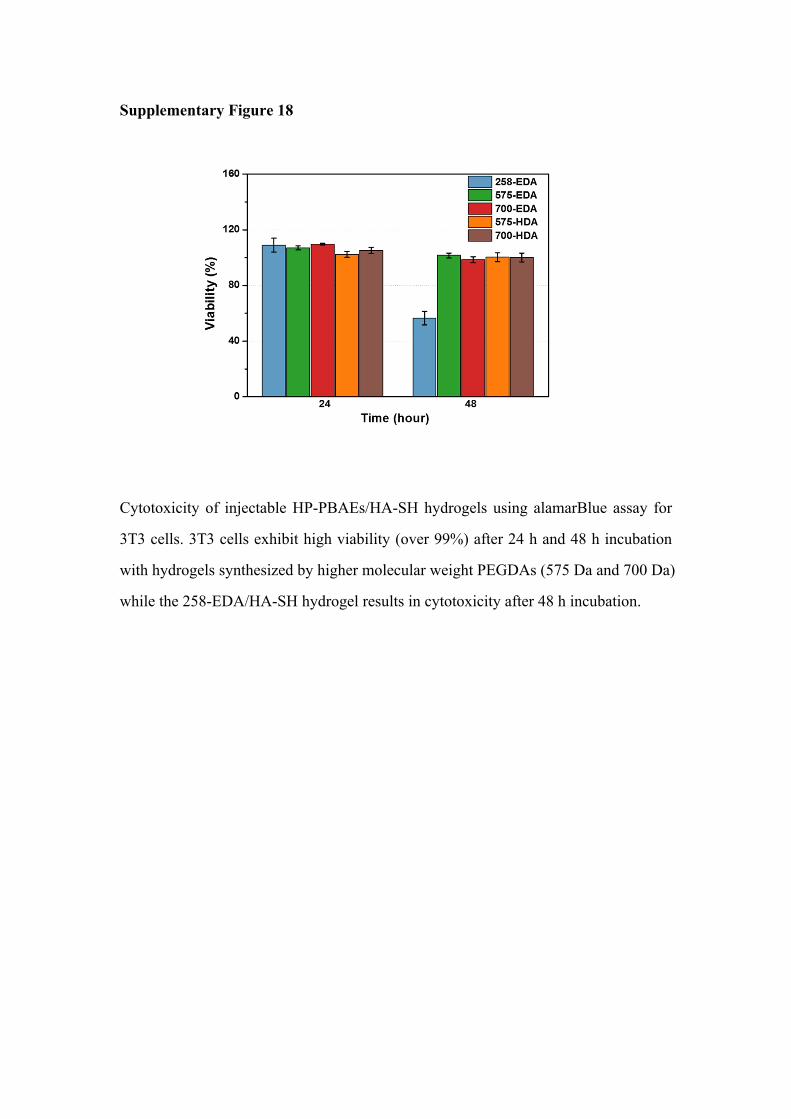
Cytotoxicity of injectable HP-PBAEs/HA-SH hydrogels using alamarBlue assay for
3T3 cells. 3T3 cells exhibit high viability (over 99%) after 24 h and 48 h incubation
with hydrogels synthesized by higher molecular weight PEGDAs (575 Da and 700 Da)
while the 258-EDA/HA-SH hydrogel results in cytotoxicity after 48 h incubation.
Supplementary Figure 19
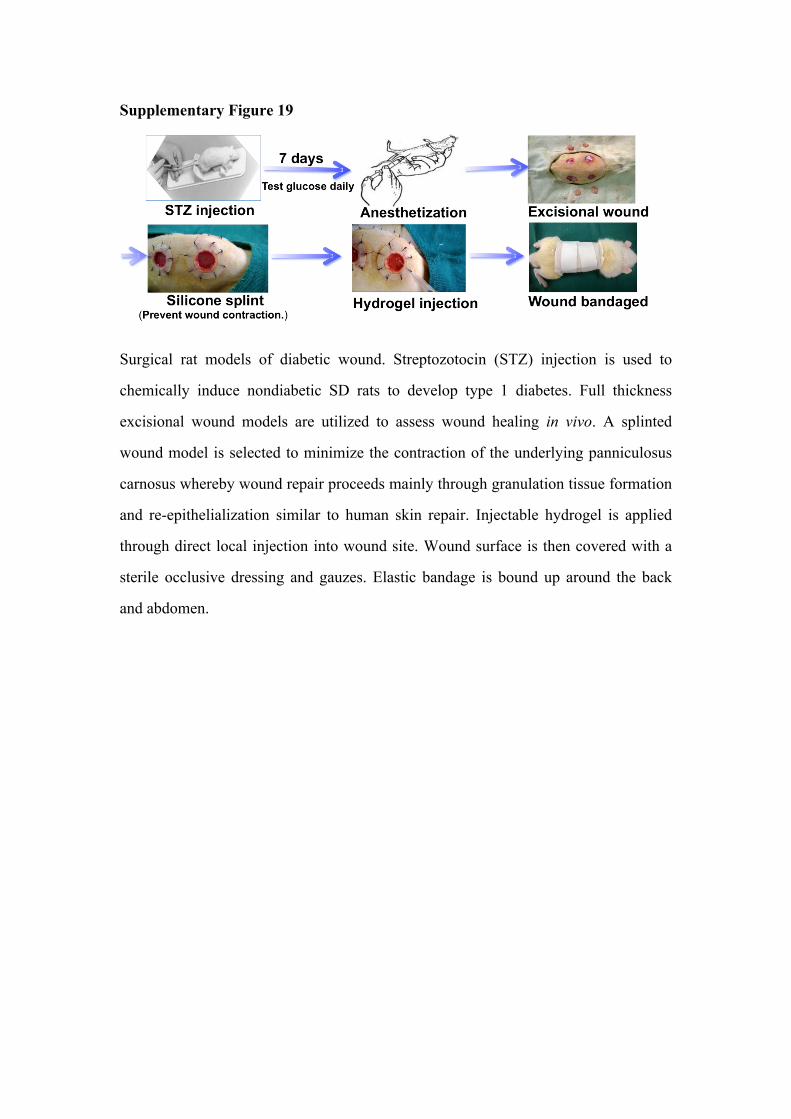
Surgical rat models of diabetic wound. Streptozotocin (STZ) injection is used to
chemically induce nondiabetic SD rats to develop type 1 diabetes. Full thickness
excisional wound models are utilized to assess wound healing in vivo. A splinted
wound model is selected to minimize the contraction of the underlying panniculosus
carnosus whereby wound repair proceeds mainly through granulation tissue formation
and re-epithelialization similar to human skin repair. Injectable hydrogel is applied
through direct local injection into wound site. Wound surface is then covered with a
sterile occlusive dressing and gauzes. Elastic bandage is bound up around the back
and abdomen.
Supplementary Figure 20
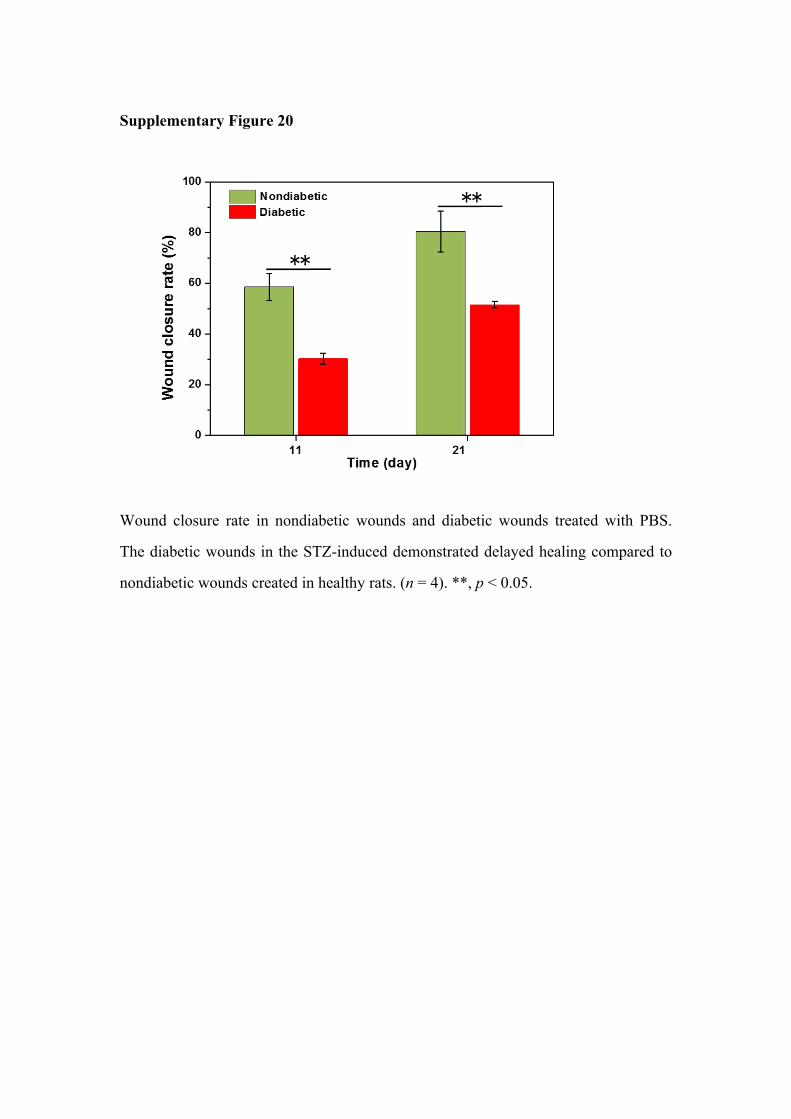
Wound closure rate in nondiabetic wounds and diabetic wounds treated with PBS.
The diabetic wounds in the STZ-induced demonstrated delayed healing compared to
nondiabetic wounds created in healthy rats. (n = 4). **, p < 0.05.
Supplementary Figure 21
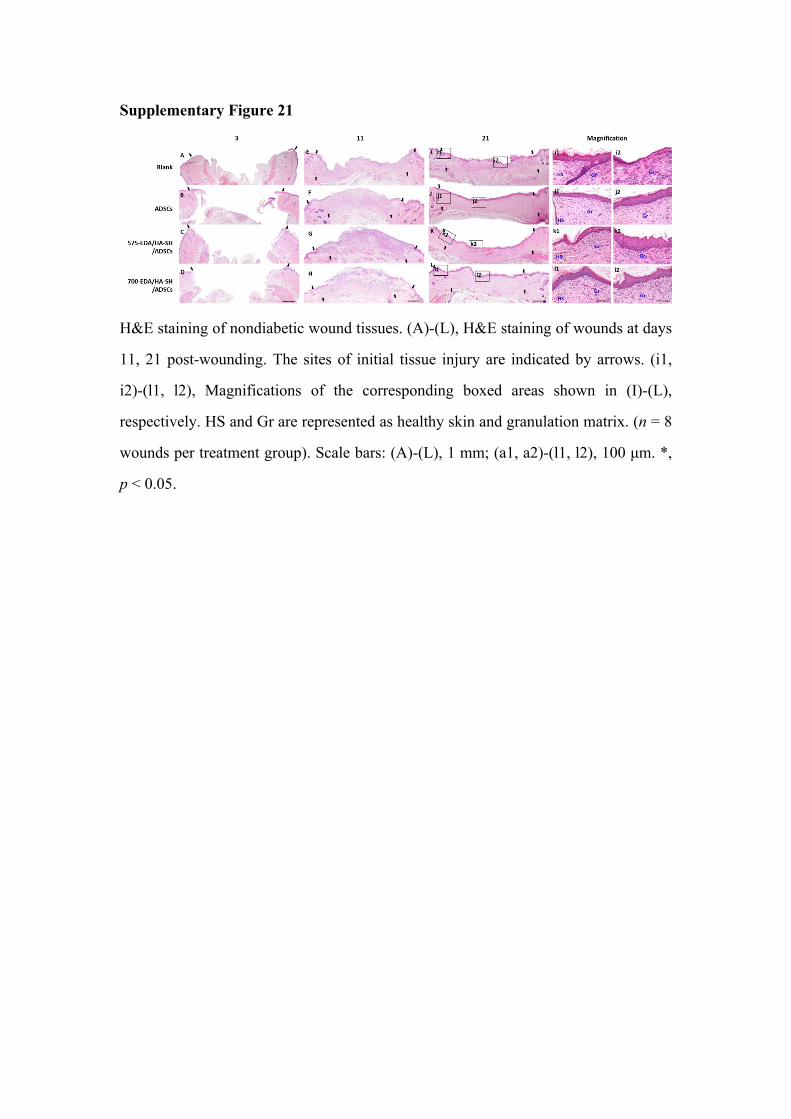
H&E staining of nondiabetic wound tissues. (A)-(L), H&E staining of wounds at days
11, 21 post-wounding. The sites of initial tissue injury are indicated by arrows. (i1,
i2)-(l1, l2), Magnifications of the corresponding boxed areas shown in (I)-(L),
respectively. HS and Gr are represented as healthy skin and granulation matrix. (n = 8
wounds per treatment group). Scale bars: (A)-(L), 1 mm; (a1, a2)-(l1, l2), 100 μm. *,
p < 0.05.
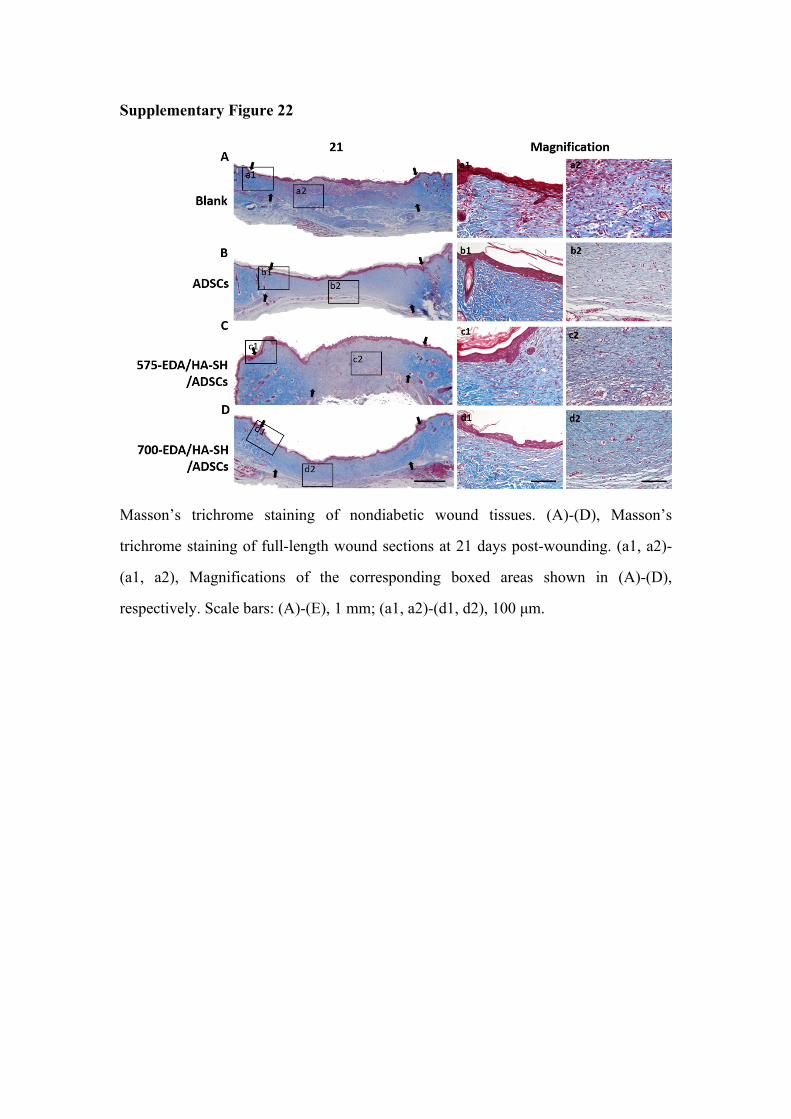
Supplementary Figure 22
Masson’s trichrome staining of nondiabetic wound tissues. (A)-(D), Masson’s
trichrome staining of full-length wound sections at 21 days post-wounding. (a1, a2)-
(a1, a2), Magnifications of the corresponding boxed areas shown in (A)-(D),
respectively. Scale bars: (A)-(E), 1 mm; (a1, a2)-(d1, d2), 100 μm.
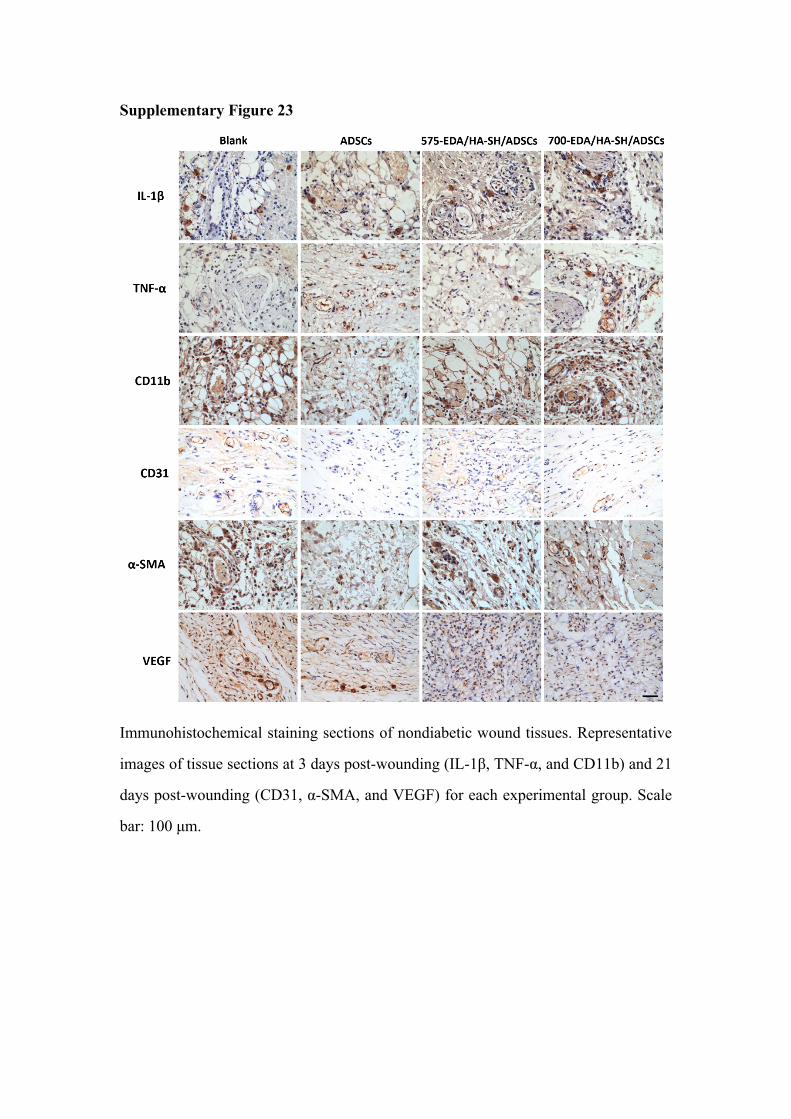
Supplementary Figure 23
Immunohistochemical staining sections of nondiabetic wound tissues. Representative
images of tissue sections at 3 days post-wounding (IL-1β, TNF-α, and CD11b) and 21
days post-wounding (CD31, α-SMA, and VEGF) for each experimental group. Scale
bar: 100 μm.
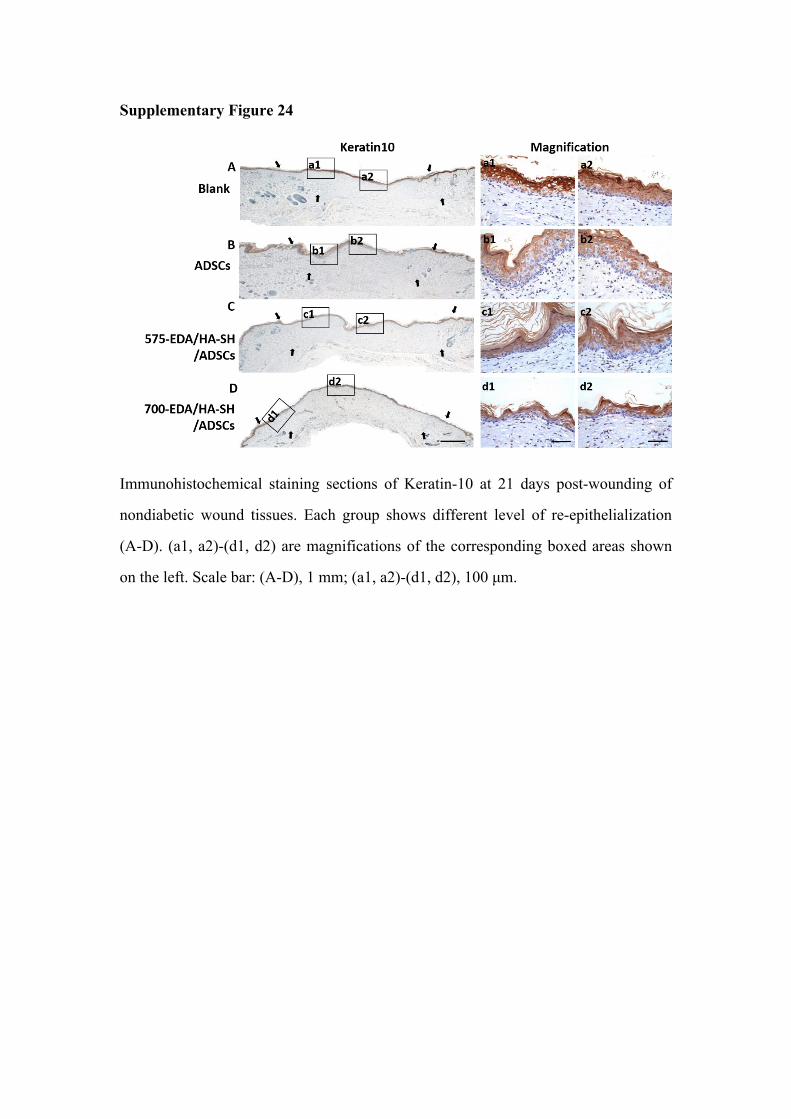
Supplementary Figure 24
Immunohistochemical staining sections of Keratin-10 at 21 days post-wounding of
nondiabetic wound tissues. Each group shows different level of re-epithelialization
(A-D). (a1, a2)-(d1, d2) are magnifications of the corresponding boxed areas shown
on the left. Scale bar: (A-D), 1 mm; (a1, a2)-(d1, d2), 100 μm.
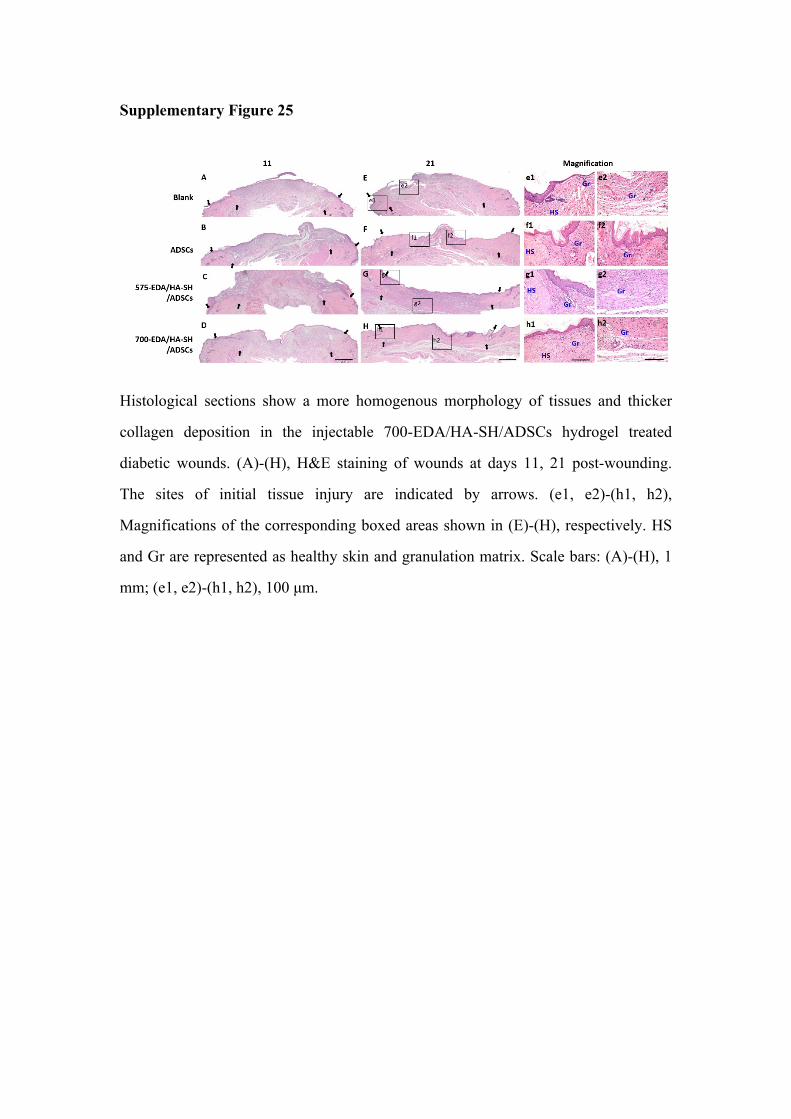
Supplementary Figure 25
Histological sections show a more homogenous morphology of tissues and thicker
collagen deposition in the injectable 700-EDA/HA-SH/ADSCs hydrogel treated
diabetic wounds. (A)-(H), H&E staining of wounds at days 11, 21 post-wounding.
The sites of initial tissue injury are indicated by arrows. (e1, e2)-(h1, h2),
Magnifications of the corresponding boxed areas shown in (E)-(H), respectively. HS
and Gr are represented as healthy skin and granulation matrix. Scale bars: (A)-(H), 1
mm; (e1, e2)-(h1, h2), 100 μm.
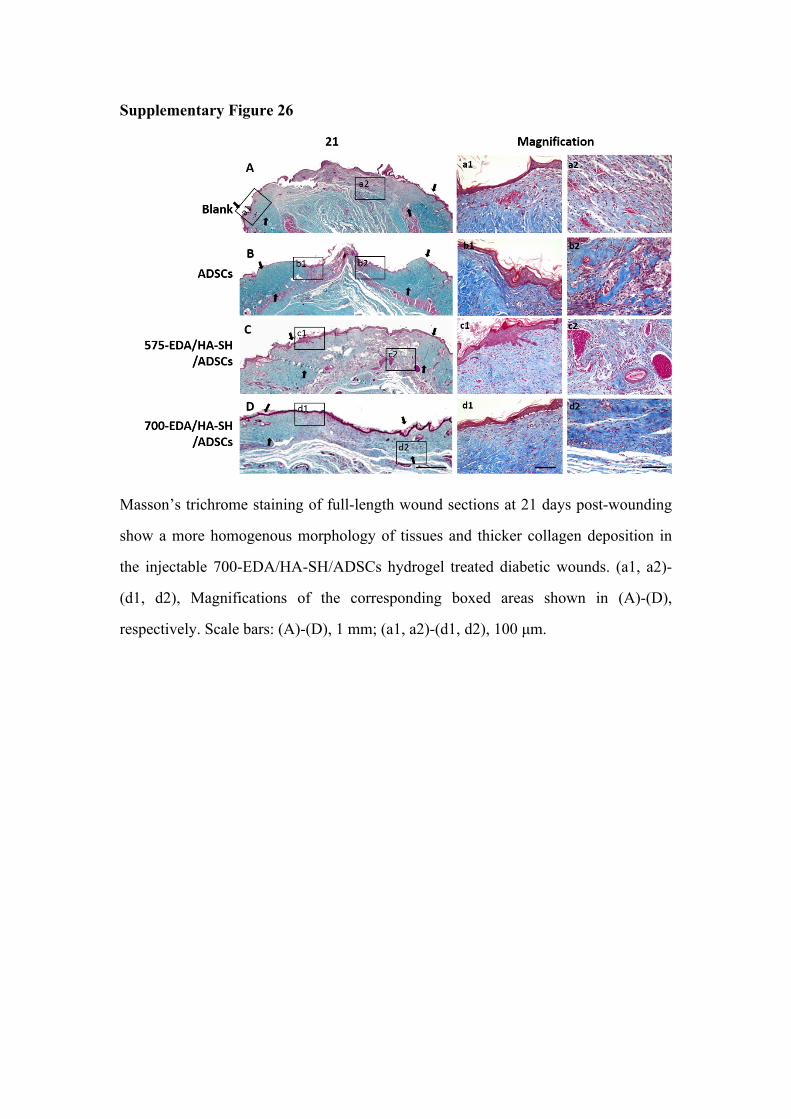
Supplementary Figure 26
Masson’s trichrome staining of full-length wound sections at 21 days post-wounding
show a more homogenous morphology of tissues and thicker collagen deposition in
the injectable 700-EDA/HA-SH/ADSCs hydrogel treated diabetic wounds. (a1, a2)-
(d1, d2), Magnifications of the corresponding boxed areas shown in (A)-(D),
respectively. Scale bars: (A)-(D), 1 mm; (a1, a2)-(d1, d2), 100 μm.
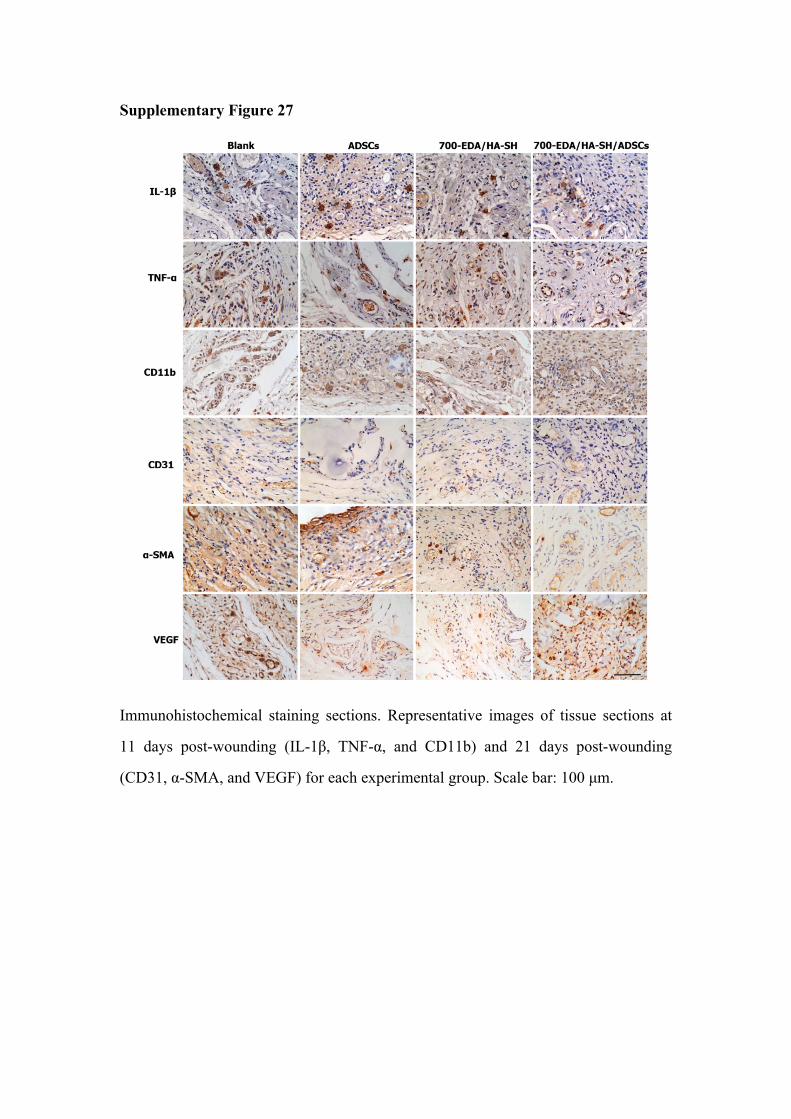
Supplementary Figure 27
Immunohistochemical staining sections. Representative images of tissue sections at
11 days post-wounding (IL-1β, TNF-α, and CD11b) and 21 days post-wounding
(CD31, α-SMA, and VEGF) for each experimental group. Scale bar: 100 μm.
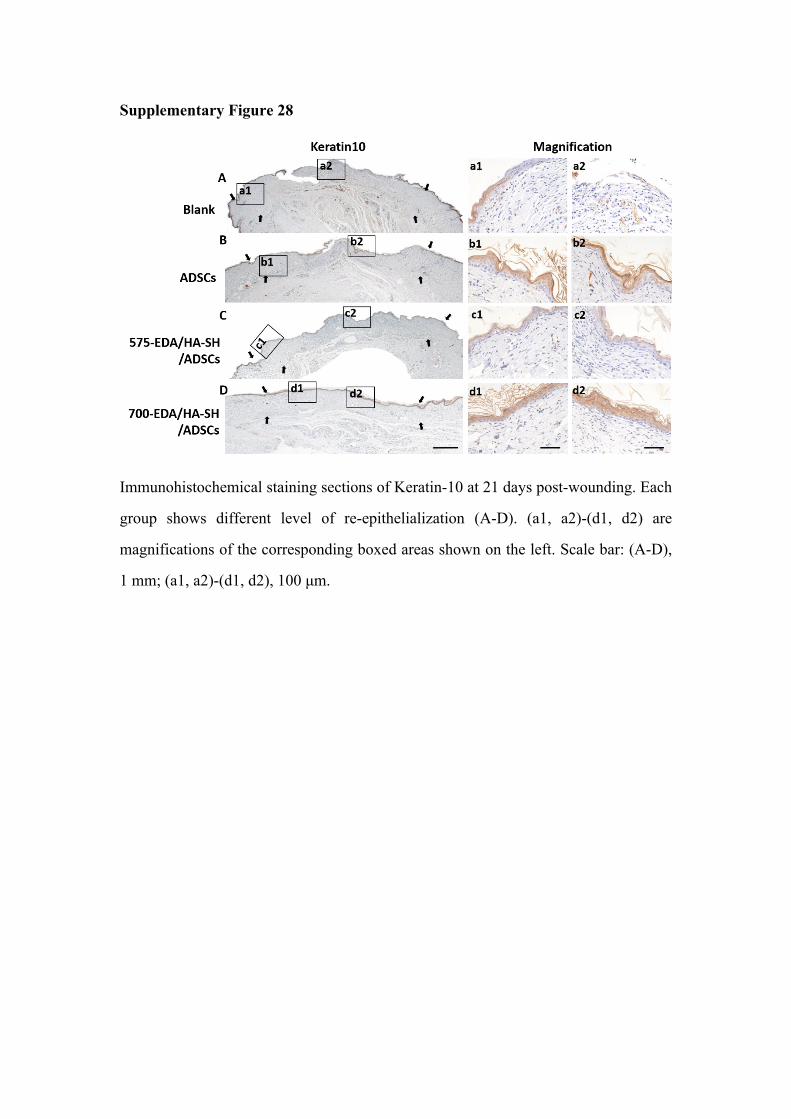
Supplementary Figure 28
Immunohistochemical staining sections of Keratin-10 at 21 days post-wounding. Each
group shows different level of re-epithelialization (A-D). (a1, a2)-(d1, d2) are
magnifications of the corresponding boxed areas shown on the left. Scale bar: (A-D),
1 mm; (a1, a2)-(d1, d2), 100 μm.


![Introduction Abstract - Neurology...medulla oblongata were dissected [27] and were stored in RNA later solution for RNA isolation. Whole brain (n = 5 per group) weighing 80-90mg) and](https://static.fdocument.org/doc/165x107/5f7aaac355c0bb44193d6438/introduction-abstract-neurology-medulla-oblongata-were-dissected-27-and.jpg)