Die Kinetik pulmonaler CD4+, CD8+, γδ T-Zellen, Apoptose ...
Transporters for Antiretroviral Drugs in Colorectal CD4+ T Cells and Circulating α4β7
Integrin CD4+ T cells: Implications for HIV Microbicides
Indrani Mukhopadhya†, §, Graeme I Murrayǁ, Linda Duncan§, Raif Yuecel§, Robin Shattockǂ,
Charles Kelly#, Francesco Iannelli┴, Gianni Pozzi┴, Emad M El-Omar§, Georgina L Hold§, ‡
and Karolin HijaziI†, §, ‡, *
† University of Aberdeen Dental School and Hospital, Aberdeen, UK.
§ Institute of Medical Sciences, University of Aberdeen, Aberdeen, UK.
ǁ Department of Pathology, School of Medicine & Dentistry, University of Aberdeen,
Aberdeen, UK.
ǂ Mucosal Infection & Immunity Group, Section of Infectious Diseases, Imperial College,
London, UK.
# King’s College London, Dental Institute, Mucosal & Salivary Biology, London, UK.
┴ Laboratory of Molecular Microbiology and Biotechnology, Department of Medical
Biotechnologies, University of Siena, Siena, Italy.
Corresponding Author:
* University of Aberdeen Dental School and Hospital, Cornhill Road, Foresterhill, Aberdeen,
AB25 2ZR. UK. Tel: +44 (0) 1224-555153. E-mail: [email protected]
‡ denotes authors contributed equally.
1
1
2
3
4
5
6
8
9
10
11
12
13
14
15
16
17
18
19
20
21
ABSTRACT
CD4+ T lymphocytes in the colorectal mucosa are key in HIV-1 transmission and
dissemination. As such they are also the primary target for anti-retroviral (ARV)-based rectal
microbicides for pre-exposure prophylaxis. Drug transporters expressed in mucosal CD4+ T
cells determine ARV distribution across the cell membrane and, most likely, efficacy of
microbicides. We describe transporters for antiretroviral drugs in colorectal mucosal CD4+ T
lymphocytes and compare gene expression with circulating α4β7+CD4+ T cells which traffic
to the intestine and have been shown to be preferentially infected by HIV-1. Purified total
CD4+ T cells were obtained from colorectal tissue and blood samples by magnetic
separation. CD4+ T cells expressing α4β7 integrin were isolated by fluorescence-activated
cell sorting from peripheral blood mononuclear cells of healthy volunteers. Expressions of 15
efflux and uptake drug transporter genes were quantified using Taqman qPCR assays.
Expression of efflux transporters MRP3, MRP5, BCRP and uptake transporter CNT2 was
significantly higher in colorectal CD4+ T cells compared to circulating CD4+ T cells
(p=0.01-0.03). Conversely, circulating α4β7+CD4+ T cells demonstrated significantly higher
expression of OATPD compared to colorectal CD4+ T cells (p=0.001). To the best of our
knowledge this is the first report of drug transporter gene expression in colorectal CD4+ and
peripheral α4β7+CD4+ T cells. The qualitative and quantitative differences in drug
transporter gene expression profiles between α4β7+CD4+ T cells and total mucosal CD4+ T
cells may have significant implications for the efficacy of rectally delivered ARV-
microbicides. Most notably, we have identified efflux drug transporters that could be targeted
by selective inhibitors or beneficial drug-drug interactions to enhance intracellular
accumulation of antiretroviral drugs.
2
22
23
24
25
26
27
28
29
30
31
32
33
34
35
36
37
38
39
40
41
42
43
44
45
KEY WORDS: efflux drug transporters; uptake drug transporters; gene expression; CD4+ T
cells; α4β7 integrin; colorectal mucosa
3
46
47
TABLE OF CONTENTS GRAPHIC
4
48
49

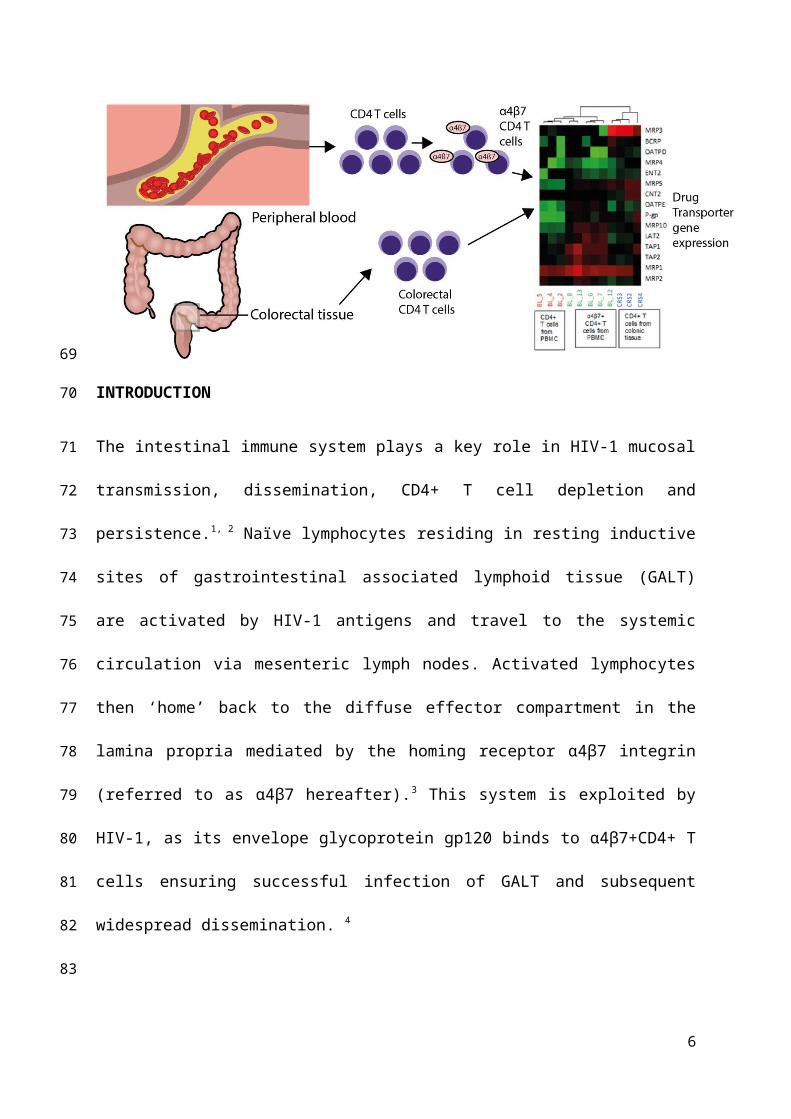
INTRODUCTION
The intestinal immune system plays a key role in HIV-1 mucosal transmission,
dissemination, CD4+ T cell depletion and persistence.1, 2 Naïve lymphocytes residing in
resting inductive sites of gastrointestinal associated lymphoid tissue (GALT) are activated by
HIV-1 antigens and travel to the systemic circulation via mesenteric lymph nodes. Activated
lymphocytes then ‘home’ back to the diffuse effector compartment in the lamina propria
mediated by the homing receptor α4β7 integrin (referred to as α4β7 hereafter).3 This system
is exploited by HIV-1, as its envelope glycoprotein gp120 binds to α4β7+CD4+ T cells
ensuring successful infection of GALT and subsequent widespread dissemination. 4
Antiretroviral (ARV)-containing rectal microbicides aimed at pre-exposure prophylaxis
should prevent infection of resident colorectal CD4+ T cells including the preferentially
infected α4β7+CD4+ T cells.5 Absorption of ARV drugs through the mucosa and
concentration within target CD4+ T cells are determined by expression of drug transporters.
The ATP-binding cassette (ABC) and solute carrier (SLC) transporter families are the
predominant efflux and uptake drug transporters, respectively. Their expression in
5
50
51
52
53
54
55
56
57
58
59
60
61
62
63
64
65
66
submucosal CD4+ T cells determines intracellular concentration, and ultimately efficacy, of
ARV drugs.6
To date there are no data on the expression of drug transporters in resident colorectal CD4+ T
cells and most of our knowledge is extrapolated from data relating to peripheral blood
mononuclear cells (PBMC).6-9 This study investigates drug transporter gene expression in
colorectal CD4+ T cells and peripheral gut-homing α4β7+CD4+ T cells. Analyses included
the efflux and uptake transporters which were most highly expressed in circulating CD4+ T
cells, those involved in transport of ARV drugs and those which expression is induced or
suppressed by ARV drugs.10, 20 Understanding of the balance of ARV drugs efflux and uptake
across the cell membrane of colorectal CD4+ T cells is critical for designing rectal
microbicides with maximal efficacy as well as predicting drug resistance and drug-drug
interactions.
EXPERIMENTAL SECTION
Tissue and blood samples
Fresh, morphologically normal human colonic mucosal samples were obtained from four
subjects (age range 54-73 years, 3 male and 1 female) undergoing surgery for left-sided
colorectal cancer at Aberdeen Royal Infirmary through NHS Grampian Biorepository (tissue
bank request number TR000037). Tissue for drug transporter analyses was sampled at a
10cm-margin from the tumour. Absence of tumour at the resective margin was documented
morphologically and histologically to ensure that assessment was done on normal colorectal
tissue. Patients did not receive cytotoxic drugs, immunosuppressive drugs or antibiotics in the
four weeks prior to surgery. Blood samples were collected from eight healthy donors (age
range 22-45 years; 3 male and 5 female) under ethical approval from the University of
6
67
68
69
70
71
72
73
74
75
76
77
78
79
80
81
82
83
84
85
86
87
88
89
90
91
Aberdeen Ethics Review Board (CERB/2014/1/987). Subjects were recruited after written
informed consent and the study was conducted according to local Research Ethics Committee
policies and the Declaration of Helsinki.
Isolation of CD4+ T cells from whole blood and colorectal mucosal samples
Whole blood samples were collected in BD Vacutainer™ EDTA tubes (Fisher Scientific,
UK) and peripheral blood mononuclear cells (PBMC) were isolated from freshly collected
blood by density gradient centrifugation using LymphoprepTM (Stemcell Technologies)
following manufacturer’s instructions. The dissected colonic mucosal samples were placed in
15 ml FalconTM tubes containing DMEM (Sigma, UK) supplemented with 10 % foetal calf
serum (FCS, Sigma, UK), 2 mM L-glutamine (Sigma, UK) and antibiotics (100 U penicillin,
100 µg of streptomycin, and 50 µg of gentamicin/ml, Sigma UK). Samples were immediately
placed on ice for transfer to the laboratory and the isolation procedure was initiated within an
hour of collection. Tissue samples were washed and dissected into ~2 mm pieces in a sterile
Petri dish using a disposable scalpel. Samples were next transferred to a gentleMACS™ C
tube (Miltenyi Biotec Ltd) containing 4 ml digestion buffer (DMEM/F12 supplemented with
1% penicillin/streptomycin, 12 mM HEPES and 2 mg/mL Collagenase) and dissociated using
the 37C_h_TDK_2 setting of a gentleMACS™ Octo Dissociator with heaters (Miltenyi
Biotec Ltd) for 1 hour 1 minute. The process was repeated twice and the cell suspension was
filtered through a 70 µm cell strainer (BD Biosciences). The resulting single-cell suspension
was washed with phosphate buffered saline (PBS) and counted using a haemocytometer with
trypan blue exclusion to analyse cell yield. Purified total CD4+ T cells were obtained from
both PBMC and colorectal tissue cell suspensions by negative selection (~ 90 % purity) using
magnetic activated cell sorting (MACS) LS columns (Miltenyi Biotec Ltd) and human CD4+
7
92
93
94
95
96
97
98
99
100
101
102
103
104
105
106
107
108
109
110
111
112
113
114
115
T Cell Isolation Kit for the isolation of untouched CD4+ T cells (Miltenyi Biotec Ltd)
following manufacturer’s instructions.
Isolation of α4β7+CD4+ T cells by Fluorescent antibody-based cell sorting
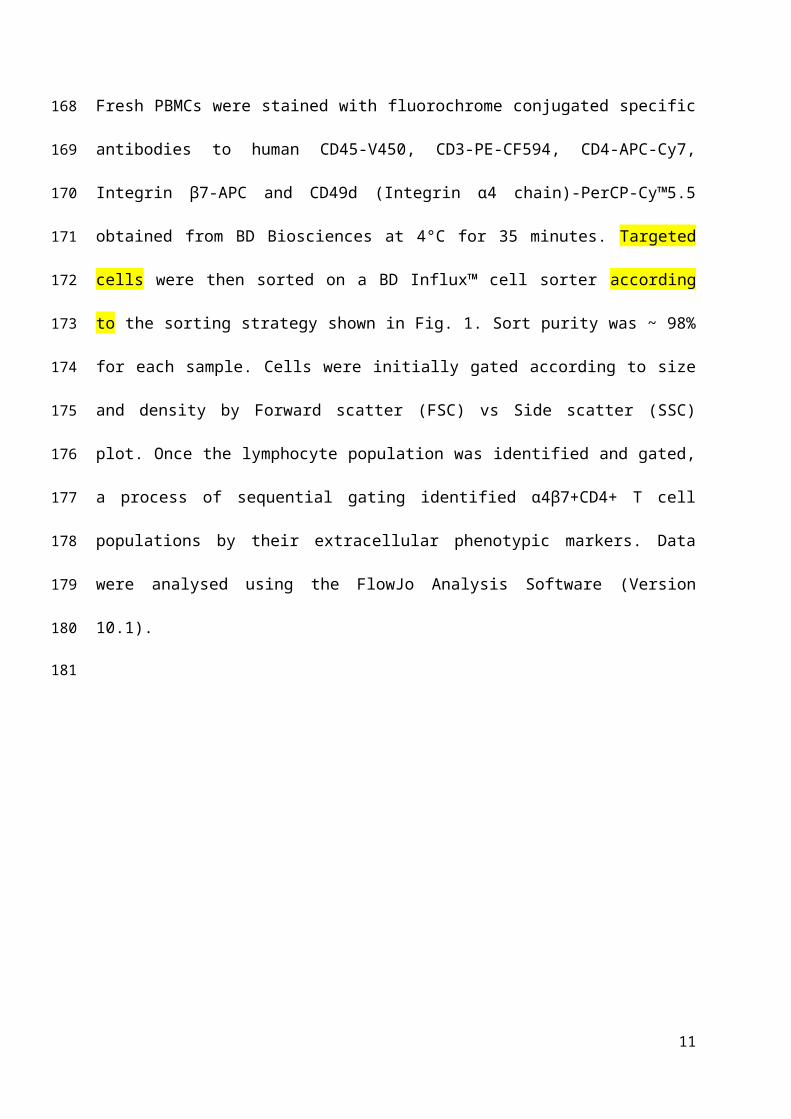
Fresh PBMCs were stained with fluorochrome conjugated specific antibodies to human
CD45-V450, CD3-PE-CF594, CD4-APC-Cy7, Integrin β7-APC and CD49d (Integrin α4
chain)-PerCP-Cy™5.5 obtained from BD Biosciences at 4°C for 35 minutes. Targeted cells
were then sorted on a BD Influx™ cell sorter according to the sorting strategy shown in Fig.
1. Sort purity was ~ 98% for each sample. Cells were initially gated according to size and
density by Forward scatter (FSC) vs Side scatter (SSC) plot. Once the lymphocyte population
was identified and gated, a process of sequential gating identified α4β7+CD4+ T cell
populations by their extracellular phenotypic markers. Data were analysed using the FlowJo
Analysis Software (Version 10.1).
8
116
117
118
119
120
121
122
123
124
125
126
127
128
129
Figure 1: Representative flow cytometry analysis of CD45+CD3+CD4+α4β7+ T-cell subgroups. A hierarchical gating strategy identified
single lymphocytes in peripheral blood mononuclear cells (PBMC) using scatter plot (FSC vs SSC). Subsequent gating analysis on fluorescence
allowed the identification of CD45+ lymphocytes, CD3+CD4+ helper T-cells and the target subset of α4β7+CD4+ T lymphocytes (CD49d vs
Integrin β7).
9
CD45+ CD3+ CD4+ α4β7+CD45+ CD3+ CD4+
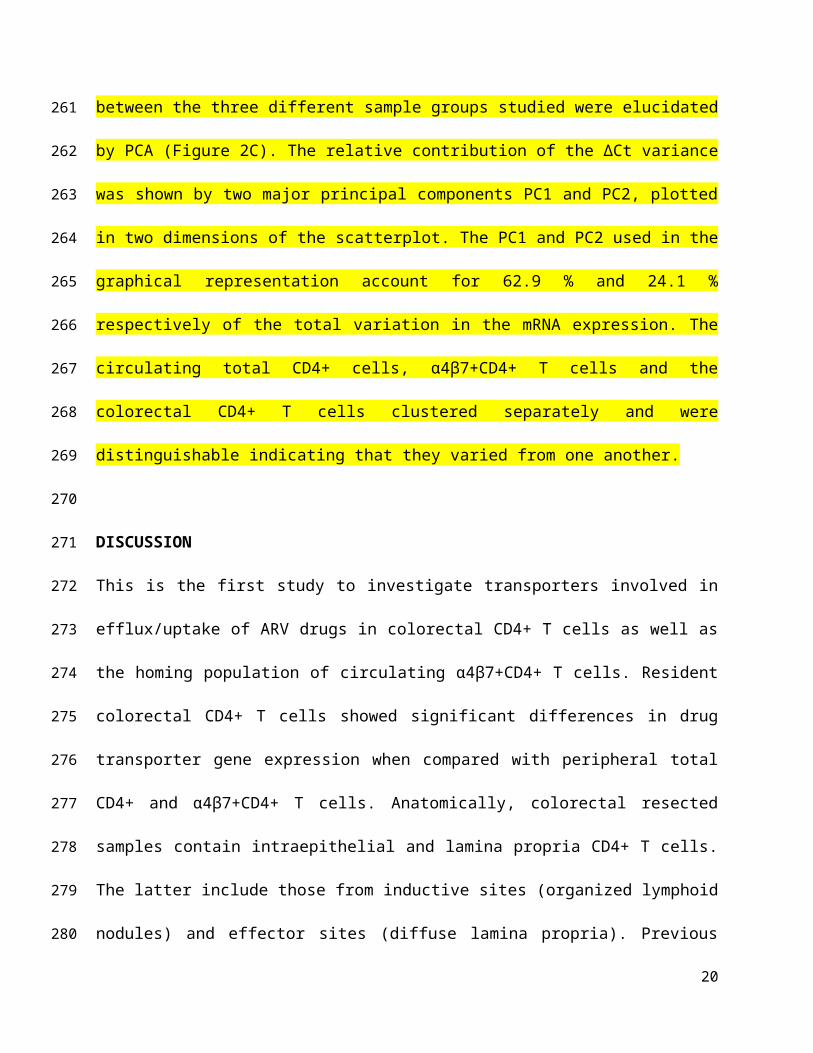
CD45+Lymphocytes Singlets
Quantitative RT-PCR
RNA, cDNA preparation and quantitative RT-PCR were done according to methods
described previously.10 Fifteen drug transporter genes and 2 housekeeper genes (PPIA and
PGK1) were analysed using Taqman® gene expression assays (Life Technologies, UK). Out
of the 15 drug transporter genes selected for the study, twelve transporters (Pg-p, BCRP,
MRP1-5, MRP10, CNT2, ENT2, OATPE and OATPD) were chosen as they were the most
relevant in ARV transport. The other three transporters (LAT2, TAP1 and TAP2) were
included as they were found to be amongst the most highly expressed genes in a preliminary
study where we analysed eighty-four drug transporter genes in total CD4+ T cells isolated
from PBMC using TaqMan® Array 96-well Fast plates for Human Drug Transporters (Life
Technologies) (data not shown). Relative gene expression was determined using the
comparative CT method11 where gene expression of total CD4+ T cells or a Human universal
reference RNA (Clontech, CA, USA) were used as reference.
Statistical methods
Expression differences between mucosal and circulating CD4+ T cells were assessed by two-
tailed t-test with significance at P<0.05. Pearson’s product moment correlation (r) was used
for individual sample comparisons and hierarchical clustering of ∆CT values. Principal
component analysis (PCA) was also based on ∆CT values. SPSS 23 (IBM Corp; Armonk,
NY) was used for all analyses.
RESULTS
Drug transporter mRNA expression in colorectal CD4+ T cells
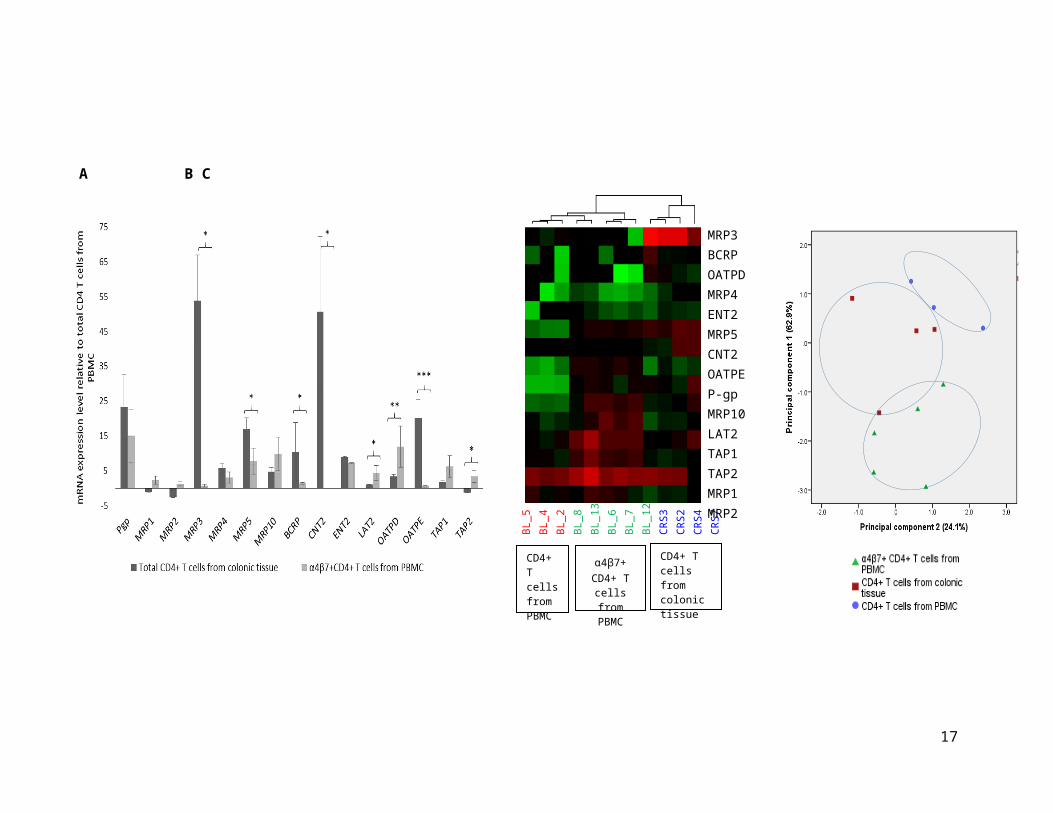
In colorectal CD4+T cells, MRP3 and CNT2 were the highest expressed efflux and uptake
transporters, respectively. Expression levels of all 15 drug transporters in total colorectal
10
130
131
132
133
134
135
136
137
138
139
140
141
142
143
144
145
146
147
148
149
150
151
152
153
154
CD4+ T cells is shown in Fig. 2. The overall expression profile was variable between
subjects with 3 out of 4 individuals showing no significant differences of expression (r=0.19-
0.89, p=0.502-0.0001) as confirmed by hierarchical clustering (Fig. 2B) and PCA analyses
(Fig. 2C).
11
155
156
157
158
159
Figure 2: Comparison of drug transporter mRNA expression between colorectal CD4+
T cells and circulating CD4+ T cells isolated from PBMC. Panel A shows mean (± SD)
relative quantitation values of mRNA expression for the 15 drug transporter genes (*P<0.05;
**P<0.01 and ***P<0.001). Panel B shows hierarchical clustering of mRNA expression of
15 drug transporter genes in the 3 groups: CD4+ T cells from colorectal tissue (n=4),
α4β7+CD4+ T cells from PBMC (n=5) and CD4+ T cells isolated from PBMC (n=3).
Distances between samples and assays were calculated for hierarchical clustering based on
the ΔCT values using Pearson’s correlation. Two endogenous control genes (PGK1 and
PPIA) were used for normalization and the ΔCT values were calculated by subtracting the
mean of the CT values of the endogenous controls from the CT value of the gene for each
sample. The ΔCT value of the neutral/middle expression level (mean) is set such that red
indicates an increase with a ΔCT value below the middle level, and green indicates a
decrease, with a ΔCT value above the middle level. The relationship between colours and
normalized values of gene expression is illustrated in the key at the top of the figure. The
rows of the heat map represent 15 drug transporter genes and the columns represent samples.
Panel C shows the principal component analysis of gene expression profiles generated from
the three different groups. Relative contribution of the ∆Ct variance is shown by two major
principal components (PC1 and PC2) plotted in two dimensions. Pgp = P-glycoprotein, MRP
= Multidrug Resistance-associated Protein, BCRP = Breast Cancer Resistance Protein, CNT
= Concentrative Nucleoside Transporter, ENT = Equilibrative Nucleoside Transporter, LAT
= Large-neutral Amino Acid Transporter, OATP = Organic Anion-Transporting
Polypeptides, TAP = Transporter associated with Antigen Processing.
12
13
A B C
MRP3BCRPOATPDMRP4ENT2MRP5CNT2OATPEP-gpMRP10LAT2TAP1TAP2MRP1MRP2
BL_5 BL_4BL_2BL_8BL_13BL_6BL_7BL_12CRS3CRS2CRS4CRS7
CD4+ T cells from colonic tissue
α4β7+ CD4+ T
cells from PBMC
CD4+ T cells from PBMC
Drug transporter mRNA expression in total and α4β7+CD4+ T cells circulating cells
The efflux and uptake drug transporters highest expressed in total circulating CD4+ T cells were
MRP1 and LAT2, respectively (Fig. 2B). Expression of α4β7 integrin on circulating CD4+ T
cells ranged from 5-15% (representative sample shown in Fig. 1) of the total CD4+ T cells
between the individuals and was consistent with previous findings.12, 13 In circulating
α4β7+CD4+ T cells, the most expressed efflux and uptake transporters, were P-gp and OATPD,
respectively. Expression levels of all 15 drug transporters in α4β7+CD4+ T cells relative to the
total CD4+ T cells is shown in Fig. 2. There was no expression of CNT2. No significant
difference was noted between individual subjects for either α4β7+CD4+ T cells (r=0.72-0.97,
p=0.004-0.0001) or total CD4+ T cells (r=0.91-0.97, p<0.0001) as confirmed by hierarchical
clustering (Fig. 2B) and PCA analyses (Fig. 2C).
Comparison between expression in colorectal CD4+ T cells and circulating α4β7+CD4+ T
cells
Comparison of expression of drug transporters between colorectal CD4+ T cells and circulating
α4β7+CD4+ T cells showed high expression of P-gp for both cell types with no statistical
difference noted between each other (Fig. 2A). Expression of efflux transporters MRP3, MRP5
and BCRP was significantly higher in colorectal CD4+ T cells (p=0.01-0.03 respectively).
Among uptake transporters, CNT2 and OATPE were predominantly expressed in colorectal
CD4+ T cells (p=0.005-0.03). Conversely, circulating α4β7+CD4+ T cells demonstrated
significantly higher expression of OATPD, LAT2 and TAP2, respectively (p=0.001-0.04).
14
160
161
162
163
164
165
166
167
168
169
170
171
172
173
174
175
176
177
178
179
180
181
Heat maps were generated to visualize hierarchical clustering between the three different groups
of samples and gene expression levels (Fig 2B). The mRNA expression profile of all the 15
target genes in the samples were tested by hierarchical cluster analysis of ∆Ct values. Analyses
indicated that samples fell into two distinct clusters as indicated by the branching shown above
Figure 2B. The circulating total CD4+ and α4β7+CD4+ T cells fell into one cluster and the
colorectal CD4+ T cells clustered separately from them. The distinct patterns of gene expression
between the three different sample groups studied were elucidated by PCA (Figure 2C). The
relative contribution of the ∆Ct variance was shown by two major principal components PC1 and
PC2, plotted in two dimensions of the scatterplot. The PC1 and PC2 used in the graphical
representation account for 62.9 % and 24.1 % respectively of the total variation in the mRNA
expression. The circulating total CD4+ cells, α4β7+CD4+ T cells and the colorectal CD4+ T
cells clustered separately and were distinguishable indicating that they varied from one another.
DISCUSSION
This is the first study to investigate transporters involved in efflux/uptake of ARV drugs in
colorectal CD4+ T cells as well as the homing population of circulating α4β7+CD4+ T cells.
Resident colorectal CD4+ T cells showed significant differences in drug transporter gene
expression when compared with peripheral total CD4+ and α4β7+CD4+ T cells. Anatomically,
colorectal resected samples contain intraepithelial and lamina propria CD4+ T cells. The latter
include those from inductive sites (organized lymphoid nodules) and effector sites (diffuse
lamina propria). Previous estimates of α4β7 expression in CD4+ T cells ranged from 30% in
intraepithelial cells to around 70% in lamina propria cells.14 Therefore, colorectal CD4+ drug
transporter gene expression represents the amalgamation of all subtypes, of which α4β7+CD4+ T
15
182
183
184
185
186
187
188
189
190
191
192
193
194
195
196
197
198
199
200
201
202
203
204
cells are a variable component. Our findings have important clinical implications as all CD4+ T
cells subtypes in the colorectal mucosa are potentially susceptible to HIV-1 infection and
therefore contribute to virus spread from the anorectal route.
Highly expressed drug transporters in colorectal CD4+ T cells were the efflux transporters
MRP3, P-gp, MRP5 and BCRP (in decreasing order of expression) and uptake transporters
CNT2 and OATPE. A summary of the differential expression of drug transporters in colorectal
CD4+ T cells and peripheral α4β7+CD4+ T cells is summarized in Table 1 with its implications
on potential ARV substrates and inhibitors.
Protease inhibitors (PIs) including darunavir, in the pipeline for development of vaginal
microbicides, are substrates of P-gp15, 16, highly expressed in both colorectal CD4+ T cells and
peripheral α4β7+CD4+ T cells. P-gp as well as BCRP, expressed at significantly higher levels in
colorectal CD4+ T cells, also mediate efflux of nucleoside/nucleotide reverse transcriptase
inhibitors (NRTIs) such as tenofovir disoproxil fumarate and abacavir.17, 18 This could adversely
impact concentration of these drugs within colorectal CD4+ T cells. Equally, expression of
MRP5 may reduce intracellular concentrations of phosphorylated nucleoside analogues such as
stavudine which are MRP5 substrates.19 This could also be true for NRTIs like tenofovir, which
may be impacted by the high expression of MRP4 in both colorectal CD4+ T cells and peripheral
α4β7+CD4+ T cells. However, other efflux transporters which reduce intracellular accumulation
of antiretroviral drugs (MRP1 and MRP2)20 were not highly expressed in these cells. In addition,
the highly expressed efflux transporter MRP3 is inhibited by NRTIs as well as non-nucleoside
reverse transcriptase inhibitors (NNRTIs) like efavirenz, emtricitabine and delaviridine in vitro21
16
205
206
207
208
209
210
211
212
213
214
215
216
217
218
219
220
221
222
223
224
225
226
227
which may therefore preferentially accumulate in colorectal CD4+ T cells. Among uptake
transporters, CNT2 was exclusively expressed in colorectal CD4+ T cells. This may result in
enhanced intracellular concentration of certain nucleoside analogue drugs like didanosine.22
Drug transporter gene expression in peripheral CD4+ T cells has been well characterized
previously8, 9, 20, 23 but has been documented in α4β7+CD4+ T cells for the first time in this study.
PCA analysis shows that α4β7+CD4+ T cells are distinct from total circulating as well as
colorectal CD4+ T cells. Previous studies have demonstrated enhanced ENT2 expression in
peripheral CD4+ T cells upon activation.7 In contrast, our study showed modest expression of
ENT2 which could be explained by the quiescent state of cells here analysed. We observed
differential expression of OATP uptake transporters between colorectal CD4+ and α4β7+CD4+
circulating T cells with OATPD predominantly expressed in α4β7+CD4+ T cells and OATPE
expressed primarily in colorectal CD4+ T cells. PIs are both substrates and inhibitors of OATP
transporters20 and their uptake by the two CD4+ T cell types may be differentially reduced. Two
other transporters, LAT2 and TAP2 were expressed more in α4β7+CD4+ T cells. The former is
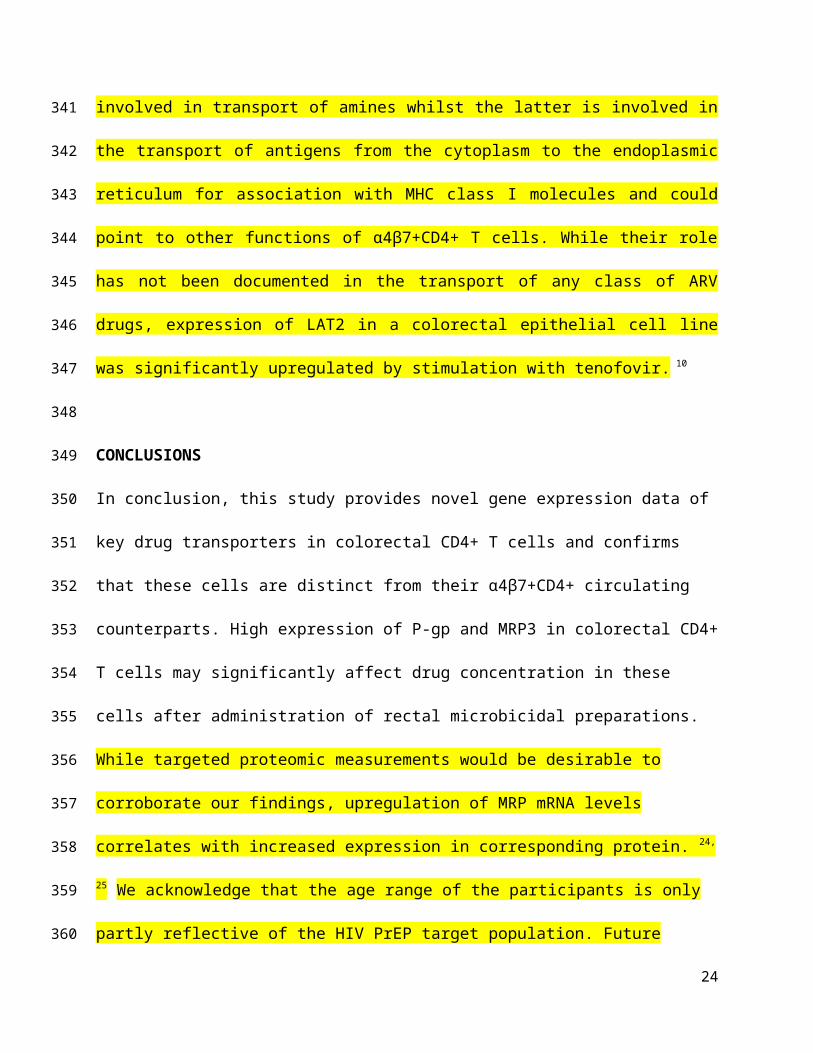
primarily involved in transport of amines whilst the latter is involved in the transport of antigens
from the cytoplasm to the endoplasmic reticulum for association with MHC class I molecules
and could point to other functions of α4β7+CD4+ T cells. While their role has not been
documented in the transport of any class of ARV drugs, expression of LAT2 in a colorectal
epithelial cell line was significantly upregulated by stimulation with tenofovir. 10
CONCLUSIONS
17
228
229
230
231
232
233
234
235
236
237
238
239
240
241
242
243
244
245
246
247
248
249

In conclusion, this study provides novel gene expression data of key drug transporters in
colorectal CD4+ T cells and confirms that these cells are distinct from their α4β7+CD4+
circulating counterparts. High expression of P-gp and MRP3 in colorectal CD4+ T cells may
significantly affect drug concentration in these cells after administration of rectal microbicidal
preparations. While targeted proteomic measurements would be desirable to corroborate our
findings, upregulation of MRP mRNA levels correlates with increased expression in
corresponding protein. 24, 25 We acknowledge that the age range of the participants is only partly
reflective of the HIV PrEP target population. Future larger scale studies may investigate drug
transporter expression in CD4+ T cells in relation to age. Nonetheless, our data along with our
previous findings of drug transporter expression in colorectal epithelium 10 will inform
optimisation of rectal microbicides through beneficial combinations of ARV drugs or addition of
selective inhibitors of efflux transporters. Functional assessment of drug transporters expressed
in colorectal CD4+ T cells is needed to elucidate their role in distribution of topically-applied
ARV drugs. In vivo pharmacokinetic studies on patients with HIV infection may be the ideal
model to analyse drug transporters in colorectal CD4+ T cells and document their response to
ARV microbicides. This is, however, hampered by the very low yield of CD4+ T cells from
endoscopic colorectal biopsies. This study is a useful surrogate to assess the potential effect of
rectal ARV microbicides on colorectal CD4+ T cells which are the target cells for anorectal
acquisition of HIV-1 infection.
18
250
251
252
253
254
255
256
257
258
259
260
261
262
263
264
265
266
267
268
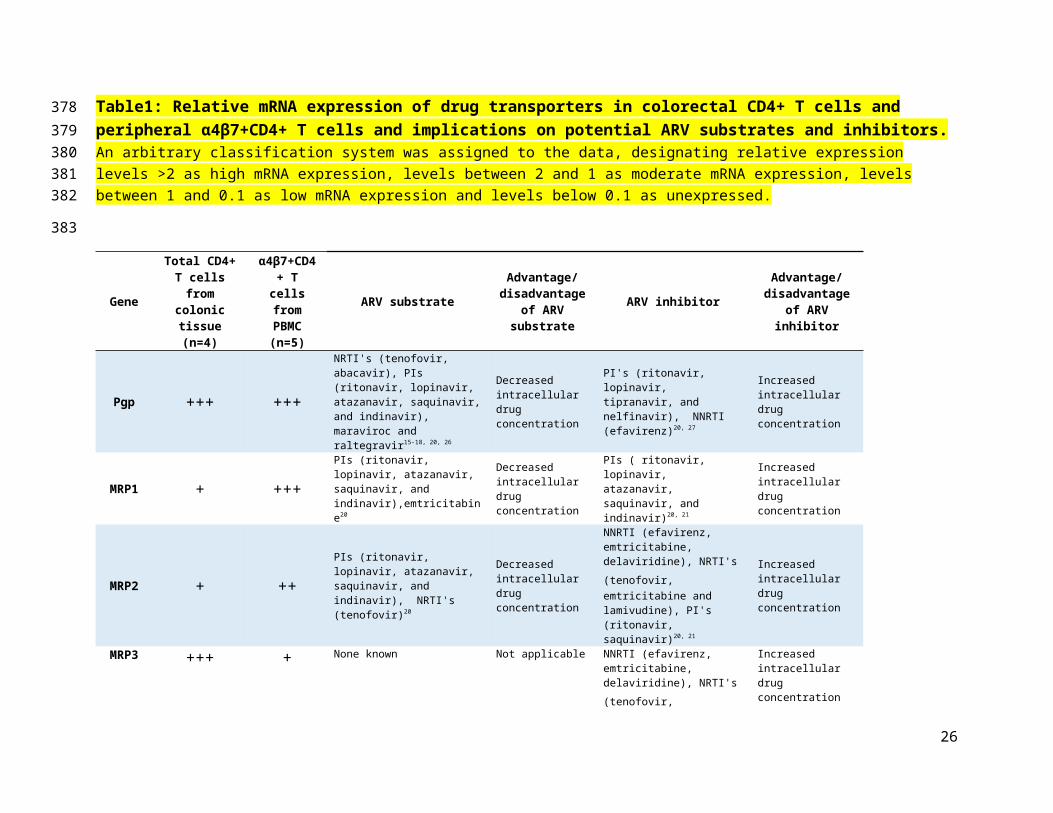
Table1: Relative mRNA expression of drug transporters in colorectal CD4+ T cells and peripheral α4β7+CD4+ T cells and implications on potential ARV substrates and inhibitors. An arbitrary classification system was assigned to the data, designating relative expression levels >2 as high mRNA expression, levels between 2 and 1 as moderate mRNA expression, levels between 1 and 0.1 as low mRNA expression and levels below 0.1 as unexpressed.
GeneTotal CD4+ T
cells from colonic tissue
(n=4)
α4β7+CD4+ T cells from
PBMC (n=5)
ARV substrateAdvantage/
disadvantage of ARV substrate
ARV inhibitorAdvantage/
disadvantage of ARV inhibitor
Pgp +++ +++
NRTI's (tenofovir, abacavir), PIs (ritonavir, lopinavir, atazanavir, saquinavir, and indinavir), maraviroc and raltegravir15-18, 20, 26
Decreased intracellular drug concentration
PI's (ritonavir, lopinavir, tipranavir, and nelfinavir), NNRTI (efavirenz)20, 27
Increased intracellular drug concentration
MRP1 + +++PIs (ritonavir, lopinavir, atazanavir, saquinavir, and indinavir),emtricitabine20
Decreased intracellular drug concentration
PIs ( ritonavir, lopinavir, atazanavir, saquinavir, and indinavir)20, 21
Increased intracellular drug concentration
MRP2 + ++PIs (ritonavir, lopinavir, atazanavir, saquinavir, and indinavir), NRTI's (tenofovir)20
Decreased intracellular drug concentration
NNRTI (efavirenz, emtricitabine, delaviridine), NRTI's (tenofovir, emtricitabine and lamivudine), PI's (ritonavir, saquinavir)20, 21
Increased intracellular drug concentration
MRP3 +++ + None known Not applicable
NNRTI (efavirenz, emtricitabine, delaviridine), NRTI's (tenofovir, emtricitabine and lamivudine)20, 21
Increased intracellular drug concentration
MRP4 +++ +++ NRTI's (tenofovir, abacavir, lamivudine and zidovudine)19
Decreased intracellular drug concentration
None known Not applicable
MRP5 +++ +++ NRTI's (tenofovir, stavudine and zidovudine)19
Decreased intracellular drug concentration
None known Not applicable
MRP10 +++ +++ None known Not applicable None known Not applicable
19
269270271272
273
BCRP +++ ++NRTI's (tenofovir, didanosine, abacavir, lamivudine and zidovudine)28
Decreased intracellular drug concentration
PI's (ritonavir, lopinavir, tipranavir, and nelfinavir), NNRTI (efavirenz, emtricitabine, delaviridine)29
Increased intracellular drug concentration
CNT2 +++ - NRTI's (Didanosine and zidovudine)22
Increased intracellular drug concentration
None known Not applicable
ENT2 +++ +++ NRTI's (Didanosine and zidovudine)30
Increased intracellular drug concentration
None known Not applicable
LAT2 ++ +++ None known Not applicable None known Not applicable
OATPD +++ +++ PIs (lopinavir,saquinavir, and
darunavir)20
Increased intracellular drug concentration
PIs (lopinavir,saquinavir, and darunavir)20
Decreased intracellular drug concentration
OATPE +++ + PIs (lopinavir,saquinavir, and darunavir)20
Increased intracellular drug concentration
PIs (lopinavir,saquinavir, and darunavir)20
Decreased intracellular drug concentration
TAP1 ++ +++ None known Not applicable None known Not applicable
TAP2 + +++ None known Not applicable None known Not applicable
RQ = Relative Quantification
+++High
expression, Mean RQ
>2
++Moderate
expression, Mean RQ
1-2
+Low
expression, Mean RQ
<1
-Unexpressed, Mean RQ <
0.1
20
274
275
276
ACKNOWLEDGEMENT
This work was supported by the European Union's Seventh Framework Programme for research,
technological development and demonstration under grant agreement No 305316 as part of the
MOTIF (Microbicides Optimisation Through Innovative Formulation for Vaginal and Rectal
Delivery) project. We would like to extend our thanks to all the study participants for their
invaluable contribution and to Grampian Biorepository staff for help with collection of fresh
colorectal resection tissue.
21
277
278
279
280
281
282
283
REFERENCES
1. Xu, H.; Wang, X.; Veazey, R. S. Mucosal immunology of HIV infection. Immunol
Rev 2013, 254, (1), 10-33.
2. Lackner, A. A.; Lederman, M. M.; Rodriguez, B. HIV pathogenesis: the host. Cold
Spring Harb Perspect Med 2012, 2, (9), a007005.
3. Kempster, S. L.; Kaser, A. alpha4beta7 integrin: beyond T cell trafficking. Gut 2014,
63, (9), 1377-9.
4. Arthos, J.; Cicala, C.; Martinelli, E.; Macleod, K.; Van Ryk, D.; Wei, D.; Xiao, Z.;
Veenstra, T. D.; Conrad, T. P.; Lempicki, R. A.; McLaughlin, S.; Pascuccio, M.; Gopaul, R.;
McNally, J.; Cruz, C. C.; Censoplano, N.; Chung, E.; Reitano, K. N.; Kottilil, S.; Goode, D.
J.; Fauci, A. S. HIV-1 envelope protein binds to and signals through integrin alpha4beta7,
the gut mucosal homing receptor for peripheral T cells. Nat Immunol 2008, 9, (3), 301-9.
5. McGowan, I.; Dezzutti, C. Rectal microbicide development. Curr Top Microbiol
Immunol 2014, 383, 117-36.
6. Hu, M.; Patel, S. K.; Zhou, T.; Rohan, L. C. Drug transporters in tissues and cells
relevant to sexual transmission of HIV: Implications for drug delivery. J Control Release
2015.
7. Minuesa, G.; Purcet, S.; Erkizia, I.; Molina-Arcas, M.; Bofill, M.; Izquierdo-Useros,
N.; Casado, F. J.; Clotet, B.; Pastor-Anglada, M.; Martinez-Picado, J. Expression and
functionality of anti-human immunodeficiency virus and anticancer drug uptake transporters
in immune cells. J Pharmacol Exp Ther 2008, 324, (2), 558-67.
8. Neyfakh, A. A.; Serpinskaya, A. S.; Chervonsky, A. V.; Apasov, S. G.; Kazarov, A.
R. Multidrug-resistance phenotype of a subpopulation of T-lymphocytes without drug
selection. Exp Cell Res 1989, 185, (2), 496-505.
22
284
285
286
287
288
289
290
291
292
293
294
295
296
297
298
299
300
301
302
303
304
305
306
9. Legrand, O.; Perrot, J. Y.; Tang, R.; Simonin, G.; Gurbuxani, S.; Zittoun, R.; Marie, J.
P. Expression of the multidrug resistance-associated protein (MRP) mRNA and protein in
normal peripheral blood and bone marrow haemopoietic cells. Br J Haematol 1996, 94, (1),
23-33.
10. Mukhopadhya, I.; Murray, G. I.; Berry, S.; Thomson, J.; Frank, B.; Gwozdz, G.;
Ekeruche-Makinde, J.; Shattock, R.; Kelly, C.; Iannelli, F.; Pozzi, G.; El-Omar, E. M.; Hold,
G. L.; Hijazi, K. Drug transporter gene expression in human colorectal tissue and cell lines:
modulation with antiretrovirals for microbicide optimization. J Antimicrob Chemother 2015.
11. Schmittgen, T. D.; Livak, K. J. Analyzing real-time PCR data by the comparative
C(T) method. Nature protocols 2008, 3, (6), 1101-8.
12. Abramson, O.; Qiu, S.; Erle, D. J. Preferential production of interferon-gamma by
CD4+ T cells expressing the homing receptor integrin alpha4/beta7. Immunology 2001, 103,
(2), 155-63.
13. Wang, X.; Xu, H.; Gill, A. F.; Pahar, B.; Kempf, D.; Rasmussen, T.; Lackner, A. A.;
Veazey, R. S. Monitoring alpha4beta7 integrin expression on circulating CD4+ T cells as a
surrogate marker for tracking intestinal CD4+ T-cell loss in SIV infection. Mucosal Immunol
2009, 2, (6), 518-26.
14. Farstad, I. N.; Halstensen, T. S.; Lien, B.; Kilshaw, P. J.; Lazarovits, A. I.;
Brandtzaeg, P. Distribution of beta 7 integrins in human intestinal mucosa and organized
gut-associated lymphoid tissue. Immunology 1996, 89, (2), 227-37.
15. Jones, K.; Hoggard, P. G.; Sales, S. D.; Khoo, S.; Davey, R.; Back, D. J. Differences
in the intracellular accumulation of HIV protease inhibitors in vitro and the effect of active
transport. AIDS 2001, 15, (6), 675-81.
23
307
308
309
310
311
312
313
314
315
316
317
318
319
320
321
322
323
324
325
326
327
328
329
16. Lee, C. G.; Gottesman, M. M.; Cardarelli, C. O.; Ramachandra, M.; Jeang, K. T.;
Ambudkar, S. V.; Pastan, I.; Dey, S. HIV-1 protease inhibitors are substrates for the MDR1
multidrug transporter. Biochemistry 1998, 37, (11), 3594-601.
17. van Gelder, J.; Deferme, S.; Naesens, L.; De Clercq, E.; van den Mooter, G.; Kinget,
R.; Augustijns, P. Intestinal absorption enhancement of the ester prodrug tenofovir
disoproxil fumarate through modulation of the biochemical barrier by defined ester mixtures.
Drug Metab Dispos 2002, 30, (8), 924-30.
18. Shaik, N.; Giri, N.; Pan, G.; Elmquist, W. F. P-glycoprotein-mediated active efflux of
the anti-HIV1 nucleoside abacavir limits cellular accumulation and brain distribution. Drug
Metab Dispos 2007, 35, (11), 2076-85.
19. Reid, G.; Wielinga, P.; Zelcer, N.; De Haas, M.; Van Deemter, L.; Wijnholds, J.;
Balzarini, J.; Borst, P. Characterization of the transport of nucleoside analog drugs by the
human multidrug resistance proteins MRP4 and MRP5. Mol Pharmacol 2003, 63, (5), 1094-
103.
20. Kis, O.; Robillard, K.; Chan, G. N.; Bendayan, R. The complexities of antiretroviral
drug-drug interactions: role of ABC and SLC transporters. Trends Pharmacol Sci 2010, 31,
(1), 22-35.
21. Weiss, J.; Theile, D.; Ketabi-Kiyanvash, N.; Lindenmaier, H.; Haefeli, W. E.
Inhibition of MRP1/ABCC1, MRP2/ABCC2, and MRP3/ABCC3 by nucleoside, nucleotide,
and non-nucleoside reverse transcriptase inhibitors. Drug Metab Dispos 2007, 35, (3), 340-4.
22. Ritzel, M. W.; Yao, S. Y.; Ng, A. M.; Mackey, J. R.; Cass, C. E.; Young, J. D.
Molecular cloning, functional expression and chromosomal localization of a cDNA encoding
a human Na+/nucleoside cotransporter (hCNT2) selective for purine nucleosides and uridine.
Mol Membr Biol 1998, 15, (4), 203-11.
24
330
331
332
333
334
335
336
337
338
339
340
341
342
343
344
345
346
347
348
349
350
351
352
353
23. Ford, J.; Khoo, S. H.; Back, D. J. The intracellular pharmacology of antiretroviral
protease inhibitors. J Antimicrob Chemother 2004, 54, (6), 982-90.
24. Konig, S. K.; Herzog, M.; Theile, D.; Zembruski, N.; Haefeli, W. E.; Weiss, J.
Impact of drug transporters on cellular resistance towards saquinavir and darunavir. J
Antimicrob Chemother 2010, 65, (11), 2319-28.
25. Cost, M.; Dezzutti, C. S.; Clark, M. R.; Friend, D. R.; Akil, A.; Rohan, L. C.
Characterization of UC781-tenofovir combination gel products for HIV-1 infection
prevention in an ex vivo ectocervical model. Antimicrob Agents Chemother 2012, 56, (6),
3058-66.
26. Weiss, J.; Weis, N.; Ketabi-Kiyanvash, N.; Storch, C. H.; Haefeli, W. E. Comparison
of the induction of P-glycoprotein activity by nucleotide, nucleoside, and non-nucleoside
reverse transcriptase inhibitors. Eur J Pharmacol 2008, 579, (1-3), 104-9.
27. Storch, C. H.; Theile, D.; Lindenmaier, H.; Haefeli, W. E.; Weiss, J. Comparison of
the inhibitory activity of anti-HIV drugs on P-glycoprotein. Biochem Pharmacol 2007, 73,
(10), 1573-81.
28. Wang, X.; Nitanda, T.; Shi, M.; Okamoto, M.; Furukawa, T.; Sugimoto, Y.; Akiyama,
S.; Baba, M. Induction of cellular resistance to nucleoside reverse transcriptase inhibitors by
the wild-type breast cancer resistance protein. Biochem Pharmacol 2004, 68, (7), 1363-70.
29. Gupta, A.; Zhang, Y.; Unadkat, J. D.; Mao, Q. HIV protease inhibitors are inhibitors
but not substrates of the human breast cancer resistance protein (BCRP/ABCG2). J
Pharmacol Exp Ther 2004, 310, (1), 334-41.
30. Yao, S. Y.; Ng, A. M.; Sundaram, M.; Cass, C. E.; Baldwin, S. A.; Young, J. D.
Transport of antiviral 3'-deoxy-nucleoside drugs by recombinant human and rat equilibrative,
nitrobenzylthioinosine (NBMPR)-insensitive (ENT2) nucleoside transporter proteins
produced in Xenopus oocytes. Mol Membr Biol 2001, 18, (2), 161-7.
25
354
355
356
357
358
359
360
361
362
363
364
365
366
367
368
369
370
371
372
373
374
375
376
377
378
GRAPHICAL ABSTRACT
26