Supplemental methods Plasmids and transfection. methods Plasmids and transfection. Expression...
19
Supplemental methods Plasmids and transfection. Expression vectors for mouse wild-type SIRPα and its mutants lacking individual Ig-like domains (ΔV, ΔC1-1, ΔC1-2) were described previously (28). Full-length cDNAs for human SIRPα variant v1 (SIRPαv1), SIRPβ1, and SIRPγ were obtained from DNAFORM (Yokohama, Japan) and that for human SIRPβ2 was purchased from eurofins Genomics (Tokyo, Japan). A cDNA fragment encoding full-length human SIRPβ2 tagged with the Myc epitope at its COOH terminus (SIRPβ2myc) was generated by PCR with human SIRPB2 cDNA as the template and an antisense primer containing the DNA sequence for the Myc epitope at its 5' end. To construct an expression vector for human SIRPαv1, SIRPβ1, SIRPβ2myc, and SIRPγ, we subcloned each full-length cDNA into the pcDNA3.1 vector (Thermo Fisher Scientific). An expression vector for mouse SIRPβ was described previously (29). A plasmid encoding human SIRPα variant v2 (SIRPαv2) protein were kindly provided by Nakayuki Honmma (Kyowa Hakko Kirin, Tokyo, Japan). For generation of expression vectors for MY-1 chimeric antibodies in which the constant region of MY-1 was replaced with that of mouse IgG2a, total RNA was purified from MY-1 hybridoma cells with the use of an RNeasy Mini Kit (Qiagen, Hilden, Germany). Complementary DNA fragments encoding the variable region of the heavy or light chain of MY-1 were amplified with the use of a 5'/3' RACE SMARTer RACE cDNA Amplification Kit (Takara, Kyoto, Japan) and Universal Primer Mix (Takara) and with either 5'-TGGTCTTTGGGGGGAAGATGAAGACAGATG-3' for the heavy chain or 5'-GACGGGGGAGGCTGATGTCTTATGAACAACCTCACAG-3' for the light chain. The resulting amplicons were further amplified by the polymerase chain reaction with the primers 5'-AAAAGAATTCACCATGGACATCAGGCTCAG-3' and 5'-TGAAGAGACAGTGACCAGAG-3' for the heavy chain or 5'-AAAAACCGGTGAGATGGAGACAGACAGACTC-3' and 5'-TTTGATCTCGAGCTTGGTCCC-3' for the light chain, and they were then
Transcript of Supplemental methods Plasmids and transfection. methods Plasmids and transfection. Expression...
Supplemental methods
Plasmids and transfection. Expression vectors for mouse wild-type SIRPα and
its mutants lacking individual Ig-like domains (ΔV, ΔC1-1, ΔC1-2) were described
previously (28). Full-length cDNAs for human SIRPα variant v1 (SIRPαv1), SIRPβ1,
and SIRPγ were obtained from DNAFORM (Yokohama, Japan) and that for human
SIRPβ2 was purchased from eurofins Genomics (Tokyo, Japan). A cDNA fragment
encoding full-length human SIRPβ2 tagged with the Myc epitope at its COOH terminus
(SIRPβ2myc) was generated by PCR with human SIRPB2 cDNA as the template and an
antisense primer containing the DNA sequence for the Myc epitope at its 5' end. To
construct an expression vector for human SIRPαv1, SIRPβ1, SIRPβ2myc, and SIRPγ,
we subcloned each full-length cDNA into the pcDNA3.1 vector (Thermo Fisher
Scientific). An expression vector for mouse SIRPβ was described previously (29). A
plasmid encoding human SIRPα variant v2 (SIRPαv2) protein were kindly provided by
Nakayuki Honmma (Kyowa Hakko Kirin, Tokyo, Japan). For generation of expression
vectors for MY-1 chimeric antibodies in which the constant region of MY-1 was
replaced with that of mouse IgG2a, total RNA was purified from MY-1 hybridoma cells
with the use of an RNeasy Mini Kit (Qiagen, Hilden, Germany). Complementary DNA
fragments encoding the variable region of the heavy or light chain of MY-1 were
amplified with the use of a 5'/3' RACE SMARTer RACE cDNA Amplification Kit
(Takara, Kyoto, Japan) and Universal Primer Mix (Takara) and with either
5'-TGGTCTTTGGGGGGAAGATGAAGACAGATG-3' for the heavy chain or
5'-GACGGGGGAGGCTGATGTCTTATGAACAACCTCACAG-3' for the light chain.
The resulting amplicons were further amplified by the polymerase chain reaction with
the primers 5'-AAAAGAATTCACCATGGACATCAGGCTCAG-3' and
5'-TGAAGAGACAGTGACCAGAG-3' for the heavy chain or
5'-AAAAACCGGTGAGATGGAGACAGACAGACTC-3' and
5'-TTTGATCTCGAGCTTGGTCCC-3' for the light chain, and they were then
subcloned into pFUSE-CHIg (InvivoGen, San Diego, CA) for the heavy chain (yielding
pFUSE-CHIg-MY-1) or into pFUSE2-CLIg (InvivoGen) for the light chain (yielding
pFUSE2-CLIg-MY-1). HEK293A cells and FreeStyle 293-F cells were transfected with
expression vectors with the use of Lipofectamine 2000 and 293Fectin (Thermo Fisher
Scientific), respectively.
Preparation of MY-1 F(ab')2 fragments. FreeStyle 293-F cells transiently
transfected with pFUSE-CHIg-MY-1 together with pFUSE2-CLIg-MY-1 were cultured
in FreeStyle 293 expression medium (Thermo Fisher Scientific) for 7 days. Chimeric
MY-1 was then purified from the culture supernatant with the use of Protein G–
Sepharose (GE Healthcare). The chimeric antibodies were cleaved with pepsin and
subjected to gel filtration chromatography in order to purify the F(ab')2 fragments.
Cell aggregation assay. A cell aggregation assay was performed as previously
described (58), with slight modifications. For preparation of a single-cell suspension,
cells were washed with PBS, incubated with 0.1% EDTA in PBS for 5 min at 37°C, and
dispersed by gentle pipetting. The cells were then suspended at a density of 1 × 10⁶/ml
in Ca2+- and Mg2+-free HBSS supplemented with 10% FBS, DNase I (0.1 mg/ml), and
1 mM EDTA. For determination of the effects of mAbs to SIRPα, CHO-Ras cells stably
expressing mouse SIRPα were incubated for 15 min at 37°C with MY-1, MY-1 F(ab')2,
P84, or normal rat IgG, each at a concentration of 5 μg/ml. Equal volumes of these cells
and of CHO-Ras cells stably expressing mouse CD47 were then mixed together and
incubated for 0 or 30 min at 37°C with gentle shaking. Formation of cell aggregates was
terminated by the addition of glutaraldehyde to a final concentration of 2%, and the
number of cells was counted with a hemocytometer. Aggregates of three or more cells
were considered equivalent to single cells in this assay. The extent of cell aggregation
was then determined as the ratio of the number of cells at the end of the incubation (E0
or E30 for 0 or 30 min) to that at its initiation (S).
Protein-based binding assay. The extracellular domain of mouse CD47 (aa 1–
161) fused to human Fc (mouse CD47–Fc) was generated as described (58). The fusion
proteins produced by cells cultured in serum-free DMEM/F-12 (1:1, v/v) medium was
purified from the culture supernatants by chromatography on a column of protein
A-Sepharose 4FF (GE Healthcare). A protein-based binding assay was performed as
previously described (58), with slight modifications. In brief, confluence mouse SIRPα–
expressing CHO-Ras (CHO-Ras-mSIRPα) cells as parental CHO-Ras cells in 96-well
plate were washed twice with serum-free culture medium. The plates were then
incubated with mouse CD47–Fc (10 μg/ml) of in the presence of MY-1 (100 μg/ml),
P84 (100 μg/ml), or control rat IgG (100 μg/ml) in αMEM culture medium for 15 min
at 37°C. The incubation medium for binding was aspirated and the wells were washed
three times with ice-cold PBS. Cells were further incubated with HRP-conjugated goat
pAbs specific to Fcγ fragment of human IgG (Jackson ImmunoResearch Laboratories)
at 1:2000 dilution in PBS containing 1% BSA for 30 min at 4°C. Cells were then
washed three times with PBS, and mouse CD47–Fc binding was determined by
peroxidase activity using o-phenylenediamine dihydrochloride (Sigma-Aldrich) as a
substrate. Absorbance at 450 nm of each wells was measured on a microplate reader
(2030 ARVO X4, PerkinElmer).
Cell viability assay. For determination of cell viability, sodium
3'-[1-(phenylamino)-carbonyl]-3,4-tetrazolium]-bis(4-methoxy-6-nitro) benzenesulfonic
acid hydrate (XTT) assay (Roche) was performed according to the manufacturer's
protocol. Briefly, RENCA cells (1.0 × 10⁴ cells/well) were seeded in 96-well plate and
allowed to adhere overnight. Cells were further cultured in the presence or absence of
control IgG (10 μg/ml) or MY-1 (10 μg/ml) for 24 or 48 h. The cells were then
incubated with the XTT labeling mixture for 4 h. The absorbance at 450 nm was
quantitated by a microplate reader (2030 ARVO X4).
NK cell-mediated cytotoxicity assay. Assay of NK cell-mediated cytotoxicity
was performed with the use of DELFIA europium (Eu)
2,2':6',2''-terpyridine-6,6''-dicarboxylic acid (TDA) cytotoxicity assay reagents
(PerkinElmer, Waltham, MA) as previously described (12), with minor modifications.
NK cells (effector cells) were isolated from the spleen of 8-week-old female BALB/c
mice with the use of an NK Cell Isolation Kit II (Miltenyi Biotec, Cologne, Germany)
and were cultured for 2 or 3 days in RPMI 1640 supplemented with 10% FBS, human
recombinant IL-2 (1000 U/ml, PeproTech), and 50 μM 2-ME. The purity of the cells as
analyzed by flow cytometry was >80%. RENCA cells (target cells) were labeled with
TDA, washed, suspended in culture medium, plated in 96-well round-bottom plates (1 ×
104 cells per well), and incubated for 4 h with various numbers of NK cells in the
presence of antibodies (each at 5 μg/ml). The plates were then centrifuged, and 20 μl of
each supernatant were transferred to the wells of a 96-well microtiter plate containing
200 μl of DELFIA Eu solution. The Eu forms a stable complex with TDA released into
the medium from lysed target cells and generates fluorescence, which was measured
with a time-resolved fluorometer (2030 ARVO X4). The percentage target cell lysis was
calculated as: 100 × (experimental release – spontaneous release)/(maximal release –
spontaneous release). Maximal release was determined by lysis of target cells with
DELFIA lysis buffer; spontaneous release was measured by incubation of target cells in
the absence of effector cells.
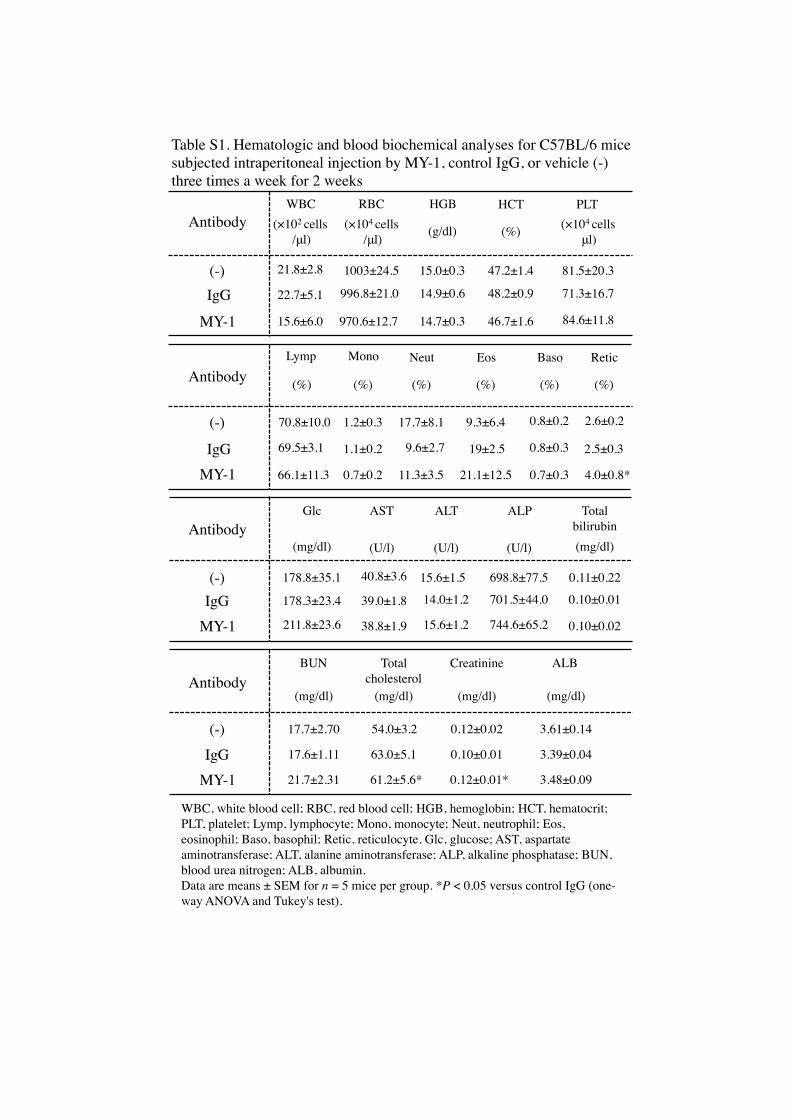
Table S1. Hematologic and blood biochemical analyses for C57BL/6 mice subjected intraperitoneal injection by MY-1, control IgG, or vehicle (-) three times a week for 2 weeks
MY-1
(-) IgG
1003±24.5
996.8±21.0
RBC( 104 cells
/ l)
81.5±20.3
71.3±16.7
84.6±11.8
PLT( 104 cells
l)
21.8±2.8
22.7±5.1
15.6±6.0
WBC( 102 cells
/ l)
MY-1
(-)
IgG
Retic
2.6±0.2
2.5±0.3
4.0±0.8*
(%)
Neut
17.7±8.1
9.6±2.7
(%)
21.1±12.5
9.3±6.4
19±2.5
Eos
(%)
0.8±0.3
0.8±0.2
0.7±0.3
Baso
(%)
15.0±0.3
14.9±0.6
14.7±0.3
HGB
(g/dl)
47.2±1.4
48.2±0.9
46.7±1.6
HCT
(%)
1.2±0.3
1.1±0.2
Mono
(%)
70.8±10.0
69.5±3.1
66.1±11.3
Lymp
(%)
970.6±12.7
0.7±0.2 11.3±3.5
WBC, white blood cell; RBC, red blood cell; HGB, hemoglobin; HCT, hematocrit; PLT, platelet; Lymp, lymphocyte; Mono, monocyte; Neut, neutrophil; Eos, eosinophil; Baso, basophil; Retic, reticulocyte. Glc, glucose; AST, aspartate aminotransferase; ALT, alanine aminotransferase; ALP, alkaline phosphatase; BUN, blood urea nitrogen; ALB, albumin.Data are means ± SEM for n = 5 mice per group. *P < 0.05 versus control IgG (one-way ANOVA and Tukey's test).
MY-1
(-)IgG
MY-1
(-)IgG
40.8±3.6
39.0±1.8
38.8±1.9
15.6±1.5
14.0±1.2
15.6±1.2
ALT
698.8±77.5
701.5±44.0
744.6±65.2
ALPAST
54.0±3.2
63.0±5.1
61.2±5.6*
Totalcholesterol
(U/l) (U/l)
(mg/dl)
(U/l)
0.11±0.22
0.10±0.01
0.10±0.02
Totalbilirubin(mg/dl)
17.7±2.70
17.6±1.11
21.7±2.31
BUN
(mg/dl)
0.12±0.02
0.10±0.01
0.12±0.01*
Creatinine
(mg/dl)
178.8±35.1
178.3±23.4
211.8±23.6
Glc
(mg/dl)
3.61±0.14
3.39±0.04
3.48±0.09
ALB
(mg/dl)
Antibody
Antibody
Antibody
Antibody
D
SIRPpAbs)
Case 2
H&E
Case 3 Case 4
C
CHO-Ras
9766
45
kDa
pAbs to SIRP
Anti- -tubulin
CHO-Ras
-hSIR
P v2
ASIRP v2
SIRP (pAbs)
SIRP v1Transfection
SIRP 1 SIRP 2myc
SIRP 1 SIRP
SIRP
Myc
BTransfection
SIRP 1 SIRP 2myc SIRPTransfection
SIRP (pAbs)Ab:
Ab:
Ab:
hSIRP
-tubulin
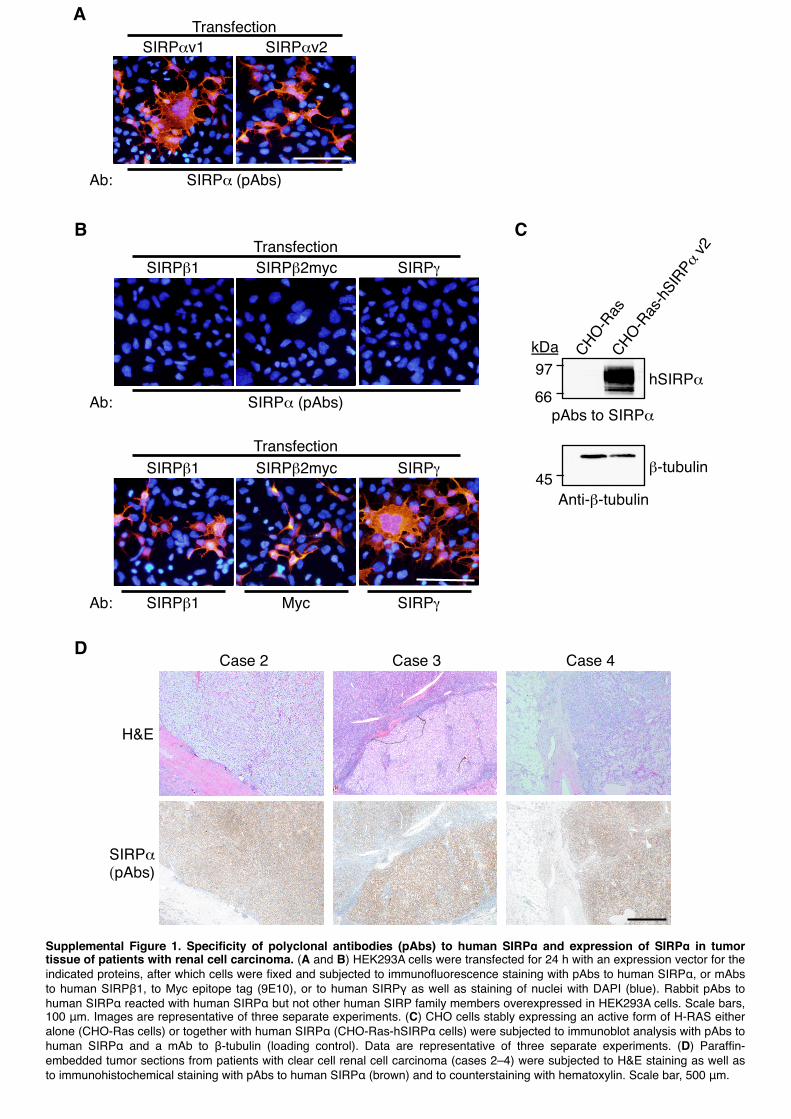
Supplemental Figure 1. Specificity of polyclonal antibodies (pAbs) to human SIRP and expression of SIRP in tumor tissue of patients with renal cell carcinoma. (A and B) HEK293A cells were transfected for 24 h with an expression vector for the indicated proteins, after which cells were and subjected to ofl o staining with pAbs to human SIRP , or mAbs to human SIRP 1, to Myc epitope tag (9E10), or to human SIRP as well as staining of nuclei with DAPI (blue). Rabbit pAbs to human SIRP reacted with human SIRP but not other human SIRP family members overexpressed in HEK293A cells. Scale bars, 100 m. Images are representative of three separate experiments. (C) CHO cells stably expressing an active form of H-RAS either alone (CHO-Ras cells) or together with human SIRP (CHO-Ras-hSIRP cells) were subjected to immunoblot analysis with pAbs to human SIRP and a mAb to -tubulin (loading control). Data are representative of three separate experiments. (D) embedded tumor sections from patients with clear cell renal cell carcinoma (cases 2–4) were subjected to H&E staining as well as to immunohistochemical staining with pAbs to human SIRP (brown) and to counterstaining with hematoxylin. Scale bar, 500 m.
B
A
Case 2
Case 3
Case 1
SIRP 1 MART-1 SIRP MART-1
Case 2
Case 3
MART-1 SIRP(040 mAb) Merge
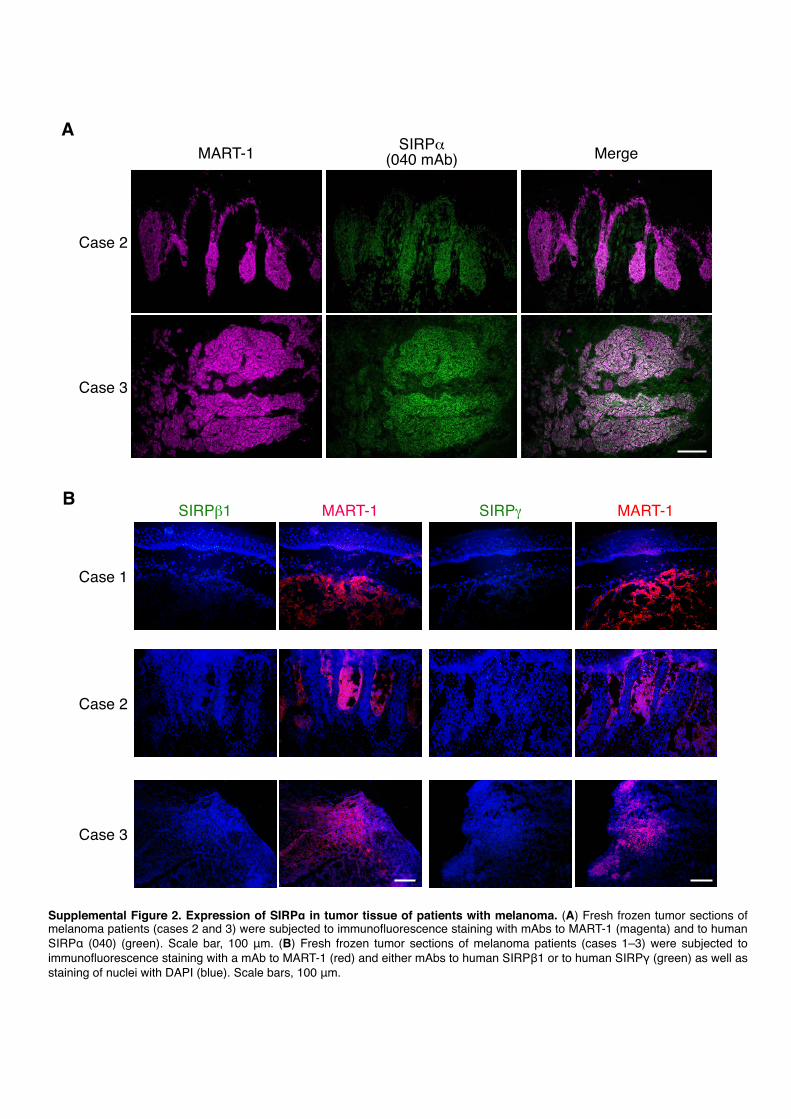
Supplemental Figure 2. Expression of SIRP in tumor tissue of patients with melanoma. (A) Fresh frozen tumor sections of melanoma patients (cases 2 and 3) were subjected to ofl o staining with mAbs to MART-1 (magenta) and to human SIRP (040) (green). Scale bar, 100 m. (B) Fresh frozen tumor sections of melanoma patients (cases 1–3) were subjected to
ofl o staining with a mAb to MART-1 (red) and either mAbs to human SIRP 1 or to human SIRP (green) as well as staining of nuclei with DAPI (blue). Scale bars, 100 m.
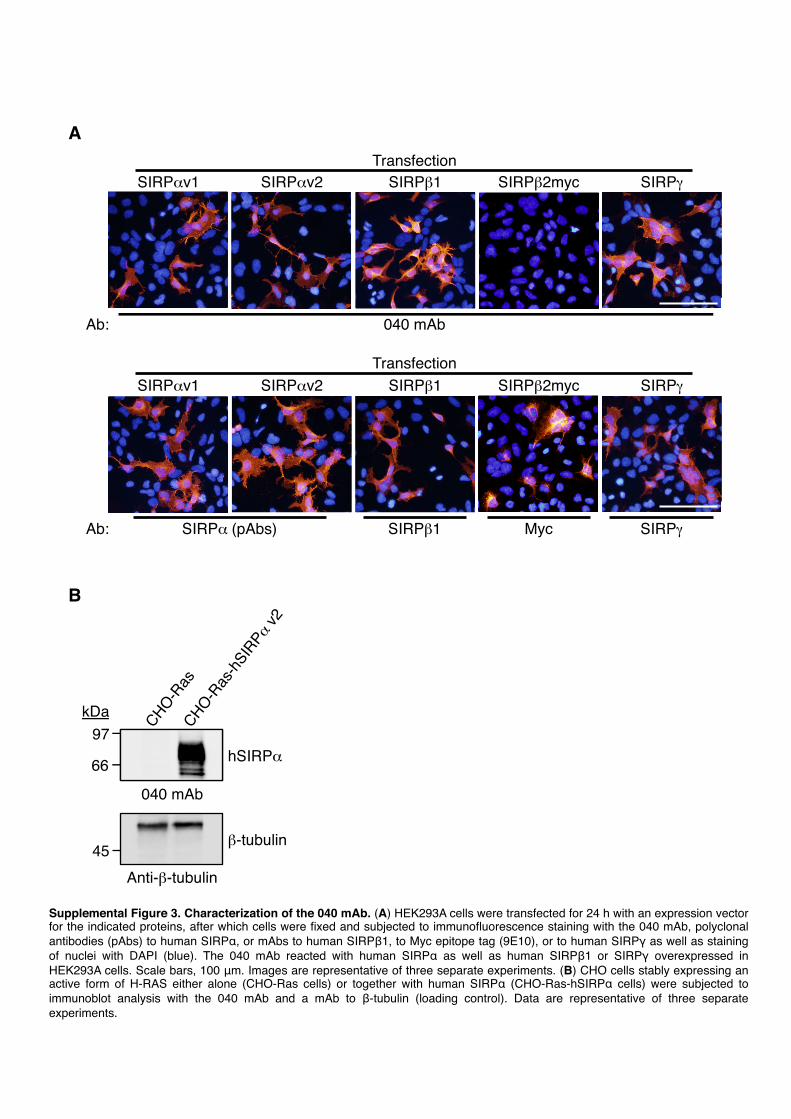
Supplemental Figure 3. Characterization of the 040 mAb. (A) HEK293A cells were transfected for 24 h with an expression vector for the indicated proteins, after which cells were and subjected to ofl o staining with the 040 mAb, polyclonal antibodies (pAbs) to human SIRP , or mAbs to human SIRP 1, to Myc epitope tag (9E10), or to human SIRP as well as staining of nuclei with DAPI (blue). The 040 mAb reacted with human SIRP as well as human SIRP 1 or SIRP overexpressed in HEK293A cells. Scale bars, 100 m. Images are representative of three separate experiments. (B) CHO cells stably expressing an active form of H-RAS either alone (CHO-Ras cells) or together with human SIRP (CHO-Ras-hSIRP cells) were subjected to immunoblot analysis with the 040 mAb and a mAb to -tubulin (loading control). Data are representative of three separate experiments.
B
hSIRP
-tubulin
040 mAb
CHO-Ras
CHO-Ras
-hSIR
P v2
Anti- -tubulin
97
66
45
kDa
A
SIRP v1 SIRP v2 SIRP 1 SIRP 2myc
040 mAb
SIRPTransfection
TransfectionSIRP v1 SIRP v2 SIRP 1 SIRP 2myc SIRP
Ab:
Ab: SIRP 1 SIRPSIRP (pAbs) Myc
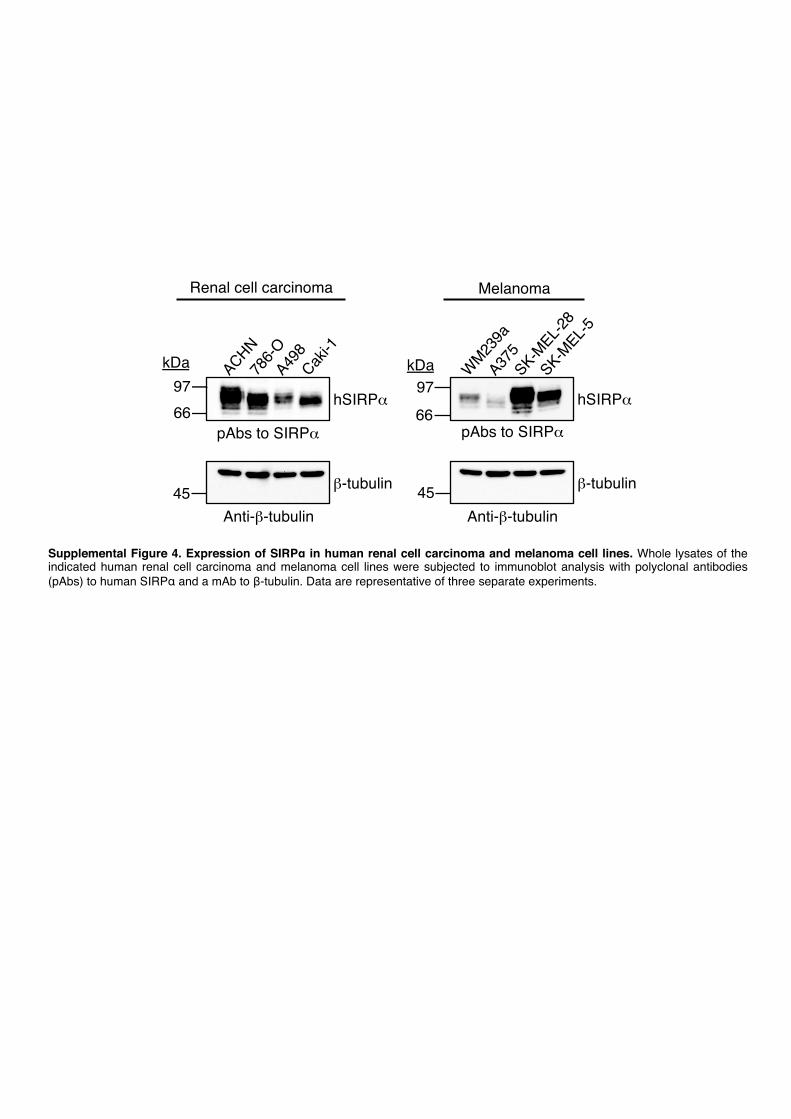
Supplemental Figure 4. Expression of SIRP in human renal cell carcinoma and melanoma cell lines. Whole lysates of the indicated human renal cell carcinoma and melanoma cell lines were subjected to immunoblot analysis with polyclonal antibodies (pAbs) to human SIRP and a mAb to -tubulin. Data are representative of three separate experiments.
pAbs to SIRP
A375
WM239a
SK-MEL-2
8SK-M
EL-5
Anti- -tubulin
97
66
45
kDa
Melanoma
786-O
ACHN
Caki-1
9766
A498
kDa
pAbs to SIRP
45Anti- -tubulin
Renal cell carcinoma
hSIRP
-tubulin
hSIRP
-tubulin
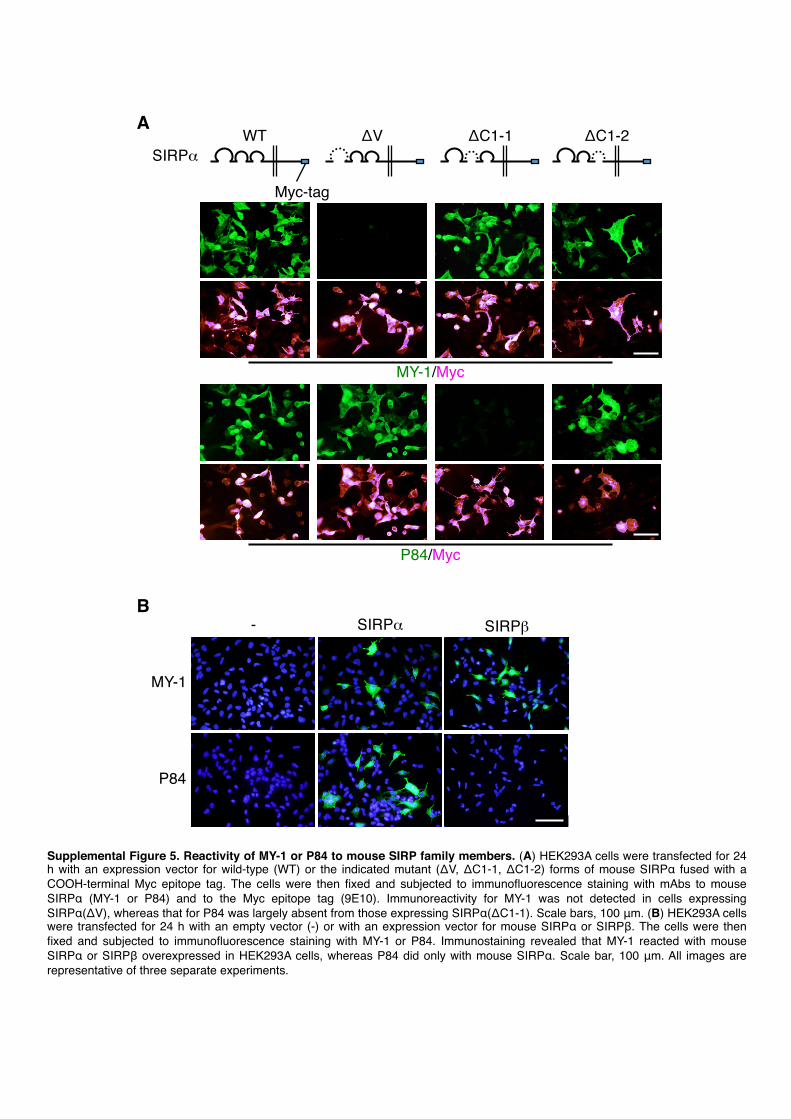
Supplemental Figure 5. Reactivity of MY-1 or P84 to mouse SIRP family members. (A) HEK293A cells were transfected for 24 h with an expression vector for wild-type (WT) or the indicated mutant ( V, C1-1, C1-2) forms of mouse SIRP fused with a COOH-terminal Myc epitope tag. The cells were then and subjected to ofl o staining with mAbs to mouse SIRP (MY-1 or P84) and to the Myc epitope tag (9E10). Immunoreactivity for MY-1 was not detected in cells expressing SIRP ( V), whereas that for P84 was largely absent from those expressing SIRP ( C1-1). Scale bars, 100 m. (B) HEK293A cells were transfected for 24 h with an empty vector (-) or with an expression vector for mouse SIRP or SIRP . The cells were then
and subjected to ofl o staining with MY-1 or P84. Immunostaining revealed that MY-1 reacted with mouse SIRP or SIRP overexpressed in HEK293A cells, whereas P84 did only with mouse SIRP . Scale bar, 100 m. All images are representative of three separate experiments.
P84
A
- SIRP SIRP
MY-1
B
Myc-tag
SIRPWT V C1-1 C1-2
P84/Myc
MY-1/Myc
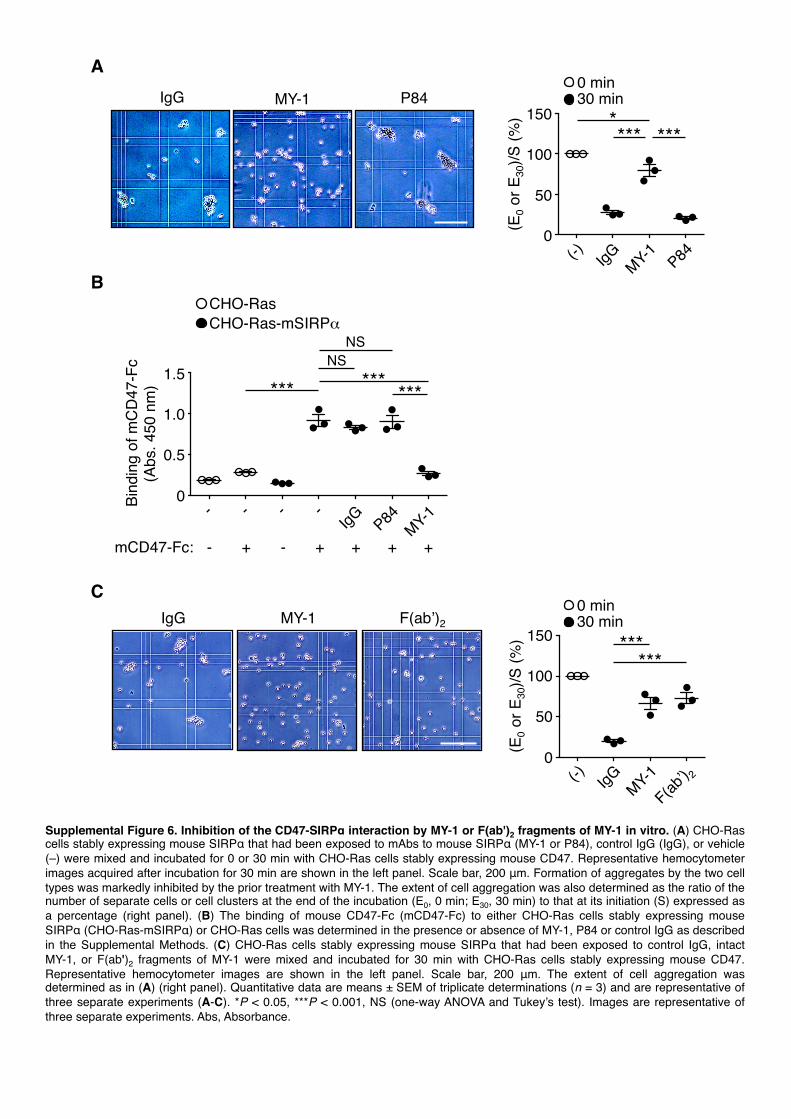
Supplemental Figure 6. Inhibition of the CD47-SIRP interaction by MY-1 or F(ab')2 fragments of MY-1 in vitro. (A) CHO-Ras cells stably expressing mouse SIRP that had been exposed to mAbs to mouse SIRP (MY-1 or P84), control IgG (IgG), or vehicle (–) were mixed and incubated for 0 or 30 min with CHO-Ras cells stably expressing mouse CD47. Representative hemocytometer images acquired after incubation for 30 min are shown in the left panel. Scale bar, 200 m. Formation of aggregates by the two cell types was markedly inhibited by the prior treatment with MY-1. The extent of cell aggregation was also determined as the ratio of the number of separate cells or cell clusters at the end of the incubation (E0, 0 min; E30, 30 min) to that at its initiation (S) expressed as a percentage (right panel). (B) The binding of mouse CD47-Fc (mCD47-Fc) to either CHO-Ras cells stably expressing mouse SIRP (CHO-Ras-mSIRP ) or CHO-Ras cells was determined in the presence or absence of MY-1, P84 or control IgG as described in the Supplemental Methods. (C) CHO-Ras cells stably expressing mouse SIRP that had been exposed to control IgG, intact MY-1, or F(ab')2 fragments of MY-1 were mixed and incubated for 30 min with CHO-Ras cells stably expressing mouse CD47. Representative hemocytometer images are shown in the left panel. Scale bar, 200 m. The extent of cell aggregation was determined as in (A) (right panel). Quantitative data are means ± SEM of triplicate determinations (n = 3) and are representative of three separate experiments (A-C). *P < 0.05, ***P < 0.001, NS (one-way ANOVA and Tukey’s test). Images are representative of three separate experiments. Abs, Absorbance.
-IgG
MY-1 p84
0
50
100
150
-IgG
MY-1 Fab
0
50
100
150
cc +
fc sS +
Fc
S + IgG
S + P84
S + My-1
0.0
0.5
1.0
1.5
0
50
100
150
IgG MY-1 ’ 2
******
(-)
(E0 o
r E30
)/S (%
)
IgG MY-1 ’ 2
A
IgG P84
MY-1(-)
(E0 o
r E30
)/S (%
) 150
100
50
0
IgG P84MY-1**** ***
0 min 30 min
B
C
Bind
ing
of m
CD
47-F
c(A
bs. 4
50 n
m)
1.5
1.0
0.5
0
mCD47-Fc:
CHO-Ras-mSIRP
IgG--- -
- + + + + +-
CHO-Ras
MY-1P84
*** ***
NSNS
***
0 min 30 min
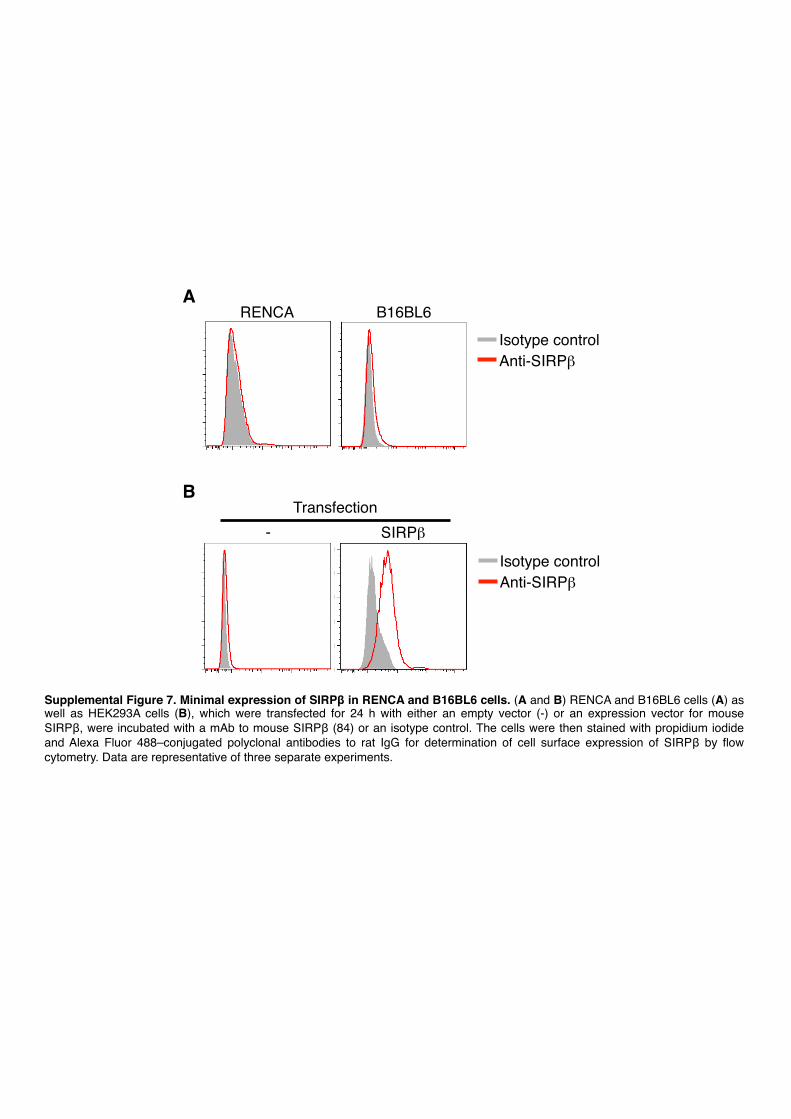
Supplemental Figure 7. Minimal expression of SIRP in RENCA and B16BL6 cells. (A and B) RENCA and B16BL6 cells (A) as well as HEK293A cells (B), which were transfected for 24 h with either an empty vector (-) or an expression vector for mouse SIRP , were incubated with a mAb to mouse SIRP (84) or an isotype control. The cells were then stained with propidium iodide and Alexa Fluor 488–conjugated polyclonal antibodies to rat IgG for determination of cell surface expression of SIRP by flow cytometry. Data are representative of three separate experiments.
Anti-SIRPIsotype control
RENCA B16BL6
SIRPTransfection
-
A
B
Anti-SIRPIsotype control
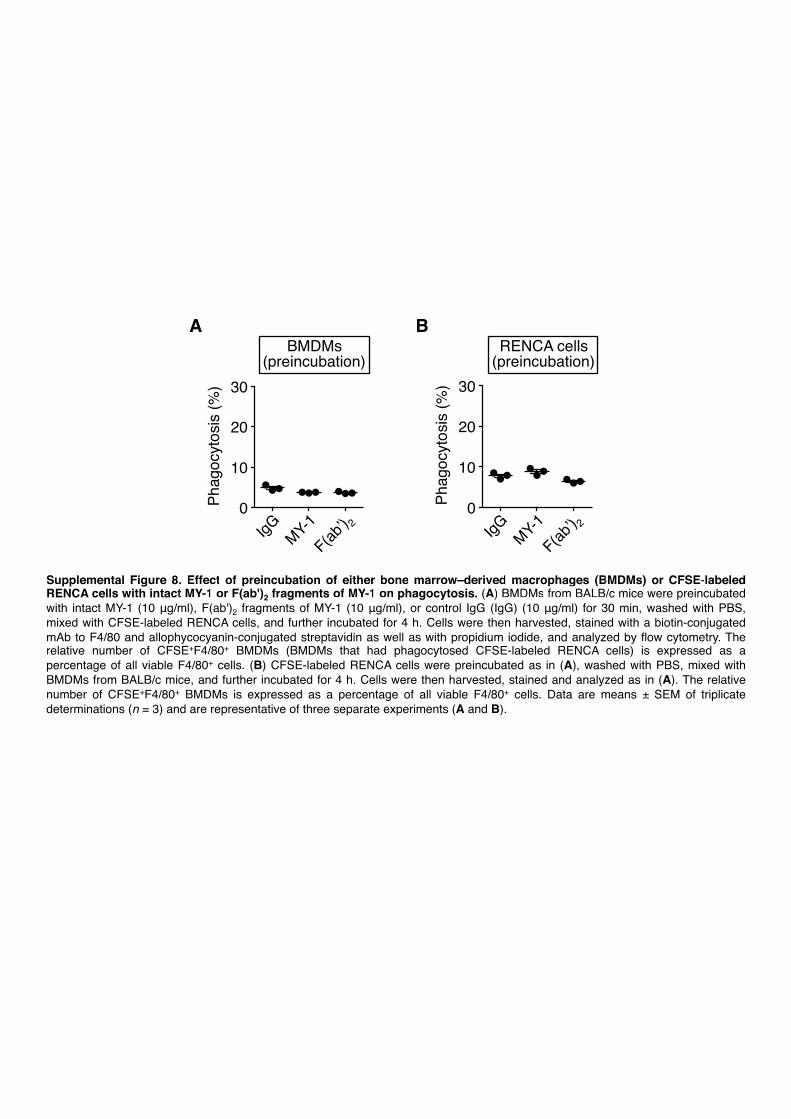
Supplemental Figure 8. Effect of preincubation of either bone marrow–derived macrophages (BMDMs) or CFSE-labeled RENCA cells with intact MY-1 or F(ab')2 fragments of MY-1 on phagocytosis. (A) BMDMs from BALB/c mice were preincubated with intact MY-1 (10 g/ml), F(ab')2 fragments of MY-1 (10 g/ml), or control IgG (IgG) (10 g/ml) for 30 min, washed with PBS, mixed with CFSE-labeled RENCA cells, and further incubated for 4 h. Cells were then harvested, stained with a biotin-conjugated mAb to F4/80 and allophycocyanin-conjugated streptavidin as well as with propidium iodide, and analyzed by flow cytometry. The relative number of CFSE+F4/80+ BMDMs (BMDMs that had phagocytosed CFSE-labeled RENCA cells) is expressed as a percentage of all viable F4/80+ cells. (B) CFSE-labeled RENCA cells were preincubated as in (A), washed with PBS, mixed with BMDMs from BALB/c mice, and further incubated for 4 h. Cells were then harvested, stained and analyzed as in (A). The relative number of CFSE+F4/80+ BMDMs is expressed as a percentage of all viable F4/80+ cells. Data are means ± SEM of triplicate determinations (n = 3) and are representative of three separate experiments (A and B).
8. Effect of preincubation of either bone marrow–derived macrophages (BMDMs)intact MY-1Y-1Y or F(ab')2 fragments of MY-1Y-1Y on phagocytosis. (A) BMDMs from BALB/c
Phag
ocyt
osis
(%)
10
20
30
0IgG MY-1
Phag
ocyt
osis
(%)
10
20
30
0IgG MY-1
A B
pre IgG
pre MY-1
pre Fab
0
10
20
30
IgG pre
MY-1 pre
Fab pre
0
10
20
30
BMDMs(preincubation)
RENCA cells(preincubation)
’ 2 ’ 2
24h
IgG MY-1(-)0
0.2
0.4
0.6
0.8 48h
1.5
1.0
0.5
0
Cel
l via
bilit
y(A
bs. 4
50 n
m)
IgG MY-1(-)ctrl
IgG
MY-1
0.0
0.2
0.4
0.6
0.8
ctrl
IgG
MY-1
0.0
0.5
1.0
1.5
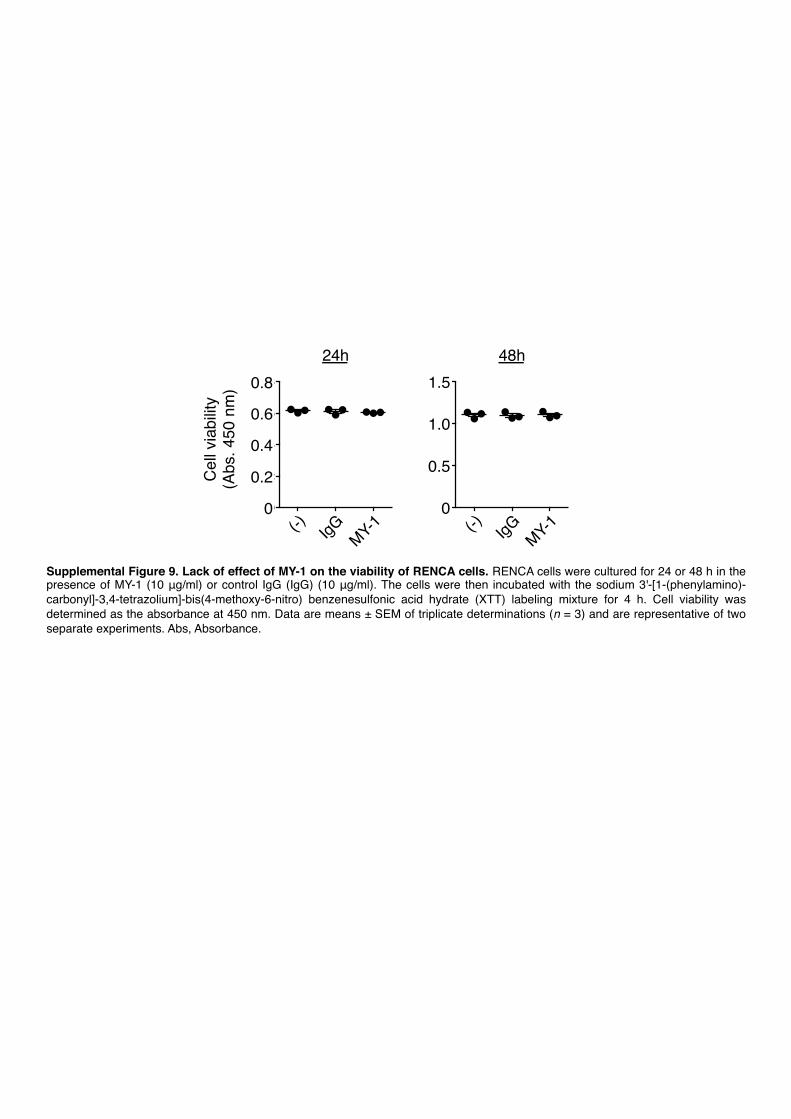
Supplemental Figure 9. Lack of effect of MY-1 on the viability of RENCA cells. RENCA cells were cultured for 24 or 48 h in the presence of MY-1 (10 g/ml) or control IgG (IgG) (10 g/ml). The cells were then incubated with the sodium 3'-[1-(phenylamino)-carbonyl]-3,4-tetrazolium]-bis(4-methoxy-6-nitro) benzenesulfonic acid hydrate (XTT) labeling mixture for 4 h. Cell viability was determined as the absorbance at 450 nm. Data are means ± SEM of triplicate determinations (n = 3) and are representative of two separate experiments. Abs, Absorbance.
Ctrl -CD4
CD
4
CD4+ T cells
62.1% 0.03%
0 5 10 15IgG or MY-1 -CD4
-1 daysRENCA cells
CD8
Tum
or v
olum
e (m
m3 ) 1500
1000
500
00 5 10 15
Days after tumor cell injection
IgG + -CD4
MY-1 + -CD4 MY-1
IgG
20
NS
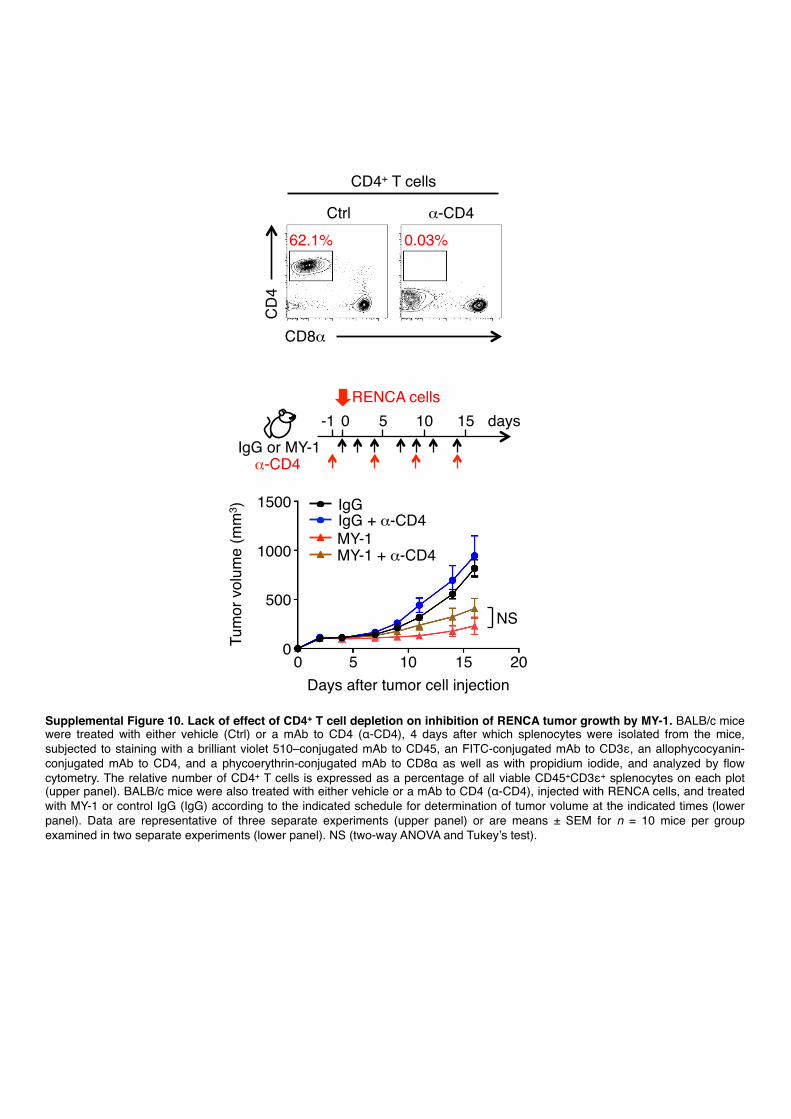
Supplemental Figure 10. Lack of effect of CD4+ T cell depletion on inhibition of RENCA tumor growth by MY-1. BALB/c mice were treated with either vehicle (Ctrl) or a mAb to CD4 ( -CD4), 4 days after which splenocytes were isolated from the mice, subjected to staining with a brilliant violet 510–conjugated mAb to CD45, an FITC-conjugated mAb to CD3 , an allophycocyanin-conjugated mAb to CD4, and a phycoerythrin-conjugated mAb to CD8 as well as with propidium iodide, and analyzed by flow cytometry. The relative number of CD4+ T cells is expressed as a percentage of all viable CD45+CD3 + splenocytes on each plot (upper panel). BALB/c mice were also treated with either vehicle or a mAb to CD4 ( -CD4), injected with RENCA cells, and treated with MY-1 or control IgG (IgG) according to the indicated schedule for determination of tumor volume at the indicated times (lower panel). Data are representative of three separate experiments (upper panel) or are means ± SEM for n = 10 mice per group examined in two separate experiments (lower panel). NS (two-way ANOVA and Tukey’s test).
4.04%
2.68%
0.79%
0.29%
Ctrl -GM1
CD
3
CD49b
NK cells
Sple
nocy
tes
To
ce
lls
37.4%
Ctrl -CD8
CD
4CD8
CD8+ T cells
0%
12.3% 0.33%
o
Tum
or v
olum
e (m
m3 )
0
200
400
600
800
1000
5 100
***
0 5 10 15 o Y-1
-5RENCA cells
-GM1 -CD8
MY-1
MY-1 + -CD8 MY-1 + -GM1
Sple
nocy
tes
To
ce
lls
A
B
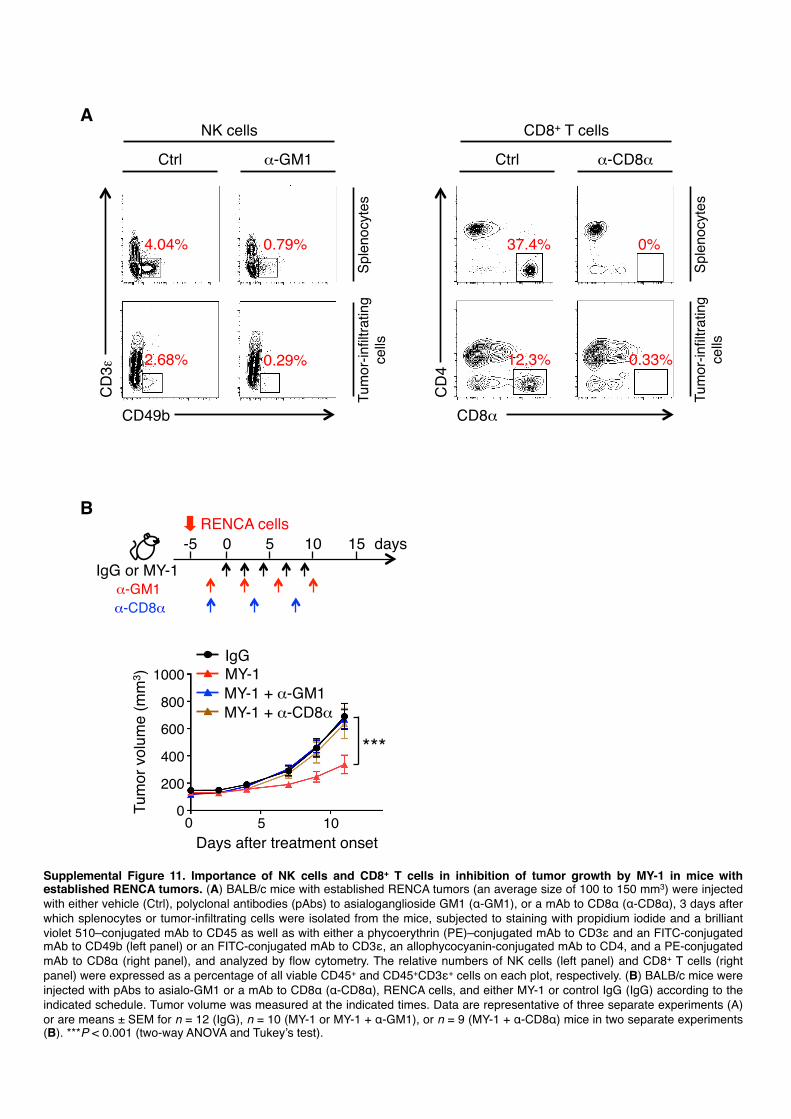
Supplemental Figure 11. Importance of NK cells and CD8+ T cells in inhibition of tumor growth by MY-1 in mice with established RENCA tumors. (A) BALB/c mice with RENCA tumors size o 100 to 150 mm3) were injected with either vehicle (Ctrl), o o o (pAbs) to o o GM1 ( -GM1), or mAb to CD8 ( -CD8 ), 3 which splenocytes or o cells were o o the mice, subjected to with propidium iodide violet o mAb to CD45 well with either phycoerythrin o mAb to CD3 o mAb to CD49b or o mAb to CD3 , o o o mAb to CD4, o mAb to CD8 by flow cytometry. The numbers o NK cells CD8+ T cells
were expressed o CD45+ CD45+CD3 + cells on plot, respectively. (B) BALB/c mice were injected with pAbs to o or mAb to CD8 ( -CD8 ), RENCA cells, either MY-1 or control o to the
schedule. Tumor volume w the times. o three experiments (A) or ± SEM o n = 12 n = 10 (MY-1 or MY-1 + -GM1), or n = 9 (MY-1 + -CD8 ) mice in two experiments (B). ***P wo w ANOVA Tukey’s test).
0 10 20 300
1000
2000
3000
MY-1IgG
3000
2000
1000
0
Tum
or v
olum
e (m
m3 )
0 20 3010
Raji cells0 5 10 15 20 days-7
Ab injection
Days after treatment onset
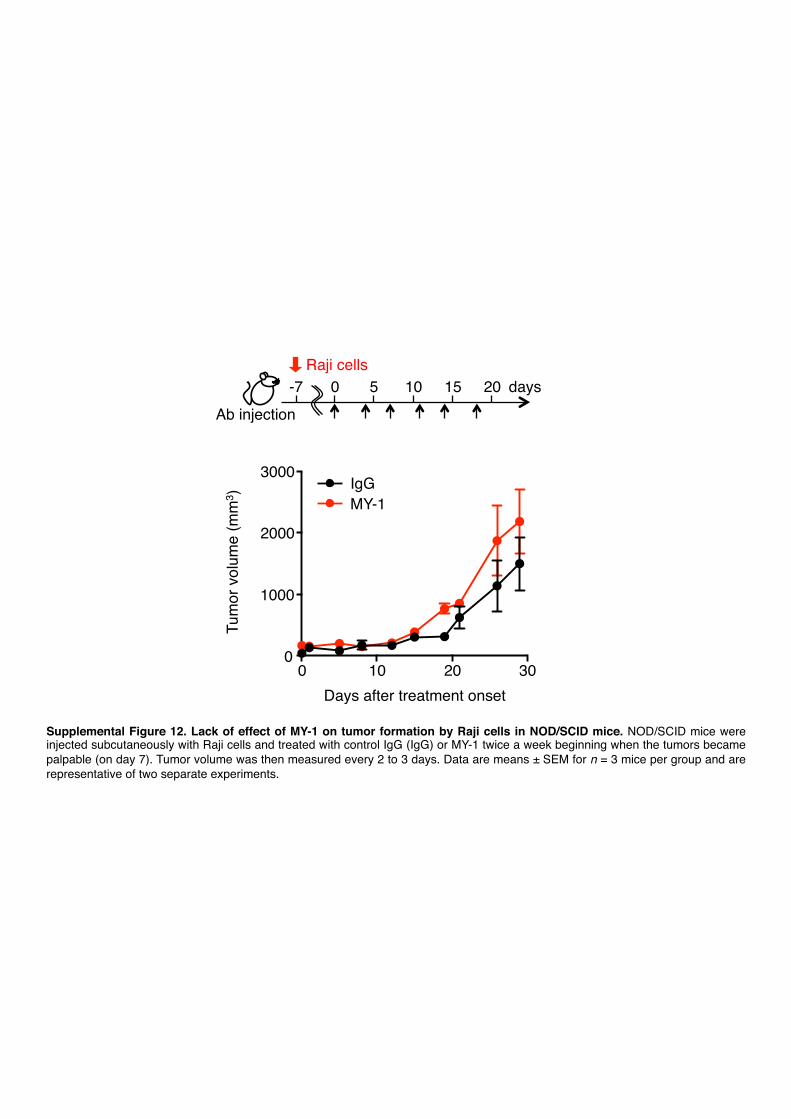
Supplemental Figure 12. Lack of effect of MY-1 on tumor formation by Raji cells in NOD/SCID mice. NOD/SCID mice were injected subcutaneously with Raji cells and treated with control IgG (IgG) or MY-1 twice a week beginning when the tumors became palpable (on day 7). Tumor volume was then measured every 2 to 3 days. Data are means ± SEM for n = 3 mice per group and are representative of two separate experiments.
IgGMY-1 p84
R IgG
R MY-1
R p840
10
20
30
40
50
A IgG
3.8%
21.6%
F4/80
CFS
E
MY-1
5.2%
38.6%
P84
29.9%
*********
***
IgG
P84
MY-1 (+) Rituximab
Phag
ocyt
osis
(%) 50
40302010
0
B
(+) R
ituxi
mab
( - )4.8%
IgG
P84
MY-1
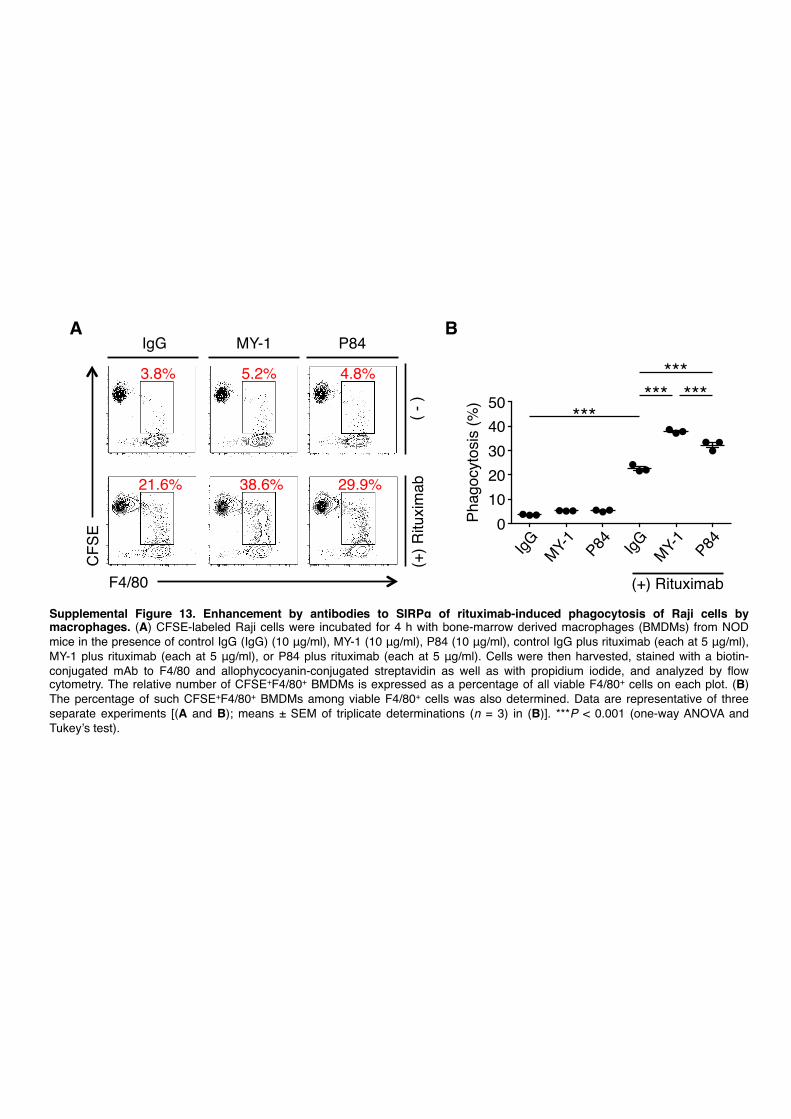
Supplemental Figure 13. Enhancement by antibodies to SIRP of rituximab-induced phagocytosis of Raji cells by macrophages. (A) CFSE-labeled Raji cells were incubated for 4 h with bone-marrow derived macrophages (BMDMs) from NOD mice in the presence of control IgG (IgG) (10 g/ml), MY-1 (10 g/ml), P84 (10 g/ml), control IgG plus rituximab (each at 5 g/ml), MY-1 plus rituximab (each at 5 g/ml), or P84 plus rituximab (each at 5 g/ml). Cells were then harvested, stained with a biotin-conjugated mAb to F4/80 and allophycocyanin-conjugated streptavidin as well as with propidium iodide, and analyzed by flow cytometry. The relative number of CFSE+F4/80+ BMDMs is expressed as a percentage of all viable F4/80+ cells on each plot. (B) The percentage of such CFSE+F4/80+ BMDMs among viable F4/80+ cells was also determined. Data are representative of three separate experiments [(A and B); means ± SEM of triplicate determinations (n = 3) in (B)]. ***P < 0.001 (one-way ANOVA and Tukey’s test).
IgG
P84MY-1
6.25:1
12.5:
1 2
5:1 5
0:1
50
40
30
20
10
0
E:T ratio
Lysi
s (%
)
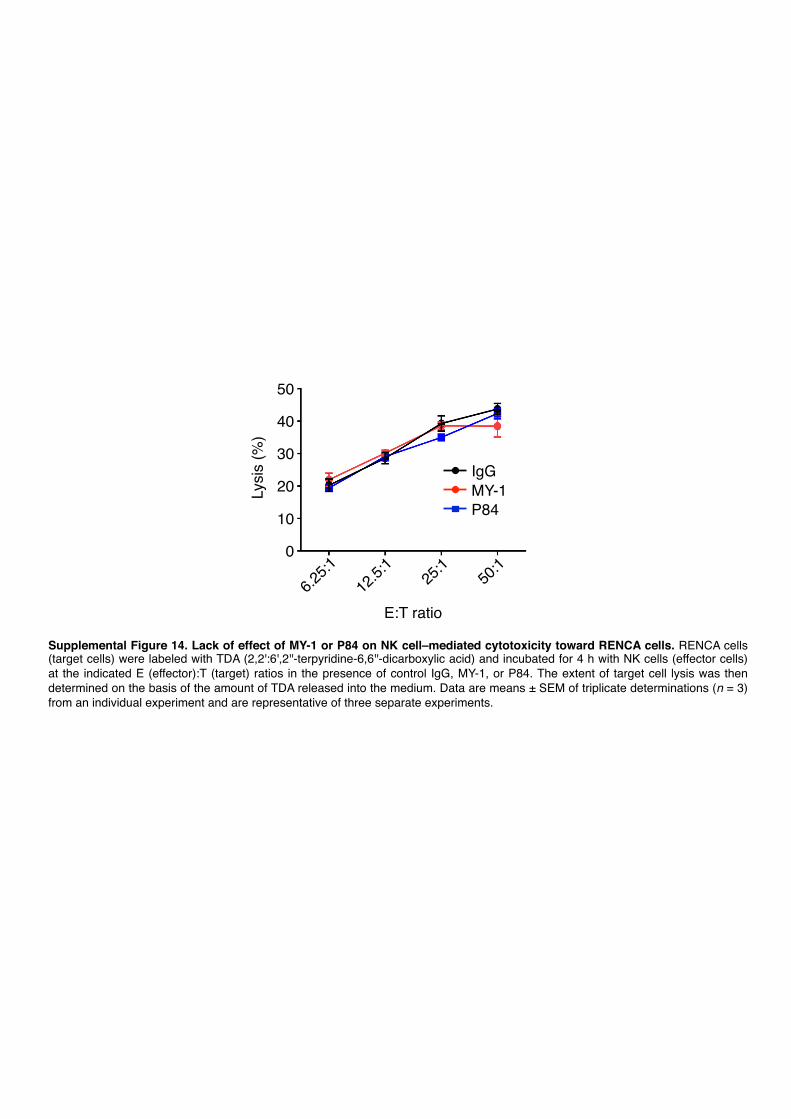
Supplemental Figure 14. Lack of effect of MY-1 or P84 on NK cell–mediated cytotoxicity toward RENCA cells. RENCA cells (target cells) were labeled with TDA (2,2':6',2''-terpyridine-6,6''-dicarboxylic acid) and incubated for 4 h with NK cells (effector cells) at the indicated E (effector):T (target) ratios in the presence of control IgG, MY-1, or P84. The extent of target cell lysis was then determined on the basis of the amount of TDA released into the medium. Data are means ± SEM of triplicate determinations (n = 3) from an individual experiment and are representative of three separate experiments.