![[T2RE] rules EL reprint 2015 TTR2 europe rules EN · Οι γκρι διαδρομές μπορούν να κλείσουν με ένα σετ ομοίων ... Μην ξεχνάτε](https://static.fdocument.org/doc/165x107/5f9cf751a63f0d1bd71c4e21/t2re-rules-el-reprint-2015-ttr2-europe-rules-en-.jpg)
electronic reprint Rapid model building of ²-sheets in - Phenix
10
electronic reprint Acta Crystallographica Section D Biological Crystallography ISSN 0907-4449 Editors: E. N. Baker and Z. Dauter Rapid model building of β -sheets in electron-density maps Thomas C. Terwilliger Acta Cryst. (2010). D66, 276–284 This open-access article is distributed under the terms of the Creative Commons Attribution Licence http://creativecommons.org/licenses/by/2.0/uk/legalcode , which permits unrestricted use, distribution, and reproduction in any medium, provided the original authors and source are cited. Acta Crystallographica Section D: Biological Crystallography welcomes the submission of papers covering any aspect of structural biology, with a particular emphasis on the struc- tures of biological macromolecules and the methods used to determine them. Reports on new protein structures are particularly encouraged, as are structure–function papers that could include crystallographic binding studies, or structural analysis of mutants or other modified forms of a known protein structure. The key criterion is that such papers should present new insights into biology, chemistry or structure. Papers on crystallo- graphic methods should be oriented towards biological crystallography, and may include new approaches to any aspect of structure determination or analysis. Crystallography Journals Online is available from journals.iucr.org Acta Cryst. (2010). D66, 276–284 Terwilliger · Rapid model building of β-sheets
Transcript of electronic reprint Rapid model building of ²-sheets in - Phenix
electronic reprintActa Crystallographica Section D
BiologicalCrystallography
ISSN 0907-4449
Editors: E. N. Baker and Z. Dauter
Rapid model building of β-sheets in electron-density maps
Thomas C. Terwilliger
Acta Cryst. (2010). D66, 276–284
This open-access article is distributed under the terms of the Creative Commons Attribution Licencehttp://creativecommons.org/licenses/by/2.0/uk/legalcode, which permits unrestricted use, distribution, andreproduction in any medium, provided the original authors and source are cited.
Acta Crystallographica Section D: Biological Crystallography welcomes the submission ofpapers covering any aspect of structural biology, with a particular emphasis on the struc-tures of biological macromolecules and the methods used to determine them. Reportson new protein structures are particularly encouraged, as are structure–function papersthat could include crystallographic binding studies, or structural analysis of mutants orother modified forms of a known protein structure. The key criterion is that such papersshould present new insights into biology, chemistry or structure. Papers on crystallo-graphic methods should be oriented towards biological crystallography, and may includenew approaches to any aspect of structure determination or analysis.
Crystallography Journals Online is available from journals.iucr.org
Acta Cryst. (2010). D66, 276–284 Terwilliger · Rapid model building of β-sheets
research papers
276 doi:10.1107/S0907444910000302 Acta Cryst. (2010). D66, 276–284
Acta Crystallographica Section D
BiologicalCrystallography
ISSN 0907-4449
Rapid model building of b-sheets in electron-densitymaps
Thomas C. Terwilliger
Los Alamos National Laboratory, Los Alamos,
NM 87545, USA
Correspondence e-mail: [email protected]
A method for rapidly building �-sheets into electron-density
maps is presented. �-Strands are identified as tubes of high
density adjacent to and nearly parallel to other tubes of
density. The alignment and direction of each strand are
identified from the pattern of high density corresponding to
carbonyl and C� atoms along the strand averaged over all
repeats present in the strand. The �-strands obtained are then
assembled into a single atomic model of the �-sheet regions.The method was tested on a set of 42 experimental electron-
density maps at resolutions ranging from 1.5 to 3.8 A. The
�-sheet regions were nearly completely built in all but two
cases, the exceptions being one structure at 2.5 A resolution in
which a third of the residues in �-sheets were built and a
structure at 3.8 A in which under 10% were built. The overall
average r.m.s.d. of main-chain atoms in the residues built using
this method compared with refined models of the structures
was 1.5 A.
Received 7 September 2009
Accepted 4 January 2010
1. Introduction
Many methods for the automatic interpretation of macro-
molecular electron-density maps and model building have
recently been developed. These methods address the critical
problem of building an atomic model that is consistent with
the known sequence of the macromolecule and the expected
geometrical features of the polymer. Automated map-inter-
pretation methods are a natural extension of the powerful
tools for interactive model building of models into maps [e.g.
O (Jones et al., 1991), MAIN (Turk, 1992), XtalView (McRee,
1999) and Coot (Emsley & Cowtan, 2004)], which include
semi-automated procedures for the generation of models after
the user specifies some information about the chain location
or geometry (Oldfield, 1994; Jones & Kjeldgaard, 1997;
McRee, 1999). Recently developed highly automated methods
for model building of proteins and nucleic acids include
procedures that first identify C�-atom positions and then
extend these to create a model (Oldfield, 2002, 2003; Ioerger
& Sacchettini, 2003; Cowtan, 2006) as well as methods that
first find regular secondary structure followed by extension to
build loops and other structures (Levitt, 2001; Terwilliger,
2003). Other methods begin with the identification of atomic
positions and their interpretation in terms of a polypeptide
chain (Perrakis et al., 1999) or begin with some information
about the location of the chain and extensive conformational
sampling to identify the conformation of the polymer
(DePristo et al., 2005). Recently, probabilistic methods based
on the recognition of density patterns in electron-density maps
have been developed that extend automated model building
to lower resolution ranges than were previously accessible
(DiMaio et al., 2007; Baker et al., 2007) and methods for
electronic reprint
building nucleic acids into electron-density maps have been
demonstrated (Pavelcik & Schneider, 2008).
There are several uses for automated model building. The
most important of these is to build an atomic model that will
form a basis for understanding the biology of the molecule
that has been crystallized. An important additional use of
automated methods for map interpretation is the evaluation
of the quality of electron-density maps during the structure-
determination process itself. Although many techniques exist
for choosing a high-quality electron-density map (see Terwil-
liger et al., 2009), by far the strongest indication that a struc-
ture has been ‘solved’ and an accurate electron-density map
has been obtained is the ability to interpret the map in terms
of an atomic model.
In the context of model building as a tool for map evalua-
tion, the speed of model building is important. The faster the
process, the more cases it can be applied to in a short period of
time. In particular, the faster the process, the more possibilities
for values of parameters in all steps of structure determination
can be tested. In our previous template-based methods for
main-chain building of protein structures, a key slow step
consists of finding which three-amino-acid fragment from a
large library best fits the electron density when placed at the
tip of a growing chain (Terwilliger, 2003). Although this step
can be optimized, for example by grouping of similar frag-
ments and testing only a small subset of the library, it is
intrinsically quite slow.
A much faster overall approach to model building is to look
specifically for regular secondary structure in an electron-
density map (Jones & Kjeldgaard, 1997; Cowtan, 1998, 2008;
Terwilliger, 2003). As typically more than half the polypeptide
chains in protein molecules have either �-helical or �-strandstructure, a large part of a protein molecule can potentially be
built in this way. Furthermore, as both �-helices and �-strandsare in many cases quite regular, it is possible to carry out
this analysis without considering a large number of different
backbone configurations.
One way to look for a specific feature in a map is to use an
FFT-based convolution search (Cowtan, 1998, 2008). We have
previously used such an approach to find �-helices and
�-strands in electron-density maps as the starting point for full
model building (Terwilliger, 2003); however, this process is not
as fast as it might be because it requires a separate FFT for
each orientation of the search model (e.g. a �-strand or
�-helical fragment).
A faster approach might be to identify features that are
observable at low resolution or for which the locations can be
identified or at least limited and only rotational components
need to be sampled (Jones, 2004; Cowtan, 2008). For example,
it might be possible to place �-helices or �-strands directly in
the map and follow this by adjustments of their orientations
and positions based on any additional information from the
map that has not already been used. We have used this type of
approach to build �-helices into electron-density maps at low
resolution (7 A), where they appear simply as cylinders of
density (Terwilliger, 2010). Higher resolution map information
was then used to identify the positioning and direction of the
helices. As the initial placement was performed with infor-
mation that was both low resolution and symmetrical (as the
�-helices appear as cylinders), it could be carried out rapidly.
Although subsequent steps were more time-intensive, they
were only applied to the relatively small number of helix
placements found, so the entire process was rapid.
Here, we develop a hierarchical method for �-sheet model
building in which adjacent strands in a sheet are identified as
nearly parallel tubes of density and the direction and register
of the strands are identified using density correlations based
on the periodicity of �-strands.
2. Modeling b-sheets in an electron-density map
Our approach for modeling the �-sheets in an electron-densitymap of a protein focuses on speed by examining the map for
characteristic features of these structures. The method consists
of three steps.
(i) Identification of the location of sheets based on the
presence of nearly parallel tubes of density.
(ii) Identification of �-strand alignment and direction using
the pattern of high density corresponding to carbonyl and C�
atoms along the strand averaged over all repeats present in the
strand.
(iii) Assembly of �-strands into a single model.
The result of this process is a model of the �-sheet portions ofthe structure. It can be used as a starting point for further
model building and map interpretation in combination with a
model of the �-helical portions of the structure. The steps
carried out are described in detail below.
2.1. Identification of sheet locations as nearly parallel tubes
of density
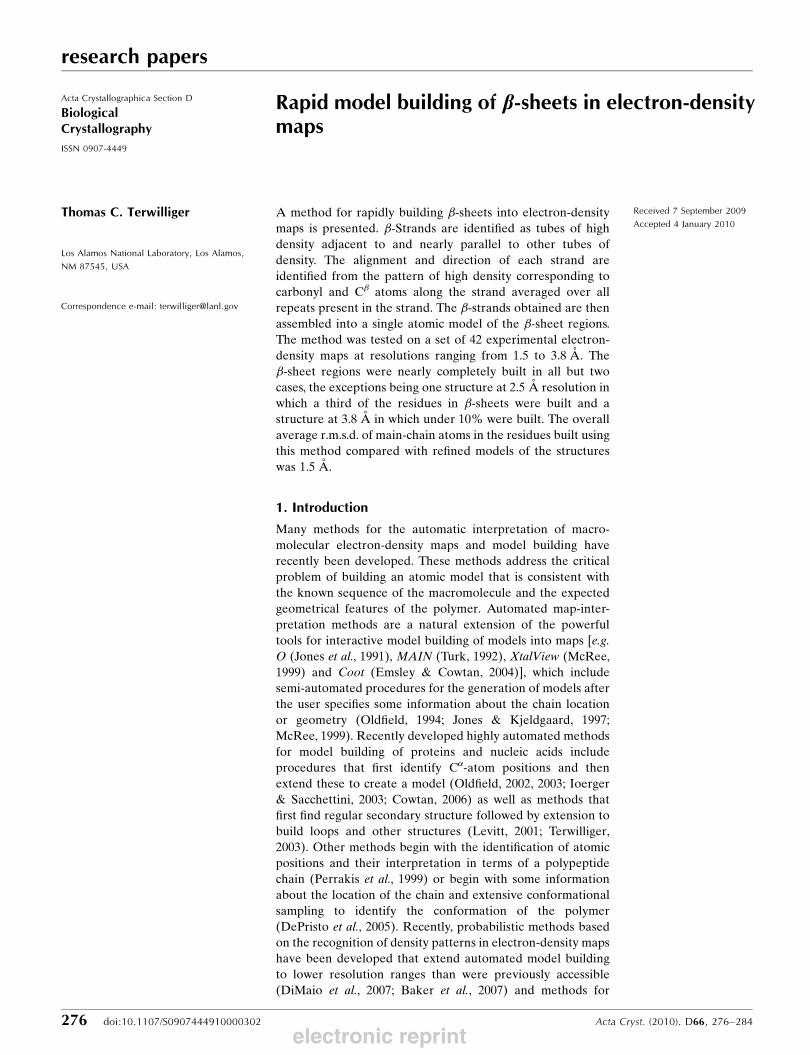
Fig. 1(a) illustrates a model of an antiparallel �-sheet andcorresponding density at a resolution of 2.5 A. The first step in
our procedure for building �-sheets is the identification of
where strands are located in the electron-density map. At
moderate resolution (2.5–4 A) the polypeptide backbone
resembles a tube of density and for �-strands the tubes have
only a small amount of curvature. In �-sheets these strands arearranged in a nearly parallel or antiparallel fashion, with a
small (typically up to about 30�) inclination between adjacent
strands. To simplify the identification of strands in a map and
to make it as rapid as possible, a pair of strands in a �-sheet istherefore initially considered to consist of two tubes of density
that are nearly parallel and that are separated by approxi-
mately 4.5 A at their closest approach. In this analysis, tubes of
density are identified, then pairs of nearly parallel tubes are
found and finally the tubes are extended into density, allowing
curvature of the tubes.
Tubes of density are found in the electron-density map by
finding points along ridgelines of high density. Firstly, a set of
points in the map that are on ridgelines of high density and are
separated typically by 2 A are identified (green spheres in
Fig. 1b). All pairs of points that are connected by high density
are then identified. The criteria for two points being connected
research papers
Acta Cryst. (2010). D66, 276–284 Terwilliger � Rapid model building of �-sheets 277electronic reprint
are that (i) the density � sampled along the line connecting the
points has a value of at least �max � cut1, where �max is the
higher of the densities at the two end points and cut1 typically
has a value of 0.5, and (ii) that the mean density �mean along
the line is at least �max � cut2, where the typical value of cut2 is
0.75. These pairs of connected points and the lines connecting
them represent the locations and directions of tubes of density
that might be �-strands.Next, pairs of nearly parallel tubes of density separated by
about 4.5 A are identified. This is performed by finding two
nearby nearly parallel pairs of connected points (representing
two tubes of density) with no high-density connections
between the pairs (such that the density � sampled along the
line connecting the points has a value of at most �max � cut1 as
defined above). The cosine of the angle between the two tubes
of density is typically required to be at least 0.5. The distance
between the tubes of density is typically required to be 4.5 �2.0 A at their closest approach. These tubes representing
high density in the map are then extended into the available
density, allowing the curvature of the tubes to match the high
density in the map, as illustrated for the two tubes of density
identified by red spheres in Fig. 1(b). To simplify the analysis,
this curvature is only allowed in the direction perpendicular to
a line connecting the midlines of the two tubes of density at
their closest approach. This direction was chosen because the
strands in �-sheets typically have a curvature that is roughly
perpendicular to the plane of the �-sheets.This procedure as a whole identifies tubes of density in the
electron-density map that have the characteristics expected of
a strand that is part of a �-sheet. Additionally, for each tube of
research papers
278 Terwilliger � Rapid model building of �-sheets Acta Cryst. (2010). D66, 276–284
Figure 1Model �-sheet density and interpretation. (a) �-Sheet (from PDB entry 1gba; Mace & Agard, 1995; with side chains truncated at C� atoms) with modelelectron density calculated at a resolution of 2.5 A. (b) Electron density with the locations of points along ridgelines of high density marked by greenspheres and with red spheres marking the axis of two adjacent curved tubes of density. (c) View of model �-sheet showing a �-strand with carbonyl Oatoms pointing up and down towards adjacent strands. (d) �-Sheet built using the methods presented here, after the assembly step combining strandsobtained by analysis of the map at resolutions of 2.5, 3 and 4 A. These figures were produced using PyMOL (DeLano, 2002).
electronic reprint
density the direction to a neighbouring tube of density is also
identified, yielding the expected direction of the carbonyl O
atoms relative to the backbone of the �-strand.To ensure that the tubes of density being considered have a
shape that is approximately that expected for a �-strand, eachtube of density is scored in two ways. Firstly, the correlation
coefficient between the density in the map and an ideal tube of
density with a value of 1 along its axis and 0 at a radius of 1.5 A
is estimated. If this is less than the value of cc_strand_min
(typically set at 0.5) then the tube of density is discarded as
a candidate �-strand position. Otherwise, the score for the
tube consists of the mean density along the axis of the tube
multiplied by the square root of the length of the tube of
density. This is similar to the scoring procedure that we have
used previously to evaluate the quality of fit of a model to
density (Terwilliger, 2003).
2.2. Identification of b-strand alignment and direction
Once tubes of density that could represent �-strands havebeen identified as described above, they are each considered
individually for their fit to a model of a �-strand, allowing thecurvature of the strand to match the curvature of the tube of
density. Fig. 1(c) shows a close-up view of a model strand and
of the curved axis of the tube of density corresponding to it. In
this step the goal is to start with the density map and the points
marking the tube of density and to end with a strand fitted into
the density. One way to do this would be to model a strand in
all possible positions near the axis of the tube of density and
find the one that fits the best. We chose instead to use a faster
but less comprehensive method in which the density near the
curve marking the tube of density is examined for periodic
patterns corresponding to the pattern of carbonyl O and C�
atoms along a �-sheet.Fig. 1(c) illustrates the features of the electron density that
we used in this process. The carbonyl O atoms of the strand in
the middle of the figure point alternately up towards the
�-strand above it and down towards the �-strand below it in
the figure. The C� atoms point alternately into the page and
out from it. Note that the C� atoms have a specific relationship
to the direction of the chain and the positions of the carbonyl
atoms: they are located about two-thirds of the distance from
one carbonyl to the next going from right to left (N-terminus
to C-terminus) along the chain in the middle of Fig. 1(c). This
relationship is what we use to identify the positioning and
direction of the �-strand.The representation of the density for this strand as a tube
is marked by the red spheres in Fig. 1(c). Note that the red
spheres very nearly coincide with the main-chain atoms of the
strand. As the periodicity of the �-strand is known (about
6.7 A), it is simple and rapid to average the density near the
strand over all corresponding locations along the strand. This
produces average density for one repeat of the strand. Then,
as the direction towards the neighboring strand is already
known, the positioning of the carbonyl atoms can readily be
identified as being where the density approximately 1.5 A
from the axis of the strand in the direction of the neighbouring
strand is maximal (as illustrated by the two carbonyl O atoms
pointing up from the middle strand in Fig. 1c). With the same
alignment, another carbonyl O atom points down towards the
strand on the other side and this density should be offset by
half of the period of the �-strand. In our approach, if these twoestimates of the locations of the carbonyls agree to within
approximately 1/12 of the period then the identification of the
location is considered to be a possible match.
The same approach can then be applied to examine the
density, again about 1.5 A from the axis of the strand, this time
in the directions perpendicular to the plane of the �-sheet.This density corresponds to that of the C� atoms and is offset
by about 1/3 of a period from that of the carbonyl O atoms
(Fig. 1c). The pattern of high density and direction along the
�-strand going from the N-terminus to the C-terminus can
now be readily seen. For the �-strand in the middle of Fig. 1(c),
starting at the carbonyl O atom pointing up at the right of the
figure and moving to the left one atom at a time, it may be seen
that the pattern of high density will be (i) up at position 1 (at
the carbonyl C atom), (ii) right at atom 3 (the C� atom into the
plane of the figure), (iii) down at atom 4 (the next carbonyl),
(iv) left at atom 6 (the next C� atom) and then up again at
atom 7 (the next carbonyl O atom pointing up). Note that if the
strand were in the opposite direction then the pattern would
be different. Consequently, the position and direction of the
strand can be identified. In our procedure, if all the positions
of highest density in this pattern are aligned within a tolerance
of 1/12 of the period of the �-strand then the position and
direction are considered to be likely to be correct (this would
happen in about 1% of cases by chance, as there are two
possible directions of the strand, the position of the first
carbonyl is defined as the start and the highest density would
be within 1/12 of the target position 1/6 of the time for each of
the other three atoms).
Given the direction and alignment of a strand as in Fig. 1(c)
and the curve corresponding approximately to the main-chain
atoms (the red spheres in Fig. 1c), an idealized �-strand can beplaced. In cases where the direction cannot be identified using
the method described above, two candidate �-strands are
created, one in each direction. Note that if the curvature is
substantial then there can be some distortion of the strand.
2.3. Assembly of b-strands, elimination of overlaps and
joining of adjacent segments
The analysis described above yields a group of modelled
�-strands that match the electron density. However, these
strands may contain overlapping fragments. We use the main-
chain assembly routines in the RESOLVE software to
assemble these fragments and resolve any overlaps (Terwil-
liger, 2003). All the �-strands are ranked based on their match
to the density using the scoring function described above.
�-Strands that have two or more sequential C� atoms that
overlap within about 1 A are connected into longer chains.
The highest scoring chain is selected and all overlapping
fragments are deleted. The process is continued until no
further fragments with a length of at least four residues are
research papers
Acta Cryst. (2010). D66, 276–284 Terwilliger � Rapid model building of �-sheets 279electronic reprint
found. Fig. 1(d) shows the result of carrying this out when the
strands found from analyses of this map using data to a
resolution of 2.5, 3 and 4 A are merged in this assembly
process (the default procedure).
3. Application to experimental electron-density maps
We tested our approach for modeling �-strands using a set of
42 density-modified electron-density maps from the PHENIX
structure library previously solved by MAD, SAD, MIR and a
combination of SAD and SIR procedures with data extending
to high resolutions ranging from 1.5 to 3.8 A. Maps were
calculated with the PHENIX AutoSol wizard (Adams et al.,
2002; Terwilliger et al., 2009) using the data that had previously
led to refined models for each of the structures considered.
Each map was examined for �-strands using the procedure
described above.
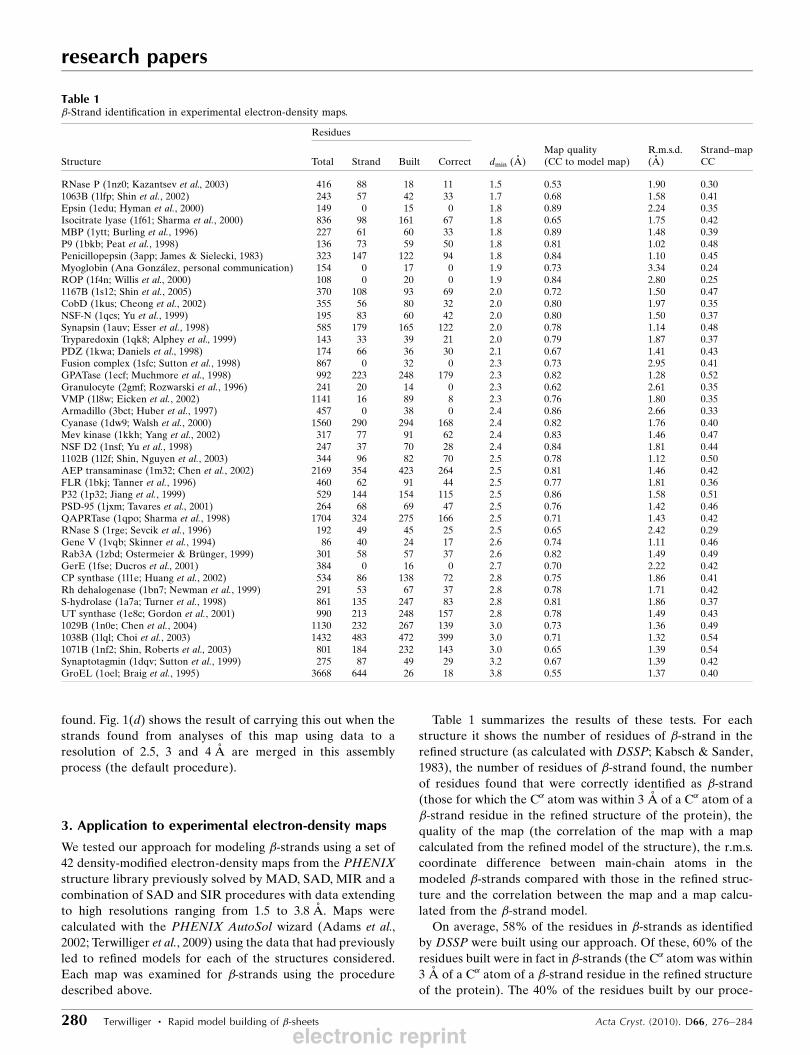
Table 1 summarizes the results of these tests. For each
structure it shows the number of residues of �-strand in the
refined structure (as calculated with DSSP; Kabsch & Sander,
1983), the number of residues of �-strand found, the number
of residues found that were correctly identified as �-strand(those for which the C� atom was within 3 A of a C� atom of a
�-strand residue in the refined structure of the protein), the
quality of the map (the correlation of the map with a map
calculated from the refined model of the structure), the r.m.s.
coordinate difference between main-chain atoms in the
modeled �-strands compared with those in the refined struc-
ture and the correlation between the map and a map calcu-
lated from the �-strand model.
On average, 58% of the residues in �-strands as identifiedby DSSP were built using our approach. Of these, 60% of the
residues built were in fact in �-strands (the C� atom was within
3 A of a C� atom of a �-strand residue in the refined structure
of the protein). The 40% of the residues built by our proce-
research papers
280 Terwilliger � Rapid model building of �-sheets Acta Cryst. (2010). D66, 276–284
Table 1�-Strand identification in experimental electron-density maps.
Residues
Structure Total Strand Built Correct dmin (A)Map quality(CC to model map)
R.m.s.d.(A)
Strand–mapCC
RNase P (1nz0; Kazantsev et al., 2003) 416 88 18 11 1.5 0.53 1.90 0.301063B (1lfp; Shin et al., 2002) 243 57 42 33 1.7 0.68 1.58 0.41Epsin (1edu; Hyman et al., 2000) 149 0 15 0 1.8 0.89 2.24 0.35Isocitrate lyase (1f61; Sharma et al., 2000) 836 98 161 67 1.8 0.65 1.75 0.42MBP (1ytt; Burling et al., 1996) 227 61 60 33 1.8 0.89 1.48 0.39P9 (1bkb; Peat et al., 1998) 136 73 59 50 1.8 0.81 1.02 0.48Penicillopepsin (3app; James & Sielecki, 1983) 323 147 122 94 1.8 0.84 1.10 0.45Myoglobin (Ana Gonzalez, personal communication) 154 0 17 0 1.9 0.73 3.34 0.24ROP (1f4n; Willis et al., 2000) 108 0 20 0 1.9 0.84 2.80 0.251167B (1s12; Shin et al., 2005) 370 108 93 69 2.0 0.72 1.50 0.47CobD (1kus; Cheong et al., 2002) 355 56 80 32 2.0 0.80 1.97 0.35NSF-N (1qcs; Yu et al., 1999) 195 83 60 42 2.0 0.80 1.50 0.37Synapsin (1auv; Esser et al., 1998) 585 179 165 122 2.0 0.78 1.14 0.48Tryparedoxin (1qk8; Alphey et al., 1999) 143 33 39 21 2.0 0.79 1.87 0.37PDZ (1kwa; Daniels et al., 1998) 174 66 36 30 2.1 0.67 1.41 0.43Fusion complex (1sfc; Sutton et al., 1998) 867 0 32 0 2.3 0.73 2.95 0.41GPATase (1ecf; Muchmore et al., 1998) 992 223 248 179 2.3 0.82 1.28 0.52Granulocyte (2gmf; Rozwarski et al., 1996) 241 20 14 0 2.3 0.62 2.61 0.35VMP (1l8w; Eicken et al., 2002) 1141 16 89 8 2.3 0.76 1.80 0.35Armadillo (3bct; Huber et al., 1997) 457 0 38 0 2.4 0.86 2.66 0.33Cyanase (1dw9; Walsh et al., 2000) 1560 290 294 168 2.4 0.82 1.76 0.40Mev kinase (1kkh; Yang et al., 2002) 317 77 91 62 2.4 0.83 1.46 0.47NSF D2 (1nsf; Yu et al., 1998) 247 37 70 28 2.4 0.84 1.81 0.441102B (1l2f; Shin, Nguyen et al., 2003) 344 96 82 70 2.5 0.78 1.12 0.50AEP transaminase (1m32; Chen et al., 2002) 2169 354 423 264 2.5 0.81 1.46 0.42FLR (1bkj; Tanner et al., 1996) 460 62 91 44 2.5 0.77 1.81 0.36P32 (1p32; Jiang et al., 1999) 529 144 154 115 2.5 0.86 1.58 0.51PSD-95 (1jxm; Tavares et al., 2001) 264 68 69 47 2.5 0.76 1.42 0.46QAPRTase (1qpo; Sharma et al., 1998) 1704 324 275 166 2.5 0.71 1.43 0.42RNase S (1rge; Sevcik et al., 1996) 192 49 45 25 2.5 0.65 2.42 0.29Gene V (1vqb; Skinner et al., 1994) 86 40 24 17 2.6 0.74 1.11 0.46Rab3A (1zbd; Ostermeier & Brunger, 1999) 301 58 57 37 2.6 0.82 1.49 0.49GerE (1fse; Ducros et al., 2001) 384 0 16 0 2.7 0.70 2.22 0.42CP synthase (1l1e; Huang et al., 2002) 534 86 138 72 2.8 0.75 1.86 0.41Rh dehalogenase (1bn7; Newman et al., 1999) 291 53 67 37 2.8 0.78 1.71 0.42S-hydrolase (1a7a; Turner et al., 1998) 861 135 247 83 2.8 0.81 1.86 0.37UT synthase (1e8c; Gordon et al., 2001) 990 213 248 157 2.8 0.78 1.49 0.431029B (1n0e; Chen et al., 2004) 1130 232 267 139 3.0 0.73 1.36 0.491038B (1lql; Choi et al., 2003) 1432 483 472 399 3.0 0.71 1.32 0.541071B (1nf2; Shin, Roberts et al., 2003) 801 184 232 143 3.0 0.65 1.39 0.54Synaptotagmin (1dqv; Sutton et al., 1999) 275 87 49 29 3.2 0.67 1.39 0.42GroEL (1oel; Braig et al., 1995) 3668 644 26 18 3.8 0.55 1.37 0.40
electronic reprint
research papers
Acta Cryst. (2010). D66, 276–284 Terwilliger � Rapid model building of �-sheets 281
dure that did not match �-strands as identified by DSSP were
either incorrectly built (e.g. traced into helices) or were built
into less regular secondary structure (such as loop regions).
Therefore, the method built �-sheets reasonably well, but
some �-strands were missed and some residues were identified
as �-strand that were in fact another type of structure. Overall,
the r.m.s.d. between modelled �-strands and refined coordi-
nates was about 1.5 A. The CPU time required (using 2.9 GHz
Intel Xeon processors) to analyze all 42 maps was 66 min or
about 0.8 s per residue of �-strand placed.
To compare these results with a standard procedure for
automated model building, the same 42 maps were analyzed
with the PHENIX AutoBuild wizard (Terwilliger et al., 2008)
using one cycle of model building and refinement. The
AutoBuild wizard built 65% of the residues in �-strands as
identified with DSSP, with an overall r.m.s.d. (including all
main-chain and C� residues built, whether strand or not) of
0.95 A and required 43 h for the entire set of structures.
One structure for which most �-strand residues were missed
was the GroEL structure (PDB entry 1oel; Braig et al., 1995;
Berman et al., 2000; Bernstein et al., 1977). This structure has
644 residues in �-strands; however, only 18 of these were
found. This structure was at a much lower resolution (3.8 A)
than all the others in this test and the map was of lower quality
than most (correlation with a model map of 0.55), suggesting
that the method may not work well at lower resolutions or
with maps of poor quality.
In a few cases significantly more �-strand residues were
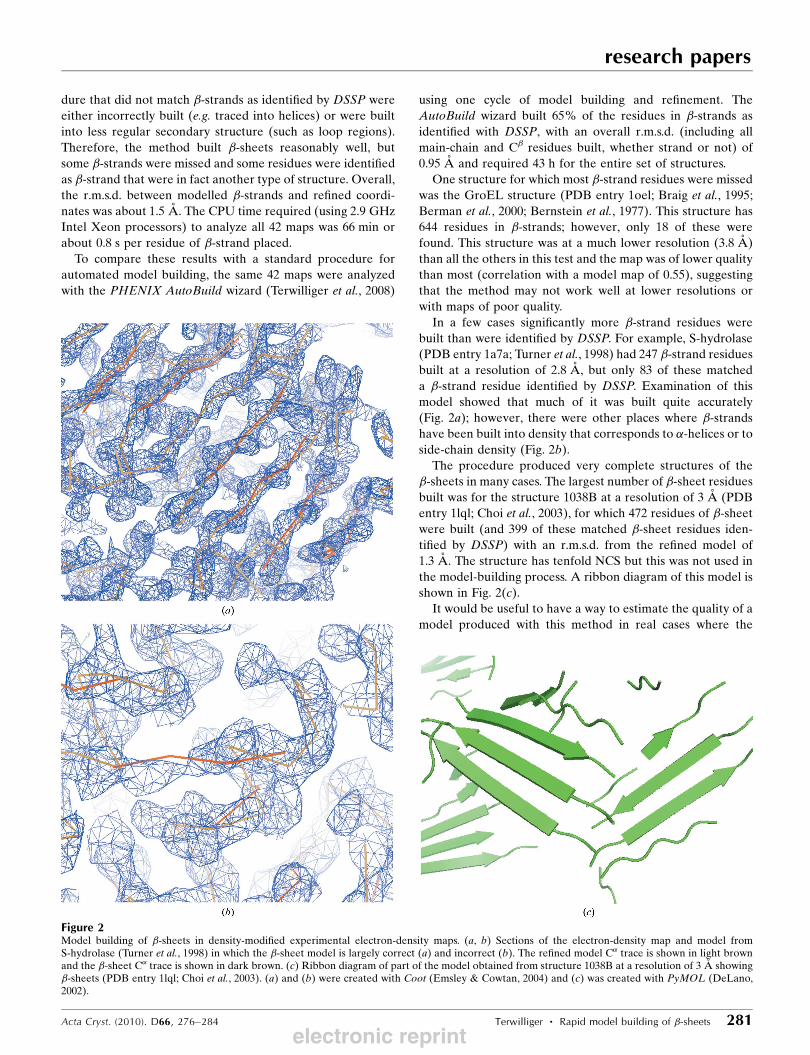
built than were identified by DSSP. For example, S-hydrolase
(PDB entry 1a7a; Turner et al., 1998) had 247 �-strand residuesbuilt at a resolution of 2.8 A, but only 83 of these matched
a �-strand residue identified by DSSP. Examination of this
model showed that much of it was built quite accurately
(Fig. 2a); however, there were other places where �-strandshave been built into density that corresponds to �-helices or toside-chain density (Fig. 2b).
The procedure produced very complete structures of the
�-sheets in many cases. The largest number of �-sheet residuesbuilt was for the structure 1038B at a resolution of 3 A (PDB
entry 1lql; Choi et al., 2003), for which 472 residues of �-sheetwere built (and 399 of these matched �-sheet residues iden-tified by DSSP) with an r.m.s.d. from the refined model of
1.3 A. The structure has tenfold NCS but this was not used in
the model-building process. A ribbon diagram of this model is
shown in Fig. 2(c).
It would be useful to have a way to estimate the quality of a
model produced with this method in real cases where the
Figure 2Model building of �-sheets in density-modified experimental electron-density maps. (a, b) Sections of the electron-density map and model fromS-hydrolase (Turner et al., 1998) in which the �-sheet model is largely correct (a) and incorrect (b). The refined model C� trace is shown in light brownand the �-sheet C� trace is shown in dark brown. (c) Ribbon diagram of part of the model obtained from structure 1038B at a resolution of 3 A showing�-sheets (PDB entry 1lql; Choi et al., 2003). (a) and (b) were created with Coot (Emsley & Cowtan, 2004) and (c) was created with PyMOL (DeLano,2002).
electronic reprint
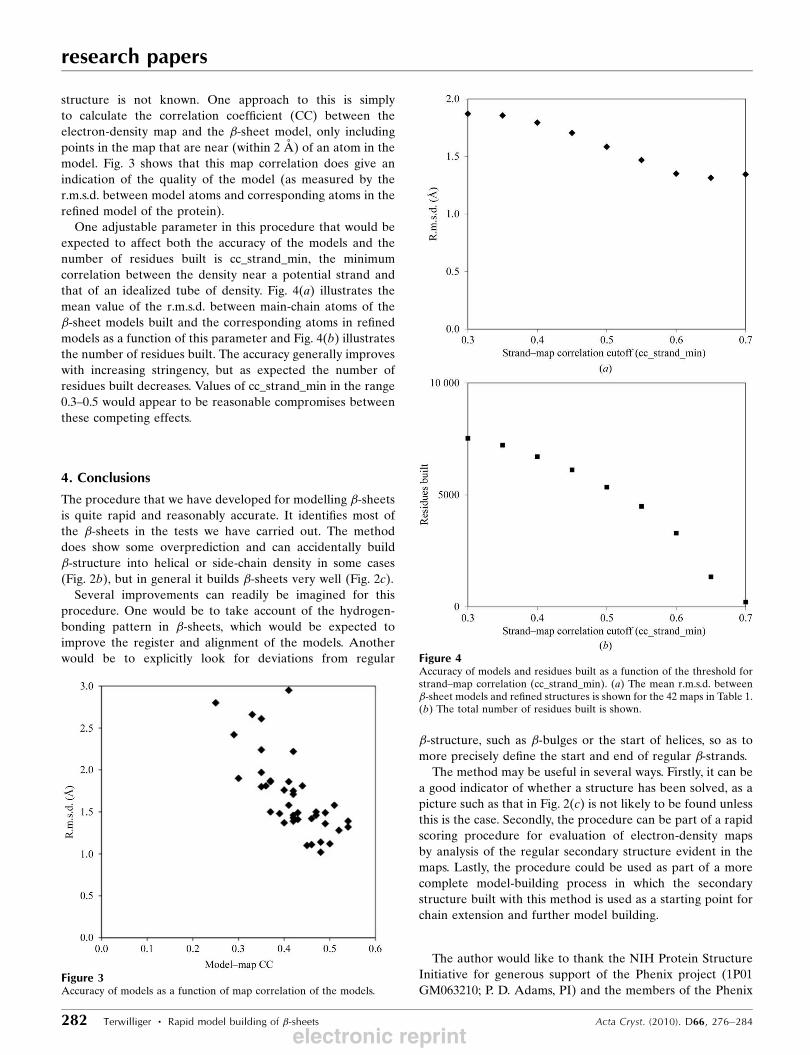
structure is not known. One approach to this is simply
to calculate the correlation coefficient (CC) between the
electron-density map and the �-sheet model, only including
points in the map that are near (within 2 A) of an atom in the
model. Fig. 3 shows that this map correlation does give an
indication of the quality of the model (as measured by the
r.m.s.d. between model atoms and corresponding atoms in the
refined model of the protein).
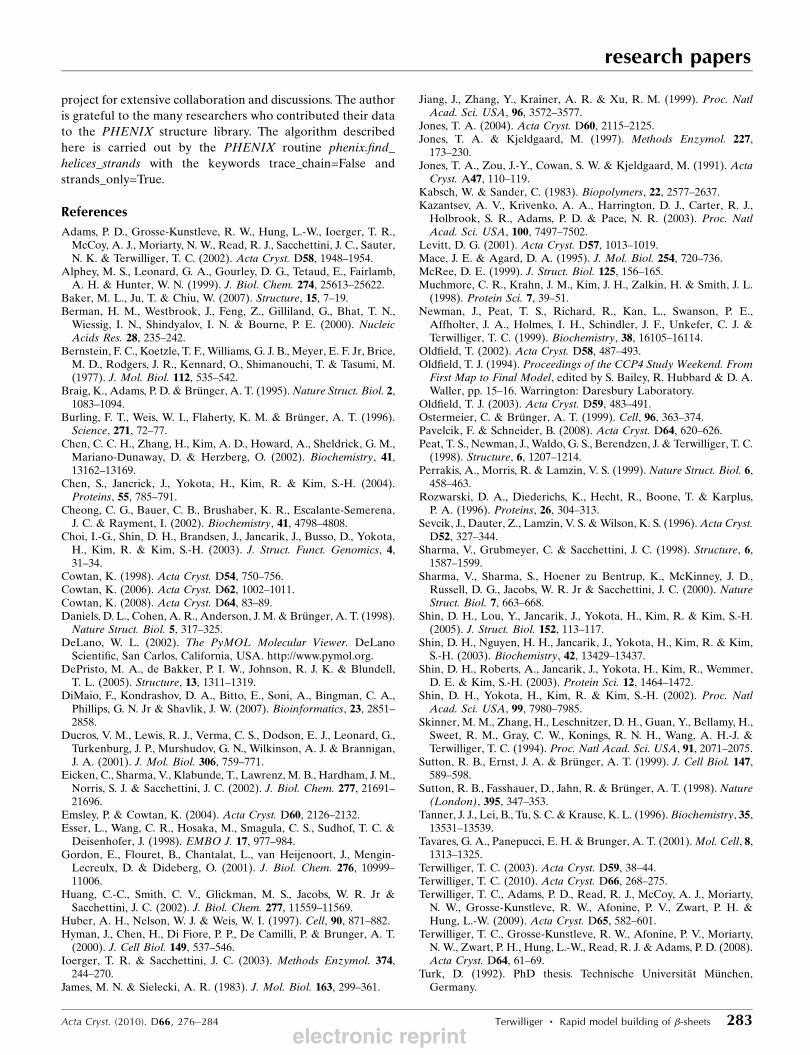
One adjustable parameter in this procedure that would be
expected to affect both the accuracy of the models and the
number of residues built is cc_strand_min, the minimum
correlation between the density near a potential strand and
that of an idealized tube of density. Fig. 4(a) illustrates the
mean value of the r.m.s.d. between main-chain atoms of the
�-sheet models built and the corresponding atoms in refined
models as a function of this parameter and Fig. 4(b) illustrates
the number of residues built. The accuracy generally improves
with increasing stringency, but as expected the number of
residues built decreases. Values of cc_strand_min in the range
0.3–0.5 would appear to be reasonable compromises between
these competing effects.
4. Conclusions
The procedure that we have developed for modelling �-sheetsis quite rapid and reasonably accurate. It identifies most of
the �-sheets in the tests we have carried out. The method
does show some overprediction and can accidentally build
�-structure into helical or side-chain density in some cases
(Fig. 2b), but in general it builds �-sheets very well (Fig. 2c).
Several improvements can readily be imagined for this
procedure. One would be to take account of the hydrogen-
bonding pattern in �-sheets, which would be expected to
improve the register and alignment of the models. Another
would be to explicitly look for deviations from regular
�-structure, such as �-bulges or the start of helices, so as to
more precisely define the start and end of regular �-strands.The method may be useful in several ways. Firstly, it can be
a good indicator of whether a structure has been solved, as a
picture such as that in Fig. 2(c) is not likely to be found unless
this is the case. Secondly, the procedure can be part of a rapid
scoring procedure for evaluation of electron-density maps
by analysis of the regular secondary structure evident in the
maps. Lastly, the procedure could be used as part of a more
complete model-building process in which the secondary
structure built with this method is used as a starting point for
chain extension and further model building.
The author would like to thank the NIH Protein Structure
Initiative for generous support of the Phenix project (1P01
GM063210; P. D. Adams, PI) and the members of the Phenix
research papers
282 Terwilliger � Rapid model building of �-sheets Acta Cryst. (2010). D66, 276–284
Figure 3Accuracy of models as a function of map correlation of the models.
Figure 4Accuracy of models and residues built as a function of the threshold forstrand–map correlation (cc_strand_min). (a) The mean r.m.s.d. between�-sheet models and refined structures is shown for the 42 maps in Table 1.(b) The total number of residues built is shown.
electronic reprint
project for extensive collaboration and discussions. The author
is grateful to the many researchers who contributed their data
to the PHENIX structure library. The algorithm described
here is carried out by the PHENIX routine phenix.find_
helices_strands with the keywords trace_chain=False and
strands_only=True.
References
Adams, P. D., Grosse-Kunstleve, R. W., Hung, L.-W., Ioerger, T. R.,McCoy, A. J., Moriarty, N. W., Read, R. J., Sacchettini, J. C., Sauter,N. K. & Terwilliger, T. C. (2002). Acta Cryst. D58, 1948–1954.
Alphey, M. S., Leonard, G. A., Gourley, D. G., Tetaud, E., Fairlamb,A. H. & Hunter, W. N. (1999). J. Biol. Chem. 274, 25613–25622.
Baker, M. L., Ju, T. & Chiu, W. (2007). Structure, 15, 7–19.Berman, H. M., Westbrook, J., Feng, Z., Gilliland, G., Bhat, T. N.,Wiessig, I. N., Shindyalov, I. N. & Bourne, P. E. (2000). NucleicAcids Res. 28, 235–242.
Bernstein, F. C., Koetzle, T. F., Williams, G. J. B., Meyer, E. F. Jr, Brice,M. D., Rodgers, J. R., Kennard, O., Shimanouchi, T. & Tasumi, M.(1977). J. Mol. Biol. 112, 535–542.
Braig, K., Adams, P. D. & Brunger, A. T. (1995). Nature Struct. Biol. 2,1083–1094.
Burling, F. T., Weis, W. I., Flaherty, K. M. & Brunger, A. T. (1996).Science, 271, 72–77.
Chen, C. C. H., Zhang, H., Kim, A. D., Howard, A., Sheldrick, G. M.,Mariano-Dunaway, D. & Herzberg, O. (2002). Biochemistry, 41,13162–13169.
Chen, S., Jancrick, J., Yokota, H., Kim, R. & Kim, S.-H. (2004).Proteins, 55, 785–791.
Cheong, C. G., Bauer, C. B., Brushaber, K. R., Escalante-Semerena,J. C. & Rayment, I. (2002). Biochemistry, 41, 4798–4808.
Choi, I.-G., Shin, D. H., Brandsen, J., Jancarik, J., Busso, D., Yokota,H., Kim, R. & Kim, S.-H. (2003). J. Struct. Funct. Genomics, 4,31–34.
Cowtan, K. (1998). Acta Cryst. D54, 750–756.Cowtan, K. (2006). Acta Cryst. D62, 1002–1011.Cowtan, K. (2008). Acta Cryst. D64, 83–89.Daniels, D. L., Cohen, A. R., Anderson, J. M. & Brunger, A. T. (1998).Nature Struct. Biol. 5, 317–325.
DeLano, W. L. (2002). The PyMOL Molecular Viewer. DeLanoScientific, San Carlos, California, USA. http://www.pymol.org.
DePristo, M. A., de Bakker, P. I. W., Johnson, R. J. K. & Blundell,T. L. (2005). Structure, 13, 1311–1319.
DiMaio, F., Kondrashov, D. A., Bitto, E., Soni, A., Bingman, C. A.,Phillips, G. N. Jr & Shavlik, J. W. (2007). Bioinformatics, 23, 2851–2858.
Ducros, V. M., Lewis, R. J., Verma, C. S., Dodson, E. J., Leonard, G.,Turkenburg, J. P., Murshudov, G. N., Wilkinson, A. J. & Brannigan,J. A. (2001). J. Mol. Biol. 306, 759–771.
Eicken, C., Sharma, V., Klabunde, T., Lawrenz, M. B., Hardham, J. M.,Norris, S. J. & Sacchettini, J. C. (2002). J. Biol. Chem. 277, 21691–21696.
Emsley, P. & Cowtan, K. (2004). Acta Cryst. D60, 2126–2132.Esser, L., Wang, C. R., Hosaka, M., Smagula, C. S., Sudhof, T. C. &Deisenhofer, J. (1998). EMBO J. 17, 977–984.
Gordon, E., Flouret, B., Chantalat, L., van Heijenoort, J., Mengin-Lecreulx, D. & Dideberg, O. (2001). J. Biol. Chem. 276, 10999–11006.
Huang, C.-C., Smith, C. V., Glickman, M. S., Jacobs, W. R. Jr &Sacchettini, J. C. (2002). J. Biol. Chem. 277, 11559–11569.
Huber, A. H., Nelson, W. J. & Weis, W. I. (1997). Cell, 90, 871–882.Hyman, J., Chen, H., Di Fiore, P. P., De Camilli, P. & Brunger, A. T.(2000). J. Cell Biol. 149, 537–546.
Ioerger, T. R. & Sacchettini, J. C. (2003). Methods Enzymol. 374,244–270.
James, M. N. & Sielecki, A. R. (1983). J. Mol. Biol. 163, 299–361.
Jiang, J., Zhang, Y., Krainer, A. R. & Xu, R. M. (1999). Proc. NatlAcad. Sci. USA, 96, 3572–3577.
Jones, T. A. (2004). Acta Cryst. D60, 2115–2125.Jones, T. A. & Kjeldgaard, M. (1997). Methods Enzymol. 227,173–230.
Jones, T. A., Zou, J.-Y., Cowan, S. W. & Kjeldgaard, M. (1991). ActaCryst. A47, 110–119.
Kabsch, W. & Sander, C. (1983). Biopolymers, 22, 2577–2637.Kazantsev, A. V., Krivenko, A. A., Harrington, D. J., Carter, R. J.,Holbrook, S. R., Adams, P. D. & Pace, N. R. (2003). Proc. NatlAcad. Sci. USA, 100, 7497–7502.
Levitt, D. G. (2001). Acta Cryst. D57, 1013–1019.Mace, J. E. & Agard, D. A. (1995). J. Mol. Biol. 254, 720–736.McRee, D. E. (1999). J. Struct. Biol. 125, 156–165.Muchmore, C. R., Krahn, J. M., Kim, J. H., Zalkin, H. & Smith, J. L.(1998). Protein Sci. 7, 39–51.
Newman, J., Peat, T. S., Richard, R., Kan, L., Swanson, P. E.,Affholter, J. A., Holmes, I. H., Schindler, J. F., Unkefer, C. J. &Terwilliger, T. C. (1999). Biochemistry, 38, 16105–16114.
Oldfield, T. (2002). Acta Cryst. D58, 487–493.Oldfield, T. J. (1994). Proceedings of the CCP4 Study Weekend. FromFirst Map to Final Model, edited by S. Bailey, R. Hubbard & D. A.Waller, pp. 15–16. Warrington: Daresbury Laboratory.
Oldfield, T. J. (2003). Acta Cryst. D59, 483–491.Ostermeier, C. & Brunger, A. T. (1999). Cell, 96, 363–374.Pavelcik, F. & Schneider, B. (2008). Acta Cryst. D64, 620–626.Peat, T. S., Newman, J., Waldo, G. S., Berendzen, J. & Terwilliger, T. C.(1998). Structure, 6, 1207–1214.
Perrakis, A., Morris, R. & Lamzin, V. S. (1999). Nature Struct. Biol. 6,458–463.
Rozwarski, D. A., Diederichs, K., Hecht, R., Boone, T. & Karplus,P. A. (1996). Proteins, 26, 304–313.
Sevcik, J., Dauter, Z., Lamzin, V. S. &Wilson, K. S. (1996).Acta Cryst.D52, 327–344.
Sharma, V., Grubmeyer, C. & Sacchettini, J. C. (1998). Structure, 6,1587–1599.
Sharma, V., Sharma, S., Hoener zu Bentrup, K., McKinney, J. D.,Russell, D. G., Jacobs, W. R. Jr & Sacchettini, J. C. (2000). NatureStruct. Biol. 7, 663–668.
Shin, D. H., Lou, Y., Jancarik, J., Yokota, H., Kim, R. & Kim, S.-H.(2005). J. Struct. Biol. 152, 113–117.
Shin, D. H., Nguyen, H. H., Jancarik, J., Yokota, H., Kim, R. & Kim,S.-H. (2003). Biochemistry, 42, 13429–13437.
Shin, D. H., Roberts, A., Jancarik, J., Yokota, H., Kim, R., Wemmer,D. E. & Kim, S.-H. (2003). Protein Sci. 12, 1464–1472.
Shin, D. H., Yokota, H., Kim, R. & Kim, S.-H. (2002). Proc. NatlAcad. Sci. USA, 99, 7980–7985.
Skinner, M. M., Zhang, H., Leschnitzer, D. H., Guan, Y., Bellamy, H.,Sweet, R. M., Gray, C. W., Konings, R. N. H., Wang, A. H.-J. &Terwilliger, T. C. (1994). Proc. Natl Acad. Sci. USA, 91, 2071–2075.
Sutton, R. B., Ernst, J. A. & Brunger, A. T. (1999). J. Cell Biol. 147,589–598.
Sutton, R. B., Fasshauer, D., Jahn, R. & Brunger, A. T. (1998). Nature(London), 395, 347–353.
Tanner, J. J., Lei, B., Tu, S. C. & Krause, K. L. (1996). Biochemistry, 35,13531–13539.
Tavares, G. A., Panepucci, E. H. & Brunger, A. T. (2001).Mol. Cell, 8,1313–1325.
Terwilliger, T. C. (2003). Acta Cryst. D59, 38–44.Terwilliger, T. C. (2010). Acta Cryst. D66, 268–275.Terwilliger, T. C., Adams, P. D., Read, R. J., McCoy, A. J., Moriarty,N. W., Grosse-Kunstleve, R. W., Afonine, P. V., Zwart, P. H. &Hung, L.-W. (2009). Acta Cryst. D65, 582–601.
Terwilliger, T. C., Grosse-Kunstleve, R. W., Afonine, P. V., Moriarty,N. W., Zwart, P. H., Hung, L.-W., Read, R. J. & Adams, P. D. (2008).Acta Cryst. D64, 61–69.
Turk, D. (1992). PhD thesis. Technische Universitat Munchen,Germany.
research papers
Acta Cryst. (2010). D66, 276–284 Terwilliger � Rapid model building of �-sheets 283electronic reprint
Turner, M. A., Yuan, C. S., Borchardt, R. T., Hershfield, M. S., Smith,G. D. & Howell, P. L. (1998). Nature Struct. Biol. 5, 369–376.
Walsh, M. A., Otwinowski, Z., Perrakis, A., Anderson, P. M. &Joachimiak, A. (2000). Structure, 8, 505–514.
Willis, M. A., Bishop, B., Regan, L. & Brunger, A. T. (2000). StructureFold. Des. 8, 1319–1328.
Yang, D., Shipman, L. W., Roessner, C. A., Scott, A. I. & Sacchettini,J. C. (2002). J. Biol. Chem. 277, 9462–9467.
Yu, R. C., Hanson, P. I., Jahn, R. & Brunger, A. T. (1998). NatureStruct. Biol. 5, 803–811.
Yu, R. C., Jahn, R. & Brunger, A. T. (1999). Mol. Cell, 4, 97–107.
research papers
284 Terwilliger � Rapid model building of �-sheets Acta Cryst. (2010). D66, 276–284
electronic reprint