Electrochemistry and Passivity of Ti-15 V-3 Cr-3 Al-3 Sn β-Titanium Alloy in Ambient Temperature...
10
doi: 10.1149/1.2059146 1994, Volume 141, Issue 10, Pages 2633-2641. J. Electrochem. Soc. D. G. Kolman and J. R. Scully Chloride Solutions Titanium Alloy in Ambient Temperature Aqueous - β Sn 3 - 3 Al - 3 Cr - 15 V - Electrochemistry and Passivity of Ti service Email alerting click here in the box at the top right corner of the article or Receive free email alerts when new articles cite this article - sign up http://jes.ecsdl.org/subscriptions go to: Journal of The Electrochemical Society To subscribe to © 1994 ECS - The Electrochemical Society
Transcript of Electrochemistry and Passivity of Ti-15 V-3 Cr-3 Al-3 Sn β-Titanium Alloy in Ambient Temperature...
doi: 10.1149/1.20591461994, Volume 141, Issue 10, Pages 2633-2641.J. Electrochem. Soc.
D. G. Kolman and J. R. Scully Chloride Solutions
Titanium Alloy in Ambient Temperature Aqueous−βSn 3−3 Al−3 Cr−15 V−Electrochemistry and Passivity of Ti
serviceEmail alerting
click herein the box at the top right corner of the article or Receive free email alerts when new articles cite this article - sign up
http://jes.ecsdl.org/subscriptions go to: Journal of The Electrochemical SocietyTo subscribe to
© 1994 ECS - The Electrochemical Society
Electrochemistry and Passivity of Ti-15 V-3 Cr-3 AI-3 Sn 13-Titanium Alloy in
Ambient Temperature Aqueous Chloride Solutions D. G. Kolman* and J. R. Scully**
Center for Electrochemical Science and Engineering, Department of Materials Science and Engineering, University of Virginia, Charlottesville, Virginia 22903
ABSTRACT
Examinat ion of the electrochemical behavior of Ti-15 V-3 Cr-3 A1-3 Sn (Ti-15-3) alloy was performed as an initial step in understanding mechanisms for environmentally assisted cracking of ~-t i tanium alloys in room temperature aqueous chloride solutions. Both solution heat-treated (SHT) and peak-aged (PA) Ti-15-3 were studied, in addition to SHT commer- cially pure Ti (grade 2 Ti) and Ti-5 A1-2.5 Sn (grade 6 Ti). The latter roughly models a precipitates within the ~-t i ianium matrix in PA Ti-15-3. Anodic polarization studies -in 0.6M NaC1 and 0.6M NaC1 adjusted to pH 1 with HC1 revealed that Ti-15-3 was spontaneously passive in each solution, with no observed pitting potential at potentials as positive as 2.1 V vs. SCE. However, an active/passive transition was observed on all alloys in both aerated and deaerated 5M HC1. In situ characterization of passivity by electrochemical impedance spectroscopy confirmed that passive film growth was linear with potential above primary passivation potentials in all solutions, and that the passive dissolution rate is limited by the charge-transfer reaction, especially at lower potentials. Similar passive current densities, active/passive transit ion poten- tials, and apparent oxide resistivities on SHT and PA Ti-15-3 suggest little effect of the c~ precipitate on the passive behavior of PA Ti-15-3. Auger electron spectroscopy and hydrogen evolution kinetics suggested less than stoichiometric incorpora- tion of alloying additions into the passive film of Ti-15-3. X-ray photoelectron spectroscopy indicated that, to the limited extent that alloying additions are found in the passive film, they are oxidized. The valence states present are discussed. Predominantly TiO2 passive films may explain the similar passive electrochemical behaviors observed on the materials examined.
Metastable B-titanium alloys have received much atten- tion recently for use in petrochemical, aerospace, and marine environments. These alloys are attractive because of their high strength, formability, and general resistance to corrosion. ~4 However, the susceptibility of B-titanium alloys to environmentally assisted cracking (EAC) in room temperature aqueous chloride-containing solutions at in- termediate strain rates has been documented. 4 While the EAC of a-titanium alloys is known to be controlled by the tendency of the a phase to hydride, 5'6 the mechanism for EAC in ~-titanium is unknown. Unlike a-titanium, a large concentration of hydrogen [>40 atomic percent (a/o)] is re- quired to hydride the ~ phase in the Ti-H system. 7 It is unclear whether such a hydrogen concentration may be obtained in B-titanium alloys following a sequence of events involving (i) crack tip passive film destabilization, (it) dissolution, (iii) hydrogen production, and (iv) hydro- gen absorption. Further, it is possible that the EAC of these alloys does not originate from a hydrogen mechanism but from some other phenomenon such as slip-film rupture- dissolution, preexisting active path dissolution, or film-in- duced cleavage. 8 EAC at intermediate strain rates suggests that a balance exists between a requirement for mechanical destabilization of protective oxides and the need for suffi- cient time to support some time independent transport pro- cess in the fracture process zone or crack tip solution.
EAC has been observed on long time, high temperature, resolutionized, and subsequently peak-aged Ti-15-3 in monotonic loading experiments on precracked samples ex- posed to 0.6M NaCl at -0.6 V vs. saturated calomel elec- trode (SCE). 9 In this condition, preferential precipitation of a precipitates perpendicular to ~ grain boundaries and coplanar slip were noted. I~ However, little is known about the passive film on this alloy, including the effects of V and Cr alloying additions, and the partitioning of these ele- ments on aging. Early work in high temperature oxida- tion, n as cited by Kubaschewski and Hopkins, ~2 found that V had virtually no effect on the oxidation of Ti and that several percent of Cr actually increased the oxidation rate. Tomashov et al. reported for Ti-15 Mo in 40% H2SO4 at 90~ that dissolution is lowest for 100% ~ alloys and increases for ~ + c~ and ~ + r alloys. 13 Additionally, passive dissolution
of HCP c~ was increased when alloyed with small additions of A1, V, Mo, Zr, or Nb. 13 All these elements increased the passive dissolution rate of a-titanium in H2SO4 at 80~ po- larized to +I V. Tomashov et al. attributed this effect to a change in ionic conductivity of the predominantly TiO2 ox- ide and did not attribute this behavior to any change in the chemical stability of the protective oxide. 13 Levy and Sklover examined the effects of HCI concentration and temperature on the anodic polarization behavior of mill- annealed Ti-13 V-II Cr-3 Al exposed to elevated tempera- ture HCI solutions, observing an active/passive transition on this alloy. 14 Other previous work has focused on the stress corrosion cracking susceptibility of B-titanium al- loys, such as Ti-3 A1-8 V-6 Cr-4 Mo-4 Zr (Ti 38644), ~ but little examination of its passivity has been undertaken. Others have examined the corrosion behavior of Ti 38644, Ti-13 V-11 Cr, and Ti-15-3 in various chloride-containing media by gravimetric analysis. I6 From this latter study it was noted that Ti-15-3 had a higher corrosion rate in boil- ing HCI than other ~, ~, and ~/~ alloys studied, including commercially pure Ti. ~ Hence, as an initial step in elu- cidating the role of electrochemical processes on the EAC mechanism of a V and Cr stabilized B-titanium alloy, char- acterization of the dissolution and passivity of Ti-15-3 has been undertaken. Additionally, the effect of the a precipi- tate within the ~ matrix on the electrochemical behavior of PA Ti-15-3 is unknown. Therefore, a goal of this study is to
Table I. Vendor reported average chemical composition of Ti-15-3.
Ti V A1 Cr Sn Fe C N
w/o remainder 15.0 3.14 2.99 2.81 0.19 0.03 0.018 a/o remainder 14.1 5.59 2.76 1.14 0.16 0.12 0.062
Table II. Vendor reported chemical compositions of grades 2 and 6 Ti in weight percent.
Ti A1 Sn Fe O N H
* Electrochemical Society Student Member. Grade 2 Ti remainder 0.16 0.13 0.005 0.0036 ** Electrochemical Society Active Member. Grade 6 Ti remainder 5.20 2.30 0.46 0.13 0.010 82 ppm
J. Electrochem. Soc., Vol. 141, No. 10, October 1994 �9 The Electrochemical Society, Inc. 2633
2634 J. Electrochem. Soc., Vol. 141, No. 10, October 1994 �9 The Electrochemical Society, inc.
Table III. Weight percentages of elements present in (~ precipitates and the 13 matrix in PA Ti-15-3, calculated from energy
dispersive spectroscopy analysis.
Ti V A1 Cr Sn
87 5.4 5.0 0.60 2.0 70 20 2.7 4.9 2.2
examine the effect of microstructure on the electrochemical behavior of this alloy, by comparing SHT and PA Ti-15-3.
Experimental Procedure The composition of Ti-15-3 may be seen in Table I. Ti-15-
3 was SHT for 30 min at 8167C (1500~ followed by an air cool. Peak-aging comprised a subsequent single-step heat- treatment at 538~ (1000~ for 8 h followed by an air cool. The presence of an a/~ microstructure, and the absence of other phases, was confirmed by both x-ray diffraction ex- periments, TEM/selected area diffraction, and optical mi- croscopy on PA Ti-15-3. TM c~ platelets nucleate and grow wit_h a Burger's orientation of (110)~ II (0001)~, [111]~ II [1120]~. 10 Further, V and Cr are known to be ~ phase stabi- lizers, while A1 is known to be an c~ stabilizer. ~7 Because A1 is known to segregate to the c~ phase within an c~/~ struc- ture, is grade 6 Ti (Ti-5 Al-2.5 Sn) was used to simulate the approximate composition of the a precipitates found in the B-titanium alloys. Commercially pure grade 2 Ti (cr phase) was examined for base line comparison. The compositions of Grades 2 and 6 Ti are listed in Table II.
Energy dispersive spectroscopy (EDS) experiments were performed on PA Ti-15-3 to discern the extent that ~ stabi- lizing elements partit ion to the [3 phase. Experiments were conducted on a Phillips 400T transmission electron micro- scope (TEM). To reduce the interaction volume of the elec- tron beam so that only a single phase was sampled, experi- ments were performed near the edge of a TEM foil prepared by ion milling. Because the c~ precipitates have a needlelike morphology, the electron beam was astigmatized to an el- lipsoidal shape during a phase analysis to minimize sam- pling of the surrounding ~ matrix. It is likely, however, that some corruption of the signal occurred and that the ~ ma- trix results are more accurate than those for the cr phase. The results (Table III), which are averages of multiple spec- tra, indicate that the a precipitate in PA Ti-15-3 is depleted of ~ stabilizing elements and enriched with A1 while the phase is enriched with V and Cr and depleted of Al. Thus, grade 6 Ti is an approximate model of the ~ precipitates within PA Ti-15-3.
Electrochemistry samples were polished to a 600 grit fin- ish followed by degreasing in acetone. The testing appara- tus comprised 1 cm 2 area of the working electrode exposed in a flat cell containing a platinized niobium mesh coun- terelectrode and an SCE situated in a separate well pos- sessing a Luggin capillary.
Polarization measurements were performed with either a Princeton Applied Research (PAR) 173 or PAR 273 poten- tiostat at a scan rate of 0.05 mV/s. All polarization experi- ments were performed following exposure to solution for 2 h at open circuit.
Each electrochemical impedance spectroscopy (EIS) ex- periment comprised ten individual impedance scans. An initial scan was conducted at the open-circuit potential followed by nine scans at 300 mV intervals from -0.3 to 2.1 V vs. SCE. Each scan was preceded by a 2 h potentio- static hold at the given potential, except the open-circuit potential scan which was preceded by 2 h at open circuit. EIS measurements were performed with a Solartron 1286 electrochemical interface and a Model 1255 frequency re- sponse analyzer. A i0 mV rms ac voltage signal was applied at frequencies between i00 kHz and 5 mI-Iz using potentio- static control. Impedance data fitting was performed with complex nonlinear least squares (CNLS) circuit fitting software. ~9
Electrochemical tests were performed on the materials using six different room temperature solutions. These were
0.6M NaCI, 0.6M NaCt adjusted to pH i with HCI, and 5M HC1, each in the aerated and deaerated condition. 0.6M NaC1 solutions comprised reagent grade NaC1 added to dis- tilled deionized water. Solutions were adjusted to pH 1 with reagent grade HC1. 5M HC1 comprised reagent grade HC1 and distilled deionized water. The pH of 5M HC1 is calculated to be - 1.64 when the effect of CI- on the activity of H + is incorporated into the calculation. 2~ Deaeration was performed with commercially pure Ar gas. 0.6M NaC1 solu- tion was utilized to model alloy behavior when exposed to the bulk solution in a marine environment. The 0.6M NaC1 pH 1 was utilized to discern the behavior of the alloys in a simulated crack tip environment. Although a crack tip so- lution and its pH has yet to be isolated, 0.6M NaC1 pH 1 is considered to be a rough estimate of that solution. Beck 21 has reported that a pH < 1.3 was found next to a corroding Ti pit exposed to neutral chloride solution. 22 Others have reported pH 1.7 at a crack tip for a Ti-8 Al-i Mo-i V alloy. 23 5M HCI was used to analyze material behavior under ex- tremely acidic conditions that perhaps are more severe than a crack tip environment.
Sample surfaces were prepared for Auger electron spec- troscopy (AES) in the manner stated above. EIS was then performed on each sample in 0.6M NaC1 pHi as described above, with the final potential at 1.5 V vs. SCE. Samples were removed from the cell and rinsed in distilled deion- ized water. AES was performed on a Perkin Elmer PHI 600 system using a 5 keV beam operated at 0.54 p~A. Sputter depth profiling was performed with a 3 keV Ar + ion beam. The particular Auger electron transition energies used for analysis for each element were selected at Auger energies as close as possible to each other for different elements to obtain comparable escape depths. The Auger transition en- ergies used were TiL~M-418 eV, OKLL-503 eV, VLMM-473 eV, CrLMM-529 eV, and AlKLL-1396 eV.
X-ray photoelectron spectroscopy (XPS) was performed on a Kratos XSAM800 using an Mg x-ray source operated at 13 kV and 20 mA, perpendicular to the sample surface. Samples were potentiostatically held at -0.6 V vs. SCE in 0.6M NaCI pH 1 and the surfaces mechanically abraded with SiC paper, thereby allowing the oxides to reform at -0.6 V. Samples were rinsed in distilled water on removal from the cell. Peaks used for analysis were as follows: Ti-2p 3/2, O-Is, V-2p 3/2, Cr-2p 3/2, Sn-3d 5z2, and AI-2p. Refer- ence to the C is signal was used to account for specimen charging.
Results and Discussion Electrochemistry and passivity in 0.6M NaCl pH 1.--
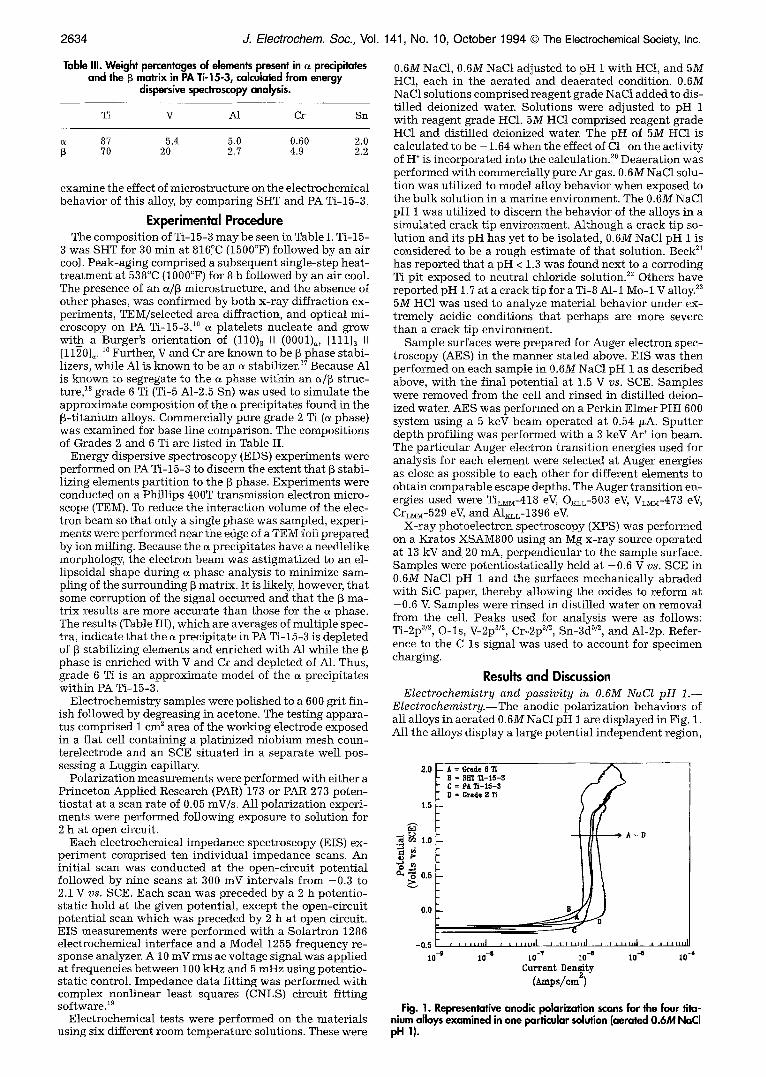
Electrochemistry.-- The anodic polarization behaviors of all alloys in aerated 0.6M NaCI p H I are displayed in Fig. 1. All the alloys display a large potential independent region,
2.0
1.0
.• 1.o
cuN 0.5
0.0
A = Grade 6 T[ B = 3Fi't ~ - 1 5 - 8 C = PA T i - 1 5 - 3 D = Grade 2 ?i
- 0 , 5 , , , , , , , , I , , , , , , , ,
10 - o 10 "-a 10 -~
i l i H i J ~ i l l r H l l
i0 -v I0 -s
Cu~ent Density (~,ps/cm 2)
A - D
, i i i i i l , I
I 0 - 6
Fig. 1. Representative anodic polarization scans for the four tita- nium alloys examined in one particular solution (aeraled 0.6M NaCI pH 1).
,1. Electrochem. Soc., Vol. 141, No. 10, October 1994 �9 The Electrochemical Society, Inc. 2635
2.1
1.8
1 . 5
~, t.~"
r
~ o.a
~ o.o
- 0 . 3
10 - l o
Z- t~ = D e a e r a t e d 0.61I I;aCl ) / / / I C = Aerated pil l O.a u RaC1 ~ , ~ ~ / I
;- D = D , , . t , a pm 0.'~ ~,C~ ~ ' / ~ I L v. = A., t~ 5. m , , ~ / " I I
E"' . . . . . " " ~ f'l ( I ,_ t
10 -9 i0 -e i0 -v i0 -II 10 -5 10 -4 i0 -s
Current Density (~ps/cm')
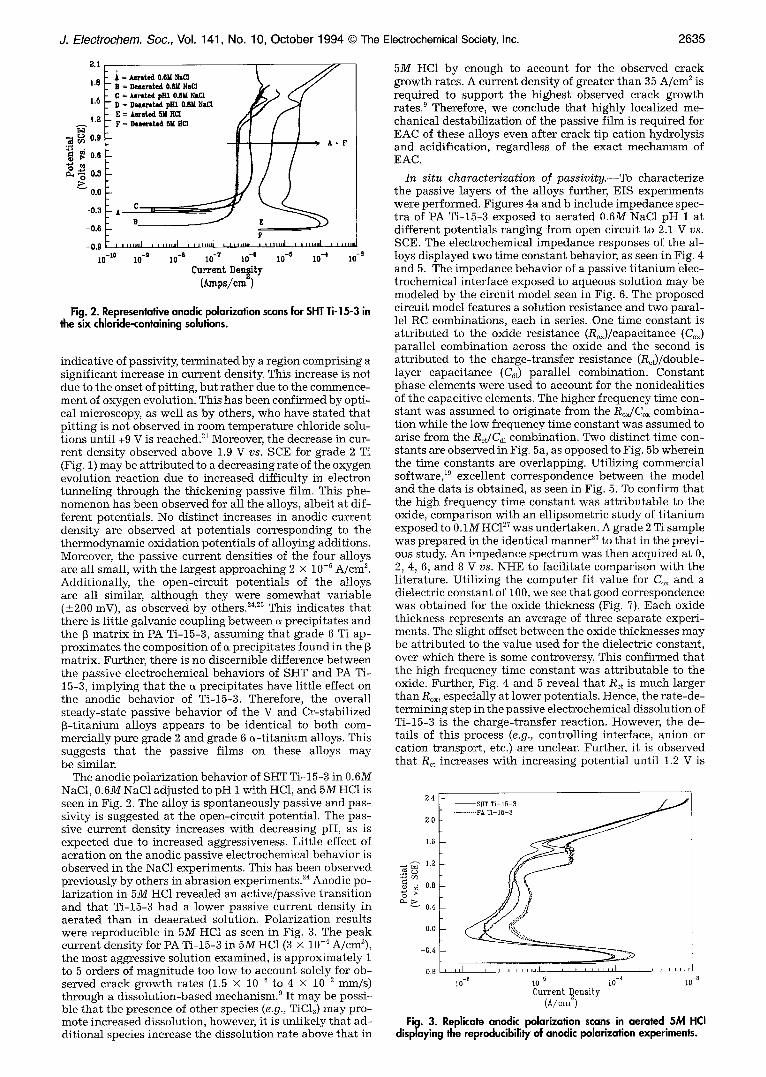
Fig. 2. Representative anodic polarization scans for SHT Ti- 15-3 in the six chloride-containing solutions.
indicative of passivity, terminated by a region comprising a significant increase in current density. This increase is not due to the onset of pitting, but rather due to the commence- ment of oxygen evolution. This has been confirmed by opti- cal microscopy, as well as by others, who have stated that pitt ing is not observed in room temperature chloride solu- tions until +9 V is reached. 21 Moreover, the decrease in cur- rent density observed above 1.9 V vs. SCE for grade 2 Ti (Fig. 1) may be attr ibuted to a decreasing rate of the oxygen evolution reaction due to increased difficulty in electron tunneling through the thickening passive film. This phe- nomenon has been observed for all the alloys, albeit at dif- ferent potentials. No distinct increases in anodic current density are observed at potentials corresponding to the thermodynamic oxidation potentials of alloying additions. Moreover, the passive current densities of the four alloys are all small, with the largest approaching 2 x 10 -6 A/cm 2. Additionally, the open-circuit potentials of the alloys are all similar, although they were somewhat variable (_+200 mV), as observed by others. 24'25 This indicates that there is little galvanic coupling between R precipitates and the [~ matr ix in PA Ti-15-3, assuming that grade 6 Ti ap- proximates the composition of a precipitates found in the [~ matrix. Further, there is no discernible difference between the passive electrochemical behaviors of SHT and PA Ti- 15-3, implying that the o~ precipitates have little effect on the anodic behavior of Ti-15-3. Therefore, the overall steady-state passive behavior of the V and Cr-stabilized [~-titanium alloys appears to be identical to both com- mercially pure grade 2 and grade 6 a- t i tanium alloys. This suggests that the passive films on these alloys may be similar.
The anodic polarization behavior of SHT Ti-15-3 in 0.6M NaCl, 0.6M NaC1 adjusted to pH I with HC1, and 5M HC1 is seen in Fig. 2. The alloy is spontaneously passive and pas- sivity is suggested at the open-circuit potential. The pas- sive current density increases with decreasing pH, as is expected due to increased aggressiveness. Little effect of aeration on the anodic passive electrochemical behavior is observed in the NaC1 experiments. This has been observed previously by others in abrasion experiments. 24 Anodic po- larization in 5M HC1 revealed an active/passive transition and that Ti-15-3 had a lower passive current density in aerated than in deaerated solution. Polarization results were reproducible in 5M HC1 as seen in Fig. 3. The peak current density for PA Ti-15-3 in 5M HC1 (3 • 10 4 A/cm2), the most aggressive solution examined, is approximately 1 to 5 orders of magnitude too low to account solely for ob- served crack growth rates (1.5 • 10 8 to 4 • 10 -2 mm/s) through a dissolution-based mechanism. 9 It may be possi- ble that the presence of other species (e.g., TIC13) may pro- mote increased dissolution, however, it is unlikely that ad- ditional species increase the dissolution rate above that in
5M HC1 by enough to account for the observed crack growth rates. A current density of greater than 35 A/cm 2 is required to support the highest observed crack growth rates2 Therefore, we conclude that highly localized me- chanical destabilization of the passive film is required for EAC of these alloys even after crack tip cation hydrolysis and acidification, regardless of the exact mechanism of EAC.
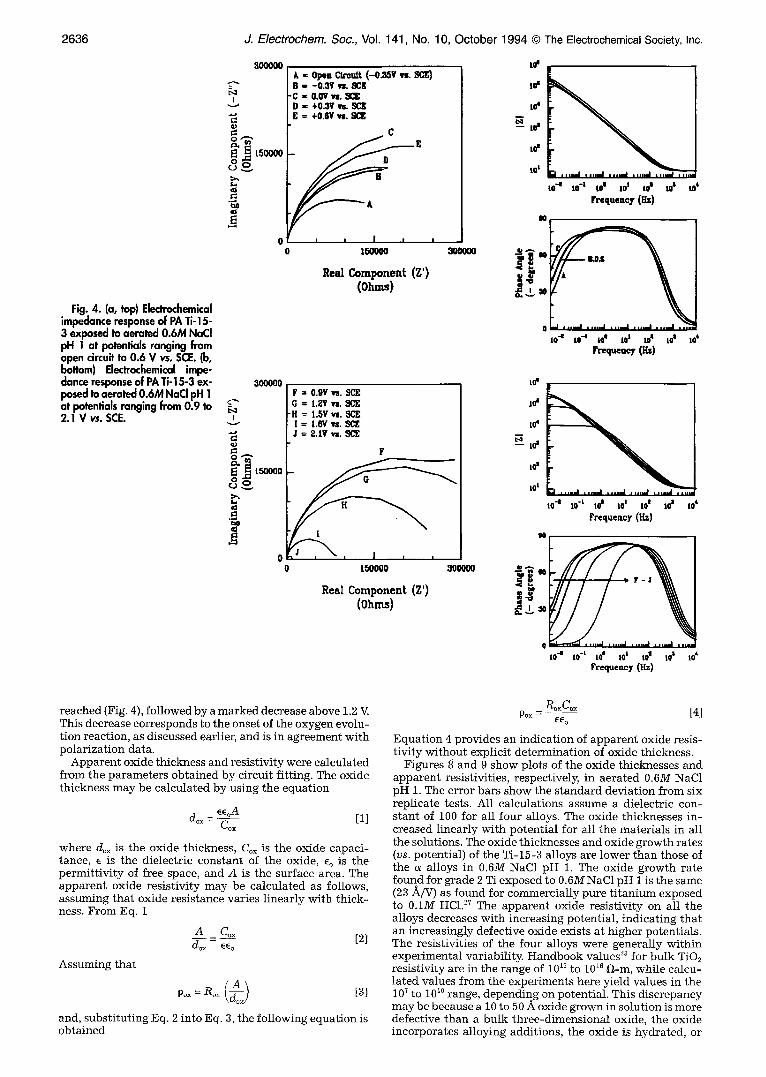
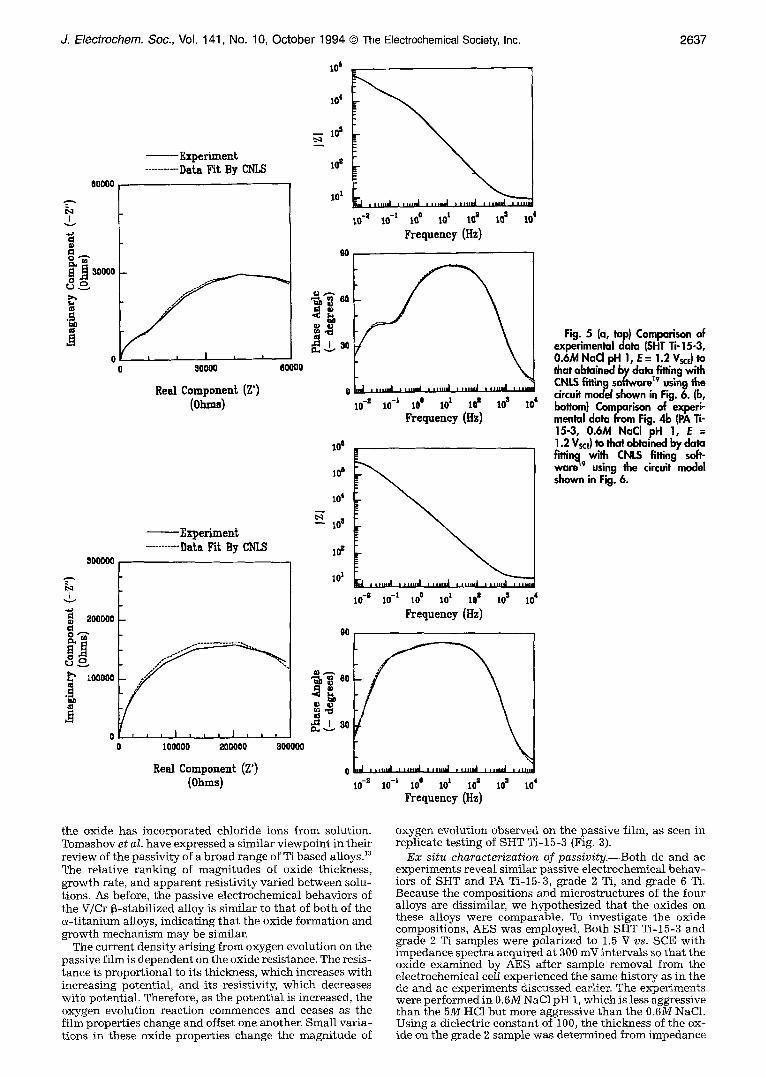
In situ characterization of passiv i ty . - -To characterize the passive layers of the alloys further, EIS experiments were performed. Figures 4a and b include impedance spec- tra of PA Ti-15-3 exposed to aerated 0.6M NaC1 pH 1 at different potentials ranging from open circuit to 2.1 V vs. SCE. The electrochemical impedance responses of the al- loys displayed two time constant behavior, as seen in Fig. 4 and 5. The impedance behavior of a passive t i tanium elec- trochemical interface exposed to aqueous solution may be modeled by the circuit model seen in Fig. 6. The proposed circuit model features a solution resistance and two paral- lel RC combinations, each in series. One time constant is attributed to the oxide resistance (Rox)/capacitance (Cox) parallel combination across the oxide and the second is attributed to the charge-transfer resistance (Rct)/double- layer capacitance (Ca1) parallel combination. Constant phase elements were used to account for the nonidealities of the capacitive elements. The higher frequency time con- stant was assumed to originate from the RoJCox combina- tion while the low frequency time constant was assumed to arise from the RJCdl combination. Two distinct t ime con- stants are observed in Fig. 5a, as opposed to Fig. 5b wherein the time constants are overlapping. Utilizing commercial software, 19 excellent correspondence between the model and the data is obtained, as seen in Fig. 5. To confirm that the high frequency time constant was attributable to the oxide, comparison with an ellipsometric study of t i tanium exposed to 0.1M HC127 was undertaken. A grade 2 Ti sample was prepared in the identical manner 27 to that in the previ- ous study. An impedance spectrum was then acquired at 0, 2, 4, 6, and 8 V vs. NHE to facilitate comparison with the literature. Utilizing the computer fit value for Co~ and a dielectric constant of 100, we see that good correspondence was obtained for the oxide thickness (Fig. 7). Each oxide thickness represents an average of three separate experi- ments. The slight offset between the oxide thicknesses may be attributed to the value used for the dielectric constant, over which there is some controversy. This confirmed that the high frequency time constant was attr ibutable to the oxide. Further, Fig. 4 and 5 reveal that Rot is much larger than Rox, especially at lower potentials. Hence, the rate-de- termining step in the passive electrochemical dissolution of Ti-15-3 is the charge-transfer reaction. However, the de- tails of this process (e.g., controlling interface, anion or cation transport, etc.) are unclear. Further, it is observed that Rot increases with increasing potential until 1.2 V is
2.4 ~ SHT 12-15-3 ~ / ' ~ ........... PA Ti 15 3
2.0 .....
1.6 _
o.o tG.
-0.4
-O.B I I I I I I I t I I I I I ( r I I I I I t l p t ~ I l i l t
10 -e 10 -5 10 4 10-~ C u r r e n t ~ e n s i t y
(A/0m)
Fig. 3. Replicate anodir polarization scans in aerated 5M HCI displaying the reproducibility of anodic polarization experiments.
2636
Fig. 4. (a, top) Electrochemical impedance response of PA Ti-15- 3 exposed to aerated 0.6M NaCI pH 1 at potentials ranging from open circuit to 0.6 V vs. SCE. (b, bottom) Electrochemical impe- dance response of PA Ti-15-3 ex- posed to aerated 0.6M NaCI pH 1 at potentials ranging from 0.9 to 2.1 V vs. SCE.
J. Electrochem. Soc., Vol. 141, No. 10, October 1994 �9 The Electrochemical Society, Inc.
:300000
8 ~
A ,~ Olin c~cutt ( -o~v ~ s c E ) B = -0.3V vs. 8CR
-C = O.OV vs. ~CZ D = +0.3V ~ . E = +0.6V vs.
C
8
I I I I I 16OOOO
R e a l C o m p o n e n t ( Z ' )
(ohms)
3OOOOO
too
los
|0 t
tO'-'8 IO-L tO e I0 i tO s i0 I' I0 +' f requency ' (Hz)
N
10 ,-e to-t i0 e lo s lo ~ lO u iO + Frequeo.ey (l'lz)
sooooo
I v
e ~ 15oooo
8 ~
~0
0 0
F = 0.gV ~s. $CE G = 1.2V vs. ~
�9 S = l.SV vs. SCg 1 = LBV vs. SCE J = 2,IV vs. SCE
F
I
150000 300000
Real Component (Z') (0hn~)
Io"
to"
to o
,oO
I0 t
lO-t 10-| P : ~ : : U e ) ' ( [~ ' 10' |04
N
~ : ~ s 0
Q lO "a tO -L tO' 101 tO t !0 s 10 4'
F r e q u e a c y , ( H z )
reached (Fig. 4), followed by a marked decrease above 1.2 V. This decrease corresponds to the onset of the oxygen evolu- tion reaction, as discussed earlier, and is in agreement with polarization data.
Apparent oxide thickness and resistivity were calculated from the parameters obtained by circuit fitting. The oxide thickness may be calculated by using the equation
ee~A dox- ~ [1]
where dox is the oxide thickness, Cox is the oxide capaci- tance, e is the dielectric constant of the oxide, eo is the permittivity of free space, and A is the surface area. The apparent oxide resistivity may be calculated as follows, assuming that oxide resistance varies linearly with thick- ness. From Eq. 1
A Cox [2] dox- eeo
Assuming that
and, substituting Eq. 2 into Eq. 3, the following equation is obtained
R o x C o x Pox - [4]
EE o
Equation 4 provides an indication of apparent oxide resis- tivity without explicit determination of oxide thickness.
Figures 8 and 9 show plots of the oxide thicknesses and apparent resistivities, respectively, in aerated 0.6M NaC1 pH 1. The error bars show the standard deviation from six replicate tests. All calculations assume a dielectric con- stant of 100 for all four alloys. The oxide thicknesses in- creased linearly with potential for all the materials in all the solutions. The oxide thicknesses and oxide growth rates (vs. potential) of the Ti-15-3 alloys are lower than those of the a alloys in 0.6M NaC1 pH 1. The oxide growth rate found for grade 2 Ti exposed to 0.6M NaC1 pH 1 is the same (23 A/V) as found for commercially pure t i tanium exposed to 0.1M HC1. 27 The apparent oxide resistivity on all the alloys decreases with increasing potential, indicating that an increasingly defective oxide exists at higher potentials. The resistivities of the four alloys were generally within experimental variability. Handbook values 28 for bulk TiO2 resistivity are in the range of 101I to 1016 t2-m, while calcu- lated values from the experiments here yield values in the 107 to 10 I+ range, depending on potential. This discrepancy may be because a 10 to 50 A oxide grown in solution is more defective than a bulk three-dimensional oxide, the oxide incorporates alloying additions, the oxide is hydrated, or
2637
- - E x p e r i m e n t ........... Data Fit By CNLS
OOOOO
o
800000
"~ 200000 cl
tooooo
0 ' 0
~o'
_ 10 ~
1o 2
101
, , I , ,
~oooo 60000
Real Component (Z')
Experiment ........... Data Fit By CNLS
' " ' '.o'ooo'".oooo tooooo
Real Component (Z') (ohms)
90
| im ,.i , ,HI i i| , m
i0-' lo -~ la ~ I0 ~ ~.o" ~0' m'
Frequency (I~)
~ I 30
lo a
lo 6
lo 4
10 ~
lo z
101
90
J. Electrochem. Soc., Vol. 141, No. 10, October 1994 �9 The Electrochemical Society, Inc.
Io -s io -~ 1o e lO ~ to s to s Io'
Frequency (Hz)
s
rJ , i t d mi J t, , , ,~i , l , . .
10 -s 10 -t 10 ~ 101 lO s IO s 104 Frequency (Hz)
, J J ,.,ml ,,,,.I , ,,uJ ,,,,
10 -s 10 -1 10 e 101 lO s 10" 104 Frequency (Hz)
Fig. 5 (o, tap) Comparison of experimental data (SHT Ti-15-3, 0.6M NaCI pH 1, E= 1.2 VscE) to that obtained by data fitting with CNLS fitting softwarelV using the circuit model shown in Fig. 6. (b, bottom) Comparison of experi- mental data from Fig. 4b (PA Ti- 15-3, 0.6M NaCI pH 1, E = 1.2 Vsc~ to that obtained by data fitting with CHLS tilting soft- ware q9 using the circuit model shown in Fig. 6.
the oxide has incorporated chloride ions from solution. Tomashov et al. have expressed a similar viewpoint in their review of the passivity of a broad range of Ti based alloys. 13 The relative ranking of magnitudes of oxide thickness, growth rate, and apparent resistivity varied between solu- tions. As before, the passive electrochemical behaviors of the V/Cr ~-stabilized alloy is similar to that of both of the q-titanium alloys, indicating that the oxide formation and growth mechanism may be similar.
The current density arising from oxygen evolution on the passive film is dependent on the oxide resistance. The resis- tance is proportional to its thickness, which increases with increasing potential, and its resistivity, which decreases with potential. Therefore, as the potential is increased, the oxygen evolution reaction commences and ceases as the film properties change and offset one another. Small varia- tions in these oxide properties change the magnitude of
oxygen evolution observed on the passive film, as seen in replicate testing of SHT Ti-15-3 (Fig. 3).
Ex situ characterization of passivity.--Both dc and ac experiments reveal similar passive electrochemical behav- iors of SHT and PA Ti-15-3, grade 2 Ti, and grade 6 Ti. Because the compositions and microstructures of the four alloys are dissimilar, we hypothesized that the oxides on these alloys were comparable. To investigate the oxide compositions, AES was employed. Both SHT Ti-15-3 and grade 2 Ti samples were polarized to 1.5 V vs. SCE with impedance spectra acquired at 300 mV intervals so that the oxide examined by AES after sample removal from the electrochemical cell experienced the same history as in the dc and ac experiments discussed earlier. The experiments were performed in 0.6M NaCI pH 1, which is less aggressive than the 5M HC1 but more aggressive than the 0.6M NaC1. Using a dielectric constant of 100, the thickness of the ox- ide on the grade 2 sample was determined from impedance
2638 J. Electrochem. Soc., Vo1._141, No. 10, October 1994 �9 The Electrochemical Society, Inc.
0 C~rada 2 Tt / 80 I Grade 8 'rJ
70
30
2O
lO
0 -0.3 0.0 02 1,~ L5 0.6 0,9
Potential (V vs. SCE)
1.8 2.1
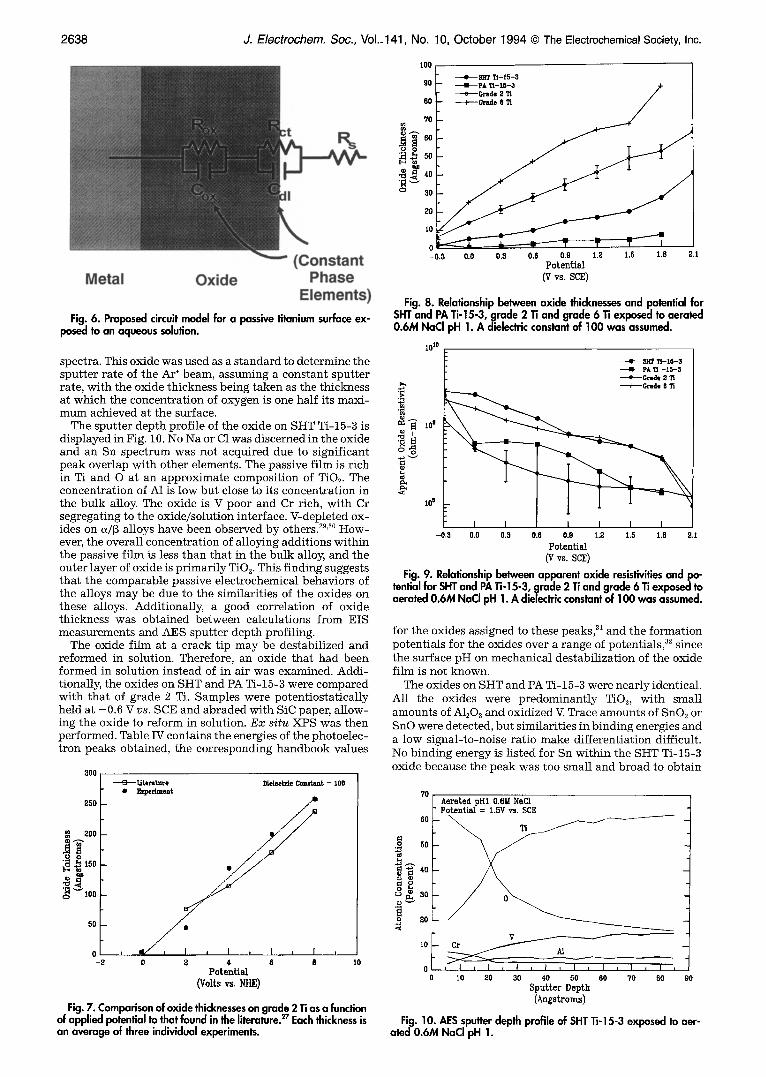
Fig. 6. Proposed circuit model for a passive titanium surface ex- posed to an aqueous solution.
spectra. This oxide was used as a standard to determine the sputter rate of the Ar § beam, assuming a constant sputter rate, with the oxide thickness being taken as the thickness at which the concentration of oxygen is one half its maxi- mum achieved at the surface.
The sputter depth profile of the oxide on SHT Ti-15-3 is displayed in Fig. 10. No Na or C1 was discerned in the oxide and an Sn spectrum was not acquired due to significant peak overlap with other elements. The passive film is rich in Ti and O at an approximate composition of TiO2. The concentration of A1 is low but close to its concentration in the bulk alloy. The oxide is V poor and Cr rich, with Cr segregating to the oxide/solution interface. V-depleted ox- ides on a/~ alloys have been observed by others. 29'3~ How- ever, the overall concentration of alloying additions within the passive film is less than that in the bulk alloy, and the outer layer of oxide is primarily TiQ. This finding suggests that the comparable passive electrochemical behaviors of the alloys may be due to the similarities of the oxides on these alloys. Additionally, a good correlation of oxide thickness was obtained between calculations from EIS measurements and AES sputter depth profiling.
The oxide film at a crack tip may be destabilized and reformed in solution. Therefore, an oxide that had been formed in solution instead of in air was examined. Addi- tionally, the oxides on SHT and PA Ti-15-3 were compared with that of grade 2 Ti. Samples were potentiostatically held at -0 .6 V vs. SCE and abraded with SiC paper, allow- ing the oxide to reform in solution. E x s i t u XPS was then performed. Table IV contains the energies of the photoelec- tron peaks obtained, the corresponding handbook values
300
250
z 200
~ 1 0 0
50
0 -2 I0
r l Literature DLelectrle Constant = 100 �9 Ex~erlmeat
. f / /
0 2 4 6 8 Potential
(Volts vs. HHE)
Fig. 7. Comparison of oxide thicknesses on grade 2 Ti as a function of applied potential to that found in the literature. 27 Each thickness is an average of three individual experiments.
Fig. 8. Relationship between oxide thicknesses and potential for SHT and PA Ti-15-3, grade 2 Ti and grade 6 Ti exposed to aerated 0.6M NaCI pH 1. A dielectric constant of 100 was assumed.
10 lo
�9 ~ ~ - 1 5 - 3 -" PA Ti - 1 5 - 3 ,0 Grade ~ '13.
I>., I Grade 0 1 t
,u i ~ lOe 2 ~
lO a
-O.S 0.0 O.S O.e 0.9 1.2 1.5 1.8 2.t
Potential (V vs. SCE)
Fig. 9. Relationship between apparent oxide resistivities and po- tential for SHT and R~ Ti- 15-3, grade 2 Ti and grade 6 Ti exposed to aerated 0.6M NaCI pH 1. A dielectric constant of I00 was assumed.
for the oxides assigned to these peaks, 31 and the formation potentials for the oxides over a range of potentials, 32 since the surface pH on mechanical destabilization of the oxide film is not known.
The oxides on SHT and PA Ti-15-3 were nearly identical. All the oxides were predominantly TiO2, with small amounts of A12Q and oxidized V. Trace amounts of SnO2 or SnO were detected, but similarities in binding energies and a low signal-to-noise ratio make differentiation difficult. No binding energy is listed for Sn within the SI-IT Ti-15-3 oxide because the peak was too small and broad to obtain
70 Aerated pill 0.6M NaCI Potential = L5V vs. SCE 60 ~ _
~ 5o _
~ ~ 4Q
u~ so
0 i I i 10 20 30 40 50 60 70 80 90
SputLer Depth (Anestroms)
Fig. 10. AES sputter depth profile of SHT Ti-15-3 exposed to aer- ated 0.6M NaCI pH 1.
J. Electrochem. Soc., Vol. 141, No. 10, October 1994 �9 The Electrochemical Society, Inc. 2639
Table IV. Binding energies obtained from XP5 experiments after abrasion (0.6M NaCI pH 1, -0 .6 V vs. SCE), handbook values for the binding energies of the metal oxides, ~' and Ibe corresponding formation
potential of the oxides at two different pH. 3~
Ti 2p 3/2 A1 2p TiO2 V 2p m A120~ Sn 3d ~/~
Grade 2 Ti 458.5 SHT Ti-15-3 458.8 PA Ti-15-3 459.0 Handbook 3~ 458.5 Minimum - 0.889
formation potential (V vs. SCE) pH 1
pH 8 -1.303
n/a n/a n/a 516.1 74.3 - - 515.9 74.3 486.1
- - 74.7 - - - - -2.022 a __
-2.264
~-AI --> A13. + 3e- reaction, assuming [A13+] = 10 6M.
a binding energy with a high degree of accuracy. A broad binding energy peak for V appears to indicate the presence of multiple oxidation states of V within the oxide, as seen by others on a/[~ alloys} ~ Because of the uncertainty of the valence state of both Sn and V within the oxide, the handbook values for these oxides are not given. No Cr peak was detected, indicating that <0.1 a/o is present. This is in contrast to the +1.5 V vs. SCE air formed oxide which contained elevated concentrations of Cr. Although exact concentrations could not be computed, the relative con- centrations of alloying additions within the passive films on both SHT and PA Ti-15-3 were nearly identical. This again indicates that the similar passive behaviors of the materials observed during both dc and ac experiments may be at tr ibutable to the analogous oxide compositions on the alloys.
E l e c t r o c h e m i s t r y and p a s s i v i t y in O. 6M NaCl s o l u t i o n s . - - E l e c t r o c h e m i s t r y and in s i tu charac ter i za t ion p a s s i v i t y . - To examine the performance of metastable [~-titanium al- loys exposed to bulk seawater, 0.6M NaC1 solutions were used. Polarization curves for grade 2 Ti, grade 6 Ti, and SHT and PA Ti-15-3 exposed to aerated 0.6M NaC1 (Fig. 11) reveal that the passive current densities for the four mate- rials are lower than in the solution adjusted to pH 1, rang- ing from 3 • 10 7 to 5 • 10 -7 A/cm 2. This was confirmed by impedance measurements wherein the charge-transfer re- sistances which dominate the polarization resistance and, hence, the passive current density, were higher. Good corre- lation between the proposed circuit model and the impedance spectra was obtained. As in the p H i solutions, there was little difference between the behavior of the al- loys, and no difference between aerated and deaerated so- lutions was discerned. The open-circuit potentials of all
-0.4
-0.8
-0,8
-1.4
-1.8
-1.8 10 -zo
C,D
t ,, Hu~
10 -9
A - 0 x = PA 'tl-ls-3
= - _
I t tlftf#~ t t t t t t t d ~ I H L , , J , , t H m l t t i s J t t d I t H t l J t
I0 -e I0 -7 i0 -e i0 -s i0 -& i0 -s
Current Density (A~Wom')
Fig. 12. Cathodic polarization scans for SHT and PA Ti- 15-3, grade 2 Ti, and grade 6 Ti exposed to 0.6M NaCI.
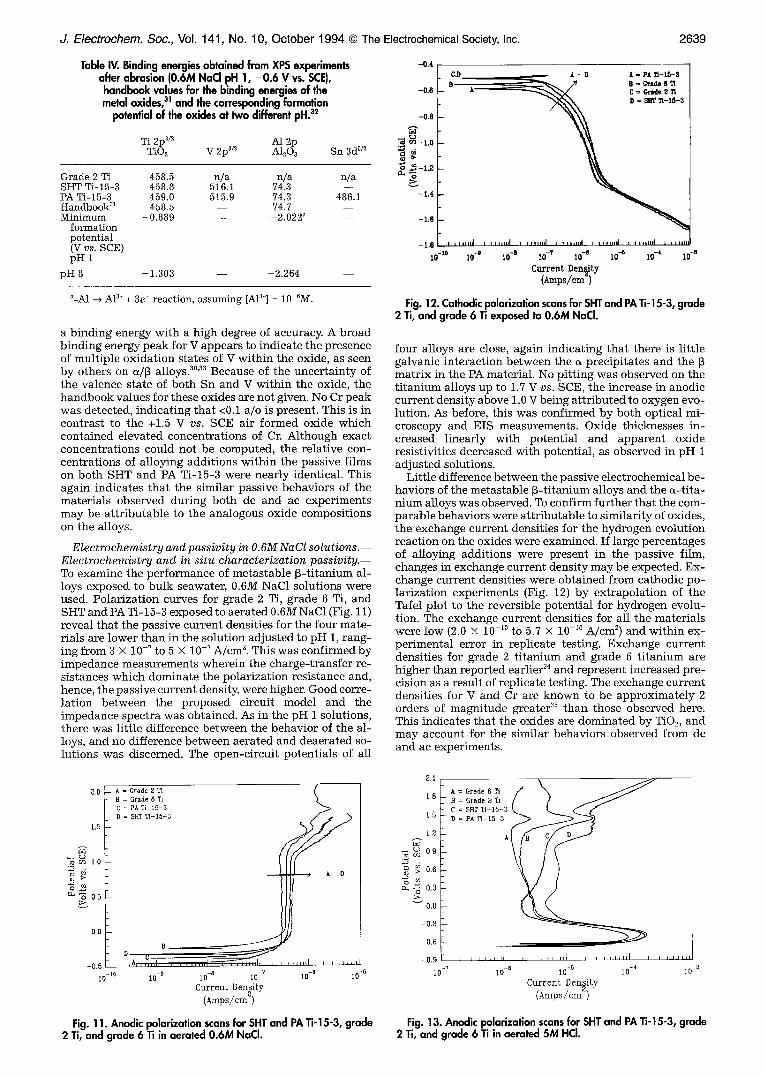
four alloys are close, again indicating that there is little galvanic interaction between the cr precipitates and the [~ matrix in the PA material. No pitting was observed on the t i tanium alloys up to 1.7 V vs. SCE, the increase in anodic current density above 1.0 V being attr ibuted to oxygen evo- lution. As before, this was confirmed by both optical mi- croscopy and EIS measurements. Oxide thicknesses in- creased linearly with potential and apparent oxide resistivities decreased with potential, as observed in pH 1 adjusted solutions.
Little difference between the passive electrochemical be- haviors of the metastable p-ti tanium alloys and the c~-tita- nium alloys was observed. To confirm further that the com- parable behaviors were attr ibutable to similarity of oxides, the exchange current densities for the hydrogen evolution reaction on the oxides were examined. If large percentages of alloying additions were present in the passive film, changes in exchange current density may be expected. Ex- change current densities were obtained from cathodic po- larization experiments (Fig. 12) by extrapolation of the Tafel plot to the reversible potential for hydrogen evolu- tion. The exchange current densities for all the materials were low (2.0 • 10 ~0 to 5.7 • 10 -~~ A/cm 2) and within ex- perimental error in replicate testing. Exchange current densities for grade 2 t i tanium and grade 6 t i tanium are higher than reported earlier 34 and represent increased pre- cision as a result of replicate testing. The exchange current densities for V and Cr are known to be approximately 2 orders of magnitude greater 35 than those observed here. This indicates that the oxides are dominated by TiQ, and may account for the similar behaviors observed from dc and ac experiments.
~- B = Grade 6 Ti } .
I 9 / D = SHT Ti-15-3
i'5 I ~ 10 .
m ~ 0 5
D B. __
-05 10 10 10-9 10-a 10-7 10 -~ i0 -s
Current Density (Amps/em%
2.1
1.8
t,5
~ 0 9
~o.6 m-~ 0.3
-0.3
0.6
-0,9
10 -?
I A = Grade 6 Ti B = Grade 2 Ti C = SHT Ti-15-3 D = PA Ti-15 3 A
I I I I 11111 I I ] ~1111 I I I l l i l l l I l I I I I h l
10 -8 10 -5 i0 -4 I0 s
Current Density (Amps/em z)
Fig. 11. Anodic polarization scans for SHT and PA Ti-15-3, grade Fig. 13. Anodic polarization scans for SHT and PA Ti-15-3, grade 2 Ti, and grade 6 Ti in aerated 0.6M NaCI. 2 Ti, and grade 6 Ti in aerated 5M HCI.
2640 ,1. Electrochem. Soc., Vol. 141, No. 10, October 1994 �9 The Electrochemical Society, Inc.
2 0 A = Grade 2 Tt \ ~ B = Grade 6 Ti C = PA Ti 15-3
t5 D = s~Tz-~5-3
~.~
~ o5
- 0 5
lO -8 10 -? | 0 -8 10 -5 10 -4 10 -a
C u r r e n L D e n s i t y
(Amps/em ~)
Fig. 14. Anodic polarization scans for SHT and PA Ti-15-3, grade 2 "~, and grade 6 Ti in d ~ e r a ~ t 5M HCI.
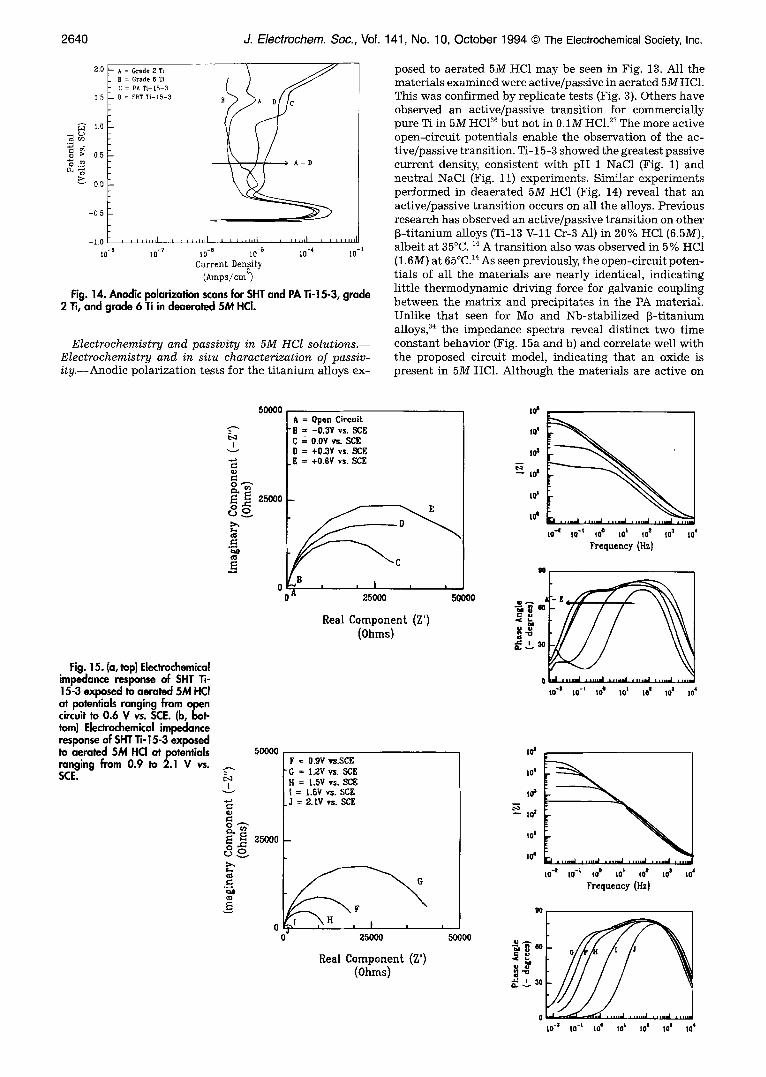
Electrochemistry and passivity in 5M HCl solutions.-- Electrochemistry and in situ characterization of passiv- ity.--Anodic polar iza t ion tests for the t i t a n i u m alloys ex-
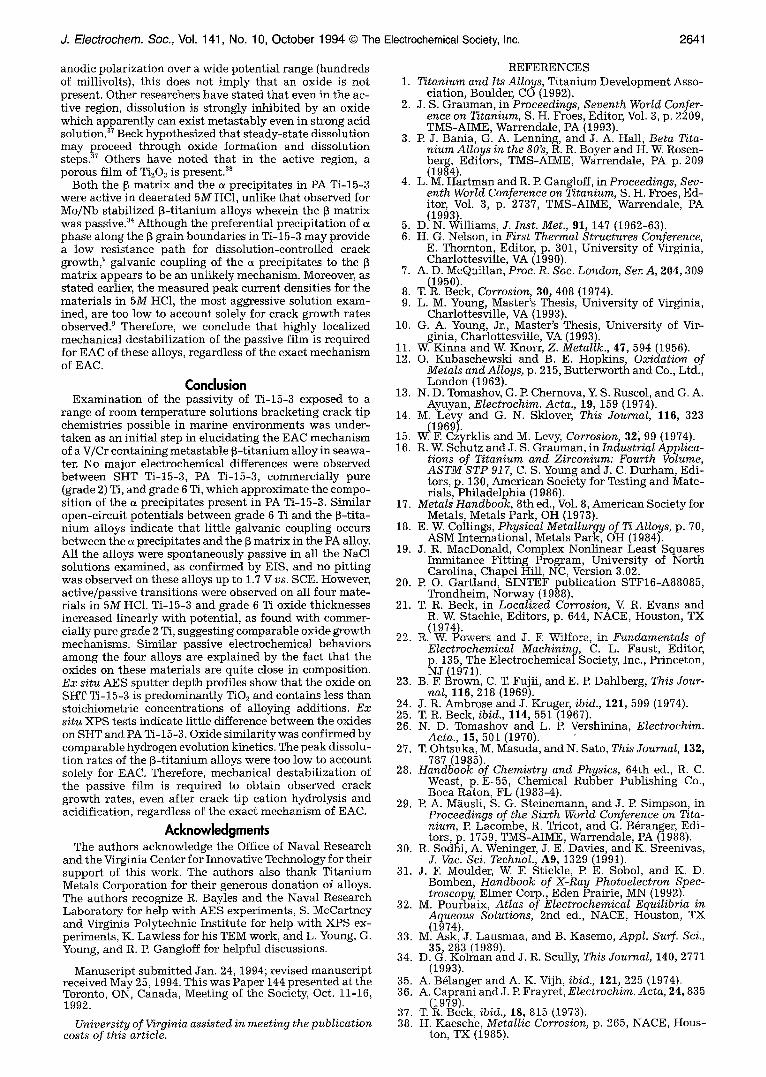
posed to aerated 5M HCI may be seen in Fig. 13. All the mater ia ls examined were active/passive in aerated 5M HC1. This was conf i rmed by replicate tests (Fig. 3). Others have observed an act ive/passive t r ans i t ion for commercial ly pure Ti in 5M HCI 3+ bu t no t in 0.1M HC1. 27 The more active open-ci rcui t potent ia ls enable the observat ion of the ac- t ive/passive t ransi t ion. T]-15-3 showed the greatest passive cur ren t density, consis tent wi th pH 1 NaC1 (Fig. 1) and neutral NaC] (Fig. Ii) experiments. Similar experiments performed in deaerated 5M HCI (Fig. 14) reveal that an active/passive transition occurs on all the alloys. Previous research has observed an active/passive transition on other ~-titanium alloys (Ti-13 V-f1 Cr-3 Al) in 20% HCI (6.5M), albeit at 35~ 14 A transition also was observed in 5% HCI (I.6M) at 65~ 14 As seen previously, the open-circuit poten- tials of all the materials are nearly identical, indicating little thermodynamic driving force for galvanic coupling between the matrix and precipitates in the PA material. Unlike that seen ior Mo and Nb-stabilized ~-titanium alloys, 34 the impedance spectra reveal distinct two time constant behavior (Fig. 15a and b) and correlate well with the proposed circuit model, indicating that an oxide is present in 5M HCI. Although the materials are active on
Fig. 15. (a, top) Electrochemical impedance response of SHT Ti- 15-3 exposed to aerated 5M HCI at potentials ranging from open circuit to 0.6 V vs. SCE. (b, bot- tom) Electrochemical impedance response of SHT Ti- 15-3 exposed to aerated 5M HCI at potentials ranging from 0.9 to 2.1 V vs.
SCE.
5O0OO
I
$..
o o
5O0OO ---
!
+ 2~
E
& = Open Circuit "B = - 0 . 3 Y vs . $CV+
C = O.OV vs. SCE D = +0 .3V vs . SCE
. E = +0 .6V vs. SCE
B I I i I I
25000
Real Component (Z') (Ohms)
I F = 0 .gV vs .SCE
G = 1.2V vs . SCE It = L.SV vs . S e E ( = L 6 V vs. SCE J = 2. IV vs. SCE
J 25OOO
Real C o m p o n e n t (Z') (Ohms)
50000
50(300
te
to+
t~
~- Le
tO ~
to e
H
~ g e m C m
to2
LO I
r
I0 . z lO "t tO o tot tO m tO s tO +
Prequeacy (Hz)
.,,,+,=I , . , . d , . , v +j ,. , . , . .I , , , , , . I i .....
tO ~l i0 - i tO O lO l tO l 10 a 10 4
tO'
t04
to +
I , , , . , . . I , , , . , J , , , . - J ., , , . , ,I , , , .=,I , , , . .
LO -2 lO - t lO ~ tO i LO s tO 3 104
Frequency (Hz}
DO
- - 3o
| 0 - I tO -L LO s tO I |01 tO a IQ+
J. Electrochem. Soc., Vol. 141, No. 10, October 1994 �9 The Electrochemical Society, Inc. 2641
anodic polar izat ion over a wide potent ial range (hundreds of millivolts), this does not imply that an oxide is not present. Other researchers have stated that even in the ac- tive region, dissolution is strongly inhibi ted by an oxide which apparent ly can exist metas tably even in strong acid solution. 37 Beck hypothesized that s teady-state dissolution may proceed through oxide formation and dissolution steps. 3~ Others have noted that in the active region, a porous film of Ti203 is present? 8
Both the B matr ix and the c~ precipi tates in PA Ti-15-3 were active in deaerated 5M HC1, unlike that observed for Mo/Nb stabil ized B-ti tanium alloys wherein the ~ matr ix was passive34 Although the preferential precipi ta t ion of phase along the ~ grain boundaries in Ti-15-3 may provide a low resistance pa th for dissolution-controlled crack growth, 9 galvanic coupling of the ~ precipi tates to the mat r ix appears to be an unlikely mechanism. Moreover, as stated earlier, the measured peak current densities for the materials in 5M HC1, the most aggressive solution exam- ined, are too low to account solely for crack growth rates observed? Therefore, we conclude that highly localized mechanical destabi l izat ion of the passive film is required for EAC of these alloys, regardless of the exact mechanism of EAC.
Conclusion Examinat ion of the passivi ty of Ti-15-3 exposed to a
range of room temperature solutions bracket ing crack tip chemistries possible in marine environments was under- taken as an ini t ial step in elucidating the EAC mechanism of a V/Cr containing metastable ~- t i tanium alloy in seawa- ter. No major electrochemical differences were observed between SHT Ti-15-3, PA Ti-15-3, commercially pure (grade 2) Ti, and grade 6 Ti, which approximate the compo- sition of the ~ precipi tates present in PA Ti-15-3. Similar open-circuit potentials between grade 6 Ti and the B-tita- nium alloys indicate that l i t t le galvanic coupling occurs between the a precipi tates and the ~ matr ix in the PA alloy. All the alloys were spontaneously passive in all the NaC1 solutions examined, as confirmed by EIS, and no pi t t ing was observed on these alloys up to 1.7 V vs. SCE. However, active/passive transi t ions were observed on all four mate- r ials in 5M HC1. Ti-15-3 and grade 6 Ti oxide thicknesses increased l inearly with potential , as found with commer- cially pure grade 2 Ti, suggesting comparable oxide growth mechanisms. Similar passive electrochemical behaviors among the four alloys are explained by the fact that the oxides on these materials are quite close in composition. Ex situ AES sputter depth profiles show that the oxide on SHT Ti-15-3 is predominant ly TiO2 and contains less than stoichiometric concentrations of alloying additions. Ex situ XPS tests indicate l i t t le difference between the oxides on SHT and PA Ti-15-3. Oxide s imilar i ty was confirmed by comparable hydrogen evolution kinetics. The peak dissolu- tion rates of the B-ti tanium alloys were too low to account solely for EAC. Therefore, mechanical destabil izat ion of the passive film is required to obtain observed crack growth rates, even after crack tip cation hydrolysis and acidification, regardless of the exact mechanism of EAC.
Acknowledgments The authors acknowledge the Office of Naval Research
and the Virginia Center for Innovative Technology for their support of this work. The authors also thank Titanium Metals Corporat ion for their generous donation of alloys. The authors recognize R. Bayles and the Naval Research Laboratory for help with AES experiments, S. McCartney and Virginia Polytechnic Inst i tute for help with XPS ex- periments, K. Lawless for his TEM work, and L. Young, G. Young, and R. R Gangloff for helpful discussions.
Manuscript submit ted Jan. 24, 1994; revised manuscr ipt received May 25, 1994. This was Paper 144 presented at the Toronto, ON, Canada, Meeting of the Society, Oct. 11-16, 1992.
University of Virginia assisted in meeting the publication costs of this article.
REFERENCES 1. Titanium and Its Alloys, Titanium Development Asso-
ciation, Boulder, CO (1992). 2. J. S. Grauman, in Proceedings, Seventh World Confer-
ence on Titanium, S. H. Froes, Editor, Vol. 3, p. 2209, TMS-AIME, Warrendale, PA (1993).
3. R J. Bania, G. A. Lenning, and J. A. Hall, Beta Tita- nium Alloys in the 80's, R. R. Boyer and H. W Rosen- berg, Editors, TMS-AIME, Warrendale, P A p . 209 (1984 ~4)..
4. L. M. Har tman and R. P Gangloff, in Proceedings, Sev- enth World Conference on Titanium, S. H. Froes, Ed- itor, Vol. 3, p. 2737, TMS-AIME, Warrendale, PA (19933).
5. D. N. Williams, J. Inst. Met., 91, 147 (1962-63). 6. H. G. Nelson, in First Thermal Structures Conference,
E. Thornton, Editor, p. 301, Universi ty of Virginia, Charlottesville, VA (1990).
7. A. D. McQuillan, Proc. R. Soc. London, Ser. A, 204,309 (1950).
8. T.R. Beck, Corrosion, 30, 408 (1974). 9. L. M. Young, Master's Thesis, Universi ty of Virginia,
Charlottesville, VA (1993). 10. G. A. Young, Jr., Master's Thesis, Universi ty of Vir-
ginia, Charlottesville, VA (1993). 11. W. Kinna and W. Knorr, Z. Metallk., 47, 594 (1956). 12. O. Kubaschewski and B. E. Hopkins, Oxidation of
Metals and Alloys, p. 215, Butterworth and Co., Ltd., London (1962).
13. N.D. Tomashov, G. P. Chernova, Y. S. Ruscol, and G. A. Ayuyan, Electrochim. Acta., 19, 159 (1974).
14. M. Levy and G. N. Sklover, This Journal, 116, 323 (1969).
15. W. E Czyrklis and M. Levy, Corrosion, 32, 99 (1974). 16. R.W. Schutz and J. S. Grauman, in Industrial Applica-
tions of Titanium and Zirconium: Fourth Volume, ASTM STP 917, C. S. Young and J. C. Durham, Edi- tors, p. 130, American Society for Testing and Mate- rials, Phi ladelphia (1986).
17. Metals Handbook, 8th ed., Vol. 8, American Society for Metals, Metals Park, OH (1973).
18. E. W. Collings, Physical Metallurgy of Ti Alloys, p. 70, ASM International , Metals Park, OH (1984).
19. J. R. MacDonald, Complex Nonlinear Least Squares Immitance Fi t t ing Program, University of North Carolina, Chapel Hill, NC, Version 3.02.
20. R O. Gart land, SINTEF publicat ion STF16-A88085, Trondheim, Norway (1988).
21. T. R. Beck, in Localized Corrosion, V. R. Evans and R. W. Staehle, Editors, p. 644, NACE, Houston, TX (1974).
22. R. W. Powers and J. E Wilfore, in Fundamentals of Electrochemical Machining, C. L. Faust , Editor, p. 135, The Electrochemical Society, Inc., Princeton, NJ (1971).
23. B. F. Brown, C. T. Fujii, and E. P. Dahlberg, This Jour- nal, 116, 218 (1969).
24. J. R. Ambrose and J. Kruger, ibid., 121, 599 (1974). 25. T. R. Beck, ibid., 114, 551 (1967). 26. N. D. Tomashov and L. P. Vershinina, Electrochim.
Acta., 15, 501 (1970). 27. T. Ohtsuka, M. Masuda, and N. Sato, This Journal, 132,
787 (1985). 28. Handbook Of Chemistry and Physics, 64th ed , R. C.
Weast, p. E-55, Chemical Rubber Publishing Co., Boca Raton, FL (1983-4).
29. R A. M~usli, S. G. Steinemann, and J. P. Simpson, in Proceedings of the Sixth World Conference on Tita- nium, R Lacombe, R. Tricot, and G. B~ranger, Edi- tors ,p . 1759, TMS-AIME, Warrendale, PA (1988).
30. R. Sodhi, A. Weninger, J. E. Davies, and K. Sreenivas, J. Vac. Sci. Technol., A9, 1329 (1991).
31. J. E Moulder, W. E Stickle, R E. Sobol, and K. D. Bomben, Handbook of X-Ray Photoelectron Spec- troscopy, Elmer Corp., Eden Prairie, MN (1992).
32. M. Pourbaix, Atlas of Electrochemical Equilibria in Aqueous Solutions, 2nd ed., NACE, Houston, TX (1974).
33. M. Ask, J. Lausmaa, and B. Kasemo, Appl. Surf. Sci., 35, 283 (1989).
34. D. G. Kolman and J. R. Scully, This Journal, 140, 2771 (1993).
35. A. B~langer and A. K. Vijh, ibid., 121, 225 (1974). 36. A. Caprani andJ . R Frayret , Electrochim. Acta, 24, 835
(1979). " d 37. T.R. Beck, ioi . , 18, 815 (1973). 38. H. Kaesche, Metallic Corrosion, p. 265, NACE, Hous-
ton, TX (1985).