Effects of natural phenolics and synthetic antioxidants on ...
12
LA RIVISTA ITALIANA DELLE SOSTANZE GRASSE - VOL XCVIII - APRILE/GIUGNO 2021 93 The antioxidant activity of phenolic compounds [thymol (T), carvacrol (C), and thymoqui- none (TQ)] was compared with commercial antioxidants [butylated hydroxyanisole (BHA), butylated hydroxytoluene (BHT) and α-tocopherol] using the β-carotene bleaching and ABTS assays. At 1000 ppm concentration, commercial antioxidants showed better an- tioxidative properties (94.9-95.9%) than phenolic compounds (64.9-85.7%) according to β-carotene bleaching assay. In the ABTS assay, except for BHT, BHA and α-tocopherol exhibited stronger radical scavenging activity than phenolic compounds. Regarding the Rancimat method, BHT-enriched stripped sunflower oil (SSO) had the longest induction period. At the same time, phenolic compounds caused a slightly higher increase in the in- duction periods than the control sample. Refined sunflower oil (RSO) enriched with BHT at 100 ppm was the most stabile during storage at 60°C. Phenolic compounds added to RSO at 250, and 500 ppm exhibited less protection to lipid oxidation than BHT, while phenolic compounds, notably TQ, improved the RSO’s oxidative stability. BHT at 100 ppm showed a strong antioxidant effect on SSO during storage at 60°C. The effect of phenolic com- pounds, especially TQ on SSO, were lower than BHT, but higher than the control sample at 60°C. The results are essential to applying new natural compounds as antioxidant agents in oils, fats, and lipids-rich foodstuffs. Keywords: Phenolics; BHT; BHA; Thymol; Carvacrol; Thymoquinone; Refined sunflower oil 1. INTRODUCTION Lipid oxidation is the main deterioration problem in oils, fats, and lipids-con- taining foodstuffs. This deterioration affects quality parameters such as co- lour, flavour, texture, and the nutritional value of foods. Besides, lipid oxidation generates some toxic products with health risks such as inflammatory disea- ses, cancer, atherosclerosis, and aging [1-4]. The fatty acid composition is a significant factor in determining the oxida- tion rate of oils/fats. The consumption of polyunsaturated fatty acids (PUFA), mainly omega fatty acids, provides several health benefits to humans, while the PUFA are prone to oxidation [5]. Antioxidants could delay the lipid oxida- tion process via delaying the initiation of oxidation chain cades, the demand for natural antioxidants has increased. Research intensively examined natural antioxidants as safe alternatives to synthetic compounds [9-11]. The most active natural antioxidants belong to the family of phenolic and polyphenolic compounds [12]. Most natural phenolics have been reported to possess a powerful antioxidant activity. Phenolics could be classified into a hydrophilic group (simple phenolics, anthocyanins, phenolic acids, flavonoids, and tan- nins) and lipophilic groups (tocopherols) [13]. Besides preventing lipid oxida- tion, phenolics exhibit a wide range of health-promoting traits, including an- (*) CORRESPONDING AUTHOR: Prof. Dr. Mohamed Fawzy Ramadan Deanship of Scientific Research Umm Al-Qura University Makkah, Kingdom of Saudi Arabia E-mail: [email protected] E-mail: [email protected] Received: July 15, 2020 Accepted: December 15, 2020 Seyma YILDIZ 1 Seyma DILMEN 1 Semra TURAN 1 Mustafa KIRALAN 2 Mohamed Fawzy RAMADAN 3,4* 1 Bolu Abant Izzet Baysal University Engineering Faculty Food Engineering Department, Bolu, Turkey 2 Balıkesir University Engineering Faculty Food Engineering Department Balıkesir, Turkey 3 Agricultural Biochemistry Department Faculty of Agriculture Zagazig University Zagazig, Egypt 4 Umm Al-Qura University Deanship of Scientific Research Makkah, Kingdom of Saudi Arabia Effects of natural phenolics and synthetic antioxidants on the oxidative thermal stability of refined and purified sunflower oils
Transcript of Effects of natural phenolics and synthetic antioxidants on ...
LA RIVISTA ITALIANA DELLE SOSTANZE GRASSE - VOL XCVIII - APRILE/GIUGNO 2021
93
The antioxidant activity of phenolic compounds [thymol (T), carvacrol (C), and thymoqui-none (TQ)] was compared with commercial antioxidants [butylated hydroxyanisole (BHA), butylated hydroxytoluene (BHT) and α-tocopherol] using the β-carotene bleaching and ABTS assays. At 1000 ppm concentration, commercial antioxidants showed better an-tioxidative properties (94.9-95.9%) than phenolic compounds (64.9-85.7%) according to β-carotene bleaching assay. In the ABTS assay, except for BHT, BHA and α-tocopherol exhibited stronger radical scavenging activity than phenolic compounds. Regarding the Rancimat method, BHT-enriched stripped sunflower oil (SSO) had the longest induction period. At the same time, phenolic compounds caused a slightly higher increase in the in-duction periods than the control sample. Refined sunflower oil (RSO) enriched with BHT at 100 ppm was the most stabile during storage at 60°C. Phenolic compounds added to RSO at 250, and 500 ppm exhibited less protection to lipid oxidation than BHT, while phenolic compounds, notably TQ, improved the RSO’s oxidative stability. BHT at 100 ppm showed a strong antioxidant effect on SSO during storage at 60°C. The effect of phenolic com-pounds, especially TQ on SSO, were lower than BHT, but higher than the control sample at 60°C. The results are essential to applying new natural compounds as antioxidant agents in oils, fats, and lipids-rich foodstuffs.
Keywords: Phenolics; BHT; BHA; Thymol; Carvacrol; Thymoquinone; Refined sunflower oil
1. INTRODUCTION
Lipid oxidation is the main deterioration problem in oils, fats, and lipids-con-taining foodstuffs. This deterioration affects quality parameters such as co-lour, flavour, texture, and the nutritional value of foods. Besides, lipid oxidation generates some toxic products with health risks such as inflammatory disea-ses, cancer, atherosclerosis, and aging [1-4]. The fatty acid composition is a significant factor in determining the oxida-tion rate of oils/fats. The consumption of polyunsaturated fatty acids (PUFA), mainly omega fatty acids, provides several health benefits to humans, while the PUFA are prone to oxidation [5]. Antioxidants could delay the lipid oxida-tion process via delaying the initiation of oxidation chain cades, the demand for natural antioxidants has increased. Research intensively examined natural antioxidants as safe alternatives to synthetic compounds [9-11]. The most active natural antioxidants belong to the family of phenolic and polyphenolic compounds [12]. Most natural phenolics have been reported to possess a powerful antioxidant activity. Phenolics could be classified into a hydrophilic group (simple phenolics, anthocyanins, phenolic acids, flavonoids, and tan-nins) and lipophilic groups (tocopherols) [13]. Besides preventing lipid oxida-tion, phenolics exhibit a wide range of health-promoting traits, including an-
(*) CORRESPONDING AUTHOR: Prof. Dr. Mohamed Fawzy Ramadan
Deanship of Scientific Research Umm Al-Qura University
Makkah, Kingdom of Saudi Arabia E-mail: [email protected]
E-mail: [email protected]
Received: July 15, 2020 Accepted: December 15, 2020
Seyma YILDIZ1
Seyma DILMEN1
Semra TURAN1
Mustafa KIRALAN2
Mohamed Fawzy RAMADAN3,4*
1 Bolu Abant Izzet Baysal University Engineering Faculty Food Engineering
Department, Bolu, Turkey
2 Balıkesir University Engineering Faculty Food Engineering Department
Balıkesir, Turkey
3 Agricultural Biochemistry Department Faculty of Agriculture
Zagazig University Zagazig, Egypt
4 Umm Al-Qura University Deanship of Scientific Research
Makkah, Kingdom of Saudi Arabia
Effects of natural phenolics and synthetic antioxidants on the
oxidative thermal stability of refined and purified sunflower oils
LA RIVISTA ITALIANA DELLE SOSTANZE GRASSE - VOL XCVIII - APRILE/GIUGNO 2021 LA RIVISTA ITALIANA DELLE SOSTANZE GRASSE - VOL XCVIII - APRILE/GIUGNO 2021
94
Total tocopherols content in oil samples was analysed according to Wong et al. [23]. The oil sample (200 mg) was weighed in a 10-mL flask. Toluene (5 mL) were added then 3.5 mL 2,2’-bipyridine (0.07% w/v in ethanol 95%) and 0.5 mL of FeCl3∙ 6H20 (0.2% w/v in ethanol 95%) were added. The solution was made up to 10 mL using ethanol 95%. After 1 min, the absorp-tion (520 nm) was recorded using a blank solution (without oil). The test was calibrated using standards containing 0-250 μg α-tocopherol in toluene. Total to-copherols in the oil was calculated as follow:
Total tocopherols (ppm) = (A-B)/M.W.
Where:A = sample absorption in 10 mm-cell,B = blank absorption in 10 mm-cell, M = gradient of absorbance vs. weight graph for α-tocopherol calibration,W = weight of the sample (g).The fatty acid profile was determined by GLC after methylation, using an Agilent 7890A fused silica ca-pillary column (J & W Scientific, USA). The column is 100 m long, 0.2 μm film thickness, and 0.25 mm inner diameter. The injector temperature was maintained at 250°C and the detector temperature at 260°C. He-lium was the carrier gas at 1 mL/min flow rate. One μL sample was injected into the column, and the split ratio was 1:30. The column temperature was set at 140°C for 5 min, then programmed to 240°C at 4°C/min and held at 240°C for 10 min. Fatty acid methyl ester (FAME) standard solution (37 FAME mix, Sigma, St. Louis, USA) was used to identify the peaks. The fatty acid composition of oils was given in percentage proportions of FAME using the peak areas.
2.2.2. Antioxidant properties of phenolics and com-mercial antioxidants
2.2.2.1. β-Carotene bleaching testThe antioxidant activity was evaluated using the β-carotene/linoleic acid test, according to Kulisic et al. [24] and Cheung et al. [25]. β-Carotene (1 mL, 0.06 g/10 mL chloroform), linoleic acid (60 mg), and Tween 40 (600 mg) were mixed, and the solvent was evaporated in a rotary evaporator under vacuum. Distilled water (150 mL) was added to the dried mixture and homogenised at 30.000 rpm at 5 min to form a β-carotene/linoleic acid emulsion. Samples (0.05 mL) with different concentrations was added to 4 ml of the resulting emulsion. A solution with 0.05 mL methanol and 4 ml of the emulsion was used as control. Absorbance readings at 470 nm using a spectrophotometer (Shimadzu, Kyoto, Japan) were carried out at 40 min intervals during 120 min, keeping the cuvettes in a water bath at 50°C. The antioxidant activity (%) of the sample was calculated using the
ti-aging, anti-inflammatory, anti-atherosclerosis, and anticancer [14].Sunflower (Helianthus annuus) is primarily harvested for oil production, and its oil is rich in PUFA. Lino-leic acid is a major fatty acid found in sunflower oil (55-70%), followed by a monounsaturated fatty acid, oleic acid (20-25%) [15]. Due to the higher content of PUFA, sunflower oil is prone to lipid oxidation [16]. Thymol (T) and carvacrol (C) are terpenoids found as major constituents of oregano and thyme essential oils [17]. Thymol and carvacrol had potent antioxi-dant and biological activities [18]. Thymoquinone (TQ) is the main bioactive constituent in the black cumin (Nigella sativa) essential oil. Thymoquinone possesses antioxidant activity and some biological activity such as anti-inflammatory, antineoplastic, neuro- and he-patoprotective properties [19]. Thymol and carvacrol were used as an active natural antioxidant against the oxidation of sunflower oil [20, 21]. Although there is no literature using TQ directly on vegetable oils, it was reported that black cumin oil rich in TQ increased the oxidative stability of sunflower oil [21]. In the current study, phenolic compounds including T, C, and TQ compared with commercial antioxidan-ts were tested as antioxidant agents to improve the oxidative stability of refined sunflower oil (RSO) and stripped sunflower oil (SSO). β-carotene bleaching and ABTS tests were used to evaluate the antioxi-dant and antiradical activity of phenolic compounds and commercial antioxidants. The effects of phenolic compounds and commercial antioxidants on the oxi-dative stability of RSO and SSO under Schaal oven test conditions (60°C) were investigated and compa-red with synthetic antioxidants (BHT).
2. MATERIALS AND METHODS
2.1. MATERIALSCommercial RSO was purchased from the mar-ket (Bolu, Turkey) and stored at -18°C. BHA, BHT, 2,2′-azino-bis (3-ethylbenzthiazoline-6-sulfonic acid) were purchased from Sigma-Aldrich (St. Louis, MO, USA). Chemicals and solvents used in this study were of analytical grade and obtained from Sigma-Aldrich (Buchs, Switzerland) and Merck (Merck KGaA, Darm-stadt, Germany).
2.2. METHODS
2.2.1. Analytical determinations of RSOThe initial quality parameters of RSO were tested by the determination of free fatty acid content (FFA) (Ca 5a-40), p-anisidine value (AV) (AOCS Cd 18-90), pe-roxide value (PV) (Cd 8-53), specific absorbance va-lues (K232 and K268) (Ch 5-91) according to AOCS [22] Official methods.
LA RIVISTA ITALIANA DELLE SOSTANZE GRASSE - VOL XCVIII - APRILE/GIUGNO 2021 LA RIVISTA ITALIANA DELLE SOSTANZE GRASSE - VOL XCVIII - APRILE/GIUGNO 2021
95
(m) SSO supplemented with 250 ppm of carvacrol (C)(n) SSO supplemented with 500 ppm of carvacrol (C)(o) SSO supplemented with 250 ppm of thymoqui-
none (TQ)(p) SSO supplemented with 500 ppm of thymoqui-
none (TQ)
2.2.3.2. Rancimat testThe induction periods of RSO and SSO mixed with phenolic compounds, and commercial antioxidants were carried out with the Rancimat apparatus (Me-trohm, Herisau, Switzerland). The oil sample (3 g) was placed in the Rancimat apparatus at 90°C in the air-flow rate of 10 L h−1.
2.2.3.3. Schaal oven testFifty grams of RSO were weighted in 50 mL glass bottles and kept 21 days at 60°C in an oven. Samples were examined at 3-day intervals by collecting them from the same bottles at specific periods. Besides, 10 g of SSO were tested under the same storage con-ditions for 7 days. Samples were examined at daily intervals by collecting samples from the same bottles at specific periods. The stability of the samples was tested by determining PV, AV, and K232. Experiments were set up in two repetitions for each sample.
2.2.4. Statistical analysisOxidation experiments were carried out in two repli-cates. The results were given as mean ± standard de-viation. The results were statistically evaluated using the Minitab 17 Statistical Software (v17.3.1) package program. The difference between the group means was determined according to the variance analysis technique (ANOVA) (p <0.05).
3. RESULTS AND DISCUSSION
3.1. COMPOSITION AND CHEMICAL CHARACTERI-STICS OF RSO AND SSOTable I summarises the FFA content, PV, K232, K268
p-AV, total tocopherols, induction period, and fatty acid composition of sunflower oil. The initial value for FFA, PV, K232, K268, p-AV, and total tocopherols was found to 0.10%, 4.90 meq O2/kg, 3.28, 1.20, 11.00 and 656.5 mg/kg, respectively. These values agree with those in literature [28-31]. The PV, K232, K268, and p-AV of SSO decreased to 1.60 meq O2/kg, 1.43, 0.54, and 0.08, respectively. Besides, total to-copherols were absent in SSO. The induction period of RSO (22.78 h) was higher than that of SSO (4.66 h). Linoleic acid was the predominant fatty acid in RSO (59.4%), followed by oleic acid (30.86%). Pal-mitic acid was the main saturated fatty acid in RSO (6.23%). The fatty acid composition reported here agrees with those reported in literature [30].
following formula:
%AA = 100 (DRControl-DRSample)/DRControl
Whereby:DR = degradation rate, ln(a/b)/t; a = absorbance470 nm of the sample before incubation; b = absorbance470 nm
of the sample after incubation at t time; t: incubation time, 40, 80 and 120 min; DRcontrol = degradation rate of the control sample; DRsample = degradation rate of the tested sample.
2.2.2.2. ABTS assayThe ABTS test was performed according to Re et al. [26]. ABTS radical cation was prepared by mixing 7 mM ABTS stock solution with 4.90 mM potassium persulfate. The mixture was kept in the dark for 24 h at room temperature until the reaction was comple-ted, and the absorbance was stabled. ABTS solution was mixed with ethanol to obtain an absorbance of 0.700 units at 734 nm using the spectrophotometer. Phenolic solutions with different concentrations (10 µL) were placed to react with 1 mL of ABTS solution in the dark for 6 min. The absorbance was recorded at 734 nm using the spectrophotometer (Shimadzu, Kyoto, Japan). The control sample was prepared with absolute ethanol (10 µL). The % inhibition was calcu-lated as below:
% Inhibition = [(A control – A sample) × 100] / A control
A control and A sample: Absorbance at 734 nm for control and sample
2.2.3. Determination of sunflower oil stability
2.2.3.1. Stripping of RSO and preparation of experi-mental samplesThe RSO was purified using the method described by Karabulut et al. [27] using activated carbon and alumi-na column chromatography treatments. In the Schaal oven test, 8 RSO and 8 SSO experimental designs were studied.(a) Refined sunflower oil (RSO)(b) RSO supplemented with 100 ppm of BHT(c) RSO supplemented with 250 ppm of thymol (T)(d) RSO supplemented with 500 ppm of thymol (T)(e) RSO supplemented with 250 ppm of carvacrol (C)(f) RSO supplemented with 500 ppm of carvacrol (C)(g) RSO supplemented with 250 ppm of thymoqui-
none (TQ)(h) RSO supplemented with 500 ppm of thymoqui-
none (TQ)(i) Stripped sunflower oil (SSO)(j) SSO supplemented with 100 ppm of BHT(k) SSO supplemented with 250 ppm of thymol (T)(l) SSO supplemented with 500 ppm of thymol (T)
LA RIVISTA ITALIANA DELLE SOSTANZE GRASSE - VOL XCVIII - APRILE/GIUGNO 2021 LA RIVISTA ITALIANA DELLE SOSTANZE GRASSE - VOL XCVIII - APRILE/GIUGNO 2021
96
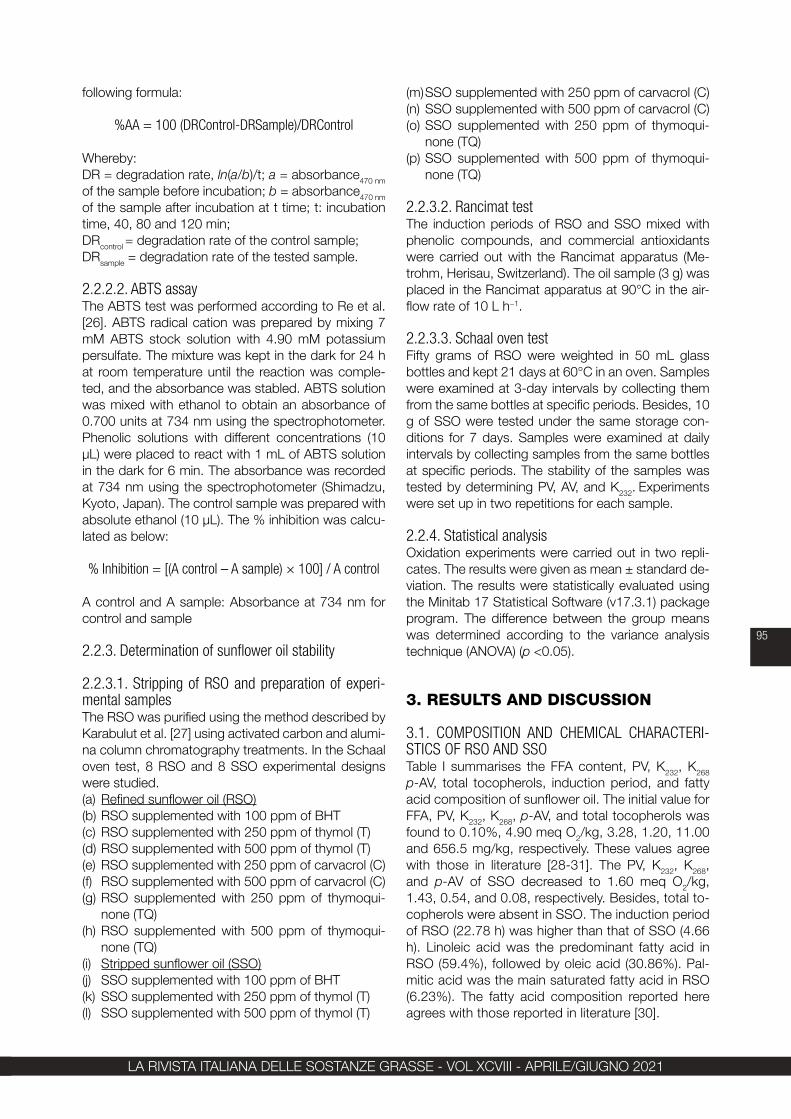
Figure 1 - Antixoidant activity (%) of phenolic compounds, α-tocopherol, BHA, and BHT in β-carotene system. Values reportedare the mean of replicates. Error bars show the variations of three determinations in terms of standard deviation.
0
20
40
60
80
100
120
10 25 50 100 250 500 1000
Antio
xidan
t acti
vity (
%)
Concentration (ppm)
ThymolCarvacrolThymoquinoneBHTBHAα-Tocopherol
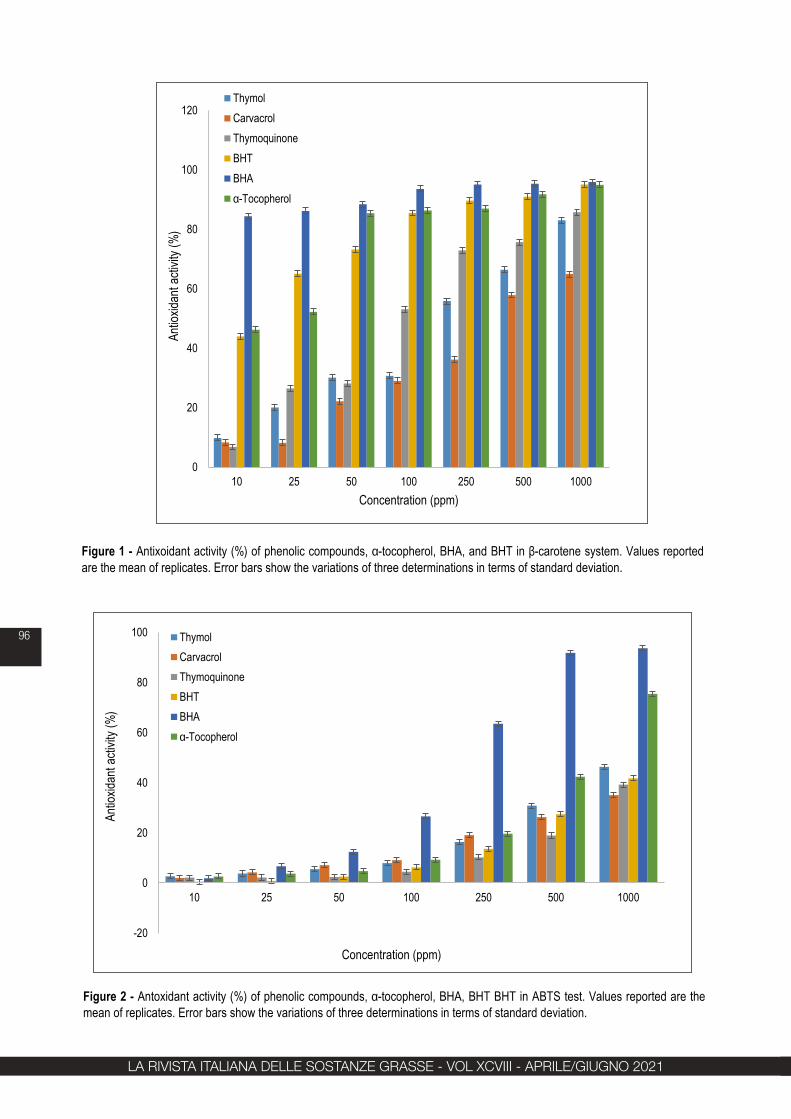
Figure 2 - Antoxidant activity (%) of phenolic compounds, α-tocopherol, BHA, BHT BHT in ABTS test. Values reported are the mean of replicates. Error bars show the variations of three determinations in terms of standard deviation.
-20
0
20
40
60
80
100
10 25 50 100 250 500 1000
Antio
xidan
t acti
vity (
%)
Concentration (ppm)
ThymolCarvacrolThymoquinoneBHTBHAα-Tocopherol
Figure 1 - Antixoidant activity (%) of phenolic compounds, α-tocopherol, BHA, and BHT in β-carotene system. Values reportedare the mean of replicates. Error bars show the variations of three determinations in terms of standard deviation.
0
20
40
60
80
100
120
10 25 50 100 250 500 1000
Antio
xidan
t acti
vity (
%)
Concentration (ppm)
ThymolCarvacrolThymoquinoneBHTBHAα-Tocopherol
Figure 2 - Antoxidant activity (%) of phenolic compounds, α-tocopherol, BHA, BHT BHT in ABTS test. Values reported are the mean of replicates. Error bars show the variations of three determinations in terms of standard deviation.
-20
0
20
40
60
80
100
10 25 50 100 250 500 1000
Antio
xidan
t acti
vity (
%)
Concentration (ppm)
ThymolCarvacrolThymoquinoneBHTBHAα-Tocopherol
LA RIVISTA ITALIANA DELLE SOSTANZE GRASSE - VOL XCVIII - APRILE/GIUGNO 2021 LA RIVISTA ITALIANA DELLE SOSTANZE GRASSE - VOL XCVIII - APRILE/GIUGNO 2021
97
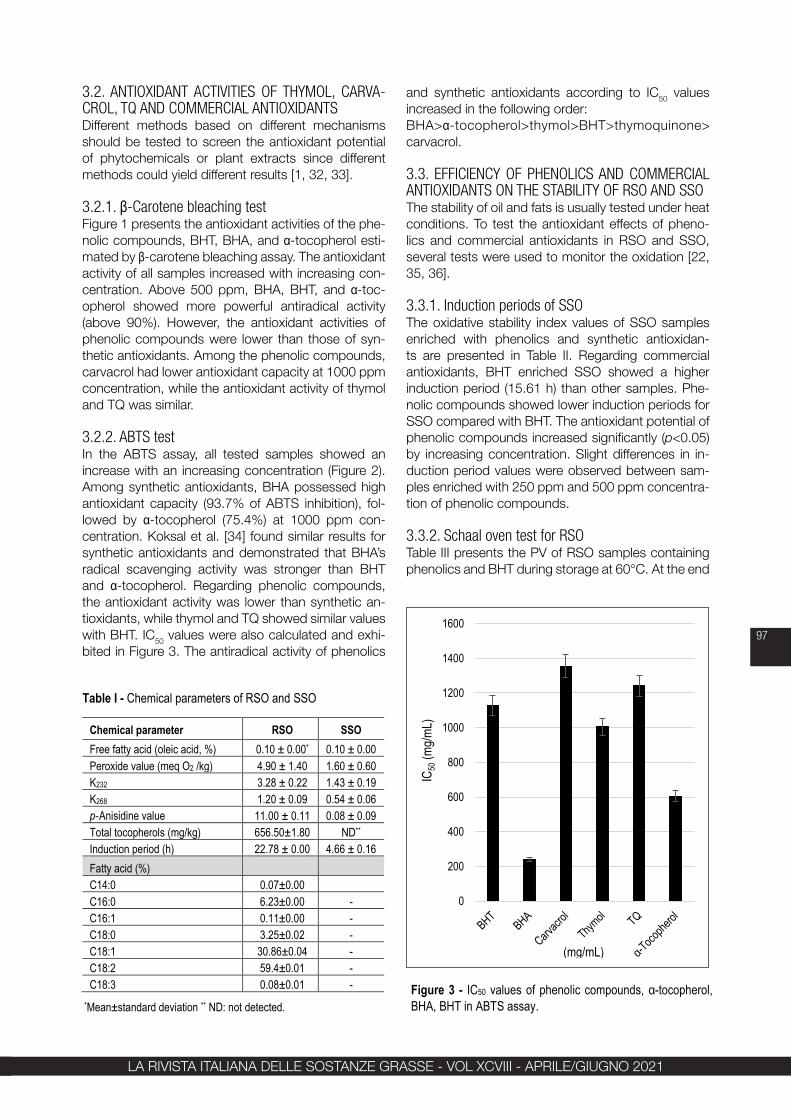
and synthetic antioxidants according to IC50 values increased in the following order:BHA>α-tocopherol>thymol>BHT>thymoquinone> carvacrol.
3.3. EFFICIENCY OF PHENOLICS AND COMMERCIAL ANTIOXIDANTS ON THE STABILITY OF RSO AND SSOThe stability of oil and fats is usually tested under heat conditions. To test the antioxidant effects of pheno-lics and commercial antioxidants in RSO and SSO, several tests were used to monitor the oxidation [22, 35, 36].
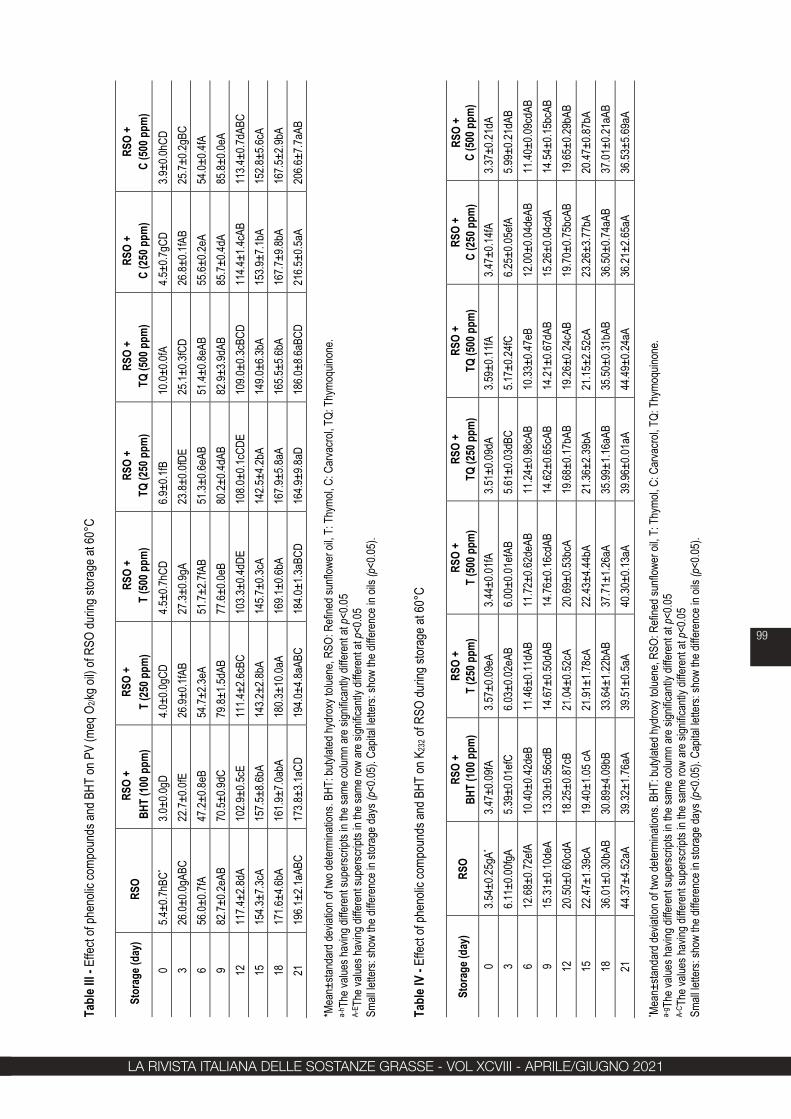
3.3.1. Induction periods of SSO The oxidative stability index values of SSO samples enriched with phenolics and synthetic antioxidan-ts are presented in Table II. Regarding commercial antioxidants, BHT enriched SSO showed a higher induction period (15.61 h) than other samples. Phe-nolic compounds showed lower induction periods for SSO compared with BHT. The antioxidant potential of phenolic compounds increased significantly (p<0.05) by increasing concentration. Slight differences in in-duction period values were observed between sam-ples enriched with 250 ppm and 500 ppm concentra-tion of phenolic compounds.
3.3.2. Schaal oven test for RSOTable III presents the PV of RSO samples containing phenolics and BHT during storage at 60°C. At the end
3.2. ANTIOXIDANT ACTIVITIES OF THYMOL, CARVA-CROL, TQ AND COMMERCIAL ANTIOXIDANTSDifferent methods based on different mechanisms should be tested to screen the antioxidant potential of phytochemicals or plant extracts since different methods could yield different results [1, 32, 33].
3.2.1. β-Carotene bleaching testFigure 1 presents the antioxidant activities of the phe-nolic compounds, BHT, BHA, and α-tocopherol esti-mated by β-carotene bleaching assay. The antioxidant activity of all samples increased with increasing con-centration. Above 500 ppm, BHA, BHT, and α-toc-opherol showed more powerful antiradical activity (above 90%). However, the antioxidant activities of phenolic compounds were lower than those of syn-thetic antioxidants. Among the phenolic compounds, carvacrol had lower antioxidant capacity at 1000 ppm concentration, while the antioxidant activity of thymol and TQ was similar.
3.2.2. ABTS testIn the ABTS assay, all tested samples showed an increase with an increasing concentration (Figure 2). Among synthetic antioxidants, BHA possessed high antioxidant capacity (93.7% of ABTS inhibition), fol-lowed by α-tocopherol (75.4%) at 1000 ppm con-centration. Koksal et al. [34] found similar results for synthetic antioxidants and demonstrated that BHA’s radical scavenging activity was stronger than BHT and α-tocopherol. Regarding phenolic compounds, the antioxidant activity was lower than synthetic an-tioxidants, while thymol and TQ showed similar values with BHT. IC50 values were also calculated and exhi-bited in Figure 3. The antiradical activity of phenolics
Table I - Chemical parameters of RSO and SSO
Chemical parameter RSO SSOFree fatty acid (oleic acid, %) 0.10 ± 0.00* 0.10 ± 0.00Peroxide value (meq O2 /kg) 4.90 ± 1.40 1.60 ± 0.60K232 3.28 ± 0.22 1.43 ± 0.19K268 1.20 ± 0.09 0.54 ± 0.06p‐Anisidine value 11.00 ± 0.11 0.08 ± 0.09Total tocopherols (mg/kg) 656.50±1.80 ND**
Induction period (h) 22.78 ± 0.00 4.66 ± 0.16Fatty acid (%)C14:0 0.07±0.00C16:0 6.23±0.00 -C16:1 0.11±0.00 -C18:0 3.25±0.02 -C18:1 30.86±0.04 -C18:2 59.4±0.01 -C18:3 0.08±0.01 -
*Mean±standard deviation ** ND: not detected.Figure 3 - IC50 values of phenolic compounds, α-tocopherol, BHA, BHT in ABTS assay.
0
200
400
600
800
1000
1200
1400
1600
IC50
(mg/m
L)
(mg/mL)
Figure 3 - IC50 values of phenolic compounds, α-tocopherol, BHA, BHT in ABTS assay.
0
200
400
600
800
1000
1200
1400
1600
IC50
(mg/m
L)
(mg/mL)
LA RIVISTA ITALIANA DELLE SOSTANZE GRASSE - VOL XCVIII - APRILE/GIUGNO 2021 LA RIVISTA ITALIANA DELLE SOSTANZE GRASSE - VOL XCVIII - APRILE/GIUGNO 2021
98
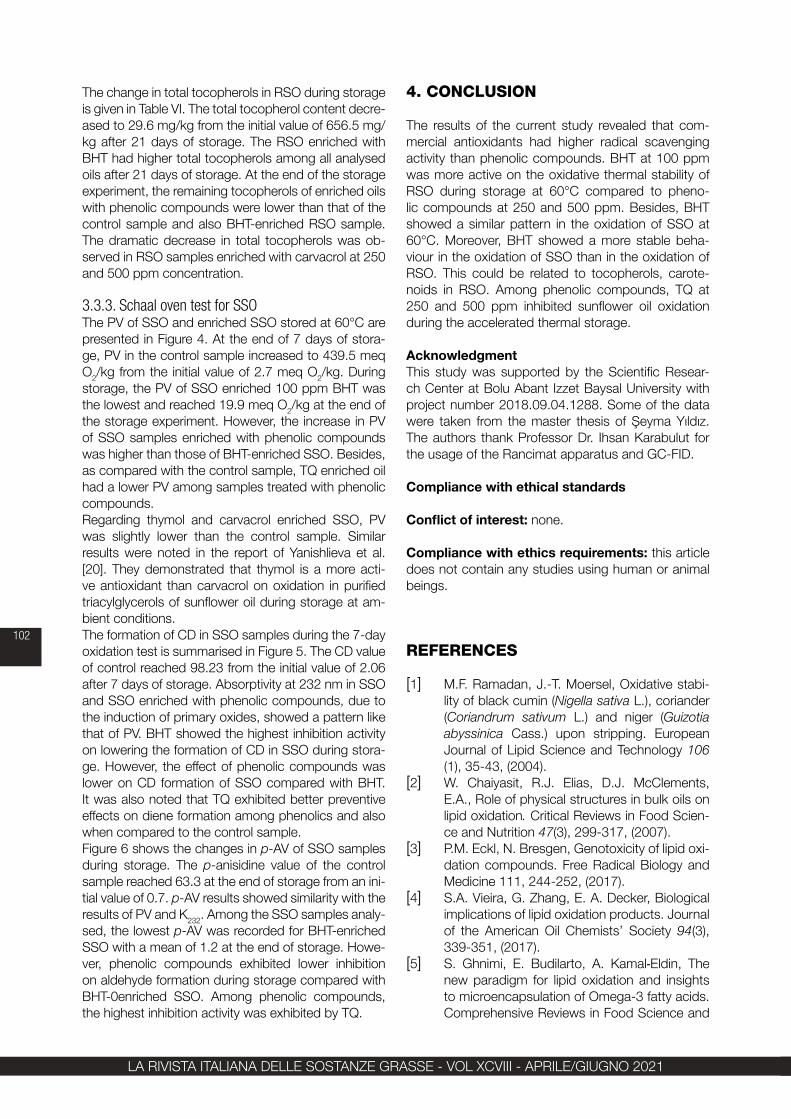
(CD) in RSO. At the end of storage, K232 value of RSO increased from 3.54 to 44.37. BHT, thymol (250 and 500 ppm), TQ (250 ppm and 500 ppm) were equiva-lent or slightly better in preventing the formation of CD compared with the control sample at the end of sto-rage. After 21 days of storage, only carvacrol addition reduced the formation of CD in RSO. During 21 days of storage at 60°C, BHT had lower p-AV than that of the control (Table V). The p-AV in the control sample reached the maximum value of 22.2 after 21 days of storage from an initial value of 12.3. At the end of the storage experiment (21 days), BHT and TQ had lower p-AV than control and oils enriched with thymol and carvacrol.
of the storage test (21 days), the control sample oxidi-sed rapidly and had the highest PV (196.1 meq O2/kg oil). Carvacrol had a prooxidant effect on RSO and re-sulted in a marked increase in their PV during storage. The addition of thymol at 500 ppm concentration and TQ (250 ppm and 500 ppm) to RSO leads to lower PV induction than the control sample, thus enhancing the oxidative stability of RSO. Besides, only one sample (TQ at 250 ppm) showed a stronger antioxidant acti-vity similar to BHT at the end of the storage period. The similar trend exhibited in RSO blended with black cumin oil rich in TQ [21].Table IV presents the impacts of natural and synthetic antioxidants on the formation of conjugated dienes
Table II - Induction periods of SSO with phenolic compounds and synthetic antioxidants
Oil Induction period (h) Protection factorSSO 4.66 ± 0.16d* 1.0SSO+BHT (100 ppm) 15.61 ± 0.29a 3.4SSO+T (250 ppm) 6.46 ± 0.00b 1.4SSO + T (500 ppm) 6.67 ± 0.11b 1.4SSO + TQ (250 ppm) 5.78 ± 0.16c 1.2SSO + TQ (500 ppm) 6.79 ± 0.16b 1.5SSO + C (250 ppm) 5.67 ± 0.17c 1.2SSO + C (500 ppm) 6.77 ± 0.03b 1.5
*Mean±standard deviation of three determinations. SSO: Stripped sunflower oil, T: Thymol, C: Carvacrol, TQ: Thymoquinone.Different letters for IP mean significant differences between samples (P < 0.05).
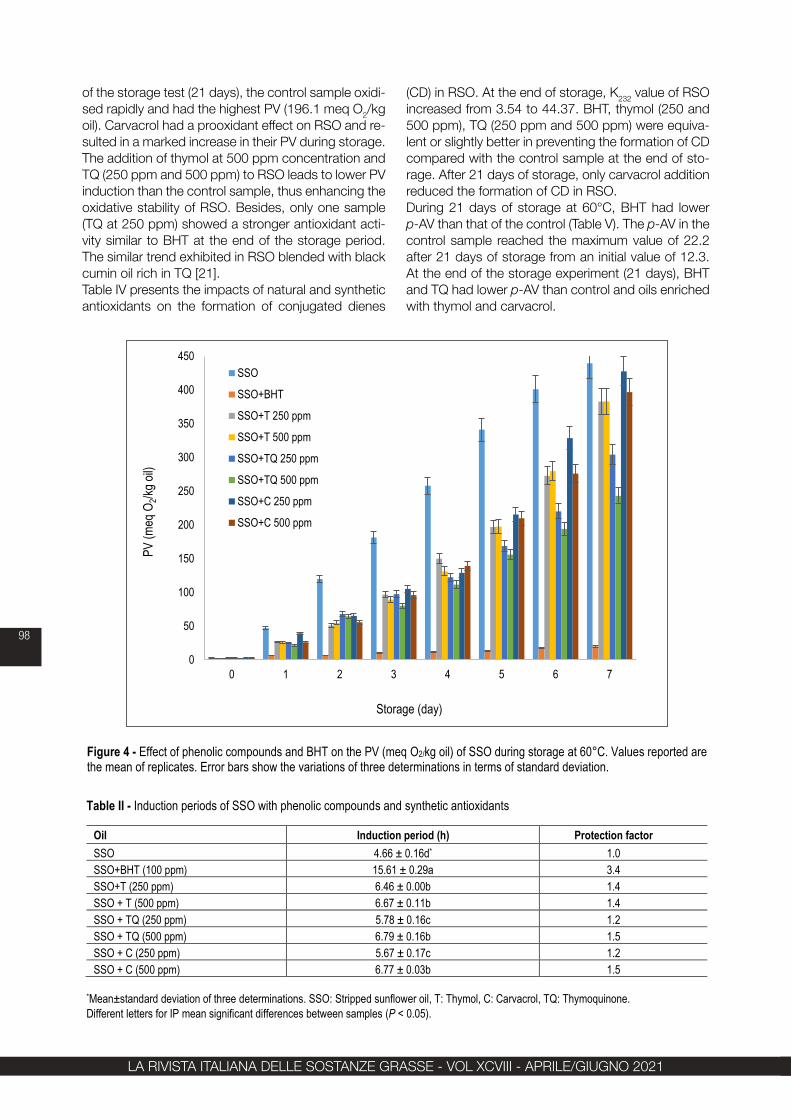
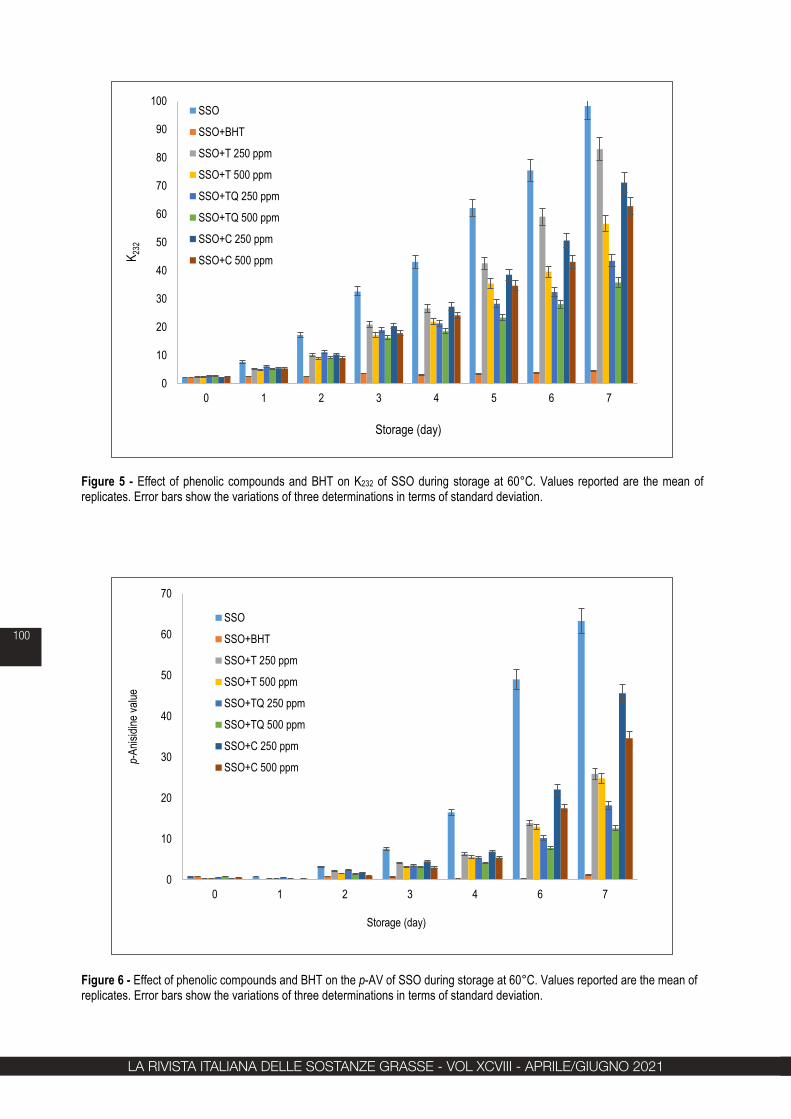
Figure 4 - Effect of phenolic compounds and BHT on the PV (meq O2/kg oil) of SSO during storage at 60°C. Values reported are the mean of replicates. Error bars show the variations of three determinations in terms of standard deviation.
0
50
100
150
200
250
300
350
400
450
0 1 2 3 4 5 6 7
PV (m
eq O
2/kg o
il)
Storage (day)
SSO
SSO+BHT
SSO+T 250 ppm
SSO+T 500 ppm
SSO+TQ 250 ppm
SSO+TQ 500 ppm
SSO+C 250 ppm
SSO+C 500 ppm
LA RIVISTA ITALIANA DELLE SOSTANZE GRASSE - VOL XCVIII - APRILE/GIUGNO 2021 LA RIVISTA ITALIANA DELLE SOSTANZE GRASSE - VOL XCVIII - APRILE/GIUGNO 2021
99
Tabl
eIII-
Effe
ct of
phen
olic c
ompo
unds
and B
HT on
PV
(meq
O2/
kg oi
l) of R
SO du
ring
stora
ge at
60°C
Stor
age (
day)
RSO
RSO
+
BHT
(100
ppm
)RS
O +
T (2
50 p
pm)
RSO
+
T (5
00 p
pm)
RSO
+
TQ (2
50 p
pm)
RSO
+
TQ (5
00 p
pm)
RSO
+
C (2
50 p
pm)
RSO
+
C (5
00 p
pm)
05.4
±0.7h
BC*
3.0±0
.0gD
4.0±0
.0gCD
4.5±0
.7hCD
6.9±0
.1fB
10.0±
0.0fA
4.5±0
.7gCD
3.9±0
.0hCD
326
.0±0.0
gABC
22.7±
0.0fE
26.9±
0.1fA
B27
.3±0.9
gA23
.8±0.0
fDE
25.1±
0.3fC
D26
.8±0.1
fAB
25.7±
0.2gB
C6
56.0±
0.7fA
47.2±
0.8eB
54.7±
2.3eA
51.7±
2.7fA
B51
.3±0.6
eAB
51.4±
0.8eA
B55
.6±0.2
eA54
.0±0.4
fA9
82.7±
0.2eA
B70
.5±0.9
dC79
.8±1.5
dAB
77.6±
0.0eB
80.2±
0.4dA
B82
.9±3.9
dAB
85.7±
0.4dA
85.8±
0.0eA
1211
7.4±2
.8dA
102.9
±0.5c
E11
1.4±2
.6cBC
103.3
±0.4d
DE10
8.0±0
.1cCD
E10
9.0±0
.3cBC
D11
4.4±1
.4cAB
113.4
±0.7d
ABC
1515
4.3±7
.3cA
157.5
±8.6b
A14
3.2±2
.8bA
145.7
±0.3c
A14
2.5±4
.2bA
149.0
±6.3b
A15
3.9±7
.1bA
152.8
±5.6c
A18
171.6
±4.6b
A16
1.9±7
.0abA
180.3
±10.0
aA16
9.1±0
.6bA
167.9
±5.8a
A16
5.5±5
.6bA
167.7
±9.8b
A16
7.5±2
.9bA
2119
6.1±2
.1aAB
C17
3.8±3
.1aCD
194.0
±4.8a
ABC
184.0
±1.3a
BCD
164.9
±9.8a
D18
6.0±8
.6aBC
D21
6.5±0
.5aA
206.6
±7.7a
AB
*Mea
n±sta
ndar
d dev
iation
of tw
o dete
rmina
tions
.BHT
: buty
lated
hydr
oxy t
oluen
e, RS
O: R
efine
d sun
flowe
r oil,
T: T
hymo
l, C: C
arva
crol, T
Q: T
hymo
quino
ne.
a-h T
he va
lues h
aving
diffe
rent
supe
rscrip
ts in
the sa
me co
lumn
are s
ignific
antly
diffe
rent
at p<
0.05
A-E T
he va
lues h
aving
diffe
rent
supe
rscrip
ts in
the sa
me ro
war
e sign
ifican
tly di
ffere
nt at
p<0.0
5Sm
all le
tters:
show
the d
iffere
nce i
n stor
age d
ays(
p<0.0
5).C
apita
l lette
rs: sh
ow th
e diffe
renc
e in o
ils(p
<0.05
).
Tabl
e IV
-Effe
ct of
phen
olic c
ompo
unds
and B
HT on
K23
2of
RSO
durin
g stor
age a
t 60°
C
* Mea
n±sta
ndar
d dev
iation
of tw
o det
ermi
natio
ns.B
HT: b
utylat
ed hy
drox
y tolu
ene,
RSO:
Refi
ned s
unflo
wer o
il, T:
Thy
mol, C
: Car
vacro
l, TQ:
Thy
moqu
inone
.a-
g The
value
s hav
ing di
ffere
nt su
persc
ripts
in the
same
colum
nar
e sign
ifican
tly di
ffere
nt at
p<0.0
5A-
C The
value
s hav
ing di
ffere
nt su
persc
ripts
in the
same
row
are s
ignific
antly
diffe
rent
at p<
0.05
Small
lette
rs: sh
ow th
e diffe
renc
e in s
torag
e day
s(p<
0.05)
.Cap
ital le
tters:
show
the d
iffere
nce i
n oils
(p<0
.05).
Stor
age (
day)
RSO
RSO
+BH
T (1
00 p
pm)
RSO
+T
(250
ppm
)RS
O +
T(5
00 p
pm)
RSO
+ TQ
(250
ppm
)RS
O +
TQ
(500
ppm
)RS
O +
C
(250
ppm
)RS
O +
C
(500
ppm
)0
3.54±
0.25g
A*3.4
7±0.0
9fA3.5
7±0.0
9eA
3.44±
0.01fA
3.51±
0.09d
A3.5
9±0.1
1fA3.4
7±0.1
4fA3.3
7±0.2
1dA
36.1
1±0.0
0fgA
5.39±
0.01e
fC6.0
3±0.0
2eAB
6.00±
0.01e
fAB
5.61±
0.03d
BC5.1
7±0.2
4fC6.2
5±0.0
5efA
5.99±
0.21d
AB6
12.68
±0.72
efA10
.40±0
.42de
B11
.46±0
.11dA
B11
.72±0
.62de
AB11
.24±0
.98cA
B10
.33±0
.47eB
12.00
±0.04
deAB
11.40
±0.09
cdAB
915
.31±0
.10de
A13
.30±0
.56cd
B14
.67±0
.50dA
B14
.76±0
.16cd
AB14
.62±0
.65cA
B14
.21±0
.67dA
B15
.26±0
.04cd
A14
.54±0
.15bc
AB12
20.50
±0.60
cdA
18.25
±0.87
cB21
.04±0
.52cA
20.69
±0.53
bcA
19.68
±0.17
bAB
19.26
±0.24
cAB
19.70
±0.75
bcAB
19.65
±0.29
bAB
1522
.47±1
.39cA
19.40
±1.05
cA21
.91±1
.78cA
22.43
±4.44
bA21
.36±2
.39bA
21.15
±2.52
cA23
.26±3
.77bA
20.47
±0.87
bA18
36.01
±0.30
bAB
30.89
±4.09
bB33
.64±1
.22bA
B37
.71±1
.26aA
35.99
±1.16
aAB
35.50
±0.31
bAB
36.50
±0.74
aAB
37.01
±0.21
aAB
2144
.37±4
.52aA
39.32
±1.76
aA39
.51±0
.5aA
40.30
±0.13
aA39
.96±0
.01aA
44.49
±0.24
aA36
.21±2
.65aA
36.53
±5.69
aA
LA RIVISTA ITALIANA DELLE SOSTANZE GRASSE - VOL XCVIII - APRILE/GIUGNO 2021 LA RIVISTA ITALIANA DELLE SOSTANZE GRASSE - VOL XCVIII - APRILE/GIUGNO 2021
100
Figure 5 - Effect of phenolic compounds and BHT on K232 of SSO during storage at 60°C. Values reported are the mean of replicates. Error bars show the variations of three determinations in terms of standard deviation.
0
10
20
30
40
50
60
70
80
90
100
0 1 2 3 4 5 6 7
K 232
Storage (day)
SSO
SSO+BHT
SSO+T 250 ppm
SSO+T 500 ppm
SSO+TQ 250 ppm
SSO+TQ 500 ppm
SSO+C 250 ppm
SSO+C 500 ppm
Figure 6 - Effect of phenolic compounds and BHT on the p-AV of SSO during storage at 60°C. Values reported are the mean of replicates. Error bars show the variations of three determinations in terms of standard deviation.
0
10
20
30
40
50
60
70
0 1 2 3 4 6 7
p-An
isidin
e valu
e
Storage (day)
SSO
SSO+BHT
SSO+T 250 ppm
SSO+T 500 ppm
SSO+TQ 250 ppm
SSO+TQ 500 ppm
SSO+C 250 ppm
SSO+C 500 ppm
LA RIVISTA ITALIANA DELLE SOSTANZE GRASSE - VOL XCVIII - APRILE/GIUGNO 2021 LA RIVISTA ITALIANA DELLE SOSTANZE GRASSE - VOL XCVIII - APRILE/GIUGNO 2021
101
Tabl
e VI -
Effe
ct of
phen
olic c
ompo
unds
and B
HT on
the t
otal to
coph
erols
(mg/k
g) of
RSO
durin
g sto
rage
at 60
°C
* Mea
n±sta
ndar
d dev
iation
of tw
o det
ermi
natio
ns.B
HT: b
utylat
ed hy
drox
y tolu
ene,
RSO:
Refi
ned s
unflo
wer o
il, T:
Thy
mol, C
: Car
vacro
l, TQ:
Thy
moqu
inone
.a-
g The
value
s hav
ing di
ffere
nt su
persc
ripts
in the
same
colum
nar
e sign
ifican
tly di
ffere
nt at
p<0.0
5A-
C The
value
s hav
ing di
ffere
nt su
persc
ripts
in the
same
row
are s
ignific
antly
diffe
rent
at p<
0.05
Small
lette
rs: sh
ow th
e diffe
renc
e in s
torag
e day
s(p<
0.05)
.Cap
ital le
tters:
show
the d
iffere
nce i
n oils
(p<0
.05).
Stor
age (
day)
RSO
RSO
+BH
T (1
00 p
pm)
RSO
+T
(250
ppm
)RS
O +
T (5
00 p
pm)
RSO
+TQ
(250
ppm
)RS
O +
TQ (5
00 p
pm)
RSO
+C
(250
ppm
)RS
O +
C
(500
ppm
)0
656.5
±1.8a
A*66
1.3±9
.3aA
657.6
±3.0a
A65
9.3±1
1.7aA
660.0
±4.2a
A66
6.9±4
.7aA
671.0
±3.7a
A67
1.0±1
6.8aA
341
8.6±1
5.8bC
461.3
±12.6
bB42
0.6±6
.7bC
416.0
±9.1b
C46
6.5±7
.8bAB
501.4
±1.5b
A44
2.4±1
.1bBC
440.3
±8.5b
BC6
270.7
±8.1c
C31
4.0±9
.0cAB
276.1
±8.9c
C27
3.8±4
.7cC
312.0
±9.9c
AB32
2.0±1
0.3cA
282.7
±10.7
cBC
279.4
±6.6c
BC9
164.6
±5.9d
C20
9.8±0
.9dA
166.4
±10.0
dC17
4.2±7
.1dBC
209.0
±11.2
dA19
7.6±2
.4dAB
174.9
±4.7d
BC17
4.6±0
.4dBC
1210
1.9±2
.1eB
138.0
±0.0e
AB11
9.2±2
2.6de
AB11
8.1±0
.2eAB
127.6
±8.8e
AB14
3.5±8
.3eA
113.8
±3.8e
AB12
0.2±8
.2eAB
1574.0±
8.5eA
B11
1.1±7
.5eA
74.4±
21.6e
fAB
73.4±
1.4fA
B90
.9±5.3
eAB
104.5
±5.2f
A78
.3±2.4
fAB
60.3±
8.8fB
1830
.3±1.2
fB68
.7±1.5
fA34
.6±16
.8fAB
37.8±
11.3g
AB51
.3±16
.8fAB
55.6±
8.6gA
B30
.8±8.1
gAB
27.1±
13.6f
gAB
2129
.6±1.7
fAB
33.4±
3.4gA
20.1±
10.4f
ABC
16.5±
1.8hA
BC25
.9±1.6
fAB
21.3±
1.9hA
BC13
.4±4.3
gBC
8.0±0
.0gC
Tabl
e V-E
ffect
of ph
enoli
c com
poun
ds an
d BHT
on th
e p-A
V of
RSO
durin
g stor
age a
t 60°
C
* Mea
n±sta
ndar
d dev
iation
of tw
o det
ermi
natio
ns.B
HT: b
utylat
ed hy
drox
y tolu
ene,
RSO:
Refi
ned s
unflo
wer o
il, T:
Thy
mol, C
: Car
vacro
l, TQ:
Thy
moqu
inone
.a-
e The
value
s hav
ing di
ffere
nt su
persc
ripts
in the
same
colum
nar
e sign
ifican
tly di
ffere
nt at
p<0.0
5A-
E The
value
s hav
ing di
ffere
nt su
persc
ripts
in the
same
row
are s
ignific
antly
diffe
rent
at p<
0.05
Small
lette
rs: sh
ow th
e diffe
renc
e in s
torag
e day
s(p<
0.05)
.Cap
ital le
tters:
show
the d
iffere
nce i
n oils
(p<0
.05).
Stor
age (
day)
RSO
RSO
+BH
T (1
00 p
pm)
RSO
+T
(250
ppm
)RS
O +
T (5
00 p
pm)
RSO
+TQ
(250
ppm
)RS
O +
TQ (5
00 p
pm)
RSO
+C
(250
ppm
)RS
O +
C
(500
ppm
)0
12.3±
0.1bc
A*10
.1±1.7
abcA
12.2±
1.0bc
A12
.5±0.5
cA12
.6±1.2
bA14
.4±1.0
aA11
.6±2.0
cA11
.2±1.5
bcA
38.8
±0.4c
dA7.6
±0.6b
cA8.4
±1.5c
A9.3
±0.4e
A7.9
±0.7c
A9.8
±0.4b
A8.9
±0.5c
A8.0
±0.8b
cA6
9.7±0
.4cdB
10.5±
0.3ab
cAB
11.0±
0.2cA
B10
.7±0.5
deAB
11.0±
0.2bA
B11
.1±0.5
bAB
11.5±
0.4cA
B12
.0±1.2
bA9
10.0±
1.0cd
A11
.0±0.3
abcA
11.1±
0.1cA
11.4±
0.4cd
A11
.4±0.6
bA10
.8±0.1
bA10
.9±1.8
cA10
.2±1.1
bcA
126.6
±2.4d
A6.2
±0.3c
A8.4
±0.2c
A4.8
±0.0f
A4.7
±0.2d
A5.3
±0.0c
A7.7
±1.8c
A5.8
±0.3c
A15
11.4±
2.0cA
10.3±
0.4ab
cA12
.7±1.5
bcA
12.3±
0.2cA
11.9±
0.4bA
11.5±
1.0bA
13.1±
1.3bc
A12
.0±0.4
bA18
16.6±
0.7bA
15.1±
5.3ab
A16
.8±2.4
abA
15.5±
0.4bA
15.7±
0.1aA
16.1±
1.3aA
17.6±
1.7ab
A21
.1±3.6
aA21
22.2±
0.5aA
15.6±
0.5aD
E17
.9±0.3
aCD
18.8±
0.5aB
C16
.1±0.4
aDE
15.3±
0.2aE
20.7±
1.3aA
B19
.2±0.7
aBC
LA RIVISTA ITALIANA DELLE SOSTANZE GRASSE - VOL XCVIII - APRILE/GIUGNO 2021 LA RIVISTA ITALIANA DELLE SOSTANZE GRASSE - VOL XCVIII - APRILE/GIUGNO 2021
102
4. CONCLUSION
The results of the current study revealed that com-mercial antioxidants had higher radical scavenging activity than phenolic compounds. BHT at 100 ppm was more active on the oxidative thermal stability of RSO during storage at 60°C compared to pheno-lic compounds at 250 and 500 ppm. Besides, BHT showed a similar pattern in the oxidation of SSO at 60°C. Moreover, BHT showed a more stable beha-viour in the oxidation of SSO than in the oxidation of RSO. This could be related to tocopherols, carote-noids in RSO. Among phenolic compounds, TQ at 250 and 500 ppm inhibited sunflower oil oxidation during the accelerated thermal storage.
AcknowledgmentThis study was supported by the Scientific Resear-ch Center at Bolu Abant Izzet Baysal University with project number 2018.09.04.1288. Some of the data were taken from the master thesis of Şeyma Yıldız. The authors thank Professor Dr. Ihsan Karabulut for the usage of the Rancimat apparatus and GC-FID.
Compliance with ethical standards Conflict of interest: none. Compliance with ethics requirements: this article does not contain any studies using human or animal beings.
REFERENCES
[1] M.F. Ramadan, J.-T. Moersel, Oxidative stabi-lity of black cumin (Nigella sativa L.), coriander (Coriandrum sativum L.) and niger (Guizotia abyssinica Cass.) upon stripping. European Journal of Lipid Science and Technology 106 (1), 35-43, (2004).
[2] W. Chaiyasit, R.J. Elias, D.J. McClements, E.A., Role of physical structures in bulk oils on lipid oxidation. Critical Reviews in Food Scien-ce and Nutrition 47(3), 299-317, (2007).
[3] P.M. Eckl, N. Bresgen, Genotoxicity of lipid oxi-dation compounds. Free Radical Biology and Medicine 111, 244-252, (2017).
[4] S.A. Vieira, G. Zhang, E. A. Decker, Biological implications of lipid oxidation products. Journal of the American Oil Chemists’ Society 94(3), 339-351, (2017).
[5] S. Ghnimi, E. Budilarto, A. Kamal-Eldin, The new paradigm for lipid oxidation and insights to microencapsulation of Omega-3 fatty acids. Comprehensive Reviews in Food Science and
The change in total tocopherols in RSO during storage is given in Table VI. The total tocopherol content decre-ased to 29.6 mg/kg from the initial value of 656.5 mg/kg after 21 days of storage. The RSO enriched with BHT had higher total tocopherols among all analysed oils after 21 days of storage. At the end of the storage experiment, the remaining tocopherols of enriched oils with phenolic compounds were lower than that of the control sample and also BHT-enriched RSO sample. The dramatic decrease in total tocopherols was ob-served in RSO samples enriched with carvacrol at 250 and 500 ppm concentration.
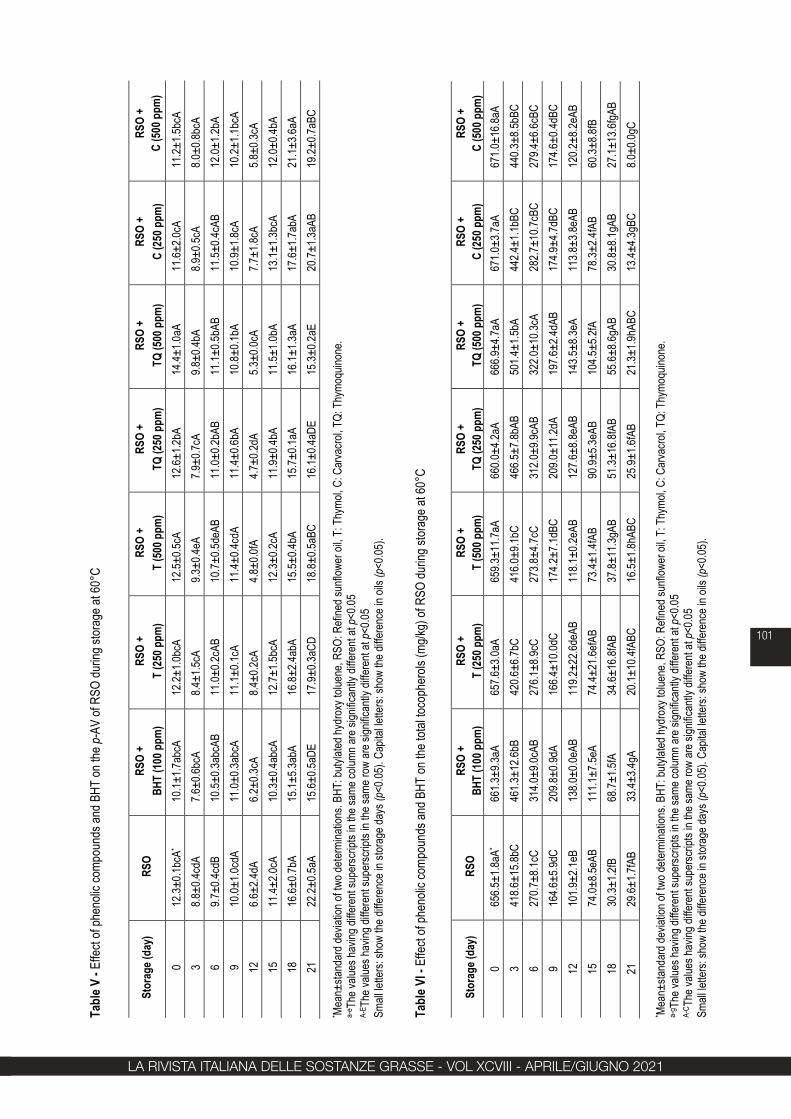
3.3.3. Schaal oven test for SSOThe PV of SSO and enriched SSO stored at 60°C are presented in Figure 4. At the end of 7 days of stora-ge, PV in the control sample increased to 439.5 meq O2/kg from the initial value of 2.7 meq O2/kg. During storage, the PV of SSO enriched 100 ppm BHT was the lowest and reached 19.9 meq O2/kg at the end of the storage experiment. However, the increase in PV of SSO samples enriched with phenolic compounds was higher than those of BHT-enriched SSO. Besides, as compared with the control sample, TQ enriched oil had a lower PV among samples treated with phenolic compounds.Regarding thymol and carvacrol enriched SSO, PV was slightly lower than the control sample. Similar results were noted in the report of Yanishlieva et al. [20]. They demonstrated that thymol is a more acti-ve antioxidant than carvacrol on oxidation in purified triacylglycerols of sunflower oil during storage at am-bient conditions.The formation of CD in SSO samples during the 7-day oxidation test is summarised in Figure 5. The CD value of control reached 98.23 from the initial value of 2.06 after 7 days of storage. Absorptivity at 232 nm in SSO and SSO enriched with phenolic compounds, due to the induction of primary oxides, showed a pattern like that of PV. BHT showed the highest inhibition activity on lowering the formation of CD in SSO during stora-ge. However, the effect of phenolic compounds was lower on CD formation of SSO compared with BHT. It was also noted that TQ exhibited better preventive effects on diene formation among phenolics and also when compared to the control sample.Figure 6 shows the changes in p-AV of SSO samples during storage. The p-anisidine value of the control sample reached 63.3 at the end of storage from an ini-tial value of 0.7. p-AV results showed similarity with the results of PV and K232. Among the SSO samples analy-sed, the lowest p-AV was recorded for BHT-enriched SSO with a mean of 1.2 at the end of storage. Howe-ver, phenolic compounds exhibited lower inhibition on aldehyde formation during storage compared with BHT-0enriched SSO. Among phenolic compounds, the highest inhibition activity was exhibited by TQ.
LA RIVISTA ITALIANA DELLE SOSTANZE GRASSE - VOL XCVIII - APRILE/GIUGNO 2021 LA RIVISTA ITALIANA DELLE SOSTANZE GRASSE - VOL XCVIII - APRILE/GIUGNO 2021
103
gism. Journal of Essential O0il-Bearing Plants, 18(4), 1013-1021, (2015).
[18] J. Mastelic, I. Jerkovic, I. Blaževic, M. Poljak-Blaži, S. Borovic, I. Ivancic-Bace, N. Müller, Comparative study on the antioxidant and bio-logical activities of carvacrol, thymol, and eu-genol derivatives. Journal of Agricultural and Food Chemistry, 56(11), 3989-3996 (2008).
[19] K. Staniek, L. Gille, Is thymoquinone an antioxi-dant?. In BMC Pharmacology, 10 (S1) p. A9 (2010).
[20] N.V. Yanishlieva, E.M. Marinova, M.H. Gordon, V.G. Raneva, Antioxidant activity and mechani-sm of action of thymol and carvacrol in two lipid systems. Food Chemistry, 64(1), 59-66 (1999).
[21] M. Kiralan, M. Ulaş, A. Özaydin, N. Özdemır, G. Özkan, A. Bayrak, M.F. Ramadan, Blends of cold pressed black cumin oil and sunflower oil with improved stability: A study based on changes in the levels of volatiles, tocopherols and thymoquinone during accelerated oxida-tion conditions. Journal of Food Biochemistry, 41(1), e12272 (2017).
[22] AOCS (2000) Official and Recommended Methods of the American Oil Chemist’s So-ciety, American Oil Chemist’s Society Press, Champaign, IL.
[23] M.L. Wong, R.E. Timms, E.M. Goh, Colorime-tric determination of total tocopherols in palm oil, olein and stearin. Journal of the American Oil Chemists Society, 65(2), 258 (1988).
[24] T. Kulisic, A. Radonic, V. Katalinic, M. Milos, Use of different methods for testing antioxida-tive activity of oregano essential oil. Food Che-mistry 85(4), 633-640 (2004).
[25] L.M. Cheung, P.C. Cheung, V.E. Ooi, Antioxi-dant activity and total phenolics of edible mu-shroom extracts. Food Chemistry 81(2), 249-255, (2003).
[26] R. Re, N. Pellegrini, A. Proteggente, A. Pan-nala, M. Yang, C. Rice Evans, C. Antioxidant Activity Applying an Improved Abts Radical Ca-tıon Decolorızatıon Assay. Free Radical Biology & Medicine 26, 1231-1237, (1999).
[27] I. Karabulut, A. Topcu, C. Akmil-Basar, Y. Onal, A.M. Lampi, Obtaining butter oil triacylglycerols free from β-carotene and α-tocopherol via acti-vated carbon adsorption and alumina-column chromatography treatments. Journal of the American Oil Chemists’ Society, 85(3), 213-219, (2008).
[28] T.H. Gamel, A. Kiritsakis, Effect of methanol extracts of rosemary and olive vegetable wa-ter on the stability of olive oil and sunflower oil. Grasas y Aceites, 50(5), 345-350, (1999).
[29] C.P. Tan, Y.C. Man, J. Selamat, M.S.A. Yusoff, Comparative studies of oxidative stability of
Food Safety 16(6), 1206-1218, (2017).[6] M. Laguerre, A. Bily, S. Birtic, Lipid oxidation in
food. Lipids and edible oils: properties, proces-sing and applications, Ed. C. Galanakis, Aca-demic Press, New York, NJ, 243-288 (2019).
[7] N. Ito, S. Fukushima, A. Haqlwara, M. Shiba-ta, T. Ogiso, Carcinogenicity of butylated hy-droxyanisole in F344 rats. Journal of the Natio-nal Cancer Institute 70(2), 343-352, (1983).
[8] W. Thamavit, M. Tatematsu, T. Ogiso, Y. Mera, H. Tsuda, N. Ito, Dose-dependent effects of butylated hydroxyanisole, butylated hydroxyto-luene and ethoxyquin in induction of foci of rat liver cells containing the placental form of glu-tathione S-transferase. Cancer Letters 27(3), 295-303, (1985).
[9] J. Pokorný, Are natural antioxidants better–and safer–than synthetic antioxidants?. Europe-an Journal of Lipid Science and Technology, 109(6), 629-642, (2007).
[10] D.R. Berdahl, R.I. Nahas, J.P. Barren, Synthetic and natural antioxidant additives in food stabi-lization: current applications and future resear-ch. In: Oxidation in foods and beverages and antioxidant applications (pp. 272-320). Woo-dhead Publishing (2010).
[11] A.R. Sen, P.K. Mandal, Use of natural antioxi-dants in muscle foods and their benefits in hu-man health: An overview. International Journal of Meat Science 7, 1-5, (2017).
[12] F. Shahidi, Antioxidants in food and food an-tioxidants. Food/Nahrung, 44(3), 158-163 (2000).
[13] D.M. Maestri, V. Nepote, A.L. Lamarque, J.A. Zygadlo, Natural products as antioxidants. Phytochemistry 37(661), 105-135 (2006).
[14] D.P. Xu, Y. Li, X. Meng, T. Zhou, Y. Zhou, J. Zheng, H.B. Li, Natural antioxidants in foods and medicinal plants: Extraction, assessment and resources. International Journal of Mole-cular Sciences, 18(1), 96 (2017).
[15] A. Premnath, M. Narayana, C. Ramakrishnan, S. Kuppusamy, V. Chockalingam, Mapping quantitative trait loci controlling oil content, oleic acid and linoleic acid content in sunflower (Helianthus annuus L.). Molecular Breeding, 36(7), 106 (2016).
[16] S.A. Hussain, A. Hameed, I. Ajmal, S. Noshe-en, H.A.R. Suleria, Y. Song, Effects of sesame seed extract as a natural antioxidant on the oxi-dative stability of sunflower oil. Journal of Food Science and Technology, 55(10), 4099-4110 (2018).
[17] N. Gavaric, S.S. Mozina, N. Kladar, B. Bozin, Chemical profile, antioxidant and antibacterial activity of thyme and oregano essential oils, thymol and carvacrol and their possible syner-
LA RIVISTA ITALIANA DELLE SOSTANZE GRASSE - VOL XCVIII - APRILE/GIUGNO 2021LA RIVISTA ITALIANA DELLE SOSTANZE GRASSE - VOL XCVIII - APRILE/GIUGNO 2021 LA RIVISTA ITALIANA DELLE SOSTANZE GRASSE - VOL XCVIII - APRILE/GIUGNO 2021
104
edible oils by differential scanning calorimetry and oxidative stability index methods. Food Chemistry 76(3), 385-389 (2002).
[30] F. Chemat, I. Grondin, P. Costes, L. Moutous-samy, A.S.C. Sing, J. Smadja, High power ul-trasound effects on lipid oxidation of refined sunflower oil. Ultrasonics Sonochemistry, 11(5), 281-285 (2004).
[31] A. Gliszczyńska-Świgło, E. Sikorska, Simple reversed-phase liquid chromatography method for determination of tocopherols in edible plant oils. Journal of Chromatography A, 1048(2), 195-198 (2004).
[32] A.A.A. Mohdaly, I. Smetanska, M.F. Ramadan, M.A. Sarhan, A. Mahmoud, Antioxidant poten-tial of sesame (Sesamum indicum) cake extract in stabilization of sunflower and soybean oils. Industrial Crops and Products 34(1), 952-959, (2011).
[33] A.A. Mohdaly, M.A. Sarhan, I. Smetanska, A. Mahmoud, Antioxidant properties of various
solvent extracts of potato peels, sugar beet pulp, and sesame cake. Journal of the Science and Food Agriculture 90, 218-226 (2010).
[34] E. Köksal, E. Bursal, I. Gülçin, M. Korkmaz, C. Çağlayan, A.C. Gören, S.H. Alwasel, Antioxi-dant activity and polyphenol content of Turkish thyme (Thymus vulgaris) monitored by liquid chromatography and tandem mass spectro-metry. International Journal of Food Properties, 20(3), 514-525, (2017).
[35] M.F. Ramadan, Oxidation of β-sitosterol and campesterol in sunflower oil upon deep- and pan-frying of French fries. Journal of Food Science and Technology 52(10):6301-6311, (2015).
[36] G. Özkan, M. Kiralan, E. Karacabey, G. Calik, N. Özdemir, T. Tat, A. Bayrak, M.F. Ramadan, Effect of hazelnut roasting on the oil properties and stability under thermal and photooxida-tion. European Food Research and Technology 242:2011–2019 (2016).