e S cienc Ragab et al., J Textile Sci Eng T e x t il e En l a o f gine ...Area of the pore space in...
9
Volume 7 • Issue 5 • 1000314 J Textile Sci Eng, an open access journal ISSN: 2165-8064 Research Article Open Access Ragab et al., J Textile Sci Eng 2017, 7:5 DOI: 10.4172/2165-8064.1000314 Research Article OMICS International Journal of Textile Science & Engineering J o u r n a l o f T e x t i l e S c i e n c e & E n g i n e e r i n g ISSN: 2165-8064 Keywords: Textile fabrics; Pore size; Porosity pore size distribution; Image analysis; Matlab program Introduction ermal comfort of clothing and textiles is strongly related to fabrics permeability, water-vapour permeability, and waterproofness [1]. On the other hand, these three characteristics are dependent on the porosity and the internal structure [2-4]. e pore properties of the fabric, such as the pore size, pore size distribution, pore shape and porosity, are determined by the fiber and yarn properties and the fabric's structural properties, such as setting and weave type. Accordingly, the prediction of the permeability performance of the fabric used in a certain area can be obtained by the control of the pore properties which have been determined through the fabric's structural properties. Porosity is defined as the ratio of the total empty area to the total area or as the ratio of the total empty volume to the total volume. e fabric's porosity was introduced as having three different components, which were the inter-fiber and inter yarn porosities; and the effective porosity of the flow that took place in the fabric was described as a function of the inter-fiber and inter-yarn porosities [5]. e introduction of image analysis techniques in textile industry and engineering enhances quality through the efficient use of control [6]. Textile porosity and other related properties, such as air permeability or light transparency, have recently become the focal point of wide and intensive research activity, because of the steadily growing interest on technical textiles and composites [7]. Due to the complex and deformable structure and the non-uniform pore size distribution of textiles, it is somewhat difficult to reach a generalized porosity measure based on measuring the pore dimensions or using the yarn diameter, etc. in order to calculate the air permeability of the fabric [8]. Several studies were oriented to the investigation of the porous structure of woven fabrics [9-11]. rough several studies have treated the pores as cylinders with a permanent cross-section over all its length, the pore size and shape are completely uneven. e same is valid for the pore distribution in the woven fabric [12]. Abstract Due to the complexity of fabric structure, modeling of pore structure and predicting the pore parameters are difficult. This paper presents a novel approach to determine textile pore size, porosity and pore size distribution by the application of the image analysis techniques. In this study, it has been attempted to establish a theoretical model for both the pore size and porosity of woven fabrics. For this purpose, a theoretical model of porous systems based on Poiseuille's law was used to predict the pore size of woven fabrics. Also a theoretical model was created to predict the porosity of a woven fabric depending on the geometrical parameters. The two characteristics of pore opening size and porosity were determined from image analysis and were compared to the results from laboratory tests. The validity of which was confirmed by experimental results using cotton plain woven fabrics produced from different yarn linear density and tightness. A new and accurate method of image analysis for pore size distribution (PSD) determination of woven fabrics is presented in this paper. The tested fabric sample could be ranked in a decrease order successfully. Determination of Pore Size, Porosity and Pore Size Distribution of Woven Structures by Image Analysis Techniques Ragab A, Fouda A, El-Deeb H and Abou-Taleb H* Textile Engineering Department, Faculty of Engineering, Mansoura University, Mansoura, Egypt *Corresponding author: Abou-Taleb H, Textile Engineering Department, Faculty of Engineering, Mansoura University, Mansoura, Egypt, Tel: +20 50 2383781; E-mail: [email protected] Received July 24, 2017; Accepted August 29, 2017; Published September 01, 2017 Citation: Ragab A, Fouda A, El-Deeb H, Abou-Taleb H (2017) Determination of Pore Size, Porosity and Pore Size Distribution of Woven Structures by Image Analysis Techniques. J Textile Sci Eng 7: 314. doi: 10.4172/2165-8064.1000314 Copyright: © 2017 Ragab A, et al. This is an open-access article distributed under the terms of the Creative Commons Attribution License, which permits unrestricted use, distribution, and reproduction in any medium, provided the original author and source are credited. Fewer attempts have been made to determine pore size and its distribution and the fabric structure plays in governing these. e experimental approaches involve a number of disadvantages. ey are time-consuming, destructive and lead to inaccurate results since fabrics deform during the procedure. erefore, the aim of this study is to present a method, based on image analysis, which is faster, accurate and particularly appropriate for use in measuring porosity, pore size and pore size distribution. eoretical Models Pore size calculation e proposed model is based on Hagen-Poiseuille equation (1839). For the development of the fabric mathematical model, the following assumptions have been considered: a) reads are uniform along the length. b) reads are equally spaced in the fabric. c) ere is no flattening in the threads. e mathematical model presented here is based on the hydraulic radius theory and starts from the first principles of fluid flow. Using Hagen-Poiseuille law for laminar flow through noncircular and irregular in the pore structure and spacing is employed as the following equation [13,14]. 2 3 . . , / sec 8 .. h o R pA Q m K η ∆ = (1)
Transcript of e S cienc Ragab et al., J Textile Sci Eng T e x t il e En l a o f gine ...Area of the pore space in...
Volume 7 • Issue 5 • 1000314J Textile Sci Eng, an open access journalISSN: 2165-8064
Research Article Open Access
Ragab et al., J Textile Sci Eng 2017, 7:5DOI: 10.4172/2165-8064.1000314
Research Article OMICS International
Journal of Textile Science & EngineeringJo
urna
l of T
extile Science & Engineering
ISSN: 2165-8064
Keywords: Textile fabrics; Pore size; Porosity pore size distribution; Image analysis; Matlab program
IntroductionThermal comfort of clothing and textiles is strongly related to
fabrics permeability, water-vapour permeability, and waterproofness [1]. On the other hand, these three characteristics are dependent on the porosity and the internal structure [2-4].
The pore properties of the fabric, such as the pore size, pore size distribution, pore shape and porosity, are determined by the fiber and yarn properties and the fabric's structural properties, such as setting and weave type. Accordingly, the prediction of the permeability performance of the fabric used in a certain area can be obtained by the control of the pore properties which have been determined through the fabric's structural properties.
Porosity is defined as the ratio of the total empty area to the total area or as the ratio of the total empty volume to the total volume. The fabric's porosity was introduced as having three different components, which were the inter-fiber and inter yarn porosities; and the effective porosity of the flow that took place in the fabric was described as a function of the inter-fiber and inter-yarn porosities [5].
The introduction of image analysis techniques in textile industry and engineering enhances quality through the efficient use of control [6]. Textile porosity and other related properties, such as air permeability or light transparency, have recently become the focal point of wide and intensive research activity, because of the steadily growing interest on technical textiles and composites [7].
Due to the complex and deformable structure and the non-uniform pore size distribution of textiles, it is somewhat difficult to reach a generalized porosity measure based on measuring the pore dimensions or using the yarn diameter, etc. in order to calculate the air permeability of the fabric [8].
Several studies were oriented to the investigation of the porous structure of woven fabrics [9-11]. Through several studies have treated the pores as cylinders with a permanent cross-section over all its length, the pore size and shape are completely uneven. The same is valid for the pore distribution in the woven fabric [12].
AbstractDue to the complexity of fabric structure, modeling of pore structure and predicting the pore parameters are
difficult. This paper presents a novel approach to determine textile pore size, porosity and pore size distribution by the application of the image analysis techniques. In this study, it has been attempted to establish a theoretical model for both the pore size and porosity of woven fabrics. For this purpose, a theoretical model of porous systems based on Poiseuille's law was used to predict the pore size of woven fabrics. Also a theoretical model was created to predict the porosity of a woven fabric depending on the geometrical parameters. The two characteristics of pore opening size and porosity were determined from image analysis and were compared to the results from laboratory tests. The validity of which was confirmed by experimental results using cotton plain woven fabrics produced from different yarn linear density and tightness. A new and accurate method of image analysis for pore size distribution (PSD) determination of woven fabrics is presented in this paper. The tested fabric sample could be ranked in a decrease order successfully.
Determination of Pore Size, Porosity and Pore Size Distribution of Woven Structures by Image Analysis TechniquesRagab A, Fouda A, El-Deeb H and Abou-Taleb H*Textile Engineering Department, Faculty of Engineering, Mansoura University, Mansoura, Egypt
*Corresponding author: Abou-Taleb H, Textile Engineering Department, Faculty of Engineering, Mansoura University, Mansoura, Egypt, Tel: +20 50 2383781; E-mail: [email protected]
Received July 24, 2017; Accepted August 29, 2017; Published September 01, 2017
Citation: Ragab A, Fouda A, El-Deeb H, Abou-Taleb H (2017) Determination of Pore Size, Porosity and Pore Size Distribution of Woven Structures by Image Analysis Techniques. J Textile Sci Eng 7: 314. doi: 10.4172/2165-8064.1000314
Copyright: © 2017 Ragab A, et al. This is an open-access article distributed under the terms of the Creative Commons Attribution License, which permits unrestricted use, distribution, and reproduction in any medium, provided the original author and source are credited.
Fewer attempts have been made to determine pore size and its distribution and the fabric structure plays in governing these. The experimental approaches involve a number of disadvantages. They are time-consuming, destructive and lead to inaccurate results since fabrics deform during the procedure.
Therefore, the aim of this study is to present a method, based on image analysis, which is faster, accurate and particularly appropriate for use in measuring porosity, pore size and pore size distribution.
Theoretical ModelsPore size calculation
The proposed model is based on Hagen-Poiseuille equation (1839). For the development of the fabric mathematical model, the following assumptions have been considered:
a) Threads are uniform along the length.
b) Threads are equally spaced in the fabric.
c) There is no flattening in the threads.
The mathematical model presented here is based on the hydraulic radius theory and starts from the first principles of fluid flow. Using Hagen-Poiseuille law for laminar flow through noncircular and irregular in the pore structure and spacing is employed as the following equation [13,14].
23. . , / sec
8 . .h oR p AQ mKη∆
=
(1)
Citation: Ragab A, Fouda A, El-Deeb H, Abou-Taleb H (2017) Determination of Pore Size, Porosity and Pore Size Distribution of Woven Structures by Image Analysis Techniques. J Textile Sci Eng 7: 314. doi: 10.4172/2165-8064.1000314
Page 2 of 9
Volume 7 • Issue 5 • 1000314J Textile Sci Eng, an open access journalISSN: 2165-8064
Where Q=Rate of flow through the capillary, Δp=Pressure difference, Ao=Area of the pore space in the channels, η=viscosity of the fluid, l=length of the capillary, K=A shape constant that depends on the shape of the pore along the channel (tortuosity) (τ) and orient ration of the pore system and Rh=The hydraulic radius of pore defined as follows [15].
2 ph
p
AR
P= (2)
Where Ap, Pp and Rh are the area, the wetted perimeter and the hydraulic radius of the pore.
The cross-sectional area of the pores (Ao) in the channels will be (Aε), where (ε) is the porosity and (A) is the total cross-sectional area. Therefore, Equation (1) can be written as follows:
23. . , / sec
8hR p AQ m
Kε
η∆
=
(3)
Now if the hydraulic radius (Rh) and the porosity (ε) of both the inter-fibre and inter-yarn flow paths are determined, along with (K), the flow velocity (V) occurring in fabrics can be defined by equation (4):
2. , / sec8
hQ dh R pV mA dt K h
εη∆
= = = (4)
The flow velocity occurring in a capillary tube with a hydraulic radius (Rh) was a function of pressure difference (Equation (4)). The effective forces during the capillary flow occurring in the vertical direction were capillary forces that affected upwarp and gravity forces that affected down. Accordingly, the pressure difference (ΔP) during the capillary flow at a straight capillary tube was defined by Equation (5), described by the Laplace equation as follows [16]:
2 cos( )h
p Pc Pg ghR
γ θρ∆ = − = − (5)
In Equation (5), capillary pressure (Pc) was a function of capillary radius (Rh), the contact angle between the fluid surface and the fibre θ and the surface tension of the fluid γ.The gravitational pressure (Pg) depended on the height of the fluid (h), acceleration of gravity (g) and the density of the fluid (ρ). At the equilibrium condition in which the capillary force was equal to gravity force in Equation (5), the maximum capillary rise was reached (Equation 6) at Δp=o.
2 cos
h
ghR
γ θ ρ= (6)
Equation (6) can be rewritten as follows
2 cos2h hD Rgh
γ θρ
= = (7)
Where Dh=hydraulic pore diameter between yarns, meter
γ=surface tension energy of the fluid at 23°C, N/m
Cos (θ)=cosine contact angle between the fluid surface and the wetted fabric=1
ρ=the fluid density, kg/m3
g=acceleration of gravity=9.81 m/sec2
h=hydrostatic head pressure, metre.
Surface porosity calculation
Fabric surface porosity (Rs) is defined as the ratio of the total empty area to the total area and can be calculated as follows [17]:
Rs=100-kc, % (8)
Where, kc is cloth cover factor percent
As Figure 1 shows, cloth cover factor percent (kc) [18,19] can be defined as the percentage of the areas covered by the warp and weft yarns and can be calculated as follows:
Cloth cover factor percent (kc)=(Covered area by yarns/Rectangular area) X 100 (9)
The total rectangular area (ABCD) as shown in Figure 2 can be calculated as P1X P2.
The area covered by the warp yarn is d1X P2, and that covered by weft yarn is d2XP1 across the material [8].
Therefore, the volume of cloth cover factor percent of the fabric can be calculated as follows:
kc=[(P1d2+P2d1-d1 d2)/ P1 P2] x 100, % (10)
Where kc is the cloth cover factor percent
P1=1/n1 (mm), P2=1/n2 (mm) are the distances between two adjacent yarns in the warp and weft directions, and d1 (mm), d2 (mm) are the diameters of the warp and weft yarns, respectively.
According to the refs. [20,21], the derived yarn diameter can be obtained as follows:
Which,
Dend =0.01189 ......,mm...0.6pf
(11)
d=yarn diameter in mm
Figure 1: Illustration for cloth cover percent of fabric: (a) Structure of plain weave, (b) Amplified area of rectangular (ABCD) in a plain weave.
Figure 2: System layout of the automatic inspection of fabric pore size: (A) video camera, (B) zoom lens, (C) fabric sample, (D) transparent glass deck, (E) light source (back side), (G) image card, (H) PC.
Citation: Ragab A, Fouda A, El-Deeb H, Abou-Taleb H (2017) Determination of Pore Size, Porosity and Pore Size Distribution of Woven Structures by Image Analysis Techniques. J Textile Sci Eng 7: 314. doi: 10.4172/2165-8064.1000314
Page 3 of 9
Volume 7 • Issue 5 • 1000314J Textile Sci Eng, an open access journalISSN: 2165-8064
Den=yarn denier and
ρf=fiber density, g/cm3
Surface porosity can also be calculated from the projected geometrical area of the opening the percentage of the areas covered by the warp and weft yarns and can be calculated as follows:
P1.P2open poreareatotal area (p1+ d1)(p2+ d2)
ε = = (12)
Where
P1=distance between warp threads
P2=distance between weft threads
d1=diameter of the warp yarn
d2=diameter of the weft yarn.
The main problem in the calculation of porosity is deformation, unevenness and irregular pore size distribution of the textile structures. Neither the distance between yarns nor the diameter of the yarn is uniform; moreover, the thickness is practically never constant across a fabric. Therefore, existing porosity calculation methods that depend on the shape characteristics of the fabric, such as those mentioned earlier in this section, are not useful for estimating the air permeability in practice.
Experimental WorkFabrics studied
Five samples or raw fabrics of 100% cotton were investigated. The woven samples were tested for their weight and thickness. All of the samples are commercial plain woven.
Image analysis technique
Determination of the pores size and porosity of a woven structure requires a digital camera, personal computer (PC), as well as Matlab program for automatic measurement of the pore size as shown in Figure 2. In this case a digital camera with a resolution of 570 pixels per inch was used. In our research, the measurements taken was mainly of the length. As magnification ratio may change in a test, it was necessary to calibrate length prior to each test.
In this study, 2-D pore size distributions for different fabrics were assessed with assistance of image analysis. Cotton fabrics and indexed with symbols A1, B1, C1, D1, and E1.
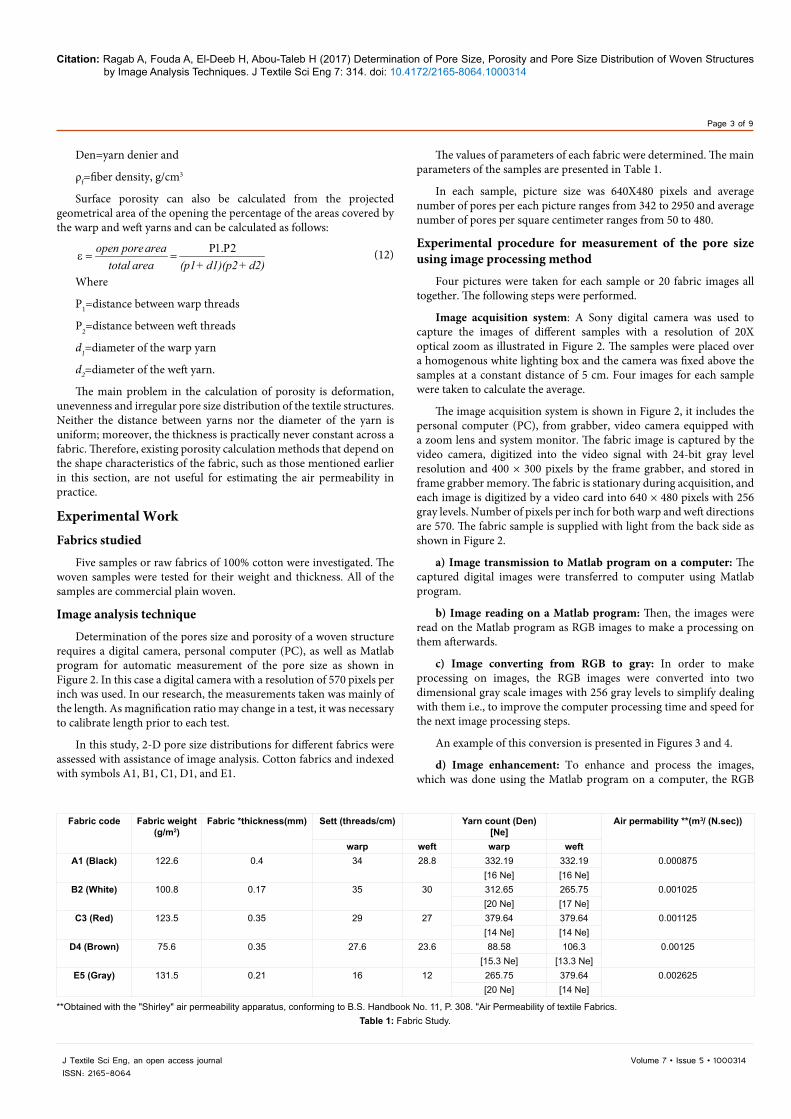
The values of parameters of each fabric were determined. The main parameters of the samples are presented in Table 1.
In each sample, picture size was 640X480 pixels and average number of pores per each picture ranges from 342 to 2950 and average number of pores per square centimeter ranges from 50 to 480.
Experimental procedure for measurement of the pore size using image processing method
Four pictures were taken for each sample or 20 fabric images all together. The following steps were performed.
Image acquisition system: A Sony digital camera was used to capture the images of different samples with a resolution of 20X optical zoom as illustrated in Figure 2. The samples were placed over a homogenous white lighting box and the camera was fixed above the samples at a constant distance of 5 cm. Four images for each sample were taken to calculate the average.
The image acquisition system is shown in Figure 2, it includes the personal computer (PC), from grabber, video camera equipped with a zoom lens and system monitor. The fabric image is captured by the video camera, digitized into the video signal with 24-bit gray level resolution and 400 × 300 pixels by the frame grabber, and stored in frame grabber memory. The fabric is stationary during acquisition, and each image is digitized by a video card into 640 × 480 pixels with 256 gray levels. Number of pixels per inch for both warp and weft directions are 570. The fabric sample is supplied with light from the back side as shown in Figure 2.
a) Image transmission to Matlab program on a computer: The captured digital images were transferred to computer using Matlab program.
b) Image reading on a Matlab program: Then, the images were read on the Matlab program as RGB images to make a processing on them afterwards.
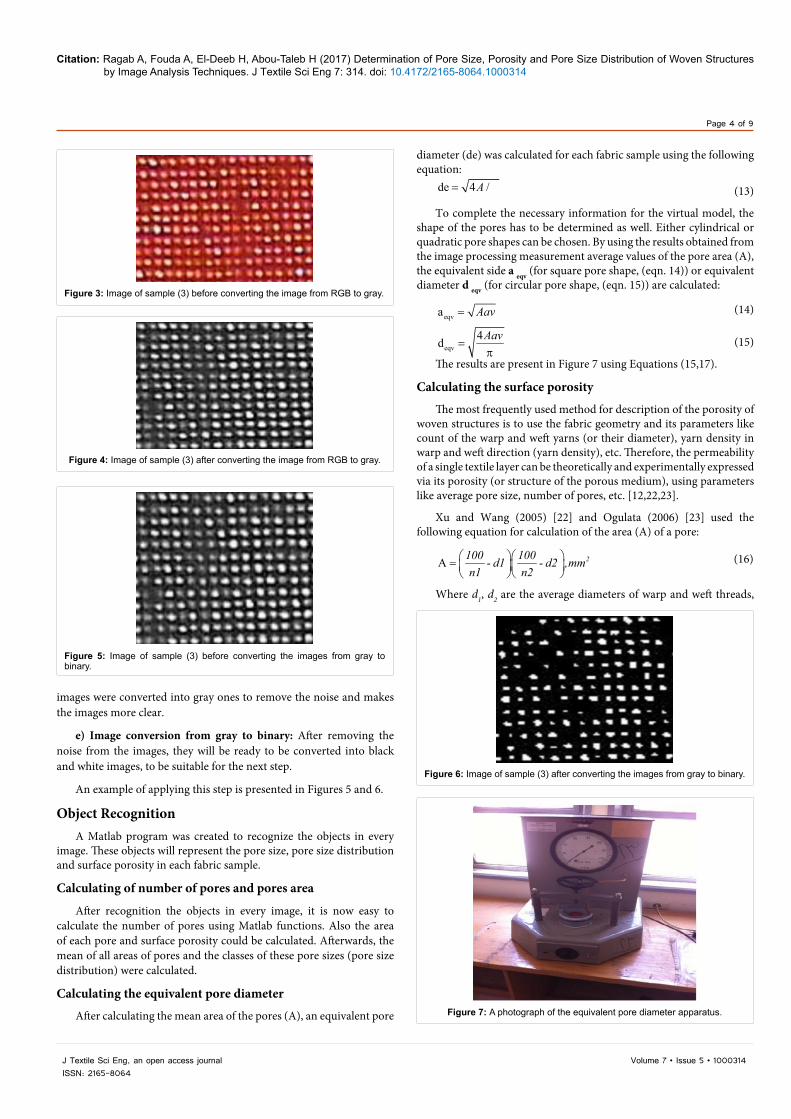
c) Image converting from RGB to gray: In order to make processing on images, the RGB images were converted into two dimensional gray scale images with 256 gray levels to simplify dealing with them i.e., to improve the computer processing time and speed for the next image processing steps.
An example of this conversion is presented in Figures 3 and 4.
d) Image enhancement: To enhance and process the images, which was done using the Matlab program on a computer, the RGB
Fabric code Fabric weight (g/m2)
Fabric *thickness(mm) Sett (threads/cm) Yarn count (Den) [Ne]
Air permability **(m3/ (N.sec))
warp weft warp weftA1 (Black) 122.6 0.4 34 28.8 332.19 332.19 0.000875
[16 Ne] [16 Ne]B2 (White) 100.8 0.17 35 30 312.65 265.75 0.001025
[20 Ne] [17 Ne]C3 (Red) 123.5 0.35 29 27 379.64 379.64 0.001125
[14 Ne] [14 Ne]D4 (Brown) 75.6 0.35 27.6 23.6 88.58 106.3 0.00125
[15.3 Ne] [13.3 Ne]E5 (Gray) 131.5 0.21 16 12 265.75 379.64 0.002625
[20 Ne] [14 Ne]
**Obtained with the "Shirley" air permeability apparatus, conforming to B.S. Handbook No. 11, P. 308. "Air Permeability of textile Fabrics.Table 1: Fabric Study.
Citation: Ragab A, Fouda A, El-Deeb H, Abou-Taleb H (2017) Determination of Pore Size, Porosity and Pore Size Distribution of Woven Structures by Image Analysis Techniques. J Textile Sci Eng 7: 314. doi: 10.4172/2165-8064.1000314
Page 4 of 9
Volume 7 • Issue 5 • 1000314J Textile Sci Eng, an open access journalISSN: 2165-8064
images were converted into gray ones to remove the noise and makes the images more clear.
e) Image conversion from gray to binary: After removing the noise from the images, they will be ready to be converted into black and white images, to be suitable for the next step.
An example of applying this step is presented in Figures 5 and 6.
Object RecognitionA Matlab program was created to recognize the objects in every
image. These objects will represent the pore size, pore size distribution and surface porosity in each fabric sample.
Calculating of number of pores and pores area
After recognition the objects in every image, it is now easy to calculate the number of pores using Matlab functions. Also the area of each pore and surface porosity could be calculated. Afterwards, the mean of all areas of pores and the classes of these pore sizes (pore size distribution) were calculated.
Calculating the equivalent pore diameter
After calculating the mean area of the pores (A), an equivalent pore
diameter (de) was calculated for each fabric sample using the following equation:
de 4 /A= π (13)
To complete the necessary information for the virtual model, the shape of the pores has to be determined as well. Either cylindrical or quadratic pore shapes can be chosen. By using the results obtained from the image processing measurement average values of the pore area (A), the equivalent side a eqv (for square pore shape, (eqn. 14)) or equivalent diameter d eqv (for circular pore shape, (eqn. 15)) are calculated:
eqva Aav= (14)
eqv4d Aav
=π
(15)
The results are present in Figure 7 using Equations (15,17).
Calculating the surface porosity
The most frequently used method for description of the porosity of woven structures is to use the fabric geometry and its parameters like count of the warp and weft yarns (or their diameter), yarn density in warp and weft direction (yarn density), etc. Therefore, the permeability of a single textile layer can be theoretically and experimentally expressed via its porosity (or structure of the porous medium), using parameters like average pore size, number of pores, etc. [12,22,23].
Xu and Wang (2005) [22] and Ogulata (2006) [23] used the following equation for calculation of the area (A) of a pore:
A 2100 100- d1 - d2 ,mmn1 n2
=
(16)
Where d1, d2 are the average diameters of warp and weft threads,
Figure 3: Image of sample (3) before converting the image from RGB to gray.
Figure 4: Image of sample (3) after converting the image from RGB to gray.
Figure 5: Image of sample (3) before converting the images from gray to binary.
Figure 6: Image of sample (3) after converting the images from gray to binary.
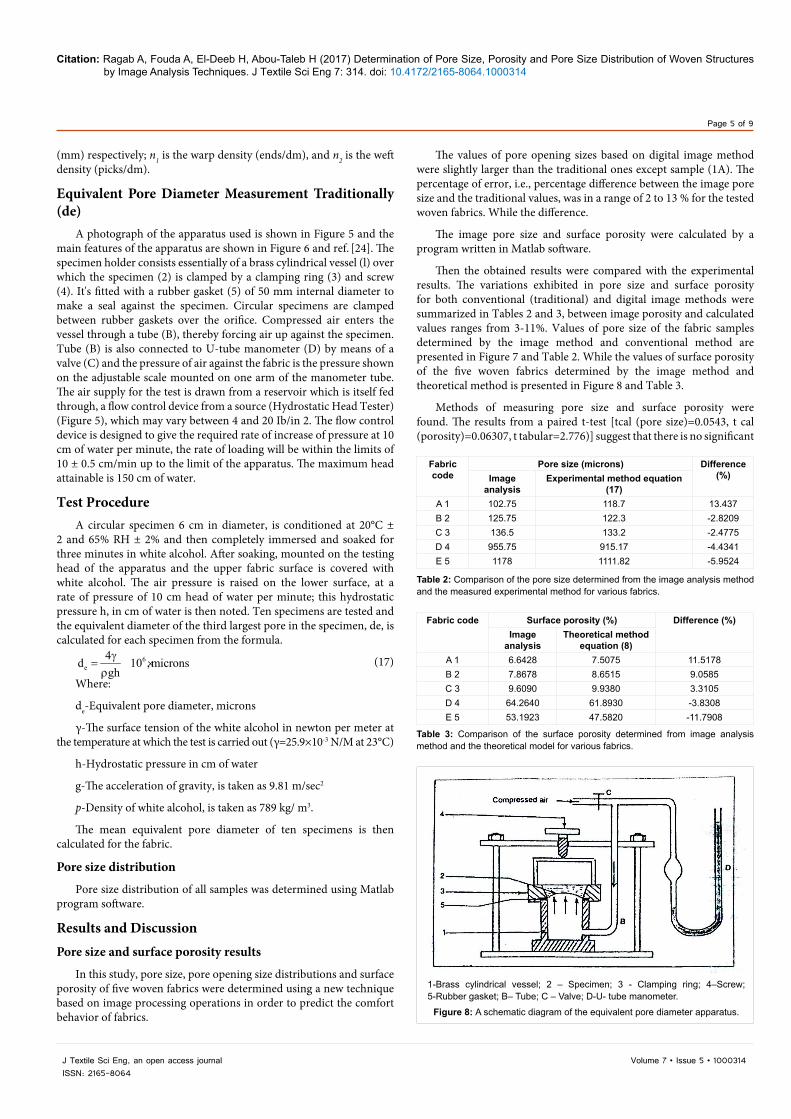
Figure 7: A photograph of the equivalent pore diameter apparatus.
Citation: Ragab A, Fouda A, El-Deeb H, Abou-Taleb H (2017) Determination of Pore Size, Porosity and Pore Size Distribution of Woven Structures by Image Analysis Techniques. J Textile Sci Eng 7: 314. doi: 10.4172/2165-8064.1000314
Page 5 of 9
Volume 7 • Issue 5 • 1000314J Textile Sci Eng, an open access journalISSN: 2165-8064
(mm) respectively; n1 is the warp density (ends/dm), and n2 is the weft density (picks/dm).
Equivalent Pore Diameter Measurement Traditionally (de)
A photograph of the apparatus used is shown in Figure 5 and the main features of the apparatus are shown in Figure 6 and ref. [24]. The specimen holder consists essentially of a brass cylindrical vessel (l) over which the specimen (2) is clamped by a clamping ring (3) and screw (4). It's fitted with a rubber gasket (5) of 50 mm internal diameter to make a seal against the specimen. Circular specimens are clamped between rubber gaskets over the orifice. Compressed air enters the vessel through a tube (B), thereby forcing air up against the specimen. Tube (B) is also connected to U-tube manometer (D) by means of a valve (C) and the pressure of air against the fabric is the pressure shown on the adjustable scale mounted on one arm of the manometer tube. The air supply for the test is drawn from a reservoir which is itself fed through, a flow control device from a source (Hydrostatic Head Tester) (Figure 5), which may vary between 4 and 20 Ib/in 2. The flow control device is designed to give the required rate of increase of pressure at 10 cm of water per minute, the rate of loading will be within the limits of 10 ± 0.5 cm/min up to the limit of the apparatus. The maximum head attainable is 150 cm of water.
Test ProcedureA circular specimen 6 cm in diameter, is conditioned at 20°C ±
2 and 65% RH ± 2% and then completely immersed and soaked for three minutes in white alcohol. After soaking, mounted on the testing head of the apparatus and the upper fabric surface is covered with white alcohol. The air pressure is raised on the lower surface, at a rate of pressure of 10 cm head of water per minute; this hydrostatic pressure h, in cm of water is then noted. Ten specimens are tested and the equivalent diameter of the third largest pore in the specimen, de, is calculated for each specimen from the formula.
6e
4d 10 ,micronsghγ
= ×ρ
(17)
Where:
de-Equivalent pore diameter, microns
γ-The surface tension of the white alcohol in newton per meter at the temperature at which the test is carried out (γ=25.9×10⁻³ N/M at 23°C)
h-Hydrostatic pressure in cm of water
g-The acceleration of gravity, is taken as 9.81 m/sec2
p-Density of white alcohol, is taken as 789 kg/ m3.
The mean equivalent pore diameter of ten specimens is then calculated for the fabric.
Pore size distribution
Pore size distribution of all samples was determined using Matlab program software.
Results and Discussion Pore size and surface porosity results
In this study, pore size, pore opening size distributions and surface porosity of five woven fabrics were determined using a new technique based on image processing operations in order to predict the comfort behavior of fabrics.
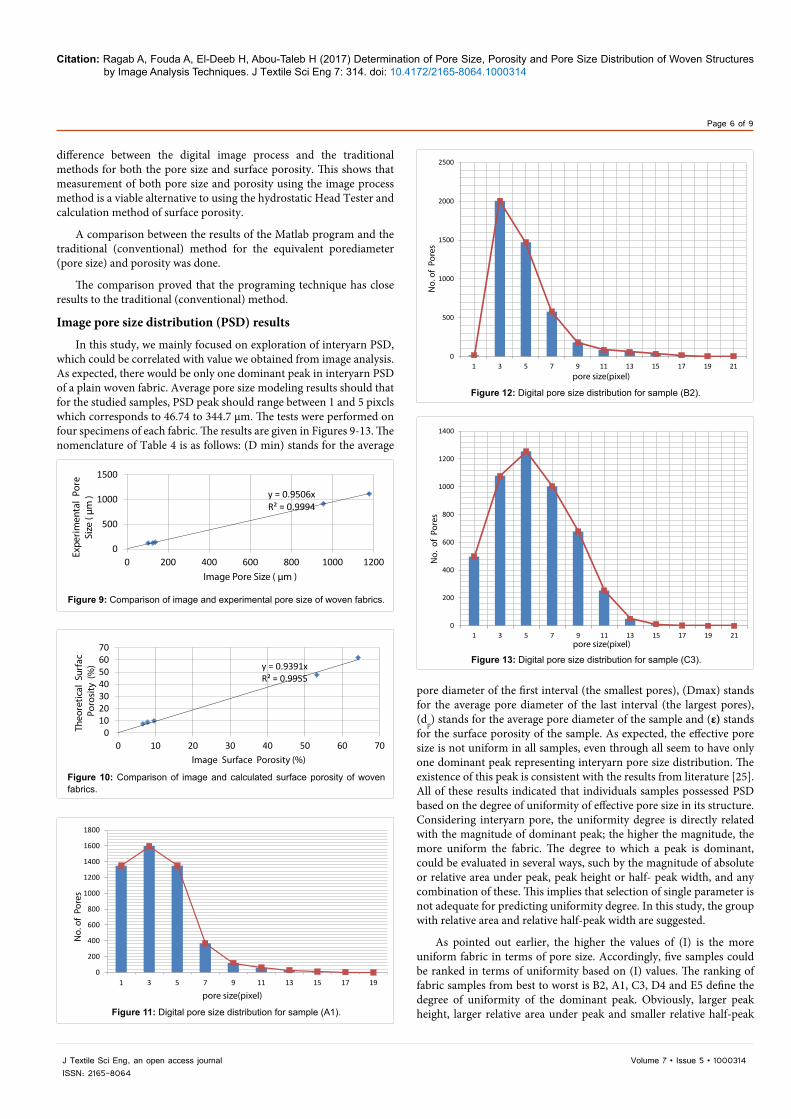
The values of pore opening sizes based on digital image method were slightly larger than the traditional ones except sample (1A). The percentage of error, i.e., percentage difference between the image pore size and the traditional values, was in a range of 2 to 13 % for the tested woven fabrics. While the difference.
The image pore size and surface porosity were calculated by a program written in Matlab software.
Then the obtained results were compared with the experimental results. The variations exhibited in pore size and surface porosity for both conventional (traditional) and digital image methods were summarized in Tables 2 and 3, between image porosity and calculated values ranges from 3-11%. Values of pore size of the fabric samples determined by the image method and conventional method are presented in Figure 7 and Table 2. While the values of surface porosity of the five woven fabrics determined by the image method and theoretical method is presented in Figure 8 and Table 3.
Methods of measuring pore size and surface porosity were found. The results from a paired t-test [tcal (pore size)=0.0543, t cal (porosity)=0.06307, t tabular=2.776)] suggest that there is no significant
Fabric code
Pore size (microns) Difference (%)Image
analysisExperimental method equation
(17)A 1 102.75 118.7 13.437B 2 125.75 122.3 -2.8209C 3 136.5 133.2 -2.4775D 4 955.75 915.17 -4.4341E 5 1178 1111.82 -5.9524
Table 2: Comparison of the pore size determined from the image analysis method and the measured experimental method for various fabrics.
Fabric code Surface porosity (%) Difference (%)Image
analysisTheoretical method
equation (8)A 1 6.6428 7.5075 11.5178B 2 7.8678 8.6515 9.0585C 3 9.6090 9.9380 3.3105D 4 64.2640 61.8930 -3.8308E 5 53.1923 47.5820 -11.7908
Table 3: Comparison of the surface porosity determined from image analysis method and the theoretical model for various fabrics.
1-Brass cylindrical vessel; 2 – Specimen; 3 - Clamping ring; 4–Screw; 5-Rubber gasket; B– Tube; C – Valve; D-U- tube manometer.
Figure 8: A schematic diagram of the equivalent pore diameter apparatus.
Citation: Ragab A, Fouda A, El-Deeb H, Abou-Taleb H (2017) Determination of Pore Size, Porosity and Pore Size Distribution of Woven Structures by Image Analysis Techniques. J Textile Sci Eng 7: 314. doi: 10.4172/2165-8064.1000314
Page 6 of 9
Volume 7 • Issue 5 • 1000314J Textile Sci Eng, an open access journalISSN: 2165-8064
difference between the digital image process and the traditional methods for both the pore size and surface porosity. This shows that measurement of both pore size and porosity using the image process method is a viable alternative to using the hydrostatic Head Tester and calculation method of surface porosity.
A comparison between the results of the Matlab program and the traditional (conventional) method for the equivalent porediameter (pore size) and porosity was done.
The comparison proved that the programing technique has close results to the traditional (conventional) method.
Image pore size distribution (PSD) results
In this study, we mainly focused on exploration of interyarn PSD, which could be correlated with value we obtained from image analysis. As expected, there would be only one dominant peak in interyarn PSD of a plain woven fabric. Average pore size modeling results should that for the studied samples, PSD peak should range between 1 and 5 pixcls which corresponds to 46.74 to 344.7 µm. The tests were performed on four specimens of each fabric. The results are given in Figures 9-13. The nomenclature of Table 4 is as follows: (D min) stands for the average
pore diameter of the first interval (the smallest pores), (Dmax) stands for the average pore diameter of the last interval (the largest pores), (dp) stands for the average pore diameter of the sample and (ε) stands for the surface porosity of the sample. As expected, the effective pore size is not uniform in all samples, even through all seem to have only one dominant peak representing interyarn pore size distribution. The existence of this peak is consistent with the results from literature [25]. All of these results indicated that individuals samples possessed PSD based on the degree of uniformity of effective pore size in its structure. Considering interyarn pore, the uniformity degree is directly related with the magnitude of dominant peak; the higher the magnitude, the more uniform the fabric. The degree to which a peak is dominant, could be evaluated in several ways, such by the magnitude of absolute or relative area under peak, peak height or half- peak width, and any combination of these. This implies that selection of single parameter is not adequate for predicting uniformity degree. In this study, the group with relative area and relative half-peak width are suggested.
As pointed out earlier, the higher the values of (I) is the more uniform fabric in terms of pore size. Accordingly, five samples could be ranked in terms of uniformity based on (I) values. The ranking of fabric samples from best to worst is B2, A1, C3, D4 and E5 define the degree of uniformity of the dominant peak. Obviously, larger peak height, larger relative area under peak and smaller relative half-peak
y = 0.9506xR² = 0.9994
0
500
1000
1500
0 200 400 600 800 1000 1200
eroP latnemirepxE
Size
( µm
)
Image Pore Size ( µm )
Figure 9: Comparison of image and experimental pore size of woven fabrics.
y = 0.9391xR² = 0.9955
010203040506070
0 10 20 30 40 50 60 70
cafruS laciteroehTPo
rosi
ty (
%)
Image Surface Porosity (%)
Figure 10: Comparison of image and calculated surface porosity of woven fabrics.
0
200
400
600
800
1000
1200
1400
1600
1800
1 3 5 7 9 11 13 15 17 19
No.
of
Pore
s
pore size(pixel)
Figure 11: Digital pore size distribution for sample (A1).
0
500
1000
1500
2000
2500
1 3 5 7 9 11 13 15 17 19 21
No.
of
Pore
s
pore size(pixel)
Figure 12: Digital pore size distribution for sample (B2).
0
200
400
600
800
1000
1200
1400
1 3 5 7 9 11 13 15 17 19 21
No.
of
Pore
s
pore size(pixel)
Figure 13: Digital pore size distribution for sample (C3).
Citation: Ragab A, Fouda A, El-Deeb H, Abou-Taleb H (2017) Determination of Pore Size, Porosity and Pore Size Distribution of Woven Structures by Image Analysis Techniques. J Textile Sci Eng 7: 314. doi: 10.4172/2165-8064.1000314
Page 7 of 9
Volume 7 • Issue 5 • 1000314J Textile Sci Eng, an open access journalISSN: 2165-8064
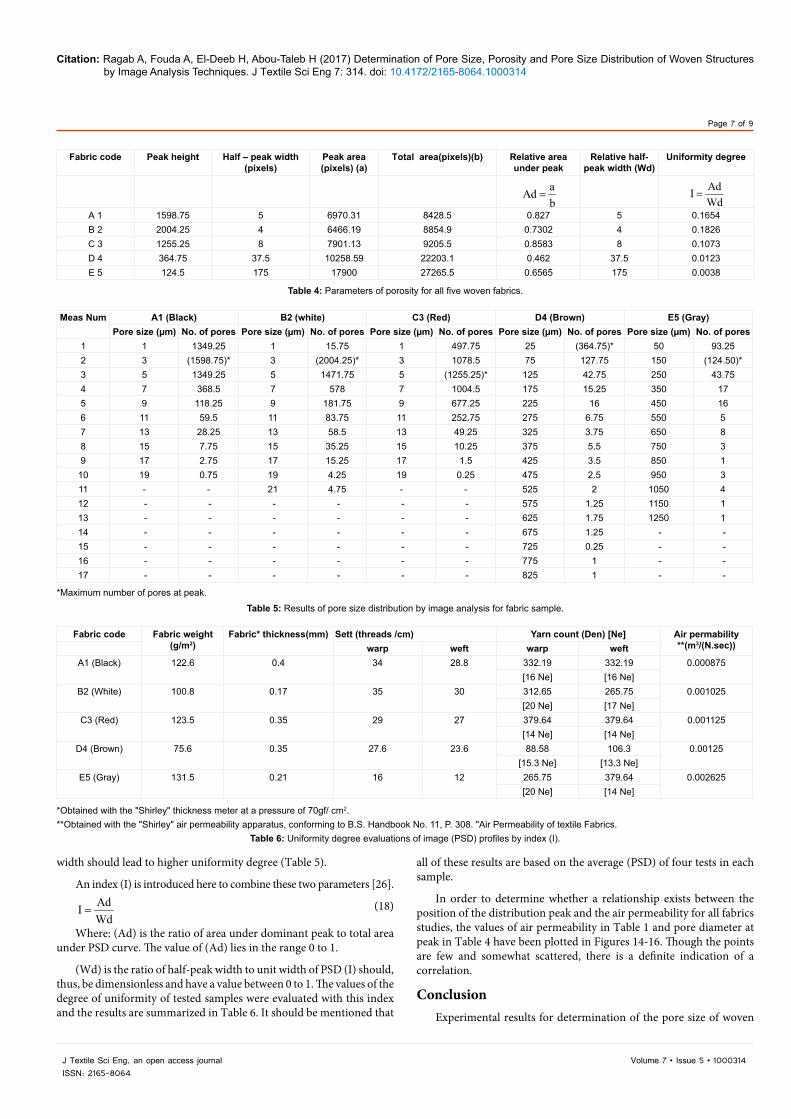
Fabric code Peak height Half – peak width (pixels)
Peak area (pixels) (a)
Total area(pixels)(b) Relative area under peak
Relative half- peak width (Wd)
Uniformity degree
aAdb
=
AdIWd
=
A 1 1598.75 5 6970.31 8428.5 0.827 5 0.1654B 2 2004.25 4 6466.19 8854.9 0.7302 4 0.1826C 3 1255.25 8 7901.13 9205.5 0.8583 8 0.1073D 4 364.75 37.5 10258.59 22203.1 0.462 37.5 0.0123E 5 124.5 175 17900 27265.5 0.6565 175 0.0038
Table 4: Parameters of porosity for all five woven fabrics.
Meas Num A1 (Black) B2 (white) C3 (Red) D4 (Brown) E5 (Gray)Pore size (µm) No. of pores Pore size (µm) No. of pores Pore size (µm) No. of pores Pore size (µm) No. of pores Pore size (µm) No. of pores
1 1 1349.25 1 15.75 1 497.75 25 (364.75)* 50 93.252 3 (1598.75)* 3 (2004.25)* 3 1078.5 75 127.75 150 (124.50)*3 5 1349.25 5 1471.75 5 (1255.25)* 125 42.75 250 43.754 7 368.5 7 578 7 1004.5 175 15.25 350 175 9 118.25 9 181.75 9 677.25 225 16 450 166 11 59.5 11 83.75 11 252.75 275 6.75 550 57 13 28.25 13 58.5 13 49.25 325 3.75 650 88 15 7.75 15 35.25 15 10.25 375 5.5 750 39 17 2.75 17 15.25 17 1.5 425 3.5 850 1
10 19 0.75 19 4.25 19 0.25 475 2.5 950 311 - - 21 4.75 - - 525 2 1050 412 - - - - - - 575 1.25 1150 113 - - - - - - 625 1.75 1250 114 - - - - - - 675 1.25 - -15 - - - - - - 725 0.25 - -16 - - - - - - 775 1 - -17 - - - - - - 825 1 - -
*Maximum number of pores at peak.
Table 5: Results of pore size distribution by image analysis for fabric sample.
Fabric code Fabric weight (g/m2)
Fabric* thickness(mm) Sett (threads /cm) Yarn count (Den) [Ne] Air permability **(m3/(N.sec)) warp weft warp weft
A1 (Black) 122.6 0.4 34 28.8 332.19 332.19 0.000875[16 Ne] [16 Ne]
B2 (White) 100.8 0.17 35 30 312.65 265.75 0.001025[20 Ne] [17 Ne]
C3 (Red) 123.5 0.35 29 27 379.64 379.64 0.001125[14 Ne] [14 Ne]
D4 (Brown) 75.6 0.35 27.6 23.6 88.58 106.3 0.00125[15.3 Ne] [13.3 Ne]
E5 (Gray) 131.5 0.21 16 12 265.75 379.64 0.002625[20 Ne] [14 Ne]
*Obtained with the "Shirley" thickness meter at a pressure of 70gf/ cm2.**Obtained with the "Shirley" air permeability apparatus, conforming to B.S. Handbook No. 11, P. 308. "Air Permeability of textile Fabrics.
Table 6: Uniformity degree evaluations of image (PSD) profiles by index (I).
width should lead to higher uniformity degree (Table 5).
An index (I) is introduced here to combine these two parameters [26].AdIWd
= (18)
Where: (Ad) is the ratio of area under dominant peak to total area under PSD curve. The value of (Ad) lies in the range 0 to 1.
(Wd) is the ratio of half-peak width to unit width of PSD (I) should, thus, be dimensionless and have a value between 0 to 1. The values of the degree of uniformity of tested samples were evaluated with this index and the results are summarized in Table 6. It should be mentioned that
all of these results are based on the average (PSD) of four tests in each sample.
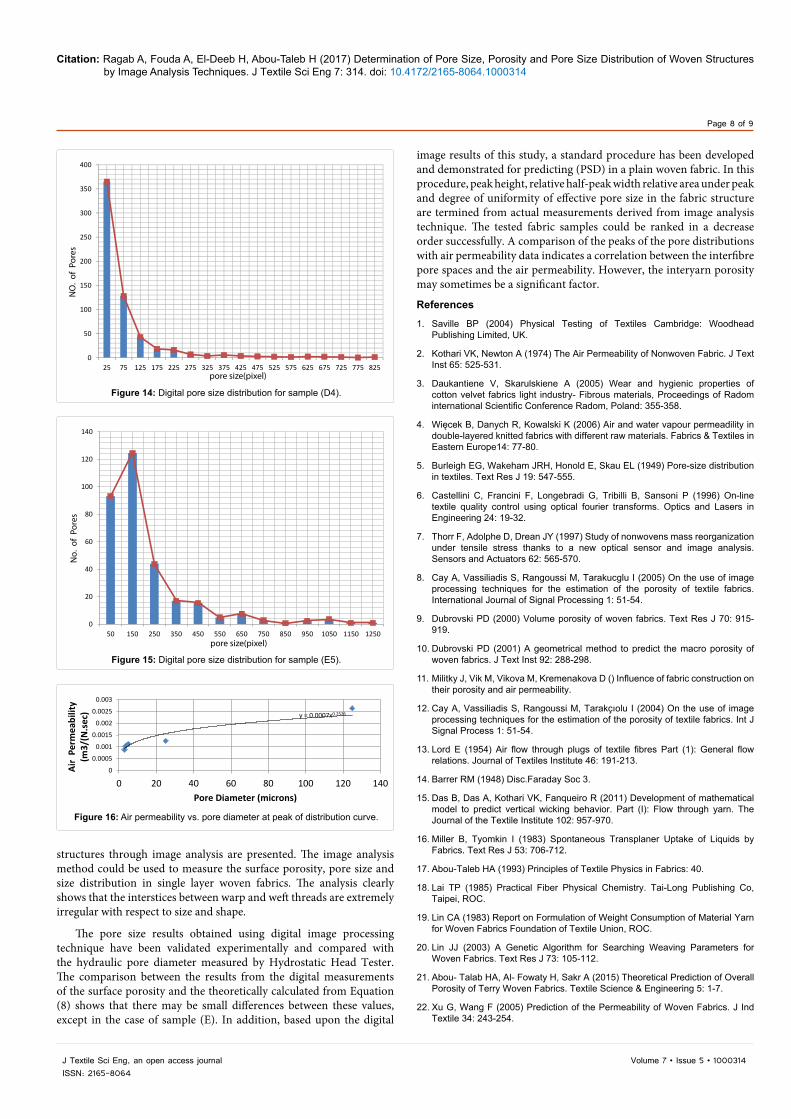
In order to determine whether a relationship exists between the position of the distribution peak and the air permeability for all fabrics studies, the values of air permeability in Table 1 and pore diameter at peak in Table 4 have been plotted in Figures 14-16. Though the points are few and somewhat scattered, there is a definite indication of a correlation.
ConclusionExperimental results for determination of the pore size of woven
Citation: Ragab A, Fouda A, El-Deeb H, Abou-Taleb H (2017) Determination of Pore Size, Porosity and Pore Size Distribution of Woven Structures by Image Analysis Techniques. J Textile Sci Eng 7: 314. doi: 10.4172/2165-8064.1000314
Page 8 of 9
Volume 7 • Issue 5 • 1000314J Textile Sci Eng, an open access journalISSN: 2165-8064
0
50
100
150
200
250
300
350
400
25 75 125 175 225 275 325 375 425 475 525 575 625 675 725 775 825
NO
. of
Por
es
pore size(pixel)
Figure 14: Digital pore size distribution for sample (D4).
0
20
40
60
80
100
120
140
50 150 250 350 450 550 650 750 850 950 1050 1150 1250
No.
of
Pore
s
pore size(pixel)
Figure 15: Digital pore size distribution for sample (E5).
y = 0.0007x0.2526
0
0.0005
0.001
0.0015
0.002
0.0025
0.003
0 20 40 60 80 100 120 140
ytilibaemreP riA
(m3/
(N.s
ec)
Pore Diameter (microns)
Figure 16: Air permeability vs. pore diameter at peak of distribution curve.
structures through image analysis are presented. The image analysis method could be used to measure the surface porosity, pore size and size distribution in single layer woven fabrics. The analysis clearly shows that the interstices between warp and weft threads are extremely irregular with respect to size and shape.
The pore size results obtained using digital image processing technique have been validated experimentally and compared with the hydraulic pore diameter measured by Hydrostatic Head Tester. The comparison between the results from the digital measurements of the surface porosity and the theoretically calculated from Equation (8) shows that there may be small differences between these values, except in the case of sample (E). In addition, based upon the digital
image results of this study, a standard procedure has been developed and demonstrated for predicting (PSD) in a plain woven fabric. In this procedure, peak height, relative half-peak width relative area under peak and degree of uniformity of effective pore size in the fabric structure are termined from actual measurements derived from image analysis technique. The tested fabric samples could be ranked in a decrease order successfully. A comparison of the peaks of the pore distributions with air permeability data indicates a correlation between the interfibre pore spaces and the air permeability. However, the interyarn porosity may sometimes be a significant factor.
References
1. Saville BP (2004) Physical Testing of Textiles Cambridge: Woodhead Publishing Limited, UK.
2. Kothari VK, Newton A (1974) The Air Permeability of Nonwoven Fabric. J Text Inst 65: 525-531.
3. Daukantiene V, Skarulskiene A (2005) Wear and hygienic properties of cotton velvet fabrics light industry- Fibrous materials, Proceedings of Radom international Scientific Conference Radom, Poland: 355-358.
4. Więcek B, Danych R, Kowalski K (2006) Air and water vapour permeadility in double-layered knitted fabrics with different raw materials. Fabrics & Textiles in Eastern Europe14: 77-80.
5. Burleigh EG, Wakeham JRH, Honold E, Skau EL (1949) Pore-size distribution in textiles. Text Res J 19: 547-555.
6. Castellini C, Francini F, Longebradi G, Tribilli B, Sansoni P (1996) On-line textile quality control using optical fourier transforms. Optics and Lasers in Engineering 24: 19-32.
7. Thorr F, Adolphe D, Drean JY (1997) Study of nonwovens mass reorganization under tensile stress thanks to a new optical sensor and image analysis. Sensors and Actuators 62: 565-570.
8. Cay A, Vassiliadis S, Rangoussi M, Tarakucglu I (2005) On the use of image processing techniques for the estimation of the porosity of textile fabrics. International Journal of Signal Processing 1: 51-54.
9. Dubrovski PD (2000) Volume porosity of woven fabrics. Text Res J 70: 915-919.
10. Dubrovski PD (2001) A geometrical method to predict the macro porosity of woven fabrics. J Text Inst 92: 288-298.
11. Militky J, Vik M, Vikova M, Kremenakova D () Influence of fabric construction on their porosity and air permeability.
12. Cay A, Vassiliadis S, Rangoussi M, Tarakçıolu I (2004) On the use of image processing techniques for the estimation of the porosity of textile fabrics. Int J Signal Process 1: 51-54.
13. Lord E (1954) Air flow through plugs of textile fibres Part (1): General flow relations. Journal of Textiles Institute 46: 191-213.
14. Barrer RM (1948) Disc.Faraday Soc 3.
15. Das B, Das A, Kothari VK, Fanqueiro R (2011) Development of mathematical model to predict vertical wicking behavior. Part (I): Flow through yarn. The Journal of the Textile Institute 102: 957-970.
16. Miller B, Tyomkin I (1983) Spontaneous Transplaner Uptake of Liquids by Fabrics. Text Res J 53: 706-712.
17. Abou-Taleb HA (1993) Principles of Textile Physics in Fabrics: 40.
18. Lai TP (1985) Practical Fiber Physical Chemistry. Tai-Long Publishing Co, Taipei, ROC.
19. Lin CA (1983) Report on Formulation of Weight Consumption of Material Yarn for Woven Fabrics Foundation of Textile Union, ROC.
20. Lin JJ (2003) A Genetic Algorithm for Searching Weaving Parameters for Woven Fabrics. Text Res J 73: 105-112.
21. Abou- Talab HA, Al- Fowaty H, Sakr A (2015) Theoretical Prediction of Overall Porosity of Terry Woven Fabrics. Textile Science & Engineering 5: 1-7.
22. Xu G, Wang F (2005) Prediction of the Permeability of Woven Fabrics. J Ind Textile 34: 243-254.

Citation: Ragab A, Fouda A, El-Deeb H, Abou-Taleb H (2017) Determination of Pore Size, Porosity and Pore Size Distribution of Woven Structures by Image Analysis Techniques. J Textile Sci Eng 7: 314. doi: 10.4172/2165-8064.1000314
Page 9 of 9
Volume 7 • Issue 4 • 1000314J Textile Sci Eng, an open access journalISSN: 2165-8064
23. Oqulata RT (2006) Air Permeability of Woven Fabrics. JTATM 5: 1-10.
24. Lord J (1954) The bubble pressure test for the measurement of the pore size of fabrics. Part (II): The application of the bubble pressure test to a study of the sealing of clo Cotton cloths when wetted. J Text Inst 45: 380-389.
25. Miller B, Tyomkin I (1994) Liquid porosimetry -new methodology and applications. J Calloid Interface Science: 163-170.
26. Xie S (2002) Characterization of interyarn pore size and its distribution in plain woven fabrics. Master Thesis, Raleigh.