Download brochure - PANalytical
20
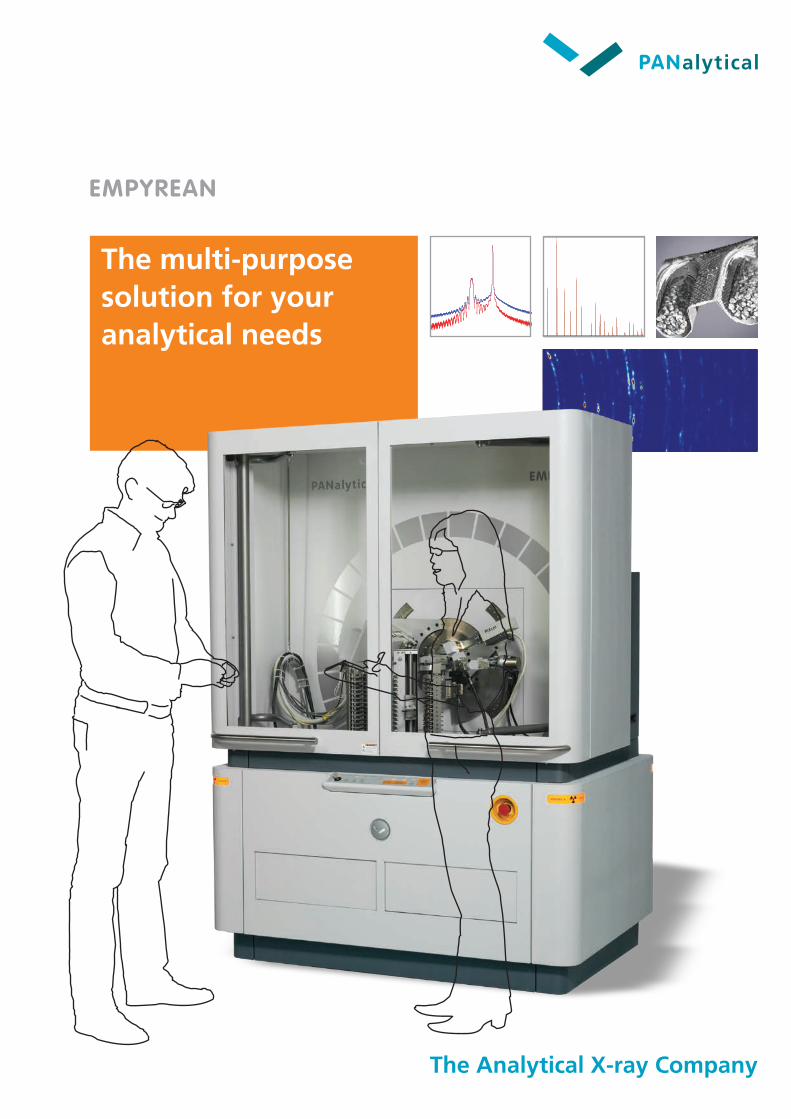
The multi-purpose solution for your analytical needs EMPYREAN The Analytical X-ray Company
Transcript of Download brochure - PANalytical
1
The multi-purposesolution for your analytical needs
EMPYREAN
The Analytical X-ray Company
-6000 -4000 -2000 0 2000 4000 600010
100
1K
10K
100K
1M
10M
100M
Omega/2Theta [s]
Inte
nsi
ty [
cou
nts
]
Position 2Theta [deg.] (Copper (Cu))
Inte
nsi
ty [
cou
nts
]
4000
3000
2000
1000
020 30 40 50 60 70 80 90 100 110 120 130 140
Inte
nsi
ty [
cou
nts
]
2000
1000
0
21 21.20 21.40 21.60
Position 2Theta [deg.] (Copper Cu))
FWHM = 0.026 °2θ
2
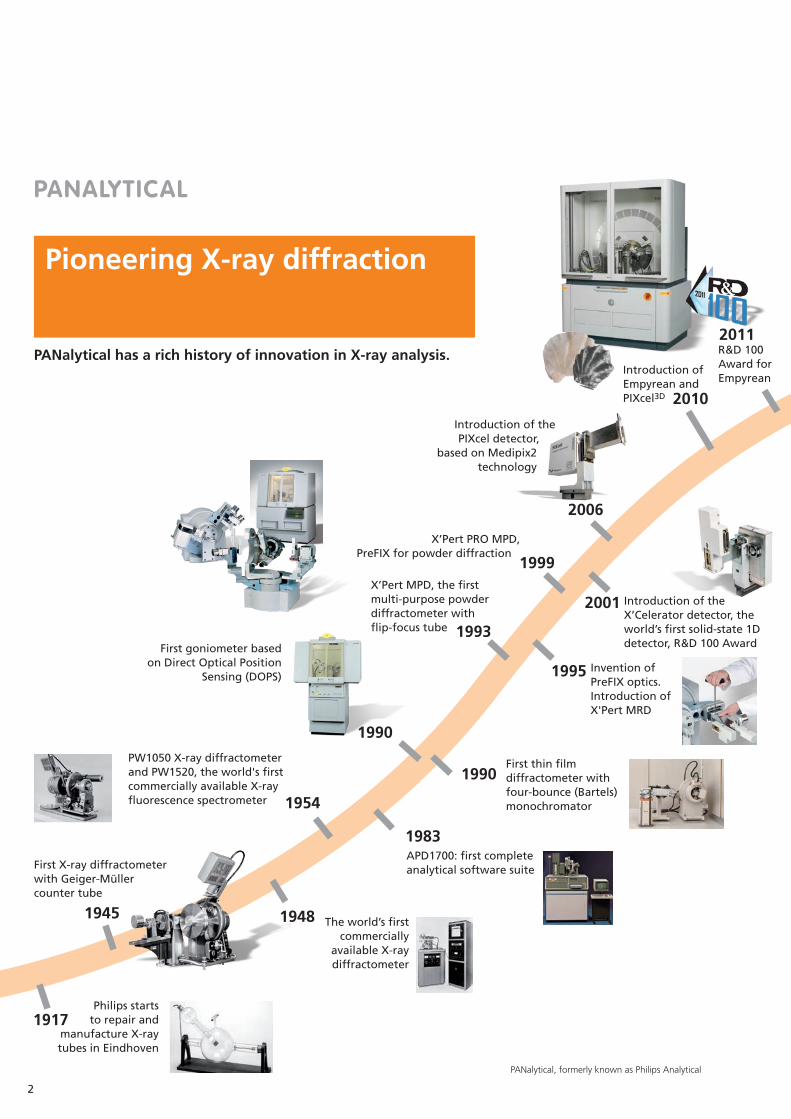
Pioneering X-ray diffraction
PANALYTICAL
2006
PANalytical has a rich history of innovation in X-ray analysis.
PANalytical, formerly known as Philips Analytical
Introduction of the PIXcel detector,
based on Medipix2 technology
Introduction of Empyrean and PIXcel3D 2010
X’Pert PRO MPD, PreFIX for powder diffraction
X’Pert MPD, the first multi-purpose powder diffractometer with flip-focus tube
1999
1993
Invention of PreFIX optics. Introduction of X'Pert MRD
Introduction of the X’Celerator detector, the world’s first solid-state 1D detector, R&D 100 Award
2001
1995
1990
First goniometer based on Direct Optical Position
Sensing (DOPS)
Philips starts to repair and
manufacture X-ray tubes in Eindhoven
First X-ray diffractometer with Geiger-Müller counter tube
The world’s first commercially
available X-ray diffractometer
PW1050 X-ray diffractometer and PW1520, the world's first commercially available X-ray fluorescence spectrometer
APD1700: first complete analytical software suite
1917
1945
1954
1983
1948
First thin film diffractometer with four-bounce (Bartels) monochromator
1990
2011R&D 100 Award for Empyrean
3
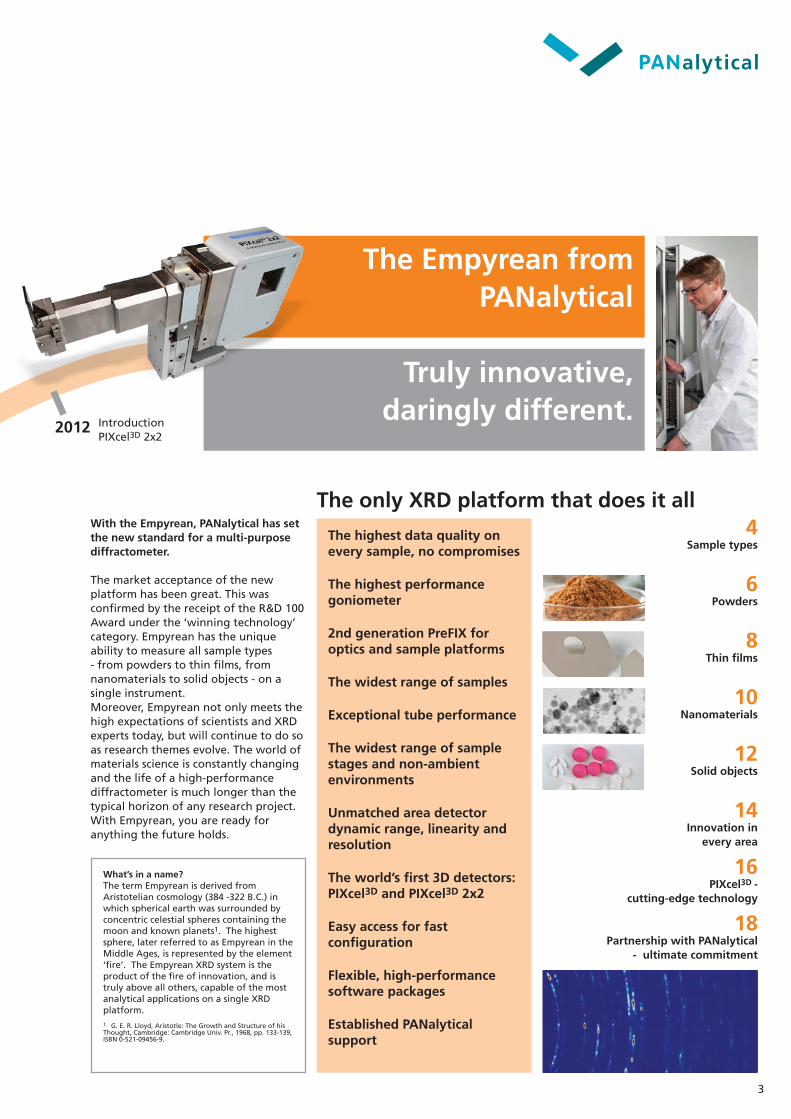
Truly innovative, daringly different.
The Empyrean from PANalytical
The highest data quality on every sample, no compromises
The highest performance goniometer
2nd generation PreFIX for optics and sample platforms
The widest range of samples
Exceptional tube performance
The widest range of sample stages and non-ambient environments
Unmatched area detector dynamic range, linearity and resolution
The world’s first 3D detectors: PIXcel3D and PIXcel3D 2x2
Easy access for fast configuration
Flexible, high-performance software packages
Established PANalytical support
4Sample types
6Powders
8Thin films
10Nanomaterials
12Solid objects
14Innovation in
every area
16PIXcel3D -
cutting-edge technology
18Partnership with PANalytical
- ultimate commitment
What’s in a name?The term Empyrean is derived from Aristotelian cosmology (384 -322 B.C.) in which spherical earth was surrounded by concentric celestial spheres containing the moon and known planets1. The highest sphere, later referred to as Empyrean in the Middle Ages, is represented by the element ‘fire’. The Empyrean XRD system is the product of the fire of innovation, and is truly above all others, capable of the most analytical applications on a single XRD platform.1. G. E. R. Lloyd, Aristotle: The Growth and Structure of his Thought, Cambridge: Cambridge Univ. Pr., 1968, pp. 133-139, ISBN 0-521-09456-9.
Introduction PIXcel3D 2x2
With the Empyrean, PANalytical has set the new standard for a multi-purpose diffractometer.
The market acceptance of the new platform has been great. This was confirmed by the receipt of the R&D 100 Award under the ‘winning technology’ category. Empyrean has the unique ability to measure all sample types - from powders to thin films, from nanomaterials to solid objects - on a single instrument. Moreover, Empyrean not only meets the high expectations of scientists and XRD experts today, but will continue to do so as research themes evolve. The world of materials science is constantly changing and the life of a high-performance diffractometer is much longer than the typical horizon of any research project. With Empyrean, you are ready for anything the future holds.
The only XRD platform that does it all
2012
4
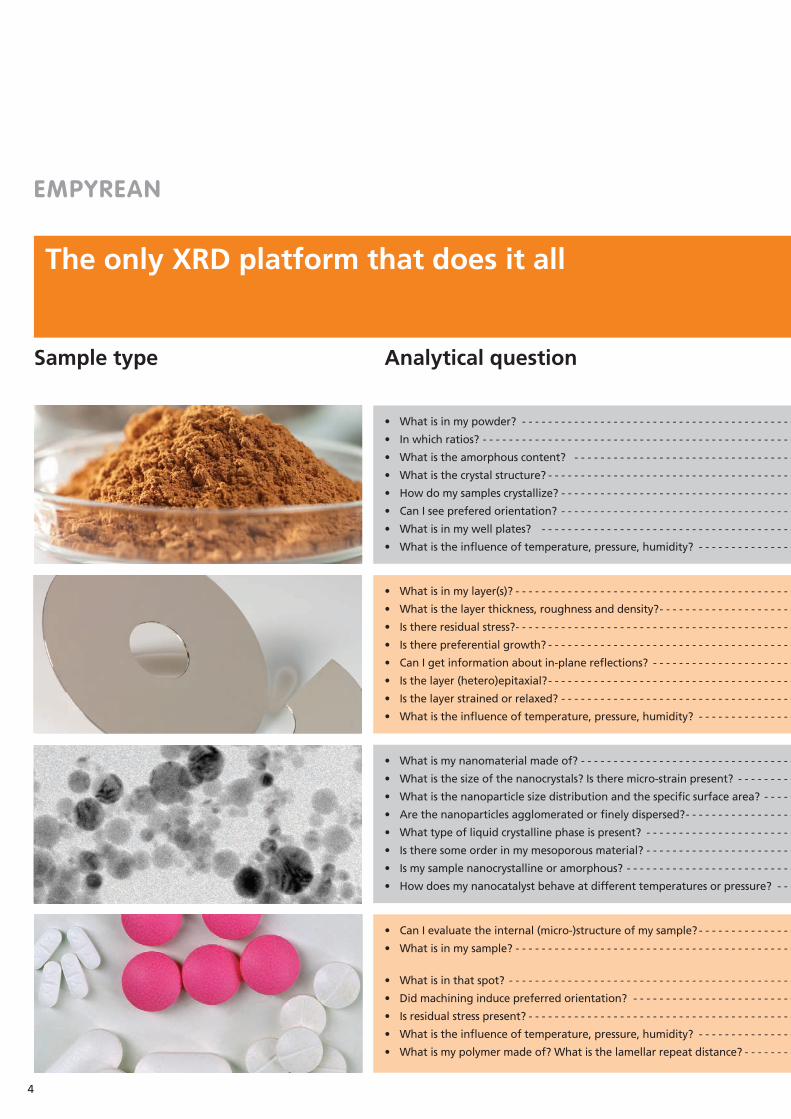
The only XRD platform that does it all
EMPYREAN
• Whatisinmypowder? - - - - - - - - - - - - - - - - - - - - - - - - - - - - - - - - - - - - - - - - - - - - - - - - - - - - - - -
• Inwhichratios? - - - - - - - - - - - - - - - - - - - - - - - - - - - - - - - - - - - - - - - - - - - - - - - - - - - - - - - - - - - - -
• Whatistheamorphouscontent? - - - - - - - - - - - - - - - - - - - - - - - - - - - - - - - - - - - - - - - - - - - - - - -
• Whatisthecrystalstructure? - - - - - - - - - - - - - - - - - - - - - - - - - - - - - - - - - - - - - - - - - - - - - - - - - - -
• Howdomysamplescrystallize? - - - - - - - - - - - - - - - - - - - - - - - - - - - - - - - - - - - - - - - - - - - - - - - - -
• CanIseepreferedorientation? - - - - - - - - - - - - - - - - - - - - - - - - - - - - - - - - - - - - - - - - - - - - - - - - -
• Whatisinmywellplates? - - - - - - - - - - - - - - - - - - - - - - - - - - - - - - - - - - - - - - - - - - - - - - - - - - - -
• Whatistheinfluenceoftemperature,pressure,humidity? - - - - - - - - - - - - - - - - - - - - - - - - - - - -
• Whatismynanomaterialmadeof? - - - - - - - - - - - - - - - - - - - - - - - - - - - - - - - - - - - - - - - - - - - - - -
• Whatisthesizeofthenanocrystals?Istheremicro-strainpresent? - - - - - - - - - - - - - - - - - - - - - -
• Whatisthenanoparticlesizedistributionandthespecificsurfacearea? - - - - - - - - - - - - - - - - - -
• Arethenanoparticlesagglomeratedorfinelydispersed? - - - - - - - - - - - - - - - - - - - - - - - - - - - - - -
• Whattypeofliquidcrystallinephaseispresent? - - - - - - - - - - - - - - - - - - - - - - - - - - - - - - - - - - - -
• Istheresomeorderinmymesoporousmaterial? - - - - - - - - - - - - - - - - - - - - - - - - - - - - - - - - - - - -
• Ismysamplenanocrystallineoramorphous? - - - - - - - - - - - - - - - - - - - - - - - - - - - - - - - - - - - - - - -
• Howdoesmynanocatalystbehaveatdifferenttemperaturesorpressure? - - - - - - - - - - - - - - - -
• Whatisinmylayer(s)? - - - - - - - - - - - - - - - - - - - - - - - - - - - - - - - - - - - - - - - - - - - - - - - - - - - - - - - -
• Whatisthelayerthickness,roughnessanddensity? - - - - - - - - - - - - - - - - - - - - - - - - - - - - - - - - - -
• Isthereresidualstress? - - - - - - - - - - - - - - - - - - - - - - - - - - - - - - - - - - - - - - - - - - - - - - - - - - - - - - - -
• Istherepreferentialgrowth? - - - - - - - - - - - - - - - - - - - - - - - - - - - - - - - - - - - - - - - - - - - - - - - - - - -
• CanIgetinformationaboutin-planereflections? - - - - - - - - - - - - - - - - - - - - - - - - - - - - - - - - - - -
• Isthelayer(hetero)epitaxial? - - - - - - - - - - - - - - - - - - - - - - - - - - - - - - - - - - - - - - - - - - - - - - - - - - -
• Isthelayerstrainedorrelaxed? - - - - - - - - - - - - - - - - - - - - - - - - - - - - - - - - - - - - - - - - - - - - - - - - -
• Whatistheinfluenceoftemperature,pressure,humidity? - - - - - - - - - - - - - - - - - - - - - - - - - - - -
• CanIevaluatetheinternal(micro-)structureofmysample? - - - - - - - - - - - - - - - - - - - - - - - - - - - -
• Whatisinmysample? - - - - - - - - - - - - - - - - - - - - - - - - - - - - - - - - - - - - - - - - - - - - - - - - - - - - - - - -
• Whatisinthatspot? - - - - - - - - - - - - - - - - - - - - - - - - - - - - - - - - - - - - - - - - - - - - - - - - - - - - - - - - -
• Didmachininginducepreferredorientation? - - - - - - - - - - - - - - - - - - - - - - - - - - - - - - - - - - - - - -
• Isresidualstresspresent? - - - - - - - - - - - - - - - - - - - - - - - - - - - - - - - - - - - - - - - - - - - - - - - - - - - - - -
• Whatistheinfluenceoftemperature,pressure,humidity? - - - - - - - - - - - - - - - - - - - - - - - - - - - -
• Whatismypolymermadeof?Whatisthelamellarrepeatdistance? - - - - - - - - - - - - - - - - - - - - -
Sample type Analytical question Application Example Typical result configuration
5
The only XRD platform that does it all Empyrean delivers the best quality data, on every sample type
• Whatisinmypowder? - - - - - - - - - - - - - - - - - - - - - - - - - - - - - - - - - - - - - - - - - - - - - - - - - - - - - - -
• Inwhichratios? - - - - - - - - - - - - - - - - - - - - - - - - - - - - - - - - - - - - - - - - - - - - - - - - - - - - - - - - - - - - -
• Whatistheamorphouscontent? - - - - - - - - - - - - - - - - - - - - - - - - - - - - - - - - - - - - - - - - - - - - - - -
• Whatisthecrystalstructure? - - - - - - - - - - - - - - - - - - - - - - - - - - - - - - - - - - - - - - - - - - - - - - - - - - -
• Howdomysamplescrystallize? - - - - - - - - - - - - - - - - - - - - - - - - - - - - - - - - - - - - - - - - - - - - - - - - -
• CanIseepreferedorientation? - - - - - - - - - - - - - - - - - - - - - - - - - - - - - - - - - - - - - - - - - - - - - - - - -
• Whatisinmywellplates? - - - - - - - - - - - - - - - - - - - - - - - - - - - - - - - - - - - - - - - - - - - - - - - - - - - -
• Whatistheinfluenceoftemperature,pressure,humidity? - - - - - - - - - - - - - - - - - - - - - - - - - - - -
• Whatismynanomaterialmadeof? - - - - - - - - - - - - - - - - - - - - - - - - - - - - - - - - - - - - - - - - - - - - - -
• Whatisthesizeofthenanocrystals?Istheremicro-strainpresent? - - - - - - - - - - - - - - - - - - - - - -
• Whatisthenanoparticlesizedistributionandthespecificsurfacearea? - - - - - - - - - - - - - - - - - -
• Arethenanoparticlesagglomeratedorfinelydispersed? - - - - - - - - - - - - - - - - - - - - - - - - - - - - - -
• Whattypeofliquidcrystallinephaseispresent? - - - - - - - - - - - - - - - - - - - - - - - - - - - - - - - - - - - -
• Istheresomeorderinmymesoporousmaterial? - - - - - - - - - - - - - - - - - - - - - - - - - - - - - - - - - - - -
• Ismysamplenanocrystallineoramorphous? - - - - - - - - - - - - - - - - - - - - - - - - - - - - - - - - - - - - - - -
• Howdoesmynanocatalystbehaveatdifferenttemperaturesorpressure? - - - - - - - - - - - - - - - -
• Whatisinmylayer(s)? - - - - - - - - - - - - - - - - - - - - - - - - - - - - - - - - - - - - - - - - - - - - - - - - - - - - - - - -
• Whatisthelayerthickness,roughnessanddensity? - - - - - - - - - - - - - - - - - - - - - - - - - - - - - - - - - -
• Isthereresidualstress? - - - - - - - - - - - - - - - - - - - - - - - - - - - - - - - - - - - - - - - - - - - - - - - - - - - - - - - -
• Istherepreferentialgrowth? - - - - - - - - - - - - - - - - - - - - - - - - - - - - - - - - - - - - - - - - - - - - - - - - - - -
• CanIgetinformationaboutin-planereflections? - - - - - - - - - - - - - - - - - - - - - - - - - - - - - - - - - - -
• Isthelayer(hetero)epitaxial? - - - - - - - - - - - - - - - - - - - - - - - - - - - - - - - - - - - - - - - - - - - - - - - - - - -
• Isthelayerstrainedorrelaxed? - - - - - - - - - - - - - - - - - - - - - - - - - - - - - - - - - - - - - - - - - - - - - - - - -
• Whatistheinfluenceoftemperature,pressure,humidity? - - - - - - - - - - - - - - - - - - - - - - - - - - - -
• CanIevaluatetheinternal(micro-)structureofmysample? - - - - - - - - - - - - - - - - - - - - - - - - - - - -
• Whatisinmysample? - - - - - - - - - - - - - - - - - - - - - - - - - - - - - - - - - - - - - - - - - - - - - - - - - - - - - - - -
• Whatisinthatspot? - - - - - - - - - - - - - - - - - - - - - - - - - - - - - - - - - - - - - - - - - - - - - - - - - - - - - - - - -
• Didmachininginducepreferredorientation? - - - - - - - - - - - - - - - - - - - - - - - - - - - - - - - - - - - - - -
• Isresidualstresspresent? - - - - - - - - - - - - - - - - - - - - - - - - - - - - - - - - - - - - - - - - - - - - - - - - - - - - - -
• Whatistheinfluenceoftemperature,pressure,humidity? - - - - - - - - - - - - - - - - - - - - - - - - - - - -
• Whatismypolymermadeof?Whatisthelamellarrepeatdistance? - - - - - - - - - - - - - - - - - - - - -
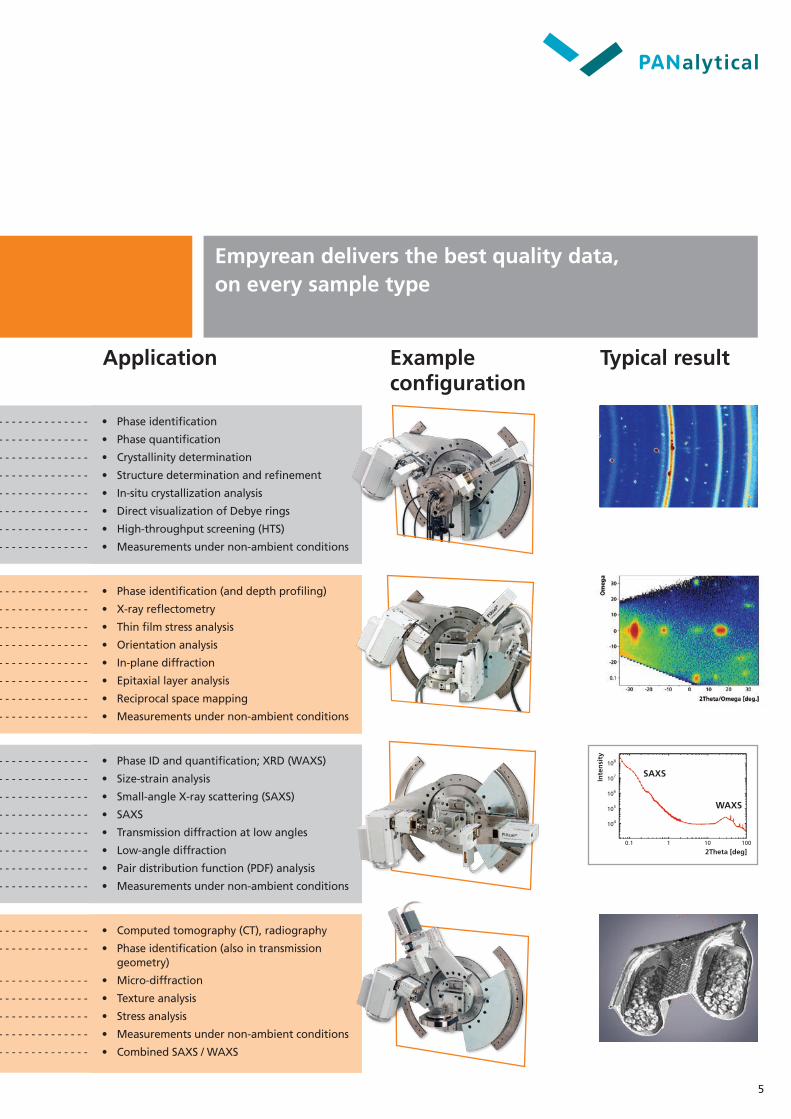
• Phaseidentification
• Phasequantification
• Crystallinitydetermination
• Structuredeterminationandrefinement
• In-situcrystallizationanalysis
• DirectvisualizationofDebyerings
• High-throughputscreening(HTS)
• Measurementsundernon-ambientconditions
• PhaseIDandquantification;XRD(WAXS)
• Size-strainanalysis
• Small-angleX-rayscattering(SAXS)
• SAXS
• Transmissiondiffractionatlowangles
• Low-anglediffraction
• Pairdistributionfunction(PDF)analysis
• Measurementsundernon-ambientconditions
• Phaseidentification(anddepthprofiling)
• X-rayreflectometry
• Thinfilmstressanalysis
• Orientationanalysis
• In-planediffraction
• Epitaxiallayeranalysis
• Reciprocalspacemapping
• Measurementsundernon-ambientconditions
• Computedtomography(CT),radiography
• Phaseidentification(alsointransmissiongeometry)
• Micro-diffraction
• Textureanalysis
• Stressanalysis
• Measurementsundernon-ambientconditions
• CombinedSAXS/WAXS
Sample type Analytical question Application Example Typical result configuration
0
0.15
0.10
0.15
0 5 10 15 20
8 nm 14 nm
5 nm
Size
dis
trib
uti
on
Particle radius [nm]
Colloidal silica, 0.8 Vol.%Trimodal size distribution
108
107
106
105
104
0.1 1 10 100
2Theta [deg]
Inte
nsi
ty
SAXS
WAXS
6
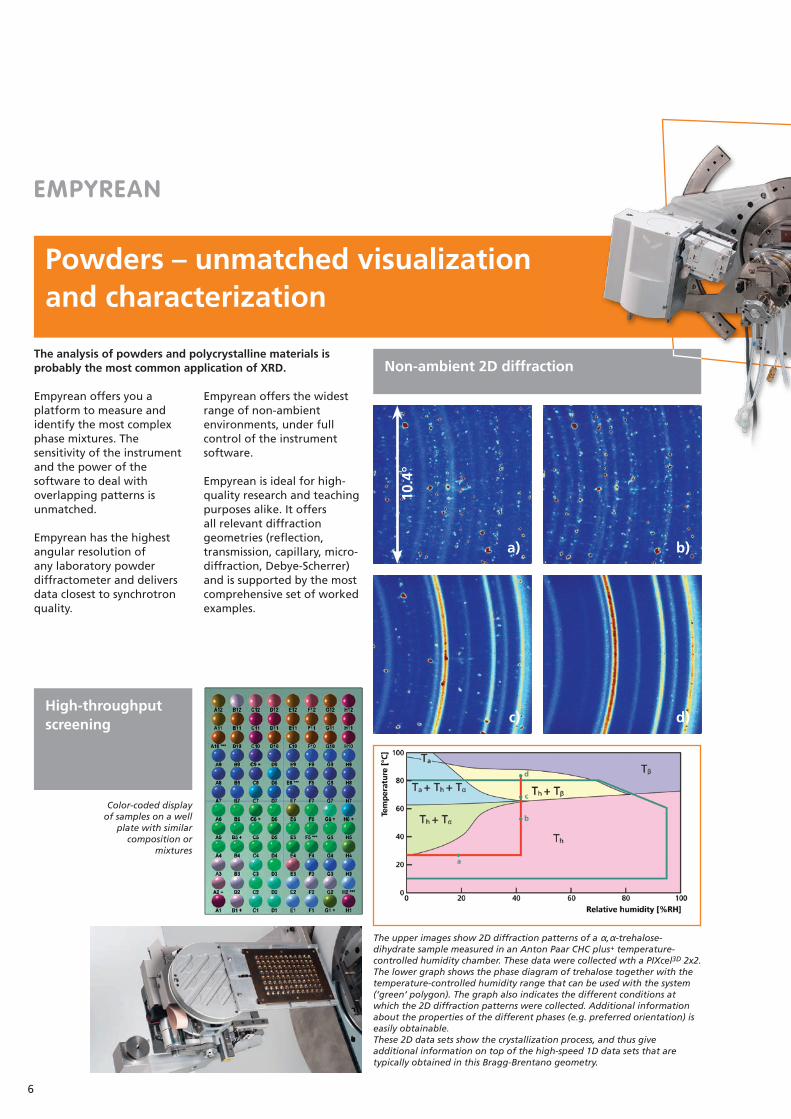
Empyrean offers you a platform to measure andidentify the most complexphase mixtures. Thesensitivity of the instrumentand the power of thesoftware to deal withoverlapping patterns isunmatched.
Empyrean has the highestangular resolution ofany laboratory powderdiffractometer and deliversdata closest to synchrotronquality.
Empyrean offers the widestrange of non-ambientenvironments, under fullcontrol of the instrumentsoftware.
Empyrean is ideal for high-quality research and teaching purposes alike. It offersall relevant diffractiongeometries (reflection,transmission, capillary, micro-diffraction, Debye-Scherrer) and is supported by the most comprehensive set of worked examples.
The upper images show 2D diffraction patterns of a α,α-trehalose-dihydrate sample measured in an Anton Paar CHC plus+ temperature-controlled humidity chamber. These data were collected wth a PIXcel3D 2x2.The lower graph shows the phase diagram of trehalose together with the temperature-controlled humidity range that can be used with the system (‘green‘ polygon). The graph also indicates the different conditions at which the 2D diffraction patterns were collected. Additional information about the properties of the different phases (e.g. preferred orientation) is easily obtainable.These 2D data sets show the crystallization process, and thus give additional information on top of the high-speed 1D data sets that are typically obtained in this Bragg-Brentano geometry.
Color-coded display of samples on a well
plate with similar composition or
mixtures
High-throughput screening
The analysis of powders and polycrystalline materials isprobably the most common application of XRD. Non-ambient 2D diffraction
EMPYREAN
Powders – unmatched visualization and characterization
a)
10.4
°
c)
b)
d)
7
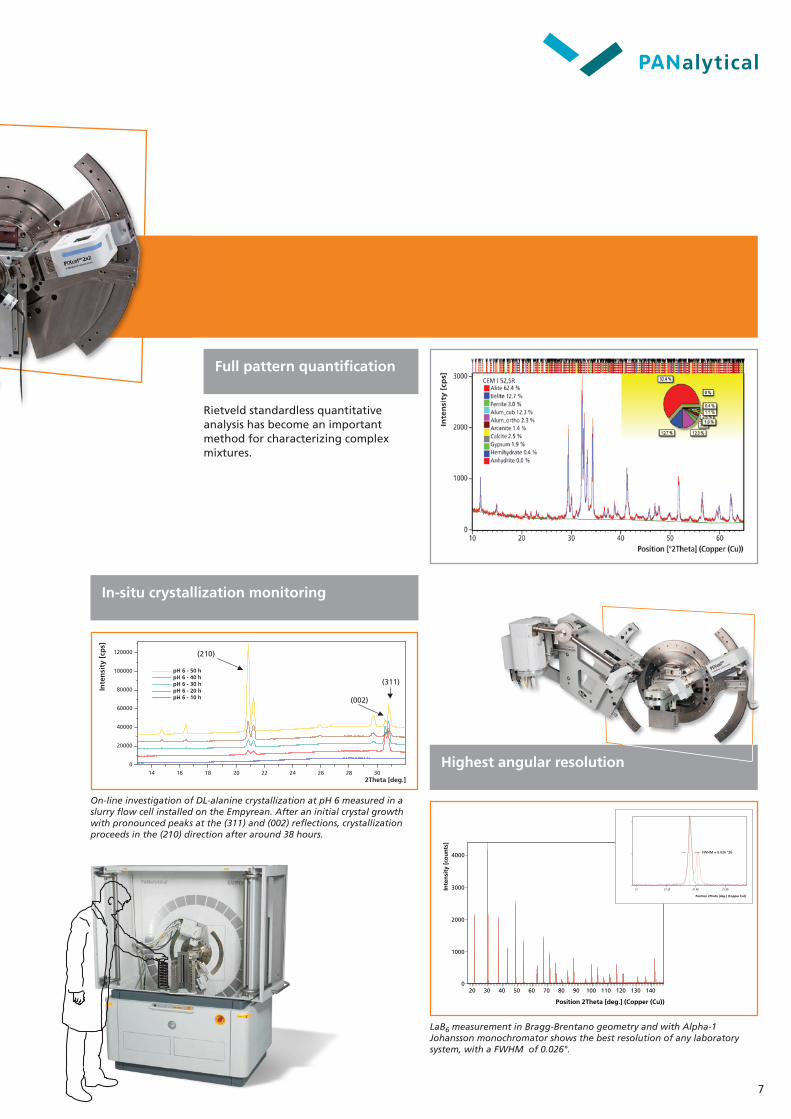
On-line investigation of DL-alanine crystallization at pH 6 measured in a slurry flow cell installed on the Empyrean. After an initial crystal growth with pronounced peaks at the (311) and (002) reflections, crystallization proceeds in the (210) direction after around 38 hours.
LaB6 measurement in Bragg-Brentano geometry and with Alpha-1 Johansson monochromator shows the best resolution of any laboratory system, with a FWHM of 0.026°.
Full pattern quantification
In-situ crystallization monitoring
Rietveld standardless quantitative analysis has become an important method for characterizing complex mixtures.
Powders – unmatched visualization and characterization
14 16 18 20 22 24 26 28 30
20000
0
40000
60000
80000
100000
120000 (210)
(002)
(311)
Inte
nsi
ty [
cps]
2Theta [deg.]
pH 6 - 50 hpH 6 - 40 hpH 6 - 30 hpH 6 - 20 hpH 6 - 10 h
Position 2Theta [deg.] (Copper (Cu))
Inte
nsi
ty [
cou
nts
]
4000
3000
2000
1000
020 30 40 50 60 70 80 90 100 110 120 130 140
Inte
nsi
ty [
cou
nts
]
2000
1000
0
21 21.20 21.40 21.60
Position 2Theta [deg.] (Copper Cu))
FWHM = 0.026 °2θ
Highest angular resolution
8
Thin films – discover all properties
EMPYREAN
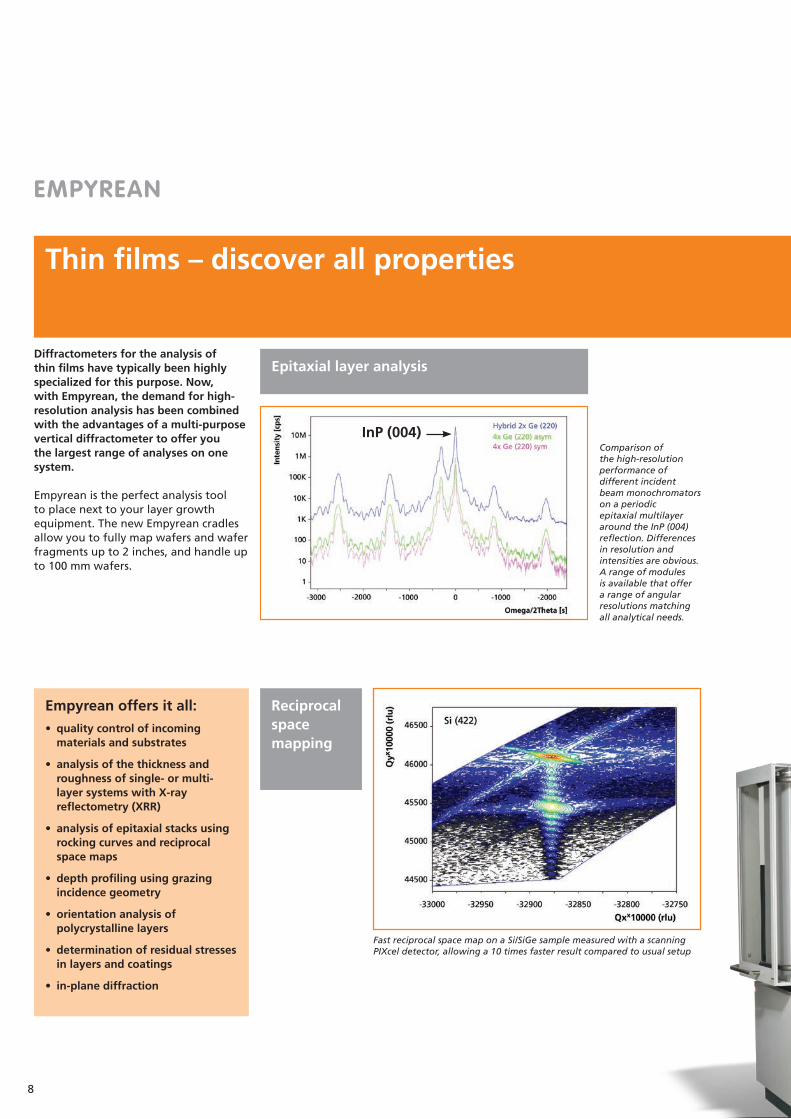
Diffractometers for the analysis ofthin films have typically been highly specialized for this purpose. Now, with Empyrean, the demand for high- resolution analysis has been combined with the advantages of a multi-purpose vertical diffractometer to offer you the largest range of analyses on one system.
Empyrean is the perfect analysis tool to place next to your layer growth equipment. The new Empyrean cradles allow you to fully map wafers and wafer fragments up to 2 inches, and handle up to 100 mm wafers.
Comparison ofthe high-resolutionperformance ofdifferent incidentbeam monochromatorson a periodicepitaxial multilayeraround the InP (004)reflection. Differencesin resolution andintensities are obvious.A range of modulesis available that offera range of angularresolutions matchingall analytical needs.
Reciprocal space mapping
Epitaxial layer analysis
Empyrean offers it all:
• qualitycontrolofincomingmaterials and substrates
• analysisofthethicknessandroughness of single- or multi-layer systems with X-ray reflectometry (XRR)
• analysisofepitaxialstacksusingrocking curves and reciprocal space maps
• depthprofilingusinggrazingincidence geometry
• orientationanalysisofpolycrystalline layers
• determinationofresidualstressesin layers and coatings
• in-planediffraction
Fast reciprocal space map on a Si/SiGe sample measured with a scanning PIXcel detector, allowing a 10 times faster result compared to usual setup
InP (004)
9
Thin films – discover all properties
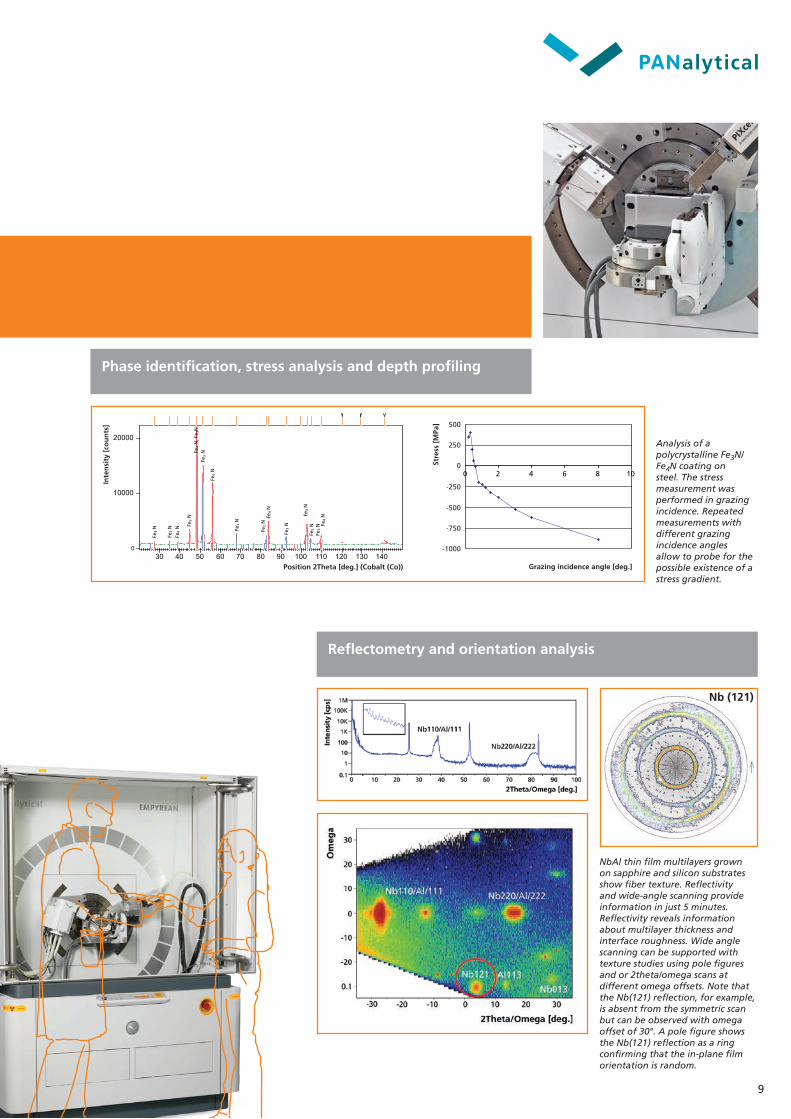
Analysis of a polycrystalline Fe3N/Fe4N coating on steel. The stress measurement was performed in grazing incidence. Repeated measurements with different grazing incidence angles allow to probe for the possible existence of a stress gradient.
NbAl thin film multilayers grownon sapphire and silicon substratesshow fiber texture. Reflectivityand wide-angle scanning provideinformation in just 5 minutes.Reflectivity reveals information about multilayer thickness and interface roughness. Wide angle scanning can be supported with texture studies using pole figures and or 2theta/omega scans at different omega offsets. Note that the Nb(121) reflection, for example, is absent from the symmetric scan but can be observed with omega offset of 30°. A pole figure shows the Nb(121) reflection as a ring confirming that the in-plane film orientation is random.
Reflectometry and orientation analysis
Phase identification, stress analysis and depth profiling
30 40 50 60 70 80 90 100 110 120 130 1400
10000
20000
Fe4
N, F
e 3N
Fe4
N
Fe4
N
Fe4
N
Fe4
N
Fe4
N
Fe4
N
Fe3
N
Fe3
N
Fe3
N
Fe3
N
Fe3
NFe
3 N
Fe3
N
Fe3
N
Inte
nsi
ty [
cou
nts
]
Position 2Theta [deg.] (Cobalt (Co))
0 2 4 6 8 10
500
250
0
-250
-500
-750
-1000
Grazing incidence angle [deg.]
Stre
ss [
MPa
]
Nb (121)
10
Nanomaterials – structural characterizationon different length scales
EMPYREAN
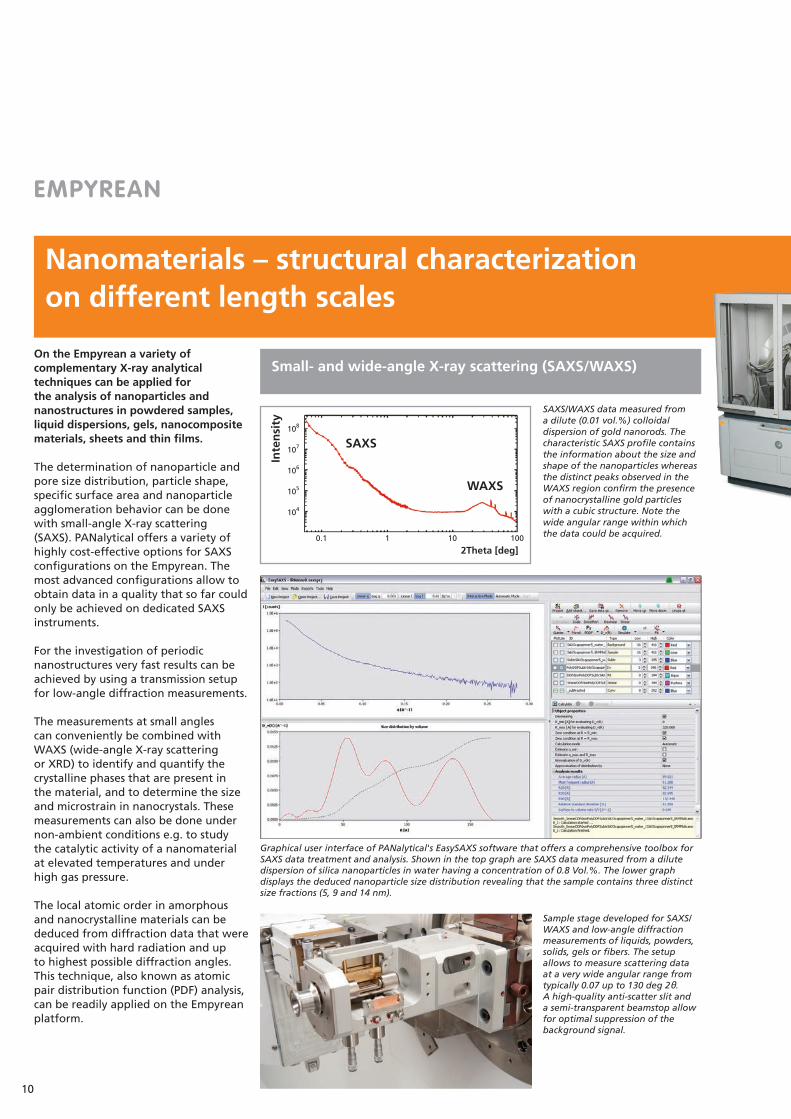
On the Empyrean a variety of complementary X-ray analytical techniques can be applied for the analysis of nanoparticles and nanostructures in powdered samples, liquid dispersions, gels, nanocomposite materials, sheets and thin films.
The determination of nanoparticle and pore size distribution, particle shape, specific surface area and nanoparticle agglomeration behavior can be done with small-angle X-ray scattering (SAXS). PANalytical offers a variety of highly cost-effective options for SAXS configurations on the Empyrean. The most advanced configurations allow to obtain data in a quality that so far could only be achieved on dedicated SAXS instruments.
For the investigation of periodic nanostructures very fast results can be achieved by using a transmission setup for low-angle diffraction measurements.
The measurements at small angles can conveniently be combined with WAXS (wide-angle X-ray scattering or XRD) to identify and quantify the crystalline phases that are present in the material, and to determine the size and microstrain in nanocrystals. These measurements can also be done under non-ambient conditions e.g. to study the catalytic activity of a nanomaterial at elevated temperatures and under high gas pressure.
The local atomic order in amorphous and nanocrystalline materials can be deduced from diffraction data that were acquired with hard radiation and up to highest possible diffraction angles. This technique, also known as atomic pair distribution function (PDF) analysis, can be readily applied on the Empyrean platform.
Small- and wide-angle X-ray scattering (SAXS/WAXS)
SAXS/WAXS data measured from a dilute (0.01 vol.%) colloidal dispersion of gold nanorods. The characteristic SAXS profile contains the information about the size and shape of the nanoparticles whereas the distinct peaks observed in the WAXS region confirm the presence of nanocrystalline gold particles with a cubic structure. Note the wide angular range within which the data could be acquired.
108
107
106
105
104
0.1 1 10 100
2Theta [deg]
Inte
nsi
ty
SAXS
WAXS
Sample stage developed for SAXS/WAXS and low-angle diffraction measurements of liquids, powders, solids, gels or fibers. The setup allows to measure scattering data at a very wide angular range from typically 0.07 up to 130 deg 2θ. A high-quality anti-scatter slit and a semi-transparent beamstop allow for optimal suppression of the background signal.
Graphical user interface of PANalytical's EasySAXS software that offers a comprehensive toolbox for SAXS data treatment and analysis. Shown in the top graph are SAXS data measured from a dilute dispersion of silica nanoparticles in water having a concentration of 0.8 Vol.%. The lower graph displays the deduced nanoparticle size distribution revealing that the sample contains three distinct size fractions (5, 9 and 14 nm).
11
Nanomaterials – structural characterizationon different length scales
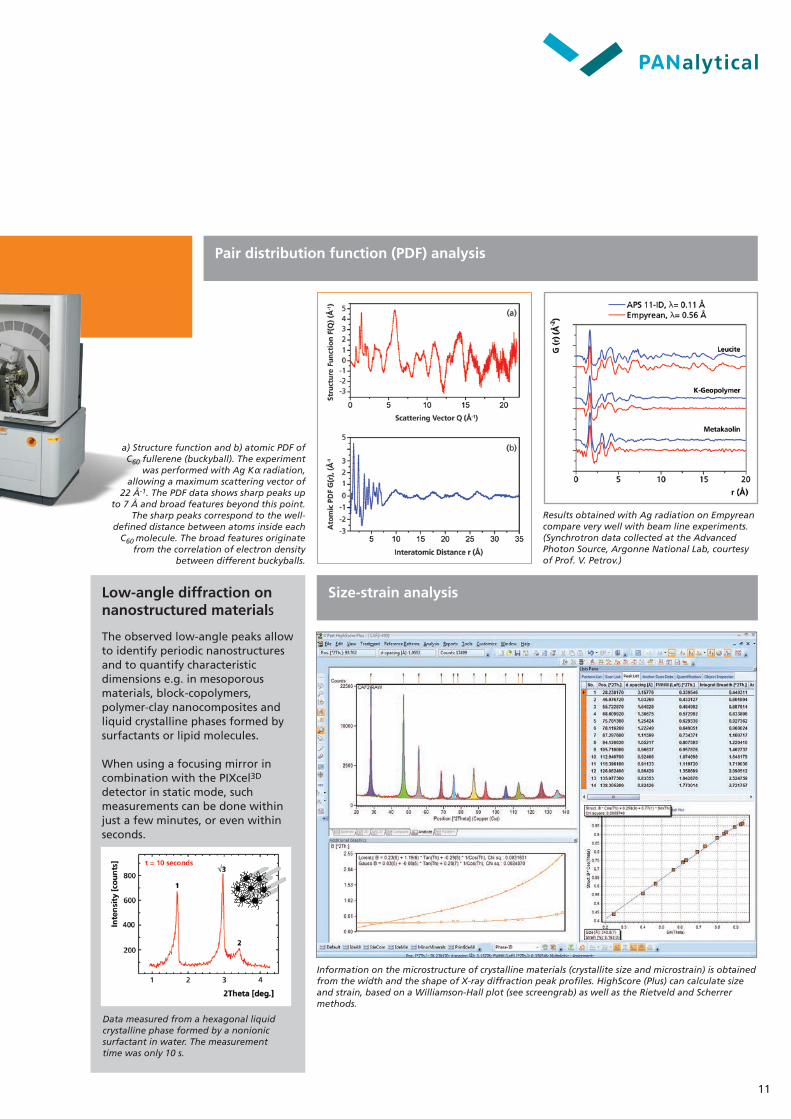
Pair distribution function (PDF) analysis
Size-strain analysis
Information on the microstructure of crystalline materials (crystallite size and microstrain) is obtained from the width and the shape of X-ray diffraction peak profiles. HighScore (Plus) can calculate size and strain, based on a Williamson-Hall plot (see screengrab) as well as the Rietveld and Scherrer methods.
Results obtained with Ag radiation on Empyrean compare very well with beam line experiments.(Synchrotron data collected at the Advanced Photon Source, Argonne National Lab, courtesy of Prof. V. Petrov.)
a) Structure function and b) atomic PDF of C60 fullerene (buckyball). The experiment
was performed with Ag Kα radiation, allowing a maximum scattering vector of
22 Å-1. The PDF data shows sharp peaks up to 7 Å and broad features beyond this point.
The sharp peaks correspond to the well- defined distance between atoms inside each
C60 molecule. The broad features originate from the correlation of electron density
between different buckyballs.
Low-angle diffraction on nanostructured materials
The observed low-angle peaks allow to identify periodic nanostructures and to quantify characteristic dimensions e.g. in mesoporous materials, block-copolymers, polymer-clay nanocomposites and liquid crystalline phases formed by surfactants or lipid molecules.
When using a focusing mirror in combination with the PIXcel3D
detector in static mode, such measurements can be done within just a few minutes, or even within seconds.
Data measured from a hexagonal liquid crystalline phase formed by a nonionic surfactant in water. The measurement time was only 10 s.
12
Solid objects – research without compromises
EMPYREAN
For particular applications samples must be analyzed without any sample preparation.
Examples are widespread: • geologicalsamples• pharmaceuticaltablets• engineeredcomponentssuchasball
bearings, joints and axles• polymersandpolymer(nano)
composites
Empyrean can handle all of these samples.
For the phase identification of roughand irregularly shaped objects, parallel beam geometry is often used.PANalytical’s philosophy for this geometry is consistent with all our set-ups - optimize, not compromise.
Empyrean can also analyze large and heavy samples up to 10 kg, a unique capability for a flexible multi-purpose X-ray system. The 3-axes Empyrean cradle allows you to mount components of up to 2 kg, and measure preferred orientation (texture) and residual stress using the chi-tilt or omega-tilt method.
A further unique possibility withEmpyrean is to see inside small solidobjects without having to cut them, thanks to the possibility of performingcomputed tomography experiments.
Radiography, computed tomography and micro-diffraction
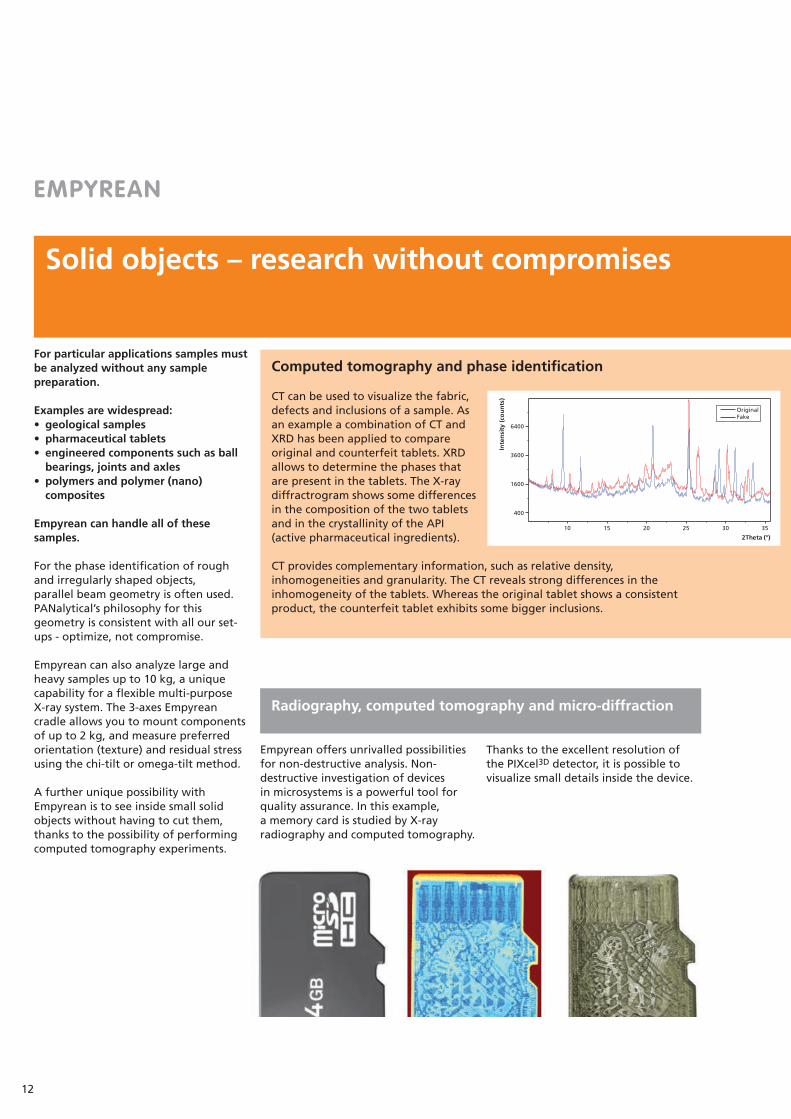
Computed tomography and phase identification
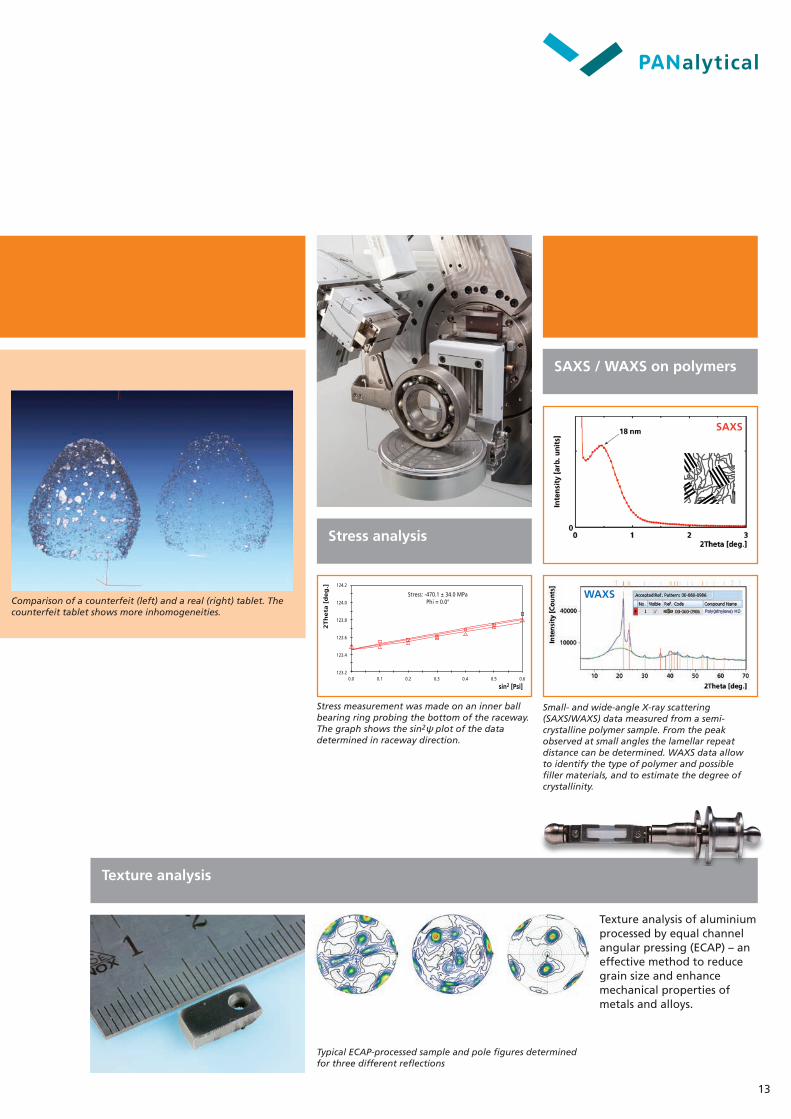
Empyrean offers unrivalled possibilities for non-destructive analysis. Non-destructive investigation of devices in microsystems is a powerful tool for quality assurance. In this example, a memory card is studied by X-ray radiography and computed tomography.
Thanks to the excellent resolution of the PIXcel3D detector, it is possible to visualize small details inside the device.
CT can be used to visualize the fabric, defects and inclusions of a sample. As an example a combination of CT and XRD has been applied to compare original and counterfeit tablets. XRD allows to determine the phases that are present in the tablets. The X-ray diffractrogram shows some differences in the composition of the two tablets and in the crystallinity of the API (active pharmaceutical ingredients).
CT provides complementary information, such as relative density, inhomogeneities and granularity. The CT reveals strong differences in the inhomogeneity of the tablets. Whereas the original tablet shows a consistent product, the counterfeit tablet exhibits some bigger inclusions.
10 15 20 25 30 35
2Theta (°)
400
1600
3600
6400
Inte
nsi
ty (c
ou
nts
)
OriginalFake
13
Solid objects – research without compromises
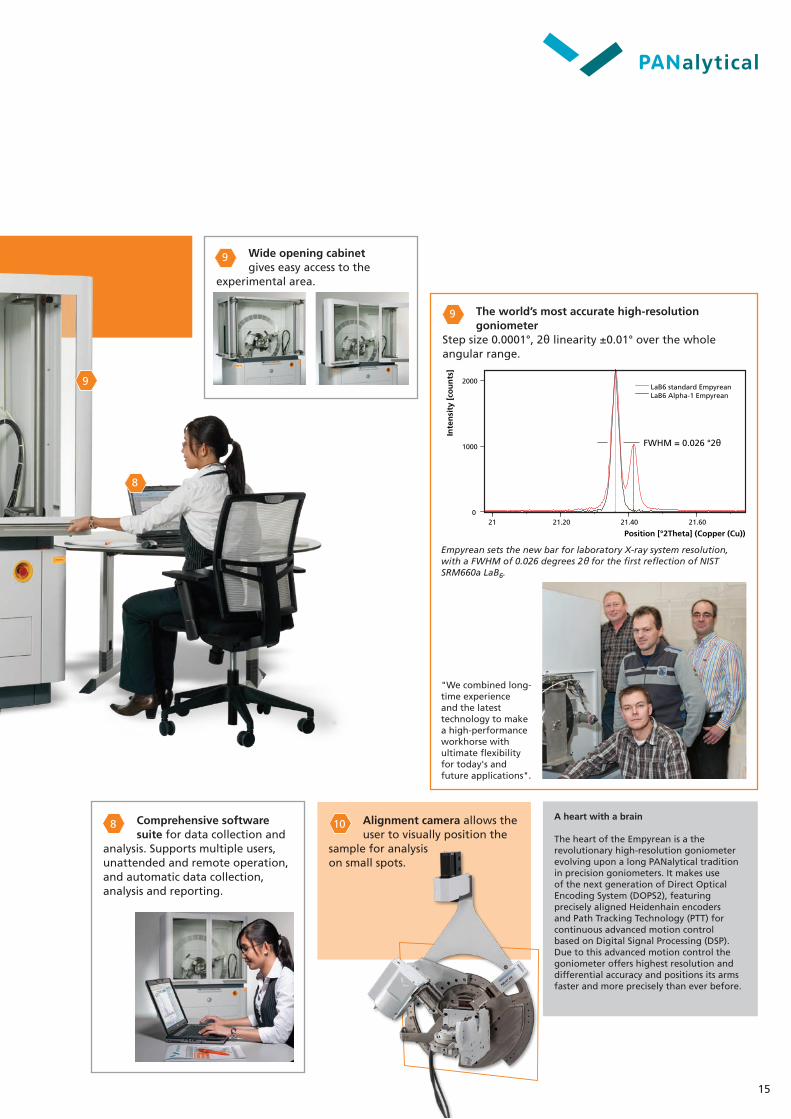
Typical ECAP-processed sample and pole figures determined for three different reflections
2T
he
ta [
de
g.]
sin2 [Psi]
124.2
124.0
123.8
123.6
123.4
123.20.0 0.1 0.2 0.3 0.4 0.5 0.6
Stress: -470.1 ± 34.0 MPaPhi = 0.0°
Stress analysis
Texture analysis
Stress measurement was made on an inner ball bearing ring probing the bottom of the raceway. The graph shows the sin2ψ plot of the data determined in raceway direction.
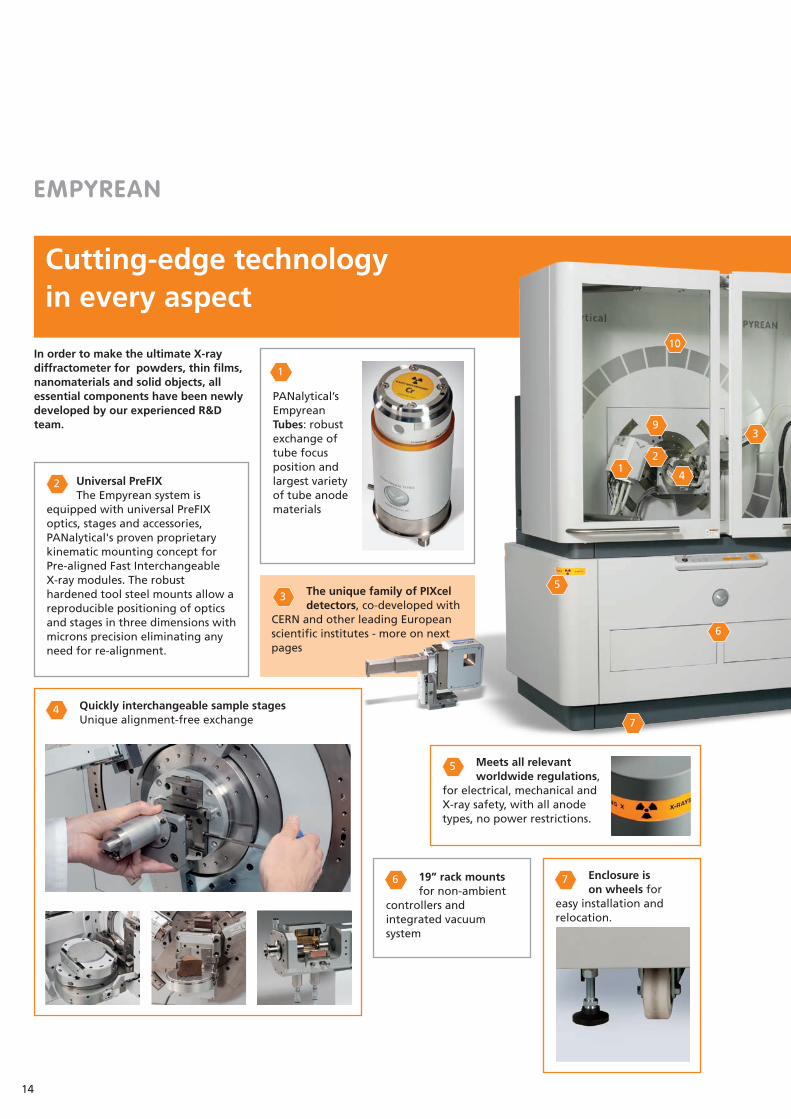
Comparison of a counterfeit (left) and a real (right) tablet. The counterfeit tablet shows more inhomogeneities.
Texture analysis of aluminium processed by equal channel angular pressing (ECAP) – an effective method to reduce grain size and enhance mechanical properties of metals and alloys.
SAXS / WAXS on polymers
Small- and wide-angle X-ray scattering (SAXS/WAXS) data measured from a semi-crystalline polymer sample. From the peak observed at small angles the lamellar repeat distance can be determined. WAXS data allow to identify the type of polymer and possible filler materials, and to estimate the degree of crystallinity.
SAXS
WAXS
14
Cutting-edge technologyin every aspect
EMPYREAN
In order to make the ultimate X-ray diffractometer for powders, thin films, nanomaterials and solid objects, all essential components have been newly developed by our experienced R&D team. 9
21
4
6
7
3
10
5
1
The unique family of PIXcel
detectors, co-developed with CERN and other leading European scientific institutes - more on next pages
Universal PreFIXThe Empyrean system is
equipped with universal PreFIX optics, stages and accessories, PANalytical's proven proprietary kinematic mounting concept for Pre-aligned Fast Interchangeable X-ray modules. The robust hardened tool steel mounts allow a reproducible positioning of optics and stages in three dimensions with microns precision eliminating any need for re-alignment.
3
2
5
19” rack mounts for non-ambient
controllers and integrated vacuum system
6 Enclosure is on wheels for
easy installation and relocation.
7
PANalytical’s Empyrean Tubes: robust exchange of tube focus position and largest variety of tube anode materials
Meets all relevant worldwide regulations,
for electrical, mechanical and X-ray safety, with all anode types, no power restrictions.
Quickly interchangeable sample stagesUnique alignment-free exchange
4
15
Cutting-edge technologyin every aspect
A heart with a brain
The heart of the Empyrean is a the revolutionary high-resolution goniometer evolving upon a long PANalytical tradition in precision goniometers. It makes use of the next generation of Direct Optical Encoding System (DOPS2), featuring preciselyalignedHeidenhainencodersand Path Tracking Technology (PTT) for continuous advanced motion control based on Digital Signal Processing (DSP). Due to this advanced motion control the goniometer offers highest resolution and differential accuracy and positions its arms faster and more precisely than ever before.
8
9
Comprehensive software suite for data collection and
analysis. Supports multiple users, unattended and remote operation, and automatic data collection, analysis and reporting.
Alignment camera allows the user to visually position the
sample for analysison small spots.
8 10
The world’s most accurate high-resolution goniometer
Step size 0.0001°, 2θ linearity ±0.01° over the whole angular range.
"We combined long-time experience and the latest technology to make a high-performance workhorse with ultimate flexibility for today's and future applications".
0
1000
2000
Inte
nsi
ty [
cou
nts
]
Position [°2Theta] (Copper (Cu))21 21.20 21.40 21.60
LaB6 Alpha-1 Empyrean LaB6 standard Empyrean
FWHM = 0.026 °2θ
Empyrean sets the new bar for laboratory X-ray system resolution, with a FWHM of 0.026 degrees 2θ for the first reflection of NIST SRM660a LaB6.
9
9 Wide opening cabinet gives easy access to the
experimental area.
16
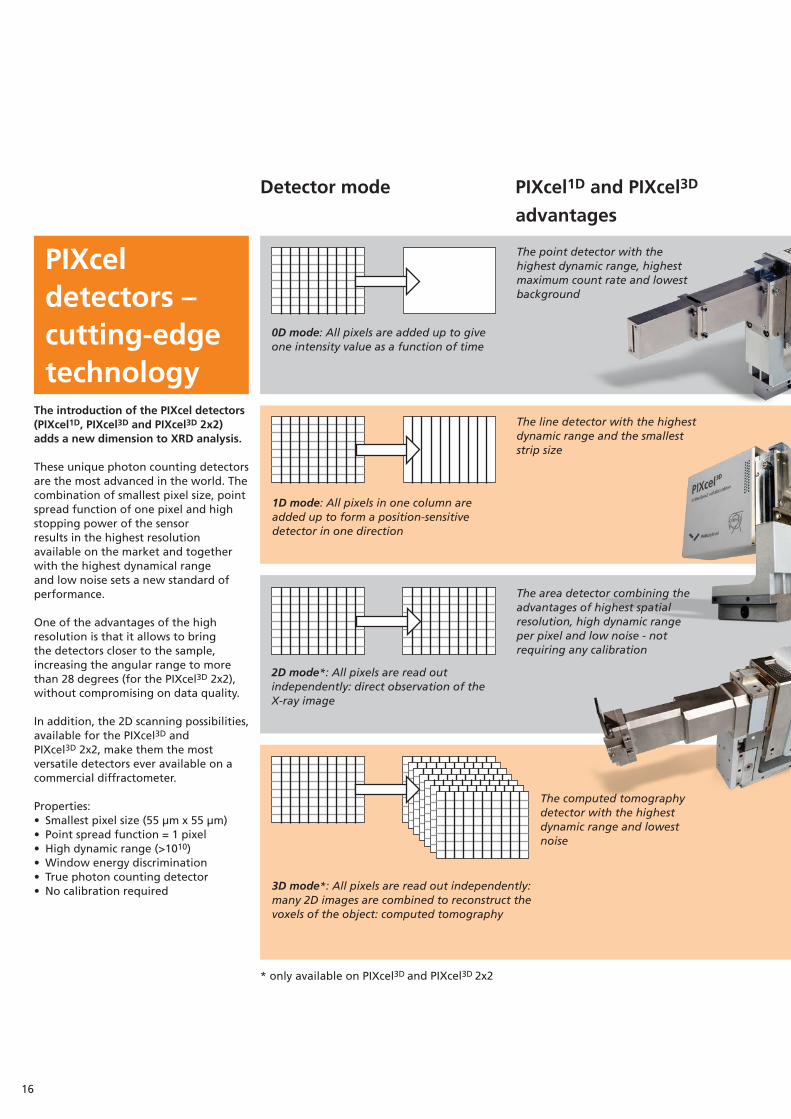
The introduction of the PIXcel detectors (PIXcel1D, PIXcel3D and PIXcel3D 2x2) adds a new dimension to XRD analysis.
These unique photon counting detectors are the most advanced in the world. The combination of smallest pixel size, point spread function of one pixel and high stopping power of the sensorresults in the highest resolution available on the market and together with the highest dynamical range and low noise sets a new standard of performance.
One of the advantages of the high resolution is that it allows to bring the detectors closer to the sample, increasing the angular range to more than 28 degrees (for the PIXcel3D 2x2), without compromising on data quality.
In addition, the 2D scanning possibilities, available for the PIXcel3D and PIXcel3D 2x2, make them the most versatile detectors ever available on a commercial diffractometer.
Properties:• Smallestpixelsize(55μmx55μm)• Pointspreadfunction=1pixel• Highdynamicrange(>1010)• Windowenergydiscrimination• Truephotoncountingdetector• Nocalibrationrequired
PIXcel detectors –cutting-edge technology
Detector mode PIXcel1D and PIXcel3D Typical applications
advantages
0D mode: All pixels are added up to give one intensity value as a function of time
The point detector with the highest dynamic range, highest maximum count rate and lowest background
The line detector with the highest dynamic range and the smallest strip size
1D mode: All pixels in one column are added up to form a position-sensitive detector in one direction
The area detector combining the advantages of highest spatial resolution, high dynamic range per pixel and low noise - not requiring any calibration
2D mode*: All pixels are read out independently: direct observation of the X-ray image
* only available on PIXcel3D and PIXcel3D 2x2
The computed tomography detector with the highest dynamic range and lowest noise
3D mode*: All pixels are read out independently: many 2D images are combined to reconstruct the voxels of the object: computed tomography
17
A strong partnership with CERN
Detector mode PIXcel1D and PIXcel3D Typical applications
advantages
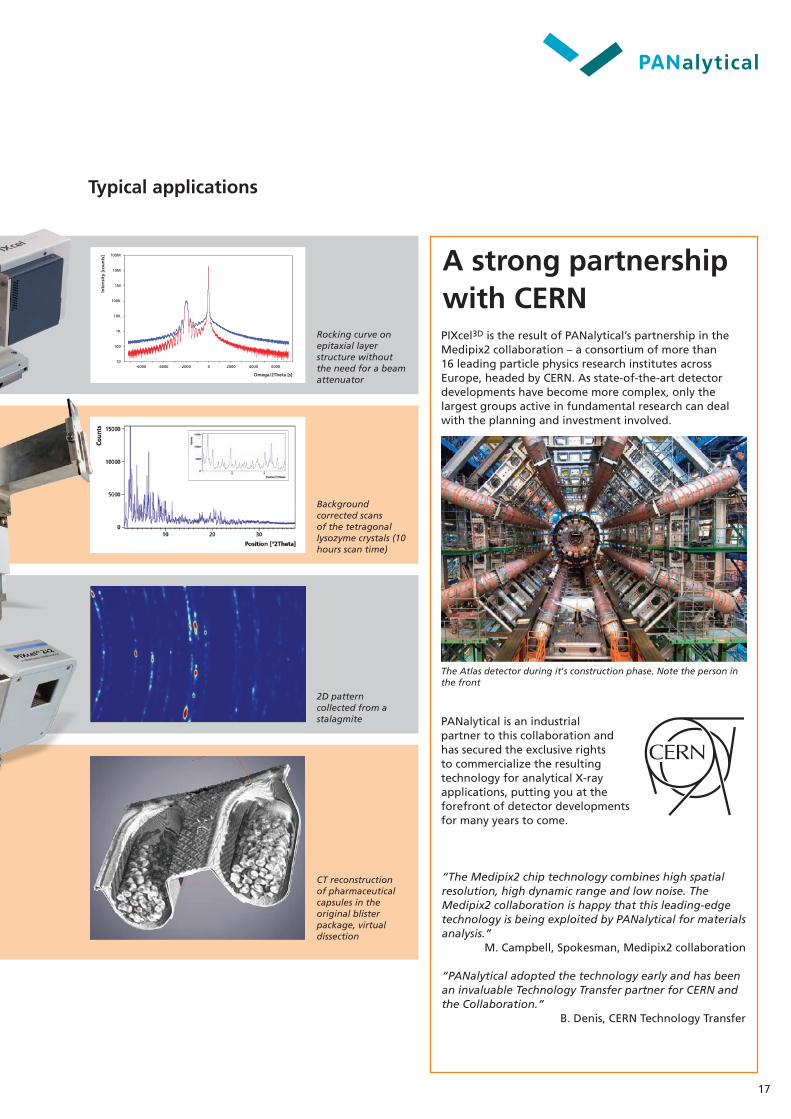
Rocking curve on epitaxial layer structure without the need for a beam attenuator
Background corrected scans of the tetragonal lysozyme crystals (10 hours scan time)
2D pattern collected from a stalagmite
CT reconstruction of pharmaceutical capsules in the original blister package, virtual dissection
-6000 -4000 -2000 0 2000 4000 600010
100
1K
10K
100K
1M
10M
100M
Omega/2Theta [s]
Inte
nsi
ty [
cou
nts
]
“The Medipix2 chip technology combines high spatial resolution, high dynamic range and low noise. The Medipix2 collaboration is happy that this leading-edgetechnology is being exploited by PANalytical for materials analysis.”
M. Campbell, Spokesman, Medipix2 collaboration
“PANalytical adopted the technology early and has been an invaluable Technology Transfer partner for CERN and the Collaboration.”
B. Denis, CERN Technology Transfer
The Atlas detector during it's construction phase. Note the person in the front
PIXcel3D is the result of PANalytical’s partnership in the Medipix2 collaboration – a consortium of more than 16 leading particle physics research institutes across Europe, headed by CERN. As state-of-the-art detector developments have become more complex, only the largest groups active in fundamental research can deal with the planning and investment involved.
PANalytical is an industrial partner to this collaboration and has secured the exclusive rights to commercialize the resulting technology for analytical X-ray applications, putting you at the forefront of detector developments for many years to come.

18
Partnership with PANalytical - ultimate commitment
Access to expertise
PANassist
Your decision to invest in Empyrean marks the beginning of a relationship that will last for many years. A critical goal in our development of Empyrean was to do more than provide a solid platform for each user to build their perfect XRD system. Together with our technical specialists and applications scientists, each diffractometer will be developed into the perfect instrument for your analysis needs. Your input guides our development efforts, and jointly we will get the most information out of your challenging materials.
Training courses, instrument familiarization sessions, application workshops and remote learning channels provide important information for new and existing users. PANalytical facilities around the world deliver these, alongside more general scientific meetings on a variety of X-ray diffraction and scattering topics.
• AlwaysconnectedtoPANalytical’scustomercare network
• Remotediagnostics• Instrumentcertification• Automatedalertandmonitoring• Shareddesktopsupport
19
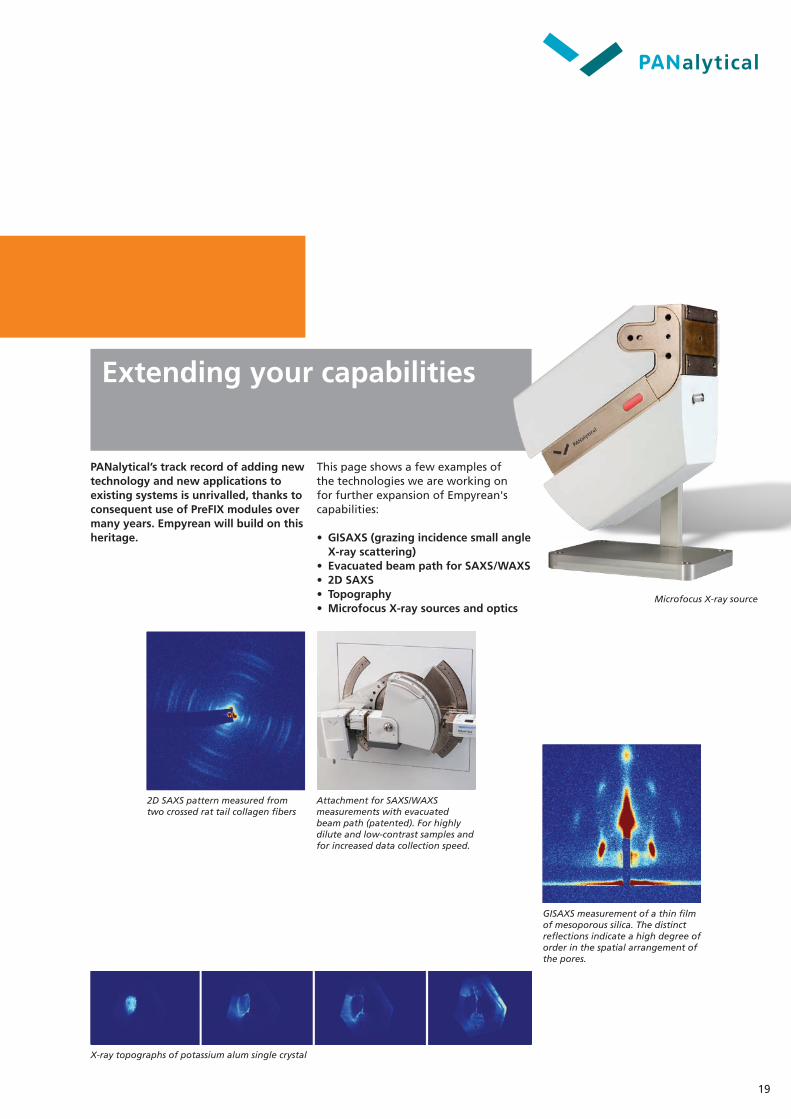
Extending your capabilities
PANalytical’s track record of adding newtechnology and new applications toexisting systems is unrivalled, thanks toconsequent use of PreFIX modules overmany years. Empyrean will build on thisheritage.
X-ray topographs of potassium alum single crystal
Attachment for SAXS/WAXS measurements with evacuated beam path (patented). For highly dilute and low-contrast samples and for increased data collection speed.
2D SAXS pattern measured from two crossed rat tail collagen fibers
GISAXS measurement of a thin film of mesoporous silica. The distinct reflections indicate a high degree of order in the spatial arrangement of the pores.
Microfocus X-ray source
This page shows a few examples ofthe technologies we are working onfor further expansion of Empyrean'scapabilities:
• GISAXS(grazingincidencesmallangleX-ray scattering)
• EvacuatedbeampathforSAXS/WAXS• 2DSAXS• Topography• MicrofocusX-raysourcesandoptics
20
Alt
ho
ug
h d
ilig
ent
care
has
bee
n u
sed
to
en
sure
th
at t
he
info
rmat
ion
her
ein
is a
ccu
rate
, no
thin
g c
on
tain
ed h
erei
n c
an b
e co
nst
rued
to
imp
ly a
ny
rep
rese
nta
tio
n o
r w
arra
nte
e as
to
th
e ac
cura
cy, c
urr
ency
or
com
ple
ten
ess
of
this
info
rmat
ion
. Th
e co
nte
nt
her
eof
is s
ub
ject
to
ch
ang
e w
ith
ou
t fu
rth
er n
oti
ce.P
leas
e co
nta
ct u
s fo
r th
e la
test
ver
sio
n o
f th
is d
ocu
men
t o
r fu
rth
er in
form
atio
n. ©
PA
Nal
ytic
al B
.V. [
2009
]
Prin
ted
in T
he
Net
her
lan
ds
on
50%
rec
ycle
d, c
hlo
rin
e-fr
ee p
aper
. 949
8 70
2 20
311
PN84
84
PANalytical B.V.Lelyweg 1, 7602 EA AlmeloThe NetherlandsT +31 (0) 546 534 444F +31 (0) 546 534 [email protected]
Regional sales offices
AmericasT +1 508 647 1100 F +1 508 647 1115
Europe, Middle East, AfricaT +31 (0) 546 834 444 F +31 (0) 546 834 499
Asia PacificT +65 6741 2868 F +65 6741 2166
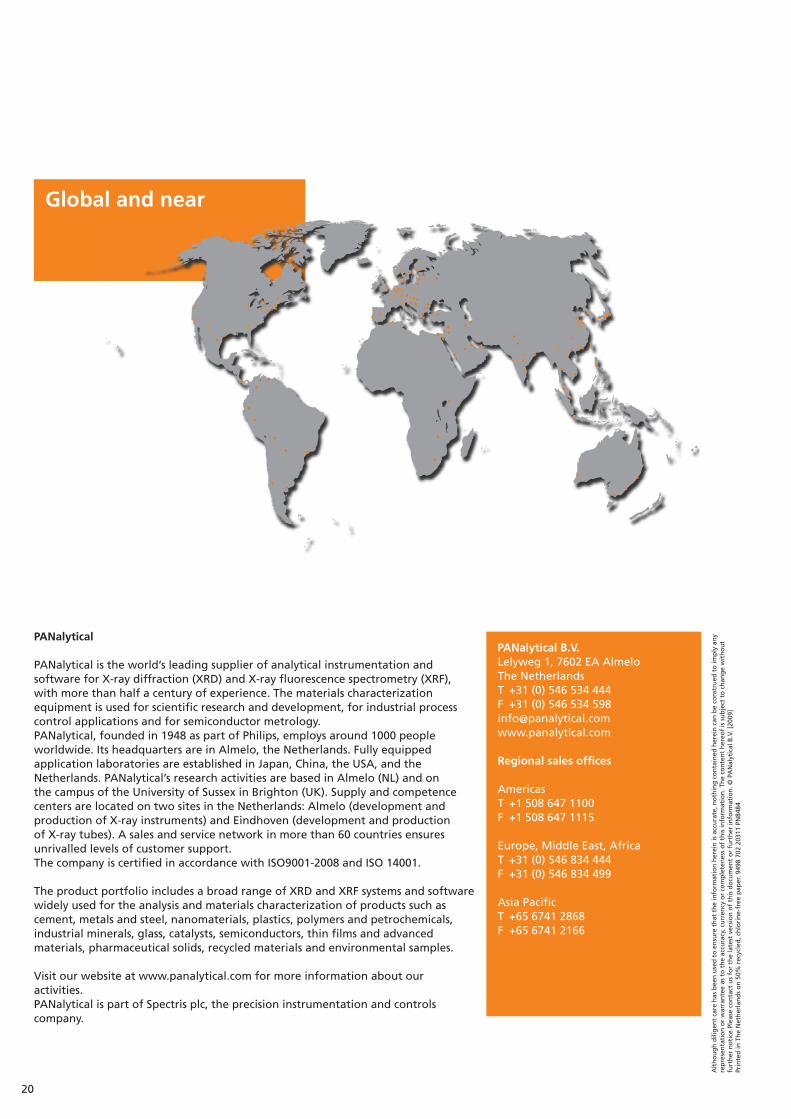
Globalandnear
PANalytical
PANalytical is the world’s leading supplier of analytical instrumentation and software for X-ray diffraction (XRD) and X-ray fluorescence spectrometry (XRF), with more than half a century of experience. The materials characterization equipment is used for scientific research and development, for industrial process control applications and for semiconductor metrology. PANalytical, founded in 1948 as part of Philips, employs around 1000 people worldwide. Its headquarters are in Almelo, the Netherlands. Fully equipped application laboratories are established in Japan, China, the USA, and the Netherlands. PANalytical’s research activities are based in Almelo (NL) and on the campus of the University of Sussex in Brighton (UK). Supply and competence centers are located on two sites in the Netherlands: Almelo (development and production of X-ray instruments) and Eindhoven (development and production of X-ray tubes). A sales and service network in more than 60 countries ensures unrivalled levels of customer support. The company is certified in accordance with ISO9001-2008 and ISO 14001. The product portfolio includes a broad range of XRD and XRF systems and software widely used for the analysis and materials characterization of products such as cement, metals and steel, nanomaterials, plastics, polymers and petrochemicals, industrial minerals, glass, catalysts, semiconductors, thin films and advanced materials, pharmaceutical solids, recycled materials and environmental samples.
Visit our website at www.panalytical.com for more information about our activities.PANalytical is part of Spectris plc, the precision instrumentation and controls company.