Digital Speckle Radiography of Explosives - · PDF fileDigital Speckle Radiography of...
9
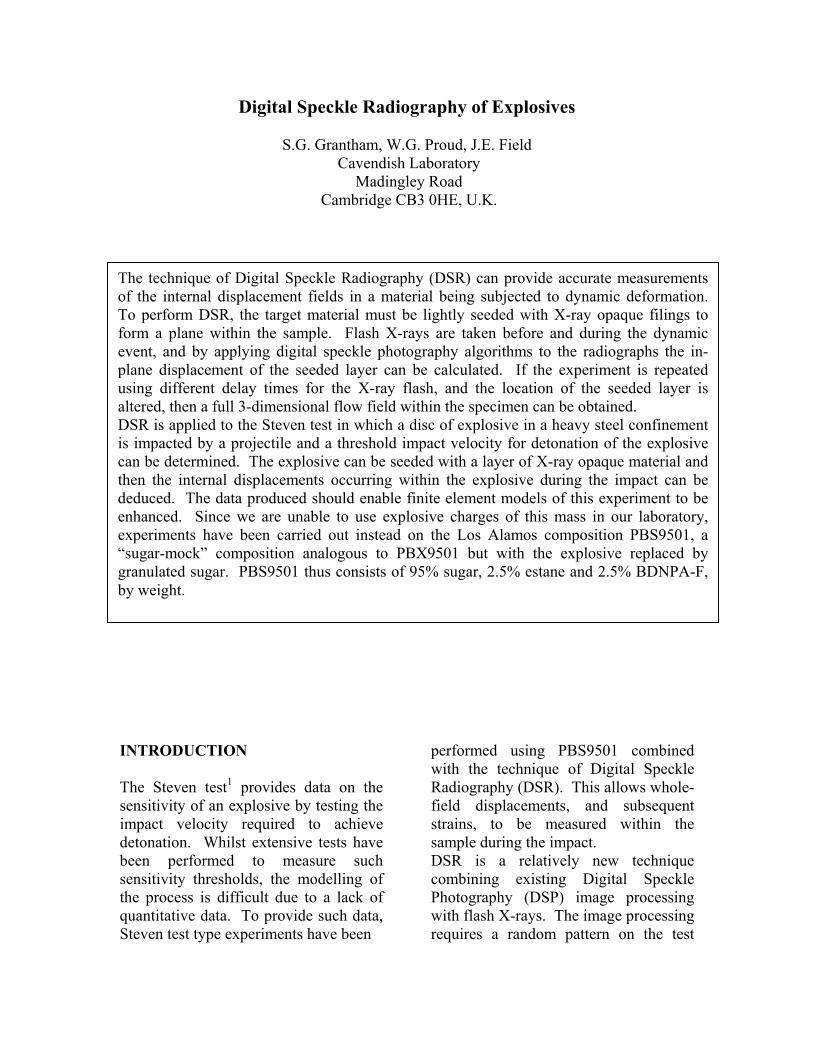
Digital Speckle Radiography of Explosives S.G. Grantham, W.G. Proud, J.E. Field Cavendish Laboratory Madingley Road Cambridge CB3 0HE, U.K. INTRODUCTION The Steven test 1 provides data on the sensitivity of an explosive by testing the impact velocity required to achieve detonation. Whilst extensive tests have been performed to measure such sensitivity thresholds, the modelling of the process is difficult due to a lack of quantitative data. To provide such data, Steven test type experiments have been performed using PBS9501 combined with the technique of Digital Speckle Radiography (DSR). This allows whole- field displacements, and subsequent strains, to be measured within the sample during the impact. DSR is a relatively new technique combining existing Digital Speckle Photography (DSP) image processing with flash X-rays. The image processing requires a random pattern on the test The technique of Digital Speckle Radiography (DSR) can provide accurate measurements of the internal displacement fields in a material being subjected to dynamic deformation. To perform DSR, the target material must be lightly seeded with X-ray opaque filings to form a plane within the sample. Flash X-rays are taken before and during the dynamic event, and by applying digital speckle photography algorithms to the radiographs the in- plane displacement of the seeded layer can be calculated. If the experiment is repeated using different delay times for the X-ray flash, and the location of the seeded layer is altered, then a full 3-dimensional flow field within the specimen can be obtained. DSR is applied to the Steven test in which a disc of explosive in a heavy steel confinement is impacted by a projectile and a threshold impact velocity for detonation of the explosive can be determined. The explosive can be seeded with a layer of X-ray opaque material and then the internal displacements occurring within the explosive during the impact can be deduced. The data produced should enable finite element models of this experiment to be enhanced. Since we are unable to use explosive charges of this mass in our laboratory, experiments have been carried out instead on the Los Alamos composition PBS9501, a “sugar-mock” composition analogous to PBX9501 but with the explosive replaced by granulated sugar. PBS9501 thus consists of 95% sugar, 2.5% estane and 2.5% BDNPA-F, by weight.
Transcript of Digital Speckle Radiography of Explosives - · PDF fileDigital Speckle Radiography of...
Digital Speckle Radiography of Explosives
S.G. Grantham, W.G. Proud, J.E. Field Cavendish Laboratory
Madingley Road Cambridge CB3 0HE, U.K.
INTRODUCTION The Steven test1 provides data on the sensitivity of an explosive by testing the impact velocity required to achieve detonation. Whilst extensive tests have been performed to measure such sensitivity thresholds, the modelling of the process is difficult due to a lack of quantitative data. To provide such data, Steven test type experiments have been
performed using PBS9501 combined with the technique of Digital Speckle Radiography (DSR). This allows whole-field displacements, and subsequent strains, to be measured within the sample during the impact. DSR is a relatively new technique combining existing Digital Speckle Photography (DSP) image processing with flash X-rays. The image processing requires a random pattern on the test
The technique of Digital Speckle Radiography (DSR) can provide accurate measurementsof the internal displacement fields in a material being subjected to dynamic deformation.To perform DSR, the target material must be lightly seeded with X-ray opaque filings toform a plane within the sample. Flash X-rays are taken before and during the dynamicevent, and by applying digital speckle photography algorithms to the radiographs the in-plane displacement of the seeded layer can be calculated. If the experiment is repeatedusing different delay times for the X-ray flash, and the location of the seeded layer isaltered, then a full 3-dimensional flow field within the specimen can be obtained. DSR is applied to the Steven test in which a disc of explosive in a heavy steel confinementis impacted by a projectile and a threshold impact velocity for detonation of the explosivecan be determined. The explosive can be seeded with a layer of X-ray opaque material andthen the internal displacements occurring within the explosive during the impact can bededuced. The data produced should enable finite element models of this experiment to beenhanced. Since we are unable to use explosive charges of this mass in our laboratory,experiments have been carried out instead on the Los Alamos composition PBS9501, a“sugar-mock” composition analogous to PBX9501 but with the explosive replaced bygranulated sugar. PBS9501 thus consists of 95% sugar, 2.5% estane and 2.5% BDNPA-F,by weight.
specimen. This is often done using a laser, or by using the natural features of the surface as in white-light speckle photography. A static image of the pattern is taken before the experiment, and then a second image is taken during the experiment. The two images can then have a correlation value, c(p,q), calculated in Fourier space2 as defined by equation 1.
( )211 *),( ss HHFqpc −= , (1)
where Hs1
* is the complex conjugate of the Fourier transform of image 1, Hs2 is the Fourier transform of image 2, and F-1 is the inverse Fourier transform. This is repeated as the images are stepped over each other pixel by pixel to create a correlation surface. The peak in this correlation surface corresponds to the displacement of one sub-image relative to the other. If this process is carried out for a series of small sub-images, rather than the entire image, a displacement map can be created over the sample surface. The displacements can be measured to an accuracy of 0.001 pixels for a well-resolved pattern3. In DSR a flat plane of X-ray opaque filings are introduced into the specimen to produce the random pattern. Utilizing flash X-rays with an exposure time of 30 ns allows the second image to be taken during a dynamic event. By repeating the experiment with different delay times for the flash X-rays, and by changing the depth of the seeded plane within the sample, a full 3-dimensional displacement field can be obtained. This method has been successfully applied to impact and penetration studies of sand4, polyester5 cement6, and glass7. Utilising two X-ray heads at 60° to each other has also been employed to further increase
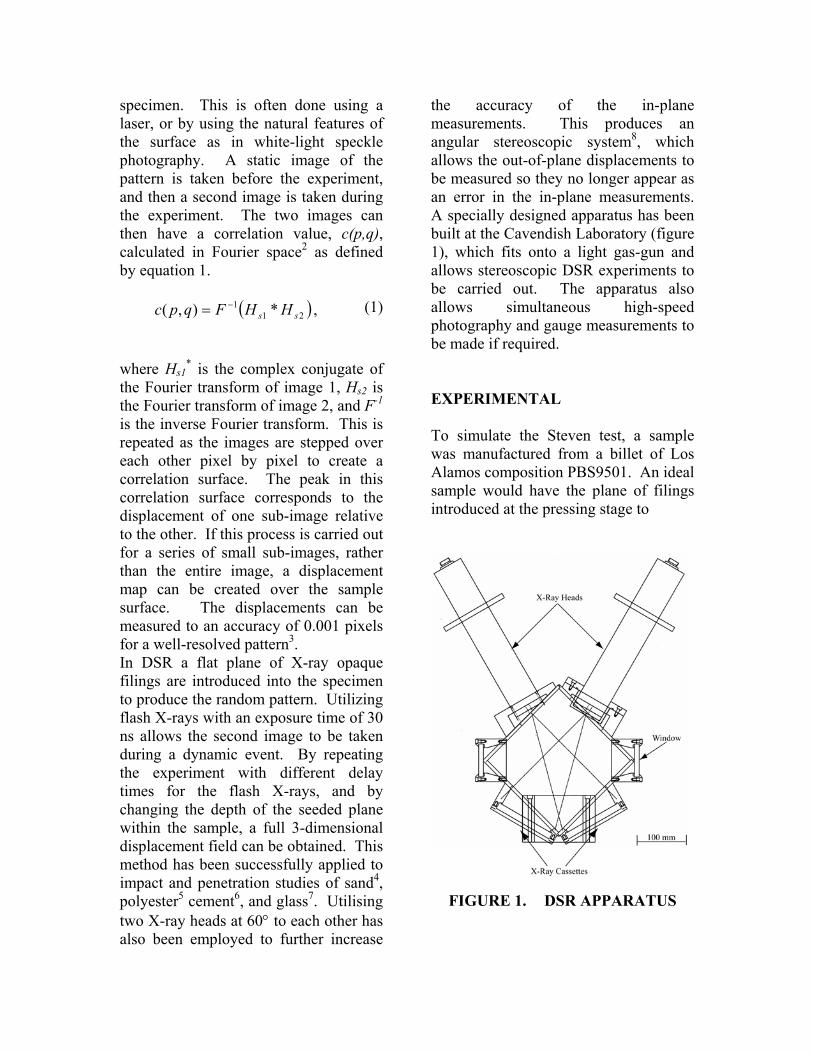
the accuracy of the in-plane measurements. This produces an angular stereoscopic system8, which allows the out-of-plane displacements to be measured so they no longer appear as an error in the in-plane measurements. A specially designed apparatus has been built at the Cavendish Laboratory (figure 1), which fits onto a light gas-gun and allows stereoscopic DSR experiments to be carried out. The apparatus also allows simultaneous high-speed photography and gauge measurements to be made if required. EXPERIMENTAL To simulate the Steven test, a sample was manufactured from a billet of Los Alamos composition PBS9501. An ideal sample would have the plane of filings introduced at the pressing stage to
FIGURE 1. DSR APPARATUS
ensure the sample properties remain as close to the original as possible. The sample used in these experiments was produced by cutting the billet of PBS9501 in half and gluing the two halves back together again using S-211E epoxy potting compound (Structural Adhesives Ltd, Leicester, UK), but with a lead seeding mixed in. The seeded sample was cut into strips of 12.85 mm thickness producing a total of 4 samples. To simulate the conditions of the test, a plate of steel 2.9 mm thick was attached to the front of the sample and a steel plate 19.1 mm thick attached to the rear surface. The plates were attached using 24-hour epoxy. The ring confinement used in the normal Steven test could not be used, as it would prevent the X-rays from penetrating the sample. Several types of projectiles are used in the standard Steven test, but here the projectile was a 100 ± 0.5 mm long, 19.6 ± 0.5 mm diameter mild steel rod with a 6.35 ± 0.5 mm radius hemispherical tip. The velocity regime chosen for these types of tests is usually below 100 m s-1 so a firing pressure was chosen which would produce a predicted velocity of 90 m s-1. The uncertainty in the velocity of the gun is ± 3 m s-1. Delays of 50, 100, 150 and 200 µs after predicted impact with the front plate were chosen. The X-ray system used in these experiments was a Scandiflash 150 keV unit with an add-on channel. The X-ray cassettes were tufnol with a foam sheet to ensure the film (3M Trimax XDA Plus) was held flat. 3M Imation Trimax intensifier screens were also used in the cassettes.
RESULTS The results of the tests can be seen in figures 2 to 5. The in-plane displacement vectors are overlaid onto the radiograph. In each of these figures, the grey region along the centre of the radiograph is the projectile. The sample has the displacement vectors overlaid, and the speckled regions in the lower right quadrant of each radiograph are fiducial markers. These markers are included to allow the subtraction of rigid body motions during the scanning of the radiographs. The first result shows no obvious displacement, this would suggest that the prediction of the point of impact was wrong and the projectile is only just at the point of impact. In figure 3, the movement is much more visible and is quite significant in the forward direction directly ahead of the projectile. This agrees with observations of the sugar mock debris, where there is a clear fracturing directly ahead of the projectile with a hole being “punched out” of the same diameter as the projectile tip. This is understandable since the material is very brittle and this central region is where most of the pressure will be occurring during the impact. The third experiment with a delay of 150 µs shows some movement to the left and right of the projectile, but there is little measured displacement in the forward’s direction. This is most likely due to the additional penetration that has occurred in this experiment so the projectile obscures most of the central region in the deformed radiograph causing complete de-correlation and no-measurement. In the final experiment, the result appears to be very similar to the 100 µs case. The projectile was actually moving
mm
mm
0 20 40 60 80 100 120
0
20
40
60
80
100
120
FIGURE 2. 50 µs AFTER IMPACT
mm
mm
0 20 40 60 80 100 120
0
20
40
60
80
100
120
FIGURE 3. 100 µs AFTER IMPACT
mm
mm
0 20 40 60 80 100 120
0
20
40
60
80
100
120
FIGURE 4. 150 µs AFTER IMPACT
mm
mm
0 20 40 60 80 100 120
0
20
40
60
80
100
120
FIGURE 5. 200 µs AFTER IMPACT
slightly slower in this final experiment causing the penetration depth to be the same as at 100 µs. STRAIN MEASUREMENTS The strains occurring in the sample can also be calculated from these displacement data. To do this, the components of the Langrangian strain tensor for a deforming sample (equations 2 to 4) are considered9.
,21
,21
,21
22
22
∂∂
∂∂
+∂∂
∂∂
+∂∂
+∂∂
=
∂∂
+
∂∂
+∂∂
=
∂∂
+
∂∂
+∂∂
=
yv
xv
yu
xu
xv
yu
yv
yu
yv
xv
xu
xu
xy
yy
xx
γ
γ
γ
(2)
(3)
(4)
From these equations it can be seen that the partial differential components of the measured displacements, u and v, need to be calculated. A direct differentiation from the results of the correlation algorithm will cause a magnification of any random errors, so instead, each four neighbouring displacement measurements are treated as an element and an averaging calculation carried out defined by the equations 5 to 8 below10.
,2
),1(),()1,1()1,(),(
,2
)1,1(),1()1,(),(),(
,2
)1,1(),1()1,(),(),(
,2
),1(),()1,1()1,(),(
njivjivjivjivji
xv
nivjivjivjivji
yv
njiujiujiujiuji
yu
njiujiujiujiuji
xu
+−−++++=
∂∂
++−+−++=
∂∂
++−+−++=
∂∂
+−−++++=
∂∂ (5)
(6)
(7)
(8)
Following calculation of the strain tensor, the principle strain and maximal shear strain can be calculated using a Mohr’s circle approach. The results of calculating the strains can be seen in figures 6 to 9 below. The strain measurements in figure 6 are most likely due to noise as the maximum strain is of the order 2.5 mstrain compared to 50 - 70 mstrain in the later delay times. These strains appear to be the correct order of magnitude given the typical failure strain of polymer-based materials is of the order of 50 – 100 mstrain11. These results also show that there is a large degree of shear strain occurring in the local region of the impact. This agrees with the observations of the central region being removed and the sugar mock failing in a brittle manner. CONCLUSION The results from these experiments are not intended to directly represent the physical behaviour of PBS9501 in the Steven test geometry as the sample has been prepared with an interface, which will change its physical response. The experiments were carried out to check the viability of manufacturing samples for this type of experiment, and to demonstrate that accurate measurements can be made for this test geometry. Strains have also been calculated which agree with the order of magnitudes that would be expected for a polymer based material.
FIGURE 6. STRAINS 50 µs AFTER IMPACT
FIGURE 7. STRAINS 100 µs AFTER IMPACT
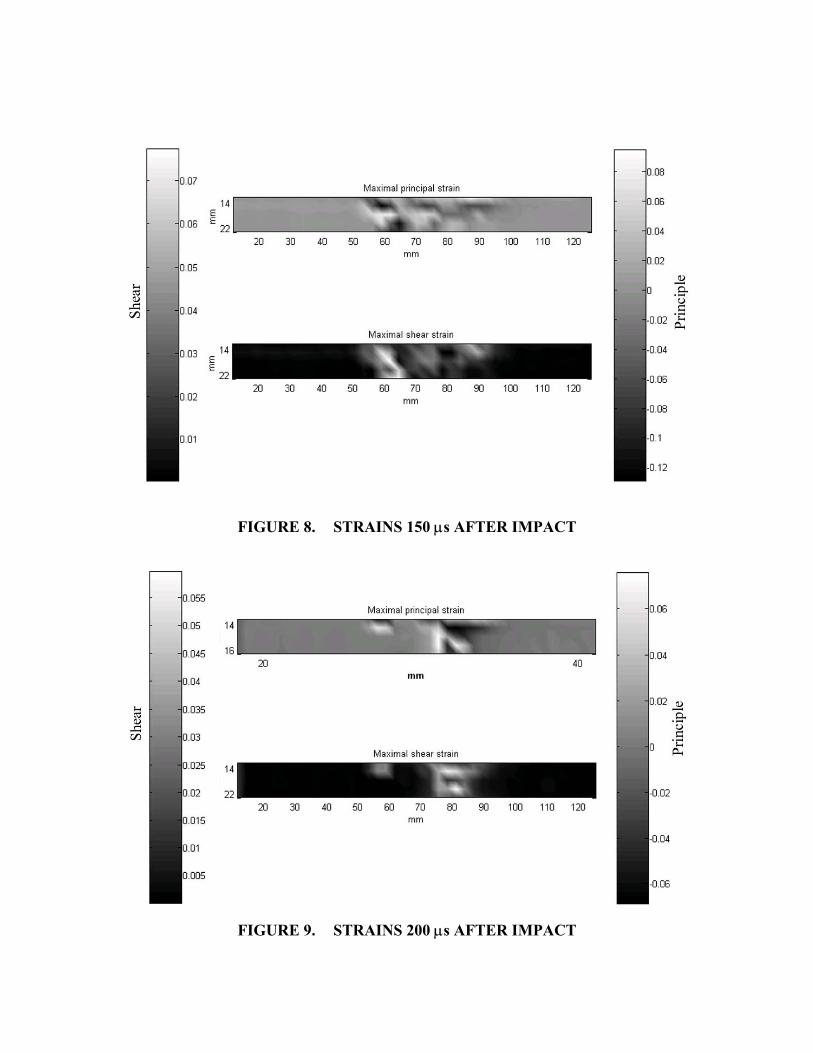
FIGURE 8. STRAINS 150 µs AFTER IMPACT
FIGURE 9. STRAINS 200 µs AFTER IMPACT
ACKNOWLEDGEMENTS The authors thank S. Wortley of A.W.E. Aldermaston for funding this research
and D. Idar of Los Alamos National Laboratory for supplying the PBS9501. S. Grantham also thanks QinetiQ and the EPSRC for research funding.
REFERENCES 1 Chidester S. K., Tarver C. M., Garza R. G., “Low Amplitude Impact Testing and Analysis of Pristine and Aged Solid High Explosives”, 11th Symposium (International) on Detonation, Office of Naval Research, Snowmass, August, pp. 93-100 2 Sjödahl M., Benckert L. R., “Electronic Speckle Photography: Analysis of an Algorithm Giving the Displacement with Subpixel Accuracy”, Applied Optics, Vol. 32, 1993, pp. 2278-2284 3 Sjödahl M., “Electronic Speckle Photography: Increased Accuracy by Non Integral Pixel Shifting”, Applied Optics, Vol. 33, 1994, pp. 6667-6673 4 Goldrein H. T., Grantham S. G., Proud W. G., Field J. E., “The Study of Internal Deformation Fields in Granular Materials Using 3D Digital Speckle X-Ray Flash Photography”, Proceedings of the 12th APS topical meeting on shock compression of condensed matter, Atlanta, June 2001 (in press) 5 Synnergren P., Goldrein H. T., Proud W. G., “Application of Digital Speckle Photography to Flash X-Ray Studies of Internal Deformation Fields in Impact Experiments”, Applied Optics, Vol. 38, 1999, pp. 4030-4036 6 Synnergren P., Goldrein H. T., “Dynamic Measurements of Internal
Three-Dimensional Displacement Fields with Digital Speckle Photography and Flash X-Rays”, Applied Optics, Vol. 38, 1999, pp. 5956-5961 7 Grantham S. G., Proud W. G., “Digital Speckle X-Ray Flash Photography”, Proceedings of the 12th APS topical meeting on shock compression of condensed matter, Atlanta, June 2001 (in press) 8 Lawson, N.J., Wu, J., “Three-dimensional particle image velocimetry: experimental error analysis of a digital angular stereoscopic system”, Meas. Sci. Tech. Vol. 8, 1997, pp.1455-1464 9 Chung T. J., “Applied Continuum Mechanics”, Cambridge University Press, USA, 1996 10 Sjödahl M., “Strain field measurements using electronic speckle photography: a comparison”, Recent Advances in Experimental Mechanics, Silva Gomes et. al., ed., A. A. Balkema, Rotterdam, Netherlands, 1994, pp. 325-330 11 Walley S. M., Field J. E., “Strain Rate Sensitivity of Polymers in Compression from Low to High Rates”, Dymat Journal, Vol. 1, No. 3, 1994, pp. 211-227


![Types of Explosives accessories - Mining and … Tube NONEL Detonator [HMX] 3 mm 1 mm 10 ELECTRIC DETONATORS a) Instantaneous Elect Det b) “L” Series Millisecond Delay Det c) Half](https://static.fdocument.org/doc/165x107/5cdcfb8d88c993400f8d4d8d/types-of-explosives-accessories-mining-and-tube-nonel-detonator-hmx-3-mm-1-mm.jpg)