Development and Validation of a Specific RP-HPLC Method ...
21
Original Research Paper Acta Chromatographica 27(2015)3, 413–433 DOI: 10.1556/AChrom.27.2015.3.2 0231–2522 © 2014 Akadémiai Kiadó, Budapest Development and Validation of a Specific RP-HPLC Method for the Estimation of γ-Aminobutyric Acid in Rat Brain Tissue Samples Using Benzoyl Chloride Derivatization and PDA Detection K.K. AKULA 1 , B. CHANDRASEKARAN 2 , M. KAUR 2 , AND S.K. KULKARNI 3,* 1 RS Dow Neurobiology Laboratories, Legacy Research Institute, Portland, OR 97232, USA 2 Centre with Potential for Excellence in Biomedical Sciences, Panjab University, Chandigarh, 160014, India 3 Pharmacology Division, University Institute of Pharmaceutical Sciences, Panjab University, Chandigarh, 160014, India *E-mail: [email protected] Summary. A new, rapid, and specific reversed phase high-performance liquid chroma- tographic (RP-HPLC) method involving precolumn derivatization with benzoyl chloride was developed and validated for the estimation of γ-aminobutyric acid (GABA) in rat brain tissue preparations. The derivatization product of GABA was identified by melting point, infrared, and proton nuclear magnetic resonance ( 1 H NMR) spectroscopy to be n-benzoyl GABA. Various parameters which influenced derivatization and elusion were optimized. The chromatographic system consisted of C-18 column with ultraviolet (UV)– photodiode array detection ranging from 210 to 400 nm. Elution with an isocratic mobile phase consisting of 0.025 M disodium hydrogen phosphate buffer–methanol (65:35, v/v; pH 6) at a flow rate of 1 mL min −1 yielded sharp and specific peak of n-benzoyl GABA within 7 min. The method was validated with respect to the linearity, accuracy, preci- sion, sensitivity, selectivity, and stability, wherein the benzoyl derivative of GABA showed stability for 2 months. The lower limit of detection was 0.5 nmol L −1 . This novel derivatization procedure for the estimation of GABA with benzoyl chloride was also ap- plied for rat brain tissue preparations that gave highly specific peak and good compo- nent recovery. The results show that the method for the determination of GABA by ben- zoylation using RP-HPLC has good linearity, accuracy, precision, sensitivity, and speci- ficity and is simple and economical to perform. Key Words: GABA, benzoyl chloride, RP-HPLC, PDA, brain tissues, validation Introduction GABA (γ-aminobutyric acid) is the primary endogenous amino acid neuro- transmitter exerting inhibitory physiological functions in the central nerv- ous system and diverse protective effects in neurochemical abnormalities [1]. Therefore, trace level measurements of GABA in the brain are especially essential in studying the role of this neurotransmitter in neurophysiology, Unauthenticated | Downloaded 02/22/22 12:37 AM UTC
Transcript of Development and Validation of a Specific RP-HPLC Method ...
Original Research Paper
Acta Chromatographica 27(2015)3, 413–433 DOI: 10.1556/AChrom.27.2015.3.2
0231–2522 © 2014 Akadémiai Kiadó, Budapest
Development and Validation of a Specific RP-HPLC Method for the Estimation of γ-Aminobutyric Acid in Rat Brain Tissue
Samples Using Benzoyl Chloride Derivatization and PDA Detection
K.K. AKULA1, B. CHANDRASEKARAN2, M. KAUR2, AND S.K. KULKARNI3,*
1RS Dow Neurobiology Laboratories, Legacy Research Institute, Portland, OR 97232, USA
2Centre with Potential for Excellence in Biomedical Sciences, Panjab University, Chandigarh, 160014, India
3Pharmacology Division, University Institute of Pharmaceutical Sciences, Panjab University, Chandigarh, 160014, India *E-mail: [email protected]
Summary. A new, rapid, and specific reversed phase high-performance liquid chroma-tographic (RP-HPLC) method involving precolumn derivatization with benzoyl chloride was developed and validated for the estimation of γ-aminobutyric acid (GABA) in rat brain tissue preparations. The derivatization product of GABA was identified by melting point, infrared, and proton nuclear magnetic resonance (1H NMR) spectroscopy to be n-benzoyl GABA. Various parameters which influenced derivatization and elusion were optimized. The chromatographic system consisted of C-18 column with ultraviolet (UV)–photodiode array detection ranging from 210 to 400 nm. Elution with an isocratic mobile phase consisting of 0.025 M disodium hydrogen phosphate buffer–methanol (65:35, v/v; pH 6) at a flow rate of 1 mL min−1 yielded sharp and specific peak of n-benzoyl GABA within 7 min. The method was validated with respect to the linearity, accuracy, preci-sion, sensitivity, selectivity, and stability, wherein the benzoyl derivative of GABA showed stability for 2 months. The lower limit of detection was 0.5 nmol L−1. This novel derivatization procedure for the estimation of GABA with benzoyl chloride was also ap-plied for rat brain tissue preparations that gave highly specific peak and good compo-nent recovery. The results show that the method for the determination of GABA by ben-zoylation using RP-HPLC has good linearity, accuracy, precision, sensitivity, and speci-ficity and is simple and economical to perform. Key Words: GABA, benzoyl chloride, RP-HPLC, PDA, brain tissues, validation
Introduction
GABA (γ-aminobutyric acid) is the primary endogenous amino acid neuro-transmitter exerting inhibitory physiological functions in the central nerv-ous system and diverse protective effects in neurochemical abnormalities [1]. Therefore, trace level measurements of GABA in the brain are especially essential in studying the role of this neurotransmitter in neurophysiology,
Unauthenticated | Downloaded 02/22/22 12:37 AM UTC
K.K. Akula et al.
414
behavioral effects, pathology, and disease diagnosis since its changes have been associated with various neuronal disorders including epilepsy, anxi-ety, sedation, schizophrenia, etc. [2]. Reversed phase high-performance liq-uid chromatography (RP-HPLC) has proved to be a valuable tool in assess-ing dysregulation of the GABAergic systems from a variety of samples gen-erated from in vivo microdialysis or from post mortem tissues [3, 4]. Vari-ous chromatographic methods have been established to estimate the en-dogenous levels of several biological amines including GABA, wherein most of them produced several interference peaks from other biological amines including glutamate, taurine, glycine, aspartate, etc., and these methods are compromised either with the increased retention time or with the poor resolution of GABA peak specifically. Low extracellular concentration, absence of chromophore or fluoro-phore, and, moreover, inherent electrochemical inactivity have made the detection of GABA quite challenging. In order to circumvent these limita-tions with the estimation of GABA, a precolumn derivatization coupled with HPLC–fluorescence/electrochemical detection has been in use for the detection and/or quantification of this amino acid in microdialysate sam-ples, brain tissue extracts, and other biological matrix preparations. This precolumn derivatization was found to transform GABA into detectable forms, and therefore, derivatizing agents like o-phthalaldehyde (OPA) with β-mercaptoethanol or sodium sulphite have been widely used despite the poor stability of the electroactive and/or fluorescent derivatives [4–8]. Use of several other derivatizing agents like dansyl chloride, naphthalene-2,3-dicarboxaldehyde, fluorescamine, phenyl isothiocyanate, 5-(4,6-dichloro-striazin-2-ylamino) fluorescein, benzylamine with 1,2-diphenylethylene-diamine, etc. has also been documented but those methods also carry stabil-ity issues and longer run times [4, 9–11]. The reduced efficiency in GABA analysis with existing gradient elution methods, enhanced run times, tedi-ous analytical procedure, and poor resolution due to interference from deri-vatizing agents themselves and other matrix components have led to the op-timization of the chromatographic methods to ensure the detection of GABA with good resolution [3, 4, 7, 8, 12]. The modern methods also make the chromatographic estimation more expensive with the use of costly deri-vatizing agents like OPA and intricate technical requirements using gradi-ent pumps, mass spectroscopic identification, microfluidic electrophoresis chip, microchip electrophoresis, and monolithic column chromatography coupled with chemiluminescence detection [4, 10, 11, 13, 14]. Notwithstanding the existence of numerous conventional estimation methods for the crucial biological amines like GABA, there is an ever-increasing demand to improve throughput, resolution and to obtain un-equivocal identification of analyte in intricate biological matrix. The benzoy-
Unauthenticated | Downloaded 02/22/22 12:37 AM UTC
HPLC Method for the Estimation of GABA
415
lation procedures have been widely acknowledged to derivatize amino group containing substances, which proceeds in presence of water and gives ultraviolet (UV)-active derivatives suitable for the extraction with or-ganic solvents [15]. A review of literature has rarely shown any isocratic method of GABA in combination with benzoyl derivative and photodiode array (PDA) detection. Moreover, this economical and specific method fa-cilitates the UV–PDA detection of stable GABA derivative in biological samples with enhanced throughput. Moreover, the simple UV detection was reported to be helpful for the detection of amino acids like GABA, and the electrochemical detection tends to lack reproducibility mainly because of hysteretic degradation of the electrode [14, 16]. The present study was aimed to develop a simple, specific, faster, and economical isocratic HPLC–PDA protocol for the detection and quantifica-tion of GABA in biological tissues using a single derivatizing agent (benzoyl chloride), in order to improve GABA derivative stability. Further, this work comprises optimization on derivatization conditions, chromatographic pa-rameters, validation tests, and application of this improved HPLC–PDA method for preliminary GABA quantification method in discrete areas of rat brain tissue preparations.
Experimental
Chemicals and Reagents
All the solvents and reagents used in this study are of HPLC grade. GABA was purchased from Sisco Research Laboratories Pvt. Ltd. (Mumbai, India). Carbon tetrachloride (CCl4), chloroform (CHCl3), and tris buffer were pro-cured from Qualigens Fine Chemicals (Mumbai, India); benzoyl chloride (C6H5COCl) and sodium hydroxide, from S.D. Fine Chemicals (Mumbai, India); and dipotassium hydrogen phosphate, chloric (VII) acid, hydrochlo-ric acid, methanol, acetonitrile, and HPLC grade water, from Merck (Mum-bai, India). The mobile phase used in the HPLC system was vacuum-filtered daily through a 0.22-μm filter (Millipore).
Instrumentation
Melting point was determined on LabIndia microprocessor controlled melt-ing point apparatus. An infrared spectrum was recorded on a Hitachi 270-50 double beam infrared (IR) spectrometer having a range of 4000–250 cm−1. A UV spectrum was recorded on a Varian Carey 3E UV–visible spectropho-tometer. Proton nuclear magnetic resonance (1H NMR) spectra were re-
Unauthenticated | Downloaded 02/22/22 12:37 AM UTC
K.K. Akula et al.
416
corded on a Bruker MSL 300 instrument at 300 MHz. Thin-layer chromatog-raphy (TLC) was run on commercially precoated plates (Merck, Kieselgel 60F254).
The chromatographic system consisted of a Waters Delta 600 equipped with a Waters 600 controller pump, a PDA detector Model Waters 2996 which was set at 210 to 400 nm, and a degasser module (all from Waters, Milford, MA). Chromatographic detection of GABA was achieved at 30 °C, using an RP-Inertsil ODS-3 C-18 column (250 × 4.6 mm I.D.; 5 μm particle size) (GL Sciences, Inc. USA). The mobile phase was an isocratic mixture of 0.025 M disodium hydrogen phosphate buffer:methanol (65:35, v/v; pH 6), the precolumn mixing being performed online by the inbuilt 600E Multi-solvent delivery unit operated by system software. The components of the mobile phase were reinstated and filtered daily. The column was equili-brated and eluted under these isocratic conditions with a flow rate of 1 mL min−1 at 30 °C. Multiple wavelength detection with UV spectra was used for analyzing the samples. The quantitation of GABA was performed at 230 nm, and the peak maxima for GABA derivative occurred at the same wavelength. The chromatographic run time for analysis was 10 min.
System control, data acquisition, and processing were performed with Waters Empower Version 2002 chromatography software with the system suitability options installed. Peak spectra and peak purity parameters at a bandwidth of 4.8 nm were obtained from this software. Calibration data were obtained by linear regression analysis of the individual peak area of GABA versus its nominal concentrations of the standard solutions. The zero concentration sample (blank) was used to verify the purity of the reagents and the absence of the other potentially interfering substances.
Derivatization
Synthesis of n-Benzoyl-γ-Aminobutyric Acid (GABA derivative)
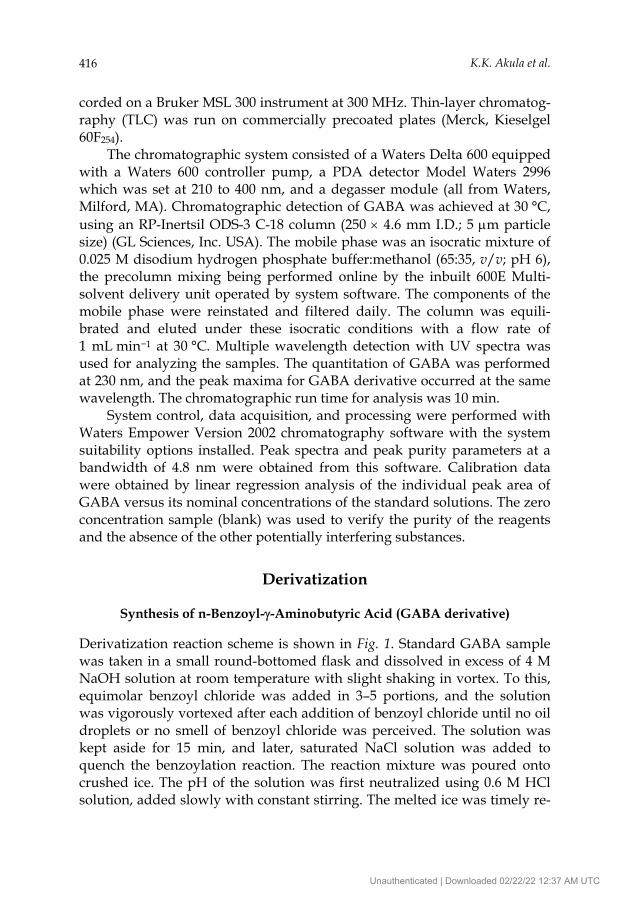
Derivatization reaction scheme is shown in Fig. 1. Standard GABA sample was taken in a small round-bottomed flask and dissolved in excess of 4 M NaOH solution at room temperature with slight shaking in vortex. To this, equimolar benzoyl chloride was added in 3–5 portions, and the solution was vigorously vortexed after each addition of benzoyl chloride until no oil droplets or no smell of benzoyl chloride was perceived. The solution was kept aside for 15 min, and later, saturated NaCl solution was added to quench the benzoylation reaction. The reaction mixture was poured onto crushed ice. The pH of the solution was first neutralized using 0.6 M HCl solution, added slowly with constant stirring. The melted ice was timely re-
Unauthenticated | Downloaded 02/22/22 12:37 AM UTC
HPLC Method for the Estimation of GABA
417
placed with small quantities of crushed ice. The pH of the solution was checked in regular intervals after each addition of HCl solution. The solu-tion was acidified to obtain a white product. The addition of acid was con-tinued until the precipitate seemed to become no thicker. The pH of the so-lution at this point was found to be nearly 2. The solution was kept aside in ice until a thick precipitate of the benzoyl derivative settled down. The solu-tion was filtered; the residue was air-dried and washed 3–5 times with CCl4 to remove excess benzoic acid, formed as a byproduct. Each washing was decanted on a filter paper. The n-benzoyl GABA was recrystallized with hot water and kept aside for the formation of pure crystals. The derivative was weighed and dissolved in the solvent with same composition as that of the mobile phase and injected into the HPLC system for further analysis.
Fig. 1. Reaction scheme showing the formation of benzoyl derivative of γ-aminobutyric acid
The formation of the n-benzoyl GABA (GABA derivative) was con-firmed based on the physical (melting point) and spectral data (IR and NMR spectroscopy). This GABA derivative obtained in large quantity was re-served as a standard to determine the retention time and for comparisons in subsequent biological sample analysis.
Preparation of Calibration Standards and Quality Control Samples
Standard stock solutions of GABA were prepared by dissolving 2.07 μg of n-benzoyl GABA in 10 mL of mobile phase composition, i.e., 0.025 M diso-dium hydrogen phosphate buffer:methanol (65:35, v/v; pH 6) to yield a fi-nal concentration of 1.00 µmol L−1 standard solution. Serial dilution (500.00, 250.00, 100.00, 50.00, 10.00, 5.00, 2.50, and 1.00 nmol L−1) from 1.00 µmol L−1 of working standard was carried out. These calibration standards were pre-pared freshly in triplicate for the analytical run. Quality control samples were prepared similarly in mobile phase in the concentrations of 1.00 (lower limit of quantification (LLOQ)), 2.50, 5.00, 25.00, and 100.00 nmol L−1, as de-
Unauthenticated | Downloaded 02/22/22 12:37 AM UTC
K.K. Akula et al.
418
scribed above for the calibration standards. The samples were prepared from a stock solution different from that used to generate calibration curve samples. These quality control samples were used to investigate intra- and inter-run variations.
Animals and Extraction of GABA from Brain Tissue Preparation
Adult male Wistar rats (250–300 g) bred in Central Animal House facility of Panjab University, Chandigarh were used. All the animal protocols were approved by the Institutional Animal Ethics Committee. Under slight ether anesthesia, the animals were sacrificed by decapitation. The brains were rapidly dissected in ice-cold conditions. Three brain regions including the cerebral cortex, striatum, and globus pallidus were separated and frozen in cold 0.9% w/v saline at −80 °C until taken for GABA analysis. The tissue was homogenized (20% w/v) in cold 0.5 N chloric (VII) acid solution. The homogenate was centrifuged (15,000 × g) at 4 °C for 15 min, and the resul-tant supernatant was filtered through 0.22 µm filter. Five hundred milliliters of this filtrate was used for derivatization, and 20 μL of the final derivative was injected (Hamilton Syringe, USA) into the HPLC system.
For recovery studies, whole brain was dissected out and was incised into two uniform cerebral hemispheres that weighed almost equal. To one part of the brain tissue, a known amount of working standard solution con-taining GABA was added. To the other equal hemisphere, equal quantity of the blank solution was added. The percentage recovery of GABA was de-termined from the following equation:
1
2Recovery (%) = 100
+ C
C N⎛ ⎞
×⎜ ⎟⎝ ⎠
where C1 is the calculated concentration from the brain tissue treated with standard GABA sample, C2 is the calculated concentration from the brain tissue treated with blank (both concentrations were derived by relating the respective peak areas to the regression line of the standard calibration), and N is the nominal concentration added to the brain tissue.
Derivatization of Rodent Brain Sample
To the 500 μL of the standard GABA solution (10 nmol L−1) or the biological sample with unknown concentration of GABA, 1 mL of 4 M NaOH solution was added followed by 10 µL benzoyl chloride:acetonitrile (1:1, v/v). The solution was vortex mixed and kept aside for 15 min at room temperature.
Unauthenticated | Downloaded 02/22/22 12:37 AM UTC

HPLC Method for the Estimation of GABA
419
Later, 2 mL of saturated NaCl solution was added to stop the benzoylation reaction. The solution was filtered into a beaker with ice. The reaction mix-ture was acidified with 6 M HCl solution until the pH was ~2. The reaction mixture was washed with CCl4 for 3–4 times. Following this, the aqueous layer was extracted with CHCl3. The chloroform layer was evaporated. Sub-sequently, the residue was dissolved in 500 μL of mobile phase mixture and analyzed by HPLC. mm
Statistical Analysis
Data was analyzed with SigmaStat software version 2. The results were ex-pressed in the form of mean ± standard deviation (SD). Linearity was de-termined with the linear regression method. Slopes were compared by means of ANOVA of the regression. Coefficient of variance (CV) and aver-age relative percentage deviation (% DEV) were calculated by eqs. (1) and (2).
Standard deviationCV (%) = 100Average calculated concentration
⎛ ⎞×⎜ ⎟
⎝ ⎠ (1)
Average calculated concentrationDEV (%) = 1 100
Nominal concentration⎛ ⎞− ×⎜ ⎟⎝ ⎠
(2)
Results and Discussion
Melting Point and UV Spectroscopy of n-Benzoyl GABA (GABA Derivative)
The melting point of n-benzoyl GABA was found to be ~81 °C. The λmax was found to be 230 nm in buffer–methanol mobile phase composition.
Structural Confirmation of n-Benzoyl GABA by Infrared and Nuclear Magnetic Resonance Spectra
IR (KBr): 3426 (N–H); 1738 (O=C–OH); 1628 (O=C–NH). 1H NMR (CDCl3) δ ppm: 1.95 (p, 2H, –CH2–CH2–CH2–); 2.45 (t, 2H, –
CH2–CH2–COOH–); 3.5 (q, 2H, –NH–CH2–CH2–); 6.87 (t, 1H, –NH–CH2–); 7.38 (m, 2H, –Ar–H); 7.45 (t, 1H, –Ar–H); 7.75 (d, 2H, –Ar–H).
Unauthenticated | Downloaded 02/22/22 12:37 AM UTC
K.K. Akula et al.
420
Optimization of Derivatization Conditions
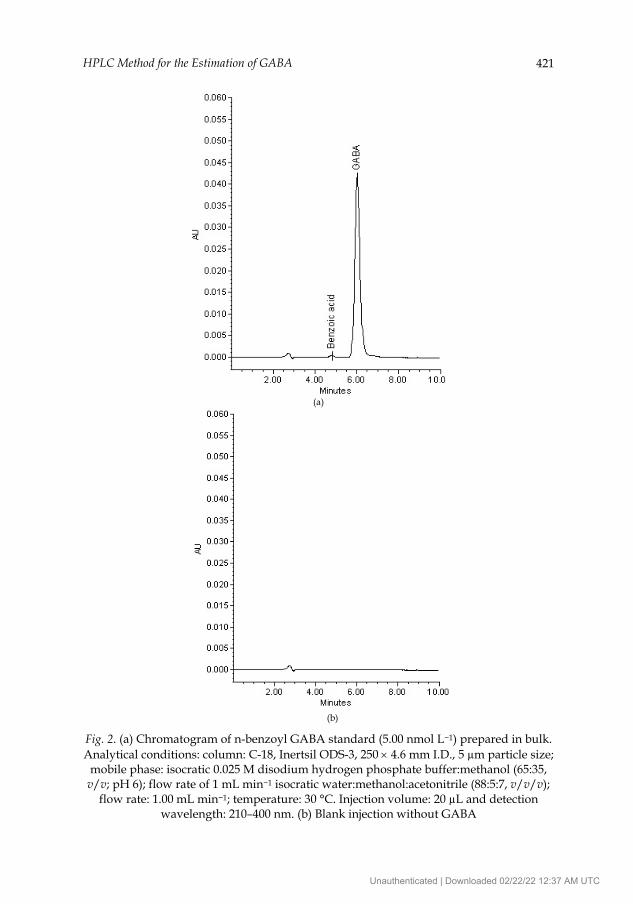
Major factors affecting derivatization process were the quantity of benzoyl chloride, pH of the reaction mixture, reaction time, and temperature. Differ-ent types of basic media were tested including weak bases like sodium bi-carbonate, potassium bicarbonate, buffers, etc.; however, the maximum yield of the benzoylated product (GABA derivative) was favored only with excess quantity of strong base like NaOH and that too in higher molar con-centrations. Moreover, the use of sodium hydroxide was also reported to be more convenient and it gives consistently good yields of benzoyl deriva-tives, and also does not lead to racemization [17]. The amount of the ben-zoyl chloride added in this reaction was critical for the formation of n-benzoyl GABA and, at the same time, determines the extent of byproducts. In the preparation of the derivative in bulk, the derivatization reaction was started with the equal molar ratio of both GABA and benzoyl chloride since the by-product (benzoic acid) formed can be completely removed from the product by washing with CCl4. During optimizing the conditions to simu-late for the preparation of the GABA derivatives for the brain samples, the quantity of the benzoyl chloride was reduced. The derivatization reaction required a critical control of the pH of the reaction medium in order to en-sure the maximum yield. Derivatization reaction did not terminate in the range of pH >2. In the reaction between GABA and benzoyl chloride, it was found that the final formation of n-benzoyl GABA (GABA derivative) was favored only in the acidic conditions, at a pH ~2, and therefore, the basic re-action mixture was acidified with HCl to obtain an acidic pH, wherein a thick, white product of n-benzoyl GABA was precipitated; moreover, this acidic pH prevents the degradation of GABA derivative. The use of 0.6 M HCl was earmarked following several preliminary trials. Following subse-quent recrystallization with hot water, pure crystals of n-benzoyl GABA were collected, which gave a very specific chromatographic peak at around 6 min in the mobile phase under study (Fig. 2).
In an unknown concentration of the biological sample, i.e., in case of the extracted rodent brain tissue, derivatization was critically carried out by optimizing every step such as using varied concentrations and/or volume of reagents (benzoyl chloride, NaOH and HCl) optimizing the reaction time, reaction temperature, and final extraction of the derivative for injection into column. All these steps were performed until a constant peak area for the detector response of n-benzoyl GABA and the minimized peak of benzoic acid (by-product) was reached.
Unauthenticated | Downloaded 02/22/22 12:37 AM UTC
HPLC Method for the Estimation of GABA
421
(a)
(b)
Fig. 2. (a) Chromatogram of n-benzoyl GABA standard (5.00 nmol L−1) prepared in bulk. Analytical conditions: column: C-18, Inertsil ODS-3, 250 × 4.6 mm I.D., 5 µm particle size;
mobile phase: isocratic 0.025 M disodium hydrogen phosphate buffer:methanol (65:35, v/v; pH 6); flow rate of 1 mL min−1 isocratic water:methanol:acetonitrile (88:5:7, v/v/v);
flow rate: 1.00 mL min−1; temperature: 30 °C. Injection volume: 20 µL and detection wavelength: 210–400 nm. (b) Blank injection without GABA
Unauthenticated | Downloaded 02/22/22 12:37 AM UTC
K.K. Akula et al.
422
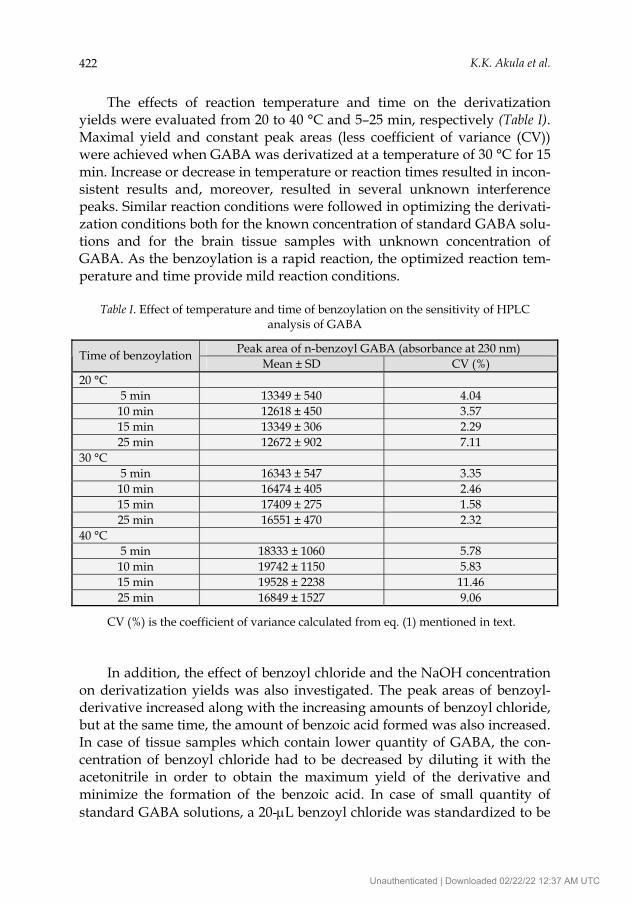
The effects of reaction temperature and time on the derivatization yields were evaluated from 20 to 40 °C and 5–25 min, respectively (Table I). Maximal yield and constant peak areas (less coefficient of variance (CV)) were achieved when GABA was derivatized at a temperature of 30 °C for 15 min. Increase or decrease in temperature or reaction times resulted in incon-sistent results and, moreover, resulted in several unknown interference peaks. Similar reaction conditions were followed in optimizing the derivati-zation conditions both for the known concentration of standard GABA solu-tions and for the brain tissue samples with unknown concentration of GABA. As the benzoylation is a rapid reaction, the optimized reaction tem-perature and time provide mild reaction conditions.
Table I. Effect of temperature and time of benzoylation on the sensitivity of HPLC
analysis of GABA
Peak area of n-benzoyl GABA (absorbance at 230 nm) Time of benzoylationMean ± SD CV (%)
20 °C 5 min 13349 ± 540 4.04 10 min 12618 ± 450 3.57 15 min 13349 ± 306 2.29 25 min 12672 ± 902 7.11
30 °C 5 min 16343 ± 547 3.35 10 min 16474 ± 405 2.46 15 min 17409 ± 275 1.58 25 min 16551 ± 470 2.32
40 °C 5 min 18333 ± 1060 5.78 10 min 19742 ± 1150 5.83 15 min 19528 ± 2238 11.46 25 min 16849 ± 1527 9.06
CV (%) is the coefficient of variance calculated from eq. (1) mentioned in text.
In addition, the effect of benzoyl chloride and the NaOH concentration on derivatization yields was also investigated. The peak areas of benzoyl-derivative increased along with the increasing amounts of benzoyl chloride, but at the same time, the amount of benzoic acid formed was also increased. In case of tissue samples which contain lower quantity of GABA, the con-centration of benzoyl chloride had to be decreased by diluting it with the acetonitrile in order to obtain the maximum yield of the derivative and minimize the formation of the benzoic acid. In case of small quantity of standard GABA solutions, a 20-μL benzoyl chloride was standardized to be
Unauthenticated | Downloaded 02/22/22 12:37 AM UTC
HPLC Method for the Estimation of GABA
423
sufficient to yield good peak of GABA derivative. On the other hand, as the brain tissue sample contains smaller amount of the GABA, the benzoyl chloride has to be diluted in 1:1 ratio with a neutral solvent such as acetoni-trile and a volume of 10 μL was optimized to be the quantity essential for the formation of n-benzoyl GABA. Further, after 15 min of derivatization reaction, 1–2 g of NaCl was added to the reaction mixture to terminate the benzoylation reaction. Based on the preliminary studies, CCl4 was selected to wash the reaction mixture for 3–4 times. CCl4 removes the unwanted benzoic acid from the final GABA derivative.
Since an entire solidified precipitate cannot be obtained with GABA in brain sample, the reaction mixture after acidification was subjected to wash-ing with CCl4 as mentioned above. The organic phase containing benzoic acid derivatives was removed, and the aqueous portions were collected. These aqueous portions containing GABA derivative were again extracted with 3–4 volumes of CHCl3. The CHCl3 fractions were collected and evapo-rated under reduced pressure. The resulting residue was processed for HPLC analysis after dissolving in appropriate amount of mobile phase.
Chromatographic Estimation
A sensitive, specific, and reproducible method for the detection of GABA in biological sample was obtained using silica RP column. The retention time of GABA in the analytical conditions of the present study was around 6 min. Selectivity for GABA is indicated by the sharp and symmetrical resolu-tion of the peak, as well as by the lack of any other interfering peaks from the derivatizing agents or from the biological matrix.
Most of the existing literature on the estimation of the GABA and re-lated aminoacids in the brain use OPA with β-mercaptoethanol or sodium sulphite as the derivatizing agent for the detection and/or quantification of this aminoacid. However, the products formed using these derivatizing agents are not stable for longer duration and require faster online estima-tion [7]. The half-lives of various GABA derivatives are compared in Table II. One of the preliminary reports of GABA estimations by Lasley et al. (1984) showed a derivative with a half-life of 4.1 min and a run time of 35 min using OPA–β-mercaptoethanol [18]. Since then, several modifica-tions of this method have been tried in subsequent literature emanating for GABA estimation. Recent literature has shown the use of modified deriva-tive agents like 1,2-benzo-3,4-dihydrocarbazole-9-ethyl chloroformate, sub-stitution of β-mercaptoethanol with β-mercaptopropionic acid, sodium sul-phite, etc. which could slightly increase the stability of the derivatives until the analysis time such as for few hours, ensuing from various precautionary
Unauthenticated | Downloaded 02/22/22 12:37 AM UTC
K.K. Akula et al.
424
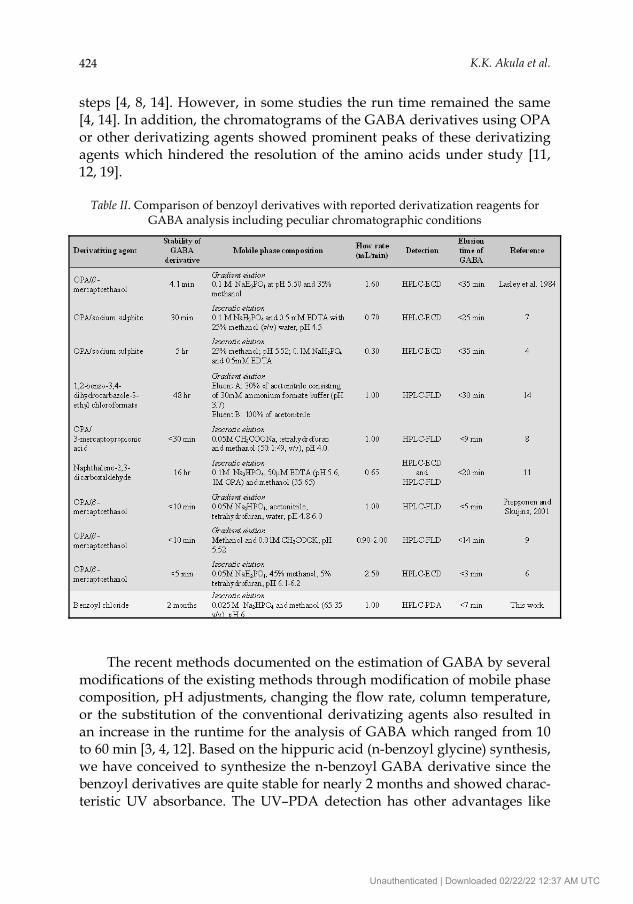
steps [4, 8, 14]. However, in some studies the run time remained the same [4, 14]. In addition, the chromatograms of the GABA derivatives using OPA or other derivatizing agents showed prominent peaks of these derivatizing agents which hindered the resolution of the amino acids under study [11, 12, 19].
Table II. Comparison of benzoyl derivatives with reported derivatization reagents for
GABA analysis including peculiar chromatographic conditions
The recent methods documented on the estimation of GABA by several modifications of the existing methods through modification of mobile phase composition, pH adjustments, changing the flow rate, column temperature, or the substitution of the conventional derivatizing agents also resulted in an increase in the runtime for the analysis of GABA which ranged from 10 to 60 min [3, 4, 12]. Based on the hippuric acid (n-benzoyl glycine) synthesis, we have conceived to synthesize the n-benzoyl GABA derivative since the benzoyl derivatives are quite stable for nearly 2 months and showed charac-teristic UV absorbance. The UV–PDA detection has other advantages like
Unauthenticated | Downloaded 02/22/22 12:37 AM UTC
HPLC Method for the Estimation of GABA
425
wide availability because of comparative lower cost, free from the probabil-ity of coulometric or amperometric electrode degradation usually present in electrochemical detectors, and therefore, good reproducibility can be ob-tained with derivatives detectable by UV–PDA detectors [14, 16].
The GABA derivative was synthesized in bulk using large quantities of the reactants and at each step for the derivatization reaction was monitored by TLC. After several attempts, we optimized the proper molar quantifica-tions of the reactants and specific steps were drawn out to recover the pure GABA derivative outlined above.
In order to circumvent the complexities in the use of gradient mobile phases, we have used a modified isocratic mobile phase consisting of 0.025 M disodium hydrogen phosphate buffer:methanol (65:35, v/v) at a pH 6. Initial experiments with several combinations of water and acetonitrile and/or methanol produced several impurity peaks which interfered with the peak of interest. Therefore, a normalization of the pH was found essen-tial and a buffer was selected with low concentration where the impurity peaks were reduced. The substitution of acetonitrile with methanol also re-sulted in a more economical means of mobile phase utilization since it has reduced the higher costs of procuring acetonitrile in times of sheer acetoni-trile shortage. The mobile phase flow rate was adjusted at 1 mL min−1 which gave the sharp peak of GABA at ~6 min. Although the isocratic mobile phase has been used in some of the recent reports, the run times ranging from 20 to 35 min and very low flow rate of 0.1 to 0.3 mL min−1 show a de-crease in the efficiency of chromatographic analysis of amino acids [4, 11].
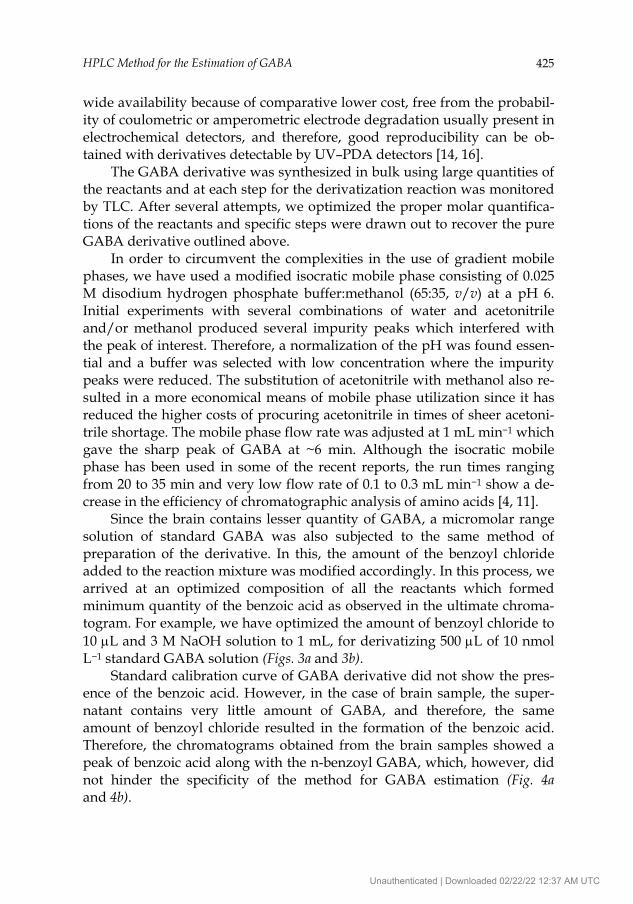
Since the brain contains lesser quantity of GABA, a micromolar range solution of standard GABA was also subjected to the same method of preparation of the derivative. In this, the amount of the benzoyl chloride added to the reaction mixture was modified accordingly. In this process, we arrived at an optimized composition of all the reactants which formed minimum quantity of the benzoic acid as observed in the ultimate chroma-togram. For example, we have optimized the amount of benzoyl chloride to 10 μL and 3 M NaOH solution to 1 mL, for derivatizing 500 μL of 10 nmol L−1 standard GABA solution (Figs. 3a and 3b).
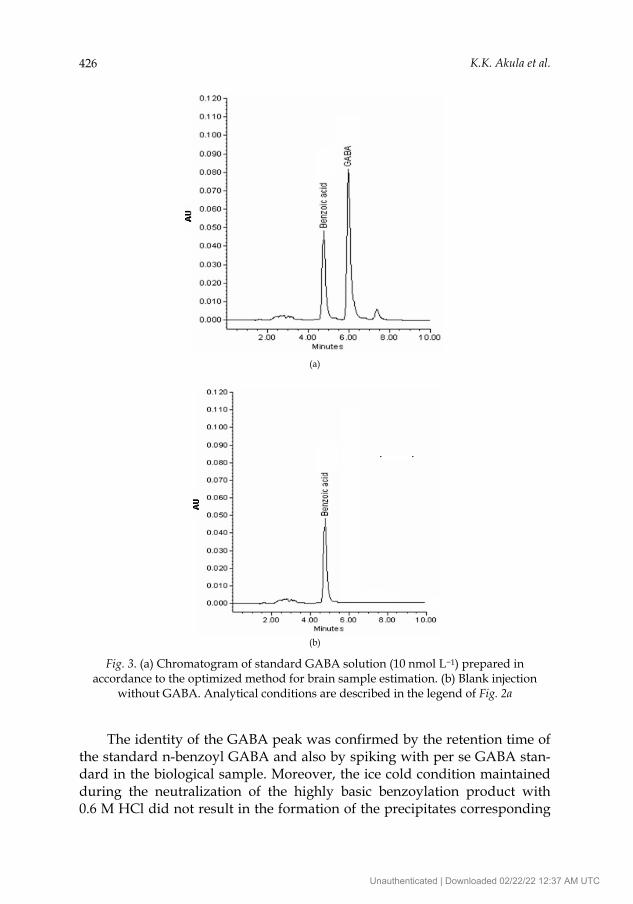
Standard calibration curve of GABA derivative did not show the pres-ence of the benzoic acid. However, in the case of brain sample, the super-natant contains very little amount of GABA, and therefore, the same amount of benzoyl chloride resulted in the formation of the benzoic acid. Therefore, the chromatograms obtained from the brain samples showed a peak of benzoic acid along with the n-benzoyl GABA, which, however, did not hinder the specificity of the method for GABA estimation (Fig. 4a and 4b).
Unauthenticated | Downloaded 02/22/22 12:37 AM UTC
K.K. Akula et al.
426
(a)
(b)
Fig. 3. (a) Chromatogram of standard GABA solution (10 nmol L−1) prepared in accordance to the optimized method for brain sample estimation. (b) Blank injection
without GABA. Analytical conditions are described in the legend of Fig. 2a The identity of the GABA peak was confirmed by the retention time of
the standard n-benzoyl GABA and also by spiking with per se GABA stan-dard in the biological sample. Moreover, the ice cold condition maintained during the neutralization of the highly basic benzoylation product with 0.6 M HCl did not result in the formation of the precipitates corresponding
Unauthenticated | Downloaded 02/22/22 12:37 AM UTC
HPLC Method for the Estimation of GABA
427
to glutamate, aspartate, and other biological amino acids tested in our pre-liminary experiments. In addition, spectral identity between the standard stored in the Empower software with that of the GABA present in the ana-lyte sample also emphasizes the identification of GABA derivative in bio-logical sample.
(a)
(b)
Fig. 4. (a) Representative chromatogram of n-benzoyl GABA in rat striatal tissue. (b) Blank injection without brain tissue sample. Analytical conditions are described
in the legend of Fig. 2a
Unauthenticated | Downloaded 02/22/22 12:37 AM UTC
K.K. Akula et al.
428
Overall, the two most attractive advantages of this method are higher stability of benzoyl derivative and convenience in analysis. The utility of isocratic mobile phase of disodium hydrogen phosphate buffer:methanol (65:35, v/v) and simple derivatization process reduced the chromatographic runtime below 7 min, indicating the higher efficiency of the present method as compared to the existing chromatographic methods for the detection of GABA, which yielded the run times up to 60 min [3, 4] and with less stabil-ity of derivatives [7, 3, 12].
Method Validation
Assay Linearity
Working standard of GABA in mobile phase composition ranging from 1.00 to 250.00 nmol L−1 was used to build the calibration curves. The peak areas obtained from these linearity studies were plotted against the concentration, and the plots were subjected to linear regression analysis. The data for the triplicates of the standard GABA samples gave an r2 value of 0.9996 (regres-sion equation, y = 3093x−2955.8) in the concentration range studied. The data from the linearity curve show that the response of the GABA dilutions was absolutely linear in the concentration ranges studied. A very high cor-relation was obtained for all the components in the mixture with an RSD of <0.70%.
Accuracy and Precision
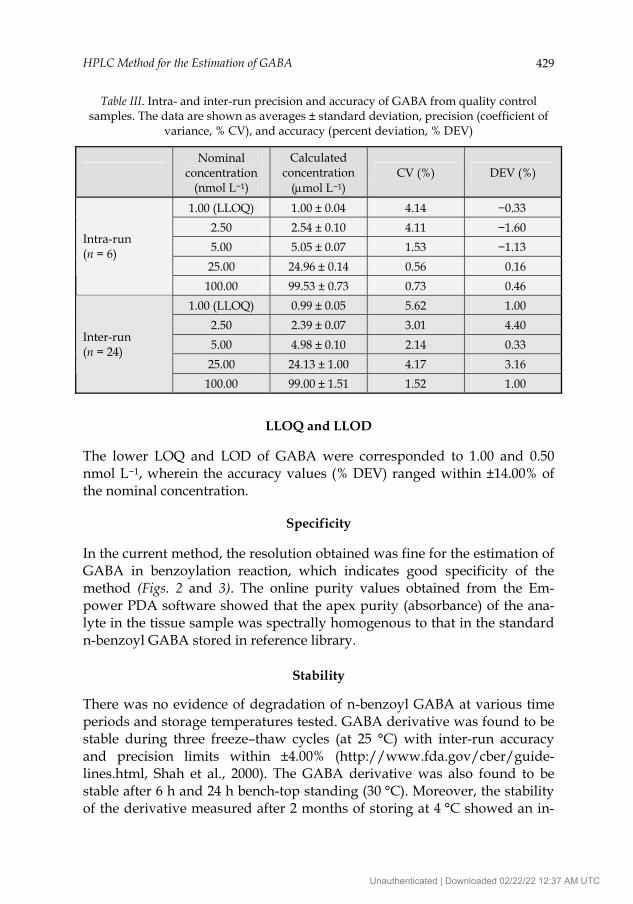
The accuracy and the precision of the results for intra-run quality control samples were within an acceptable level with DEV and CV values <5.00% (Table III). The reproducibility of the method was evaluated by repeatability studies of these quality control samples of 1.00, 2.50, 5.00, 25.00, and 100.00 nmol L−1. The accuracy and precision of the assay results in case inter-run samples (Table III) are shown by DEV and CV values <6.00%, which is ac-ceptable according to established validation protocols [20, 21].
Unauthenticated | Downloaded 02/22/22 12:37 AM UTC
HPLC Method for the Estimation of GABA
429
Table III. Intra- and inter-run precision and accuracy of GABA from quality control samples. The data are shown as averages ± standard deviation, precision (coefficient of
variance, % CV), and accuracy (percent deviation, % DEV)
Nominal
concentration (nmol L−1)
Calculated concentration
(μmol L−1) CV (%) DEV (%)
1.00 (LLOQ) 1.00 ± 0.04 4.14 −0.33 2.50 2.54 ± 0.10 4.11 −1.60 5.00 5.05 ± 0.07 1.53 −1.13 25.00 24.96 ± 0.14 0.56 0.16
Intra-run (n = 6)
100.00 99.53 ± 0.73 0.73 0.46 1.00 (LLOQ) 0.99 ± 0.05 5.62 1.00
2.50 2.39 ± 0.07 3.01 4.40 5.00 4.98 ± 0.10 2.14 0.33 25.00 24.13 ± 1.00 4.17 3.16
Inter-run (n = 24)
100.00 99.00 ± 1.51 1.52 1.00
LLOQ and LLOD
The lower LOQ and LOD of GABA were corresponded to 1.00 and 0.50 nmol L−1, wherein the accuracy values (% DEV) ranged within ±14.00% of the nominal concentration.
Specificity
In the current method, the resolution obtained was fine for the estimation of GABA in benzoylation reaction, which indicates good specificity of the method (Figs. 2 and 3). The online purity values obtained from the Em-power PDA software showed that the apex purity (absorbance) of the ana-lyte in the tissue sample was spectrally homogenous to that in the standard n-benzoyl GABA stored in reference library.
Stability
There was no evidence of degradation of n-benzoyl GABA at various time periods and storage temperatures tested. GABA derivative was found to be stable during three freeze–thaw cycles (at 25 °C) with inter-run accuracy and precision limits within ±4.00% (http://www.fda.gov/cber/guide-lines.html, Shah et al., 2000). The GABA derivative was also found to be stable after 6 h and 24 h bench-top standing (30 °C). Moreover, the stability of the derivative measured after 2 months of storing at 4 °C showed an in-
Unauthenticated | Downloaded 02/22/22 12:37 AM UTC
K.K. Akula et al.
430
ter-run accuracy and precision within ±6.00% (data not shown). This data proves the excellent stability of the benzoyl derivative compared with the widely used OPA derivatives.
Sensitivity and Recovery
PDA detection of GABA in the range of 3.39 nmol mg−1 tissue indicates the good sensitivity of this method. The experimental recovery of the analyte extracted from brain tissues by this method was assessed by relating the peak area to the regression line of the standard calibration curve. The ana-lytical recovery of GABA derivative was found to be 96.31%. The absolute recoveries of this analyte eliminated the need of an internal standard. The CV (%) of the peak areas and the retention times were within ±5.00% and ±0.50%, respectively. The results demonstrated that the pretreatment and derivatization with benzoyl chloride are satisfactory for the quantification of GABA in biological tissue samples.
Application of the HPLC Method to Study GABA Levels in Rat Brain
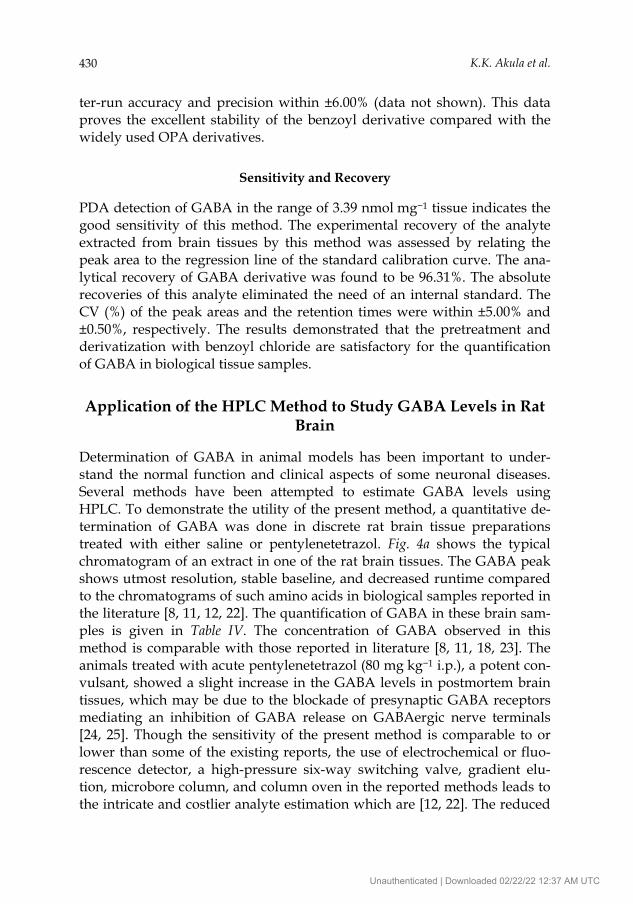
Determination of GABA in animal models has been important to under-stand the normal function and clinical aspects of some neuronal diseases. Several methods have been attempted to estimate GABA levels using HPLC. To demonstrate the utility of the present method, a quantitative de-termination of GABA was done in discrete rat brain tissue preparations treated with either saline or pentylenetetrazol. Fig. 4a shows the typical chromatogram of an extract in one of the rat brain tissues. The GABA peak shows utmost resolution, stable baseline, and decreased runtime compared to the chromatograms of such amino acids in biological samples reported in the literature [8, 11, 12, 22]. The quantification of GABA in these brain sam-ples is given in Table IV. The concentration of GABA observed in this method is comparable with those reported in literature [8, 11, 18, 23]. The animals treated with acute pentylenetetrazol (80 mg kg−1 i.p.), a potent con-vulsant, showed a slight increase in the GABA levels in postmortem brain tissues, which may be due to the blockade of presynaptic GABA receptors mediating an inhibition of GABA release on GABAergic nerve terminals [24, 25]. Though the sensitivity of the present method is comparable to or lower than some of the existing reports, the use of electrochemical or fluo-rescence detector, a high-pressure six-way switching valve, gradient elu-tion, microbore column, and column oven in the reported methods leads to the intricate and costlier analyte estimation which are [12, 22]. The reduced
Unauthenticated | Downloaded 02/22/22 12:37 AM UTC
HPLC Method for the Estimation of GABA
431
runtimes for GABA, increased stability of GABA derivative, and increased efficiency of analysis make this method competent for the comparison of changes in GABA levels in both diseased and control conditions.
Table IV. GABA levels in discrete regions of rat brains. The amounts are expressed as nmol mg−1 wet tissue. Pentylenetetrazol (PTZ) was administered at a dose of
80 mg kg−1 i.p. Values are mean ± SD of six animals with three technical replicates
Frontal cortex Striatum Globus pallidus
Saline PTZ Saline PTZ Saline PTZ
GABA (nmol mg−1 tissue)
3.39 ± 1.91 5.56 ± 1.22 10.44 ± 3.67 11.34 ± 2.49 9.37 ± 2.95 8.88 ± 1.78
Conclusion
The RP-HPLC chromatographic method described over here is simple, spe-cific, and reproducible for the determination of GABA. It was demonstrated that this method could be applicable for quantifying this foremost inhibi-tory neurotransmitter in the rat brain tissue samples. In particular, this method selectively allows for the determination of this analyte without any interference from the peaks of varied matrix components including several other similar aminoacids and biological amines in the brain samples. The benzoyl derivative of GABA formed by this method was stable for 2 months compared to those formed by conventional derivatizing agents. Moreover, the method utilizes the widely available benzoyl chloride, which is more economical compared to the OPA used in most of the existing methods for the estimation of the amino acids and biological amines. The use of the in-tricate gradient methods of elusion for the estimation of these aminoacids has been overcome by the isocratic mixture of phosphate buffer and metha-nol (65:35, v/v) at lower strengths. This isocratic mobile phase led to the rapid estimation of GABA within 7 min. Further refinement of this derivati-zation procedure to completely eliminate the chromatographic peak of ben-zoic acid, formed as byproduct, will still improve this method in revealing the role of GABA in normal and pathological processes.
The better specificity of the method allows for its application to study the possible correlation of the GABA in the diagnosis of several neurologi-cal and psychiatric disorders and their modification by drugs.
Unauthenticated | Downloaded 02/22/22 12:37 AM UTC
K.K. Akula et al.
432
Acknowledgement
The study was carried out at the UGC—Centre with Potential for Excellence in Biomedical Sciences (CPEBS), Panjab University. The authors also wish to acknowledge Dr. K.N. Singh, Associate Professor of Chemistry, Panjab Uni-versity. The NMR analysis done by Mr. Avtar Singh, Scientific Officer, Re-gional Sophisticated Instrumentation Centre, Panjab University is highly appreciated.
Conflict of Interest
The authors do not have any conflict of interest.
References [1] S.K. Kulkarni, Developments in Psychopharmacology, vol. 1, Satish Serial Publish-
ing House, New Delhi, India, 2006, pp. 1–13 [2] B. George and S.K. Kulkarni, Methods Find. Exp. Clin. Pharmacol., 18, 335–340
(1996) [3] K. Rea, T.I.F.H. Cremers, and B.H.C. Westerink, J. Neurochem., 94, 672–679 (2005) [4] A.A. Monge-Acuña and J. Fornaguera-Trías, J. Neurosci. Methods, 183, 176–181
(2009) [5] B.A. Donzanti and B.K. Yamamoto, Life Sci., 43, 913–922 (1988) [6] S. Murai, H. Nagahama, H. Saito, H. Miyate, Y. Masuda, and T. Itoh, J. Pharmacol.
Methods, 21, 115–121 (1989) [7] H.L. Rowley, K.F. Martin, and C.A. Marsden, J. Neurosci. Methods, 57, 93–99 (1995) [8] D.M. de Freitas Silva, V.P. Ferraz, and A.M. Ribeiro, J. Neurosci. Methods, 177, 289–
293 (2009) [9] L. Bianchi, L. Della Corte, and K.F. Tipton, J. Chromatogr. B, 723, 47–59 (1999)
[10] Y. Xiao, X.D. Yu, K. Wang, J.J. Xu, J. Huang, and H.Y. Chen, Talanta, 71, 2048–2055 (2007)
[11] G. Clarke, S. O’Mahony, G. Malone, and T.G. Dinan, J. Neurosci. Methods, 160, 223–230 (2007)
[12] S. Zhang, Y. Takeda, S. Hagioka, K. Takata, H. Aoe, H. Nakatsuka, M. Yokoyama, and K. Morita, Brain Res. Protoc., 14, 61–66 (2005)
[13] J.L. Adcock, N.W. Barnett, J.W. Costin, P.S. Francis, and S.W. Lewis, Talanta, 67, 585–589 (2005)
[14] X.E. Zhao and Y.R. Suo, Talanta, 76, 690–697 (2008) [15] J. Oehlke, M. Brudel, and I.E. Blasig, J. Chromatogr. B, 655, 105–111 (1994) [16] M. Yoshitake, H. Nohta, H. Yoshida, T. Yoshitake, K. Todoroki, and M. Yamaguchi,
Anal. Chem., 78, 920–927 (2006) [17] H.E. Carter and C.M. Stevens, J. Biol. Chem., 138, 627–629 (1941) [18] S.M. Lasley, R.D. Greenland, and I.A. Michaelson, Life Sci., 35, 1921–1930 (1984) [19] J. McKenzie, C. Watson, R. Rostand, I. German, S. Witowski, and R. Kennedy,
J. Chromatogr. A, 962, 105–115 (2002)
Unauthenticated | Downloaded 02/22/22 12:37 AM UTC
HPLC Method for the Estimation of GABA
433
[20] US Department of Health and Humans Services, Food and Drug Administration, Guidance for Industry Q2B Validation of Analytical Procedures: Methodology, 1996, http://www.fda.gov/cber/guidelines.htm
[21] K.K. Akula, M. Kaur, M. Bishnoi, and S.K. Kulkarni, J. Sep. Sci., 31, 3139–3147 (2008)
[22] T.P. Piepponen and A. Skujins, J. Chromatogr. B, 757, 277–283 (2001) [23] A.G. Chapman, K. Riley, M.C. Evans, and B.S. Meldrum, Neurochem. Res., 7, 1089–
1105 (1982) [24] T. de Boer, J.C. Stoof, and H. van Duijn, Brain Res., 253, 153–160 (1982) [25] G. Nyitrai, K.A. Kékesi, and G. Juhász, Curr. Top. Med. Chem., 6, 935–940 (2006)
Accepted by DA
Unauthenticated | Downloaded 02/22/22 12:37 AM UTC


![HPLC Method Development[1]](https://static.fdocument.org/doc/165x107/55179c7c4979599d0e8b4652/hplc-method-development1.jpg)


![C18, C18-WP, HFC18-16, HFC18-30,RP-AQUA, …1].pdfChromaNik Technologies Inc. SunShell 2 μm, 2.6 μm, 3.4 μm and 5 μm HPLC column Core Shell Particle C18, C18-WP, HFC18-16, HFC18-30,RP-AQUA,](https://static.fdocument.org/doc/165x107/5be363f509d3f24a208d0dd6/c18-c18-wp-hfc18-16-hfc18-30rp-aqua-1pdfchromanik-technologies-inc-sunshell.jpg)