Cooperative Growth of Pearliteweb.access.rwth-aachen.de/THERMOCALC/proceedings/... · Conclusion...
24
Ingo Steinbach Cooperative Growth of Pearlite Acknowledgement: Katsumi Nakajima, Markus Apel, JFE Steel Corporation for financial support
Transcript of Cooperative Growth of Pearliteweb.access.rwth-aachen.de/THERMOCALC/proceedings/... · Conclusion...
Ingo Steinbach
Cooperative Growth of Pearlite
Acknowledgement: Katsumi Nakajima, Markus Apel,
JFE Steel Corporation for financial support
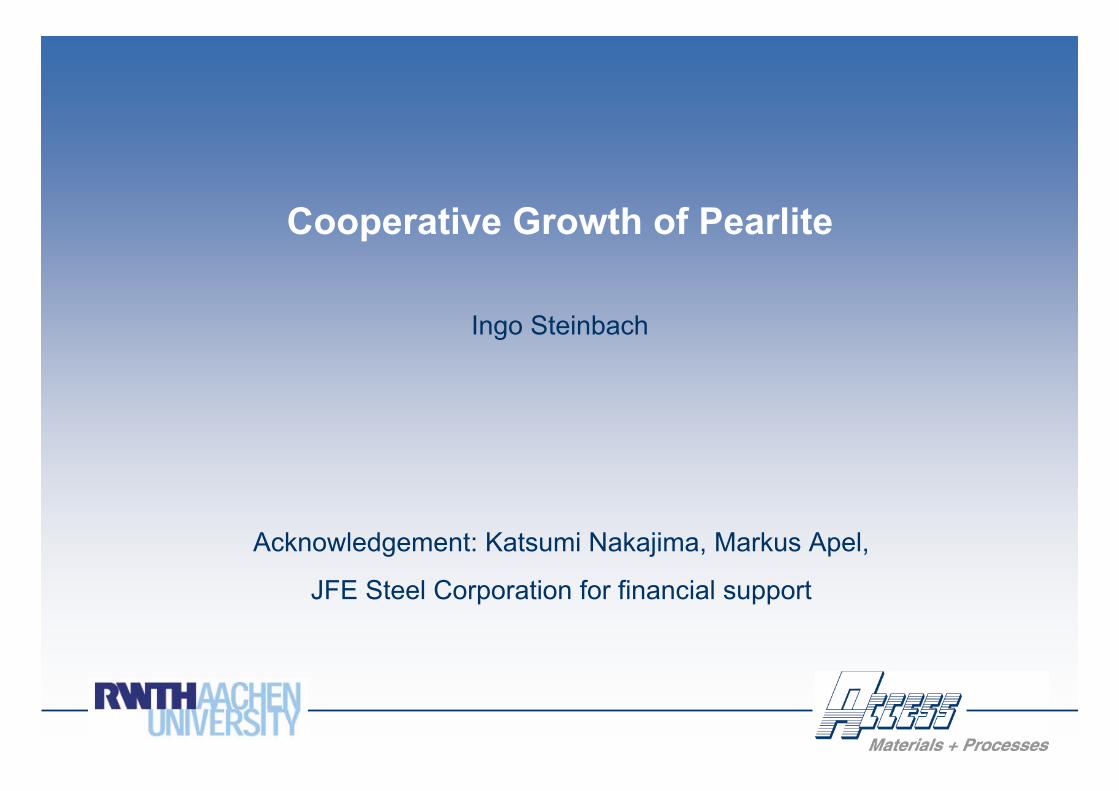
Cooperative Growth of Pearlite
„The microstructure ofsteels and cast iron“ byDurand-CharreMicrographs by Irsid-Arcelor
Introduction
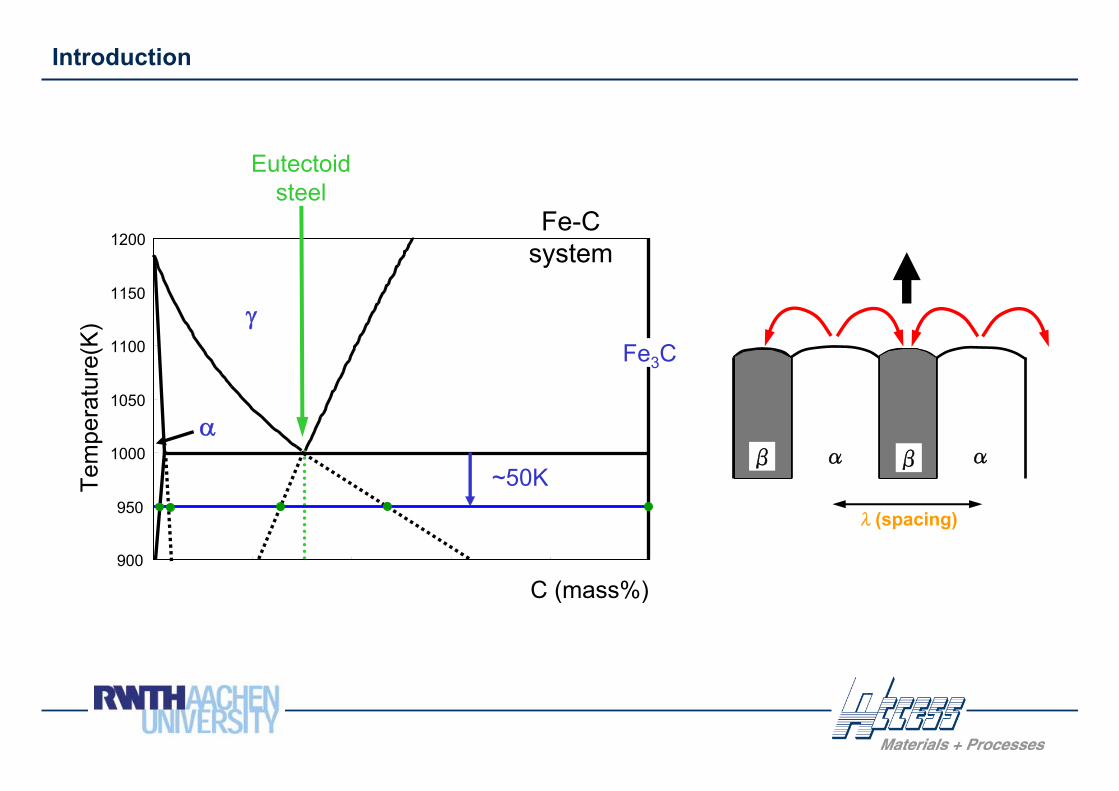
αα ββ
λ(spacing)
900
950
1000
1050
1100
1150
1200
Tem
pera
ture
(K)
C (mass%)
γ
α
Fe3C
Fe-C system
Eutectoid steel
~50K
Introduction
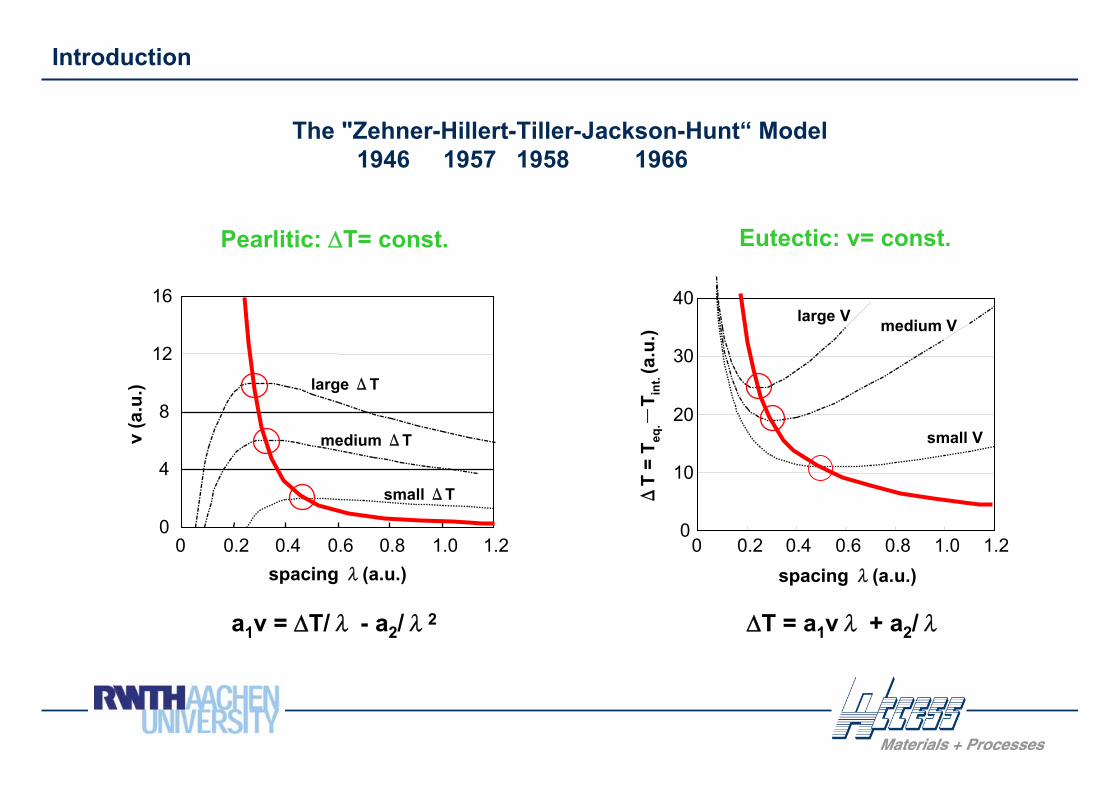
The "Zehner-Hillert-Tiller-Jackson-Hunt“ Model1946 1957 1958 1966
0
4
8
12
16
0 0.2 0.4 0.6 0.8 1.0 1.2
v (a
.u.) large ΔT
medium ΔT
small ΔT
spacing λ(a.u.)
0
10
20
30
40
0 0.2 0.4 0.6 0.8 1.0 1.2spacing λ(a.u.)
large V
small V
medium V
ΔT
= T e
q.-
T int
. (a.u
.)
Eutectic: v= const.Pearlitic: ΔT= const.
ΔT = a1vλ + a2/λa1v = ΔT/λ - a2/λ2
Introduction
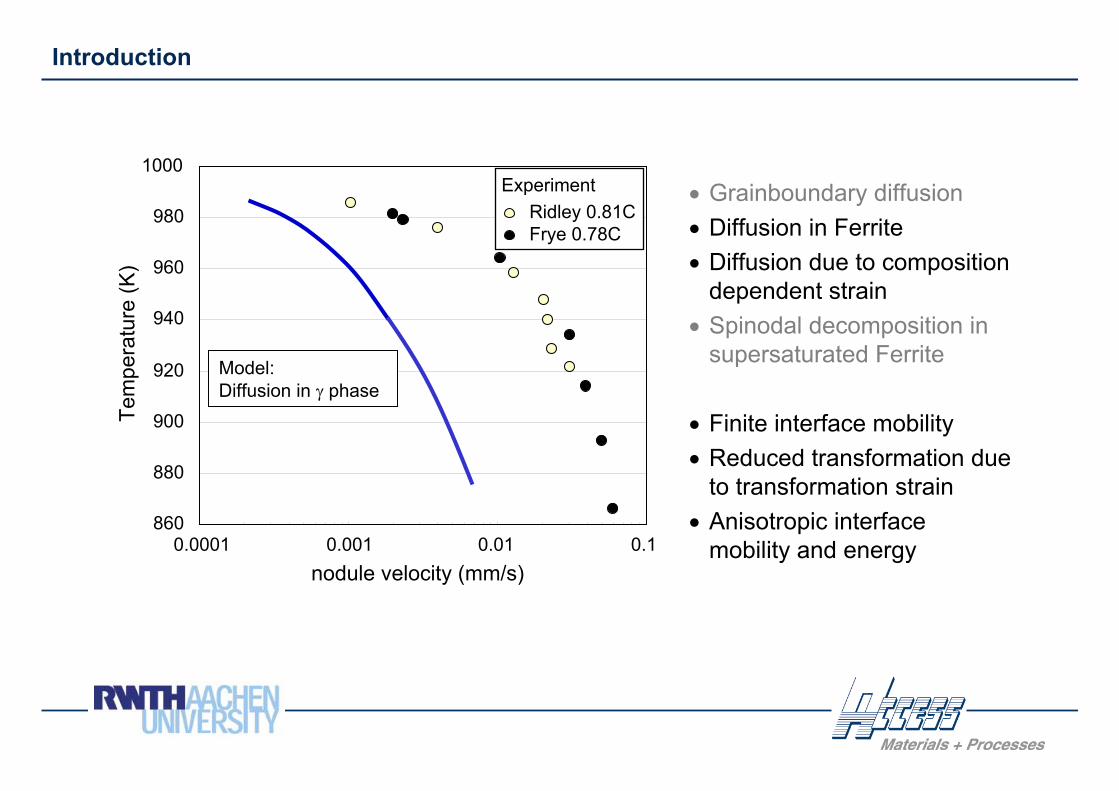
860
880
900
920
940
960
980
1000
0.0001 0.001 0.01 0.1
Tem
pera
ture
(K)
nodule velocity (mm/s)
• Grainboundary diffusion• Diffusion in Ferrite• Diffusion due to composition
dependent strain• Spinodal decomposition in
supersaturated Ferrite
• Finite interface mobility• Reduced transformation due
to transformation strain• Anisotropic interface
mobility and energy
Model:Diffusion in γ phase
ExperimentRidley 0.81CFrye 0.78C
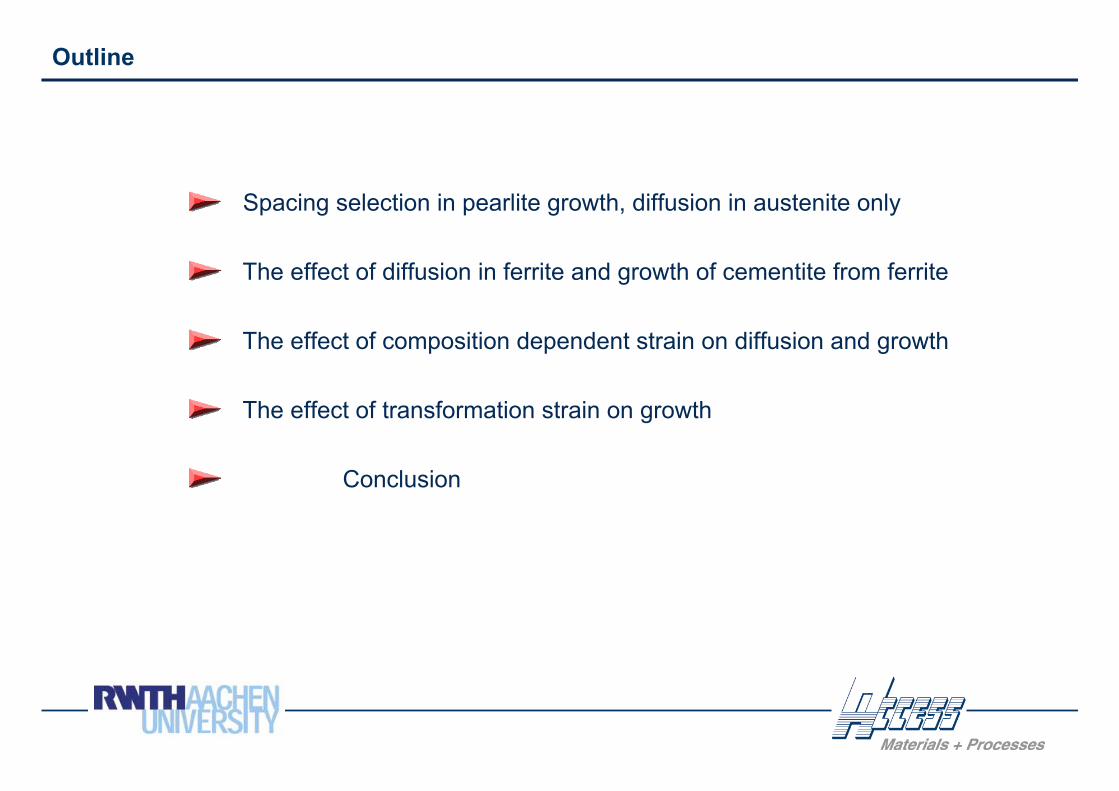
Outline
Spacing selection in pearlite growth, diffusion in austenite only
The effect of diffusion in ferrite and growth of cementite from ferrite
The effect of composition dependent strain on diffusion and growth
The effect of transformation strain on growth
Conclusion
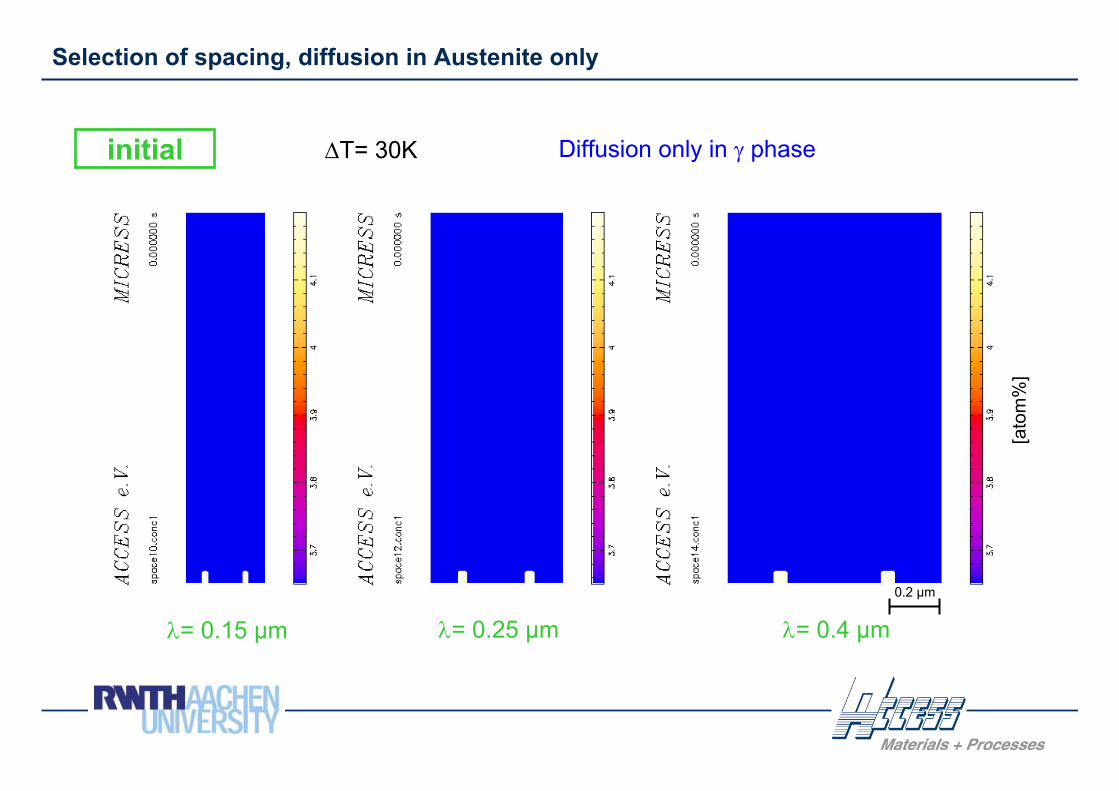
Selection of spacing, diffusion in Austenite only
[ato
m%
]
initial
λ= 0.15 µm λ= 0.25 µm λ= 0.4 µm
ΔT= 30K Diffusion only in γ phase
0.2 µm
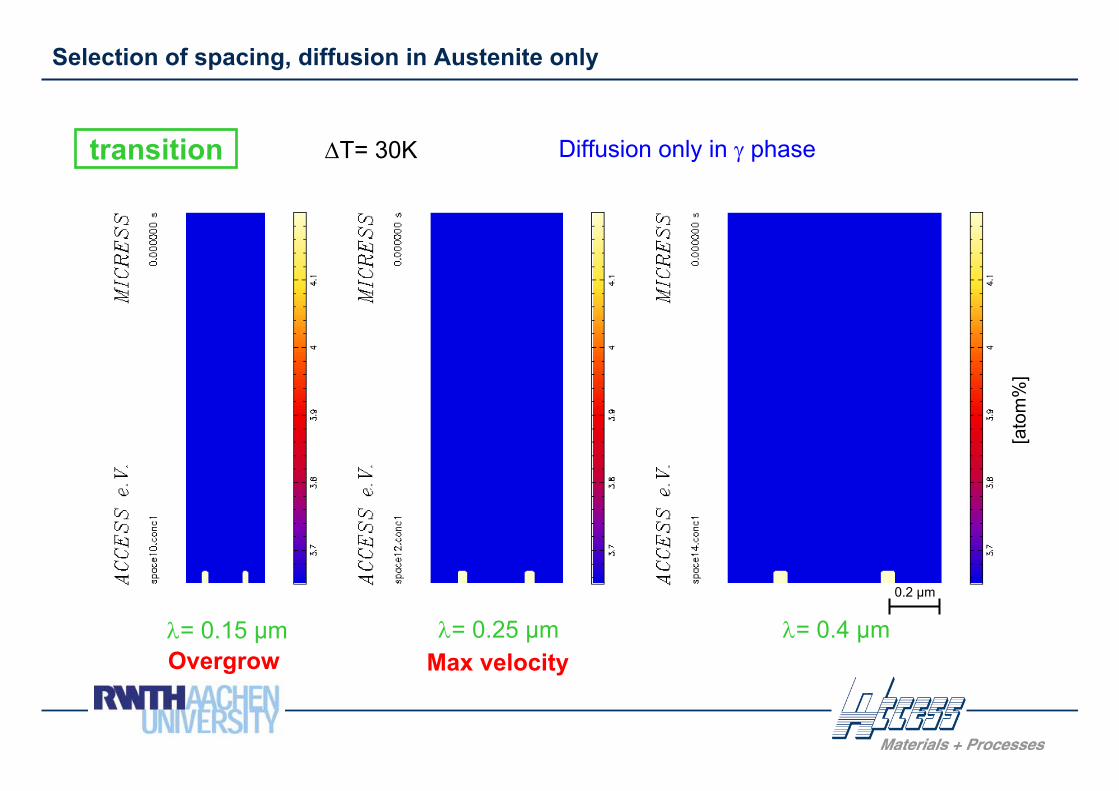
Selection of spacing, diffusion in Austenite only
Max velocityOvergrow
[ato
m%
]
transition
λ= 0.15 µm λ= 0.25 µm λ= 0.4 µm
ΔT= 30K Diffusion only in γ phase
0.2 µm
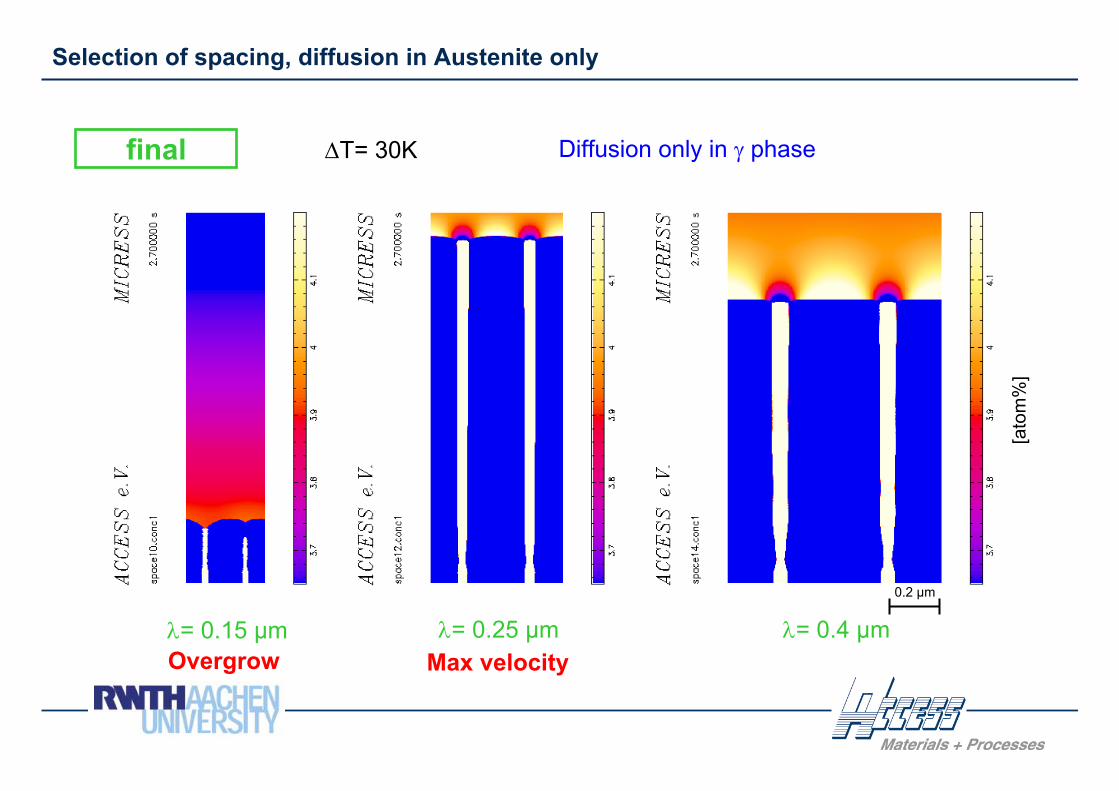
Selection of spacing, diffusion in Austenite only
Max velocityOvergrow
[ato
m%
]
final
λ= 0.15 µm λ= 0.25 µm λ= 0.4 µm
ΔT= 30K Diffusion only in γ phase
0.2 µm
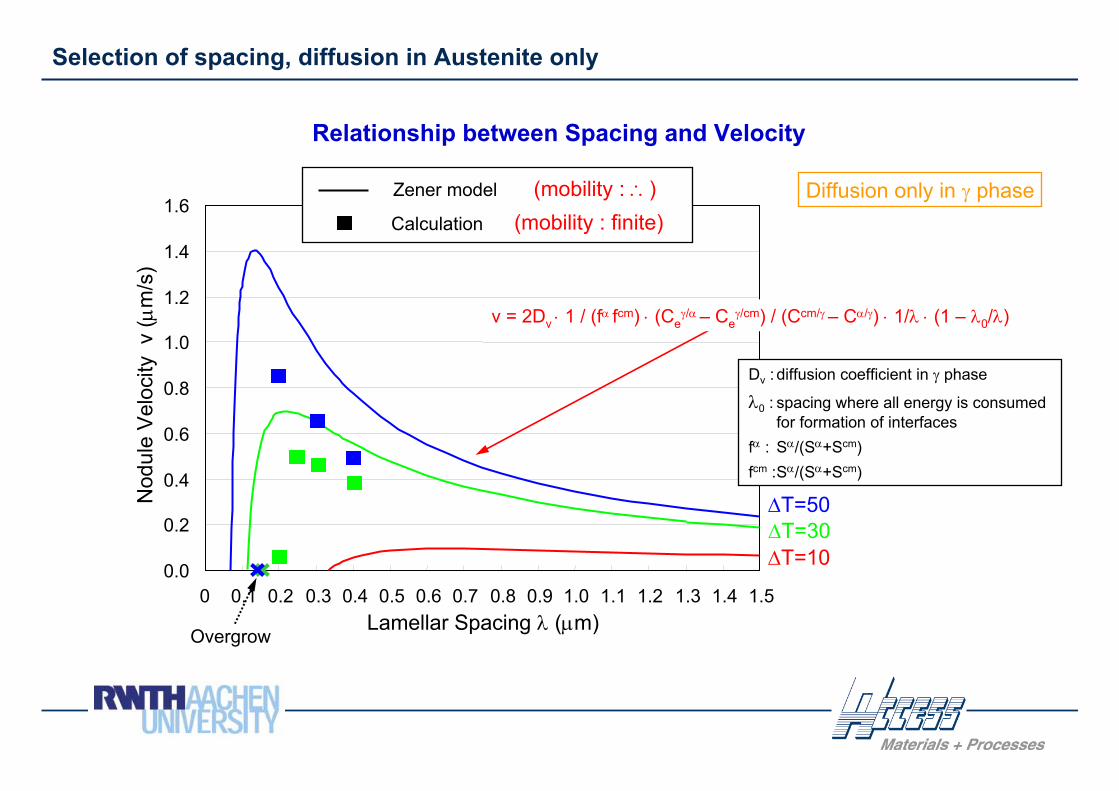
Selection of spacing, diffusion in Austenite only
Relationship between Spacing and Velocity
0.0
0.2
0.4
0.6
0.8
1.0
1.2
1.4
1.6
0 0.1 0.2 0.3 0.4 0.5 0.6 0.7 0.8 0.9 1.0 1.1 1.2 1.3 1.4 1.5Lamellar Spacing λ (μm)
Nod
ule
Vel
ocity
v (μ
m/s
)
Diffusion only in γ phase
ΔT=10ΔT=30ΔT=50
Zener model
Calculation
(mobility : ∴)(mobility : finite)
Dv :diffusion coefficient in γ phase
λ0 : spacing where all energy is consumedfor formation of interfaces
fα : Sα/(Sα+Scm)fcm :Sα/(Sα+Scm)
Overgrow
v = 2Dv ⋅ 1 / (fα fcm) ⋅ (Ceγ/α – Ce
γ/cm) / (Ccm/γ – Cα/γ) ⋅ 1/λ ⋅ (1 – λ0/λ)
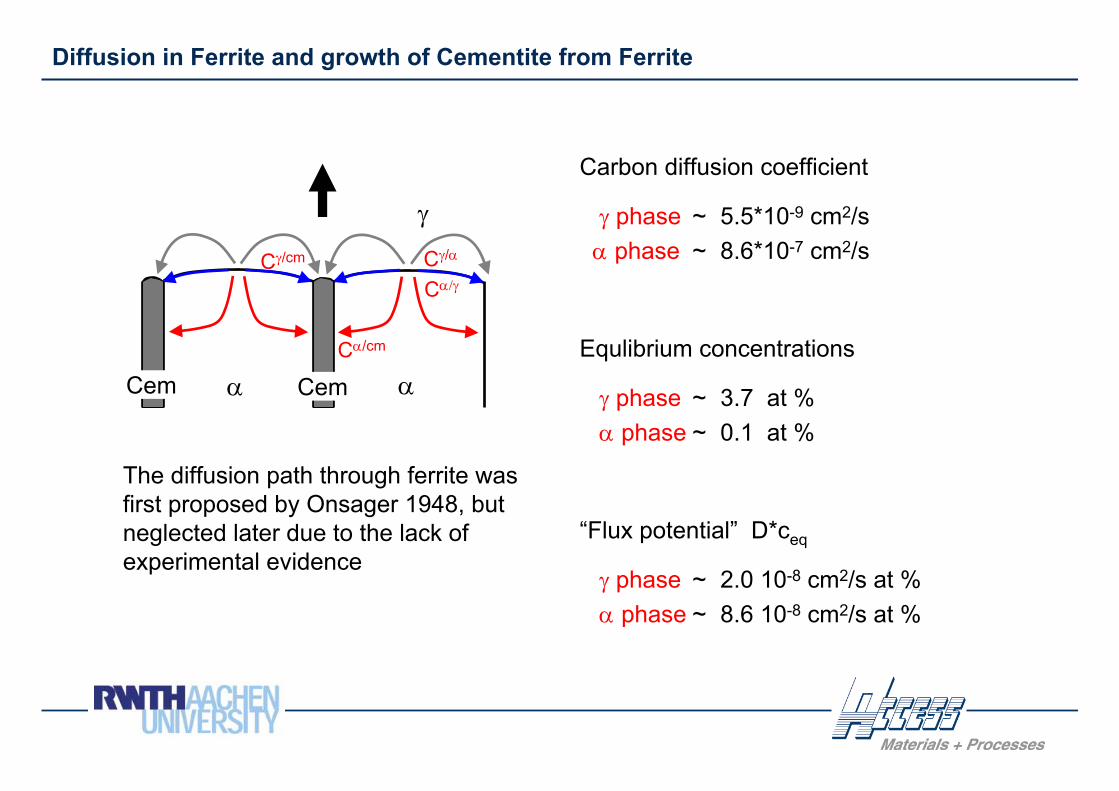
Diffusion in Ferrite and growth of Cementite from Ferrite
γ
α αCem Cem
Cγ/α
Cα/γCγ/cm
Cα/cm
Carbon diffusion coefficient
γ phase ~ 5.5*10-9 cm2/sα phase ~ 8.6*10-7 cm2/s
Equlibrium concentrations
γ phase ~ 3.7 at %α phase ~ 0.1 at %
“Flux potential” D*ceq
γ phase ~ 2.0 10-8 cm2/s at %α phase ~ 8.6 10-8 cm2/s at %
The diffusion path through ferrite was first proposed by Onsager 1948, butneglected later due to the lack of experimental evidence
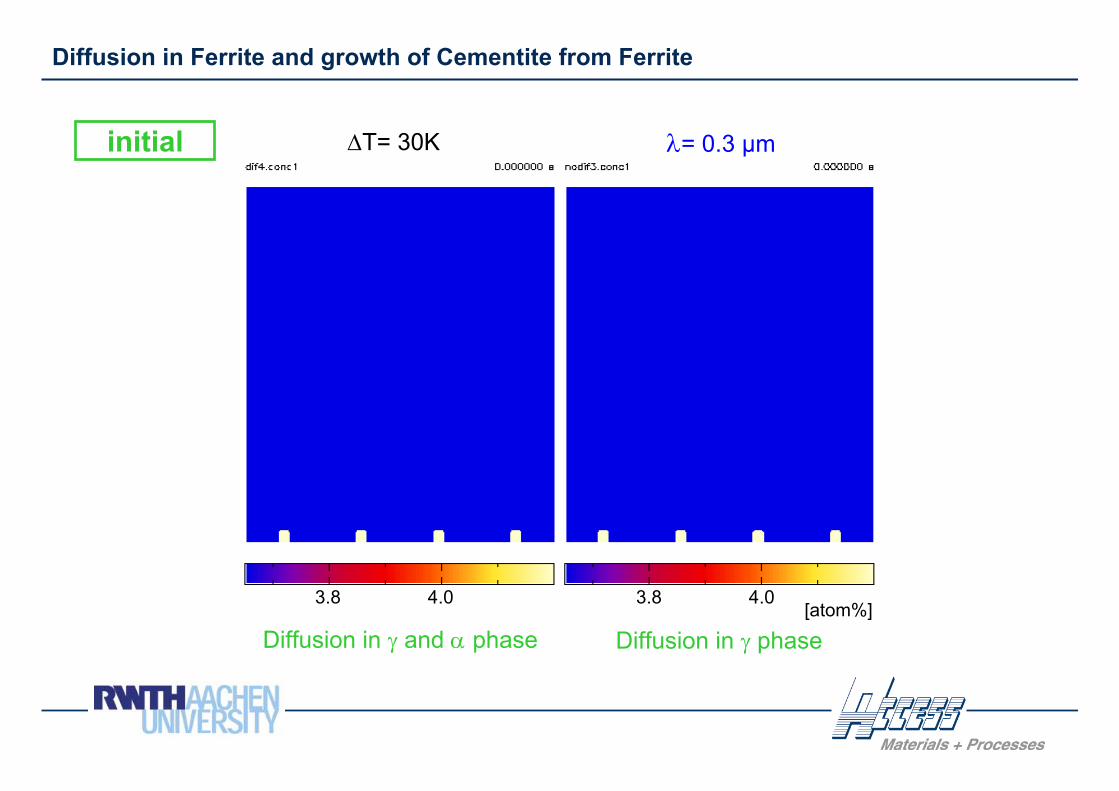
Diffusion in Ferrite and growth of Cementite from Ferrite
Diffusion in γ and α phase Diffusion in γ phase
initial ΔT= 30K λ= 0.3 µm
3.8 4.0 3.8 4.0[atom%]

Diffusion in Ferrite and growth of Cementite from Ferrite
Diffusion in γ and α phase Diffusion in γ phase
ΔT= 30K λ= 0.3 µmtransition
3.8 4.0 3.8 4.0[atom%]
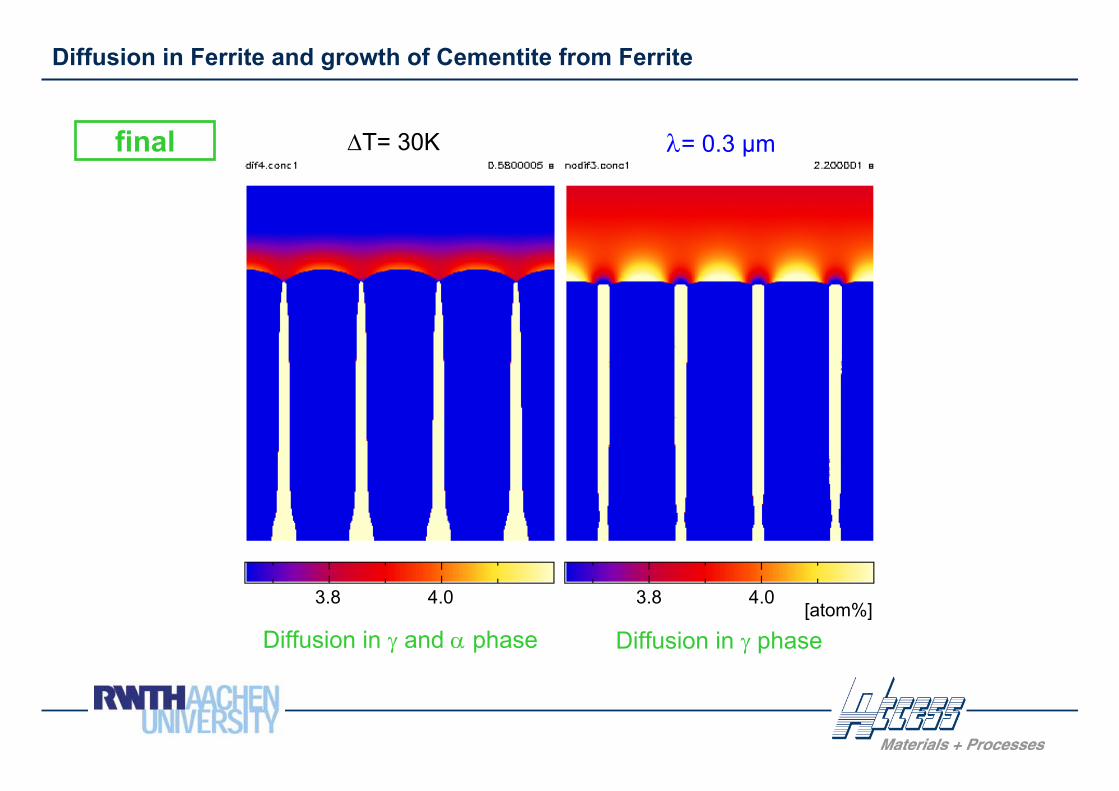
Diffusion in Ferrite and growth of Cementite from Ferrite
Diffusion in γ and α phase Diffusion in γ phase
final ΔT= 30K λ= 0.3 µm
3.8 4.0 3.8 4.0[atom%]
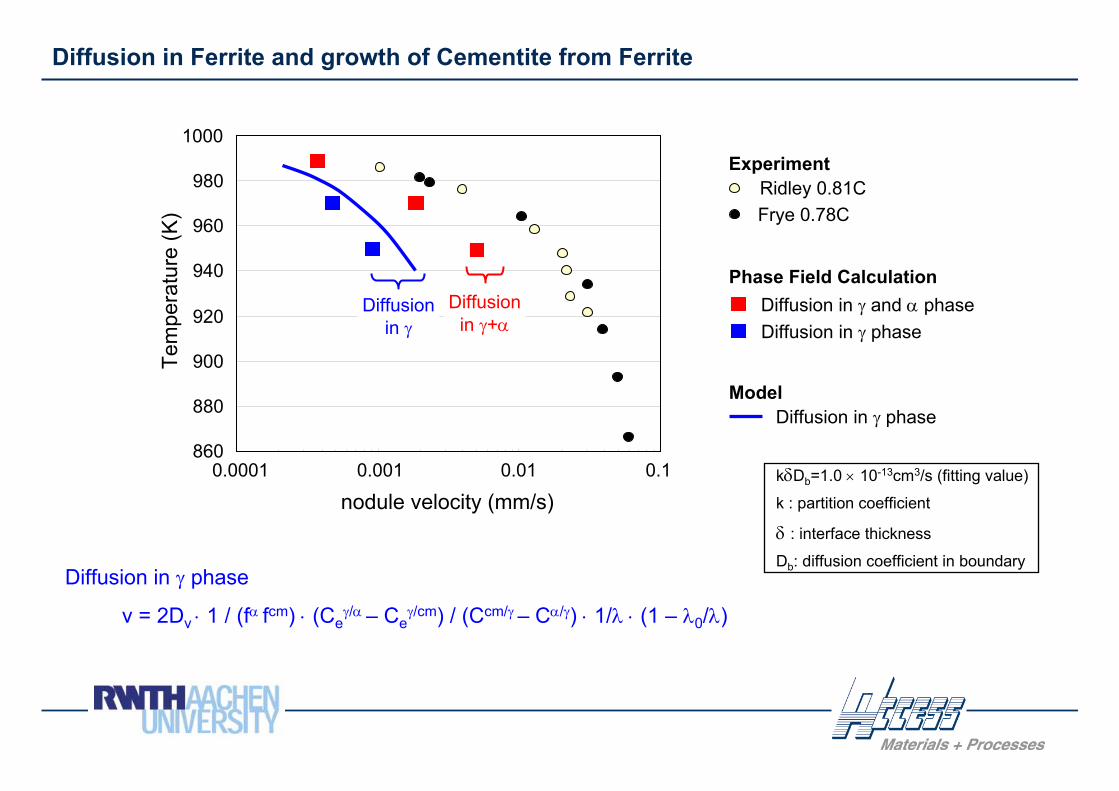
Diffusion in Ferrite and growth of Cementite from Ferrite
Diffusion in γ and α phasePhase Field Calculation
Ridley 0.81CFrye 0.78C
Experiment
860
880
900
920
940
960
980
1000
0.0001 0.001 0.01 0.1
Tem
pera
ture
(K)
nodule velocity (mm/s)
Model
Diffusion in γ phase
Diffusion in γ phase
Diffusion in γ
Diffusion in γ+α
Diffusion in γ phase
v = 2Dv ⋅ 1 / (fα fcm) ⋅ (Ceγ/α – Ce
γ/cm) / (Ccm/γ – Cα/γ) ⋅ 1/λ ⋅ (1 – λ0/λ)
kδDb=1.0 × 10⁻¹³cm3/s (fitting value)
k : partition coefficient
δ : interface thickness
Db: diffusion coefficient in boundary
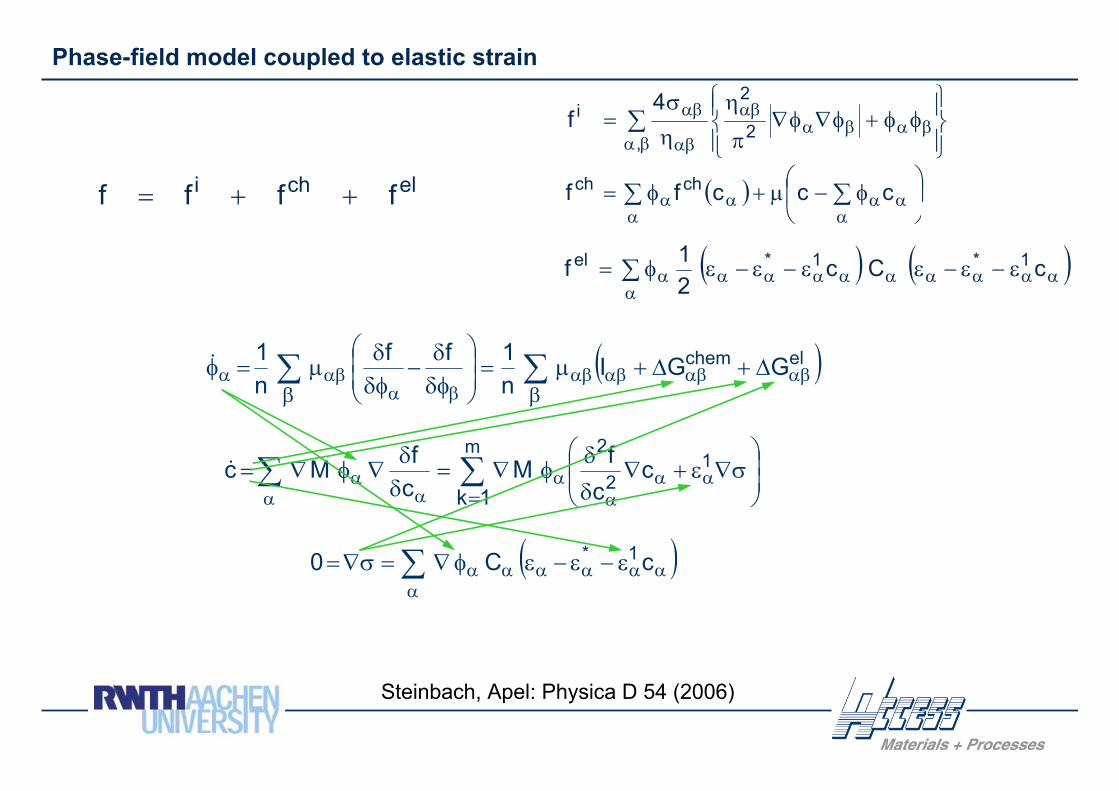
Phase-field model coupled to elastic strain
elchi ffff ++=
∑βα
βαβααβ
αβ
αβ
⎪⎭
⎪⎬⎫
⎪⎩
⎪⎨⎧
φφ+φ∇φ∇π
η
η
σ=
,2
2i 4
f
( ) ⎟⎠
⎞⎜⎝
⎛φ−μ+φ= ∑∑
ααα
ααα cccff chch
( ) ( )∑α
αααααααααα ε−ε−εε−ε−εφ= cCc21f 1*1*el
( )elchem GGIn1ff
n1
αβαβαβαββα
αβα Δ+Δ+μ=⎟⎟⎠
⎞⎜⎜⎝
⎛
δφδ
−δφδ
μ=φ ∑∑ββ
&
⎟⎟⎠
⎞⎜⎜⎝
⎛σ∇ε+∇
δδ
φ∇=δδ
∇φ∇= ααα
αα
αα
∑∑=
12
2mc
cfM
cfMc
1k&
( )ααααααα
ε−ε−εφ∇=σ∇= ∑ cC0 1*
Steinbach, Apel: Physica D 54 (2006)
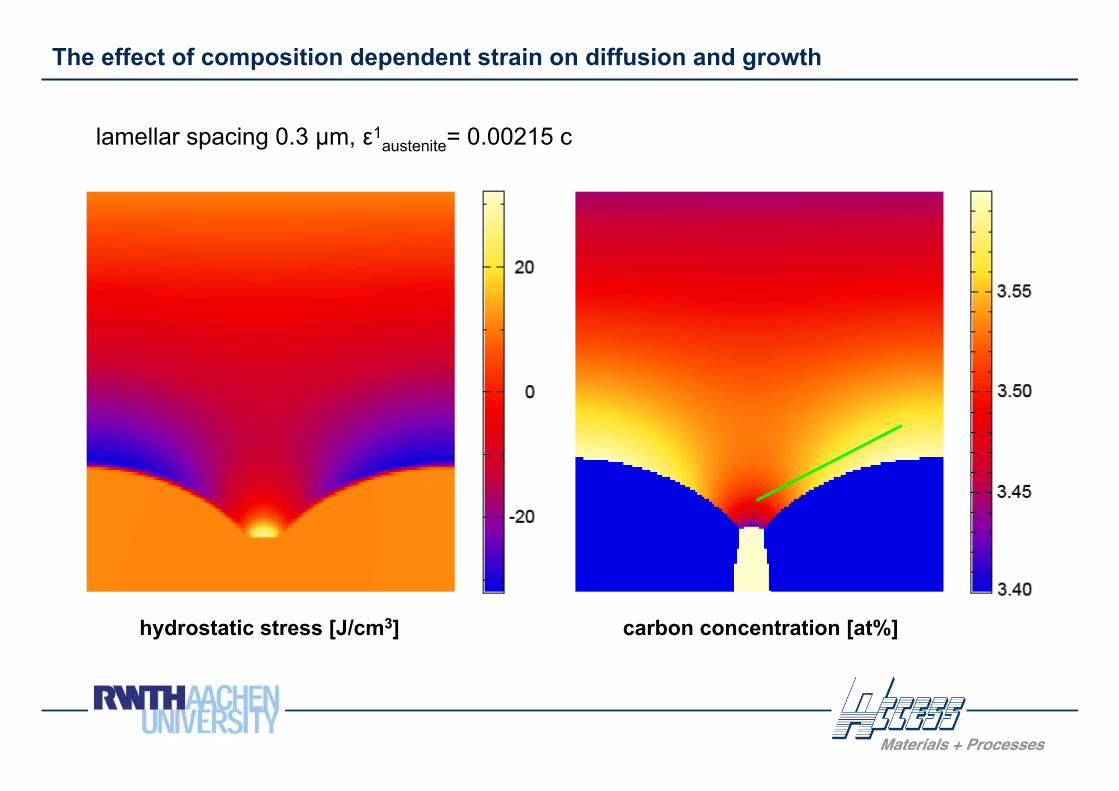
The effect of composition dependent strain on diffusion and growth
hydrostatic stress [J/cm3] carbon concentration [at%]
lamellar spacing 0.3 μm, ε1austenite= 0.00215 c
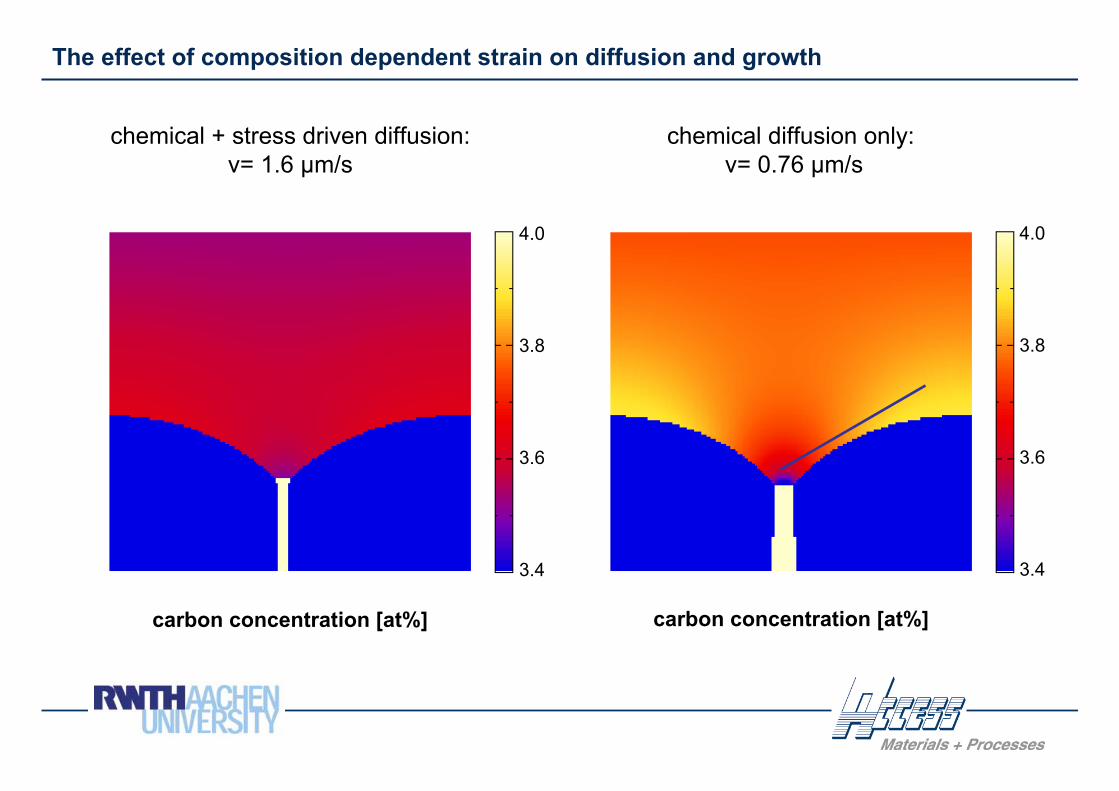
The effect of composition dependent strain on diffusion and growth
carbon concentration [at%] carbon concentration [at%]
chemical diffusion only:v= 0.76 μm/s
chemical + stress driven diffusion: v= 1.6 μm/s
3.4
3.6
3.8
4.0
3.4
3.6
3.8
4.0
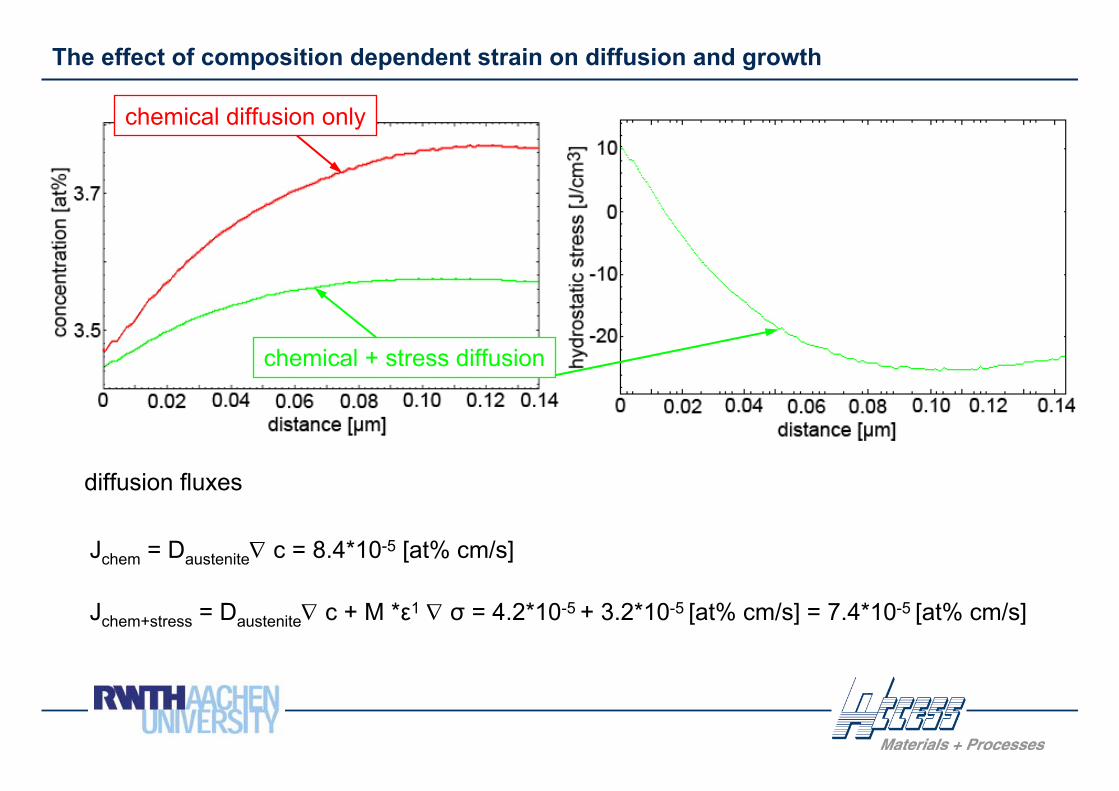
The effect of composition dependent strain on diffusion and growth
diffusion fluxes
Jchem = Daustenite∇ c = 8.4*10-5 [at% cm/s]
Jchem+stress = Daustenite∇ c + M *ε1 ∇ σ = 4.2*10-5 + 3.2*10-5 [at% cm/s] = 7.4*10-5 [at% cm/s]
chemical diffusion only
chemical + stress diffusion
The effect of composition dependent strain on diffusion and growth
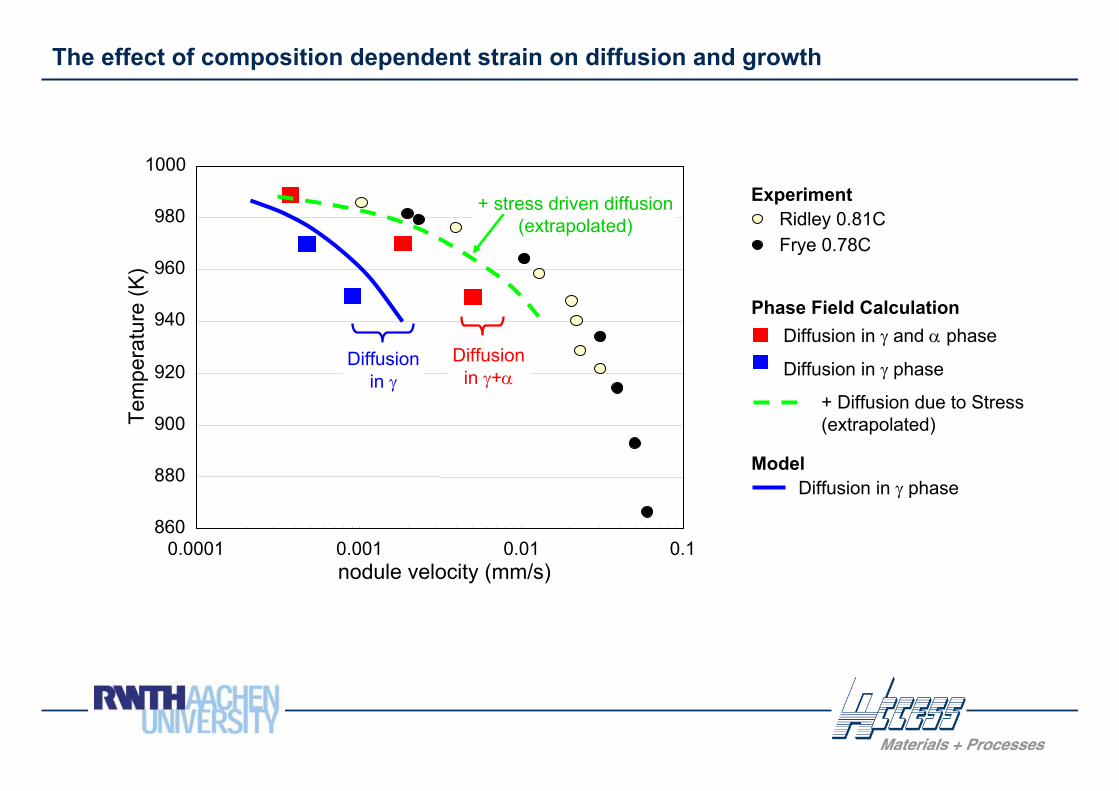
Phase Field Calculation
Ridley 0.81CFrye 0.78C
Experiment
ModelDiffusion in γ phase
Diffusion in γ and α phase
Diffusion in γ phase
+ Diffusion due to Stress (extrapolated)
860
880
900
920
940
960
980
1000
0.0001 0.001 0.01 0.1
Tem
pera
ture
(K)
nodule velocity (mm/s)
Diffusion in γ
Diffusion in γ+α
+ stress driven diffusion(extrapolated)
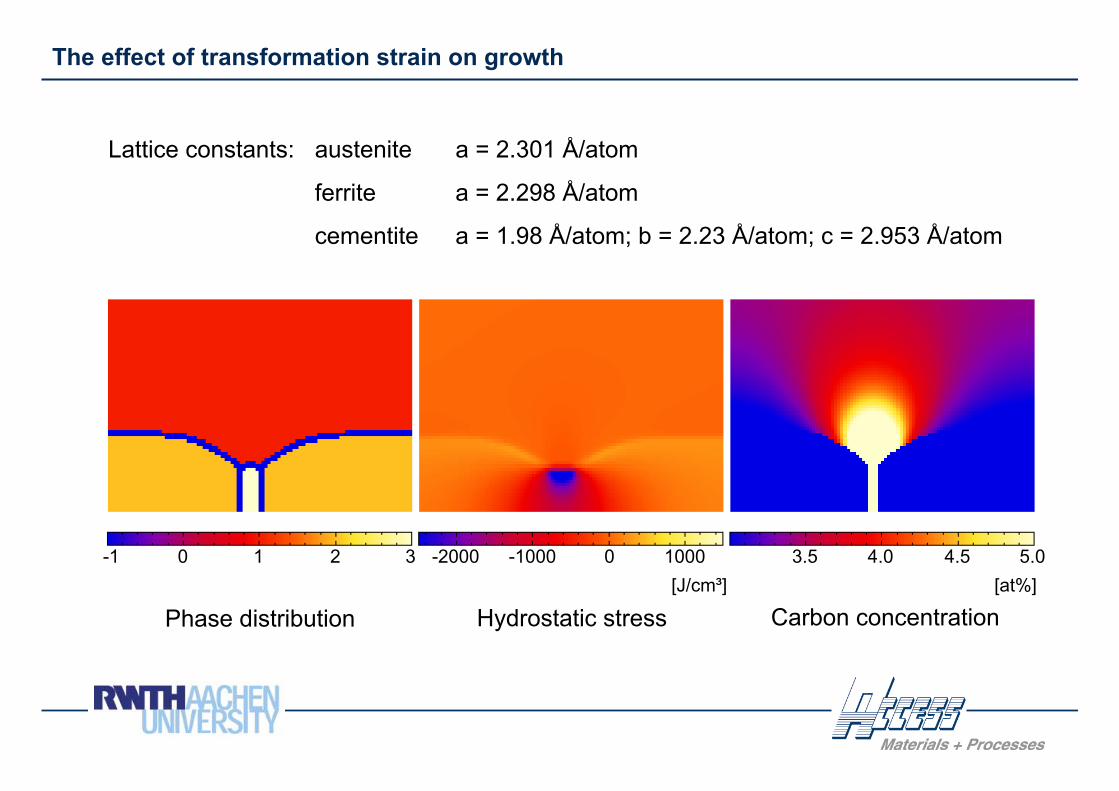
The effect of transformation strain on growth
Phase distribution Hydrostatic stress Carbon concentration
Lattice constants: austenite a = 2.301 Å/atom
ferrite a = 2.298 Å/atom
cementite a = 1.98 Å/atom; b = 2.23 Å/atom; c = 2.953 Å/atom
-1 0[J/cm³] [at%]
1 2 3 -2000 -1000 0 1000 3.5 4.0 4.5 5.0
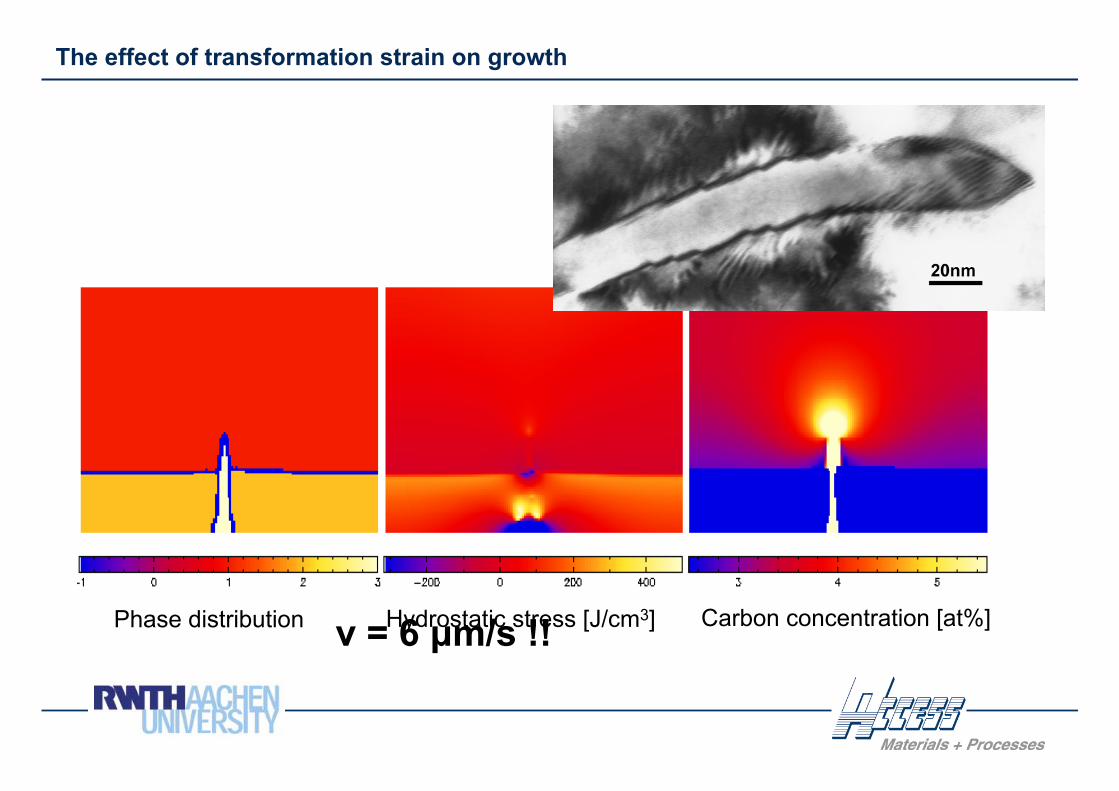
The effect of transformation strain on growth
v = 6 μm/s !!Phase distribution Hydrostatic stress [J/cm3] Carbon concentration [at%]
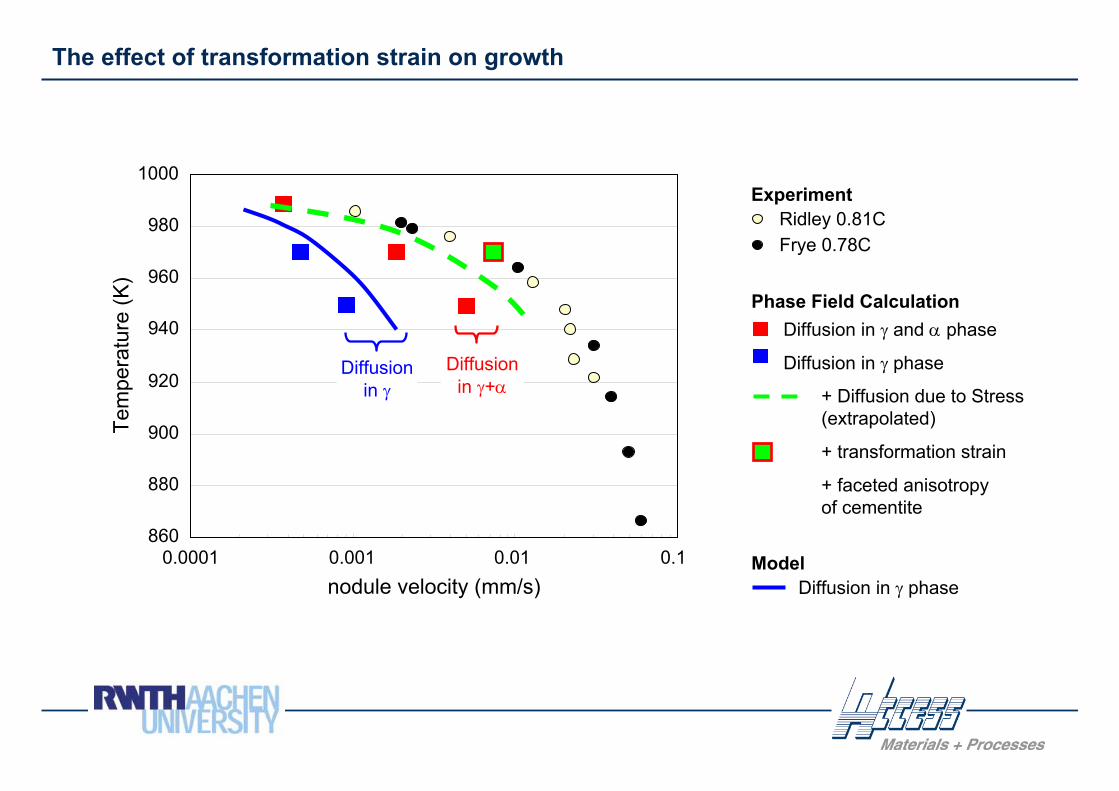
The effect of transformation strain on growth
860
880
900
920
940
960
980
1000
0.0001 0.001 0.01 0.1
Tem
pera
ture
(K)
nodule velocity (mm/s)
Diffusion in γ
Diffusion in γ+α
Ridley 0.81CFrye 0.78C
Experiment
ModelDiffusion in γ phase
Phase Field CalculationDiffusion in γ and α phase
Diffusion in γ phase
+ Diffusion due to Stress (extrapolated)
+ transformation strain
+ faceted anisotropy of cementite
Conclusion
Many features are nessesary to explain the kinetics of pearlite transformation• spacing selection through growth restriction by curvature of the austenite/ferrite
interface
• enhanced diffusion in ferrite
• stress driven diffusion in austenite
• faceted surfaceface structure allowes preferential growth of cementite
into austenite
Phase-field simulation offers the metodology to investigate these effects
and their interrellation (allmost) quantitatively
Steel metallurgy is not only the past of „solidification“, it is also part it‘s future
www.micress.de