Comparison of Optical Fiber Inertial Vibration...
3
* *
Transcript of Comparison of Optical Fiber Inertial Vibration...
Vol. 122 (2012) ACTA PHYSICA POLONICA A No. 5
Optical and Acoustical Methods in Science and Technology
Comparison of Optical Fiber Inertial Vibration Sensors
T. Poczesny∗, K. Prokopczuk and A.W. Domanski
Faculty of Physics, Warsaw University of Technology, Koszykowa 75, 00-662 Warszawa, Poland
This paper presents the application and comparison of a macrobend seismic optical �ber accelerometer andferrule-top cantilever �ber sensor (made by Optics11 � Amsterdam, Netherlands) both for long distance vibrationmonitoring. The sensors utilize typical telecommunication optical transmission systems with specially preparedsensing head. Both optical �ber sensors measure force and acceleration similar to the piezoelectric accelerometers.One of the advantages of these devices is insensitivity to electromagnetic interference because of lack of electricallydriven elements in sensing head area. Experiments with wide ranges of frequencies and vibration amplitudes wereperformed. Main parameters and measurement capabilities of both sensor types were compared. Experimentalresults show usage possibility of both sensor types in industry and other explosion risk environments for vibrationmeasurement and online monitoring.
PACS: 42.81.Pa, 42.25.Bs, 42.79.Pw
1. Introduction
There is a need in chemical and petrochemical indus-try, gas distribution line system and other harsh envi-ronments for fans, motors, turbines, compressors, pumpand other equipment vibration measurement and onlinemonitoring [1�3]. Vibration monitoring is mainly basedon measurement of displacement or acceleration of testedobject. In principle, accelerometer behaves as a dampedmass (called seismic mass) on a spring. During acceler-ation seismic mass is displaced from the neutral positionas a result of inertia forces. Measurement of this dis-placement gives information about acceleration of the ob-ject. Modern commercial accelerometers commonly usepiezoelectric, piezoresistive, capacitive and micro electro--mechanical systems (MEMS) components to convert me-chanical displacement into electric signal. These devicesneed electrical current in sensing head. This creates po-tential risk in the area of measurement and makes thesedevices sensitive to electromagnetic interference.Presented sensors utilize �ber opto-mechanical trans-
ducers for vibration and displacement measurement.They use low-power light sources (e.g. laser diodes, SLD)typically used in telecommunication working on wave-lengths of 1310 nm or 1550 nm. For signal transmissionfrom light source to sensor head and back to photode-tector standard single mode (SM) optical �bers are used.Also the sensors heads are all-optical. It provides insensi-tivity to any electromagnetic interference and allows forelimination of the �re hazard. This design provides gen-erally low-cost construction of multi-point sensing systemand online monitoring architecture. All this is an im-
∗ corresponding author; e-mail: [email protected]
portant advantage which plays signi�cant role in manyindustrial applications.Optical �ber macrobend seismic sensor transducer uti-
lizes bend loss phenomenon achieving intensity based sig-nal proportional to acceleration [4]. Continuous opticaltransmission of light through the head allows for long�ber connections up to 500 m and longer, depending onthe power of light source. The ferrule-top cantilever sen-sor utilize occurrence of re�ection and interference in thesensor head to receive intensity signal proportional to ac-celeration [5]. In principle both sensors measure signalproportional to inertia force, which acts on structuralelement of the sensor � similar to the piezoelectric ac-celerometers � providing useful information about ob-ject acceleration, velocity and displacement.
2. Optical �ber macrobend seismic sensor
The transducer utilizes the phenomenon of bendinglosses in optical �bers dependent on radius of the bend-ing [6�8]. It can be described in geometrical approach asa distortion of the angle of incidence due to the geometrydeformation (Fig. 1). This causes part of the light to loseits total internal re�ection (TIR) propagation mechanismand allows escaping from the optical �ber. In optical �bermode theory losses are caused by mode shifting due tochange of propagation speed (e�ective refractive index)in order to maintain mode �eld. Optical �ber macrobendseismic sensor contains bent SM �ber in a loop shape withdiameter of 7 mm. To the �ber loop a small 0.3 g metalsphere is attached. During movement the sphere is de-forming the loop through inertia forces [9]. It is acting asa seismic mass. Figure 1 represents schematic illustrationof the optical �ber macrobend seismic sensor.Behavior of the sensor can be described by damped
harmonic oscillator equation and its solution is similar to
(954)
Comparison of Optical Fiber Inertial Vibration Sensors 955
Fig. 1. Optical �ber macrobend seismic sensorschematic and working principle.
x(t) = A exp(−at) sin(ωt+ φ). (1)
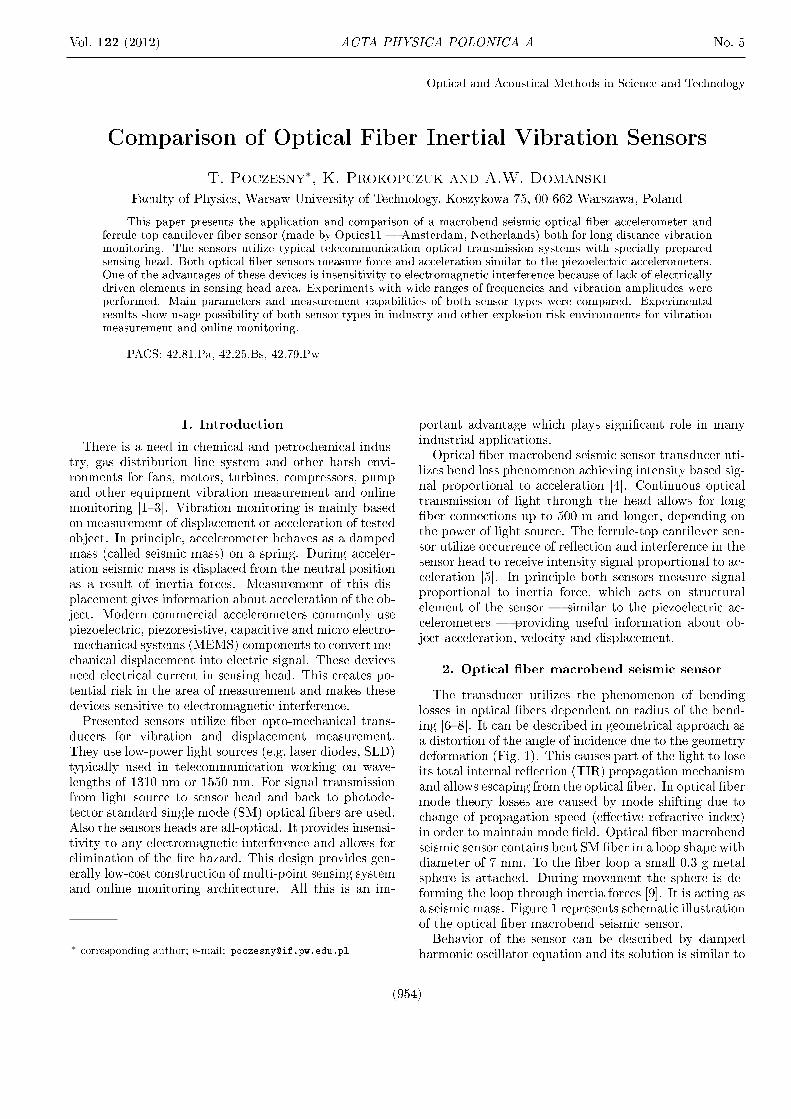
The parameter x(t) is proportional to the signal on de-tector, A is the amplitude of mechanical vibration, whileω and a are the resonance frequency and dumping coe�-cient, respectively. The latter two parameters are corre-lated with the loop diameter and the weight of the seis-mic mass [10, 11]. Relation of the parameters may besophisticated due to the impact of the �ber and coatingsti�ness. In short impulse stimulation damped free os-cillations are observed. The resonance frequency for thissensor head con�guration is 372 Hz. Figure 2 shows thelight spectrum of the SLD light source which is drivingthe macrobend seismic sensor and light spectrum trans-mitted by the sensor itself. The attenuation of the �bermacrobend seismic sensing head in presented con�gura-tion is in the range of 10�20 dB.
Fig. 2. Spectrum of SLD light source (left) and lightspectrum after passing through macrobend sensor(right).
3. Ferrule-top optical �ber sensor
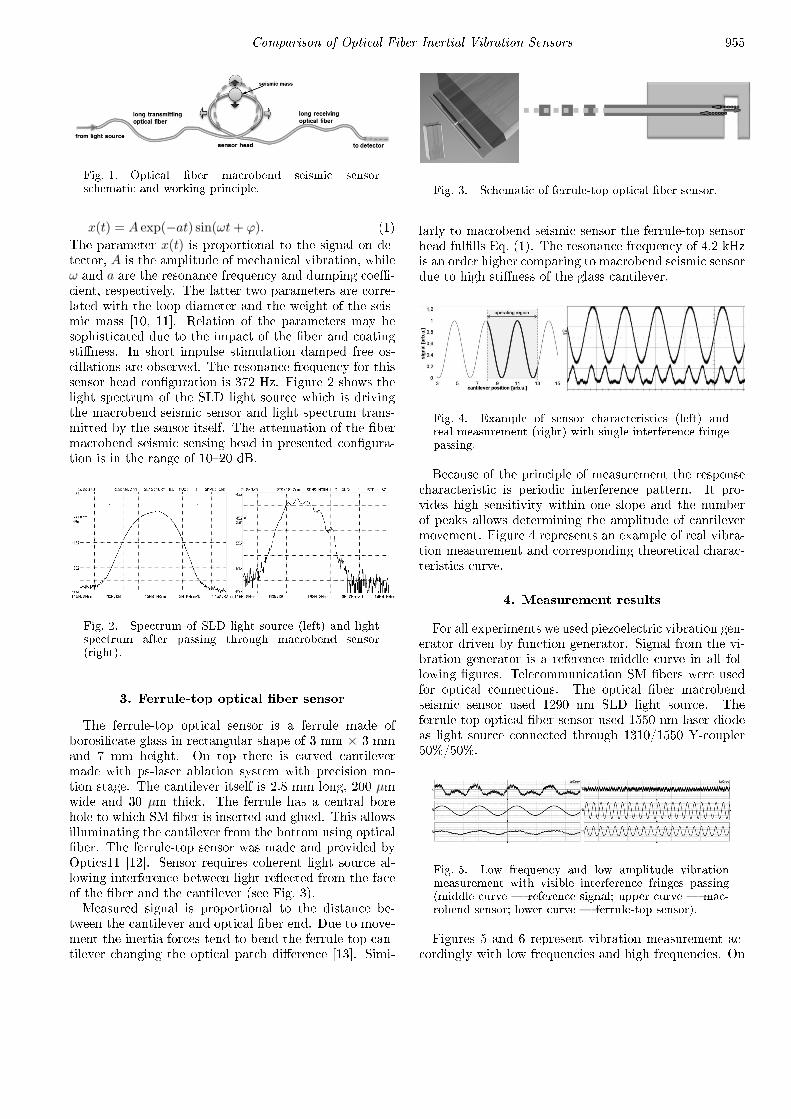
The ferrule-top optical sensor is a ferrule made ofborosilicate glass in rectangular shape of 3 mm × 3 mmand 7 mm height. On top there is carved cantilevermade with ps-laser ablation system with precision mo-tion stage. The cantilever itself is 2.8 mm long, 200 µmwide and 30 µm thick. The ferrule has a central borehole to which SM �ber is inserted and glued. This allowsilluminating the cantilever from the bottom using optical�ber. The ferrule-top sensor was made and provided byOptics11 [12]. Sensor requires coherent light source al-lowing interference between light re�ected from the faceof the �ber and the cantilever (see Fig. 3).Measured signal is proportional to the distance be-
tween the cantilever and optical �ber end. Due to move-ment the inertia forces tend to bend the ferrule-top can-tilever changing the optical patch di�erence [13]. Simi-
Fig. 3. Schematic of ferrule-top optical �ber sensor.
larly to macrobend seismic sensor the ferrule-top sensorhead ful�lls Eq. (1). The resonance frequency of 4.2 kHzis an order higher comparing to macrobend seismic sensordue to high sti�ness of the glass cantilever.
Fig. 4. Example of sensor characteristics (left) andreal measurement (right) with single interference fringepassing.
Because of the principle of measurement the responsecharacteristic is periodic interference pattern. It pro-vides high sensitivity within one slope and the numberof peaks allows determining the amplitude of cantilevermovement. Figure 4 represents an example of real vibra-tion measurement and corresponding theoretical charac-teristics curve.
4. Measurement results
For all experiments we used piezoelectric vibration gen-erator driven by function generator. Signal from the vi-bration generator is a reference middle curve in all fol-lowing �gures. Telecommunication SM �bers were usedfor optical connections. The optical �ber macrobendseismic sensor used 1290 nm SLD light source. Theferrule-top optical �ber sensor used 1550 nm laser diodeas light source connected through 1310/1550 Y-coupler50%/50%.
Fig. 5. Low frequency and low amplitude vibrationmeasurement with visible interference fringes passing(middle curve � reference signal; upper curve � mac-robend sensor; lower curve � ferrule-top sensor).
Figures 5 and 6 represent vibration measurement ac-cordingly with low frequencies and high frequencies. On
956 T. Poczesny, K. Prokopczuk, A.W. Domanski
Fig. 6. High frequency vibration measurement: left11 kHz; right 21 kHz (middle curve � reference sig-nal; upper curve � macrobend sensor; lower curve �ferrule-top sensor).
top curve in Fig. 5 due to high vibration amplitude theresponse characteristic of ferrule-top �ber sensor consistsof multiply interference fringes (compare Fig. 4) thereforethe signal is modulated by nonlinear sensor characteris-tics.
Fig. 7. Impulse vibration measurements (middle curve� reference signal; upper curve � macrobend sensor;lower curve � ferrule-top sensor).
Response for short duration and wide frequency rangevibration which represents impulse disturbance is pre-sented in Fig. 7. As measurements show, the signal iscorrectly measured with negligible resonance e�ects.
5. Conclusion
Experimental results show that both sensors based onstandard telecommunication optical �bers with speciallyprepared sensor head can be used for vibration moni-toring in wide range of frequencies. The decay timeof resonance vibration is su�cient for impulse vibra-tion measurement. Ferrule-top optical �ber sensor showshigher sensitivity due to utilization of the interferencee�ect and additionally this gives information about can-tilever movement. In the case of high vibration amplitudeferrule-top sensor needs more sophisticated data analysis
than macrobend sensor due to nonlinear sensor charac-teristic. Very small size of cantilever makes it vulnerableto any mechanical damage. Optical �ber macrobend seis-mic sensor gives direct mapping of vibration curve dueto its linear response [4]. It does not require the usageof coherent light sources in contrast to the ferrule-topsensor. Both sensors are insensitive to electromagneticinterference and do not create explosion risk. All thesefeatures allow them to work in harsh environments.
Acknowledgments
This work was supported by Polish National Centre forResearch and Development (NCBiR) under the grant NR01 0026 06/2009.
References
[1] T.R. Wolinski, D. Budaszewski, A.W. Domanski,S. Ertman, G. Goleniewski, M. Wydmanski, Proc.SPIE 6616, 66161U (2007).
[2] Y.R. García, J.M. Corres, J. Goicoechea, J. Sensors2010, 936487 (2010).
[3] K. Prokopczuk, T. Poczesny, A.W. Domanski, Proc.SPIE 8010, 80100E (2011).
[4] A.W. Doma«ski, T. Poczesny, K. Prokopczuk,P. Makowski, Photonic Lett. Poland 2, 58 (2010).
[5] S. Deladi, D. Iannuzzi, V.J. Gadgil, H. Schreuders,M.C. Elwenspoek, J. Micromech. Microeng. 16, 886(2006).
[6] D. Marcuse, J. Opt. Soc. Am. B 66, 216 (1976).
[7] R.T. Schermer, J.H. Cole, IEEE J. Quantum Elec-tron. 43, 899 (2007).
[8] P. Wang, Q. Wang, G. Farrell, G. Rajan, T. Freir,J. Cassidy, Microwave Opt. Technol. Lett. 49, 2133(2007).
[9] T. Poczesny, K. Prokopczuk, A.W. Domanski, Proc.SPIE 8010, 80100D (2011).
[10] T. Poczesny, K. Prokopczuk, P.L. Makowski,A.W. Domanski, Proc. SPIE 8082, 80823L (2011).
[11] P.L. Makowski, R.Z. Morawski, L. Michalik,A.W. Domanski, Measurement: J. Int. Measur. Con-feder. 44, 2060 (2011).
[12] http://www.optics11.com/ .
[13] A. Cipullo, G. Gruca, K. Heeck, F. De Filippis,D. Iannuzzi, L. Zeni, Proc. SPIE 7753, 77534O(2011).


![Chapitre 12 : Propagation d’ondes · • Onde : vibration/perturbation qui se propage dans un milieu matériel Mexican wave ... [ondes de cisaillement] - vagues - vibration vibration](https://static.fdocument.org/doc/165x107/5b99783909d3f26e678c41a0/chapitre-12-propagation-d-onde-vibrationperturbation-qui-se-propage.jpg)