Comparison of functional and nutritional characteristics...
153
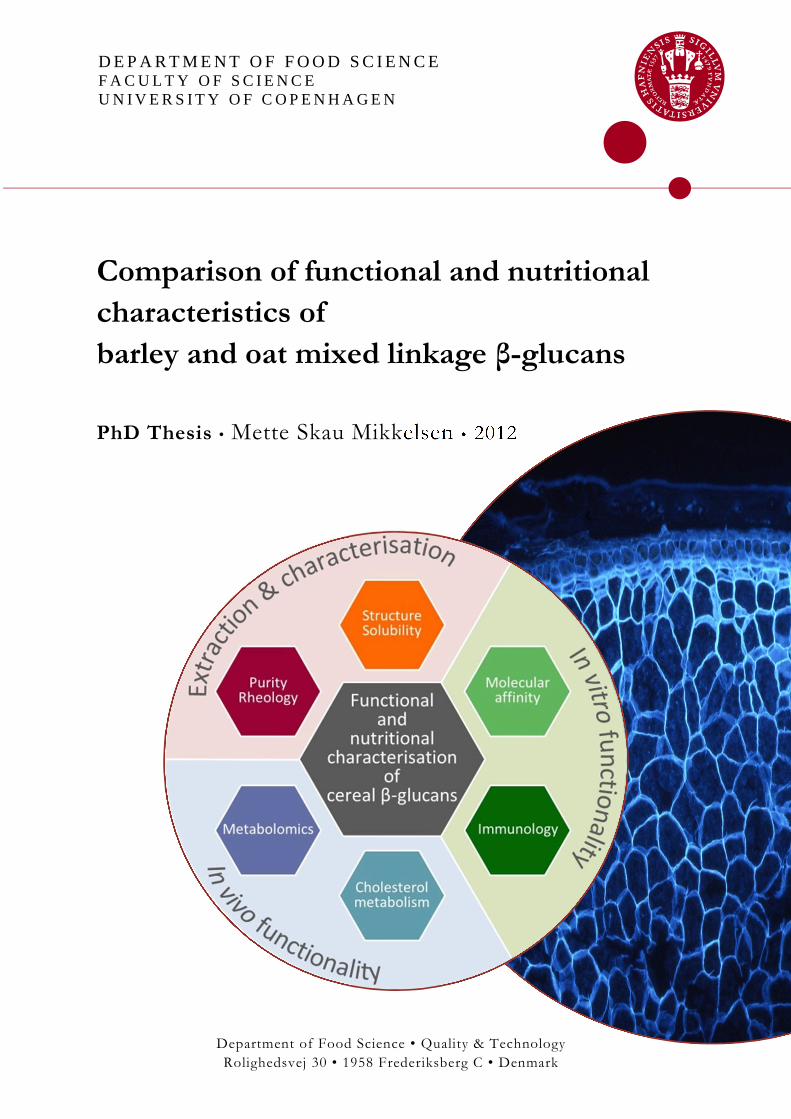
DEPARTMENT OF FOOD SCIENCE FACULTY OF SCIENCE UNIVERSITY OF COPENHAGEN Comparison of functional and nutritional characteristics of barley and oat mixed linkage β-glucans PhD Thesis • Mette Skau Mikkelsen • 2012 Department of Food Science • Quality & Technology Rolighedsvej 30 • 1958 Frederiksberg C • Denmark
Transcript of Comparison of functional and nutritional characteristics...
D E P A R T M E N T O F F O O D S C I E N C E F A C U L T Y O F S C I E N C E U N I V E R S I T Y O F C O P E N H A G E N
Comparison of functional and nutritional
characteristics of
barley and oat mixed linkage β-glucans
PhD Thesis • Mette Skau Mikkelsen • 2012
Department of Food Science • Quality & Technology
Rolighedsvej 30 • 1958 Frederiksberg C • Denmark
Comparison of functional and nutritional characteristics of barley and oat mixed linkage β-glucans
PhD Thesis by
Mette Skau Mikkelsen
2012
University of Copenhagen • Faculty of Science
Department of Food Science • Quality & Technology
Rolighedsvej 30 • 1958 Frederiksberg C • Denmark
2
Title Comparison of functional and nutritional characteristics of barley and oat mixed linkage β-glucans Submission November 27th 2012 Defence January 11th 2013 Supervisors Professor Søren Balling Engelsen & Associate Professor Birthe Møller Jespersen Department of Food Science Faculty of Science, University of Copenhagen Assistant Professor Mette Kristensen Department of Nutrition, Exercise and Sports Faculty of Science, University of Copenhagen Opponents Senior Scientist Baljit Singh Ghotra Mondelez International East Hanover, NJ, USA Adjunct Professor Peter Olesen Actifoods ApS Hillerød, Denmark Associate Professor Thomas Skov (Chairman) Department of Food Science Faculty of Science, University of Copenhagen, Denmark Cover illustrations: PhD overview figure. Calcofluor-stained section of a barley kernel - with permission from Lars Munck. PhD Thesis 2012 © Mette Skau Mikkelsen ISBN: 978-78-7611-545-6 Printed by SL Grafik, Frederiksberg C, Denmark
Preface
I
Preface
The present PhD thesis is based on work carried out in the research group Quality & Technology (Q&T) at the Department of Food Science, Faculty of Science, University of Copenhagen. The project was granted by the Faculty of Science, University of Copenhagen with support from the strategic research initiative BEST. The project has been supervised by Professor Søren Balling Engelsen, Associate Professor Birthe Møller Jespersen and Assistant Professor Mette Kristensen from University of Copenhagen. A large number of people have contributed to the completion of this thesis. First of all, I am grateful to my three supervisors. Søren, for giving me the opportunity to conduct this thesis, for great freedom in choosing focus and direction of the work and for your valuable knowledge and inspiration. Birthe, for all the hard work we did together, for always taking time to discuss problems and ideas and for an always positive attitude at the office. Mette, for great company on journeys, for facilitating the possibility to conduct a human intervention study and for sharing valuable knowledge in this field. Great thanks to Mark Lawther and Novozymes A/S for assisting me in the large-scale β-glucan extraction. Also thanks to all my co-workers from Department of Nutrition, Exercise and Sports, Department of Plant Biology and Biotechnology and Department of Veterinary Disease Biology at University of Copenhagen. I could not have completed this thesis study without the help and good collaboration from all of you. A special and warm thank to my colleagues at Q&T, for a very pleasant, humorous and professional working environment. Finally, the warmest feelings to the boys at home; Søren Kristian, Ebbe and Thyge.
Mette Skau Mikkelsen
Frederiksberg, November 2012
Summary
II
Summary
It is well accepted that dietary fibres, especially mixed linkage (1→3, 1→4)-β-D-glucans (β-glucan) from barley and oat, have beneficial effects on health and prevent modern lifestyle diseases. Even though recent research has shed some light on the mechanisms of action and structure-functionality relationship of β-glucans, the exact functional principle remain elusive. The overall aim of this project was to provide new knowledge into the relation between β-glucan and health at a molecular level. For the first time two barley and one oat fractions of well-defined and structurally different β-glucans were compared in a human intervention study. The work first focussed on large-scale extraction and physico-chemical characterisation of barley and oat β-glucans. The second step was to investigate the in vitro health effects of barley and oat β-glucans in relation to their physico-chemical properties. Finally, health effects from barley and oat β-glucans were studied in vivo in humans using traditional biomarkers and plasma metabolomics.
Results from Paper I demonstrated that structural characteristics and viscous properties of barley and oat β-glucans dominate the functional traits over the presence of α-glucan impurities. Paper II identified a structurally unique barley high β-glucan variety with an extraordinary high amount of cellotriosyl units and showed that the oligomer block structure of barley and oat β-glucans influence their solubility. The main findings from Papers III and IV in vitro studies were that small molecule interaction with barley and oat β-glucans is influenced by degree of polymerisation and β-glucan fine structure whereas β-glucan solubility and aggregation are key elements for understanding their immune modulating capacity. Results from the Paper V in vivo human study showed that consumption of 3.3 g/day extracted barley and oat β-glucan for 3 weeks does not significantly lower total and LDL cholesterol levels in young healthy adults. However, an indicated potential effect of oat suggests the importance of solubility for β-glucan interference with the cholesterol metabolism. The findings from Paper VI confirmed the general absence of barley and oat β-glucan effect on blood metabolites but showed the existence of subject unique lipoprotein profiles depended on gender, BMI and diet.
In conclusion, the results show that barley and oat β-glucan fine structures are of great importance for their functionality. β-Glucan solubility and polymer aggregation in solution is dependent on the block structural pattern and differently structured β-glucans may exert various functional and bioactive properties in our body. It is important to account for these diverse effects in the future evaluation of β-glucan effectiveness in functional foods and health.
Sammendrag
III
Sammendrag
Det er almindeligt accepteret, at kostfibre, særligt (1→3, 1→4)-β-D-glukan (β-glukan) fra byg og havre, har gavnlig effekt på vores sundhed og forebygger moderne livsstilssygdomme. Selvom nyere forskning til dels har belyst virkningsmekanismerne og struktur-funktionalitet forholdet hos β-glukaner, forbliver det nøjagtige funktionelle princip fortsat uafklaret. Det overordnede formål med dette projekt var at skabe ny viden om β-glukaner og sundhed på et molekylært niveau. For første gang sammenlignes to veldefinerede og strukturelt forskellige byg og en havre β-glukan i et humant kostforsøg. Første del af arbejdet fokuserede på stor-skala ekstraktion og fysisk-kemisk karakterisering af byg og havre β-glukaner. Næste del af projektet undersøgte in vitro sundhedsvirkninger af byg og havre β-glukaner i forhold til deres fysisk-kemiske egenskaber. Endelig blev sundhedsmæssige virkninger af byg og havre β-glukaner undersøgt in vivo i mennesker ved brug af traditionelle biomarkører og plasma metabolomics.
Resultaterne fra Artikel I viste, at de strukturelle karakteristika og viskøse egenskaber hos byg og havre β-glukaner dominerer de funktionelle egenskaber over α-glukan urenheder. Artikel II identificerede en strukturelt unik byg β-glukan med en ekstraordinær stor mængde cellotriosyl enheder og viste, at oligomer blokstrukturen af byg og havre β-glukaner påvirker deres opløselighed. De vigtigste resultater fra Artikel III og IV in vitro studier var, at små molekylers interaktion med byg og havre β-glukaner påvirkes af graden af polymerisering samt β-glukaners blok struktur, mens β-glukan opløselighed og aggregering er centrale elementer for at forstå deres immunmodulerende kapacitet. Resultater fra det in vivo humane studie i Artikel V viste, at indtag af 3,3 g/dag ekstraheret byg og havre β-glukan i 3 uger ikke sænker total og LDL kolesterol signifikant hos unge sunde voksne. En indikeret potentiel virkning af havre antyder dog vigtigheden af opløselighed for β-glukan effekt på kolesterolmetabolismen. Resultaterne fra Artikel VI bekræftede den generelle mangel på byg og havre β-glukan effekt på blodets metabolitter, men viste, at der findes individ unikke lipoprotein profiler som afhænger af køn, BMI og kost.
Sammenfattende viser resultaterne, at byg og havre β-glukan blok struktur er af stor betydning for deres funktionalitet. β-Glukan opløselighed og aggregering afhænger af blok strukturelle mønstre og β-glukaner med forskellige strukturer kan udøve varierende funktionelle og bioaktive egenskaber i vores krop. Det er vigtigt at redegøre for disse egenskaber i den fremtidige evaluering af β-glukaners effektivitet i funktionelle fødevarer og sundhed.
List of publications
IV
List of publications
Paper I Mikkelsen MS, Jespersen BM, Møller BL, Lærke HN, Larsen FH, Engelsen SB. Comparative spectroscopic and rheological studies on crude and purified soluble barley and oat β-glucan preparations. Food Research International, 43: 2417-2424, 2010. Paper II Mikkelsen MS, Jespersen BM, Larsen FH, Blennow A, Engelsen SB. Molecular structure of large-scale extracted β-glucan from barley and oat. Identification of a significantly changed block structure in a high β-glucan barley mutant. Food Chemistry, 136:130-138, 2013. Paper III Simonsen HT, Nielsen MS, Christensen NJ, Christensen U, La Cour TV, Motawia MS, Jespersen BM, Engelsen SB, Møller BL. Molecular interactions between barley and oat β-glucans and phenolic derivatives. Journal of Agricultural and Food Chemistry, 57: 2056-2064, 2009. Paper IV Mikkelsen MS, Jespersen BM, Mehlsen A, Engelsen SB, Frøkjær H. Cereal β-glucan immune modulating activity depends on polymer fine structure and in turn the polymer solubility and aggregation in solution. Molecular Nutrition & Food Research, submitted November 2012. Paper V Ibrügger S, Kristensen M, Poulsen MW, Mikkelsen MS, Ejsing J, Knudsen KEB, Jespersen BM, Dragsted LO, Engelsen SE, Bügel S. Effect of oat and barley β-glucans on cholesterol metabolism in young healthy adults: a randomized controlled trial. Journal of Nutrition, submitted November 2012. Paper VI Mikkelsen MS, Rasmussen MA, Savorani F, Jespersen BM, Kristensen M, Engelsen SB. Observations from a non-confirmatory dietary fibre intervention study with barley and oat β-glucans using NMR metabolomics. Manuscript in preparation.
Additional publications
V
Additional publications
Paper VII Savorani F, Rasmussen MA, Mikkelsen MS, Engelsen SB. A primer to nutritional metabolomics by NMR spectroscopy and chemometrics. Food Research International, accepted December 2012. Paper IIX Kristensen M, Jensen MG, Mikkelsen MS, Astrup A. Flaxseed dietary fibers lower cholesterol and increase fecal fat excretion, but magnitude of effect depend on food type. Nutrition & Metabolism, 9:8, 2012. Paper IX Ibrügger S, Kristensen M, Mikkelsen MS, Astrup A. Flaxseed dietary fiber supplements for suppression of appetite and food intake. Appetite, 58:490-495, 2012. Paper X Nielsen MS, Karlsson AO, Engelsen SB. Cereal (1→3, 1→4)-β-D-glucans – functional properties and molecular interactions. Annual Transactions of the Nordic Rheology Society, 16: 179-183, 2008.
List of abbreviations
VI
List of abbreviations
AOAC Association of Official Analytical Chemists BMI Body Mass Index CVD Cardiovascular Disease DC Dendritic Cell DP Degree of Polymerisation DP3/DP4 Ratio of cellotriosyl to cellotetraosyl units EFSA European Food Safety Authority FDA US Food and Drug Administration HMG-CoA 3-Hydroxy-3-Methyl-Glutaryl-Coenzyme A IDF Insoluble Dietary Fibre IL-10 Interleukin 10 IL-12 Interleukin 12 LDL Low Density Lipoprotein NMR Nuclear Magnetic Resonance PCA Principal Component Analysis PLS Partial Least Square RMSE Root Mean Square Error SCFA Short Chain Fatty Acid SDF Soluble Dietary Fibre
Contents
VII
Contents
1. INTRODUCTION 1
2. OBJECTIVES AND HYPOTHESIS 3
2.1 Subaims of the work packages 4 β-Glucan extraction and characterisation 4 β-Glucan in vitro functionality 4 β-Glucan in vivo functionality 4
3. BACKGROUND 5
3.1 Cereal mixed likage (1→3, 1→4)-β-D-glucans 5 Origin and structure 5 Solubility and rheological properties 6
3.2 In vitro and in vivo functionalities of β-glucans 9 Absorption and metabolism 9 Mechanism of action for health effects 10
4. OVERVIEW OF STUDIES AND MAIN OUTCOMES 14
4.1 β-Glucan extraction and characterisation 14
4.2 β-Glucan in vitro functionality 15
4.3 β-Glucan in vivo functionality 16
5. METHODOLOGICAL CONSIDERATIONS 18
5.1 β-Glucan extraction 18
5.2 Human study 19
5.3 Metabolomics and multivariate data analysis 21
6. GENERAL DISCUSSION AND PERSPECTIVES 25
7. CONCLUSIONS 31
8. REFERENCES 33
PAPERS I-VI

Contents
VIII
Introduction
1
Chapter 1
Introduction
In the Western world, healthy diets have become a major quest in our endeavour of living a good and long life, and bioactive components in food may constitute a key factor in the prevention of contemporary lifestyle related diseases. Dietary fibres, particularly soluble fibres like mixed linkage (1→3, 1→4)-β-D-glucan (β-glucan) from oat and barley have been recognised for a long time for their positive effects on health. The dietary fibre hypothesis implies that a high intake of fibre-containing foods is directly related to or is associated with a low incidence of many disorders related to a Western lifestyle (e.g. chronic bowel disease, diabetes, coronary heart disease and colon cancer)1-4. Establishing a definition for dietary fibre has historically been a balance between nutritional knowledge and analytical capabilities5. After years of discussion the Codex6 finally agreed in 2009 on the following definition of dietary fibre: Dietary fibre means carbohydrate polymers with ten or more monomeric units which are not hydrolysed by the endogenous enzymes in the small intestine of humans and belong to one of the following categories*:
Edible carbohydrate polymers naturally occurring in the food as consumed.
Carbohydrate polymers, which have been obtained from food raw material by physiological, enzymatic or chemical means and which have been shown to have a physiological effect of benefit to health.
Synthetic carbohydrate polymers which have been shown to have a physiological effect of benefit to health.
Especially, the association between β-glucan intake and a risk reduction of cardiovascular diseases (CVD), which represent the number one death cause globally7, is being continuously documented2,3. As a consequence, the US Food and Drug Administration (FDA)8 in 1997 permitted a health claim on oat β-glucan stating that: “A diet rich in β-glucans may reduce the cholesterol level and reduce the risk of heart disease”. Likewise, the European Food Safety Authority (EFSA)9 in 2009 reacted favourable to the *Note 1: Includes also lignin and other compounds if quantified by AOAC 991.43. Note 2: Decision on whether to include carbohydrates with monomeric units from DP 3-9 should be left to national authorities. The European Union has decided to include DP 3-9.
Introduction
2
application of a health claim for oat and barley products providing at least 3 g β-glucan/day which states, that: “Regular consumption of β-glucans contributes to maintenance of normal blood cholesterol concentrations”. Extracted β-glucan can be utilised as texture promoting additives in food production due to their viscous hydrocolloid properties10 and considerable work has been conducted to develop β-glucan enriched functional food products such as breads and beverages in relation to the food labelling claims of FDA and EFSA11-21. In Denmark, the Nordic recommendations22, which dates from 2004, calls for a dietary fibre intake of 25-35 g/day for optimal benefits. However, the actual consumption of dietary fibre in Denmark has been estimated to be about 20-23 g/day23. Altogether, this leaves a potential of benefit from β-glucan for the consumer, manufacturer as well as for society as a whole, as functional and healthy foods are expected to play a major role in preventing lifestyle related problems in the future24. In contrast to the numerous studies proclaiming a significant cholesterol lowering response to β-glucan, other studies have failed to prove this effect. Such variability in response is speculated to derive from structural/functional differences of various β-glucans or a reduction in the efficacy of the β-glucan e.g. following extraction and processing1,2,25. It is thus of great importance for the utilisation of β-glucan fibres to gain thorough knowledge on their physico-chemical characteristics prior to consumption. β-Glucan viscosity is suggested as the key molecular mechanism governing health effects, but other β-glucan physico-chemical properties mediated by the same, partly overlapping or different parameters such as molecular structure contributing to viscosity may also be important factors. The aim of the present thesis study is to provide new insight into the relation between β-glucan and health at a molecular level using large-scale extraction, physico-chemical characterisation as well as in vitro and in vivo investigations.
Objectives and hypothesis
3
Chapter 2
Objectives and hypothesis
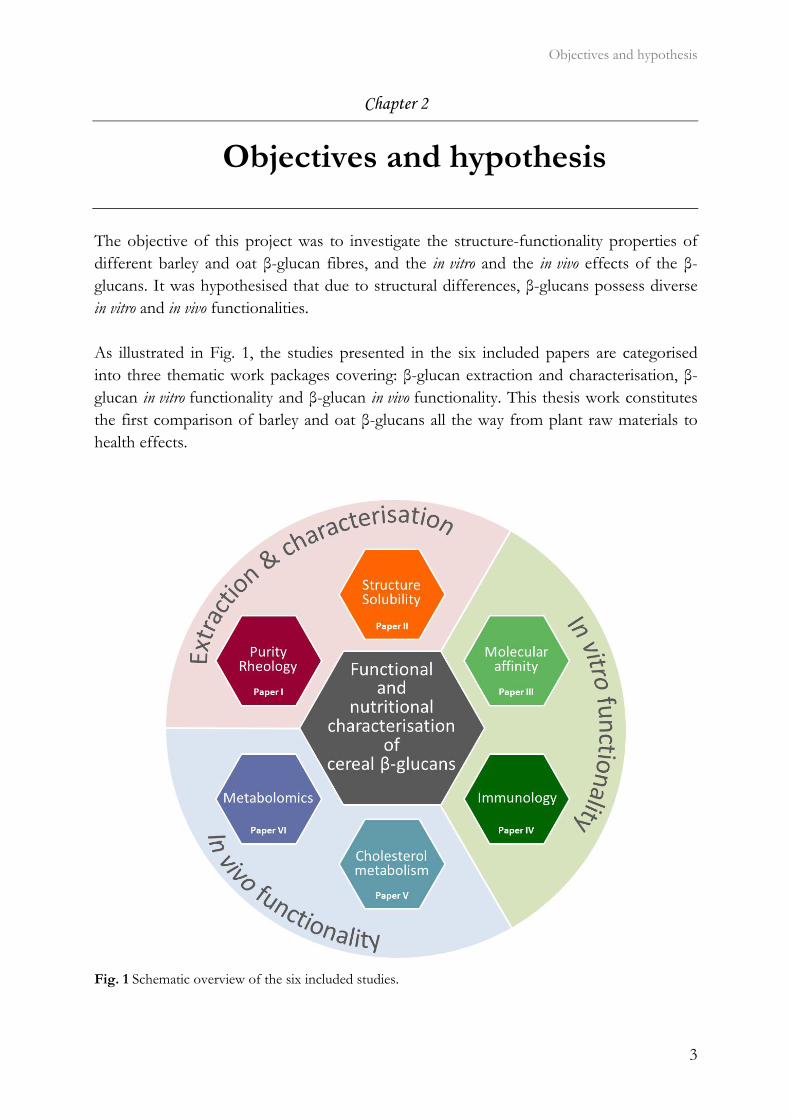
The objective of this project was to investigate the structure-functionality properties of different barley and oat β-glucan fibres, and the in vitro and the in vivo effects of the β-glucans. It was hypothesised that due to structural differences, β-glucans possess diverse in vitro and in vivo functionalities. As illustrated in Fig. 1, the studies presented in the six included papers are categorised into three thematic work packages covering: β-glucan extraction and characterisation, β-glucan in vitro functionality and β-glucan in vivo functionality. This thesis work constitutes the first comparison of barley and oat β-glucans all the way from plant raw materials to health effects.
Fig. 1 Schematic overview of the six included studies.
Objectives and hypothesis
4
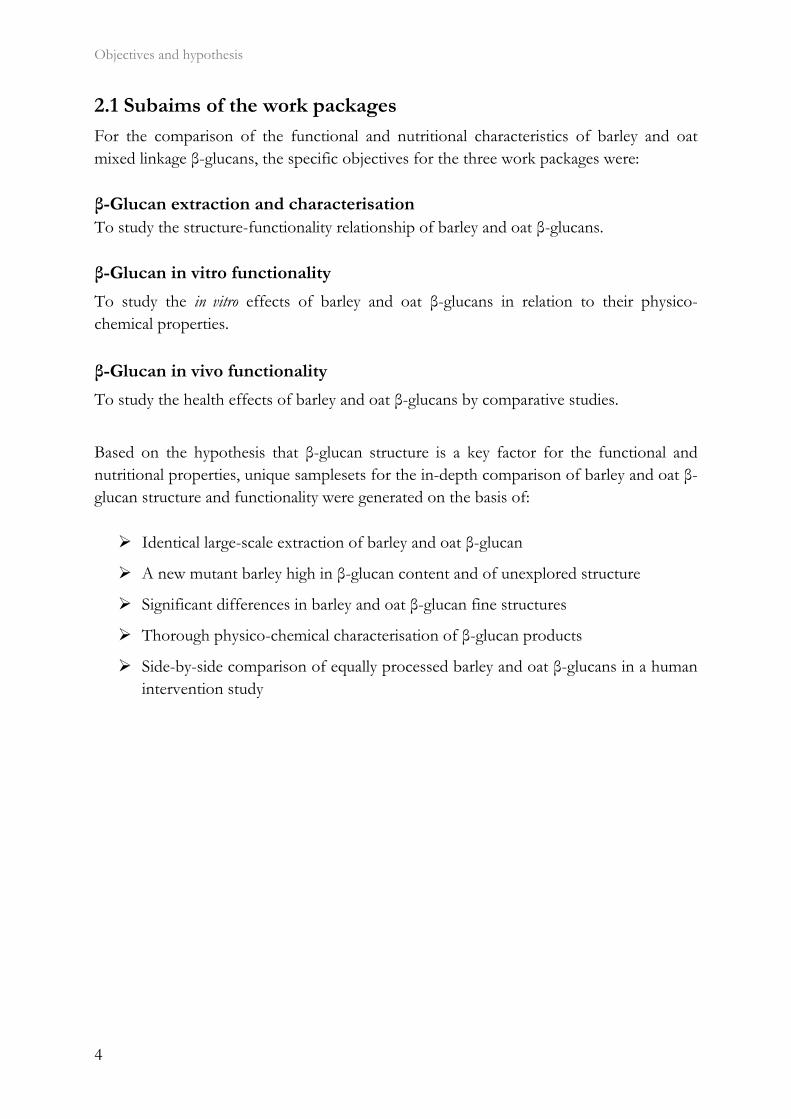
2.1 Subaims of the work packages
For the comparison of the functional and nutritional characteristics of barley and oat mixed linkage β-glucans, the specific objectives for the three work packages were: β-Glucan extraction and characterisation To study the structure-functionality relationship of barley and oat β-glucans. β-Glucan in vitro functionality
To study the in vitro effects of barley and oat β-glucans in relation to their physico-chemical properties. β-Glucan in vivo functionality
To study the health effects of barley and oat β-glucans by comparative studies.
Based on the hypothesis that β-glucan structure is a key factor for the functional and nutritional properties, unique samplesets for the in-depth comparison of barley and oat β-glucan structure and functionality were generated on the basis of: Identical large-scale extraction of barley and oat β-glucan
A new mutant barley high in β-glucan content and of unexplored structure
Significant differences in barley and oat β-glucan fine structures
Thorough physico-chemical characterisation of β-glucan products
Side-by-side comparison of equally processed barley and oat β-glucans in a human intervention study
Background
5
Chapter 3
Background
3.1 Cereal mixed linkage (1→3, 1→4)-β-D-glucans
The physico-chemical properties of barley and oat β-glucans are outlined in the following section with special emphasis on β-glucan block structural characteristics, solubility and aggregation capability. When comparing equally sized and concentrated β-glucan polymers, these molecular features are expected to determine the β-glucan viscous functionality. Origin and structure
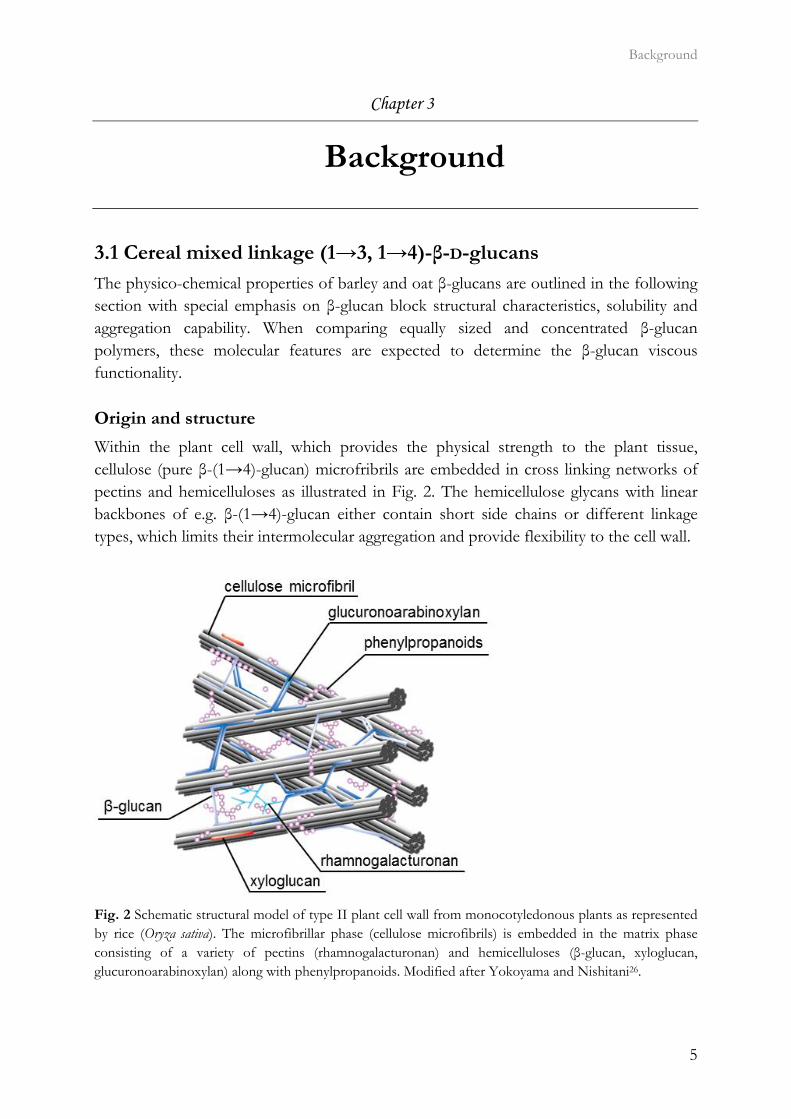
Within the plant cell wall, which provides the physical strength to the plant tissue, cellulose (pure β-(1→4)-glucan) microfribrils are embedded in cross linking networks of pectins and hemicelluloses as illustrated in Fig. 2. The hemicellulose glycans with linear backbones of e.g. β-(1→4)-glucan either contain short side chains or different linkage types, which limits their intermolecular aggregation and provide flexibility to the cell wall.
Fig. 2 Schematic structural model of type II plant cell wall from monocotyledonous plants as represented by rice (Oryza sativa). The microfibrillar phase (cellulose microfibrils) is embedded in the matrix phase consisting of a variety of pectins (rhamnogalacturonan) and hemicelluloses (β-glucan, xyloglucan, glucuronoarabinoxylan) along with phenylpropanoids. Modified after Yokoyama and Nishitani26.
Background
6
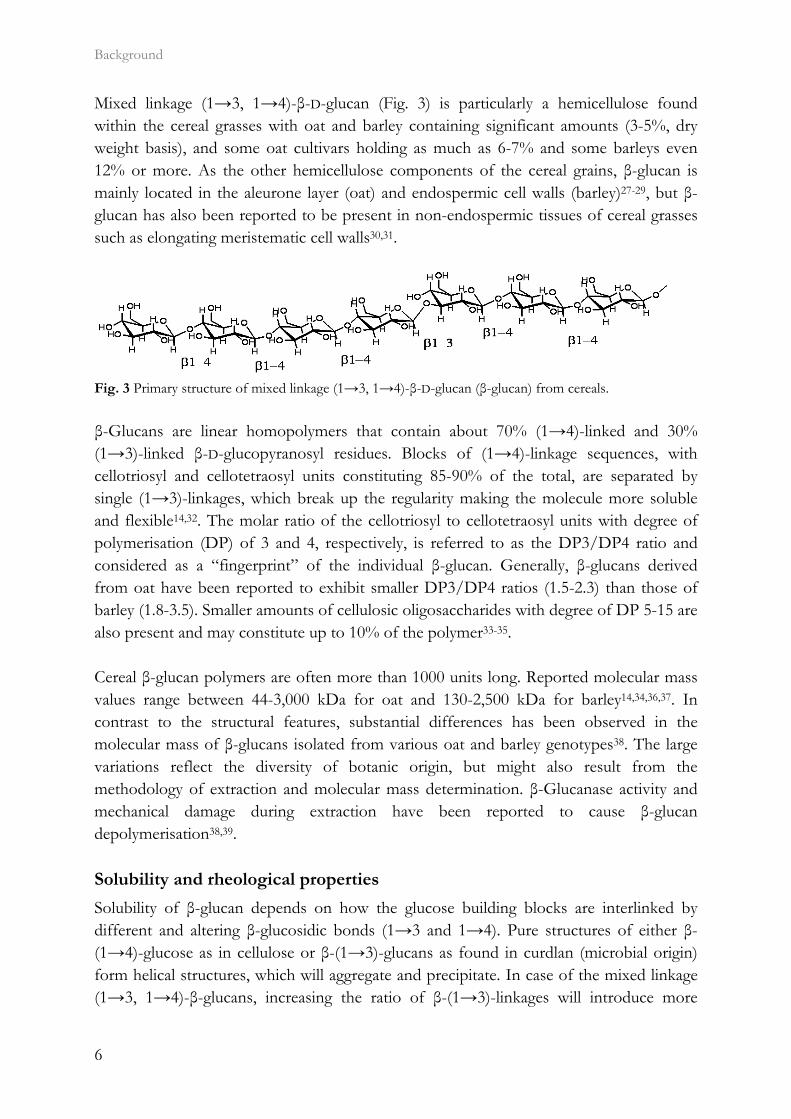
Mixed linkage (1→3, 1→4)-β-D-glucan (Fig. 3) is particularly a hemicellulose found within the cereal grasses with oat and barley containing significant amounts (3-5%, dry weight basis), and some oat cultivars holding as much as 6-7% and some barleys even 12% or more. As the other hemicellulose components of the cereal grains, β-glucan is mainly located in the aleurone layer (oat) and endospermic cell walls (barley)27-29, but β-glucan has also been reported to be present in non-endospermic tissues of cereal grasses such as elongating meristematic cell walls30,31.
Fig. 3 Primary structure of mixed linkage (1→3, 1→4)-β-D-glucan (β-glucan) from cereals.
β-Glucans are linear homopolymers that contain about 70% (1→4)-linked and 30% (1→3)-linked β-D-glucopyranosyl residues. Blocks of (1→4)-linkage sequences, with cellotriosyl and cellotetraosyl units constituting 85-90% of the total, are separated by single (1→3)-linkages, which break up the regularity making the molecule more soluble and flexible14,32. The molar ratio of the cellotriosyl to cellotetraosyl units with degree of polymerisation (DP) of 3 and 4, respectively, is referred to as the DP3/DP4 ratio and considered as a “fingerprint” of the individual β-glucan. Generally, β-glucans derived from oat have been reported to exhibit smaller DP3/DP4 ratios (1.5-2.3) than those of barley (1.8-3.5). Smaller amounts of cellulosic oligosaccharides with degree of DP 5-15 are also present and may constitute up to 10% of the polymer33-35. Cereal β-glucan polymers are often more than 1000 units long. Reported molecular mass
values range between 44-3,000 kDa for oat and 130-2,500 kDa for barley14,34,36,37. In contrast to the structural features, substantial differences has been observed in the molecular mass of β-glucans isolated from various oat and barley genotypes38. The large variations reflect the diversity of botanic origin, but might also result from the methodology of extraction and molecular mass determination. β-Glucanase activity and mechanical damage during extraction have been reported to cause β-glucan depolymerisation38,39. Solubility and rheological properties
Solubility of β-glucan depends on how the glucose building blocks are interlinked by different and altering β-glucosidic bonds (1→3 and 1→4). Pure structures of either β-(1→4)-glucose as in cellulose or β-(1→3)-glucans as found in curdlan (microbial origin) form helical structures, which will aggregate and precipitate. In case of the mixed linkage (1→3, 1→4)-β-glucans, increasing the ratio of β-(1→3)-linkages will introduce more
Background
7
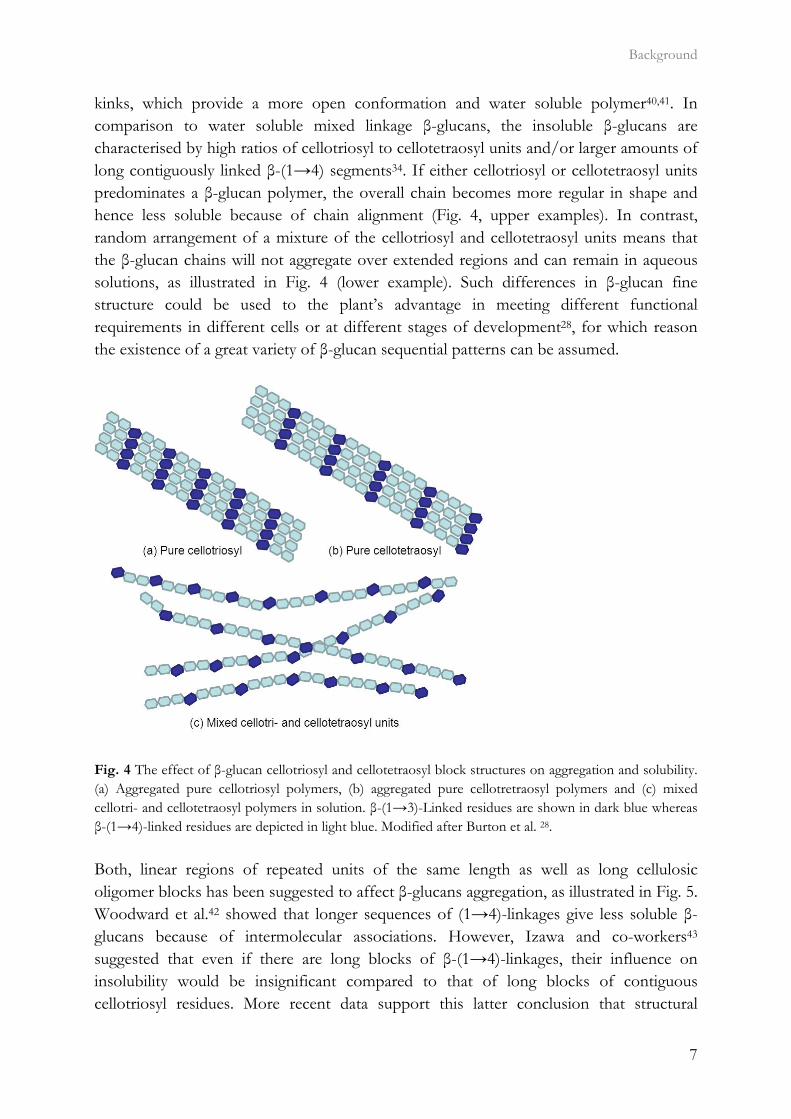
kinks, which provide a more open conformation and water soluble polymer40,41. In comparison to water soluble mixed linkage β-glucans, the insoluble β-glucans are characterised by high ratios of cellotriosyl to cellotetraosyl units and/or larger amounts of long contiguously linked β-(1→4) segments34. If either cellotriosyl or cellotetraosyl units predominates a β-glucan polymer, the overall chain becomes more regular in shape and hence less soluble because of chain alignment (Fig. 4, upper examples). In contrast, random arrangement of a mixture of the cellotriosyl and cellotetraosyl units means that the β-glucan chains will not aggregate over extended regions and can remain in aqueous solutions, as illustrated in Fig. 4 (lower example). Such differences in β-glucan fine structure could be used to the plant’s advantage in meeting different functional requirements in different cells or at different stages of development28, for which reason the existence of a great variety of β-glucan sequential patterns can be assumed.
Fig. 4 The effect of β-glucan cellotriosyl and cellotetraosyl block structures on aggregation and solubility. (a) Aggregated pure cellotriosyl polymers, (b) aggregated pure cellotretraosyl polymers and (c) mixed cellotri- and cellotetraosyl polymers in solution. β-(1→3)-Linked residues are shown in dark blue whereas β-(1→4)-linked residues are depicted in light blue. Modified after Burton et al. 28.
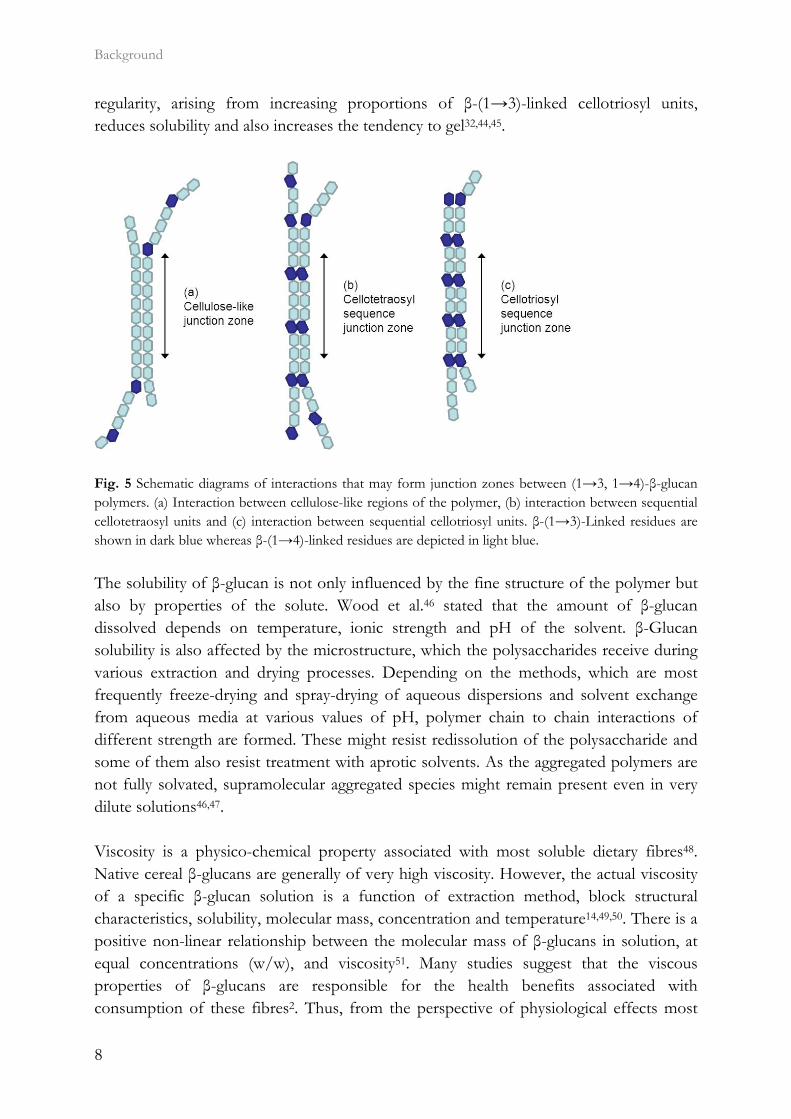
Both, linear regions of repeated units of the same length as well as long cellulosic oligomer blocks has been suggested to affect β-glucans aggregation, as illustrated in Fig. 5. Woodward et al.42 showed that longer sequences of (1→4)-linkages give less soluble β-glucans because of intermolecular associations. However, Izawa and co-workers43 suggested that even if there are long blocks of β-(1→4)-linkages, their influence on insolubility would be insignificant compared to that of long blocks of contiguous cellotriosyl residues. More recent data support this latter conclusion that structural
Background
8
regularity, arising from increasing proportions of β-(1→3)-linked cellotriosyl units, reduces solubility and also increases the tendency to gel32,44,45.
Fig. 5 Schematic diagrams of interactions that may form junction zones between (1→3, 1→4)-β-glucan polymers. (a) Interaction between cellulose-like regions of the polymer, (b) interaction between sequential cellotetraosyl units and (c) interaction between sequential cellotriosyl units. β-(1→3)-Linked residues are shown in dark blue whereas β-(1→4)-linked residues are depicted in light blue.
The solubility of β-glucan is not only influenced by the fine structure of the polymer but also by properties of the solute. Wood et al.46 stated that the amount of β-glucan dissolved depends on temperature, ionic strength and pH of the solvent. β-Glucan solubility is also affected by the microstructure, which the polysaccharides receive during various extraction and drying processes. Depending on the methods, which are most frequently freeze-drying and spray-drying of aqueous dispersions and solvent exchange from aqueous media at various values of pH, polymer chain to chain interactions of different strength are formed. These might resist redissolution of the polysaccharide and some of them also resist treatment with aprotic solvents. As the aggregated polymers are not fully solvated, supramolecular aggregated species might remain present even in very dilute solutions46,47. Viscosity is a physico-chemical property associated with most soluble dietary fibres48. Native cereal β-glucans are generally of very high viscosity. However, the actual viscosity of a specific β-glucan solution is a function of extraction method, block structural characteristics, solubility, molecular mass, concentration and temperature14,49,50. There is a positive non-linear relationship between the molecular mass of β-glucans in solution, at equal concentrations (w/w), and viscosity51. Many studies suggest that the viscous properties of β-glucans are responsible for the health benefits associated with consumption of these fibres2. Thus, from the perspective of physiological effects most
Background
9
studies have focussed on the flow viscosity of β-glucans. However, the properties of aqueous solutions of polysaccharides are controlled by both volume occupancy in solution (hence viscosity) and propensity of the molecules to self-associate or aggregate, which refer to the mechanism of gel formation. These two properties are not the same, and β-glucans can exhibit both2,52-54. Vaikousi et al.36 reported a detailed study on the flow behaviour and gelling properties of water soluble barley β-glucans varying in molecular mass. The results indicated that during storage low molecular mass β-glucans showed unusual shear-thinning behaviour, which was explained by aggregation tendency. Such aggregates were proposed to be fringed micelles formed by side-to-side aggregation of chains of molecular mass ~175 kDa55,56. Burkus and Temelli52 found that network formation in solutions of β-glucans is highly time- and concentration dependent. This mechanism makes gelation of β-glucan unlikely to occur in the human intestine, where constant shear and mixing with other food constituents will hinder intermolecular β-glucan association.
3.2 In vitro and in vivo functionalities of β-glucans
Physiological effects and proposed mechanism of action by oat and barley β-glucans are reviewed in the following section. Both in vitro and in vivo functionalities are outlined to present the diverse field of β-glucan health investigations. Absorption and metabolism
General proposed beneficial effects of dietary fibres are presented in Table 1. Dietary fibres pass undigested through the human small intestine and are completely or partially fermented in the large intestine by the intestinal microflora yielding short-chain fatty acids (SCFA), which are protective to the colon mucosa. Major end-products of the β-glucan fermentation are the SCFAs; acetate, propionate and butyrate. β-Glucans can be fermented to a degree between 70 and 100%57-59. SCFAs are efficiently absorbed in caecum and colon where they serve as fuel for a large variety of cells e.g. colonocytes60. Consumption of dietary fibres and hence β-glucans is basically associated with increased faecal weight61 and accelerated transit time62.
Background
10
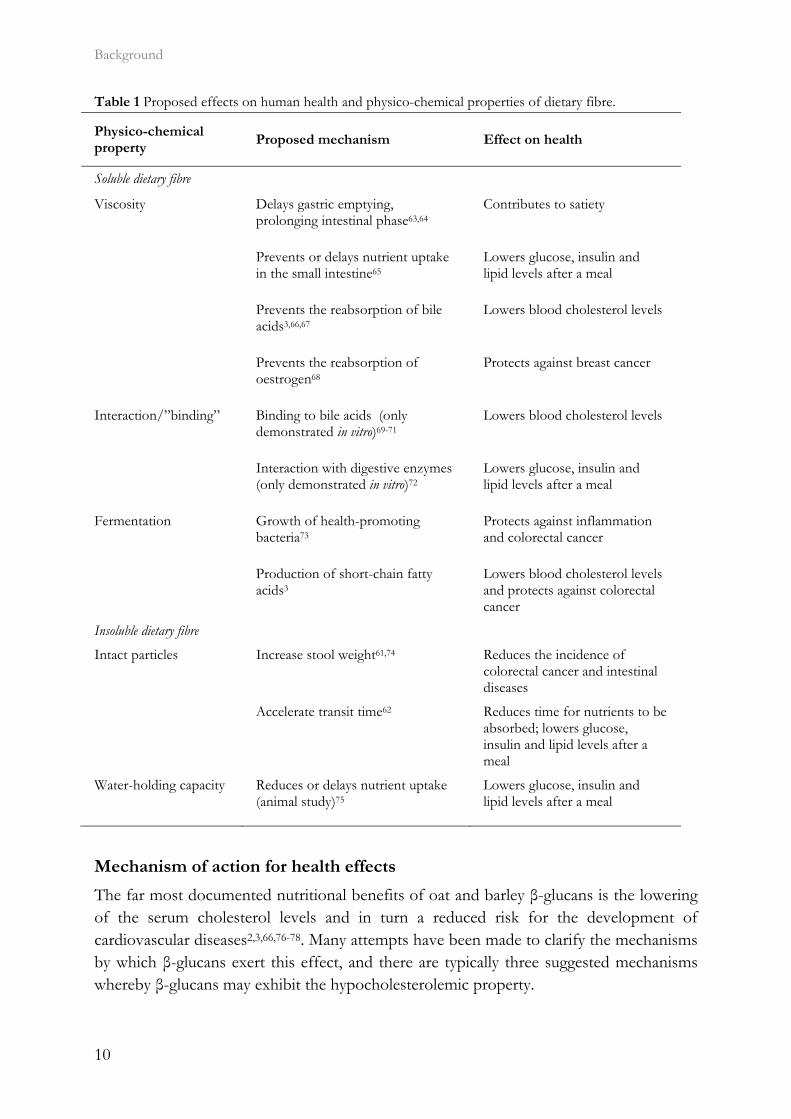
Table 1 Proposed effects on human health and physico-chemical properties of dietary fibre.
Physico-chemical property
Proposed mechanism Effect on health
Soluble dietary fibre
Viscosity Delays gastric emptying, prolonging intestinal phase63,64
Contributes to satiety
Prevents or delays nutrient uptake in the small intestine65
Lowers glucose, insulin and lipid levels after a meal
Prevents the reabsorption of bile acids3,66,67
Lowers blood cholesterol levels
Prevents the reabsorption of oestrogen68
Protects against breast cancer
Interaction/”binding” Binding to bile acids (only demonstrated in vitro)69-71
Lowers blood cholesterol levels
Interaction with digestive enzymes (only demonstrated in vitro)72
Lowers glucose, insulin and lipid levels after a meal
Fermentation Growth of health-promoting bacteria73
Protects against inflammation and colorectal cancer
Production of short-chain fatty acids3
Lowers blood cholesterol levels and protects against colorectal cancer
Insoluble dietary fibre
Intact particles Increase stool weight61,74 Reduces the incidence of colorectal cancer and intestinal diseases
Accelerate transit time62 Reduces time for nutrients to be absorbed; lowers glucose, insulin and lipid levels after a meal
Water-holding capacity Reduces or delays nutrient uptake (animal study)75
Lowers glucose, insulin and lipid levels after a meal
Mechanism of action for health effects
The far most documented nutritional benefits of oat and barley β-glucans is the lowering of the serum cholesterol levels and in turn a reduced risk for the development of cardiovascular diseases2,3,66,76-78. Many attempts have been made to clarify the mechanisms by which β-glucans exert this effect, and there are typically three suggested mechanisms whereby β-glucans may exhibit the hypocholesterolemic property.
Background
11
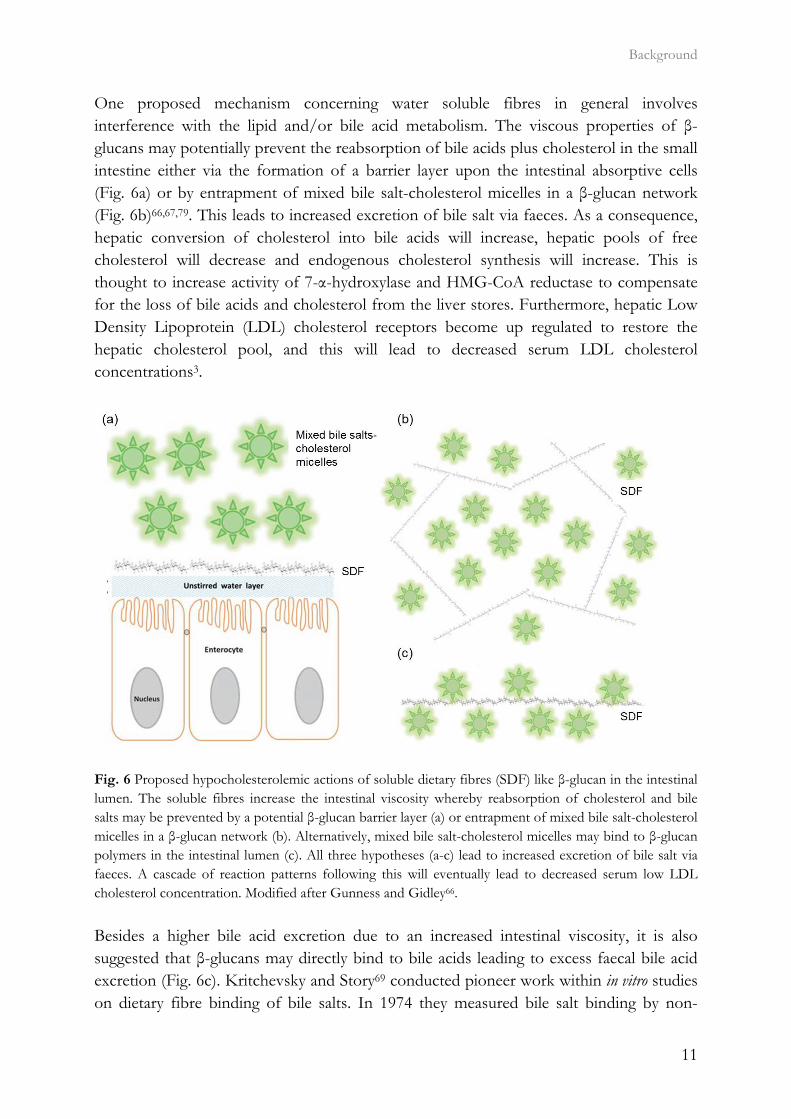
One proposed mechanism concerning water soluble fibres in general involves interference with the lipid and/or bile acid metabolism. The viscous properties of β-glucans may potentially prevent the reabsorption of bile acids plus cholesterol in the small intestine either via the formation of a barrier layer upon the intestinal absorptive cells (Fig. 6a) or by entrapment of mixed bile salt-cholesterol micelles in a β-glucan network (Fig. 6b)66,67,79. This leads to increased excretion of bile salt via faeces. As a consequence, hepatic conversion of cholesterol into bile acids will increase, hepatic pools of free cholesterol will decrease and endogenous cholesterol synthesis will increase. This is thought to increase activity of 7-α-hydroxylase and HMG-CoA reductase to compensate for the loss of bile acids and cholesterol from the liver stores. Furthermore, hepatic Low Density Lipoprotein (LDL) cholesterol receptors become up regulated to restore the hepatic cholesterol pool, and this will lead to decreased serum LDL cholesterol concentrations3.
Fig. 6 Proposed hypocholesterolemic actions of soluble dietary fibres (SDF) like β-glucan in the intestinal lumen. The soluble fibres increase the intestinal viscosity whereby reabsorption of cholesterol and bile salts may be prevented by a potential β-glucan barrier layer (a) or entrapment of mixed bile salt-cholesterol micelles in a β-glucan network (b). Alternatively, mixed bile salt-cholesterol micelles may bind to β-glucan polymers in the intestinal lumen (c). All three hypotheses (a-c) lead to increased excretion of bile salt via faeces. A cascade of reaction patterns following this will eventually lead to decreased serum low LDL cholesterol concentration. Modified after Gunness and Gidley66.
Besides a higher bile acid excretion due to an increased intestinal viscosity, it is also suggested that β-glucans may directly bind to bile acids leading to excess faecal bile acid excretion (Fig. 6c). Kritchevsky and Story69 conducted pioneer work within in vitro studies on dietary fibre binding of bile salts. In 1974 they measured bile salt binding by non-
Background
12
nutritive fibre using radioactively labelled bile salts. Since then, many approaches have been used to investigate the molecular interactions between fibre and small molecules like bile salts70,80-85, however, there has been very little data reported on the nature of any molecular interaction between bile salt micelles and dietary fibre. One of the few examples is the study by Bowles and coworkers86 who investigated specific interaction between barley β-glucan and glycocholic acid using solid-state 13C nuclear magnetic resonance (NMR) spectroscopy. However, no evidence for specific binding (e.g. hydrogen bonding or hydrophobic interactions) was found. Using the same method, Gunness et al.71 reported interaction between β-glucan and a model bile salt (taurochenodeoxycholate) and proposed a model for interaction where bile salt micelles have frequent close molecular contact with β-glucan chains causing changes in the bile salt micelle conformation. This suggests that β-glucan interacts directly on a molecular length scale with the micelles. Another suggested mechanism of action links to the flattering of the postprandial blood glucose and insulin rises following β-glucan intake87-89, which again has been related to: the amount and quality of fibre90, increased intrinsic viscosity and hence the gastrointestinal environment91 and physical integrity of the food92. Viscous dietary fibres may reduce the rate of intestinal absorption of glucose with subsequent decrease in insulin production by the pancreas93. As insulin is an activator of HMG-CoA reductase, it is possible that reduced insulin levels could lead to a decrease in cholesterol synthesis94. Thirdly the cholesterol reducing effect from soluble dietary fibres like oat and barley β-glucans has been associated with the SCFA produced by fermentation of microbiota in the colon. Propionate has been reported to inhibit cholesterol synthesis in the liver95, and this is the main argument in the SCFA-cholesterol lowering theory. On the other hand, propionate is found as a substrate for hepatic gluconeogenesis, and in this way it seems to have two opposite and competing effects on the gluconeogenesis60. Acetate is hypothesised as a primary substrate for cholesterol metabolism, and a dependence on the ratio of propionate and acetate in the possible utilisation of SCFA in lipid synthesis has been suggested96,97. However, the effect of SCFA in cholesterol metabolism may still be regarded as unclear. In summary, the properties that could contribute to the cholesterol lowering effect of oat and barley β-glucans in animal and humans are the prevention of bile salt reabsorption (with subsequent excess faecal excretion) and decreased hepatic cholesterol synthesis modulated by insulin and/or by fermentation products such as propionate. The immune modulatory capacity of mixed linkage cereal β-glucans has been confirmed in several studies though showing less efficiency than β-glucans of microbial origin 98-101. The immunological potency of fungal and yeast β-glucans was found to vary with the
Background
13
molecular mass, solution conformation, structural characteristics and the cell type that is targeted102-105. Cereal β-glucans have shown in vitro activity on cytokine secretion106, phagocytic activity and cytotoxicity of isolated immune cells107 and activation of the complement system108. In an in vitro test system favouring complement activation via the alternative pathway, aggregated barley β-glucan significantly inhibited haemolysis indicating complement activation, whereas high molecular mass soluble β-glucan showed no activity109. In addition, cereal β-glucans have shown an effect on cytokine secretion by isolated dendritic cells (DCs) as they increased the interleukin-10 (IL-10) and reduce the IL-12 levels106. This effect has been linked to the binding of β-glucan to dectin-1 receptors that initiates the immune response of dendritic cells102,110. Clinical trials on either athletes or hypercholesterolemic individuals, ingesting up to 6 g oat β-glucan daily, did not change immune parameters111,112. Thus, so far, cereal β-glucans have not shown immune modulation in the few conducted human studies.
Overview of studies and main outcomes
14
Chapter 4
Overview of studies and main outcomes
An overview of the six included studies (Fig. 1) and the main outcomes is presented in the following section. A full presentation of the results can be found in the respective papers.
4.1 β-Glucan extraction and characterisation
Paper I
Objective: Crude and purified barley and oat β-glucan samples were characterised in terms of composition, structure and rheological features to investigate the effect of α-glucan impurities on the β-glucan viscous properties.
Results: Oat β-glucan was approximately three times the size of barley β-glucan and no degradation was seen throughout the purification process. Considerable amounts of α-glucan impurities were found in crude and purified oat samples as compared to the purer barley samples. No significant structural differences were seen between oat and barley β-(1→3) to β-(1→4) linkage ratios. A direct viscosity dependence on β-glucan content regardless of amount and composition of α-glucan impurities was found for both barley and oat samples.
Conclusion: The study demonstrates that structural characteristic of the β-glucan polymers including the molecular mass dominates the functional traits over the presence of larger amount of starch/α-dextrins.
Paper II
Objective: A high β-glucan content mutant barley, mother barley and oat β-glucan were large-scale extracted, characterised and compared in terms of physico-chemical properties to elucidate structure-functionality differences.
Results: Large-scale extraction by comparable protocols lead to high purity and similar molecular mass barley and oat β-glucans. The main variance among sample compositional, structural and functional features was primarily explained by differences in the β-glucan block structures i.e. the ratio of cellotri- to cellotetraosyl units (mutant barley>mother barley>oat) and by differences in the ratio of β-(1→3) to β-(1→4)
Overview of studies and main outcomes
15
glycosidic linkages. The differences corresponded to a lower solubility of barley samples as compared to oat. Mutant barley β-glucan demonstrated a unique block structure with an extraordinary high number of cellotriosyl units as captured by both chromatographic and spectroscopic methods. Hypothetical illustrations of the varying barley and oat β-glucan block structures were presented. Low solubility of the barley samples was prospectively a consequence of repetitive cellotriosyl substructures that are prone to aggregate.
Conclusion: The study stresses the importance of β-glucan fine structure analysis for the relation to solubility and in turn to health effects.
4.2 β-Glucan in vitro functionality
Paper III
Objective: The molecular affinity between barley and oat β-glucans and phenolic compounds was studied in order to elucidate the mechanisms behind small molecule (e.g. bile acid) retention by β-glucan fibres.
Results: It was shown that phenolic aglycones in contrast to their corresponding glycosides were retained by both barley and oat β-glucans, which indicate the possible importance of the β-glucan hydrophobic properties for small molecule absorption. The different phenolics were retained at varying levels, but the nature of the molecular interaction could not be explained by simple correlation to any specific physico-chemical feature of the phenolic compounds. However, increased β-glucan viscosity showed to increase the small molecule retention and degradation of the β-glucan tertiary structure by enzymatic hydrolysis released some but not all of the phenolics.
Conclusion: The results suggest that at least two independent β-glucan properties are involved in determining the binding of small molecules to fibres: the degree of polymerisation and the fine structure of the polymers.
Paper IV
Objective: This study addressed the importance of the physico-chemical properties of barley and oat β-glucans for their capacity to affect immune responses.
Results: All the 23 β-glucan samples characterised in Paper II were found to modulate a microbial lipopolysaccharide induced dendritic cell cytokine pattern for which IL-10 levels increased and IL-12 levels decreased. Likewise, the β-glucans modulated a Lactobacillus acidophilus induced cell system giving rise to up-regulation of IL-10 but only modest changes of IL-12 cytokine levels. The extent to which β-glucan modulated the immune responses was found to depend on the β-glucan solubility, block structure as expressed by the ratio of cellotri- to cellotetraosyl units and especially the polymer aggregation in

Overview of studies and main outcomes
16
solution. Hypothetical speculations on β-glucan fringed micelle interaction with dendritic cells were presented.
Conclusion: This comparative study reveals that the β-glucan fine structure and in turn the polymer solubility and aggregation tendency are key elements for understanding their immune modulatory capacity.
4.3 β-Glucan in vivo functionality
Paper V
Objective: Barley and oat β-glucans which had been processed and dried by the same method were compared in a human study to investigate possible differences in the effectiveness and relate β-glucan functionality to specific physico-chemical properties.
Results: The mutant barley, mother barley and oat β-glucans from Paper II were consumed by 14 healthy adults in a blinded 4-arm cross-over intervention study as a daily dosage of 3.3 g/day fibre for a 3-week period. As compared to control (no β-glucan added) it was found that 3.3 g of extracted barley and oat β-glucan was not enough to significantly lower total and LDL cholesterol levels within the 3-week period. However, in contrast to barley oat β-glucan appeared to be more potent in lowering cholesterol when compared to baseline, presumably due to higher solubility and viscosity as compared to barley.
Conclusion: The results indicate that β-glucan solubility and in turn the spatial appearance in the intestine is of prime importance for the fibre interference with the endogenous lipid and/or bile acid metabolism.
Paper VI
Objective: In order to further clarify the in vivo β-glucan fibre functionality, as investigated in Paper V, the plasma metabolic patterns after β-glucan intake was studied using NMR metabolomics.
Results: It was shown that the plasma metabolic data correlated well with reference plasma glucose and serum triglyceride measurements. Subject variance was found to significantly dominate data although participant age and BMI exhibited little variance. The second most influential variation could be assigned to gender and characteristic lipoprotein landscapes were found for male and female samples. No significant difference between 3-week β-glucan treatments and control was found in agreement with the findings in Paper V. However, two sets of measurements (0, 2 and 4hour), one male and one female, appeared to represent fat boosted systems prior to β-glucan exposure, and these systems might prove more sensitive to β-glucan fibre exposure compared to average metabolomes of the young healthy adults.
Overview of studies and main outcomes
17
Conclusion: The results of this study reveal the existence of subject unique lipoprotein profiles, which are strongly dependent on gender, BMI and diet. It is hypothesised that β-glucan driven health effects from 3.3 g/day may only be detectable in young healthy adults after a diet high in fat.
Methodological considerations
18
Chapter 5
Methodological considerations
In the following section selected methods applied in the experimental part of the project are presented and discussed: 1) β-glucan extraction, 2) human study and 3) metabolomics and multivariate data analysis. The approach of using these methods in combination makes the present thesis work unique compared to other studies investigating cereal β-glucan functionality. The reader is referred to Paper I and II for a detailed survey of the physical/chemical principles, advantages and disadvantages of rheological, chromatographic and spectroscopic analytical techniques in relation to β-glucan characterisation. Reflections upon in vitro methods are presented later in the general discussion and in the respective papers.
5.1 β-Glucan extraction
Intervention product characteristics and study design are key elements in the cereal β-glucan nutritional understanding25 and β-glucan extraction methods largely affect the product characteristics. Thus, choice of an appropriate extraction technique is important as it may affect quantity113, purity114,115, structure33, molecular mass116, microstructure47 and in turn the rheological properties of the extracted β-glucan117,118. Traditionally, β-glucan extraction methods involve several steps: 1) inactivation of endogenous enzymes in the grain, 2) extraction with water or alkali solutions, 3) removal of contaminating protein and starch using hydrolytic enzymes and/or selective absorption, 4) precipitation of β-glucan from the purified solution with alcohol and 5) freeze, drum or spray drying of the extract119. The extractability or solubility of β-glucan is dependent on the extraction parameters (temperature, ionic strength, pH, duration of extraction and liquid-solids ratio), pretreatment (heating, drying and fineness of grind) and presence of enzymes (endogenous or from contaminating microorganisms). In general, the extractability of cereal β-glucans increases with elevated temperatures and pH39. Higher temperature extracts larger β-glucan molecules and the extractability of oat β-glucan seems to be higher than that from barley46,120. Wood et al.37 found that extraction under alkaline conditions increases the starch solubilisation and the proportion of co-extracted arabinoxylan from barley. Adjustment of the pH below the isoelectric point of proteins (pH 6) has been used for removing additional amounts of protein121. For complete extraction of β-glucan from cereal grains and high purity, rather drastic conditions are needed122, often inappropriate for potential food uses of the isolate119,120.
Methodological considerations
19
For food applications, cost effective production of β-glucan concentrate in terms of yield, purity, viscosity stability and in turn preservation of the functional properties is the main concern. In the present thesis work (Paper II) a method of extracting soluble oat and barley β-glucan in large-scale for food applications using hot water (95ºC), heat-stable α-amylase and centrifugally separation was adapted from Kvist and Lawther123 with some modifications. In addition to starch dextrification by α-amylase and protein removal by centrifugation, solution was protease treated and ethanol precipitated to purify β-glucan from additional proteins and starch derivatives. The extraction conditions were held at high temperatures (85-95 ºC) for minimum endogenous enzyme activity, and pH 6 was chosen to balance α-amylase and protease enzyme optimum with starch solubilisation and the isoelectric point of barley proteins. The final β-glucan purity largely depended on the starch content in the raw material in spite of adjustment of α-amylase amount to the crude material starch content. This indicate lower extractability of β-glucan from solutions highly dominated by starch and suggest a greater extraction potential in turn of purity and yield from more β-glucan rich grain fractions like the high β-glucan barley mutant or oat bran. Since processing has been shown to cause depolymerisation and loss of viscosity of β-glucan polymers1 and considering the small effect from starch on β-glucan viscosity (Paper I) no further purification of the large-scale extracted β-glucans was performed. Optimisation experiments prior to the large-scale extraction showed some degradation of barley β-glucan molecular mass during the extraction steps (500-350 kDa), but the magnitude of depolymerisation may be considered as small and the final molecular masses of the three extracted barley and oat β-glucans ranged 250-300 kDa, which is medium as compared to other extracted β-glucans116. In summary, the extraction conditions used for the large-scale extraction of barley mutant, barley and oat β-glucan was optimised to balance product quality and yield. Using the same procedure large batches of pure, comparable and reproducible β-glucans with similar molecular masses and specific genotypic structural characteristics were extracted for the use in the human intervention study.
5.2 Human study
The human gastrointestinal tract can be considered as a multivalent sink capable of converting biological material to energy. However, on the detailed chemical and kinetic level there is a great intra- and inter-individual variation in efficiency and specificity. In order to deal with this, three key issues are particularly important to consider when planning an intervention study: 1) a full cross-over design should be preferred to parallel studies because of the high inter-individual variation, 2) controlled diets should be preferred to habitual diets due to the large diversity of compounds present in different
Methodological considerations
20
foods and seasonal changes in habitual diets and 3) different metabolomes display different kinetics upon a given challenge124. Because the human homeostasis will efficiently restore the status quo, sampling dynamics is an important issue when analysing blood metabolic changes to a nutritional exposure. Recently, the response kinetics of the metabolome upon a nutritional challenge, e.g. postprandial sampling, has been favoured from the previous more static approaches based on single end-point or few samples along the time line of the intervention125. The intervention study of this thesis work was designed as a blinded randomised cross-over trial examining the hypocholesterolemic effects from two barley and one oat β-glucan as compared to a non-fibre control during four 3-week periods separated by 2-3 weeks washout. Fourteen normocholesterolemic young adults, 8 females and 6 males, aged 19-25 years completed the study. Recently, we investigated traditional exposure and effect markers from flaxseed dietary fibre intake in a similar study design and found a relation between fibre viscosity and hypocholesterolemic effect126. Hence, the study design, fibre effect in young healthy people and statistical power had been validated prior to the present β-glucan intervention study. The food platform used may influence the trial outcome by increasing the variability of individual subject response and in turn reduce the power and precision of a trial. Study subjects of the present trial maintained their habitual diet due to lack of external project funding for setting up controlled diets and because the FDA and EFSA health claims on 3 g β-glucan/day are based on individuals eating their habitual diet. The full cross-over design compensated some statistical power, but enrolment of a different cohort that habitually consumed a low-fibre diet presumably would have been advantageous. Extreme fibre intake up to 50 g/day was observed for some subjects. Before and after each period fasting and postprandial (0, 2 and 4 hour) blood samples were drawn. Fasting samples potentially show the long term changes in metabolically cleared systems whereas postprandial samples monitor fast changes following a nutritional exposure. Postprandial effects from intervention were strongly declined at 2 hour. Hence, for investigation of postprandial blood glucose and triglyceride small kinetic changes upon β-glucan treatment more frequent sampling between 0 and 4 hours would have been favourable. Again, funding was a restricting factor along with considerations of participant safety in terms of total amount of blood drawn. Altogether the present human trial enclosed a highly refined study design including repeated measures and cross-over for handling of different sources of variation, which inevitably makes the interpretation of both confirmatory and non-confirmatory results relevant. The general lack of effect of β-glucan treatment as compared to control is further considered later in the general discussion.
Methodological considerations
21
Conclusively, human trials have to be carefully designed in the future if they are to yield clear evidence of the value of β-glucan inclusion in diets at sensible levels. Most often, however, choice of an appropriate study design is a balance between cost and statistical power at the lowest tolerated level, which obviously decline the study robustness to mistakes.
5.3 Metabolomics and multivariate data analysis
Both exploratory and targeted metabolomics approaches using NMR spectroscopy and multivariate data analysis were employed in Paper VI to investigate plasma exposure and marker effects from treatment with the large-scale extracted barley and oat β-glucans. In metabolomics the profile of metabolites in a biological system e.g. bodyfluids, tissues and cellular extracts is identified and quantified127 often with the purpose of linking a specific dietary intake to a metabolic fingerprint. The overall metabolome of an organism is a complex signature depending on: 1) the metabolites from cells and tissues in the host, 2) foreign metabolites derived from e.g. drugs, 3) metabolites derived from the digestion of food and 4) metabolites produced by the gut microbiota. The human metabolome consists of a large number of small metabolites (~20,000) belonging to a variety of different compound classes, such as amino acids, peptides, organic acids, lipids, nucleotides128. Both nuclear magnetic resonance (NMR) spectroscopic and mass spectrometry (MS) based technologies have been widely used to measure the effect of dietary components in the nutri-metabolomics approach129,130. NMR spectroscopy functions by the application of a strong magnetic field and resonance frequencies pulses to the nuclei of atoms in a sample. Nuclei in different chemical environments absorb energy at slightly different resonance frequencies, which is referred to as the chemical shift of the atom131. The majority of NMR metabolomics studies have been using 1H NMR spectroscopy since it is the most informative and sensitive NMR method and the most rapid method suited for high throughput studies124. The larger magnetic field the better is the resolution and the sensitivity132. NMR spectroscopy is a non-destructive technique with the ability to simultaneously quantify multiple classes of metabolites. Moreover, NMR metabolomics studies of biofluids have shown high reproducibility and in most cases only one analytical replicate is sufficient per sampling point133. Numerous factors have to be carefully considered to gain reliable results from metabolomics studies. A general challenge in metabolomics is the relative low number of samples compared to the number of variables, which means that a full cross-over design should be preferred to parallel studies due to the possible high inter-individual variation in human studies134. Likewise, dynamic/kinetic studies should be preferred to static studies
Methodological considerations
22
only including end-point measures. The most commonly used biological samples for nutri-metabolomics studies are easy accessible samples such as urine, salvia and blood/plasma/serum. Great care must be taken to sample collection because biological samples is highly susceptible to degradation135. Both urine and plasma samples should be handled quickly and stored preferably at -80ºC133. The metabolomics work included in this thesis explored plasma samples analysed by 600 MHz 1H NMR spectroscopy, and the best possible preservation procedures for the samples was carried out133. Choices of acquisition conditions and type of experiments were based on previous experience136 and generally spectra of very high quality were achieved. Metabolite identification is an essential part of a metabolomics study134 and approximate full assignment of metabolite signals was possible. Especially, the lipoprotein region showed well resolved profiles of interest, and here the favourable quantitative nature of NMR spectroscopy was successfully used to study lipoprotein fluctuations in relation to diets. The complexity and richness, which are key qualities of metabolomics data, generally makes data interpretation very complicated. Multivariate data analysis are here an obvious choice due to their ability to decompose complex multivariate data into simpler and potentially interpretable structures137. Data preprocessing such as normalisation (scaling between samples), centering and scaling between variables is typically applied to remove unwanted systematic bias in spectra while retaining the interesting biological information. Before multivariate data analysis each sample is usually normalised to the global or to a reference signal area which adjusts for the variance that may arise from sample inhomogeneity or minor differences in sample preparation. Furthermore, the data matrix is normally mean centered in order to focus on the differences between samples rather than the direction of the overall variance. Centering converts all the concentrations to fluctuations around zero instead of around the mean of the metabolite concentration and hereby adjusts for offset variation between the high and low abundant metabolites. The most common scaling method for metabolomics data is autoscaling which employs the standard deviation as a scaling factor. This adjusts for the fold difference between the detected metabolites138. Principal component analysis (PCA) summarises the major variation in a data set and capture systematic variation in a model that can be used to quickly visualise which samples are similar or dissimilar to each other. Mathematically a PCA model can be written as: X = T · P′ + E
Methodological considerations
23
X is the data matrix representing samples and variables decomposed into a score matrix (T) and a transposed loading matrix (P′). The E matrix contains the residuals, the part of the data not explained by the principal component model137. From this, possible spectral loadings causing any treatment-related separation may be identified. Partial least square (PLS) regression is a multivariate calibration/regression method by which two sets of data X (e.g. spectra) and Y (e.g. a response variable/biomarker) are related by means of regression. This enables establishment of a linear model that can predict Y from the measured spectra in X139. Like PCA, PLS regression generates a model of the data, but where PCA models the main variance in the data itself, PLS derives a model that describes the correlation between the X variables and a feature (Y variable) of interest. In addition, refined PLS methods like the interval partial least square (iPLS) regression140 used for variable selection and the discriminant analysis (PLS-DA) approach141 applied in supervised classification using the study design as a priori knowledge were used in the metabolomics data analysis. Validation of PLS models is a very central issue to ensure construction of reliable models and estimates of e.g. prediction error and to determine the optimal number of components. Cross validation, where the X data matrix is divided into a number of segments containing one or more samples (full or segmented cross validation), may be applied when the number of samples is limited. As a stronger validation method, test set validation can be used when a study contains enough samples to be divided into a calibration set and a validation test set. Here, the calibration set is used to build the model, and the test set is subsequently applied to estimate the prediction error139. Test set validation was used in the metabolomics study whereas full and segmented cross validation was used in subsequent studies due to limited number of samples. The often used estimate of prediction error is the root mean square error (RMSE), which mimics the traditional standard deviation. PCA and PLS represent the basic data analytical approaches broadly applied throughout this thesis work and they were successful used to obtain overview of data, detect ‘outliers’, select variables, classify samples into groups and relate data to reference values for construction of prediction models. For examples on usage of multivariate data analysis in the investigation of non-metabolomics data matrices the reader is referred to Papers II, III and IV. In the metabolomics study, the initially used exploratory metabolomics approach did not provide new insight to potential β-glucan exposure and effect markers. The major disadvantage of NMR spectroscopy is the low sensitivity and resolution why NMR application may not be the first choice for identification of new biomarkers. Instead, the nature of NMR as a quantitative technique makes a targeted metabolomics approach a
Methodological considerations
24
more evident option124 in accordance with the investigation of β-glucan action on blood lipids, which revealed the potential existence of subject unique lipoprotein profiles dependent on gender, BMI and diet. This exemplifies how metabolomics may promote new and unexpected findings from hypothesis based human intervention studies.
General discussion and perspectives
25
Chapter 6
General discussion and perspectives
The main objective of this thesis study was to investigate the structure-functionality properties of different barley and oat β-glucan fibres, and the in vitro and the in vivo effects of these β-glucans. It was hypothesised that delicate structural differences of β-glucans provide different in vitro and in vivo functionalities. Even though recent research has shed some light on the mechanisms of action and structure-functionality relationship of β-glucans, the exact functional principle remain elusive. A number of expert reviews suggest that β-glucan viscosity is the main parameter governing health effects, on the other hand, there is no clear evidence in clinical studies of blood lipids to demonstrate an effect of viscosity142. In 2010 Wood142 stated the following: “Repeated clinical studies that provide no physico-chemical information about the β-glucan in the foods used lend little additional information to the very large body of literature on this subject and may simply add further confusion because of different responses.” Similar considerations lead to the ambitious intention of this thesis; to conduct an in-depth comparison of barley and oat β-glucan structure and functionality all the way from raw plant material to health effects. Until the present thesis work, β-glucan fine structure characteristics have not yet been ascribed a direct role in the health related effects of dietary fibres. However, the fact that barley β-glucan have not proved the same hypocholesterolemic capability as oat β-glucan lead to speculations whether differences in the β-glucan oligomer block structural patterns is of crucial importance. Knowledge in this field would add valuable information to the discussion of the effectiveness of β-glucans in food systems and human health, and also be of great marketing value for the functional food industry. From 1995 to 2010 the medicine and doctor expenses per Danish household increased with almost 100%143. This underlines the request for health promoting bioactive food products in approaching a healthy population in the future. β-Glucan block structure and solubility
Results from Paper I demonstrated that barley and oat β-glucan structural characteristics, especially the molecular mass, compared at equal β-glucan concentration, dominate the viscous properties over the presence of α-dextrin impurities. Hence, the presence of starch derivatives in the barley and oat β-glucan preparations was not considered as a source of variation disturbing the β-glucan functionality in the further in vitro and in vivo investigations. Paper II showed that β-glucan block structural differences explain the main variance among identically extracted mutant barley, mother barley and oat β-glucans. In addition, the higher DP3/DP4 ratio of barley samples corresponded to a lower solubility
General discussion and perspectives
26
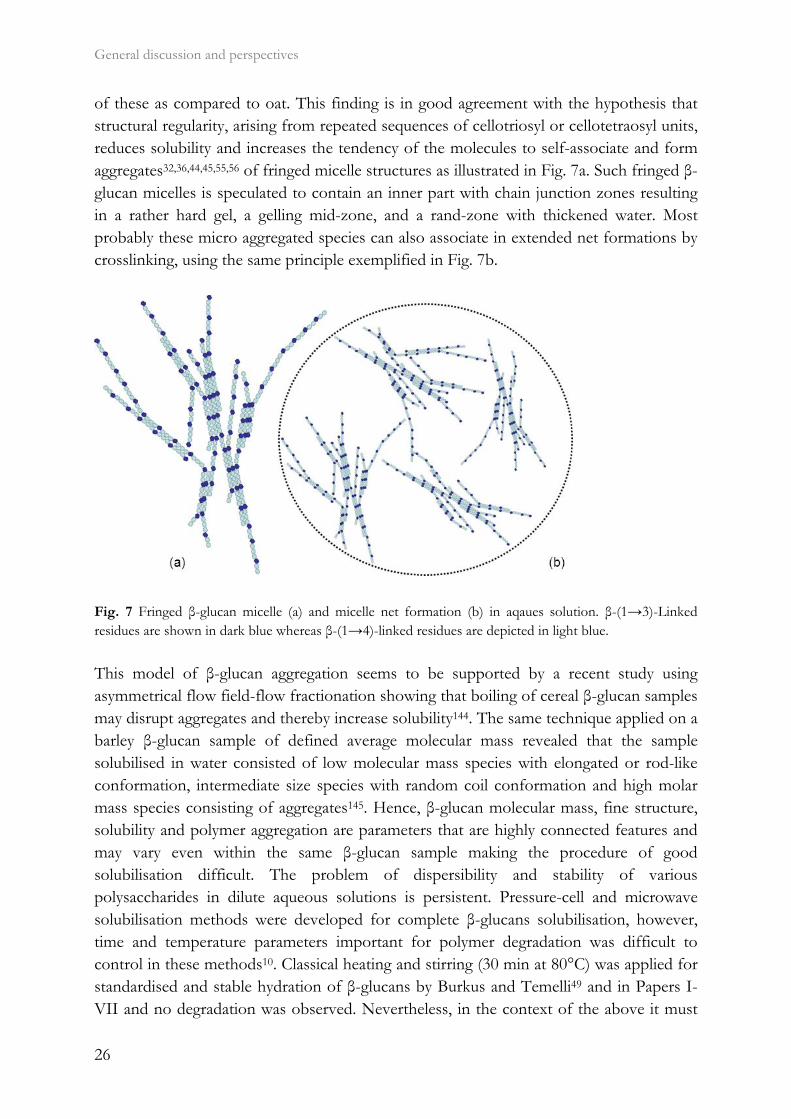
of these as compared to oat. This finding is in good agreement with the hypothesis that structural regularity, arising from repeated sequences of cellotriosyl or cellotetraosyl units, reduces solubility and increases the tendency of the molecules to self-associate and form aggregates32,36,44,45,55,56 of fringed micelle structures as illustrated in Fig. 7a. Such fringed β-glucan micelles is speculated to contain an inner part with chain junction zones resulting in a rather hard gel, a gelling mid-zone, and a rand-zone with thickened water. Most probably these micro aggregated species can also associate in extended net formations by crosslinking, using the same principle exemplified in Fig. 7b.
Fig. 7 Fringed β-glucan micelle (a) and micelle net formation (b) in aqaues solution. β-(1→3)-Linked residues are shown in dark blue whereas β-(1→4)-linked residues are depicted in light blue.
This model of β-glucan aggregation seems to be supported by a recent study using asymmetrical flow field-flow fractionation showing that boiling of cereal β-glucan samples may disrupt aggregates and thereby increase solubility144. The same technique applied on a barley β-glucan sample of defined average molecular mass revealed that the sample solubilised in water consisted of low molecular mass species with elongated or rod-like conformation, intermediate size species with random coil conformation and high molar mass species consisting of aggregates145. Hence, β-glucan molecular mass, fine structure, solubility and polymer aggregation are parameters that are highly connected features and may vary even within the same β-glucan sample making the procedure of good solubilisation difficult. The problem of dispersibility and stability of various polysaccharides in dilute aqueous solutions is persistent. Pressure-cell and microwave solubilisation methods were developed for complete β-glucans solubilisation, however, time and temperature parameters important for polymer degradation was difficult to control in these methods10. Classical heating and stirring (30 min at 80°C) was applied for standardised and stable hydration of β-glucans by Burkus and Temelli49 and in Papers I-VII and no degradation was observed. Nevertheless, in the context of the above it must
General discussion and perspectives
27
be assumed that β-glucan solutions prepared for the various experiments of this thesis work consisted of a rather heterogeneous group of polysaccharide conformations even if they were prepared identically and from the exact same β-glucan sample. In vitro functionalities
It is believed that an increased viscosity of the upper gastrointestinal tract content upon β-glucan consumption may entrap or encapsulate mixed bile acid micelles leading to a greater bile acid excretion3,66,67,79,146-148. Also a direct binding of bile acids by β-glucan has been suggested, although less studied70,80-85. In Paper III, both types of interaction were studied experimentally using an equilibrium dialysis in vitro system. The dialysis system was set to mimic physiological conditions (37ºC and constant shear) although far from being representative of the human intestinal environment. The retention of small molecules (phenolic compounds and bile acids) by both barley and oat β-glucan could not be ascribed specific physico-chemical properties of the small molecules but rather it was suggested that β-glucan properties such as the degree of polymerisation and the fine structure of the polymers were important features determining the molecular interaction. Conclusively, this study indicated that the multiplicity of parameters determining the binding of small molecules to fibres obscures a direct correlation of the observed binding to specific descriptors. Nevertheless, as the dialysis approach in combination with molecular modelling offers a fast and cheap method for screening large series of small molecules and β-glucan fibres it has a great potential in the further investigation of the underlying mechanism of β-glucan functionality. The use of different β-glucan preparations in various immunological test systems complicates attempts to draw conclusions on structure-functional relationships of the observed effects. Among fungal β-glucans, fine structure, molecular mass, conformation and solubility have been shown to influence immunological activity105, and it is likely that these parameters also affect the activity of cereal β-glucan. Paper IV addressed the importance of barley and oat β-glucan physico-chemical properties for their capacity to affect immune responses and the results showed that the immune modulatory capacity of equally sized β-glucans is dependent on the DP3/DP4 ratio, solubility and especially polymer conformation in solution. In context with the above presented hypothesis of β-glucan supramolecular aggregate formation, the high immune response of the rather insoluble mutant barley β-glucan can be speculated to arise from fringed micelle formation of this polymer favoured by the dendritic cell receptors as compared to receptor interaction with single chain polysaccharides. This would be in agreement with a reduced immune modulatory effect from soluble β-glucans as compared to aggregated β-glucans seen elsewhere109. The evidence for an immune potentiating activity for cereal β-glucans is primarily based on in vivo animal and in vitro cell culture studies and it remains to be seen whether such observations in animal and in vitro studies have consequences for human physiology and health.
General discussion and perspectives
28
The choice of using in vitro methods to investigate the action of β-glucans has several reasons. As shown earlier in this thesis, the complexity of β-glucan functionality is extensive for which reason it becomes relevant to study β-glucan in less complex systems (in vitro) where covariant factors can be limited and sampling is much easier. Secondly, it is difficult to provide more mechanistic knowledge about the effects of β-glucan through epidemiological studies – such detailed information could to a certain degree be obtained from in vitro models. The drawback to this, however, is the fact that physiological conditions can never be exactly mimicked in vitro and that possible inconsistence between in vitro and in vivo results may be difficult to explain. In conclusion, the in vitro models applied in the experimental work added valuable knowledge to the general understanding of β-glucan solution properties as well as the interaction of β-glucan with small molecules and immune cells. In vivo functionalities
The FDA-approved health claim concerning the intake of soluble fibre from oat and a reduced risk of heart disease was based on a review of 37 scientific studies, 17 of which demonstrated positive effects mostly in hypercholesterolemic subjects. Four studies did not meet the inclusion criteria and the remaining 16 studies showed insignificant or no effects on blood cholesterol levels, with explanations such as low β-glucan content, processing or compliance8. The report comments on the critical effects of processing, but no requirements on molecular mass or viscosity measurements were outlined in conjunction with the use of the claim. The EFSA claim on barley and oat β-glucan recommends a daily intake of at least 3 g of minimal processed β-glucan for LDL-cholesterol lowering activity in both normocholesterolemic and hypercholesterolemic subjects9, but there is still no definition of what minimally processed β-glucans means, nor any guidelines on how the functionality of dietary fibre can be guaranteed. In two reviews by Wood2,25 on the relationship between the solution properties of cereal β-glucans and observed physiological effects it was concluded, that the efficacy of various soluble β-glucan preparations could not solely be related to the amount, size and viscosity of the β-glucans as the included studies represented a heterogeneous group of trials in terms of both study design and intervention product characteristics. The investigation of the health effects of the physico-chemical characterised barley and oat β-glucans of Paper II in a human intervention study is presented in Paper V. Although it was demonstrated that 3.3 g/day barley and oat β-glucan was not sufficient to significantly lower the LDL-cholesterol levels of young and healthy male and females a greater potential observed for oat β-glucan was suggested to derive from a higher solubility and viscosity of this as compared to mutant and mother barley β-glucans. Hence, differences in the fine structure remain a likely reason for the successful cholesterol lowering in some human intervention studies and the lack of effect in other studies on barley and oat β-glucan. The lack of β-
General discussion and perspectives
29
glucan efficiency in the human study could also be speculated to be due to: 1) too low active β-glucan dose, 2) loss of β-glucan functionality through processing, 3) choice of study subjects or 4) too short intervention period. In fact, it might be that dietary fibre nutritional functionality is predominately preventative in contrast to curative for which reason effects would sparsely be detectable in short intervention studies on healthy subjects. The large number of factors influencing the effectiveness of β-glucans calls for larger intervention studies with sufficient statistical power. The human study reported in Paper V used a full cross-over design whereby the exact individual response for each treatment could be evaluated. However, inclusion of more subjects (n=14) in the study would have strengthened the data analysis and interpretation of the study. Using nutri-metabolomics techniques as in Paper VI, it may be possible to detect additional responses to those presumably found with the traditional used biomarkers. The initially exploratory nature of the metabolomics data analysis was alternatively replaced by a more targeted approach where the a priori knowledge on how the β-glucan fibres might affect the lipid metabolism was used. Nevertheless, in Paper VI, the absence of β-glucan treatment effect on cholesterol metabolism found in Paper V was confirmed and no additional responses were identified between 3-week baseline samples. This may be due to the above outlined influential factors or additionally lack of NMR sensitivity as discussed earlier. The recommended β-glucan dose in the FDA- and EU-approved health claims are the same for men/women, young/old and obese/slim although there potentially is a large difference in health effects between individuals. The recommended intake in the health claims should perhaps be based on energy intake, and hence differ for men/women, young/old and obese/slim. Also, it might be that in vivo cereal β-glucan activity is determined by the subject health situation. Therefore, addition of extracted soluble β-glucans to food may be useful for certain indications and risk groups, but for the majority of those who want to increase their dietary fibre intake, it should be sufficient to eat a diet containing naturally fibre-rich food products. Food is eaten as a whole and therefore also the combined effect of components has to be taken into account when assessing the health effects of fibre-rich foods.
General discussion and perspectives
30
In this thesis work we used the state-of the-art technological platforms for large-scale extraction of barley and oat β-glucans, physico-chemical characterisation and in vitro and in vivo investigations. However, it seems obvious that we in future work need:
improved analytical methods for studying the oligomer block structural patterns of β-glucans
tools for understanding how and why the plants modify the fine structure of β-glucans
improved models for understanding β-glucan aggregation
improved models for understanding β-glucan affinity to small molecules such as bile acids
to set up new intervention studies with many more subjects, higher doses and longer monitoring by metabolomics with additional urine and faces samples
There is at present no standardised methodology for characterisation of β-glucans that would be accessible to most laboratories. However, with the introduction of more general regulations for health claims, it is necessary to verify that the fibre tested in the lab is also functional in vivo. This involves the measurement of several fibre physico-chemical properties as outlined throughout this thesis work, but for future studies, it might also be relevant to use in vitro digestion methods to evaluate how β-glucans behave in combination with a food product and how the β-glucan-rich product behaves in the gastrointestinal environment. By measuring the releasability of β-glucans, it would be possible to estimate the “active” dose required in the intestine, and by optimising the releasability, less fibre should be required for retained physiological effects. It is important for the food industry that the health promoting properties of soluble fibre, as well as the factors that may influence these properties, can be modelled or evaluated in vitro before studies are carried out in humans, or even to eliminate the need for in vivo studies for every single product.
Conclusions
31
Chapter 7
Conclusions
In summary, the highlights from this thesis work are:
β-Glucan extraction and characterisation
Barley and oat β-glucan preparations vary significantly in purity
β-Glucan dominates the viscous properties over the presence of α-glucan impurities in water dispersions
The fine structure of barley and oat β-glucans influence their solubility
Repeated cellotriosyl or cellotetraosyl substructures in β-glucan are prone to aggregate
High β-glucan barley mutant showed a significantly changes and unique oligomer block structure as compared to the mother barley variety
β-Glucan in vitro functionality
Small molecules (phenolics and bile acids) interact with β-glucan in vitro
Degree of polymerisation and β-glucan fine structure influence the retention of small molecules
Barley β-glucan of low solubility as compared to soluble oat β-glucan has a greater immune modulatory potential in vitro
β-Glucan fine structure and in turn solubility and aggregation are key elements for understanding their immune modulatory capacity
β-Glucan in vivo functionality
3.3g/day extracted barley and oat β-glucan does not significantly lower total and LDL cholesterol levels in young and healthy adults
An indicated potential effect of oat in contrast to barley suggests the importance of solubility for β-glucan interference with the cholesterol metabolism
Plasma metabolic patterns from 3-week 3.3 g β-glucan/day treatment does not differ significantly from control treatment
β-Glucan health effects on subject unique lipoprotein profiles of young healthy adults may only be detectable after a diet high in fat
Conclusions
32
In conclusion, the results show that barley and oat β-glucan fine structures are of great importance for their functionality. Significant differences in β-glucan block structures were found between barley and oat and even between two related barley varieties. The results demonstrate that β-glucan solubility and the polymer aggregation in solution is dependent on the block structural pattern. Barley β-glucans with high DP3/DP4 ratios as compared to oat show lower solubility and are suggested to form heterogeneous mixtures of free polymers, fringed micelles and networks of aggregated species in solution. Small molecule retention by β-glucan is influenced by the degree of polymerisation and the fine structure of the polymer. The immune response to β-glucans is especially connected to the presence of aggregated species from insoluble β-glucans. In contrast, the in vivo metabolic response to β-glucan is related to high solubility of the polymers. Altogether, the results demonstrate that the health effects form barley and oat β-glucans are largely influenced by the polymer fine structure, and that different structures may affect various mechanisms in our body differently. It is very important to account for these multiple functional and bioactive properties of β-glucans in the future evaluations of β-glucan effectiveness in functional foods and health.
References
33
References
1 . Brennan CS, Cleary LJ. The potential use of cereal (1→3),(1→4)-beta-D-glucans
as functional food ingredients. J Cereal Sci 2005;42:1-13.
2 . Wood PJ. Relationships between solution properties of cereal beta-glucans and physiological effects - a review. Trends Food Sci Tech 2004;15:313-20.
3 . Theuwissen E, Mensink RP. Water-soluble dietary fibers and cardiovascular disease. Physiol Behav 2008;94:285-92.
4 . El KD, Cuda C, Luhovyy BL, Anderson GH. Beta glucan: health benefits in obesity and metabolic syndrome. J Nutr Metab 2012;2012:851362.
5 . Phillips GO, Cui SW. An introduction: Evolution and finalisation of the regulatory definition of dietary fibre. Food Hydrocoll 2011;25:139-43.
6 . Lupton JR, Betteridge VA, Pijls LTJ. Codex final definition of dietary fibre: issues of implementation. Quality Assur Safety Crops Foods 2009;1:206-12.
7 . WHO. http://www.who.int/mediacentre/factsheets/fs317/en/index.html. September 30. 2012.
8 . FDA, US Food and Drug Administration. Food labeling: Health claims; Soluble fiber from whole oats and risk of coronary heart disease. Federal Register 1997;62:15343-44.
9 . EFSA, Panel on Dietetic Products,nutrition and allegies. Scientific opinion on the substantiation of health claims related to beta-glucans and maintenance of normal blood cholesterol concentrations and maintenance or achievement of a normal body weight. EFSA J 2009;7:1254.
10 . Ebringerova A, Hromadkova Z, Heinze T. Hemicellulose. Adv Polymer Sci 2005;186:1-67.
11 . Brennan CS, Cleary LJ. Utilisation Glucagel (R) in the beta-glucan enrichment of breads: A physicochemical and nutritional evaluation. Food Res Int 2007;40:291-6.
12 . Temelli F, Bansema C, Stobbe K. Development of an orange-flavored barley beta-glucan beverage. Cereal Chem 2004;81:499-503.
13 . Lee S, Warner K, Inglett GE. Rheological properties and baking performance of new oat beta-glucan-rich hydrocolloids. J Agri Food Chem 2005;53:9805-9.
References
34
14 . Lazaridou A, Biliaderis CG, Micha-Screttas M, Steele BR. A comparative study on structure-function relations of mixed-linkage (1→3),(1→4) linear beta-D-glucans. Food Hydrocoll 2004;18:837-55.
15 . Burkus Z, Temelli F. Stabilization of emulsions and foams using barley beta-glucan. Food Res Int 2000;33:27-33.
16 . Volikakis P, Biliaderis CG, Vamvakas C, Zerfiridis GK. Effects of a commercial oat-beta-glucan concentrate on the chemical, physico-chemical and sensory attributes of a low-fat white-brined cheese product. Food Res Int 2004;37:83-94.
17 . Konuklar G, Inglett GE, Warner K, Carriere CJ. Use of a beta-glucan hydrocolloidal suspension in the manufacture of low-fat Cheddar cheeses: textural properties by instrumental methods and sensory panels. Food Hydrocoll 2004;18:535-45.
18 . Inglett GE, Carriere CJ, Maneepun S, Tungtrakul P. A soluble fibre gel produced from rice bran and barley flour as a fat replacer in Asian foods. Int J Food Sci Technol 2004;39:1-10.
19 . Berglund PT, Fastnaught CE, Holm ET. Physicochemical and sensory evaluation of extruded high-fiber barley cereals. Cereal Chem 1994;71:91-5.
20 . Fastnaught CE. Barley fiber. In: Cho SS, Dreher ML, ed. Handbook of dietary fiber. New York, USA: Marcel Dekker Inc., 2001. p. 519-42.
21 . Madene A, Jacquot M, Scher J, Desobry S. Flavour encapsulation and controlled release - a review. Int J Food Sci Technol 2006;41:1-21.
22 . Becker W, Lyhne N, Pedersen AN, Aro A, Fogelholm M, Phórsdottir I, Alexander J, Anderssen SA, Meltzer HM, Pedersen Ji. Nordic nutrition recommendations 2004; Integrating nutrition and physical activity. Scand J Nutr 2004;48:178-87.
23 . Fagt S, Matthiessen J, Biltoft-Jensen A, Velsing Groth M, Christensen T, Hinsch H-J, Hartkopp H, Trolle E, Lyhne N, Møller A. Udviklingen i danskernes kost 1985-2001 - med fokus på sukker og alkohol samt motivation og barrierer for sund livsstil. Søborg, Danmark: Danmarks Fødevare- og Veterinærforskning, 2004.
24 . Katan MB, De Roos NM. Promises and problems of functional foods. Crit Rev Food Sci Nutr 2004;44:369-77.
25 . Wood PJ. Cereal beta-glucans in diet and health. J Cereal Sci 2007;46:230-8.
26 . Yokoyama R, Nishitani K. Genomic basis for cell-wall diversity in plants. A comparative approach to gene families in rice and Arabidopsis. Plant Cell Physiol 2004;45:1111-21.
27 . Brett CT, Waldron KW. Physiology and biochemistry of plant cell walls, 2nd ed. London, UK: Chapman and Hall, 1996.
References
35
28 . Burton RA, Gidley MJ, Fincher GB. Heterogeneity in the chemistry, structure and function of plant cell walls. Nature Chem Bio 2010;6:724-32.
29 . Carpita NC, Gibeaut DM. Structural models of primary cell walls in flowering plants: Consistency of molecular structure with the physical properties of the walls during growth. Plant J 1993;3:1-30.
30 . Wood PJ, Weisz J, Beer MU, Newman CW, Newman RK. Structure of (1→3),(1→4)-beta-D-glucan in waxy and nonwaxy barley. Cereal Chem 2003;80:329-32.
31 . Buckeridge MS, Rayon C, Urbanowicz B, Tine MAS, Carpita NC. Mixed linkage (1→3),(1→4)-beta-D-glucans of grasses. Cereal Chem 2004;81:115-27.
32 . Cui W, Wood PJ, Blackwell B, Nikiforuk J. Physicochemical properties and structural characterization by two-dimensional NMR spectroscopy of wheat beta-D-glucan - comparison with other cereal beta-D-glucans. Carbohydr Polym 2000;41:249-58.
33 . Roubroeks JP, Mastromauro DI, Andersson R, Christensen BE, Åman P. Molecular weight, structure, and shape of oat (1→3),(1→4)-beta-D-glucan fractions obtained by enzymatic degradation with lichenase. Biomacromol 2000;1:584-91.
34 . Papageorgiou M, Lakhdara N, Lazaridou A, Biliaderis CG, Izydorczyk MS. Water extractable (1→3),(1→4)-beta-D-glucans from barley and oats: An intervarietal study on their structural features and rheological behaviour. J Cereal Sci 2005;42:213-24.
35 . Lazaridou A, Biliaderis CG. Molecular aspects of cereal beta-glucan functionality: Physical properties, technological applications and physiological effects. J Cereal Sci 2007;46:101-18.
36 . Vaikousi H, Biliaderis CG, Izydorczyk MS. Solution flow behavior and gelling properties of water-soluble barley (1->3),(1->4)-beta-glucans varying in molecular size. J Cereal Sci 2004;39:119-37.
37 . Wood PJ, Weisz J, Mahn W. Molecular characterization of cereal beta-glucans .2. size-exclusion chromatography for comparison of molecular-weight. Cereal Chem 1991;68:530-6.
38 . Irakli M, Biliaderis CG, Izydorczyk MS, Papadoyannis IN. Isolation, structural features and rheological properties of water-extractable beta-glucans from different Greek barley cultivars. J Sci Food Agric 2004;84:1170-8.
39 . Knuckles BE, Yokoyama WH, Chiu MM. Molecular characterization of barley beta-glucans by size-exclusion chromatography with multiple-angle laser light scattering and other detectors. Cereal Chem 1997;74:599-604.
References
36
40 . Christensen NJ, Hansen PI, Larsen FH, Folkerman T, Motawia MS, Engelsen SB. A combined nuclear magnetic resonance and molecular dynamics study of the two structural motifs for mixed-linkage beta-glucans: methyl beta-cellobioside and methyl beta-laminarabioside. Carbohydr Res 2010;345:474-86.
41 . Perez S, Kouwijzer M, Mazeau K, Engelsen SB. Modeling polysaccharides: Present status and challenges. J Mol Graph Model 1996;14:307-&.
42 . Woodward JR, Phillips DR, Fincher GB. Water-soluble (1→3,1→4)-beta-D-glucans from barley (Hordeum-Vulgare) endosperm .4. comparison of 40-degrees-C and 65-degrees-C soluble fractions. Carbohydr Polym 1988;8:85-97.
43 . Izawa M, Kano Y, Koshino S. Relationship between structure and solubility of (1→3), (1→4)-beta-glucan from barley. J Am Assoc Brew Chem 1993;51:123-7.
44 . Bohm N, Kulicke WM. Rheological studies of barley (1→3)(1→4)-beta-glucan in concentrated solution: mechanistic and kinetic investigation of the gel formation. Carbohydr Res 1999;315:302-11.
45 . Tosh SM, Brummer Y, Wood PJ, Wang Q, Weisz J. Evaluation of structure in the formation of gels by structurally diverse (1→3)(1→4)-beta-D-glucans from four cereal and one lichen species. Carbohydr Polym 2004;57:249-59.
46 . Wood PJ, Paton D, Siddiqui IR. Determination of beta-glucan in oats and barley. Cereal Chem 1977;54:524-33.
47 . Hromadkova Z, Ebringerova A, Sasinkova V, Sandula J, Hribalova V, Omelkova J. Influence of the drying method on the physical properties and immunomodulatory activity of the particulate (1→3)-beta-D-glucan from Saccharomyces cerevisiae. Carbohydr Polym 2003;51:9-15.
48 . Dikeman CL, Fahey GC. Viscosity as related to dietary fiber: A review. Crit Rev Food Sci Nutr 2006;46:649-63.
49 . Burkus Z, Temelli F. Rheological properties of barley beta-glucan. Carbohydr Polym 2005;59:459-65.
50 . Dawkins NL, Nnanna IA. Studies on oat gum (1→3),(1→4)-beta-D-glucan - composition, molecular-weight estimation and rheological properties. Food Hydrocoll 1995;9:1-7.
51 . Anttila H, Sontag-Strohm T, Salovaara H. Viscosity of beta-glucan in oat products. Agr Food Sci 2004;13:80-7.
52 . Burkus Z, Temelli F. Network formation by pilot plant and laboratory-extracted barley beta-glucan and its rheological properties in aqueous solutions. Cereal Chem 2006;83:584-9.
References
37
53 . Dongowski G, Drzikova B, Senge B, Blochwitz R, Gebhardt E, Habel A. Rheological behaviour of beta-glucan preparations from oat products. Food Chem 2005;93:279-91.
54 . Wood PJ, Weisz J, Blackwell BA. Structural studies of (1→3),(1→4)-beta-D-glucans by 13C-nuclear magnetic-resonance spectroscopy and by rapid analysis of cellulose-like regions using high-performance anion-exchange chromatography of oligosaccharides released by lichenase. Cereal Chem 1994;71:301-7.
55 . Grimm A, Kruger E, Burchard W. Solution properties of beta-D-(1→3),(1→4)-glucan isolated from beer. Carbohydr Polym 1995;27:205-14.
56 . Wu J, Zhang Y, Wang L, Xie BJ, Wang HB, Deng SP. Visualization of single and aggregated hulless oat (Avena nuda L.) (1→3),(1→4)-beta-D-glucan molecules by atomic force microscopy and confocal scanning laser microscopy. J Agric Food Chem 2006;54:925-34.
57 . Drzikova B, Dongowski G, Gebhardt E, Habel A. The composition of dietary fibre-rich extrudates from oat affects bile acid binding and fermentation in vitro. Food Chem 2005;90:181-92.
58 . Eastwood M, Kritchevsky D. Dietary fiber: How did we get where we are? Annu Rev Nutr 2005;25:1-8.
59 . Hellendoorn EW. Fermentation as the principal cause of the physiological activity of indigestible food residue. In: Spiller GA, ed. Topics in dietary fiber research. New York, USA: Plenum, 1983. p. 127-68.
60 . Wong JMW, de Souza R, Kendall CWC, Emam A, Jenkins DJA. Colonic health: Fermentation and short chain fatty acids. J Clin Gastroenterol 2006;40:235-43.
61 . Kanauchi O, Agata K. Protein, and dietary fiber-rich new foodstuff from brewer's spent grain increased excretion of feces and jejunum mucosal protein content in rats. Biosci Biotech Biochem 1997;61:29-33.
62 . Lupton JR, Morin JL, Robinson MC. Barley bran flour accelerates gastrointestinal transit-time. J Am Diet Assoc 1993;93:881-5.
63 . Ibrügger S, Kristensen M, Mikkelsen MS, Astrup A. Flaxseed dietary fiber supplements for suppression of appetite and food intake. Appetite 2012;58:490-5.
64 . Kristensen M, Jensen MG. Dietary fibres in the regulation of appetite and food intake. Importance of viscosity. Appetite 2011;56:65-70.
65 . Galisteo M, Duarte J, Zarzuelo A. Effects of dietary fibers on disturbances clustered in the metabolic syndrome. J Nutr Biochem 2008;19:71-84.
66 . Gunness P, Gidley MJ. Mechanisms underlying the cholesterol-lowering properties of soluble dietary fibre polysaccharides. Food Func 2010;1:149-55.
References
38
67 . Wolever TMS, Tosh SM, Gibbs AL, Brand-Miller J, Duncan AM, Hart V, Lamarche B, Thomson BA, Duss R, Wood PJ. Physicochemical properties of oat beta-glucan influence its ability to reduce serum LDL cholesterol in humans: a randomized clinical trial. Am J Clin Nutr 2010;92:723-32.
68 . Cade JE, Burley VJ, Greenwood DC. Dietary fibre and risk of breast cancer in the UK Women's Cohort Study. Int J Epidemiol 2007;36:431-8.
69 . Kritchevsky D, Story JA. Binding of bile-salts in-vitro by nonnutritive fiber. J Nutr 1974;104:458-62.
70 . Ghotra BS, Vasanthan T, Wettasinghe M, Goel V, Temelli F, Basu T. A rapid method to determine quantitatively the in vitro adsorption of taurocholate to soluble fiber. Cereal Foods World 2006;51:118-21.
71 . Gunness P, Flanagan BM, Gidley MJ. Molecular interactions between cereal soluble dietary fibre polymers and a model bile salt deduced from 13C NMR titration. J Cereal Sci 2010;52:444-9.
72 . Dutta SK, Hlasko J. Dietary fiber in pancreatic disease - effect of high-fiber diet on fat malabsorption in pancreatic insufficiency and invitro study of the interaction of dietary fiber with pancreatic-enzymes. Am J Clin Nutr 1985;41:517-25.
73 . Gibson GR, Probert HM, Van Loo J, Rastall RA, Roberfroid MB. Dietary modulation of the human colonic microbiota: updating the concept of prebiotics. Nutr Res Rev 2004;17:259-75.
74 . Slavin J, Stewart M. Fiber and microbially generated active components. In: Milner J, Romagnolo D, ed. Bioactive compounds and cancer. New York, USA: Humana Press, Springer Science, 2010. p. 165-80.
75 . Takahashi T, Furuichi Y, Mizuno T, Kato M, Tabara A, Kawada Y, Hirano Y, Kubo K, Onozuka M, Kurita O. Water-holding capacity of insoluble fibre decreases free water and elevates digesta viscosity in the rat. J Sci Food Agric 2009;89:245-50.
76 . Behall KM, Scholfield DJ, Hallfrisch J. Effect of beta-glucan level in oat fiber extracts on blood lipids in men and women. J Am Coll Nutr 1997;16:46-51.
77 . Behall KM, Scholfield DJ, Hallfrisch J. Diets containing barley significantly reduce lipids in mildly hypercholesterolemic men and women. Am J Clin Nutr 2004;80:1185-93.
78 . Brown L, Rosner B, Willett WW, Sacks FM. Cholesterol-lowering effects of dietary fiber: a meta-analysis. Am J Clin Nutr 1999;69:30-42.
79 . Kay RM, Truswell AS. Effect of Citrus Pectin on Blood-Lipids and Fecal Steroid Excretion in Man. Am J Clin Nutr 1977;30:171-5.
References
39
80 . Goel V, Cheema SK, Agellon LB, Ooraikul B, McBurney MI, Basu TK. In vitro binding of bile salt to rhubarb stalk powder. Nutr Res 1998;18:893-903.
81 . Gallaher D, Schneeman BO. Intestinal interaction of bile-acids, phospholipids, dietary-fibers, and cholestyramine. Am J Physiol 1986;250:G420-G426.
82 . Kritchevsky D. In vitro binding of bile acids and other lipids by dietary fiber. Agro Food Industry Hi-Tech 1996;7:27-9.
83 . Coles GD, Eady SL, Coles TK, Boone DJJ, Furneaux RH. Beta-glucan binds bile salts. In: Wringley CW, ed. "Cereals 96": Proceedings of the 46th Australian cereal chemistry conference. Melbourne, Australia: RACI Cereal Chemistry Division, 1996. p. 180-3.
84 . Story JA, Kritchevsky D. Comparison of binding of various bile-acids and bile-salts invitro by several types of fiber. J Nutr 1976;106:1292-4.
85 . Kahlon TS, Berrios KJD, Smith GE, Pan JL. In vitro bile acid binding capacity of milled wheat bran and milled extruded wheat bran at five specific mechanical energy levels. Cereal Chem 2006;83:434-8.
86 . Bowles RK, Morgan KR, Furneaux RH, Coles GD. 13C CP/MAS NMR study of the interaction of bile acids with barley beta-D-glucan. Carbohydr Polym 1996;29:7-10.
87 . Behall KM, Scholfield DJ, Hallfrisch JG. Barley beta-glucan reduces plasma glucose and insulin responses compared with resistant starch in men. Nutr Res 2006;26:644-50.
88 . Yokoyama WH, Hudson CA, Knuckles BE, Chiu MCM, Sayre RN, Turnlund JR, Schneeman BO. Effect of barley beta-glucan in durum wheat pasta on human glycemic response. Cereal Chem 1997;74:293-6.
89 . Wursch P, Pi-Sunyer FX. The role of viscous soluble fiber in the metabolic control of diabetes. A review with special emphasis on cereals rich in beta-glucan. Diabetes Care 1997;20:1774-80.
90 . Wolever TMS. Relationship between dietary fiber content and composition in foods and the glycemic index. Am J Clin Nutr 1990;51:72-5.
91 . Mourot J, Thouvenot P, Couet C, Antoine JM, Krobicka A, Debry G. Relationship between the rate of gastric-emptying and glucose and insulin responses to starchy foods in young healthy-adults. Am J Clin Nutr 1988;48:1035-40.
92 . O'Dea K, Nestel PJ, Antonoff L. Physical factors influencing postprandial glucose and insulin responses to starch. Am J Clin Nutr 1980;33:760-5.
93 . Erkkila AT, Lichtenstein AH. Fiber and cardiovascular disease risk - How strong is the evidence? J Cardiovasc Nurs 2006;21:3-8.
References
40
94 . Juntunen KS, Laaksonen DE, Autio K, Niskanen LK, Holst JJ, Savolainen KE, Liukkonen KH, Poutanen KS, Mykkanen HM. Structural differences between rye and wheat breads but not total fiber content may explain the lower postprandial insulin response to rye bread. Am J Clin Nutr 2003;78:957-64.
95 . Venter CS, Vorster HH, Cummings JH. Effects of dietary propionate on carbohydrate and lipid-metabolism in healthy-volunteers. Am J Gastroenterol 1990;85:549-53.
96 . Wolever TMS, Brighenti F, Royall D, Jenkins AL, Jenkins DJA. Effect of rectal infusion of short chain fatty-acids in human-subjects. Am J Gastroenterol 1989;84:1027-33.
97 . Wolever TMS, Spadafora P, Eshuis H. Interaction between colonic acetate and propionate in humans. Am J Clin Nutr 1991;53:681-7.
98 . Akramiene D, Kondrotas A, Didziapetriene J, Kevelaitis E. Effects of beta-glucans on the immune system. Medicina 2007;43:597-606.
99 . Murphy EA, Davis JM, Carmichael MD. Immune modulating effects of beta-glucan. Curr Opin Clin Nutr Metab Care 2010;13:656-61.
100 . Rieder A, Samuelsen AB. Do cereal mixed-linked beta-glucans possess immune-modulating activities? Mol Nutr Food Res 2012;56:536-47.
101 . Wismar R, Brix S, Frokiaer H, Laerke HN. Dietary fibers as immunoregulatory compounds in health and disease. Ann NY Acad Sci 2010;1190:70-85.
102 . Brown GD, Gordon S. Immune recognition - A new receptor for beta-glucans. Nature 2001;413:36-7.
103 . Brown GD. Dectin-1: a signalling non-TLR pattern-recognition receptor. Nature Rev Immunol 2006;6:33-43.
104 . Sonck E, Stuyven E, Goddeeris B, Cox E. The effect of beta-glucans on porcine leukocytes. Vet Immunol Immunopathol 2010;135:199-207.
105 . Bohn JA, BeMiller JN. (1→3)-beta-D-glucans as biological response modifiers: A review of structure-functional activity relationships. Carbohydr Polym 1995;28:3-14.
106 . Wismar R, Brix S, Laerke HN, Frokiaer H. Comparative analysis of a large panel of non-starch polysaccharides reveals structures with selective regulatory properties in dendritic cells. Mol Nutr Food Res 2011;55:443-54.
107 . Yun CH, Estrada A, Van Kessel A, Park BC, Laarveld B. beta-glucan, extracted from oat, enhances disease resistance against bacterial and parasitic infections. FEMS Immunol Med Microbiol 2003;35:67-75.
References
41
108 . Samuelsen AB, Rieder A, Grimmer S, Michaelsen TE, Knutsen SH. Immunomodulatory activity of dietary fiber: arabinoxylan and mixed-linked beta-glucan isolated from barley show modest activities in vitro. Int J Mol Sci 2011;12:570-87.
109 . Czop JK, Austen KF. Properties of glycans that activate the human alternative complement pathway and interact with the human monocyte beta-glucan receptor. J Immunol 1985;135:3388-93.
110 . Tada R, Ikeda F, Aoki K, Yoshikawa M, Kato Y, Adachi Y, Tanioka A, Ishibashi K, Tsubaki K, Ohno N. Barley-derived beta-D-glucan induces immunostimulation via a dectin-1-mediated pathway. Immunol Lett 2009;123:144-8.
111 . Nieman DC, Henson DA, McMahon M, Wrieden JL, Davis JM, Murphy EA, Gross SJ, Mcanulty LS, Dumke CL. beta-glucan, immune function, and upper respiratory tract infections in athletes. Med Sci Sports Exerc 2008;40:1463-71.
112 . Theuwissen E, Plat J, Mensink RP. Consumption of oat beta-glucan with or without plant stanols did not influence inflammatory markers in hypercholesterolemic subjects. Mol Nutr Food Res 2009;53:370-6.
113 . Wood PJ, Weisz J, Blackwell BA. Molecular characterization of cereal beta-D-glucans - structural-analysis of oat beta-D-glucan and rapid structural evaluation of beta-D-glucans from different sources by high-performance liquid-chromatography of oligosaccharides released by lichenase. Cereal Chem 1991;68:31-9.
114 . Temelli F. Extraction and functional properties of barley beta-glucan as affected by temperature and pH. J Food Sci 1997;62:1194-201.
115 . Burkus Z, Temelli F. Effect of extraction conditions on yield, composition, and viscosity stability of barley beta-glucan gum. Cereal Chem 1998;75:805-9.
116 . Beer MU, Wood PJ, Weisz J. Molecular weight distribution and (1→3),(1→4)-beta-D-glucan content of consecutive extracts of various oat and barley cultivars. Cereal Chem 1997;74:476-80.
117 . Ahmad A, Anjum FM, Zahoor T, Nawaz H, Din A. Physicochemical and functional properties of barley beta-glucan as affected by different extraction procedures. Int J Food Sci Technol 2009;44:181-7.
118 . Ahmad A, Anjum FM, Zahoor T, Nawaz H, Dilshad SM. Beta glucan: a valuable functional ingredient in foods. Crit Rev Food Sci Nutr 2012;52:201-12.
119 . Izydorczyk MS, Dexter JE. Barley beta-glucans and arabinoxylans: Molecular structure, physicochemical properties, and uses in food products-a Review. Food Res Int 2008;41:850-68.
References
42
120 . Izydorczyk M, Biliaderis C, Lazaridou A. Cereal beta-glucans. In: Biliaderis C, Costas G, Izydorczyk M, Marta S, eds. Functional food carbohydrates. New York, USA: CRC Press, 2006. p. 1-72.
121 . Bilgi B, Celik S. Solubility and emulsifying properties of barley protein concentrate. Eur Food Res Technol 2004;218:437-41.
122 . Westerlund E, Andersson R, Aman P. Isolation and chemical characterization of water-soluble mixed-linked beta-glucans and arabinoxylans in oat milling fractions. Carbohydr Polym 1993;20:115-23.
123 . Kvist S, Lawther JM; Patent Num: WO2005048735-A1. Soluble dietary fibre from oat and barley grains, method for producing a fraction rich in beta-glucan and use of the fraction in foods, pharmaceuticals and cosmetics. 2005.
124 . Savorani F, Rasmussen MA, Mikkelsen MS, Engelsen SB. The NMR nutri-metabolomics platform: facts, opportunities and challenges. Food Res Int 2012 (Submitted).
125 . van Ommen B, Keijer J, Heil SG, Kaput J. Challenging homeostasis to define biomarkers for nutrition related health. Mol Nutr Food Res 2009;53:795-804.
126 . Kristensen M, Jensen MG, Aarestrup J, Petersen KEN, Sondergaard L, Mikkelsen MS, Astrup A. Flaxseed dietary fibers lower cholesterol and increase fecal fat excretion, but magnitude of effect depend on food type. Nutr Metab 2012;9.
127 . Fiehn O. Metabolomics - the link between genotypes and phenotypes. Plant Mol Biol 2002;48:155-71.
128 . Giovane A, Balestrieri A, Napoli C. New insights into cardiovascular and lipid metabolomics. J Cell Biochem 2008;105:648-54.
129 . Holmes E, Loo RL, Stamler J, Bictash M, Yap IKS, Chan Q, Ebbels T, De Iorio M, Brown IJ, Veselkov KA, Daviglus ML, Kesteloot H, et al. Human metabolic phenotype diversity and its association with diet and blood pressure. Nature 2008;453:396-U50.
130 . Oresic M. Metabolomics, a novel tool for studies of nutrition, metabolism and lipid dysfunction. Nutr Metab Cardiovas Diseases 2009;19:816-24.
131 . Dunn WB, Ellis DI. Metabolomics: Current analytical platforms and methodologies. Trac-Trends Anal Chem 2005;24:285-94.
132 . Bertram HC, Malmendal A, Petersen BO, Madsen JC, Pedersen H, Nielsen NC, Hoppe C, Molgaard C, Michaelsen KF, Duus JO. Effect of magnetic field strength on NMR-Based metabonomic human urine data comparative study of 250, 400, 500, and 800 MHz. Anal Chem 2007;79:7110-5.
References
43
133 . Beckonert O, Keun HC, Ebbels TMD, Bundy J, Holmes E, Lindon JC, Nicholson JK. Metabolic profiling, metabolomic and metabonomic procedures for NMR spectroscopy of urine, plasma, serum and tissue extracts. Nature Prot 2007;2:2692-703.
134 . Scalbert A, Brennan L, Fiehn O, Hankemeier T, Kristal BS, van Ommen B, Pujos-Guillot E, Verheij E, Wishart D, Wopereis S. Mass-spectrometry-based metabolomics: limitations and recommendations for future progress with particular focus on nutrition research. Metabolomics 2009;5:435-58.
135 . Maher AD, Zirah SFM, Holmes E, Nicholson JK. Experimental and analytical variation in human urine in 1H NMR spectroscopy-based metabolic phenotyping studies. Anal Chem 2007;79:5204-11.
136 . Savorani F, Kristensen M, Larsen FH, Astrup A, Engelsen SB. High throughput prediction of chylomicron triglycerides in human plasma by nuclear magnetic resonance and chemometrics. Nutr Metab 2010;7.
137 . Wold S, Esbensen K, Geladi P. Principal component analysis. Chemo Intel Lab Sys 1987;2:37-52.
138 . van den Berg RA, Hoefsloot HCJ, Westerhuis JA, Smilde AK, van der Werf MJ. Centering, scaling, and transformations: improving the biological information content of metabolomics data. Bmc Genomics 2006;7.
139 . Wold S, Sjostrom M, Eriksson L. PLS-regression: a basic tool of chemometrics. Chemo Intel Lab Sys 2001;58:109-30.
140 . Nørgaard L, Saudland A, Wagner J, Nielsen JP, Munck L, Engelsen SB. Interval partial least-squares regression (iPLS): A comparative chemometric study with an example from near-infrared spectroscopy. Ap Spec 2000;54:413-9.
141 . Ståhle L, Wold S. Partial least squares analysis with cross-validation for the two-class problem: A monte Carlo study. J Chemo 1987;1:185-96.
142 . Wood PJ. Oat and rye beta-glucan: Properties and function. Cereal Chem 2010;87:315-30.
143 . Statistikbanken. http://www.statistikbanken.dk. September 30. 2012.
144 . Ulmius M, Önning G, Nilsson L. Solution behavior of barley beta-glucan as studied with asymmetrical flow field-flow fractionation. Food Hydrocoll 2012;26:175-80.
145 . Håkansson A, Ulmius M, Nilsson L. Asymmetrical flow field-flow fractionation enables the characterization of molecular and supramolecular properties of cereal beta-glucan dispersions. Carbohydr Polym 2012;87:518-23.
146 . Ellegard L, Andersson H. Oat bran rapidly increases bile acid excretion and bile acid synthesis: an ileostomy study. Eur J Clin Nutr 2007;61:938-45.
References
44
147 . Lia A, Andersson H, Mekki N, Juhel C, Senft M, Lairon D. Postprandial lipemia in relation to sterol and fat excretion in ileostomy subjects given oat-bran and wheat test meals. Am J Clin Nutr 1997;66:357-65.
148 . Othman RA, Moghadasian MH, Jones PJ. Cholesterol-lowering effects of oat beta-glucan. Nutr Rev 2011;69:299-309.
Paper I
Mikkelsen MS, Jespersen BM, Møller BL, Lærke HN, Larsen FH, Engelsen SB
Comparative spectroscopic and rheological studies on crude and
purified soluble barley and oat β-glucan preparations
Food Research International, 43: 2417-2424, 2010
Comparative spectroscopic and rheological studies on crude and purified solublebarley and oat β-glucan preparations
Mette S. Mikkelsen a,⁎, Birthe M. Jespersen a, Birger L. Møller b, Helle N. Lærke c,Flemming H. Larsen a, Søren B. Engelsen a
a Quality & Technology, Department of Food Science, Faculty of Life Sciences, University of Copenhagen, Rolighedsvej 30, 1958 Frederiksberg C, Denmarkb Plant Biochemistry Laboratory and Laboratory for Molecular Plant Biology, Centre for Molecular Plant Physiology, Department of Plant Biology and Biotechnology, Faculty of Life Sciences,University of Copenhagen, Thorvaldsensvej 40, 1871 Frederiksberg, Denmarkc Molecular Nutrition and Cell Biology, Department of Animal Health and Bioscience, Aarhus University, Blichers Allé 20, 8830 Tjele, Denmark
a b s t r a c ta r t i c l e i n f o
Article history:Received 31 May 2010Accepted 16 September 2010
Keywords:Beta-glucanRamanIRNMRMolar massRheology
The rheology of crude and purified barley (BBG) and oat (OBG) β-glucan samples were characterized. Samplecontent andmajor impuritieswas characterized by Fourier-transformnear infrared Raman and infrared (FT-IR)spectroscopy revealing substantial differences between the β-glucan samples. The purification procedureincreased theβ-glucan content from66.7 to 82.4% and from30.1 to 68.4% for BBG andOBG, respectively. Protonnuclearmagnetic resonance (1HNMR) analysiswas applied to estimate theβ-(1→3) toβ-(1→4) linkage ratioof the β-glucans. The molar mass of BBG and OBG was determined by high performance size-exclusionchromatography (HPSEC) using β-glucan standards and was found to be 126 and 355 kDa, respectively.The viscosity of crude andpurifiedβ-glucanswas studied at various concentrations (2.5, 5%w/v), temperatures(10–80 °C) and shear rates (1–100 s−1). BBG was characterized as a low-viscosity β-glucan with Newtonianflow behavior while OBGwas characterized as a high-viscosity β-glucan with shear thinning flow behavior. Atequivalent β-glucan concentration in solutions the viscosity for OBGwas found to be ~100 fold higher than forBBG. A direct viscosity dependence on exact β-glucan content regardless of amount and composition of α-glucan impuritieswas found for bothOBG and BBG. This study suggests that the structural characteristics of theβ-glucan polymers such asmolarmass are of greater functional importance than the presence of lager amountsof starch/α-dextrins as long as the β-glucan samples are compared at equivalent β-glucan doses.
© 2010 Elsevier Ltd. All rights reserved.
1. Introduction
Health benefits and hydrocolloid functionality of mixed linkage(1→3, 1→4)-β-D-glucans from cereals make them interesting foodconstituents and they have been suggested as ingredients in health-promoting functional foods (Brennan & Cleary, 2005; Ebringerova,Hromadkova, & Heinze, 2005; Inglett, Carriere, Maneepun, & Tungtrakul,2004; Lazaridou & Biliaderis, 2007; Lee,Warner, & Inglett, 2005; Temelli,Bansema, & Stobbe, 2004; Volikakis, Biliaderis, Vamvakas, & Zerfiridis,2004). However, β-glucan sample composition and β-glucan structureare crucial characteristics affecting the functionality in food systems andhuman health. In complex food systems β-glucan functionality may beaffected by interactions or incompatibilities between β-glucan and otherfood components (Lee, Schwarz, & D'Appolonia, 1995; Satrapai &Suphantharika, 2007) and detailed knowledge about structure/functionrelationships of β-glucan containing systems is required in order toexploit the full health beneficial properties of this important dietaryfiber.
Traditionally plant cell wall structure has been analyzed usingchemical agents that gently extract andpurify specific components. Thecell walls are typically analyzed for sugars and sugar linkages usingchemical (methylation analysis) and physical techniques (1H and 13CNMR). Additional information on the repetitive units in the polymerscan be gained from the use of glycanases that cleave specific glycosidicbonds and subsequent analysis of the oligosaccharides by chromato-graphic and/or mass analysis (Guillon, Saulnier, Robert, Thibault, &Champ, 2007). Cereal β-glucan polymers generally contain ~70%(1→4)-β-glucosyl residues and ~30% (1→3)-β-glucosyl residues.The (1→3)-linkages occur singly, linking together three (cellotriosylunit) or four (cellotetraosyl unit) (1→4)-β-linked sequences and to alesser extend longer cellulose-like fragments (Ebringerova et al., 2005).Structurally related β-glucans differ in the ratio of tri- and tetraosylunits which is 2.8–3.3 for β-glucan of barley and 2.1–2.4 for oat(Lazaridou, Biliaderis, Micha-Screttas, & Steele, 2004; Wood, Weisz, &Blackwell, 1994).
Nuclear magnetic resonance (NMR) spectroscopy has been widelyused for the overall structure and linkage sequence analysis of cerealβ-glucans (Cui, Wood, Blackwell, & Nikiforuk, 2000; Johansson,Tuomainen, Ylinen, Ekholm, & Virkki, 2004; Lazaridou et al., 2004;
Food Research International 43 (2010) 2417–2424
⁎ Corresponding author. Tel.: +45 35 33 35 07; fax: +45 35 33 32 45.E-mail address: [email protected] (M.S. Mikkelsen).
0963-9969/$ – see front matter © 2010 Elsevier Ltd. All rights reserved.doi:10.1016/j.foodres.2010.09.016
Contents lists available at ScienceDirect
Food Research International
j ourna l homepage: www.e lsev ie r.com/ locate / foodres

Morgan, Roberts, Tendler, Davies, & Williams, 1999; Petersen, Krah,Duus, & Thomsen, 2000; Roubroeks, Mastromauro, Andersson,Christensen, & Aman, 2000; Seefeldt, Larsen, Viereck, Wollenweber,& Engelsen, 2008; Wood et al., 1994). Liquid state 1H NMR allowsestimation of the ratio ofβ-(1→3) toβ-(1→4) linkages in theβ-glucanpolymers as well as the residual constituents present in the β-glucanextract. Fourier-transform infrared (FT-IR) spectroscopy has also beensuccessfully used for the analysis of plant cell wall polysaccharidesincludingβ-glucans (Johansson et al., 2004;Kacurakova&Wilson, 2001;Seefeldt, Blennow, Jespersen, Wollenweber, & Engelsen, 2009). Ramanspectroscopy has a great potential in analyzing plant cell wallpolysaccharides (Engelsen & Norgaard, 1996; Goral & Zichy, 1990;Mohacek-Grosev, Bozac, & Puppels, 2001; Salomonsen, Jensen, Sten-baek, & Engelsen, 2008; Sene, Mccann, Wilson, & Grinter, 1994) but tothe best of our knowledge, structural and compositional cerealβ-glucananalysis by Raman spectroscopy has not been reported before. Both IRand Raman spectroscopic methods are rapid, sensitive and able todistinguish the α- and β-conformations of saccharides (Cael, Koenig, &Blackwel, 1974; Engelsen & Norgaard, 1996; Kacurakova, Capek,Sasinkova, Wellner, & Ebringerova, 2000). In contrast to chemical,chromatographic, or mass spectrometric methods, spectroscopic meth-ods require no chemical extraction as the intact sample matrix isexamined which is an advantage when analyzing delicate and complexbiological samples (Seefeldt et al., 2008; Seefeldt et al., 2009).
The molar mass of a β-glucan polysaccharide is an importantcharacteristic as it determines the physicochemical properties such asviscosity (Ebringerova et al., 2005). Molar mass values for oat andbarley β-glucans have been reported to range between 44–3000 and126–2500 kDa, respectively (Beer, Wood, &Weisz, 1997; Ebringerovaet al., 2005; Lazaridou et al., 2004; Papageorgiou, Lakhdara, Lazaridou,Biliaderis, & Izydorczyk, 2005; Vaikousi, Biliaderis, & Izydorczyk,2004; Wood, Weisz, & Mahn, 1991). The values strongly depend onthe method of extraction and analysis which makes comparisonsdifficult. Increasing the extraction temperature leads to an increase inmolar mass of the extracted β-glucan (Izydorczyk, Macri, & Mac-Gregor, 1998; Zhang, Doehlert, & Moore, 1998; Temelli, 1997). Zhanget al. (1998) extracted oat β-glucan at 40, 65 and 100 °C and reportedmolarmass values of 118–1024 kDa at 40 °C, 985–1919 kDa at 65 °C and2300 kDa at 100 °C. Size-exclusion chromatography (SEC) is often usedinβ-glucan size determination (Johansson et al., 2004;Morgan&Ofman,1998). SEC require calibration standards for the estimation of the molarmasses unless it use a molar mass sensitive detection system such asLALLS, MALLS or RALLS (Christensen et al., 2001). Various studies havediscussed the use of β-glucan, pullulan or dextran standards asreferences in molar mass determination of β-glucans (Beer et al.,1997; Christensen et al., 2001;Roubroeks et al., 2000;Varum,Martinsen,& Smidsrod, 1991; Zhang et al., 1998). It is well-known that calibrationwith pullulan standards leads to overestimation of the molar mass,however, pullulan standards offer a greater range of molar massescompared to β-glucan standards, especially for large molecules(Christensen et al., 2001; Varum et al., 1991).
Rheological methods such as viscometry have been widely used instudies of β-glucan flow behavior (Burkus & Temelli, 2005; Dawkins &Nnanna, 1995; Doublier & Wood, 1995; Lazaridou, Biliaderis, &Izydorczyk, 2003). Increasing the concentration or themolarmass of aβ-glucan polymer generally results in increased viscosity (Anttila,Sontag-Strohm, & Salovaara, 2004; Wood, 2004). Often, β-glucanfrom oat exhibits somewhat higher viscosity compared to barley β-glucan due to longer polymer chains (Beer et al., 1997). Johansson,Karesoja, Ekholma, Virkki, and Tenhu (2008) compared viscosities ofequal size oat and barley β-glucans and the higher viscosity of the oatβ-glucan was suggested to stem from differences in the fine structurei.e. the ratio of tri- and tetraosyl units. Shear thinning flow behavior ofβ-glucan solutions is an established fact (Burkus & Temelli, 2005). Inaddition, low-viscosity β-glucan extracts and high-viscosity β-glucanextracts at low concentrations often show Newtonian flow behavior
(Autio, Myllymaki, & Malkki, 1987; Burkus & Temelli, 2005; Doublier& Wood, 1995). Since starch is one of the major components of foods,understanding the mechanism of interaction of β-glucan with nativestarch and its hydrolytic products and its implication for rheologicalproperties is of interest (Faraj, Vasanthan, & Hoover, 2006; Grimm,Krüger, & Burchard, 1995; Lee et al., 1995; Satrapai & Suphantharika,2007). Grimm et al. (1995) studied the aggregation of β-glucanmolecules in aqueous maltose solutions and found a minimum ofaggregation near 5% maltose. This was attributed to a preferentialbinding of maltose to β-glucan, which partly breaks up the aggregatedβ-glucan clusters. Faraj et al. (2006) investigated the influence ofhydrolysed starch fractions (low, medium and high molar mass) onthe solution viscosities of low and high purity barley β-glucans. Noneof the hydrolysates affected the high purity β-glucan viscositywhereas the viscosity of the low purity β-glucan increased in thepresence of themediummolar mass starch fractions. It was concludedthat some non-β-glucan components in the low purity β-glucan mayinfluence the solution viscosity of β-glucan-hydrolysed starch blends.
The aim of the present study was to conduct comparativespectroscopic, chromatographic and rheological studies on β-glucanconcentrate samples. Special interest in these samples was thedetection and characterization of α-glucans and to study the effectof α-glucans on the viscous properties of the sample solutions. Two ofthe β-glucan samples were recently investigated in a dialysis studytargeted at studying the β-glucan affinity with small molecules(Simonsen et al., 2009).
2. Materials and methods
The crude materials were soluble barley β-glucan (BBG) Gluca-gel™ (GraceLinc Ltd., Christchurch, New Zealand), with molar mass120–180 kDa and purity ~75% according to the supplier, and solubleoat β-glucan (OBG) Promoat™ (Biovelop, Kimstad, Sweden), withmolar mass N1000 kDa and purity ~35% according to the supplier.Purification of the crude samples was performed as follows: the β-glucan powders were dissolved in distilled water (5%, w/v) at 90–95 °C, pH 6.2 and starch was hydrolyzed using Termamyl 120 Lthermostable α-amylase (0.1%, v/v) (Novo Nordisk A/S, Bagsværd,Denmark) and continuous stirring for 45 min. Alpha amylase activitywas stopped by autoclaving solution (120 °C) for 10 min. Thepolysaccharides were precipitated using 80% ethanol at 4 °C for24 h. The precipitate was washed in diethyl ether and the resulting β-glucan gumwas air dried and grinded into particle sizes b500 μm. Theyield from the purification procedure was 86.4% for BBG and 39.2% forOBG. Pure (N97%) high-viscosity barley (BBGMz) and high-viscosityoat (OBGMz) β-glucans from Megazyme International Ltd. (Bray,Ireland) were used as references in the spectroscopic analyses alongwith wheat starch from Sigma-Aldrich (Brøndby, Denmark).
2.1. Chemical analyses
The crude and purified β-glucan samples were characterized fortheir β-glucan, starch and protein contents. Each samplewas analyzedin duplicates. Standard reference samples were included in allchemical analysis and the methods proved to be accurate. Total β-glucan content was determined by the method of McCleary andMugford (1997) using the Megazyme (Megazyme International Ltd.,Bray, Ireland) mixed linkage β-glucan assay kit with a sample amountof 10 mg instead of 80–120 mg and 3 h of lichenase hydrolysis insteadof 1 h. The extended hydrolysis timewas suggested by Johansson et al.(2006) for concentrated β-glucan samples and the smaller sampleamount was based on an internally pre-study. Total starch wasdetermined according to the Megazyme procedure provided withtheir test kit (AACC, 2000). Protein was analyzed using the KjeldahlMethod (AACC, 2000).
2418 M.S. Mikkelsen et al. / Food Research International 43 (2010) 2417–2424
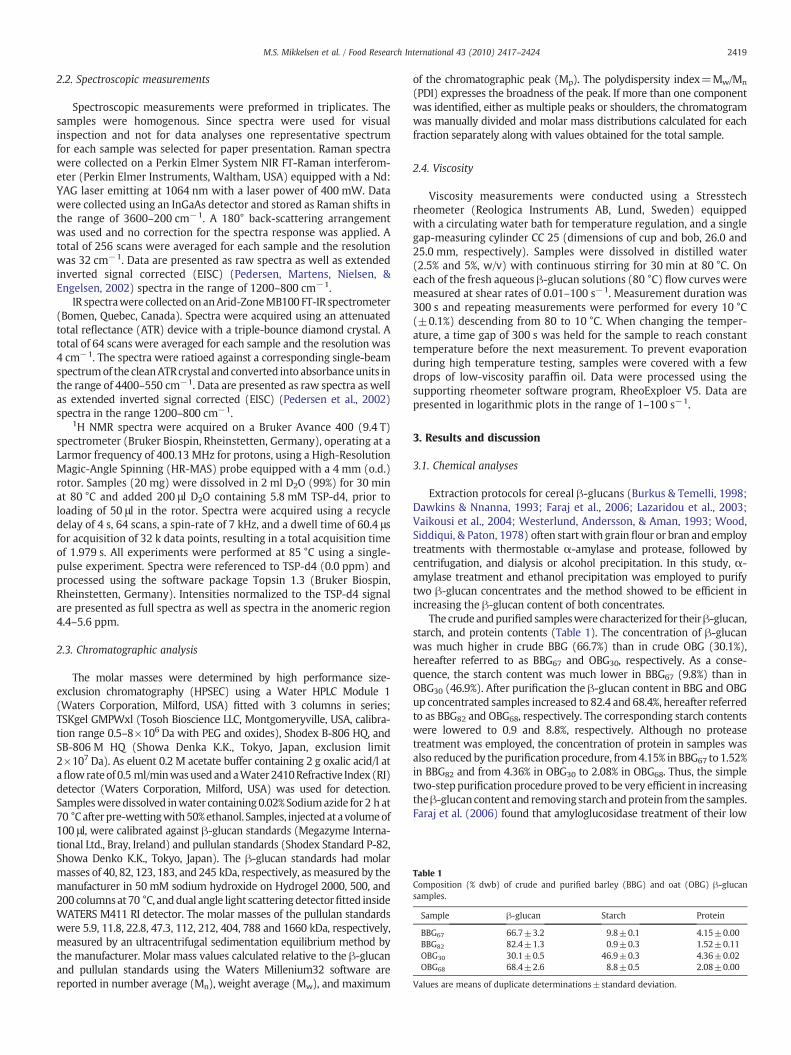
2.2. Spectroscopic measurements
Spectroscopic measurements were preformed in triplicates. Thesamples were homogenous. Since spectra were used for visualinspection and not for data analyses one representative spectrumfor each sample was selected for paper presentation. Raman spectrawere collected on a Perkin Elmer System NIR FT-Raman interferom-eter (Perkin Elmer Instruments, Waltham, USA) equipped with a Nd:YAG laser emitting at 1064 nm with a laser power of 400 mW. Datawere collected using an InGaAs detector and stored as Raman shifts inthe range of 3600–200 cm−1. A 180° back-scattering arrangementwas used and no correction for the spectra response was applied. Atotal of 256 scans were averaged for each sample and the resolutionwas 32 cm−1. Data are presented as raw spectra as well as extendedinverted signal corrected (EISC) (Pedersen, Martens, Nielsen, &Engelsen, 2002) spectra in the range of 1200–800 cm−1.
IR spectrawere collectedon anArid-ZoneMB100 FT-IR spectrometer(Bomen, Quebec, Canada). Spectra were acquired using an attenuatedtotal reflectance (ATR) device with a triple-bounce diamond crystal. Atotal of 64 scans were averaged for each sample and the resolution was4 cm−1. The spectra were ratioed against a corresponding single-beamspectrumof the cleanATRcrystal and converted into absorbanceunits inthe range of 4400–550 cm−1. Data are presented as raw spectra as wellas extended inverted signal corrected (EISC) (Pedersen et al., 2002)spectra in the range 1200–800 cm−1.
1H NMR spectra were acquired on a Bruker Avance 400 (9.4 T)spectrometer (Bruker Biospin, Rheinstetten, Germany), operating at aLarmor frequency of 400.13 MHz for protons, using a High-ResolutionMagic-Angle Spinning (HR-MAS) probe equipped with a 4 mm (o.d.)rotor. Samples (20 mg) were dissolved in 2 ml D2O (99%) for 30 minat 80 °C and added 200 μl D2O containing 5.8 mM TSP-d4, prior toloading of 50 μl in the rotor. Spectra were acquired using a recycledelay of 4 s, 64 scans, a spin-rate of 7 kHz, and a dwell time of 60.4 μsfor acquisition of 32 k data points, resulting in a total acquisition timeof 1.979 s. All experiments were performed at 85 °C using a single-pulse experiment. Spectra were referenced to TSP-d4 (0.0 ppm) andprocessed using the software package Topsin 1.3 (Bruker Biospin,Rheinstetten, Germany). Intensities normalized to the TSP-d4 signalare presented as full spectra as well as spectra in the anomeric region4.4–5.6 ppm.
2.3. Chromatographic analysis
The molar masses were determined by high performance size-exclusion chromatography (HPSEC) using a Water HPLC Module 1(Waters Corporation, Milford, USA) fitted with 3 columns in series;TSKgel GMPWxl (Tosoh Bioscience LLC, Montgomeryville, USA, calibra-tion range 0.5–8×10⁶ Da with PEG and oxides), Shodex B-806 HQ, andSB-806 M HQ (Showa Denka K.K., Tokyo, Japan, exclusion limit2×107 Da). As eluent 0.2 M acetate buffer containing 2 g oxalic acid/l ataflowrateof 0.5 ml/minwasusedandaWater2410Refractive Index (RI)detector (Waters Corporation, Milford, USA) was used for detection.Samplesweredissolved inwater containing0.02%Sodiumazide for 2 hat70 °Cafterpre-wettingwith50%ethanol. Samples, injectedat avolumeof100 μl, were calibrated against β-glucan standards (Megazyme Interna-tional Ltd., Bray, Ireland) and pullulan standards (Shodex Standard P-82,Showa Denko K.K., Tokyo, Japan). The β-glucan standards had molarmasses of 40, 82, 123, 183, and 245 kDa, respectively, asmeasured by themanufacturer in 50 mM sodium hydroxide on Hydrogel 2000, 500, and200 columnsat 70 °C, anddual angle light scatteringdetectorfitted insideWATERS M411 RI detector. The molar masses of the pullulan standardswere 5.9, 11.8, 22.8, 47.3, 112, 212, 404, 788 and 1660 kDa, respectively,measured by an ultracentrifugal sedimentation equilibrium method bythe manufacturer. Molar mass values calculated relative to the β-glucanand pullulan standards using the Waters Millenium32 software arereported in number average (Mn), weight average (Mw), and maximum
of the chromatographic peak (Mp). The polydispersity index=Mw/Mn
(PDI) expresses the broadness of the peak. If more than one componentwas identified, either as multiple peaks or shoulders, the chromatogramwas manually divided and molar mass distributions calculated for eachfraction separately along with values obtained for the total sample.
2.4. Viscosity
Viscosity measurements were conducted using a Stresstechrheometer (Reologica Instruments AB, Lund, Sweden) equippedwith a circulating water bath for temperature regulation, and a singlegap-measuring cylinder CC 25 (dimensions of cup and bob, 26.0 and25.0 mm, respectively). Samples were dissolved in distilled water(2.5% and 5%, w/v) with continuous stirring for 30 min at 80 °C. Oneach of the fresh aqueous β-glucan solutions (80 °C) flow curves weremeasured at shear rates of 0.01–100 s−1. Measurement duration was300 s and repeating measurements were performed for every 10 °C(±0.1%) descending from 80 to 10 °C. When changing the temper-ature, a time gap of 300 s was held for the sample to reach constanttemperature before the next measurement. To prevent evaporationduring high temperature testing, samples were covered with a fewdrops of low-viscosity paraffin oil. Data were processed using thesupporting rheometer software program, RheoExploer V5. Data arepresented in logarithmic plots in the range of 1–100 s−1.
3. Results and discussion
3.1. Chemical analyses
Extraction protocols for cereal β-glucans (Burkus & Temelli, 1998;Dawkins & Nnanna, 1993; Faraj et al., 2006; Lazaridou et al., 2003;Vaikousi et al., 2004; Westerlund, Andersson, & Aman, 1993; Wood,Siddiqui, & Paton, 1978) often startwith grain flour or bran and employtreatments with thermostable α-amylase and protease, followed bycentrifugation, and dialysis or alcohol precipitation. In this study, α-amylase treatment and ethanol precipitation was employed to purifytwo β-glucan concentrates and the method showed to be efficient inincreasing the β-glucan content of both concentrates.
The crudeandpurified sampleswere characterized for theirβ-glucan,starch, and protein contents (Table 1). The concentration of β-glucanwas much higher in crude BBG (66.7%) than in crude OBG (30.1%),hereafter referred to as BBG67 and OBG30, respectively. As a conse-quence, the starch content was much lower in BBG67 (9.8%) than inOBG30 (46.9%). After purification the β-glucan content in BBG and OBGup concentrated samples increased to 82.4 and 68.4%, hereafter referredto as BBG82 and OBG68, respectively. The corresponding starch contentswere lowered to 0.9 and 8.8%, respectively. Although no proteasetreatment was employed, the concentration of protein in samples wasalso reduced by the purification procedure, from4.15% in BBG67 to 1.52%in BBG82 and from 4.36% in OBG30 to 2.08% in OBG68. Thus, the simpletwo-steppurification procedure proved to be very efficient in increasingtheβ-glucancontent and removingstarchandprotein fromthesamples.Faraj et al. (2006) found that amyloglucosidase treatment of their low
Table 1Composition (% dwb) of crude and purified barley (BBG) and oat (OBG) β-glucansamples.
Sample β-glucan Starch Protein
BBG67 66.7±3.2 9.8±0.1 4.15±0.00BBG82 82.4±1.3 0.9±0.3 1.52±0.11OBG30 30.1±0.5 46.9±0.3 4.36±0.02OBG68 68.4±2.6 8.8±0.5 2.08±0.00
Values are means of duplicate determinations±standard deviation.
2419M.S. Mikkelsen et al. / Food Research International 43 (2010) 2417–2424
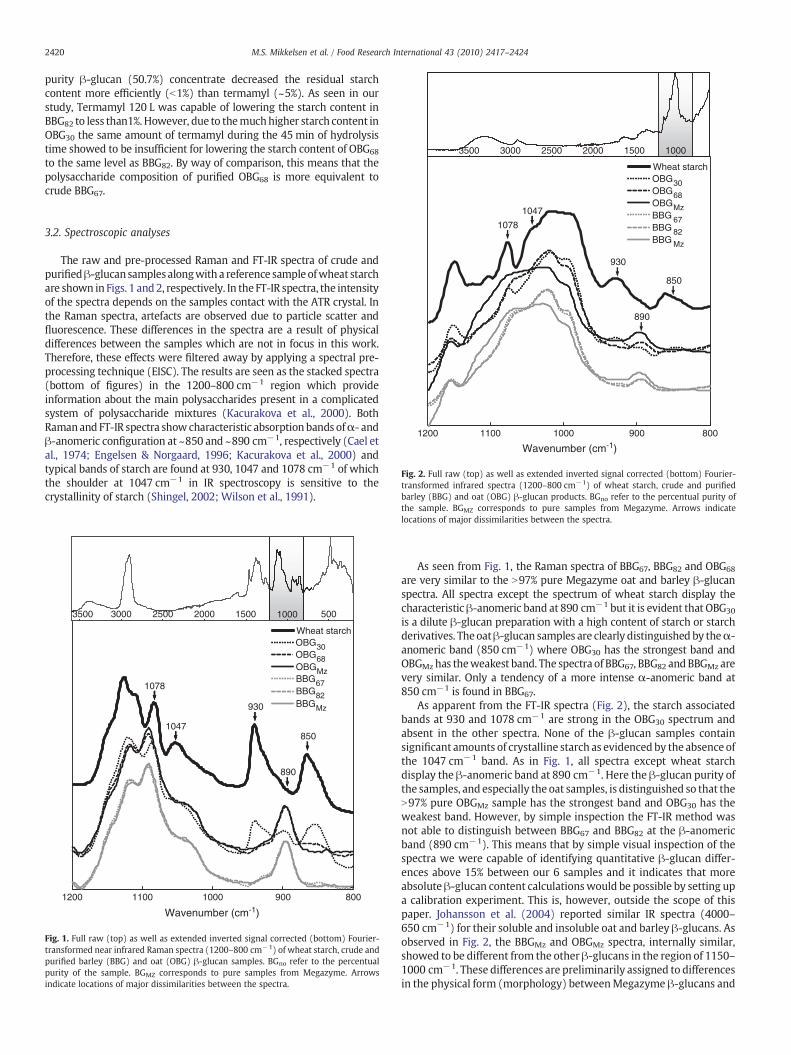
purity β-glucan (50.7%) concentrate decreased the residual starchcontent more efficiently (b1%) than termamyl (~5%). As seen in ourstudy, Termamyl 120 L was capable of lowering the starch content inBBG82 to less than1%.However, due to themuchhigher starch content inOBG30 the same amount of termamyl during the 45 min of hydrolysistime showed to be insufficient for lowering the starch content of OBG68
to the same level as BBG82. By way of comparison, this means that thepolysaccharide composition of purified OBG68 is more equivalent tocrude BBG67.
3.2. Spectroscopic analyses
The raw and pre-processed Raman and FT-IR spectra of crude andpurifiedβ-glucansamplesalongwith a reference sampleofwheat starchare shown in Figs. 1 and2, respectively. In the FT-IR spectra, the intensityof the spectra depends on the samples contact with the ATR crystal. Inthe Raman spectra, artefacts are observed due to particle scatter andfluorescence. These differences in the spectra are a result of physicaldifferences between the samples which are not in focus in this work.Therefore, these effects were filtered away by applying a spectral pre-processing technique (EISC). The results are seen as the stacked spectra(bottom of figures) in the 1200–800 cm−1 region which provideinformation about the main polysaccharides present in a complicatedsystem of polysaccharide mixtures (Kacurakova et al., 2000). BothRamanand FT-IR spectra showcharacteristic absorptionbands ofα- andβ-anomeric configuration at ~850 and ~890 cm−1, respectively (Cael etal., 1974; Engelsen & Norgaard, 1996; Kacurakova et al., 2000) andtypical bands of starch are found at 930, 1047 and 1078 cm−1 of whichthe shoulder at 1047 cm−1 in IR spectroscopy is sensitive to thecrystallinity of starch (Shingel, 2002; Wilson et al., 1991).
As seen from Fig. 1, the Raman spectra of BBG67, BBG82 and OBG68
are very similar to the N97% pure Megazyme oat and barley β-glucanspectra. All spectra except the spectrum of wheat starch display thecharacteristic β-anomeric band at 890 cm−1 but it is evident that OBG30
is a dilute β-glucan preparation with a high content of starch or starchderivatives. Theoatβ-glucan samples are clearly distinguished by theα-anomeric band (850 cm−1) where OBG30 has the strongest band andOBGMzhas theweakest band. The spectra of BBG67, BBG82 andBBGMz arevery similar. Only a tendency of a more intense α-anomeric band at850 cm−1 is found in BBG67.
As apparent from the FT-IR spectra (Fig. 2), the starch associatedbands at 930 and 1078 cm−1 are strong in the OBG30 spectrum andabsent in the other spectra. None of the β-glucan samples containsignificant amounts of crystalline starch as evidenced by the absence ofthe 1047 cm−1 band. As in Fig. 1, all spectra except wheat starchdisplay the β-anomeric band at 890 cm−1. Here the β-glucan purity ofthe samples, and especially the oat samples, is distinguished so that theN97% pure OBGMz sample has the strongest band and OBG30 has theweakest band. However, by simple inspection the FT-IR method wasnot able to distinguish between BBG67 and BBG82 at the β-anomericband (890 cm−1). This means that by simple visual inspection of thespectra we were capable of identifying quantitative β-glucan differ-ences above 15% between our 6 samples and it indicates that moreabsoluteβ-glucan content calculationswould be possible by setting upa calibration experiment. This is, however, outside the scope of thispaper. Johansson et al. (2004) reported similar IR spectra (4000–650 cm−1) for their soluble and insoluble oat and barley β-glucans. Asobserved in Fig. 2, the BBGMz and OBGMz spectra, internally similar,showed to be different from the other β-glucans in the region of 1150–1000 cm−1. These differences are preliminarily assigned to differencesin the physical form (morphology) betweenMegazyme β-glucans and
500100015002000250030003500
Wheat starch
BBG67BBG82BBGMz
OBGMz
OBG30OBG68
930
850
890
800900100011001200
Wavenumber (cm-1)
1078
1047
Fig. 1. Full raw (top) as well as extended inverted signal corrected (bottom) Fourier-transformed near infrared Raman spectra (1200–800 cm−1) of wheat starch, crude andpurified barley (BBG) and oat (OBG) β-glucan samples. BGno refer to the percentualpurity of the sample. BGMZ corresponds to pure samples from Megazyme. Arrowsindicate locations of major dissimilarities between the spectra.
100015002000250030003500
930
850
890
800900100011001200
Wavenumber (cm-1)
1078
1047
Wheat starch
BBG 67BBG 82BBG Mz
OBGMz
OBG30OBG68
Fig. 2. Full raw (top) as well as extended inverted signal corrected (bottom) Fourier-transformed infrared spectra (1200–800 cm−1) of wheat starch, crude and purifiedbarley (BBG) and oat (OBG) β-glucan products. BGno refer to the percentual purity ofthe sample. BGMZ corresponds to pure samples from Megazyme. Arrows indicatelocations of major dissimilarities between the spectra.
2420 M.S. Mikkelsen et al. / Food Research International 43 (2010) 2417–2424
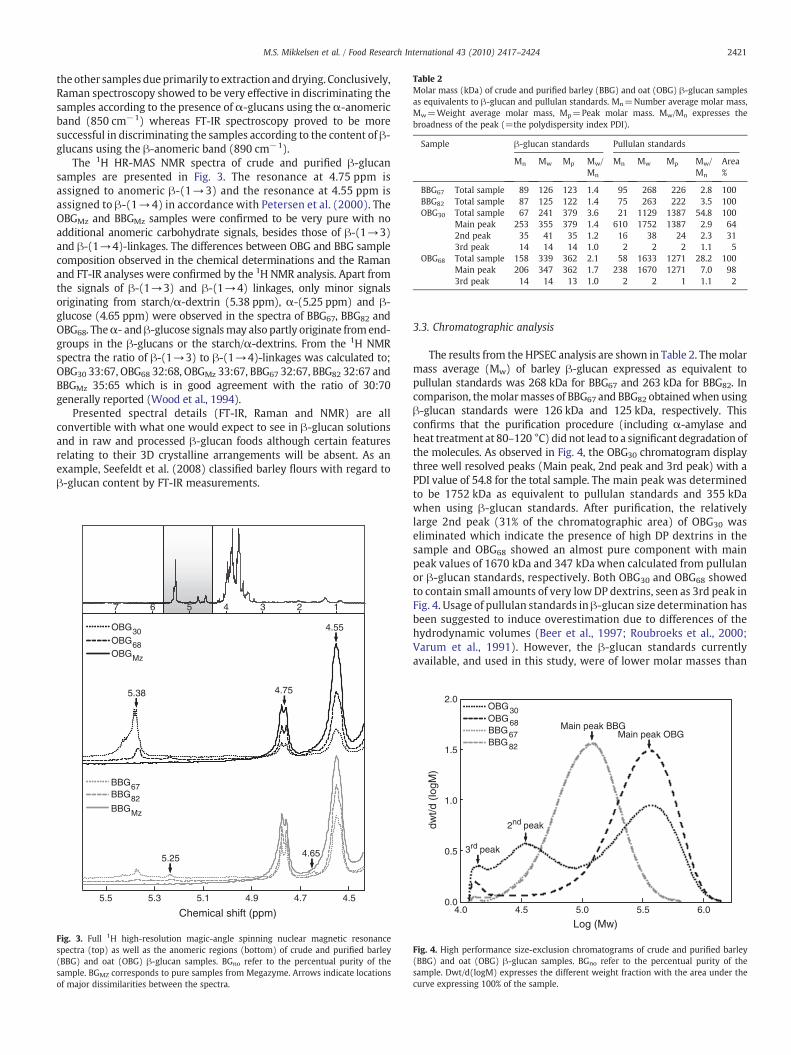
the other samples due primarily to extraction anddrying. Conclusively,Raman spectroscopy showed to be very effective in discriminating thesamples according to the presence of α-glucans using the α-anomericband (850 cm−1) whereas FT-IR spectroscopy proved to be moresuccessful in discriminating the samples according to the content of β-glucans using the β-anomeric band (890 cm−1).
The 1H HR-MAS NMR spectra of crude and purified β-glucansamples are presented in Fig. 3. The resonance at 4.75 ppm isassigned to anomeric β-(1→3) and the resonance at 4.55 ppm isassigned to β-(1→4) in accordance with Petersen et al. (2000). TheOBGMz and BBGMz samples were confirmed to be very pure with noadditional anomeric carbohydrate signals, besides those of β-(1→3)and β-(1→4)-linkages. The differences between OBG and BBG samplecomposition observed in the chemical determinations and the Ramanand FT-IR analyses were confirmed by the 1H NMR analysis. Apart fromthe signals of β-(1→3) and β-(1→4) linkages, only minor signalsoriginating from starch/α-dextrin (5.38 ppm), α-(5.25 ppm) and β-glucose (4.65 ppm) were observed in the spectra of BBG67, BBG82 andOBG68. Theα- andβ-glucose signalsmay also partly originate fromend-groups in the β-glucans or the starch/α-dextrins. From the 1H NMRspectra the ratio of β-(1→3) to β-(1→4)-linkages was calculated to;OBG30 33:67, OBG68 32:68, OBGMz 33:67, BBG67 32:67, BBG82 32:67 andBBGMz 35:65 which is in good agreement with the ratio of 30:70generally reported (Wood et al., 1994).
Presented spectral details (FT-IR, Raman and NMR) are allconvertible with what one would expect to see in β-glucan solutionsand in raw and processed β-glucan foods although certain featuresrelating to their 3D crystalline arrangements will be absent. As anexample, Seefeldt et al. (2008) classified barley flours with regard toβ-glucan content by FT-IR measurements.
3.3. Chromatographic analysis
The results from the HPSEC analysis are shown in Table 2. Themolarmass average (Mw) of barley β-glucan expressed as equivalent topullulan standards was 268 kDa for BBG67 and 263 kDa for BBG82. Incomparison, themolarmasses of BBG67 and BBG82 obtainedwhen usingβ-glucan standards were 126 kDa and 125 kDa, respectively. Thisconfirms that the purification procedure (including α-amylase andheat treatment at 80–120 °C) did not lead to a significant degradation ofthe molecules. As observed in Fig. 4, the OBG30 chromatogram displaythree well resolved peaks (Main peak, 2nd peak and 3rd peak) with aPDI value of 54.8 for the total sample. The main peak was determinedto be 1752 kDa as equivalent to pullulan standards and 355 kDawhen using β-glucan standards. After purification, the relativelylarge 2nd peak (31% of the chromatographic area) of OBG30 waseliminated which indicate the presence of high DP dextrins in thesample and OBG68 showed an almost pure component with mainpeak values of 1670 kDa and 347 kDa when calculated from pullulanor β-glucan standards, respectively. Both OBG30 and OBG68 showedto contain small amounts of very lowDP dextrins, seen as 3rd peak inFig. 4. Usage of pullulan standards inβ-glucan size determination hasbeen suggested to induce overestimation due to differences of thehydrodynamic volumes (Beer et al., 1997; Roubroeks et al., 2000;Varum et al., 1991). However, the β-glucan standards currentlyavailable, and used in this study, were of lower molar masses than
5
4.54.74.95.15.35.5
Chemical shift (ppm)
BBG67BBG82BBGMz
OBGMz
OBG30OBG68
5.25 4.65
5.38 4.75
4.55
123467
Fig. 3. Full 1H high-resolution magic-angle spinning nuclear magnetic resonancespectra (top) as well as the anomeric regions (bottom) of crude and purified barley(BBG) and oat (OBG) β-glucan samples. BGno refer to the percentual purity of thesample. BGMZ corresponds to pure samples from Megazyme. Arrows indicate locationsof major dissimilarities between the spectra.
Table 2Molar mass (kDa) of crude and purified barley (BBG) and oat (OBG) β-glucan samplesas equivalents to β-glucan and pullulan standards. Mn=Number average molar mass,Mw=Weight average molar mass, Mp=Peak molar mass. Mw/Mn expresses thebroadness of the peak (=the polydispersity index PDI).
Sample β-glucan standards Pullulan standards
Mn Mw Mp Mw/Mn
Mn Mw Mp Mw/Mn
Area%
BBG67 Total sample 89 126 123 1.4 95 268 226 2.8 100BBG82 Total sample 87 125 122 1.4 75 263 222 3.5 100OBG30 Total sample 67 241 379 3.6 21 1129 1387 54.8 100
Main peak 253 355 379 1.4 610 1752 1387 2.9 642nd peak 35 41 35 1.2 16 38 24 2.3 313rd peak 14 14 14 1.0 2 2 2 1.1 5
OBG68 Total sample 158 339 362 2.1 58 1633 1271 28.2 100Main peak 206 347 362 1.7 238 1670 1271 7.0 983rd peak 14 14 13 1.0 2 2 1 1.1 2
BBG67BBG82
OBG30OBG68
0.0
0.5
1.0
1.5
2.0
4.0 4.5 5.0 5.5 6.0
Log (Mw)
dwt/d
(lo
gM)
Main peak BBG Main peak OBG
2nd peak
3rd peak
Fig. 4. High performance size-exclusion chromatograms of crude and purified barley(BBG) and oat (OBG) β-glucan samples. BGno refer to the percentual purity of thesample. Dwt/d(logM) expresses the different weight fraction with the area under thecurve expressing 100% of the sample.
2421M.S. Mikkelsen et al. / Food Research International 43 (2010) 2417–2424
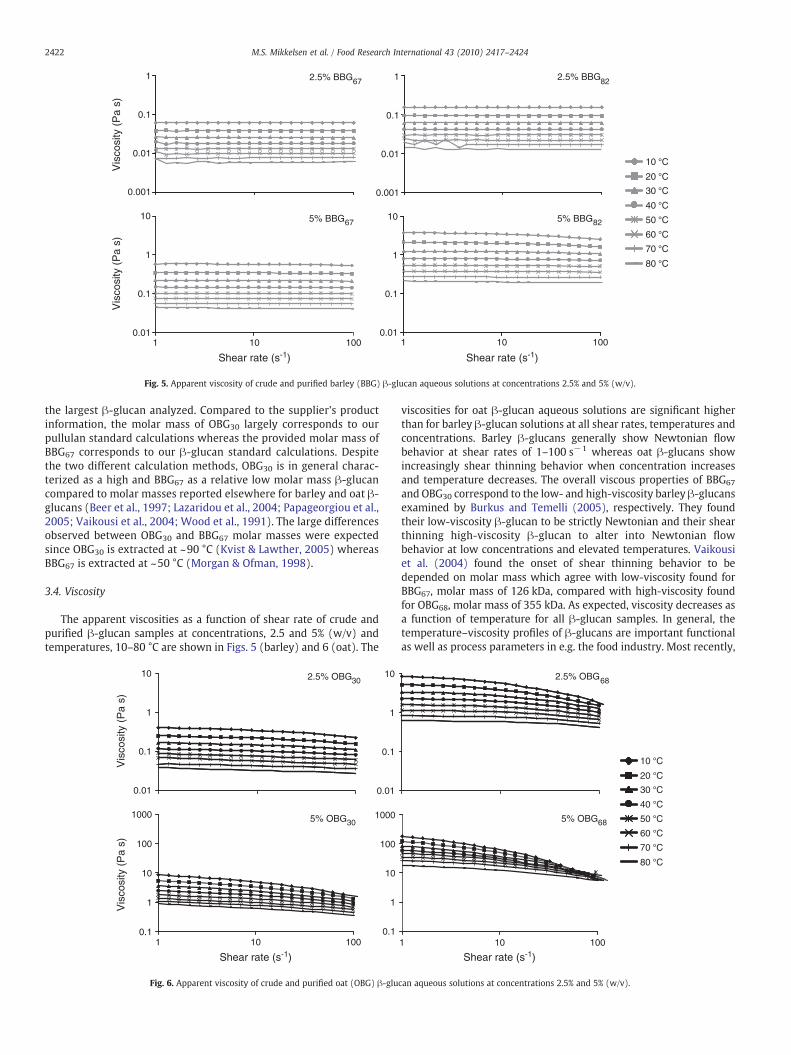
the largest β-glucan analyzed. Compared to the supplier's productinformation, the molar mass of OBG30 largely corresponds to ourpullulan standard calculations whereas the provided molar mass ofBBG67 corresponds to our β-glucan standard calculations. Despitethe two different calculation methods, OBG30 is in general charac-terized as a high and BBG67 as a relative low molar mass β-glucancompared to molar masses reported elsewhere for barley and oat β-glucans (Beer et al., 1997; Lazaridou et al., 2004; Papageorgiou et al.,2005; Vaikousi et al., 2004; Wood et al., 1991). The large differencesobserved between OBG30 and BBG67 molar masses were expectedsince OBG30 is extracted at ~90 °C (Kvist & Lawther, 2005) whereasBBG67 is extracted at ~50 °C (Morgan & Ofman, 1998).
3.4. Viscosity
The apparent viscosities as a function of shear rate of crude andpurified β-glucan samples at concentrations, 2.5 and 5% (w/v) andtemperatures, 10–80 °C are shown in Figs. 5 (barley) and 6 (oat). The
viscosities for oat β-glucan aqueous solutions are significant higherthan for barley β-glucan solutions at all shear rates, temperatures andconcentrations. Barley β-glucans generally show Newtonian flowbehavior at shear rates of 1–100 s−1 whereas oat β-glucans showincreasingly shear thinning behavior when concentration increasesand temperature decreases. The overall viscous properties of BBG67
and OBG30 correspond to the low- and high-viscosity barley β-glucansexamined by Burkus and Temelli (2005), respectively. They foundtheir low-viscosity β-glucan to be strictly Newtonian and their shearthinning high-viscosity β-glucan to alter into Newtonian flowbehavior at low concentrations and elevated temperatures. Vaikousiet al. (2004) found the onset of shear thinning behavior to bedepended on molar mass which agree with low-viscosity found forBBG67, molar mass of 126 kDa, compared with high-viscosity foundfor OBG68, molar mass of 355 kDa. As expected, viscosity decreases asa function of temperature for all β-glucan samples. In general, thetemperature–viscosity profiles of β-glucans are important functionalas well as process parameters in e.g. the food industry. Most recently,
Vis
cosi
ty (
Pa
s)
0.001
1
0.1
0.01
2.5% BBG67
Vis
cosi
ty (
Pa
s)
0.001
1
0.1
0.01
2.5% BBG82
10
1
0.1
0.011 10 100
5% BBG8210
1
0.1
0.011 10 100
Shear rate (s-1) Shear rate (s-1)
5% BBG67
10 °C
20 °C
30 °C
40 °C
50 °C
60 °C
70 °C
80 °C
Fig. 5. Apparent viscosity of crude and purified barley (BBG) β-glucan aqueous solutions at concentrations 2.5% and 5% (w/v).
10 °C
20 °C
30 °C
40 °C
50 °C
60 °C
70 °C
80 °C
Vis
cosi
ty (
Pa
s)
2.5% OBG30
Vis
cosi
ty (
Pa
s)
Shear rate (s-1) Shear rate (s-1)
2.5% OBG6810
1
0.1
0.01
10
1
0.1
0.01
5% OBG68
1 10 100
1000
10
1
0.1
100
5% OBG30
1 10 100
1000
10
1
0.1
100
Fig. 6. Apparent viscosity of crude and purified oat (OBG) β-glucan aqueous solutions at concentrations 2.5% and 5% (w/v).
2422 M.S. Mikkelsen et al. / Food Research International 43 (2010) 2417–2424
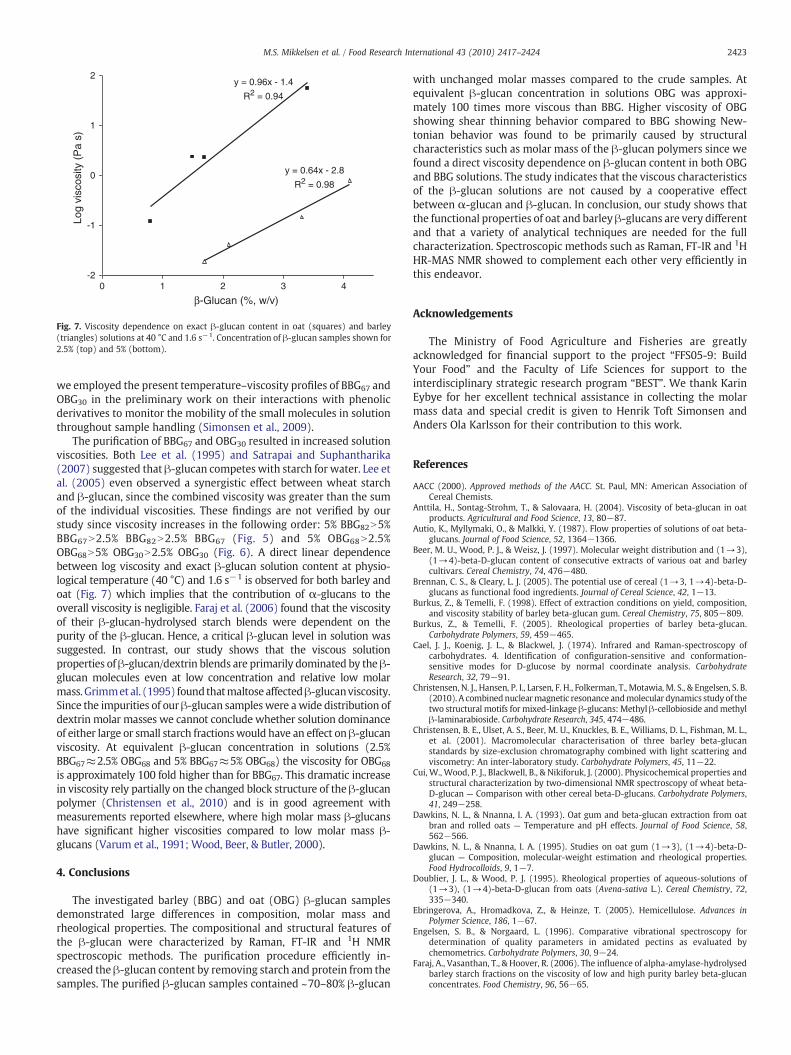
we employed the present temperature–viscosity profiles of BBG67 andOBG30 in the preliminary work on their interactions with phenolicderivatives to monitor the mobility of the small molecules in solutionthroughout sample handling (Simonsen et al., 2009).
The purification of BBG67 and OBG30 resulted in increased solutionviscosities. Both Lee et al. (1995) and Satrapai and Suphantharika(2007) suggested that β-glucan competes with starch for water. Lee etal. (2005) even observed a synergistic effect between wheat starchand β-glucan, since the combined viscosity was greater than the sumof the individual viscosities. These findings are not verified by ourstudy since viscosity increases in the following order: 5% BBG82N5%BBG67N2.5% BBG82N2.5% BBG67 (Fig. 5) and 5% OBG68N2.5%OBG68N5% OBG30N2.5% OBG30 (Fig. 6). A direct linear dependencebetween log viscosity and exact β-glucan solution content at physio-logical temperature (40 °C) and 1.6 s−1 is observed for both barley andoat (Fig. 7) which implies that the contribution of α-glucans to theoverall viscosity is negligible. Faraj et al. (2006) found that the viscosityof their β-glucan-hydrolysed starch blends were dependent on thepurity of the β-glucan. Hence, a critical β-glucan level in solution wassuggested. In contrast, our study shows that the viscous solutionproperties ofβ-glucan/dextrin blends are primarily dominated by theβ-glucan molecules even at low concentration and relative low molarmass.Grimmet al. (1995) foundthatmaltose affectedβ-glucanviscosity.Since the impurities of ourβ-glucan sampleswere awide distribution ofdextrin molar masses we cannot conclude whether solution dominanceof either large or small starch fractionswould have an effect on β-glucanviscosity. At equivalent β-glucan concentration in solutions (2.5%BBG67≈2.5% OBG68 and 5% BBG67≈5% OBG68) the viscosity for OBG68
is approximately 100 fold higher than for BBG67. This dramatic increasein viscosity rely partially on the changed block structure of the β-glucanpolymer (Christensen et al., 2010) and is in good agreement withmeasurements reported elsewhere, where high molar mass β-glucanshave significant higher viscosities compared to low molar mass β-glucans (Varum et al., 1991; Wood, Beer, & Butler, 2000).
4. Conclusions
The investigated barley (BBG) and oat (OBG) β-glucan samplesdemonstrated large differences in composition, molar mass andrheological properties. The compositional and structural features ofthe β-glucan were characterized by Raman, FT-IR and 1H NMRspectroscopic methods. The purification procedure efficiently in-creased the β-glucan content by removing starch and protein from thesamples. The purified β-glucan samples contained ~70–80% β-glucan
with unchanged molar masses compared to the crude samples. Atequivalent β-glucan concentration in solutions OBG was approxi-mately 100 times more viscous than BBG. Higher viscosity of OBGshowing shear thinning behavior compared to BBG showing New-tonian behavior was found to be primarily caused by structuralcharacteristics such as molar mass of the β-glucan polymers since wefound a direct viscosity dependence on β-glucan content in both OBGand BBG solutions. The study indicates that the viscous characteristicsof the β-glucan solutions are not caused by a cooperative effectbetween α-glucan and β-glucan. In conclusion, our study shows thatthe functional properties of oat and barley β-glucans are very differentand that a variety of analytical techniques are needed for the fullcharacterization. Spectroscopic methods such as Raman, FT-IR and 1HHR-MAS NMR showed to complement each other very efficiently inthis endeavor.
Acknowledgements
The Ministry of Food Agriculture and Fisheries are greatlyacknowledged for financial support to the project “FFS05-9: BuildYour Food” and the Faculty of Life Sciences for support to theinterdisciplinary strategic research program “BEST”. We thank KarinEybye for her excellent technical assistance in collecting the molarmass data and special credit is given to Henrik Toft Simonsen andAnders Ola Karlsson for their contribution to this work.
References
AACC (2000). Approved methods of the AACC. St. Paul, MN: American Association ofCereal Chemists.
Anttila, H., Sontag-Strohm, T., & Salovaara, H. (2004). Viscosity of beta-glucan in oatproducts. Agricultural and Food Science, 13, 80−87.
Autio, K., Myllymaki, O., & Malkki, Y. (1987). Flow properties of solutions of oat beta-glucans. Journal of Food Science, 52, 1364−1366.
Beer, M. U., Wood, P. J., & Weisz, J. (1997). Molecular weight distribution and (1→3),(1→4)-beta-D-glucan content of consecutive extracts of various oat and barleycultivars. Cereal Chemistry, 74, 476−480.
Brennan, C. S., & Cleary, L. J. (2005). The potential use of cereal (1→3, 1→4)-beta-D-glucans as functional food ingredients. Journal of Cereal Science, 42, 1−13.
Burkus, Z., & Temelli, F. (1998). Effect of extraction conditions on yield, composition,and viscosity stability of barley beta-glucan gum. Cereal Chemistry, 75, 805−809.
Burkus, Z., & Temelli, F. (2005). Rheological properties of barley beta-glucan.Carbohydrate Polymers, 59, 459−465.
Cael, J. J., Koenig, J. L., & Blackwel, J. (1974). Infrared and Raman-spectroscopy ofcarbohydrates. 4. Identification of configuration-sensitive and conformation-sensitive modes for D-glucose by normal coordinate analysis. CarbohydrateResearch, 32, 79−91.
Christensen, N. J., Hansen, P. I., Larsen, F. H., Folkerman, T., Motawia, M. S., & Engelsen, S. B.(2010). A combinednuclearmagnetic resonance andmolecular dynamics study of thetwo structural motifs for mixed-linkage β-glucans: Methyl β-cellobioside andmethylβ-laminarabioside. Carbohydrate Research, 345, 474−486.
Christensen, B. E., Ulset, A. S., Beer, M. U., Knuckles, B. E., Williams, D. L., Fishman, M. L.,et al. (2001). Macromolecular characterisation of three barley beta-glucanstandards by size-exclusion chromatography combined with light scattering andviscometry: An inter-laboratory study. Carbohydrate Polymers, 45, 11−22.
Cui, W., Wood, P. J., Blackwell, B., & Nikiforuk, J. (2000). Physicochemical properties andstructural characterization by two-dimensional NMR spectroscopy of wheat beta-D-glucan — Comparison with other cereal beta-D-glucans. Carbohydrate Polymers,41, 249−258.
Dawkins, N. L., & Nnanna, I. A. (1993). Oat gum and beta-glucan extraction from oatbran and rolled oats — Temperature and pH effects. Journal of Food Science, 58,562−566.
Dawkins, N. L., & Nnanna, I. A. (1995). Studies on oat gum (1→3), (1→4)-beta-D-glucan — Composition, molecular-weight estimation and rheological properties.Food Hydrocolloids, 9, 1−7.
Doublier, J. L., & Wood, P. J. (1995). Rheological properties of aqueous-solutions of(1→3), (1→4)-beta-D-glucan from oats (Avena-sativa L.). Cereal Chemistry, 72,335−340.
Ebringerova, A., Hromadkova, Z., & Heinze, T. (2005). Hemicellulose. Advances inPolymer Science, 186, 1−67.
Engelsen, S. B., & Norgaard, L. (1996). Comparative vibrational spectroscopy fordetermination of quality parameters in amidated pectins as evaluated bychemometrics. Carbohydrate Polymers, 30, 9−24.
Faraj, A., Vasanthan, T., & Hoover, R. (2006). The influence of alpha-amylase-hydrolysedbarley starch fractions on the viscosity of low and high purity barley beta-glucanconcentrates. Food Chemistry, 96, 56−65.
y = 0.96x - 1.4
R2 = 0.94
y = 0.64x - 2.8
R2 = 0.98
-2
-1
0
1
2
0 1 2 3 4
β-Glucan (%, w/v)
Log
visc
osity
(P
a s)
Fig. 7. Viscosity dependence on exact β-glucan content in oat (squares) and barley(triangles) solutions at 40 °C and 1.6 s−1. Concentration of β-glucan samples shown for2.5% (top) and 5% (bottom).
2423M.S. Mikkelsen et al. / Food Research International 43 (2010) 2417–2424
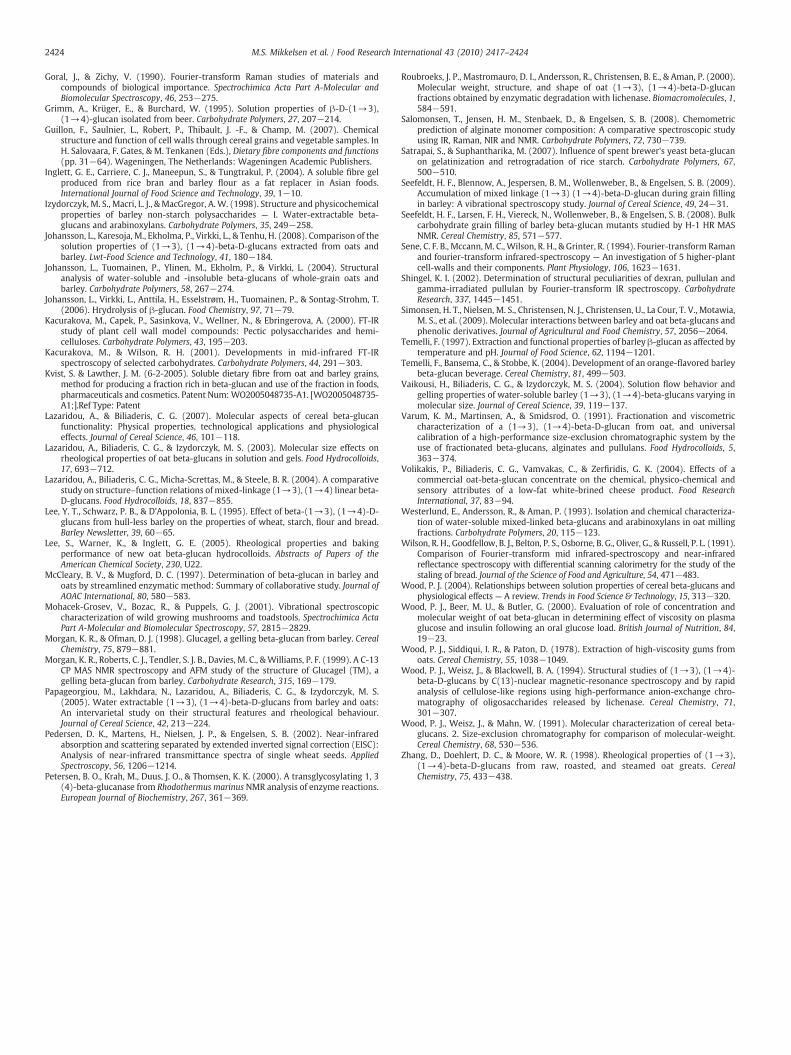
Goral, J., & Zichy, V. (1990). Fourier-transform Raman studies of materials andcompounds of biological importance. Spectrochimica Acta Part A-Molecular andBiomolecular Spectroscopy, 46, 253−275.
Grimm, A., Krüger, E., & Burchard, W. (1995). Solution properties of β-D-(1→3),(1→4)-glucan isolated from beer. Carbohydrate Polymers, 27, 207−214.
Guillon, F., Saulnier, L., Robert, P., Thibault, J. -F., & Champ, M. (2007). Chemicalstructure and function of cell walls through cereal grains and vegetable samples. InH. Salovaara, F. Gates, & M. Tenkanen (Eds.), Dietary fibre components and functions(pp. 31−64). Wageningen, The Netherlands: Wageningen Academic Publishers.
Inglett, G. E., Carriere, C. J., Maneepun, S., & Tungtrakul, P. (2004). A soluble fibre gelproduced from rice bran and barley flour as a fat replacer in Asian foods.International Journal of Food Science and Technology, 39, 1−10.
Izydorczyk, M. S., Macri, L. J., &MacGregor, A.W. (1998). Structure and physicochemicalproperties of barley non-starch polysaccharides — I. Water-extractable beta-glucans and arabinoxylans. Carbohydrate Polymers, 35, 249−258.
Johansson, L., Karesoja, M., Ekholma, P., Virkki, L., & Tenhu, H. (2008). Comparison of thesolution properties of (1→3), (1→4)-beta-D-glucans extracted from oats andbarley. Lwt-Food Science and Technology, 41, 180−184.
Johansson, L., Tuomainen, P., Ylinen, M., Ekholm, P., & Virkki, L. (2004). Structuralanalysis of water-soluble and -insoluble beta-glucans of whole-grain oats andbarley. Carbohydrate Polymers, 58, 267−274.
Johansson, L., Virkki, L., Anttila, H., Esselstrøm, H., Tuomainen, P., & Sontag-Strohm, T.(2006). Hrydrolysis of β-glucan. Food Chemistry, 97, 71−79.
Kacurakova, M., Capek, P., Sasinkova, V., Wellner, N., & Ebringerova, A. (2000). FT-IRstudy of plant cell wall model compounds: Pectic polysaccharides and hemi-celluloses. Carbohydrate Polymers, 43, 195−203.
Kacurakova, M., & Wilson, R. H. (2001). Developments in mid-infrared FT-IRspectroscopy of selected carbohydrates. Carbohydrate Polymers, 44, 291−303.
Kvist, S. & Lawther, J. M. (6-2-2005). Soluble dietary fibre from oat and barley grains,method for producing a fraction rich in beta-glucan and use of the fraction in foods,pharmaceuticals and cosmetics. Patent Num:WO2005048735-A1. [WO2005048735-A1;].Ref Type: Patent
Lazaridou, A., & Biliaderis, C. G. (2007). Molecular aspects of cereal beta-glucanfunctionality: Physical properties, technological applications and physiologicaleffects. Journal of Cereal Science, 46, 101−118.
Lazaridou, A., Biliaderis, C. G., & Izydorczyk, M. S. (2003). Molecular size effects onrheological properties of oat beta-glucans in solution and gels. Food Hydrocolloids,17, 693−712.
Lazaridou, A., Biliaderis, C. G., Micha-Screttas, M., & Steele, B. R. (2004). A comparativestudy on structure–function relations of mixed-linkage (1→3), (1→4) linear beta-D-glucans. Food Hydrocolloids, 18, 837−855.
Lee, Y. T., Schwarz, P. B., & D'Appolonia, B. L. (1995). Effect of beta-(1→3), (1→4)-D-glucans from hull-less barley on the properties of wheat, starch, flour and bread.Barley Newsletter, 39, 60−65.
Lee, S., Warner, K., & Inglett, G. E. (2005). Rheological properties and bakingperformance of new oat beta-glucan hydrocolloids. Abstracts of Papers of theAmerican Chemical Society, 230, U22.
McCleary, B. V., & Mugford, D. C. (1997). Determination of beta-glucan in barley andoats by streamlined enzymatic method: Summary of collaborative study. Journal ofAOAC International, 80, 580−583.
Mohacek-Grosev, V., Bozac, R., & Puppels, G. J. (2001). Vibrational spectroscopiccharacterization of wild growing mushrooms and toadstools. Spectrochimica ActaPart A-Molecular and Biomolecular Spectroscopy, 57, 2815−2829.
Morgan, K. R., & Ofman, D. J. (1998). Glucagel, a gelling beta-glucan from barley. CerealChemistry, 75, 879−881.
Morgan, K. R., Roberts, C. J., Tendler, S. J. B., Davies, M. C., &Williams, P. F. (1999). A C-13CP MAS NMR spectroscopy and AFM study of the structure of Glucagel (TM), agelling beta-glucan from barley. Carbohydrate Research, 315, 169−179.
Papageorgiou, M., Lakhdara, N., Lazaridou, A., Biliaderis, C. G., & Izydorczyk, M. S.(2005). Water extractable (1→3), (1→4)-beta-D-glucans from barley and oats:An intervarietal study on their structural features and rheological behaviour.Journal of Cereal Science, 42, 213−224.
Pedersen, D. K., Martens, H., Nielsen, J. P., & Engelsen, S. B. (2002). Near-infraredabsorption and scattering separated by extended inverted signal correction (EISC):Analysis of near-infrared transmittance spectra of single wheat seeds. AppliedSpectroscopy, 56, 1206−1214.
Petersen, B. O., Krah, M., Duus, J. O., & Thomsen, K. K. (2000). A transglycosylating 1, 3(4)-beta-glucanase from Rhodothermus marinus NMR analysis of enzyme reactions.European Journal of Biochemistry, 267, 361−369.
Roubroeks, J. P., Mastromauro, D. I., Andersson, R., Christensen, B. E., & Aman, P. (2000).Molecular weight, structure, and shape of oat (1→3), (1→4)-beta-D-glucanfractions obtained by enzymatic degradation with lichenase. Biomacromolecules, 1,584−591.
Salomonsen, T., Jensen, H. M., Stenbaek, D., & Engelsen, S. B. (2008). Chemometricprediction of alginate monomer composition: A comparative spectroscopic studyusing IR, Raman, NIR and NMR. Carbohydrate Polymers, 72, 730−739.
Satrapai, S., & Suphantharika, M. (2007). Influence of spent brewer's yeast beta-glucanon gelatinization and retrogradation of rice starch. Carbohydrate Polymers, 67,500−510.
Seefeldt, H. F., Blennow, A., Jespersen, B. M., Wollenweber, B., & Engelsen, S. B. (2009).Accumulation of mixed linkage (1→3) (1→4)-beta-D-glucan during grain fillingin barley: A vibrational spectroscopy study. Journal of Cereal Science, 49, 24−31.
Seefeldt, H. F., Larsen, F. H., Viereck, N., Wollenweber, B., & Engelsen, S. B. (2008). Bulkcarbohydrate grain filling of barley beta-glucan mutants studied by H-1 HR MASNMR. Cereal Chemistry, 85, 571−577.
Sene, C. F. B., Mccann, M. C., Wilson, R. H., & Grinter, R. (1994). Fourier-transform Ramanand fourier-transform infrared-spectroscopy — An investigation of 5 higher-plantcell-walls and their components. Plant Physiology, 106, 1623−1631.
Shingel, K. I. (2002). Determination of structural peculiarities of dexran, pullulan andgamma-irradiated pullulan by Fourier-transform IR spectroscopy. CarbohydrateResearch, 337, 1445−1451.
Simonsen, H. T., Nielsen, M. S., Christensen, N. J., Christensen, U., La Cour, T. V., Motawia,M. S., et al. (2009). Molecular interactions between barley and oat beta-glucans andphenolic derivatives. Journal of Agricultural and Food Chemistry, 57, 2056−2064.
Temelli, F. (1997). Extraction and functional properties of barley β-glucan as affected bytemperature and pH. Journal of Food Science, 62, 1194−1201.
Temelli, F., Bansema, C., & Stobbe, K. (2004). Development of an orange-flavored barleybeta-glucan beverage. Cereal Chemistry, 81, 499−503.
Vaikousi, H., Biliaderis, C. G., & Izydorczyk, M. S. (2004). Solution flow behavior andgelling properties of water-soluble barley (1→3), (1→4)-beta-glucans varying inmolecular size. Journal of Cereal Science, 39, 119−137.
Varum, K. M., Martinsen, A., & Smidsrod, O. (1991). Fractionation and viscometriccharacterization of a (1→3), (1→4)-beta-D-glucan from oat, and universalcalibration of a high-performance size-exclusion chromatographic system by theuse of fractionated beta-glucans, alginates and pullulans. Food Hydrocolloids, 5,363−374.
Volikakis, P., Biliaderis, C. G., Vamvakas, C., & Zerfiridis, G. K. (2004). Effects of acommercial oat-beta-glucan concentrate on the chemical, physico-chemical andsensory attributes of a low-fat white-brined cheese product. Food ResearchInternational, 37, 83−94.
Westerlund, E., Andersson, R., & Aman, P. (1993). Isolation and chemical characteriza-tion of water-soluble mixed-linked beta-glucans and arabinoxylans in oat millingfractions. Carbohydrate Polymers, 20, 115−123.
Wilson, R. H., Goodfellow, B. J., Belton, P. S., Osborne, B. G., Oliver, G., & Russell, P. L. (1991).Comparison of Fourier-transform mid infrared-spectroscopy and near-infraredreflectance spectroscopy with differential scanning calorimetry for the study of thestaling of bread. Journal of the Science of Food and Agriculture, 54, 471−483.
Wood, P. J. (2004). Relationships between solution properties of cereal beta-glucans andphysiological effects — A review. Trends in Food Science & Technology, 15, 313−320.
Wood, P. J., Beer, M. U., & Butler, G. (2000). Evaluation of role of concentration andmolecular weight of oat beta-glucan in determining effect of viscosity on plasmaglucose and insulin following an oral glucose load. British Journal of Nutrition, 84,19−23.
Wood, P. J., Siddiqui, I. R., & Paton, D. (1978). Extraction of high-viscosity gums fromoats. Cereal Chemistry, 55, 1038−1049.
Wood, P. J., Weisz, J., & Blackwell, B. A. (1994). Structural studies of (1→3), (1→4)-beta-D-glucans by C(13)-nuclear magnetic-resonance spectroscopy and by rapidanalysis of cellulose-like regions using high-performance anion-exchange chro-matography of oligosaccharides released by lichenase. Cereal Chemistry, 71,301−307.
Wood, P. J., Weisz, J., & Mahn, W. (1991). Molecular characterization of cereal beta-glucans. 2. Size-exclusion chromatography for comparison of molecular-weight.Cereal Chemistry, 68, 530−536.
Zhang, D., Doehlert, D. C., & Moore, W. R. (1998). Rheological properties of (1→3),(1→4)-beta-D-glucans from raw, roasted, and steamed oat greats. CerealChemistry, 75, 433−438.
2424 M.S. Mikkelsen et al. / Food Research International 43 (2010) 2417–2424
Paper II
Mikkelsen MS, Jespersen BM, Larsen FH, Blennow A, Engelsen SB
Molecular structure of large-scale extracted β-glucan from barley
and oat: Identification of a significantly changed block structure
in a high β-glucan barley mutant
Food Chemistry, 136:130-138, 2013
Molecular structure of large-scale extracted b-glucan from barley and oat:Identification of a significantly changed block structure in a high b-glucan barleymutant
Mette S. Mikkelsen a,⇑, Birthe M. Jespersen a, Flemming H. Larsen a, Andreas Blennow b, Søren B. Engelsen a
a Quality & Technology, Department of Food Science, Faculty of Science, University of Copenhagen, Rolighedsvej 30, 1958 Frederiksberg C, Denmarkb VKR Research Centre Pro-Active Plants, Department of Plant Biology and Biotechnology, Faculty of Science, University of Copenhagen, Thorvaldsensvej 40, 1871 FrederiksbergC, Denmark
a r t i c l e i n f o
Article history:Received 1 May 2012Received in revised form 4 July 2012Accepted 23 July 2012Available online 1 August 2012
Keywords:b-GlucanBarleyExtractionCompositionViscosityHPAECBlock structureRamanNMRMultivariate data analysis
a b s t r a c t
Health effects of b-glucan are typically related to dose, size and viscosity without taking the specificmolecular structure into account. High b-glucan mutant barley, mother barley and oat b-glucans werelarge-scale extracted by comparable protocols using hot water, enzyme assisted hydrolysis and ethanolprecipitation leading to similar molecular masses (200–300 kDa). Multivariate data analysis on all com-positional, structural and functional features demonstrated that the main variance among the sampleswas primarily explained by block structural differences as determined by HPSEC–PAD. In particular thebarley high b-glucan mutant proved to exhibit a unique block structure with DP3 and DP4 contributionsof: 78.9% and 16.7% as compared to the barley mother (72.1% and 21.4%) and oat (66.1% and 29.1%). Thisunique block structure was further confirmed by the 1H NMR determination of the b-1,4 to b-1,3 linkageratio. Low solubility of the barley samples was potentially an effect of substructures consisting of longerrepetitive cellotriosyl sequences. FT-Raman and NMR spectroscopy were useful in measuring sampleimpurities of a-glucans and prediction of b-linkage characteristics.
� 2012 Elsevier Ltd. All rights reserved.
1. Introduction
Viscous dietary fibres, such as mixed-linkage (1 ? 3, 1 ? 4)-b-D-glucan, a polysaccharide particularly occurring in oats and bar-ley, account for the majority of the clinical benefits observed withdietary fibres (Kendall, Esfahani, & Jenkins, 2010). The most widelydocumented nutritional benefits of b-glucan in food are the flatter-ing of the postprandial blood glucose and insulin rises as well asthe reduction of serum cholesterol levels. Both barley and oat b-glucans give rise to these responses and effectiveness is stronglyrelated to dose, size and viscosity (Lazaridou & Biliaderis, 2007;Wood, 2007). However, the bare amount of b-glucan is insufficientto determine the health effects of the fibre as also the molecularstructure and physical properties directly related to these para-meters are potentially important for the health promoting effects.Normally, these more detailed data are not taken into account inhuman intervention studies which is partially the reason why theresults often remain controversial (Wood, 2004). In addition, thereis sparse evidence for parallel studies comparing the health effects
of barley and oat b-glucans (Biorklund, van Rees, Mensink, &Onning, 2005; Delaney et al., 2003).
For this reason we intended to conduct a thorough comparisonof barley and oat b-glucan structure and functionality all the wayfrom raw plant material to health effects. The present work in-cludes large-scale extraction of barley and oat b-glucans, molecularstructure and physico-chemical functionality elucidation and mul-tivariate data analysis for exploitation of significant differencesand inner relations between b-glucan properties.
Due to the complexity of the raw plant material, b-glucanextraction and purification typically involve several steps: (i) inac-tivation of endogenous enzymes in the grain, (ii) extraction withwater or alkali solutions, (iii) removal of protein and starch usinghydrolytic enzymes and/or selective adsorption, (iv) precipitationof b-glucan from the purified solution with alcohol and freeze-,drum- or spray drying of the extract (Izydorczyk & Dexter, 2008).The extraction method affects the purity of the product, the funda-mental molecular structure and the molecular mass of the b-glucanpolymer (Beer, Wood, & Weisz, 1997; Burkus & Temelli, 1998;Roubroeks, Mastromauro, Andersson, Christensen, & Aman, 2000;Temelli, 1997). Kvist and Lawther (2005) previously extractedsoluble barley and oat b-glucan in large-scale for food applications
0308-8146/$ - see front matter � 2012 Elsevier Ltd. All rights reserved.http://dx.doi.org/10.1016/j.foodchem.2012.07.097
⇑ Corresponding author. Tel.: +45 35 33 35 07; fax: +45 35 33 32 45.E-mail address: [email protected] (M.S. Mikkelsen).
Food Chemistry 136 (2013) 130–138
Contents lists available at SciVerse ScienceDirect
Food Chemistry
journal homepage: www.elsevier .com/locate / foodchem
using hot (95 �C) water, heat-stable a-amylase and centrifugal sep-aration of the solution to provide a soluble fibre complex and anaqueous pellet mostly comprising of the protein and oil togetherwith the insoluble fibre material from the milled grain. This meth-od was modified for the large-scale extraction of b-glucans inves-tigated in the present study.
Total b-glucan content of barley grain generally ranges between2.5% and 11.3% by weight, whereas the range for oat is 2.2–7.8%.Munck, Moller, Jacobsen, and Sondergaard (2004) reported b-glu-can levels as high as 15–20% in a barley low starch mutant linelys5f and explained the overall constant production of polysaccha-rides as a pleitropic effect of the mutation (Patron et al., 2004). Thishigh b-glucan mutant barley was included in the present studyalong with its barley mother line. b-Glucan from different generaof cereals share the same general linear molecular structure, butexhibit variations in molecular mass, linkage pattern (ratio of b-1,4 to b-1,3 linkages), block structure (ratio of cellotriosyl/cellotet-raosyl units; DP3/DP4) and amount of longer cellulose-like frag-ments (DP P 5) (Izydorczyk, Biliaderis, & Lazaridou, 2006). Theoligomer block structure of b-glucan can be analysed using diges-tion with endo-1,3-b-D-glucanase (lichenase) that releases the b-1,4-linked segments of DP3-DPn (Blennow, Bay-Smidt, Wisch-mann, Olsen, & Moller, 1998). The differences in the molar ratioof DP3/DP4 units can be regarded as a fingerprint of the structureof cereal b-glucans and generally follows the order of wheat (3.0–4.5), barley (1.8–3.5), rye (1.9–3.0) and oat (1.5–2.3) (Fincher,2009; Izydorczyk et al., 2006; Lazaridou, Biliaderis, Micha-Screttas,& Steele, 2004; Wood, Weisz, & Blackwell, 1991, 1994).
Raman and 1H liquid-state NMR spectroscopy are widely ap-plied methods in compositional and structural investigations ofpolysaccharides (Mikkelsen et al., 2010; Salomonsen, Jensen,Stenbaek, & Engelsen, 2008; Synytsya, Copikova, Matejka, &Machovic, 2003). The advantage of using spectroscopic techniquesis the high throughput and exploratory character of the measure-ments that enables fast and simultaneous detection of severaldifferent components, and in combination with multivariate dataanalysis spectroscopy makes a powerful approach to screen forvariation in large sample sets (Munck et al., 2010). Multivariatedata analysis can also be used to predict structural and composi-tional features of polysaccharides and cereal grains from spectraldata (Jacobsen, Sondergaard, Moller, Desler, & Munck, 2005;Salomonsen et al., 2008). Earlier we have found b-glucan specificstructural information in Raman (the anomeric b-configurationadsorption band at �890 cm�1) and 1H NMR spectra (the anomericb-1,3 and b-1,4 resonances at 4.75 and 4.55 ppm, respectively)(Mikkelsen et al., 2010). In this work we demonstrate how Ramanand 1H NMR spectroscopy can be used to predict b-glucan compo-sitional and structural features. These features were further linkedto variation in physical characteristics important for determininghealth related assets of b-glucans.
2. Materials and methods
Barley materials for large-scale b-glucan extraction werehigh b-glucan-low starch mutant line in BOMI lys5f (b-glucan:16.5–19.8%, starch: 30.0%, protein: 16.0%) and mother line BOMI(b-glucan: 6.0%, starch: 52.3%, protein: 12.8%) (Munck et al.,2004). Extracted barley mutant samples were denoted: Bm1,Bm2, Bm3, Bm4 and barley mother samples were denoted: B1,B2, B3, B4. Oat b-glucan (O1, O2) was purified from oat b-glucanconcentrate (Promoat™, b-glucan: �35%, starch: �45%, protein:�4.5%) obtained from Biovelop (Kimstad, Sweden) using the samelarge-scale procedure as for the barley raw materials. For the struc-tural and functional comparison of b-glucan isolates, pure low,medium and high viscosity barley (BL, BM, BH) and medium and
high viscosity oat (OM, OH) b-glucans from Megazyme Interna-tional Ltd. (Bray, Ireland) were used as references along with crudeand purified barley (BC, BP) and oat (OC, OP) b-glucan extractsearlier studied by Mikkelsen et al. (2010). Lichenan1,3/1,4-BG (Lich),cellulose1,4-BG (Cell) and curdlan1,3-BG (Curd) (Sigma–Aldrich,Brøndby, Denmark) were included as structural reference samples(Table 1).
2.1. Large-scale extraction of b-glucans
b-Glucans were isolated from barley grains by hot water andenzymatic hydrolysis treatment using a modified procedure ofKvist and Lawther (2005). A flow diagram outlining the steps dur-ing b-glucan extraction is shown in Fig. 1. The Application PilotPlant at Novozymes A/S (Bagsværd, Denmark) operating with600 L tanks, pipe connections and mono pumps was used for thefollowing extraction steps except for the ethanol precipitationwhich was conducted at the University of Copenhagen. Barleygrains were ground on a Brabender disc mill twice before disper-sion using different concentrations of the raw materials (10% w/vmother line, 4% w/v mutant line, 5% w/v oat b-glucan concentrate)into 450 L, 95 �C, tap water. Termamyl SC (EC 3.2.1.1, NovozymesA/S, Bagsværd, Denmark) thermostable a-amylase (2% w/w, en-zyme/starch) was added and the solution held with mixing for30 min, pH 6. The mixture was then passed through a FrymaKoru-ma Toothed Colloid MZ 130 wetmill (600 L/h, Romaco FrymaKoru-ma, Neuenburg, Germany) and circulated back to the tank for afurther 30 min of starch dextrification, 95 �C and pH 6. Large parti-cles and insoluble fibres were decanted away using a Westfalia CA225-110 separator (600 L/h, GEA Westfalia Separator Group GmbH,Oelde, Germany) and amylase activity was stopped in a Hydrohe-ather M101MG (400 L/h, 2 bar, Hydro-Thermal Corporation, Wau-kesha, WI, USA) at 125 �C for 4 min. The solution was centrifugedusing a Westfalia SB7 centrifuge (300 L/h, GEA Westfalia SeparatorGroup GmbH, Oelde, Germany) thereby removing most of thedenatured protein fraction prior to addition of Alcalase AF 2.4L(EC 3.4.21.62, Novozymes A/S, Bagsværd, Denmark) protease(2.5% w/w, enzyme/protein) at 60 �C for 30 min, pH 7. Proteaseactivity was terminated at 85 �C for 15 min and the solution cooledto 25 �C before precipitation of b-glucan in 50–80% food grade eth-anol. The gum material was filtered, freeze-dried and ground intofine b-glucan powder. Barley b-glucans were extracted in two truereplicate processes corresponding to samples: B1, B2, Bm1, Bm2 inrepetition 1 and B3, B4, Bm3, Bm4 in repetition 2, whereas oat b-glucan (O1, O2) was purified in one single process. Batches 1 and3 are b-glucans immediately precipitating out in 80–50% ethanolwhereas batches 2 and 4 are b-glucans precipitating out in theremaining 50:50% b-glucan-ethanol solution overnight. However,as no significant differences were found for isolates of the sameorigin, Bm1–4, B1–4 and O1–2 were treated as replicate samples,respectively.
2.2. Compositional analyses
Samples were analysed for their b-glucan, starch, and proteincontents in duplicates. Dietary fibre analysis was performed onfour replicate samples. Total b-glucan content was determined bythe method of McCleary and Mugford (1997) using the Megazyme(Megazyme International, Wicklow, Ireland) mixed linkage b-glu-can assay kit and same conditions as Mikkelsen et al. (2010). Thecontent of total starch along with total (TDF), soluble (SDF) andinsoluble dietary fibres (IDF) was determined according to theMegazyme procedures provided with the test kits (ApprovedMethods 76–13 and 32–07, AACC 2000). Protein was analysedusing the Kjeldahl method (Approved Method 46–12, AACC 2000).
M.S. Mikkelsen et al. / Food Chemistry 136 (2013) 130–138 131
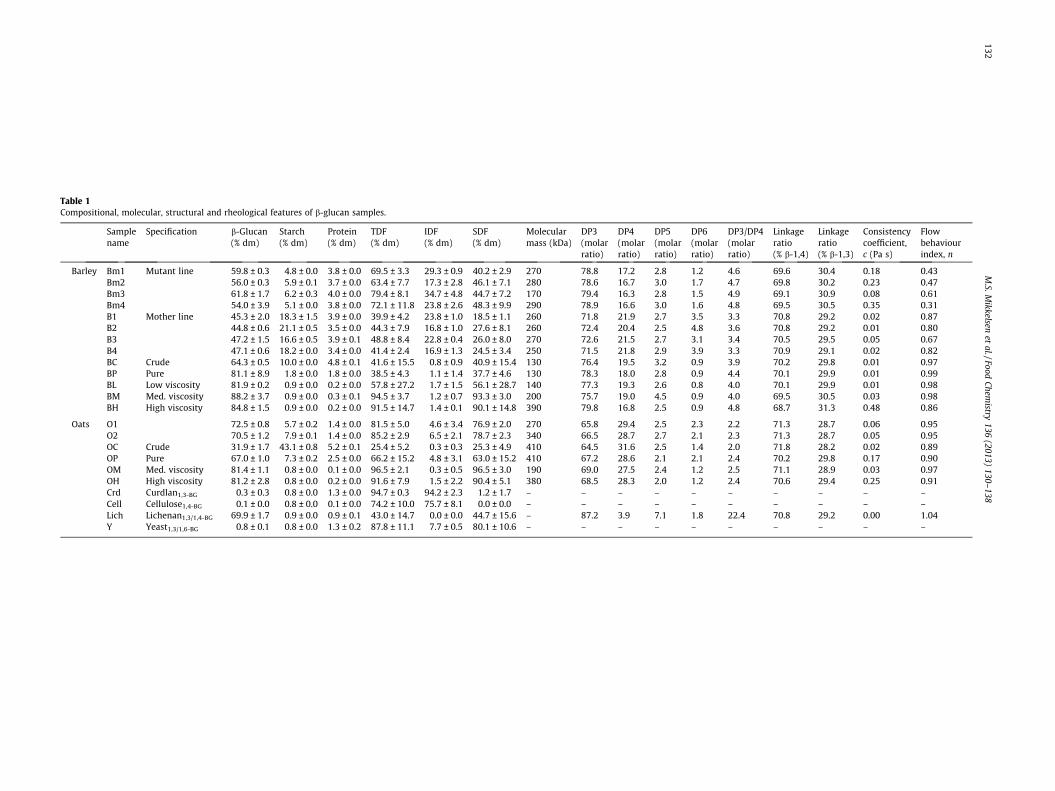
Table 1Compositional, molecular, structural and rheological features of b-glucan samples.
Samplename
Specification b-Glucan(% dm)
Starch(% dm)
Protein(% dm)
TDF(% dm)
IDF(% dm)
SDF(% dm)
Molecularmass (kDa)
DP3(molarratio)
DP4(molarratio)
DP5(molarratio)
DP6(molarratio)
DP3/DP4(molarratio)
Linkageratio(% b-1,4)
Linkageratio(% b-1,3)
Consistencycoefficient,c (Pa s)
Flowbehaviourindex, n
Barley Bm1 Mutant line 59.8 ± 0.3 4.8 ± 0.0 3.8 ± 0.0 69.5 ± 3.3 29.3 ± 0.9 40.2 ± 2.9 270 78.8 17.2 2.8 1.2 4.6 69.6 30.4 0.18 0.43Bm2 56.0 ± 0.3 5.9 ± 0.1 3.7 ± 0.0 63.4 ± 7.7 17.3 ± 2.8 46.1 ± 7.1 280 78.6 16.7 3.0 1.7 4.7 69.8 30.2 0.23 0.47Bm3 61.8 ± 1.7 6.2 ± 0.3 4.0 ± 0.0 79.4 ± 8.1 34.7 ± 4.8 44.7 ± 7.2 170 79.4 16.3 2.8 1.5 4.9 69.1 30.9 0.08 0.61Bm4 54.0 ± 3.9 5.1 ± 0.0 3.8 ± 0.0 72.1 ± 11.8 23.8 ± 2.6 48.3 ± 9.9 290 78.9 16.6 3.0 1.6 4.8 69.5 30.5 0.35 0.31B1 Mother line 45.3 ± 2.0 18.3 ± 1.5 3.9 ± 0.0 39.9 ± 4.2 23.8 ± 1.0 18.5 ± 1.1 260 71.8 21.9 2.7 3.5 3.3 70.8 29.2 0.02 0.87B2 44.8 ± 0.6 21.1 ± 0.5 3.5 ± 0.0 44.3 ± 7.9 16.8 ± 1.0 27.6 ± 8.1 260 72.4 20.4 2.5 4.8 3.6 70.8 29.2 0.01 0.80B3 47.2 ± 1.5 16.6 ± 0.5 3.9 ± 0.1 48.8 ± 8.4 22.8 ± 0.4 26.0 ± 8.0 270 72.6 21.5 2.7 3.1 3.4 70.5 29.5 0.05 0.67B4 47.1 ± 0.6 18.2 ± 0.0 3.4 ± 0.0 41.4 ± 2.4 16.9 ± 1.3 24.5 ± 3.4 250 71.5 21.8 2.9 3.9 3.3 70.9 29.1 0.02 0.82BC Crude 64.3 ± 0.5 10.0 ± 0.0 4.8 ± 0.1 41.6 ± 15.5 0.8 ± 0.9 40.9 ± 15.4 130 76.4 19.5 3.2 0.9 3.9 70.2 29.8 0.01 0.97BP Pure 81.1 ± 8.9 1.8 ± 0.0 1.8 ± 0.0 38.5 ± 4.3 1.1 ± 1.4 37.7 ± 4.6 130 78.3 18.0 2.8 0.9 4.4 70.1 29.9 0.01 0.99BL Low viscosity 81.9 ± 0.2 0.9 ± 0.0 0.2 ± 0.0 57.8 ± 27.2 1.7 ± 1.5 56.1 ± 28.7 140 77.3 19.3 2.6 0.8 4.0 70.1 29.9 0.01 0.98BM Med. viscosity 88.2 ± 3.7 0.9 ± 0.0 0.3 ± 0.1 94.5 ± 3.7 1.2 ± 0.7 93.3 ± 3.0 200 75.7 19.0 4.5 0.9 4.0 69.5 30.5 0.03 0.98BH High viscosity 84.8 ± 1.5 0.9 ± 0.0 0.2 ± 0.0 91.5 ± 14.7 1.4 ± 0.1 90.1 ± 14.8 390 79.8 16.8 2.5 0.9 4.8 68.7 31.3 0.48 0.86
Oats O1 72.5 ± 0.8 5.7 ± 0.2 1.4 ± 0.0 81.5 ± 5.0 4.6 ± 3.4 76.9 ± 2.0 270 65.8 29.4 2.5 2.3 2.2 71.3 28.7 0.06 0.95O2 70.5 ± 1.2 7.9 ± 0.1 1.4 ± 0.0 85.2 ± 2.9 6.5 ± 2.1 78.7 ± 2.3 340 66.5 28.7 2.7 2.1 2.3 71.3 28.7 0.05 0.95OC Crude 31.9 ± 1.7 43.1 ± 0.8 5.2 ± 0.1 25.4 ± 5.2 0.3 ± 0.3 25.3 ± 4.9 410 64.5 31.6 2.5 1.4 2.0 71.8 28.2 0.02 0.89OP Pure 67.0 ± 1.0 7.3 ± 0.2 2.5 ± 0.0 66.2 ± 15.2 4.8 ± 3.1 63.0 ± 15.2 410 67.2 28.6 2.1 2.1 2.4 70.2 29.8 0.17 0.90OM Med. viscosity 81.4 ± 1.1 0.8 ± 0.0 0.1 ± 0.0 96.5 ± 2.1 0.3 ± 0.5 96.5 ± 3.0 190 69.0 27.5 2.4 1.2 2.5 71.1 28.9 0.03 0.97OH High viscosity 81.2 ± 2.8 0.8 ± 0.0 0.2 ± 0.0 91.6 ± 7.9 1.5 ± 2.2 90.4 ± 5.1 380 68.5 28.3 2.0 1.2 2.4 70.6 29.4 0.25 0.91Crd Curdlan1,3-BG 0.3 ± 0.3 0.8 ± 0.0 1.3 ± 0.0 94.7 ± 0.3 94.2 ± 2.3 1.2 ± 1.7 – – – – – – – – – –Cell Cellulose1,4-BG 0.1 ± 0.0 0.8 ± 0.0 0.1 ± 0.0 74.2 ± 10.0 75.7 ± 8.1 0.0 ± 0.0 – – – – – – – – – –Lich Lichenan1,3/1,4-BG 69.9 ± 1.7 0.9 ± 0.0 0.9 ± 0.1 43.0 ± 14.7 0.0 ± 0.0 44.7 ± 15.6 – 87.2 3.9 7.1 1.8 22.4 70.8 29.2 0.00 1.04Y Yeast1,3/1,6-BG 0.8 ± 0.1 0.8 ± 0.0 1.3 ± 0.2 87.8 ± 11.1 7.7 ± 0.5 80.1 ± 10.6 – – – – – – – – – –
132M
.S.Mikkelsen
etal./Food
Chemistry
136(2013)
130–138
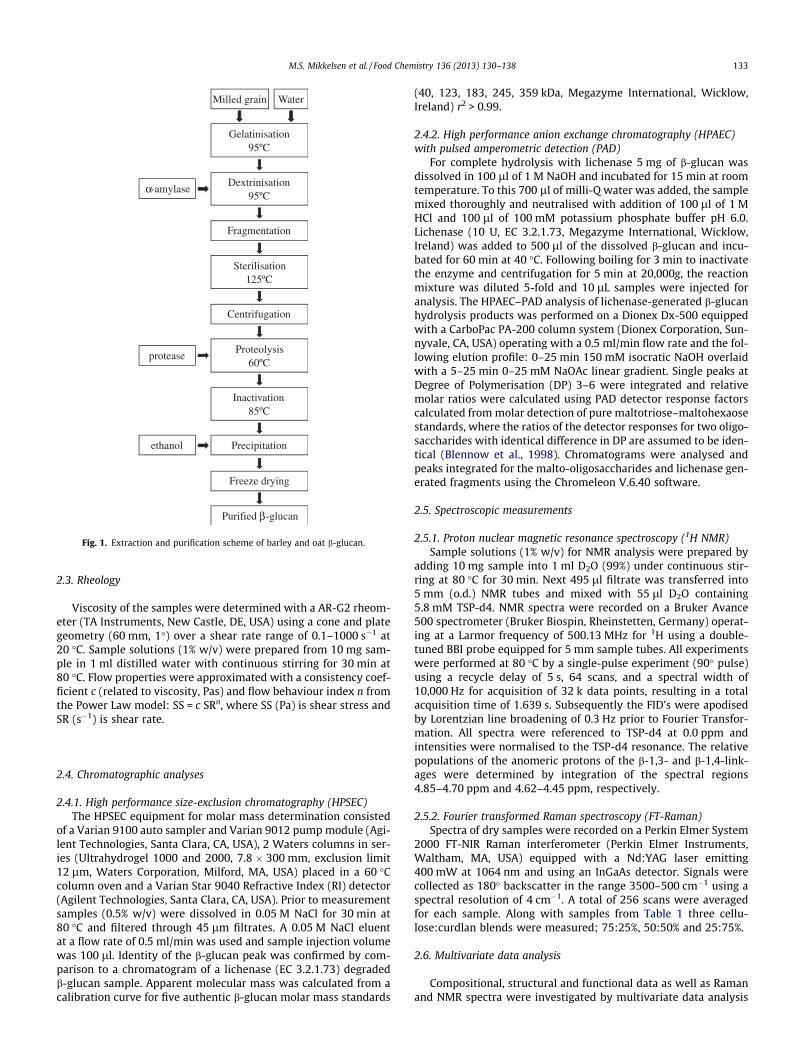
2.3. Rheology
Viscosity of the samples were determined with a AR-G2 rheom-eter (TA Instruments, New Castle, DE, USA) using a cone and plategeometry (60 mm, 1�) over a shear rate range of 0.1–1000 s�1 at20 �C. Sample solutions (1% w/v) were prepared from 10 mg sam-ple in 1 ml distilled water with continuous stirring for 30 min at80 �C. Flow properties were approximated with a consistency coef-ficient c (related to viscosity, Pas) and flow behaviour index n fromthe Power Law model: SS = c SRn, where SS (Pa) is shear stress andSR (s�1) is shear rate.
2.4. Chromatographic analyses
2.4.1. High performance size-exclusion chromatography (HPSEC)The HPSEC equipment for molar mass determination consisted
of a Varian 9100 auto sampler and Varian 9012 pump module (Agi-lent Technologies, Santa Clara, CA, USA), 2 Waters columns in ser-ies (Ultrahydrogel 1000 and 2000, 7.8 � 300 mm, exclusion limit12 lm, Waters Corporation, Milford, MA, USA) placed in a 60 �Ccolumn oven and a Varian Star 9040 Refractive Index (RI) detector(Agilent Technologies, Santa Clara, CA, USA). Prior to measurementsamples (0.5% w/v) were dissolved in 0.05 M NaCl for 30 min at80 �C and filtered through 45 lm filtrates. A 0.05 M NaCl eluentat a flow rate of 0.5 ml/min was used and sample injection volumewas 100 ll. Identity of the b-glucan peak was confirmed by com-parison to a chromatogram of a lichenase (EC 3.2.1.73) degradedb-glucan sample. Apparent molecular mass was calculated from acalibration curve for five authentic b-glucan molar mass standards
(40, 123, 183, 245, 359 kDa, Megazyme International, Wicklow,Ireland) r2 > 0.99.
2.4.2. High performance anion exchange chromatography (HPAEC)with pulsed amperometric detection (PAD)
For complete hydrolysis with lichenase 5 mg of b-glucan wasdissolved in 100 ll of 1 M NaOH and incubated for 15 min at roomtemperature. To this 700 ll of milli-Q water was added, the samplemixed thoroughly and neutralised with addition of 100 ll of 1 MHCl and 100 ll of 100 mM potassium phosphate buffer pH 6.0.Lichenase (10 U, EC 3.2.1.73, Megazyme International, Wicklow,Ireland) was added to 500 ll of the dissolved b-glucan and incu-bated for 60 min at 40 �C. Following boiling for 3 min to inactivatethe enzyme and centrifugation for 5 min at 20,000g, the reactionmixture was diluted 5-fold and 10 lL samples were injected foranalysis. The HPAEC–PAD analysis of lichenase-generated b-glucanhydrolysis products was performed on a Dionex Dx-500 equippedwith a CarboPac PA-200 column system (Dionex Corporation, Sun-nyvale, CA, USA) operating with a 0.5 ml/min flow rate and the fol-lowing elution profile: 0–25 min 150 mM isocratic NaOH overlaidwith a 5–25 min 0–25 mM NaOAc linear gradient. Single peaks atDegree of Polymerisation (DP) 3–6 were integrated and relativemolar ratios were calculated using PAD detector response factorscalculated from molar detection of pure maltotriose–maltohexaosestandards, where the ratios of the detector responses for two oligo-saccharides with identical difference in DP are assumed to be iden-tical (Blennow et al., 1998). Chromatograms were analysed andpeaks integrated for the malto-oligosaccharides and lichenase gen-erated fragments using the Chromeleon V.6.40 software.
2.5. Spectroscopic measurements
2.5.1. Proton nuclear magnetic resonance spectroscopy (1H NMR)Sample solutions (1% w/v) for NMR analysis were prepared by
adding 10 mg sample into 1 ml D2O (99%) under continuous stir-ring at 80 �C for 30 min. Next 495 ll filtrate was transferred into5 mm (o.d.) NMR tubes and mixed with 55 ll D2O containing5.8 mM TSP-d4. NMR spectra were recorded on a Bruker Avance500 spectrometer (Bruker Biospin, Rheinstetten, Germany) operat-ing at a Larmor frequency of 500.13 MHz for 1H using a double-tuned BBI probe equipped for 5 mm sample tubes. All experimentswere performed at 80 �C by a single-pulse experiment (90� pulse)using a recycle delay of 5 s, 64 scans, and a spectral width of10,000 Hz for acquisition of 32 k data points, resulting in a totalacquisition time of 1.639 s. Subsequently the FID’s were apodisedby Lorentzian line broadening of 0.3 Hz prior to Fourier Transfor-mation. All spectra were referenced to TSP-d4 at 0.0 ppm andintensities were normalised to the TSP-d4 resonance. The relativepopulations of the anomeric protons of the b-1,3- and b-1,4-link-ages were determined by integration of the spectral regions4.85–4.70 ppm and 4.62–4.45 ppm, respectively.
2.5.2. Fourier transformed Raman spectroscopy (FT-Raman)Spectra of dry samples were recorded on a Perkin Elmer System
2000 FT-NIR Raman interferometer (Perkin Elmer Instruments,Waltham, MA, USA) equipped with a Nd:YAG laser emitting400 mW at 1064 nm and using an InGaAs detector. Signals werecollected as 180� backscatter in the range 3500–500 cm�1 using aspectral resolution of 4 cm�1. A total of 256 scans were averagedfor each sample. Along with samples from Table 1 three cellu-lose:curdlan blends were measured; 75:25%, 50:50% and 25:75%.
2.6. Multivariate data analysis
Compositional, structural and functional data as well as Ramanand NMR spectra were investigated by multivariate data analysis
Milled grain Water
Gelatinisation95ºC
Dextrinisation95ºC
Sterilisation125ºC
Centrifugation
Proteolysis 60ºC
Freeze drying
Purified β-glucan
α-amylase
Fragmentation
Precipitationethanol
protease
Inactivation85ºC
Fig. 1. Extraction and purification scheme of barley and oat b-glucan.
M.S. Mikkelsen et al. / Food Chemistry 136 (2013) 130–138 133
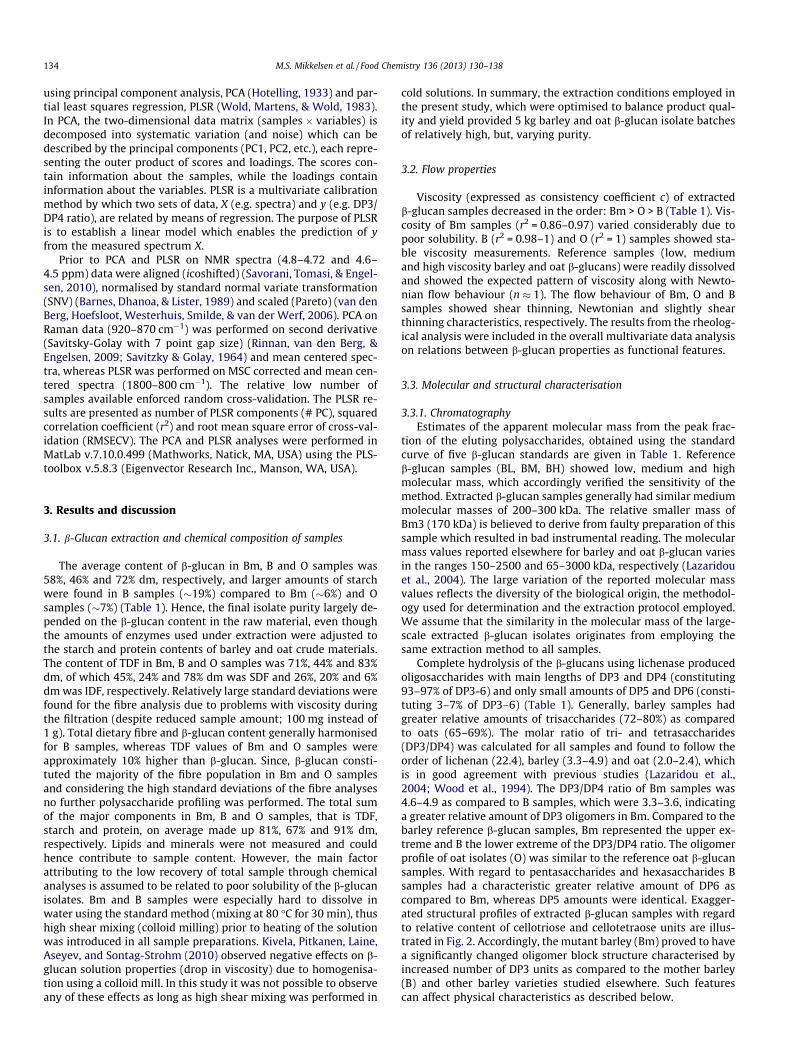
using principal component analysis, PCA (Hotelling, 1933) and par-tial least squares regression, PLSR (Wold, Martens, & Wold, 1983).In PCA, the two-dimensional data matrix (samples � variables) isdecomposed into systematic variation (and noise) which can bedescribed by the principal components (PC1, PC2, etc.), each repre-senting the outer product of scores and loadings. The scores con-tain information about the samples, while the loadings containinformation about the variables. PLSR is a multivariate calibrationmethod by which two sets of data, X (e.g. spectra) and y (e.g. DP3/DP4 ratio), are related by means of regression. The purpose of PLSRis to establish a linear model which enables the prediction of yfrom the measured spectrum X.
Prior to PCA and PLSR on NMR spectra (4.8–4.72 and 4.6–4.5 ppm) data were aligned (icoshifted) (Savorani, Tomasi, & Engel-sen, 2010), normalised by standard normal variate transformation(SNV) (Barnes, Dhanoa, & Lister, 1989) and scaled (Pareto) (van denBerg, Hoefsloot, Westerhuis, Smilde, & van der Werf, 2006). PCA onRaman data (920–870 cm�1) was performed on second derivative(Savitsky-Golay with 7 point gap size) (Rinnan, van den Berg, &Engelsen, 2009; Savitzky & Golay, 1964) and mean centered spec-tra, whereas PLSR was performed on MSC corrected and mean cen-tered spectra (1800–800 cm�1). The relative low number ofsamples available enforced random cross-validation. The PLSR re-sults are presented as number of PLSR components (# PC), squaredcorrelation coefficient (r2) and root mean square error of cross-val-idation (RMSECV). The PCA and PLSR analyses were performed inMatLab v.7.10.0.499 (Mathworks, Natick, MA, USA) using the PLS-toolbox v.5.8.3 (Eigenvector Research Inc., Manson, WA, USA).
3. Results and discussion
3.1. b-Glucan extraction and chemical composition of samples
The average content of b-glucan in Bm, B and O samples was58%, 46% and 72% dm, respectively, and larger amounts of starchwere found in B samples (�19%) compared to Bm (�6%) and Osamples (�7%) (Table 1). Hence, the final isolate purity largely de-pended on the b-glucan content in the raw material, even thoughthe amounts of enzymes used under extraction were adjusted tothe starch and protein contents of barley and oat crude materials.The content of TDF in Bm, B and O samples was 71%, 44% and 83%dm, of which 45%, 24% and 78% dm was SDF and 26%, 20% and 6%dm was IDF, respectively. Relatively large standard deviations werefound for the fibre analysis due to problems with viscosity duringthe filtration (despite reduced sample amount; 100 mg instead of1 g). Total dietary fibre and b-glucan content generally harmonisedfor B samples, whereas TDF values of Bm and O samples wereapproximately 10% higher than b-glucan. Since, b-glucan consti-tuted the majority of the fibre population in Bm and O samplesand considering the high standard deviations of the fibre analysesno further polysaccharide profiling was performed. The total sumof the major components in Bm, B and O samples, that is TDF,starch and protein, on average made up 81%, 67% and 91% dm,respectively. Lipids and minerals were not measured and couldhence contribute to sample content. However, the main factorattributing to the low recovery of total sample through chemicalanalyses is assumed to be related to poor solubility of the b-glucanisolates. Bm and B samples were especially hard to dissolve inwater using the standard method (mixing at 80 �C for 30 min), thushigh shear mixing (colloid milling) prior to heating of the solutionwas introduced in all sample preparations. Kivela, Pitkanen, Laine,Aseyev, and Sontag-Strohm (2010) observed negative effects on b-glucan solution properties (drop in viscosity) due to homogenisa-tion using a colloid mill. In this study it was not possible to observeany of these effects as long as high shear mixing was performed in
cold solutions. In summary, the extraction conditions employed inthe present study, which were optimised to balance product qual-ity and yield provided 5 kg barley and oat b-glucan isolate batchesof relatively high, but, varying purity.
3.2. Flow properties
Viscosity (expressed as consistency coefficient c) of extractedb-glucan samples decreased in the order: Bm > O > B (Table 1). Vis-cosity of Bm samples (r2 = 0.86–0.97) varied considerably due topoor solubility. B (r2 = 0.98–1) and O (r2 = 1) samples showed sta-ble viscosity measurements. Reference samples (low, mediumand high viscosity barley and oat b-glucans) were readily dissolvedand showed the expected pattern of viscosity along with Newto-nian flow behaviour (n � 1). The flow behaviour of Bm, O and Bsamples showed shear thinning, Newtonian and slightly shearthinning characteristics, respectively. The results from the rheolog-ical analysis were included in the overall multivariate data analysison relations between b-glucan properties as functional features.
3.3. Molecular and structural characterisation
3.3.1. ChromatographyEstimates of the apparent molecular mass from the peak frac-
tion of the eluting polysaccharides, obtained using the standardcurve of five b-glucan standards are given in Table 1. Referenceb-glucan samples (BL, BM, BH) showed low, medium and highmolecular mass, which accordingly verified the sensitivity of themethod. Extracted b-glucan samples generally had similar mediummolecular masses of 200–300 kDa. The relative smaller mass ofBm3 (170 kDa) is believed to derive from faulty preparation of thissample which resulted in bad instrumental reading. The molecularmass values reported elsewhere for barley and oat b-glucan variesin the ranges 150–2500 and 65–3000 kDa, respectively (Lazaridouet al., 2004). The large variation of the reported molecular massvalues reflects the diversity of the biological origin, the methodol-ogy used for determination and the extraction protocol employed.We assume that the similarity in the molecular mass of the large-scale extracted b-glucan isolates originates from employing thesame extraction method to all samples.
Complete hydrolysis of the b-glucans using lichenase producedoligosaccharides with main lengths of DP3 and DP4 (constituting93–97% of DP3-6) and only small amounts of DP5 and DP6 (consti-tuting 3–7% of DP3–6) (Table 1). Generally, barley samples hadgreater relative amounts of trisaccharides (72–80%) as comparedto oats (65–69%). The molar ratio of tri- and tetrasaccharides(DP3/DP4) was calculated for all samples and found to follow theorder of lichenan (22.4), barley (3.3–4.9) and oat (2.0–2.4), whichis in good agreement with previous studies (Lazaridou et al.,2004; Wood et al., 1994). The DP3/DP4 ratio of Bm samples was4.6–4.9 as compared to B samples, which were 3.3–3.6, indicatinga greater relative amount of DP3 oligomers in Bm. Compared to thebarley reference b-glucan samples, Bm represented the upper ex-treme and B the lower extreme of the DP3/DP4 ratio. The oligomerprofile of oat isolates (O) was similar to the reference oat b-glucansamples. With regard to pentasaccharides and hexasaccharides Bsamples had a characteristic greater relative amount of DP6 ascompared to Bm, whereas DP5 amounts were identical. Exagger-ated structural profiles of extracted b-glucan samples with regardto relative content of cellotriose and cellotetraose units are illus-trated in Fig. 2. Accordingly, the mutant barley (Bm) proved to havea significantly changed oligomer block structure characterised byincreased number of DP3 units as compared to the mother barley(B) and other barley varieties studied elsewhere. Such featurescan affect physical characteristics as described below.
134 M.S. Mikkelsen et al. / Food Chemistry 136 (2013) 130–138
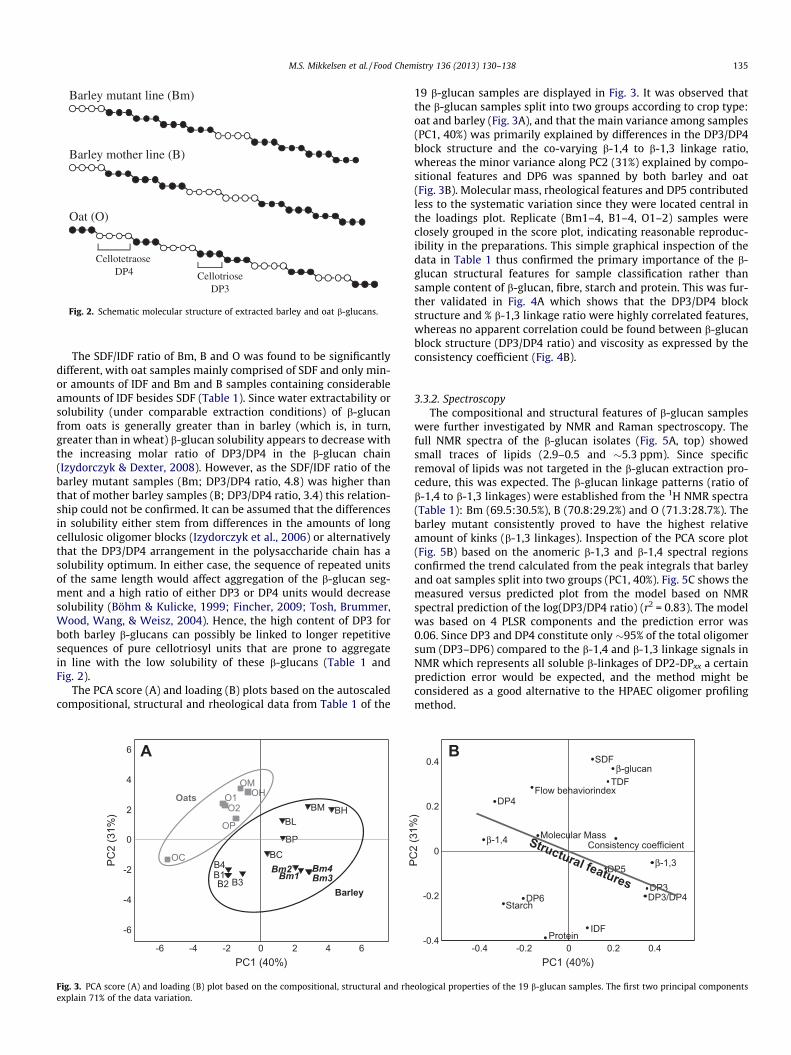
The SDF/IDF ratio of Bm, B and O was found to be significantlydifferent, with oat samples mainly comprised of SDF and only min-or amounts of IDF and Bm and B samples containing considerableamounts of IDF besides SDF (Table 1). Since water extractability orsolubility (under comparable extraction conditions) of b-glucanfrom oats is generally greater than in barley (which is, in turn,greater than in wheat) b-glucan solubility appears to decrease withthe increasing molar ratio of DP3/DP4 in the b-glucan chain(Izydorczyk & Dexter, 2008). However, as the SDF/IDF ratio of thebarley mutant samples (Bm; DP3/DP4 ratio, 4.8) was higher thanthat of mother barley samples (B; DP3/DP4 ratio, 3.4) this relation-ship could not be confirmed. It can be assumed that the differencesin solubility either stem from differences in the amounts of longcellulosic oligomer blocks (Izydorczyk et al., 2006) or alternativelythat the DP3/DP4 arrangement in the polysaccharide chain has asolubility optimum. In either case, the sequence of repeated unitsof the same length would affect aggregation of the b-glucan seg-ment and a high ratio of either DP3 or DP4 units would decreasesolubility (Böhm & Kulicke, 1999; Fincher, 2009; Tosh, Brummer,Wood, Wang, & Weisz, 2004). Hence, the high content of DP3 forboth barley b-glucans can possibly be linked to longer repetitivesequences of pure cellotriosyl units that are prone to aggregatein line with the low solubility of these b-glucans (Table 1 andFig. 2).
The PCA score (A) and loading (B) plots based on the autoscaledcompositional, structural and rheological data from Table 1 of the
19 b-glucan samples are displayed in Fig. 3. It was observed thatthe b-glucan samples split into two groups according to crop type:oat and barley (Fig. 3A), and that the main variance among samples(PC1, 40%) was primarily explained by differences in the DP3/DP4block structure and the co-varying b-1,4 to b-1,3 linkage ratio,whereas the minor variance along PC2 (31%) explained by compo-sitional features and DP6 was spanned by both barley and oat(Fig. 3B). Molecular mass, rheological features and DP5 contributedless to the systematic variation since they were located central inthe loadings plot. Replicate (Bm1–4, B1–4, O1–2) samples wereclosely grouped in the score plot, indicating reasonable reproduc-ibility in the preparations. This simple graphical inspection of thedata in Table 1 thus confirmed the primary importance of the b-glucan structural features for sample classification rather thansample content of b-glucan, fibre, starch and protein. This was fur-ther validated in Fig. 4A which shows that the DP3/DP4 blockstructure and % b-1,3 linkage ratio were highly correlated features,whereas no apparent correlation could be found between b-glucanblock structure (DP3/DP4 ratio) and viscosity as expressed by theconsistency coefficient (Fig. 4B).
3.3.2. SpectroscopyThe compositional and structural features of b-glucan samples
were further investigated by NMR and Raman spectroscopy. Thefull NMR spectra of the b-glucan isolates (Fig. 5A, top) showedsmall traces of lipids (2.9–0.5 and �5.3 ppm). Since specificremoval of lipids was not targeted in the b-glucan extraction pro-cedure, this was expected. The b-glucan linkage patterns (ratio ofb-1,4 to b-1,3 linkages) were established from the 1H NMR spectra(Table 1): Bm (69.5:30.5%), B (70.8:29.2%) and O (71.3:28.7%). Thebarley mutant consistently proved to have the highest relativeamount of kinks (b-1,3 linkages). Inspection of the PCA score plot(Fig. 5B) based on the anomeric b-1,3 and b-1,4 spectral regionsconfirmed the trend calculated from the peak integrals that barleyand oat samples split into two groups (PC1, 40%). Fig. 5C shows themeasured versus predicted plot from the model based on NMRspectral prediction of the log(DP3/DP4 ratio) (r2 = 0.83). The modelwas based on 4 PLSR components and the prediction error was0.06. Since DP3 and DP4 constitute only �95% of the total oligomersum (DP3–DP6) compared to the b-1,4 and b-1,3 linkage signals inNMR which represents all soluble b-linkages of DP2-DPxx a certainprediction error would be expected, and the method might beconsidered as a good alternative to the HPAEC oligomer profilingmethod.
CellotetraoseDP4 Cellotriose
DP3
Barley mutant line (Bm)
Barley mother line (B)
Oat (O)
Fig. 2. Schematic molecular structure of extracted barley and oat b-glucans.
β-glucan
Protein
Starch
TDF
IDF
Molecular Mass
DP3
DP4
DP5
DP6 DP3/DP4
Consistency coefficient
Flow behaviorindex
β-1,4
β-1,3
-0.4
-0.2
0
0.2
0.4
PC1 (40%)
PC2
(31%
)
SDF
B1B2 B3
B4
BH
BCBP
BLBMO2
O1OM
OH
-0.4 -0.2 0 0.2 0.4-6 -4 -2 0 2 4 6
-6
-4
-2
0
2
4
6
PC1 (40%)
PC2
(31%
)
Bm1Bm2
Bm3Bm4
OC
OP
Barley
Oats
A B
Fig. 3. PCA score (A) and loading (B) plot based on the compositional, structural and rheological properties of the 19 b-glucan samples. The first two principal componentsexplain 71% of the data variation.
M.S. Mikkelsen et al. / Food Chemistry 136 (2013) 130–138 135
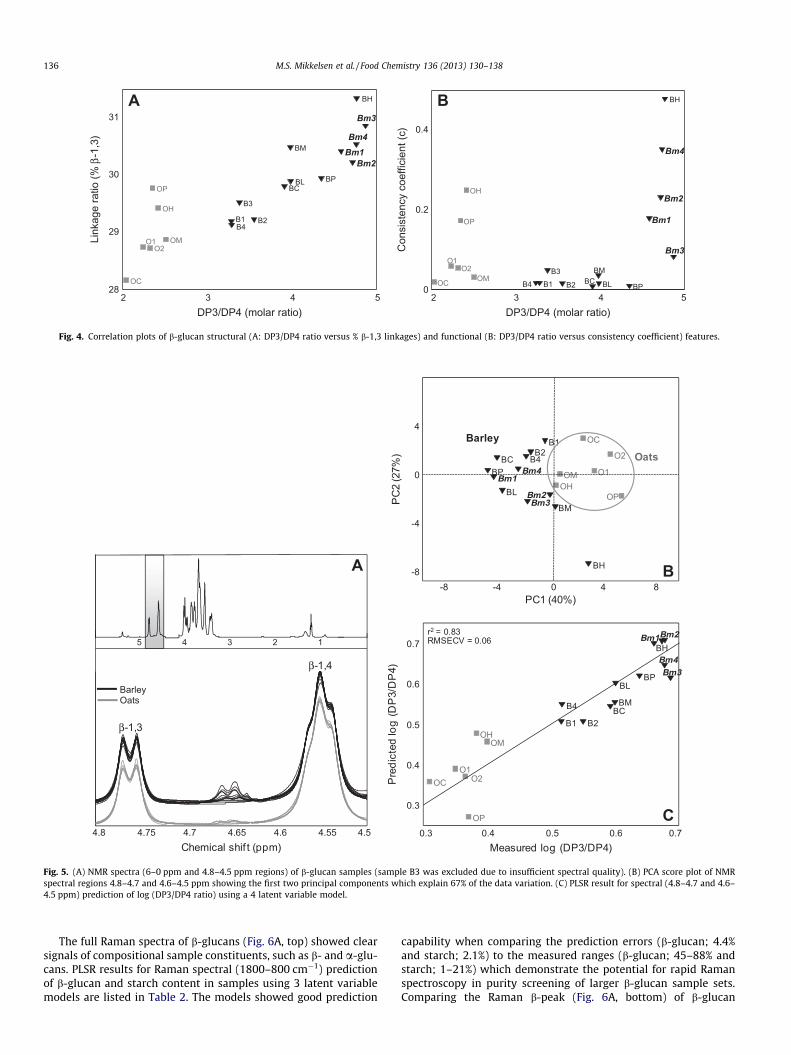
The full Raman spectra of b-glucans (Fig. 6A, top) showed clearsignals of compositional sample constituents, such as b- and a-glu-cans. PLSR results for Raman spectral (1800–800 cm�1) predictionof b-glucan and starch content in samples using 3 latent variablemodels are listed in Table 2. The models showed good prediction
capability when comparing the prediction errors (b-glucan; 4.4%and starch; 2.1%) to the measured ranges (b-glucan; 45–88% andstarch; 1–21%) which demonstrate the potential for rapid Ramanspectroscopy in purity screening of larger b-glucan sample sets.Comparing the Raman b-peak (Fig. 6A, bottom) of b-glucan
2 3 4 528
29
30
31
DP3/DP4 (molar ratio)
Link
age
ratio
(% β
-1,3
)
Bm1Bm2
Bm3
Bm4
B1 B2
B3
B4
BCBPBL
BM
BH
O1O2
OC
OP
OM
OH
A
DP3/DP4 (molar ratio)
BLB4 BP2 3 4 5
0
0.2
0.4
Con
sist
ency
coe
ffici
ent (
c)
Bm1
Bm2
Bm3
Bm4
B1 B2
B3BC
BM
BH
O1O2
OC
OP
OM
OH
B
Fig. 4. Correlation plots of b-glucan structural (A: DP3/DP4 ratio versus % b-1,3 linkages) and functional (B: DP3/DP4 ratio versus consistency coefficient) features.
4.54.554.64.654.74.75Chemical shif t (ppm)
12345
4.8
A
BarleyOats
β-1,3
β-1,4
B-8 -4 0 4 8
-8
-4
0
4
PC1 (40%)
PC
2 (2
7%)
B1
OHBm1
BH
Bm2
B2
BP
OC
OPBL
BM
OM
Bm3
Bm4 O1
O2B4BC Oats
0.4 0.5 0.6 0.7
0.3
0.4
0.5
0.6
0.7
Measured log (DP3/DP4)
Pre
dict
edlo
g (D
P3/
DP
4)
B1OH
Bm1Bm2
B2
BP
OC
OP
BL
OM
Bm3Bm4
O1O2
B4 BC
r2 = 0.83RMSECV = 0.06
0.3
BM
BH
C
Barley
Fig. 5. (A) NMR spectra (6–0 ppm and 4.8–4.5 ppm regions) of b-glucan samples (sample B3 was excluded due to insufficient spectral quality). (B) PCA score plot of NMRspectral regions 4.8–4.7 and 4.6–4.5 ppm showing the first two principal components which explain 67% of the data variation. (C) PLSR result for spectral (4.8–4.7 and 4.6–4.5 ppm) prediction of log (DP3/DP4 ratio) using a 4 latent variable model.
136 M.S. Mikkelsen et al. / Food Chemistry 136 (2013) 130–138
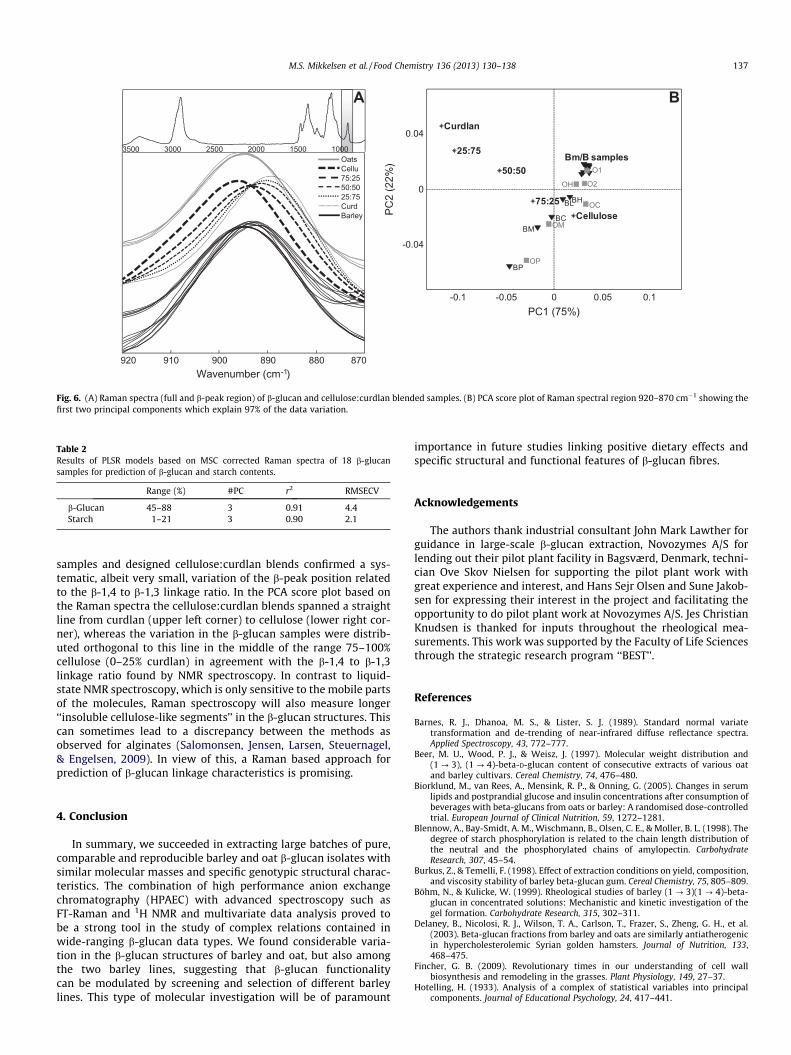
samples and designed cellulose:curdlan blends confirmed a sys-tematic, albeit very small, variation of the b-peak position relatedto the b-1,4 to b-1,3 linkage ratio. In the PCA score plot based onthe Raman spectra the cellulose:curdlan blends spanned a straightline from curdlan (upper left corner) to cellulose (lower right cor-ner), whereas the variation in the b-glucan samples were distrib-uted orthogonal to this line in the middle of the range 75–100%cellulose (0–25% curdlan) in agreement with the b-1,4 to b-1,3linkage ratio found by NMR spectroscopy. In contrast to liquid-state NMR spectroscopy, which is only sensitive to the mobile partsof the molecules, Raman spectroscopy will also measure longer‘‘insoluble cellulose-like segments’’ in the b-glucan structures. Thiscan sometimes lead to a discrepancy between the methods asobserved for alginates (Salomonsen, Jensen, Larsen, Steuernagel,& Engelsen, 2009). In view of this, a Raman based approach forprediction of b-glucan linkage characteristics is promising.
4. Conclusion
In summary, we succeeded in extracting large batches of pure,comparable and reproducible barley and oat b-glucan isolates withsimilar molecular masses and specific genotypic structural charac-teristics. The combination of high performance anion exchangechromatography (HPAEC) with advanced spectroscopy such asFT-Raman and 1H NMR and multivariate data analysis proved tobe a strong tool in the study of complex relations contained inwide-ranging b-glucan data types. We found considerable varia-tion in the b-glucan structures of barley and oat, but also amongthe two barley lines, suggesting that b-glucan functionalitycan be modulated by screening and selection of different barleylines. This type of molecular investigation will be of paramount
importance in future studies linking positive dietary effects andspecific structural and functional features of b-glucan fibres.
Acknowledgements
The authors thank industrial consultant John Mark Lawther forguidance in large-scale b-glucan extraction, Novozymes A/S forlending out their pilot plant facility in Bagsværd, Denmark, techni-cian Ove Skov Nielsen for supporting the pilot plant work withgreat experience and interest, and Hans Sejr Olsen and Sune Jakob-sen for expressing their interest in the project and facilitating theopportunity to do pilot plant work at Novozymes A/S. Jes ChristianKnudsen is thanked for inputs throughout the rheological mea-surements. This work was supported by the Faculty of Life Sciencesthrough the strategic research program ‘‘BEST’’.
References
Barnes, R. J., Dhanoa, M. S., & Lister, S. J. (1989). Standard normal variatetransformation and de-trending of near-infrared diffuse reflectance spectra.Applied Spectroscopy, 43, 772–777.
Beer, M. U., Wood, P. J., & Weisz, J. (1997). Molecular weight distribution and(1 ? 3), (1 ? 4)-beta-D-glucan content of consecutive extracts of various oatand barley cultivars. Cereal Chemistry, 74, 476–480.
Biorklund, M., van Rees, A., Mensink, R. P., & Onning, G. (2005). Changes in serumlipids and postprandial glucose and insulin concentrations after consumption ofbeverages with beta-glucans from oats or barley: A randomised dose-controlledtrial. European Journal of Clinical Nutrition, 59, 1272–1281.
Blennow, A., Bay-Smidt, A. M., Wischmann, B., Olsen, C. E., & Moller, B. L. (1998). Thedegree of starch phosphorylation is related to the chain length distribution ofthe neutral and the phosphorylated chains of amylopectin. CarbohydrateResearch, 307, 45–54.
Burkus, Z., & Temelli, F. (1998). Effect of extraction conditions on yield, composition,and viscosity stability of barley beta-glucan gum. Cereal Chemistry, 75, 805–809.
Böhm, N., & Kulicke, W. (1999). Rheological studies of barley (1 ? 3)(1 ? 4)-beta-glucan in concentrated solutions: Mechanistic and kinetic investigation of thegel formation. Carbohydrate Research, 315, 302–311.
Delaney, B., Nicolosi, R. J., Wilson, T. A., Carlson, T., Frazer, S., Zheng, G. H., et al.(2003). Beta-glucan fractions from barley and oats are similarly antiatherogenicin hypercholesterolemic Syrian golden hamsters. Journal of Nutrition, 133,468–475.
Fincher, G. B. (2009). Revolutionary times in our understanding of cell wallbiosynthesis and remodeling in the grasses. Plant Physiology, 149, 27–37.
Hotelling, H. (1933). Analysis of a complex of statistical variables into principalcomponents. Journal of Educational Psychology, 24, 417–441.
100015002000250030003500
870880890900910920
OatsCellu75:2550:50 25:75CurdBarley
Wavenumber (cm-1)
A
75:25 BHBL
0-0.1 -0.05 0.05 0.1
-0.04
0
0.04
PC1 (75%)
PC2
(22%
)
25:75
50:50
BC
BPOP
OH
BM OM
Curdlan
Cellulose
O2
O1Bm/B samples
OC
B
Fig. 6. (A) Raman spectra (full and b-peak region) of b-glucan and cellulose:curdlan blended samples. (B) PCA score plot of Raman spectral region 920–870 cm�1 showing thefirst two principal components which explain 97% of the data variation.
Table 2Results of PLSR models based on MSC corrected Raman spectra of 18 b-glucansamples for prediction of b-glucan and starch contents.
Range (%) #PC r2 RMSECV
b-Glucan 45–88 3 0.91 4.4Starch 1–21 3 0.90 2.1
M.S. Mikkelsen et al. / Food Chemistry 136 (2013) 130–138 137
Izydorczyk, M. S., & Dexter, J. E. (2008). Barley beta-glucans and arabinoxylans:Molecular structure, physicochemical properties, and uses in food products – Areview. Food Research International, 41, 850–868.
Izydorczyk, M., Biliaderis, C., & Lazaridou, A. (2006). Cereal beta-glucans. In CostasG. Biliaderis & Marta S. Izydorczyk (Eds.), Functional Food Carbohydrates(pp. 1–72). NY: CRC Press.
Jacobsen, S., Sondergaard, I., Moller, B., Desler, T., & Munck, L. (2005). Achemometric evaluation of the underlying physical and chemical patternsthat support near infrared spectroscopy of barley seeds as a tool for explorativeclassification of endosperm, genes and gene combinations. Journal of CerealScience, 42, 281–299.
Kendall, C. W. C., Esfahani, A., & Jenkins, D. J. A. (2010). The link between dietaryfibre and human health. Food Hydrocolloids, 24, 42–48.
Kivela, R., Pitkanen, L., Laine, P., Aseyev, V., & Sontag-Strohm, T. (2010). Influence ofhomogenisation on the solution properties of oat beta-glucan. FoodHydrocolloids, 24, 611–618.
Kvist, S., & Lawther, J. M. (2005). Soluble dietary fibre from oat and barley grains,method for producing a fraction rich in beta-glucan and use of the fraction in foods,pharmaceuticals and cosmetics. Patent Num: WO2005048735-A1 (Ed.).[WO2005048735-A1].
Lazaridou, A., & Biliaderis, C. G. (2007). Molecular aspects of cereal beta-glucanfunctionality: Physical properties, technological applications and physiologicaleffects. Cereal Science, 46, 101–118.
Lazaridou, A., Biliaderis, C. G., Micha-Screttas, M., & Steele, B. R. (2004). Acomparative study on structure–function relations of mixed-linkage (1 ? 3),(1 ? 4) linear beta-D-glucans. Food Hydrocolloids, 18, 837–855.
McCleary, B. V., & Mugford, D. C. (1997). Determination of beta-glucan in barley andoats by streamlined enzymatic method: Summary of collaborative study.Journal of AOAC International, 80, 580–583.
Mikkelsen, M. S., Jespersen, B. M., Moller, B. L., Laerke, H. N., Larsen, F. H., &Engelsen, S. B. (2010). Comparative spectroscopic and rheological studies oncrude and purified soluble barley and oat beta-glucan preparations. FoodResearch International, 43, 2417–2424.
Munck, L., Jespersen, B. M., Rinnan, A., Seefeldt, H. F., Engelsen, M. M., Norgaard, L.,et al. (2010). A physiochemical theory on the applicability of soft mathematicalmodels-experimentally interpreted. Journal of Chemometrics, 24.
Munck, L., Moller, B., Jacobsen, S., & Sondergaard, I. (2004). Near infrared spectraindicate specific mutant endosperm genes and reveal a new mechanism forsubstituting starch with (1 ? 3,1 ? 4)-beta-glucan in barley. Journal of CerealScience, 40, 213–222.
Patron, N. J., Greber, B., Fahy, B. E., Laurie, D. A., Parker, M. L., & Denyer, K. (2004).The lys5 mutations of barley reveal the nature and importance of plastidialADP-Glc transporters for starch synthesis in cereal endosperm. Plant Physiology,135, 2088–2097.
Rinnan, A., van den Berg, F., & Engelsen, S. B. (2009). Review of the most commonpre-processing techniques for near-infrared spectra. Trac-Trends in AnalyticalChemistry, 28, 1201–1222.
Roubroeks, J. P., Mastromauro, D. I., Andersson, R., Christensen, B. E., & Aman, P.(2000). Molecular weight, structure, and shape of oat (1 ? 3), (1 ? 4)-beta-D-glucan fractions obtained by enzymatic degradation with lichenase.Biomacromolecules, 1, 584–591.
Salomonsen, T., Jensen, H. M., Larsen, F. H., Steuernagel, S., & Engelsen, S. B. (2009).Alginate monomer composition studied by solution- and solid-state NMR – Acomparative chemometric study. Food Hydrocolloids, 23, 1579–1586.
Salomonsen, T., Jensen, H. M., Stenbaek, D., & Engelsen, S. B. (2008). Chemometricprediction of alginate monomer composition: A comparative spectroscopicstudy using IR, Raman, NIR and NMR. Carbohydrate Polymers, 72, 730–739.
Savitzky, A., & Golay, M. J. E. (1964). Smoothing + differentiation of data bysimplified least squares procedures. Analytical Chemistry, 36, 1627.
Savorani, F., Tomasi, G., & Engelsen, S. B. (2010). Icoshift: A versatile tool for therapid alignment of 1D NMR spectra. Journal of Magnetic Resonance, 202,190–202.
Synytsya, A., Copikova, J., Matejka, P., & Machovic, V. (2003). Fourier transformRaman and infrared spectroscopy of pectins. Carbohydrate Polymers, 54, 97–106.
Temelli, F. (1997). Extraction and functional properties of barley beta-glucan asaffected by temperature and pH. Journal of Food Science, 62, 1194–1201.
Tosh, S. M., Brummer, Y., Wood, P. J., Wang, Q., & Weisz, J. (2004). Evaluation ofstructure in the formation of gels by structurally diverse (1 ? 3), (1 ? 4)-beta-D-glucans from four cereal and one lichen species. Carbohydrate Polymers, 57,249–259.
van den Berg, R. A., Hoefsloot, H. C. J., Westerhuis, J. A., Smilde, A. K., & van der Werf,M. J. (2006). Centering, scaling, and transformations: Improving the biologicalinformation content of metabolomics data. BMC Genomics, 7.
Wold, S., Martens, H., & Wold, H. (1983). The multivariate calibration-problem inchemistry solved by the Pls method. Lecture Notes in Mathematics, 973, 286–293.
Wood, P. J. (2004). Relationships between solution properties of cereal beta-glucansand physiological effects – A review. Trends in Food Science & Technology, 15,313–320.
Wood, P. J. (2007). Cereal beta-glucans in diet and health. Journal of Cereal Science,46, 230–238.
Wood, P. J., Weisz, J., & Blackwell, B. A. (1991). Molecular characterisation of cerealbeta-D-glucans – structural-analysis of oat beta-D-glucan and rapid structuralevaluation of beta-D-glucans from different sources by high-performanceliquid-chromatography of oligosaccharides released by lichenase. CerealChemistry, 68, 31–39.
Wood, P. J., Weisz, J., & Blackwell, B. A. (1994). Structural studies of (1 ? 3), (1 ? 4)-beta-D-glucans by C(13)-nuclear magnetic-resonance spectroscopy and by rapidanalysis of cellulose-like regions using high-performance anion-exchangechromatography of oligosaccharides released by lichenase. Cereal Chemistry,71, 301–307.
138 M.S. Mikkelsen et al. / Food Chemistry 136 (2013) 130–138
Paper III
Simonsen HT, Nielsen MS, Christensen NJ, Christensen U, La Cour TV, Motawia
MS, Jespersen BM, Engelsen SB, Møller BL
Molecular interactions between barley and oat β-glucans and
phenolic derivatives
Journal of Agricultural and Food Chemistry, 57: 2056-2064, 2009
Molecular Interactions between Barley and Oat�-Glucans and Phenolic Derivatives
HENRIK TOFT SIMONSEN,† METTE S. NIELSEN,†,‡ NIELS J. CHRISTENSEN,‡
ULLA CHRISTENSEN,† THOMAS V. LA COUR,† MOHAMMED SADDIK MOTAWIA,†
BIRTHE P. M. JESPERSEN,‡ SØREN B. ENGELSEN,‡ AND
BIRGER LINDBERG MØLLER*,†
Plant Biochemistry Laboratory and Laboratory for Molecular Plant Biology, VKR Research CentrePro-Active Plants, Department of Plant Biology and Biotechnology, University of Copenhagen,
Thorvaldsensvej 40, 1871 Frederiksberg, Denmark, and Quality and Technology, Department of FoodScience, University of Copenhagen, Rolighedsvej 30, 1958 Frederiksberg C, Denmark
Equilibrium dialysis, molecular modeling, and multivariate data analysis were used to investigate thenature of the molecular interactions between 21 vanillin-inspired phenolic derivatives, 4 bile salts,and 2 commercially available �-glucan preparations, Glucagel and PromOat, from barley and oats.The two �-glucan products showed very similar binding properties. It was demonstrated that the two�-glucan products are able to absorb most phenolic derivatives at a level corresponding to theabsorption of bile salts. Glucosides of the phenolic compounds showed poor or no absorption. Thefour phenolic derivatives that showed strongest retention in the dialysis assay shared the pres-ence of a hydroxyl group in para-position to a CHO group. However, other compounds with the samestructural feature but possessing a different set of additional functional groups showed less retention.Principal component analysis (PCA) and partial least-squares regression (PLS) calculations using amultitude of diverse descriptors related to electronic, geometrical, constitutional, hybrid, and topologicalfeatures of the phenolic compounds showed a marked distinction between aglycon, glucosides, andbile salt retention. These analyses did not offer additional information with respect to the mode ofinteraction of the individual phenolics with the �-glucans. When the barley �-glucan was subjected toenzyme degradation, the ability to bind some but not all of the phenolic derivatives was lost. It isconcluded that the binding must be dependent on multiple characteristics that are not captured by asingle molecular descriptor.
KEYWORDS: �-Glucan; barley; oat; bile salts; phenolic derivatives; �-glucosides
INTRODUCTION
The first publication on the relationship between dietary fibersand small molecules, namely, bile salts, was published byCooksoon et al. in 1967 (1). Since then, the health-promotingeffect of dietary fibers and the influence of dietary fibers in foodmixtures has been investigated in a large number of studies.The health-promoting effects of dietary fibers are now welldocumented (2-5). Knowledge obtained in these studies hasinspired this study and has served as a platform in theinvestigation of the interaction of a different set of smallmolecules with �-glucans. It has been observed in animal aswell as human models that an increase in soluble, viscousnonstarch polysaccharides (e.g., �-glucan) in the diet is ac-companied by an increase in fecal sterols, suggesting that these
fibers interact with bile salts and cholesterol in the gastrointes-tinal (GI) tract (6, 7). Cellulose was shown not to possess anyof these effects, but it was not possible to define the propertiesresponsible for binding or retention (8). The adsorption capaci-ties of different fiber types were shown to vary, and the drugcolestyramine, a bile acid sequestrant, has been adopted as astandard for these measurements (8). Eastwood et al. (9)suggested a simple method to establish strong and reversibleadsorption. A linear relationship between the percentage of bileacid adsorbed and the amount of fiber used regardless of thebile acid concentration was observed. However, differencesbetween the adsorption of different bile acids made finalconclusions difficult. Dietary fibers from different sources havebeen tested and shown to adsorb bile salts, but the adsorptionwas not correlated with the ability of the fiber to alter thecholesterol level in vivo. This suggests that several factorsinfluence the properties that account for the adsorption of thebile acids and the lowering of blood cholesterol levels (10, 11).
* Corresponding author (telephone 353 33352; fax 353 33333; [email protected]).
† Department of Plant Biology and Biotechnology.‡ Department of Food Science.
2056 J. Agric. Food Chem. 2009, 57, 2056–2064
10.1021/jf802057v CCC: $40.75 2009 American Chemical SocietyPublished on Web 02/11/2009
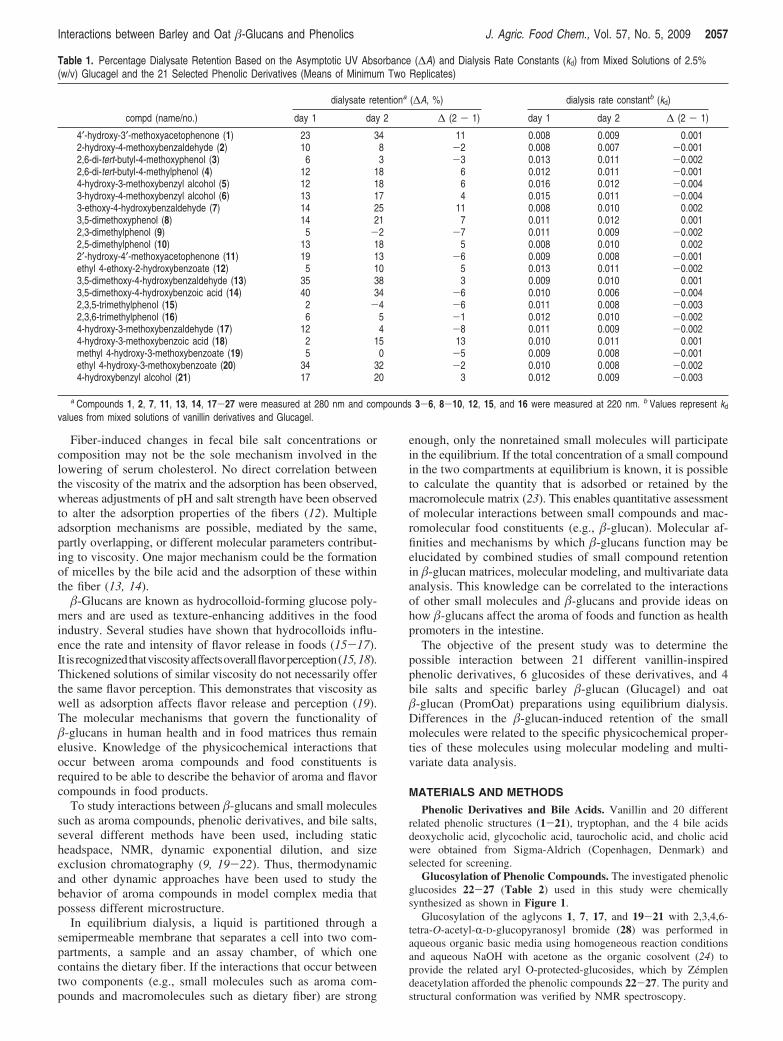
Fiber-induced changes in fecal bile salt concentrations orcomposition may not be the sole mechanism involved in thelowering of serum cholesterol. No direct correlation betweenthe viscosity of the matrix and the adsorption has been observed,whereas adjustments of pH and salt strength have been observedto alter the adsorption properties of the fibers (12). Multipleadsorption mechanisms are possible, mediated by the same,partly overlapping, or different molecular parameters contribut-ing to viscosity. One major mechanism could be the formationof micelles by the bile acid and the adsorption of these withinthe fiber (13, 14).
�-Glucans are known as hydrocolloid-forming glucose poly-mers and are used as texture-enhancing additives in the foodindustry. Several studies have shown that hydrocolloids influ-ence the rate and intensity of flavor release in foods (15-17).Itisrecognizedthatviscosityaffectsoverallflavorperception(15,18).Thickened solutions of similar viscosity do not necessarily offerthe same flavor perception. This demonstrates that viscosity aswell as adsorption affects flavor release and perception (19).The molecular mechanisms that govern the functionality of�-glucans in human health and in food matrices thus remainelusive. Knowledge of the physicochemical interactions thatoccur between aroma compounds and food constituents isrequired to be able to describe the behavior of aroma and flavorcompounds in food products.
To study interactions between �-glucans and small moleculessuch as aroma compounds, phenolic derivatives, and bile salts,several different methods have been used, including staticheadspace, NMR, dynamic exponential dilution, and sizeexclusion chromatography (9, 19-22). Thus, thermodynamicand other dynamic approaches have been used to study thebehavior of aroma compounds in model complex media thatpossess different microstructure.
In equilibrium dialysis, a liquid is partitioned through asemipermeable membrane that separates a cell into two com-partments, a sample and an assay chamber, of which onecontains the dietary fiber. If the interactions that occur betweentwo components (e.g., small molecules such as aroma com-pounds and macromolecules such as dietary fiber) are strong
enough, only the nonretained small molecules will participatein the equilibrium. If the total concentration of a small compoundin the two compartments at equilibrium is known, it is possibleto calculate the quantity that is adsorbed or retained by themacromolecule matrix (23). This enables quantitative assessmentof molecular interactions between small compounds and mac-romolecular food constituents (e.g., �-glucan). Molecular af-finities and mechanisms by which �-glucans function may beelucidated by combined studies of small compound retentionin �-glucan matrices, molecular modeling, and multivariate dataanalysis. This knowledge can be correlated to the interactionsof other small molecules and �-glucans and provide ideas onhow �-glucans affect the aroma of foods and function as healthpromoters in the intestine.
The objective of the present study was to determine thepossible interaction between 21 different vanillin-inspiredphenolic derivatives, 6 glucosides of these derivatives, and 4bile salts and specific barley �-glucan (Glucagel) and oat�-glucan (PromOat) preparations using equilibrium dialysis.Differences in the �-glucan-induced retention of the smallmolecules were related to the specific physicochemical proper-ties of these molecules using molecular modeling and multi-variate data analysis.
MATERIALS AND METHODS
Phenolic Derivatives and Bile Acids. Vanillin and 20 differentrelated phenolic structures (1-21), tryptophan, and the 4 bile acidsdeoxycholic acid, glycocholic acid, taurocholic acid, and cholic acidwere obtained from Sigma-Aldrich (Copenhagen, Denmark) andselected for screening.
Glucosylation of Phenolic Compounds. The investigated phenolicglucosides 22-27 (Table 2) used in this study were chemicallysynthesized as shown in Figure 1.
Glucosylation of the aglycons 1, 7, 17, and 19-21 with 2,3,4,6-tetra-O-acetyl-R-D-glucopyranosyl bromide (28) was performed inaqueous organic basic media using homogeneous reaction conditionsand aqueous NaOH with acetone as the organic cosolvent (24) toprovide the related aryl O-protected-glucosides, which by Zemplendeacetylation afforded the phenolic compounds 22-27. The purity andstructural conformation was verified by NMR spectroscopy.
Table 1. Percentage Dialysate Retention Based on the Asymptotic UV Absorbance (∆A) and Dialysis Rate Constants (kd) from Mixed Solutions of 2.5%(w/v) Glucagel and the 21 Selected Phenolic Derivatives (Means of Minimum Two Replicates)
dialysate retentiona (∆A, %) dialysis rate constantb (kd)
compd (name/no.) day 1 day 2 ∆ (2 - 1) day 1 day 2 ∆ (2 - 1)
4′-hydroxy-3′-methoxyacetophenone (1) 23 34 11 0.008 0.009 0.0012-hydroxy-4-methoxybenzaldehyde (2) 10 8 -2 0.008 0.007 -0.0012,6-di-tert-butyl-4-methoxyphenol (3) 6 3 -3 0.013 0.011 -0.0022,6-di-tert-butyl-4-methylphenol (4) 12 18 6 0.012 0.011 -0.0014-hydroxy-3-methoxybenzyl alcohol (5) 12 18 6 0.016 0.012 -0.0043-hydroxy-4-methoxybenzyl alcohol (6) 13 17 4 0.015 0.011 -0.0043-ethoxy-4-hydroxybenzaldehyde (7) 14 25 11 0.008 0.010 0.0023,5-dimethoxyphenol (8) 14 21 7 0.011 0.012 0.0012,3-dimethylphenol (9) 5 -2 -7 0.011 0.009 -0.0022,5-dimethylphenol (10) 13 18 5 0.008 0.010 0.0022′-hydroxy-4′-methoxyacetophenone (11) 19 13 -6 0.009 0.008 -0.001ethyl 4-ethoxy-2-hydroxybenzoate (12) 5 10 5 0.013 0.011 -0.0023,5-dimethoxy-4-hydroxybenzaldehyde (13) 35 38 3 0.009 0.010 0.0013,5-dimethoxy-4-hydroxybenzoic acid (14) 40 34 -6 0.010 0.006 -0.0042,3,5-trimethylphenol (15) 2 -4 -6 0.011 0.008 -0.0032,3,6-trimethylphenol (16) 6 5 -1 0.012 0.010 -0.0024-hydroxy-3-methoxybenzaldehyde (17) 12 4 -8 0.011 0.009 -0.0024-hydroxy-3-methoxybenzoic acid (18) 2 15 13 0.010 0.011 0.001methyl 4-hydroxy-3-methoxybenzoate (19) 5 0 -5 0.009 0.008 -0.001ethyl 4-hydroxy-3-methoxybenzoate (20) 34 32 -2 0.010 0.008 -0.0024-hydroxybenzyl alcohol (21) 17 20 3 0.012 0.009 -0.003
a Compounds 1, 2, 7, 11, 13, 14, 17-27 were measured at 280 nm and compounds 3-6, 8-10, 12, 15, and 16 were measured at 220 nm. b Values represent kd
values from mixed solutions of vanillin derivatives and Glucagel.
Interactions between Barley and Oat �-Glucans and Phenolics J. Agric. Food Chem., Vol. 57, No. 5, 2009 2057
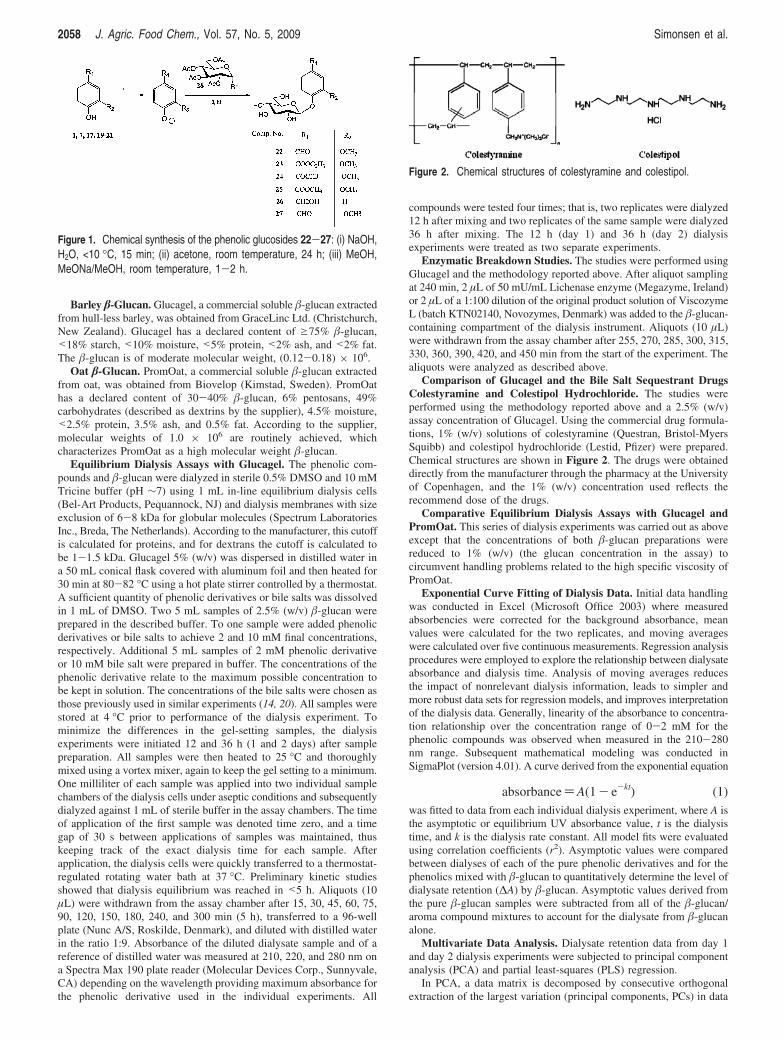
Barley �-Glucan. Glucagel, a commercial soluble �-glucan extractedfrom hull-less barley, was obtained from GraceLinc Ltd. (Christchurch,New Zealand). Glucagel has a declared content of g75% �-glucan,<18% starch, <10% moisture, <5% protein, <2% ash, and <2% fat.The �-glucan is of moderate molecular weight, (0.12-0.18) × 106.
Oat �-Glucan. PromOat, a commercial soluble �-glucan extractedfrom oat, was obtained from Biovelop (Kimstad, Sweden). PromOathas a declared content of 30-40% �-glucan, 6% pentosans, 49%carbohydrates (described as dextrins by the supplier), 4.5% moisture,<2.5% protein, 3.5% ash, and 0.5% fat. According to the supplier,molecular weights of 1.0 × 10⁶ are routinely achieved, whichcharacterizes PromOat as a high molecular weight �-glucan.
Equilibrium Dialysis Assays with Glucagel. The phenolic com-pounds and �-glucan were dialyzed in sterile 0.5% DMSO and 10 mMTricine buffer (pH ∼7) using 1 mL in-line equilibrium dialysis cells(Bel-Art Products, Pequannock, NJ) and dialysis membranes with sizeexclusion of 6-8 kDa for globular molecules (Spectrum LaboratoriesInc., Breda, The Netherlands). According to the manufacturer, this cutoffis calculated for proteins, and for dextrans the cutoff is calculated tobe 1-1.5 kDa. Glucagel 5% (w/v) was dispersed in distilled water ina 50 mL conical flask covered with aluminum foil and then heated for30 min at 80-82 °C using a hot plate stirrer controlled by a thermostat.A sufficient quantity of phenolic derivatives or bile salts was dissolvedin 1 mL of DMSO. Two 5 mL samples of 2.5% (w/v) �-glucan wereprepared in the described buffer. To one sample were added phenolicderivatives or bile salts to achieve 2 and 10 mM final concentrations,respectively. Additional 5 mL samples of 2 mM phenolic derivativeor 10 mM bile salt were prepared in buffer. The concentrations of thephenolic derivative relate to the maximum possible concentration tobe kept in solution. The concentrations of the bile salts were chosen asthose previously used in similar experiments (14, 20). All samples werestored at 4 °C prior to performance of the dialysis experiment. Tominimize the differences in the gel-setting samples, the dialysisexperiments were initiated 12 and 36 h (1 and 2 days) after samplepreparation. All samples were then heated to 25 °C and thoroughlymixed using a vortex mixer, again to keep the gel setting to a minimum.One milliliter of each sample was applied into two individual samplechambers of the dialysis cells under aseptic conditions and subsequentlydialyzed against 1 mL of sterile buffer in the assay chambers. The timeof application of the first sample was denoted time zero, and a timegap of 30 s between applications of samples was maintained, thuskeeping track of the exact dialysis time for each sample. Afterapplication, the dialysis cells were quickly transferred to a thermostat-regulated rotating water bath at 37 °C. Preliminary kinetic studiesshowed that dialysis equilibrium was reached in <5 h. Aliquots (10µL) were withdrawn from the assay chamber after 15, 30, 45, 60, 75,90, 120, 150, 180, 240, and 300 min (5 h), transferred to a 96-wellplate (Nunc A/S, Roskilde, Denmark), and diluted with distilled waterin the ratio 1:9. Absorbance of the diluted dialysate sample and of areference of distilled water was measured at 210, 220, and 280 nm ona Spectra Max 190 plate reader (Molecular Devices Corp., Sunnyvale,CA) depending on the wavelength providing maximum absorbance forthe phenolic derivative used in the individual experiments. All
compounds were tested four times; that is, two replicates were dialyzed12 h after mixing and two replicates of the same sample were dialyzed36 h after mixing. The 12 h (day 1) and 36 h (day 2) dialysisexperiments were treated as two separate experiments.
Enzymatic Breakdown Studies. The studies were performed usingGlucagel and the methodology reported above. After aliquot samplingat 240 min, 2 µL of 50 mU/mL Lichenase enzyme (Megazyme, Ireland)or 2 µL of a 1:100 dilution of the original product solution of ViscozymeL (batch KTN02140, Novozymes, Denmark) was added to the �-glucan-containing compartment of the dialysis instrument. Aliquots (10 µL)were withdrawn from the assay chamber after 255, 270, 285, 300, 315,330, 360, 390, 420, and 450 min from the start of the experiment. Thealiquots were analyzed as described above.
Comparison of Glucagel and the Bile Salt Sequestrant DrugsColestyramine and Colestipol Hydrochloride. The studies wereperformed using the methodology reported above and a 2.5% (w/v)assay concentration of Glucagel. Using the commercial drug formula-tions, 1% (w/v) solutions of colestyramine (Questran, Bristol-MyersSquibb) and colestipol hydrochloride (Lestid, Pfizer) were prepared.Chemical structures are shown in Figure 2. The drugs were obtaineddirectly from the manufacturer through the pharmacy at the Universityof Copenhagen, and the 1% (w/v) concentration used reflects therecommend dose of the drugs.
Comparative Equilibrium Dialysis Assays with Glucagel andPromOat. This series of dialysis experiments was carried out as aboveexcept that the concentrations of both �-glucan preparations werereduced to 1% (w/v) (the glucan concentration in the assay) tocircumvent handling problems related to the high specific viscosity ofPromOat.
Exponential Curve Fitting of Dialysis Data. Initial data handlingwas conducted in Excel (Microsoft Office 2003) where measuredabsorbencies were corrected for the background absorbance, meanvalues were calculated for the two replicates, and moving averageswere calculated over five continuous measurements. Regression analysisprocedures were employed to explore the relationship between dialysateabsorbance and dialysis time. Analysis of moving averages reducesthe impact of nonrelevant dialysis information, leads to simpler andmore robust data sets for regression models, and improves interpretationof the dialysis data. Generally, linearity of the absorbance to concentra-tion relationship over the concentration range of 0-2 mM for thephenolic compounds was observed when measured in the 210-280nm range. Subsequent mathematical modeling was conducted inSigmaPlot (version 4.01). A curve derived from the exponential equation
absorbance)A(1- e-kt) (1)was fitted to data from each individual dialysis experiment, where A isthe asymptotic or equilibrium UV absorbance value, t is the dialysistime, and k is the dialysis rate constant. All model fits were evaluatedusing correlation coefficients (r2). Asymptotic values were comparedbetween dialyses of each of the pure phenolic derivatives and for thephenolics mixed with �-glucan to quantitatively determine the level ofdialysate retention (∆A) by �-glucan. Asymptotic values derived fromthe pure �-glucan samples were subtracted from all of the �-glucan/aroma compound mixtures to account for the dialysate from �-glucanalone.
Multivariate Data Analysis. Dialysate retention data from day 1and day 2 dialysis experiments were subjected to principal componentanalysis (PCA) and partial least-squares (PLS) regression.
In PCA, a data matrix is decomposed by consecutive orthogonalextraction of the largest variation (principal components, PCs) in data
Figure 1. Chemical synthesis of the phenolic glucosides 22-27: (i) NaOH,H2O, <10 °C, 15 min; (ii) acetone, room temperature, 24 h; (iii) MeOH,MeONa/MeOH, room temperature, 1-2 h.
Figure 2. Chemical structures of colestyramine and colestipol.
2058 J. Agric. Food Chem., Vol. 57, No. 5, 2009 Simonsen et al.
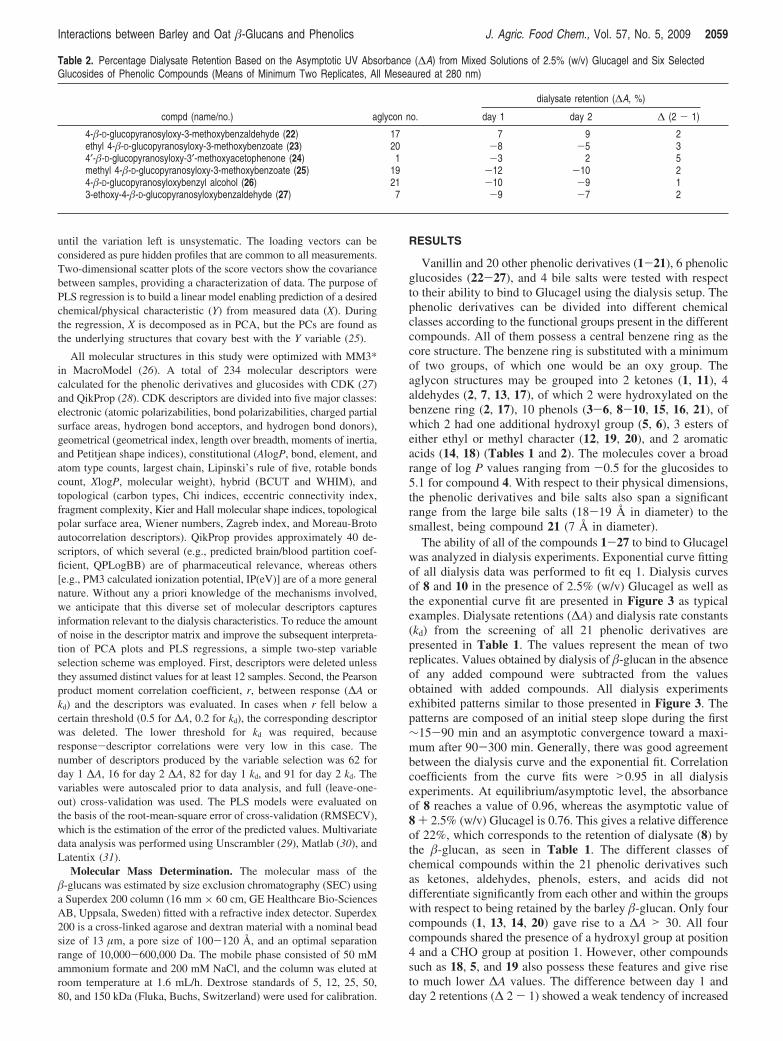
until the variation left is unsystematic. The loading vectors can beconsidered as pure hidden profiles that are common to all measurements.Two-dimensional scatter plots of the score vectors show the covariancebetween samples, providing a characterization of data. The purpose ofPLS regression is to build a linear model enabling prediction of a desiredchemical/physical characteristic (Y) from measured data (X). Duringthe regression, X is decomposed as in PCA, but the PCs are found asthe underlying structures that covary best with the Y variable (25).
All molecular structures in this study were optimized with MM3*in MacroModel (26). A total of 234 molecular descriptors werecalculated for the phenolic derivatives and glucosides with CDK (27)and QikProp (28). CDK descriptors are divided into five major classes:electronic (atomic polarizabilities, bond polarizabilities, charged partialsurface areas, hydrogen bond acceptors, and hydrogen bond donors),geometrical (geometrical index, length over breadth, moments of inertia,and Petitjean shape indices), constitutional (AlogP, bond, element, andatom type counts, largest chain, Lipinski’s rule of five, rotable bondscount, XlogP, molecular weight), hybrid (BCUT and WHIM), andtopological (carbon types, Chi indices, eccentric connectivity index,fragment complexity, Kier and Hall molecular shape indices, topologicalpolar surface area, Wiener numbers, Zagreb index, and Moreau-Brotoautocorrelation descriptors). QikProp provides approximately 40 de-scriptors, of which several (e.g., predicted brain/blood partition coef-ficient, QPLogBB) are of pharmaceutical relevance, whereas others[e.g., PM3 calculated ionization potential, IP(eV)] are of a more generalnature. Without any a priori knowledge of the mechanisms involved,we anticipate that this diverse set of molecular descriptors capturesinformation relevant to the dialysis characteristics. To reduce the amountof noise in the descriptor matrix and improve the subsequent interpreta-tion of PCA plots and PLS regressions, a simple two-step variableselection scheme was employed. First, descriptors were deleted unlessthey assumed distinct values for at least 12 samples. Second, the Pearsonproduct moment correlation coefficient, r, between response (∆A orkd) and the descriptors was evaluated. In cases when r fell below acertain threshold (0.5 for ∆A, 0.2 for kd), the corresponding descriptorwas deleted. The lower threshold for kd was required, becauseresponse-descriptor correlations were very low in this case. Thenumber of descriptors produced by the variable selection was 62 forday 1 ∆A, 16 for day 2 ∆A, 82 for day 1 kd, and 91 for day 2 kd. Thevariables were autoscaled prior to data analysis, and full (leave-one-out) cross-validation was used. The PLS models were evaluated onthe basis of the root-mean-square error of cross-validation (RMSECV),which is the estimation of the error of the predicted values. Multivariatedata analysis was performed using Unscrambler (29), Matlab (30), andLatentix (31).
Molecular Mass Determination. The molecular mass of the�-glucans was estimated by size exclusion chromatography (SEC) usinga Superdex 200 column (16 mm × 60 cm, GE Healthcare Bio-SciencesAB, Uppsala, Sweden) fitted with a refractive index detector. Superdex200 is a cross-linked agarose and dextran material with a nominal beadsize of 13 µm, a pore size of 100-120 Å, and an optimal separationrange of 10,000-600,000 Da. The mobile phase consisted of 50 mMammonium formate and 200 mM NaCl, and the column was eluted atroom temperature at 1.6 mL/h. Dextrose standards of 5, 12, 25, 50,80, and 150 kDa (Fluka, Buchs, Switzerland) were used for calibration.
RESULTS
Vanillin and 20 other phenolic derivatives (1-21), 6 phenolicglucosides (22-27), and 4 bile salts were tested with respectto their ability to bind to Glucagel using the dialysis setup. Thephenolic derivatives can be divided into different chemicalclasses according to the functional groups present in the differentcompounds. All of them possess a central benzene ring as thecore structure. The benzene ring is substituted with a minimumof two groups, of which one would be an oxy group. Theaglycon structures may be grouped into 2 ketones (1, 11), 4aldehydes (2, 7, 13, 17), of which 2 were hydroxylated on thebenzene ring (2, 17), 10 phenols (3-6, 8-10, 15, 16, 21), ofwhich 2 had one additional hydroxyl group (5, 6), 3 esters ofeither ethyl or methyl character (12, 19, 20), and 2 aromaticacids (14, 18) (Tables 1 and 2). The molecules cover a broadrange of log P values ranging from -0.5 for the glucosides to5.1 for compound 4. With respect to their physical dimensions,the phenolic derivatives and bile salts also span a significantrange from the large bile salts (18-19 Å in diameter) to thesmallest, being compound 21 (7 Å in diameter).
The ability of all of the compounds 1-27 to bind to Glucagelwas analyzed in dialysis experiments. Exponential curve fittingof all dialysis data was performed to fit eq 1. Dialysis curvesof 8 and 10 in the presence of 2.5% (w/v) Glucagel as well asthe exponential curve fit are presented in Figure 3 as typicalexamples. Dialysate retentions (∆A) and dialysis rate constants(kd) from the screening of all 21 phenolic derivatives arepresented in Table 1. The values represent the mean of tworeplicates. Values obtained by dialysis of �-glucan in the absenceof any added compound were subtracted from the valuesobtained with added compounds. All dialysis experimentsexhibited patterns similar to those presented in Figure 3. Thepatterns are composed of an initial steep slope during the first∼15-90 min and an asymptotic convergence toward a maxi-mum after 90-300 min. Generally, there was good agreementbetween the dialysis curve and the exponential fit. Correlationcoefficients from the curve fits were >0.95 in all dialysisexperiments. At equilibrium/asymptotic level, the absorbanceof 8 reaches a value of 0.96, whereas the asymptotic value of8 + 2.5% (w/v) Glucagel is 0.76. This gives a relative differenceof 22%, which corresponds to the retention of dialysate (8) bythe �-glucan, as seen in Table 1. The different classes ofchemical compounds within the 21 phenolic derivatives suchas ketones, aldehydes, phenols, esters, and acids did notdifferentiate significantly from each other and within the groupswith respect to being retained by the barley �-glucan. Only fourcompounds (1, 13, 14, 20) gave rise to a ∆A > 30. All fourcompounds shared the presence of a hydroxyl group at position4 and a CHO group at position 1. However, other compoundssuch as 18, 5, and 19 also possess these features and give riseto much lower ∆A values. The difference between day 1 andday 2 retentions (∆ 2 - 1) showed a weak tendency of increased
Table 2. Percentage Dialysate Retention Based on the Asymptotic UV Absorbance (∆A) from Mixed Solutions of 2.5% (w/v) Glucagel and Six SelectedGlucosides of Phenolic Compounds (Means of Minimum Two Replicates, All Meseaured at 280 nm)
dialysate retention (∆A, %)
compd (name/no.) aglycon no. day 1 day 2 ∆ (2 - 1)
4-�-D-glucopyranosyloxy-3-methoxybenzaldehyde (22) 17 7 9 2ethyl 4-�-D-glucopyranosyloxy-3-methoxybenzoate (23) 20 -8 -5 34′-�-D-glucopyranosyloxy-3′-methoxyacetophenone (24) 1 -3 2 5methyl 4-�-D-glucopyranosyloxy-3-methoxybenzoate (25) 19 -12 -10 24-�-D-glucopyranosyloxybenzyl alcohol (26) 21 -10 -9 13-ethoxy-4-�-D-glucopyranosyloxybenzaldehyde (27) 7 -9 -7 2
Interactions between Barley and Oat �-Glucans and Phenolics J. Agric. Food Chem., Vol. 57, No. 5, 2009 2059
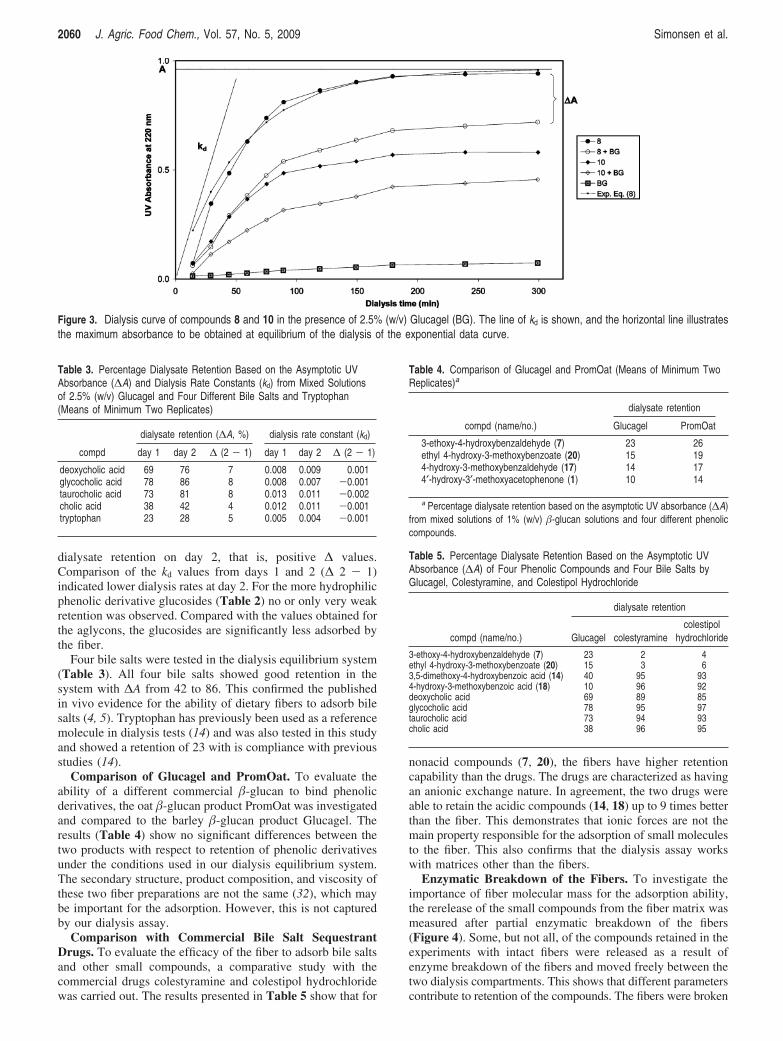
dialysate retention on day 2, that is, positive ∆ values.Comparison of the kd values from days 1 and 2 (∆ 2 - 1)indicated lower dialysis rates at day 2. For the more hydrophilicphenolic derivative glucosides (Table 2) no or only very weakretention was observed. Compared with the values obtained forthe aglycons, the glucosides are significantly less adsorbed bythe fiber.
Four bile salts were tested in the dialysis equilibrium system(Table 3). All four bile salts showed good retention in thesystem with ∆A from 42 to 86. This confirmed the publishedin vivo evidence for the ability of dietary fibers to adsorb bilesalts (4, 5). Tryptophan has previously been used as a referencemolecule in dialysis tests (14) and was also tested in this studyand showed a retention of 23 with is compliance with previousstudies (14).
Comparison of Glucagel and PromOat. To evaluate theability of a different commercial �-glucan to bind phenolicderivatives, the oat �-glucan product PromOat was investigatedand compared to the barley �-glucan product Glucagel. Theresults (Table 4) show no significant differences between thetwo products with respect to retention of phenolic derivativesunder the conditions used in our dialysis equilibrium system.The secondary structure, product composition, and viscosity ofthese two fiber preparations are not the same (32), which maybe important for the adsorption. However, this is not capturedby our dialysis assay.
Comparison with Commercial Bile Salt SequestrantDrugs. To evaluate the efficacy of the fiber to adsorb bile saltsand other small compounds, a comparative study with thecommercial drugs colestyramine and colestipol hydrochloridewas carried out. The results presented in Table 5 show that for
nonacid compounds (7, 20), the fibers have higher retentioncapability than the drugs. The drugs are characterized as havingan anionic exchange nature. In agreement, the two drugs wereable to retain the acidic compounds (14, 18) up to 9 times betterthan the fiber. This demonstrates that ionic forces are not themain property responsible for the adsorption of small moleculesto the fiber. This also confirms that the dialysis assay workswith matrices other than the fibers.
Enzymatic Breakdown of the Fibers. To investigate theimportance of fiber molecular mass for the adsorption ability,the rerelease of the small compounds from the fiber matrix wasmeasured after partial enzymatic breakdown of the fibers(Figure 4). Some, but not all, of the compounds retained in theexperiments with intact fibers were released as a result ofenzyme breakdown of the fibers and moved freely between thetwo dialysis compartments. This shows that different parameterscontribute to retention of the compounds. The fibers were broken
Figure 3. Dialysis curve of compounds 8 and 10 in the presence of 2.5% (w/v) Glucagel (BG). The line of kd is shown, and the horizontal line illustratesthe maximum absorbance to be obtained at equilibrium of the dialysis of the exponential data curve.
Table 3. Percentage Dialysate Retention Based on the Asymptotic UVAbsorbance (∆A) and Dialysis Rate Constants (kd) from Mixed Solutionsof 2.5% (w/v) Glucagel and Four Different Bile Salts and Tryptophan(Means of Minimum Two Replicates)
dialysate retention (∆A, %) dialysis rate constant (kd)
compd day 1 day 2 ∆ (2 - 1) day 1 day 2 ∆ (2 - 1)
deoxycholic acid 69 76 7 0.008 0.009 0.001glycocholic acid 78 86 8 0.008 0.007 -0.001taurocholic acid 73 81 8 0.013 0.011 -0.002cholic acid 38 42 4 0.012 0.011 -0.001tryptophan 23 28 5 0.005 0.004 -0.001
Table 4. Comparison of Glucagel and PromOat (Means of Minimum TwoReplicates)a
dialysate retention
compd (name/no.) Glucagel PromOat
3-ethoxy-4-hydroxybenzaldehyde (7) 23 26ethyl 4-hydroxy-3-methoxybenzoate (20) 15 194-hydroxy-3-methoxybenzaldehyde (17) 14 174′-hydroxy-3′-methoxyacetophenone (1) 10 14
a Percentage dialysate retention based on the asymptotic UV absorbance (∆A)from mixed solutions of 1% (w/v) �-glucan solutions and four different phenoliccompounds.
Table 5. Percentage Dialysate Retention Based on the Asymptotic UVAbsorbance (∆A) of Four Phenolic Compounds and Four Bile Salts byGlucagel, Colestyramine, and Colestipol Hydrochloride
dialysate retention
compd (name/no.) Glucagel colestyraminecolestipol
hydrochloride
3-ethoxy-4-hydroxybenzaldehyde (7) 23 2 4ethyl 4-hydroxy-3-methoxybenzoate (20) 15 3 63,5-dimethoxy-4-hydroxybenzoic acid (14) 40 95 934-hydroxy-3-methoxybenzoic acid (18) 10 96 92deoxycholic acid 69 89 85glycocholic acid 78 95 97taurocholic acid 73 94 93cholic acid 38 96 95
2060 J. Agric. Food Chem., Vol. 57, No. 5, 2009 Simonsen et al.
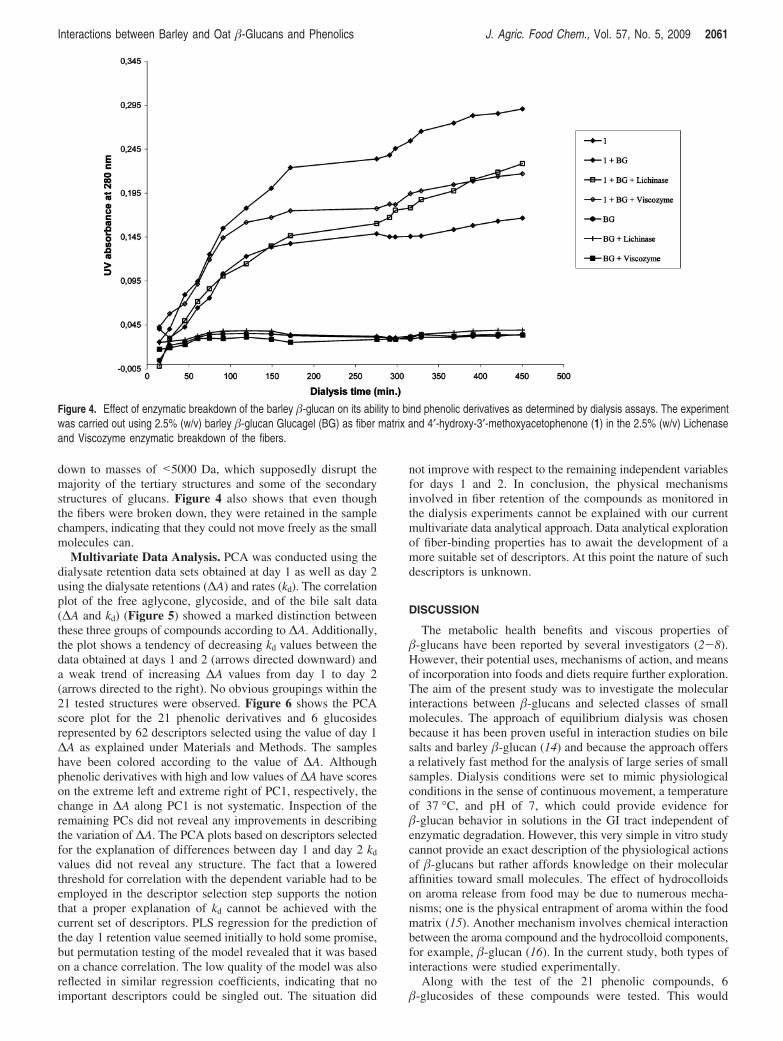
down to masses of <5000 Da, which supposedly disrupt themajority of the tertiary structures and some of the secondarystructures of glucans. Figure 4 also shows that even thoughthe fibers were broken down, they were retained in the samplechampers, indicating that they could not move freely as the smallmolecules can.
Multivariate Data Analysis. PCA was conducted using thedialysate retention data sets obtained at day 1 as well as day 2using the dialysate retentions (∆A) and rates (kd). The correlationplot of the free aglycone, glycoside, and of the bile salt data(∆A and kd) (Figure 5) showed a marked distinction betweenthese three groups of compounds according to ∆A. Additionally,the plot shows a tendency of decreasing kd values between thedata obtained at days 1 and 2 (arrows directed downward) anda weak trend of increasing ∆A values from day 1 to day 2(arrows directed to the right). No obvious groupings within the21 tested structures were observed. Figure 6 shows the PCAscore plot for the 21 phenolic derivatives and 6 glucosidesrepresented by 62 descriptors selected using the value of day 1∆A as explained under Materials and Methods. The sampleshave been colored according to the value of ∆A. Althoughphenolic derivatives with high and low values of ∆A have scoreson the extreme left and extreme right of PC1, respectively, thechange in ∆A along PC1 is not systematic. Inspection of theremaining PCs did not reveal any improvements in describingthe variation of ∆A. The PCA plots based on descriptors selectedfor the explanation of differences between day 1 and day 2 kd
values did not reveal any structure. The fact that a loweredthreshold for correlation with the dependent variable had to beemployed in the descriptor selection step supports the notionthat a proper explanation of kd cannot be achieved with thecurrent set of descriptors. PLS regression for the prediction ofthe day 1 retention value seemed initially to hold some promise,but permutation testing of the model revealed that it was basedon a chance correlation. The low quality of the model was alsoreflected in similar regression coefficients, indicating that noimportant descriptors could be singled out. The situation did
not improve with respect to the remaining independent variablesfor days 1 and 2. In conclusion, the physical mechanismsinvolved in fiber retention of the compounds as monitored inthe dialysis experiments cannot be explained with our currentmultivariate data analytical approach. Data analytical explorationof fiber-binding properties has to await the development of amore suitable set of descriptors. At this point the nature of suchdescriptors is unknown.
DISCUSSION
The metabolic health benefits and viscous properties of�-glucans have been reported by several investigators (2-8).However, their potential uses, mechanisms of action, and meansof incorporation into foods and diets require further exploration.The aim of the present study was to investigate the molecularinteractions between �-glucans and selected classes of smallmolecules. The approach of equilibrium dialysis was chosenbecause it has been proven useful in interaction studies on bilesalts and barley �-glucan (14) and because the approach offersa relatively fast method for the analysis of large series of smallsamples. Dialysis conditions were set to mimic physiologicalconditions in the sense of continuous movement, a temperatureof 37 °C, and pH of 7, which could provide evidence for�-glucan behavior in solutions in the GI tract independent ofenzymatic degradation. However, this very simple in vitro studycannot provide an exact description of the physiological actionsof �-glucans but rather affords knowledge on their molecularaffinities toward small molecules. The effect of hydrocolloidson aroma release from food may be due to numerous mecha-nisms; one is the physical entrapment of aroma within the foodmatrix (15). Another mechanism involves chemical interactionbetween the aroma compound and the hydrocolloid components,for example, �-glucan (16). In the current study, both types ofinteractions were studied experimentally.
Along with the test of the 21 phenolic compounds, 6�-glucosides of these compounds were tested. This would
Figure 4. Effect of enzymatic breakdown of the barley �-glucan on its ability to bind phenolic derivatives as determined by dialysis assays. The experimentwas carried out using 2.5% (w/v) barley �-glucan Glucagel (BG) as fiber matrix and 4′-hydroxy-3′-methoxyacetophenone (1) in the 2.5% (w/v) Lichenaseand Viscozyme enzymatic breakdown of the fibers.
Interactions between Barley and Oat �-Glucans and Phenolics J. Agric. Food Chem., Vol. 57, No. 5, 2009 2061
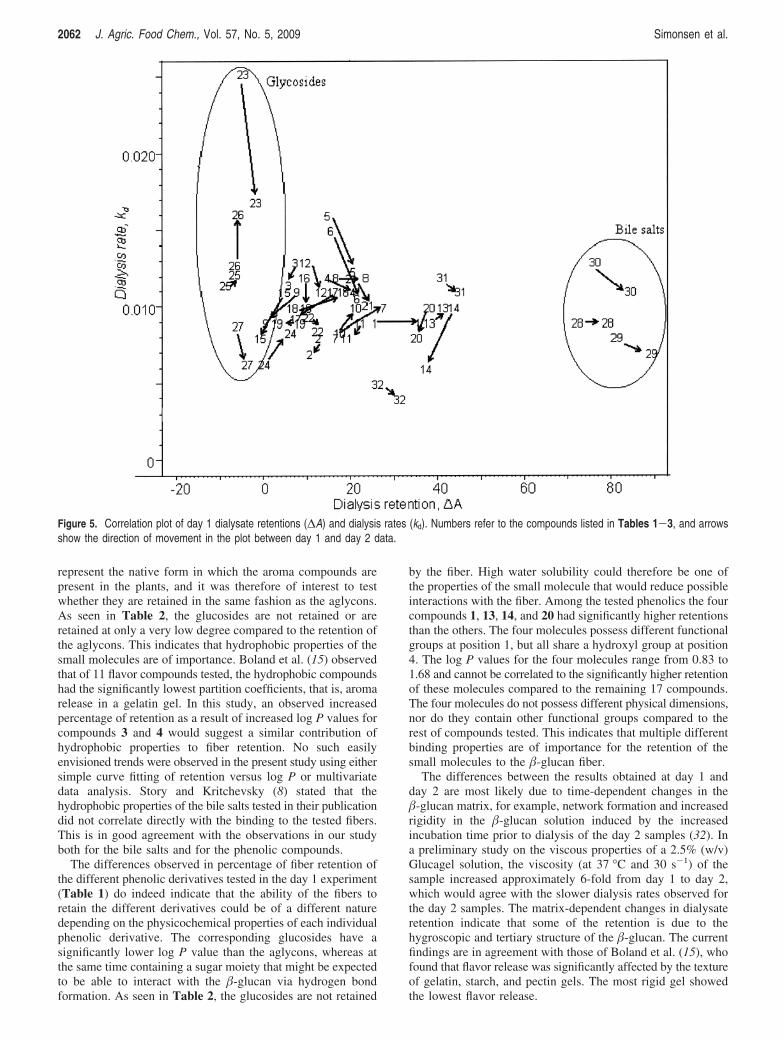
represent the native form in which the aroma compounds arepresent in the plants, and it was therefore of interest to testwhether they are retained in the same fashion as the aglycons.As seen in Table 2, the glucosides are not retained or areretained at only a very low degree compared to the retention ofthe aglycons. This indicates that hydrophobic properties of thesmall molecules are of importance. Boland et al. (15) observedthat of 11 flavor compounds tested, the hydrophobic compoundshad the significantly lowest partition coefficients, that is, aromarelease in a gelatin gel. In this study, an observed increasedpercentage of retention as a result of increased log P values forcompounds 3 and 4 would suggest a similar contribution ofhydrophobic properties to fiber retention. No such easilyenvisioned trends were observed in the present study using eithersimple curve fitting of retention versus log P or multivariatedata analysis. Story and Kritchevsky (8) stated that thehydrophobic properties of the bile salts tested in their publicationdid not correlate directly with the binding to the tested fibers.This is in good agreement with the observations in our studyboth for the bile salts and for the phenolic compounds.
The differences observed in percentage of fiber retention ofthe different phenolic derivatives tested in the day 1 experiment(Table 1) do indeed indicate that the ability of the fibers toretain the different derivatives could be of a different naturedepending on the physicochemical properties of each individualphenolic derivative. The corresponding glucosides have asignificantly lower log P value than the aglycons, whereas atthe same time containing a sugar moiety that might be expectedto be able to interact with the �-glucan via hydrogen bondformation. As seen in Table 2, the glucosides are not retained
by the fiber. High water solubility could therefore be one ofthe properties of the small molecule that would reduce possibleinteractions with the fiber. Among the tested phenolics the fourcompounds 1, 13, 14, and 20 had significantly higher retentionsthan the others. The four molecules possess different functionalgroups at position 1, but all share a hydroxyl group at position4. The log P values for the four molecules range from 0.83 to1.68 and cannot be correlated to the significantly higher retentionof these molecules compared to the remaining 17 compounds.The four molecules do not possess different physical dimensions,nor do they contain other functional groups compared to therest of compounds tested. This indicates that multiple differentbinding properties are of importance for the retention of thesmall molecules to the �-glucan fiber.
The differences between the results obtained at day 1 andday 2 are most likely due to time-dependent changes in the�-glucan matrix, for example, network formation and increasedrigidity in the �-glucan solution induced by the increasedincubation time prior to dialysis of the day 2 samples (32). Ina preliminary study on the viscous properties of a 2.5% (w/v)Glucagel solution, the viscosity (at 37 °C and 30 s-1) of thesample increased approximately 6-fold from day 1 to day 2,which would agree with the slower dialysis rates observed forthe day 2 samples. The matrix-dependent changes in dialysateretention indicate that some of the retention is due to thehygroscopic and tertiary structure of the �-glucan. The currentfindings are in agreement with those of Boland et al. (15), whofound that flavor release was significantly affected by the textureof gelatin, starch, and pectin gels. The most rigid gel showedthe lowest flavor release.
Figure 5. Correlation plot of day 1 dialysate retentions (∆A) and dialysis rates (kd). Numbers refer to the compounds listed in Tables 1-3, and arrowsshow the direction of movement in the plot between day 1 and day 2 data.
2062 J. Agric. Food Chem., Vol. 57, No. 5, 2009 Simonsen et al.
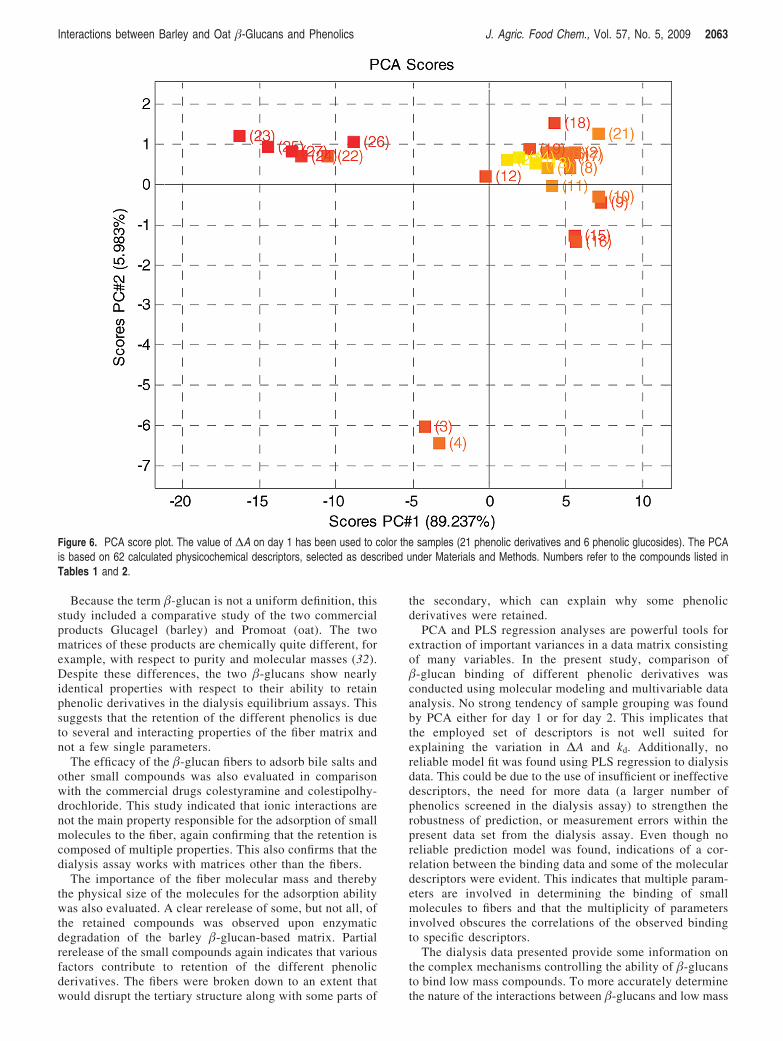
Because the term �-glucan is not a uniform definition, thisstudy included a comparative study of the two commercialproducts Glucagel (barley) and Promoat (oat). The twomatrices of these products are chemically quite different, forexample, with respect to purity and molecular masses (32).Despite these differences, the two �-glucans show nearlyidentical properties with respect to their ability to retainphenolic derivatives in the dialysis equilibrium assays. Thissuggests that the retention of the different phenolics is dueto several and interacting properties of the fiber matrix andnot a few single parameters.
The efficacy of the �-glucan fibers to adsorb bile salts andother small compounds was also evaluated in comparisonwith the commercial drugs colestyramine and colestipolhy-drochloride. This study indicated that ionic interactions arenot the main property responsible for the adsorption of smallmolecules to the fiber, again confirming that the retention iscomposed of multiple properties. This also confirms that thedialysis assay works with matrices other than the fibers.
The importance of the fiber molecular mass and therebythe physical size of the molecules for the adsorption abilitywas also evaluated. A clear rerelease of some, but not all, ofthe retained compounds was observed upon enzymaticdegradation of the barley �-glucan-based matrix. Partialrerelease of the small compounds again indicates that variousfactors contribute to retention of the different phenolicderivatives. The fibers were broken down to an extent thatwould disrupt the tertiary structure along with some parts of
the secondary, which can explain why some phenolicderivatives were retained.
PCA and PLS regression analyses are powerful tools forextraction of important variances in a data matrix consistingof many variables. In the present study, comparison of�-glucan binding of different phenolic derivatives wasconducted using molecular modeling and multivariable dataanalysis. No strong tendency of sample grouping was foundby PCA either for day 1 or for day 2. This implicates thatthe employed set of descriptors is not well suited forexplaining the variation in ∆A and kd. Additionally, noreliable model fit was found using PLS regression to dialysisdata. This could be due to the use of insufficient or ineffectivedescriptors, the need for more data (a larger number ofphenolics screened in the dialysis assay) to strengthen therobustness of prediction, or measurement errors within thepresent data set from the dialysis assay. Even though noreliable prediction model was found, indications of a cor-relation between the binding data and some of the moleculardescriptors were evident. This indicates that multiple param-eters are involved in determining the binding of smallmolecules to fibers and that the multiplicity of parametersinvolved obscures the correlations of the observed bindingto specific descriptors.
The dialysis data presented provide some information onthe complex mechanisms controlling the ability of �-glucansto bind low mass compounds. To more accurately determinethe nature of the interactions between �-glucans and low mass
Figure 6. PCA score plot. The value of ∆A on day 1 has been used to color the samples (21 phenolic derivatives and 6 phenolic glucosides). The PCAis based on 62 calculated physicochemical descriptors, selected as described under Materials and Methods. Numbers refer to the compounds listed inTables 1 and 2.
Interactions between Barley and Oat �-Glucans and Phenolics J. Agric. Food Chem., Vol. 57, No. 5, 2009 2063
compounds, a range of advanced spectroscopy and molecularmodeling methodologies will need to be introduced.
In conclusion, the retention of aroma compounds by�-glucan is of great interest from a food composition pointof view and from a health perspective. In recent years, theincreased health consciousness among consumers has led toextended additional use of hydrocolloids as replacements forfats. The food industry would benefit greatly from animproved understanding of the mechanisms involved in theflavor retention and release from �-glucan matrices alongwith the nature of the interactions occurring in the GI tract.Knowledge of the action of model compounds in �-glucanmatrices can provide general information on the �-glucanaffinity toward small molecules, which would be applicablein the studies of, for example, the bioavailability of naturalcompounds found in association with �-glucans and for healthclaims on �-glucan.
It was confirmed that �-glucans from barley and oat areable to adsorb bile salts, and for the first time �-glucans’ability to absorb vanillin and other phenolic compounds wasdemonstrated. The retention in our newly developed dialysisassay depends on numerous and interacting physicochemicalproperties of the small molecules. The interaction could notbe explained by simple correlation to any of the descriptorsincluded in the multivariable data analysis, and the resultscould not confirm or disprove the previously describedhydrophobic binding or micelle capture of the small mol-ecules to the �-glucan.
LITERATURE CITED
(1) Cookson, F. B.; Altschul, R.; Fedoroff, S. The effects of alfalfaon serum cholesterol and in modifying or preventing cholesterol-induced atherosclerosis in rabbits. J. Atheroscler. Res. 1967, 7,69–81.
(2) Eastwood, M. A. A molecular biological basis for the nutritionaland pharmacological benefits of dietary plants. Q. J. Med. 2001,94, 45–48.
(3) Eastwood, M. A.; Kritchevsky, D. Dietary fibre: how did we getwhere we are? Annu. ReV. Nutr. 2005, 25, 1–8.
(4) Kritchevsky, D. Cereal fibre and lipidemia. Cereal Foods World1997, 42, 81–85.
(5) Story, J. A.; Watterson, J. J.; Matheson, H. B.; Furumoto, E. J.Dietary fibre and bile acid metabolismsan update. AdV. Exp. Med.Biol. 1997, 427, 259–266.
(6) Beer, M. U.; Arrigoni, E.; Amado, R. Effects of oat gum on bloodcholesterol levels in healthy-young men. Eur. J. Clin. Nut. 1995,49, 517–22.
(7) Yang, J. L.; Kim, Y. H.; Lee, H. S.; Lee, M. S.; Moon, Y. K.Barley �-glucan lowers serum cholesterol based on the up-regulation of cholesterol 7 R-hydroxylase activity and mRNAabundance in cholesterol-fed rats. J. Nut. Sci. Vitamin. 2003, 49,381–387.
(8) Story, J. A.; Kritchevsky, D. Comparison of the binding of variousbile acids and bile salts in vitro by several types of fibre. J. Nutr.1976, 106, 1292–1294.
(9) Eastwood, M. A.; Anderson, R.; Mitchell, W. D.; Robertson, J.;Podock, S. A method to measure the adsorption of bile salts tovegetable fibre of differing water holding capacity. J. Nutr. 1976,106, 1429–1432.
(10) Kahlon, T. S.; Berrios, J. de J.; Smith, G. E.; Pan, J. L. In vitrobile acid binding capacity of wheat bran extruded at five specificmechanical energy levels. Cereal Chem. 2006, 83, 157–160.
(11) Vahouny, G. V.; Tombes, R.; Cassidy, M. M.; Kritchevsky, D.;Gallo, L. L. Dietary fibres: V. Binding of bile salts, phospholipidsand cholesterol from mixed micelles by bile acid sequestrants anddietary fibres. Lipids 1980, 15, 1012–1018.
(12) Story, J. A.; Watterson, J. J.; Matheson, H. B.; Furumoto, E. J.Dietary fibre and bile acid metabolism. AdV. Exp. Med. Biol. 1990,270, 43–48.
(13) Vahouny, G. V.; Khalafi, R.; Satchithanandam, S.; Watkins, D. W.;Story, J. A.; Cassidy, M. M.; Kritchevsky, D. Dietary fibresupplementation and fecal bile acids, neutral steroids and divalentcations in rats. J. Nutr. 1987, 117, 2009–2015.
(14) Coles, G. D.; Eady, S. L.; Coles, T. K.; Boone, D. J. J.; Furneaux,R. H. �-Glucan binds bile salts. In Cereals “96”, Proceedings ofThe 46th Australian Cereal Chemistry Conference; Wringley,C. W., Ed.; RACI Cereal Chemistry Division: Melbourne,Australia, 1996; 180-183.
(15) Boland, A. B.; Buhr, K.; Giannouli, P.; van Ruth, S. M. Influenceof gelatin, starch, pectin and artificial saliva on the release of 11flavour compounds from model gel systems. Food Chem. 2004,86, 401–11.
(16) Malkki, Y.; Heinio, R. L.; Autio, K. Influence of oat gum, guargum and carboxymethyl cellulose on the perception of sweetnessand flavor. Food Hydrocolloids 1993, 6, 525–532.
(17) Pangborn, R. M.; Gibbs, Z. M.; Tassan, C. Effect of hydrocolloidson apparent viscosity and sensory properties of selected beverages.J. Texture Stud. 1978, 9, 415–436.
(18) Juteau, A.; Cayot, N.; Chabanet, C.; Doublier, J. L.; Guichard,E. Flavour release from polysaccharide gels: different approachesfor the determination of kinetic parameters. Trends Food Sci.Technol. 2004, 15, 394–402.
(19) Yven, C.; Guichard, E.; Giboreau, A.; Roberts, D. D. Assessmentof interactions between hydrocolloids and flavour compounds bysensory, headspace, and binding methodologies. J. Agric. FoodChem. 1998, 46, 1510–1514.
(20) Bowles, R. K.; Morgan, K. R.; Furneaux, R. H.; Coles, G. D.C-13 CP/MAS NMR study of the interaction of bile acids withbarley �-D-glucan. Carbohydr. Polym. 1996, 29, 7–10.
(21) Guichard, E.; Etievant, P. Measurement of interactions betweenpolysaccharides and flavour compounds by exclusion size chro-matography: advantages and limits. Nahrung-Food 1998, 42,376–379.
(22) Langourieux, S.; Crouzet, J. Study of aroma compounds polysac-charides interactions by dynamic exponential dilution. Food Sci.Technol.-Lebensm. Wiss. Technol. 1994, 27, 544–549.
(23) Druaux, C.; Voilley, A. Effect of food composition and micro-structure on volatile flavour release. Trends Food Sci. Technol.1997, 8, 364–368.
(24) Mauthner, F. Uber neue synthetische Glucoside. J. Prakt. Chem.(Neue Folge) 1912, 85, 564–568.
(25) Martens, H.; Næs, T. MultiVariate Calibration; Wiley: Chichester,U.K., 1989.
(26) Macromodel, vers. 9.6; Schrodinger: New York, 2008.(27) Steinbeck, C.; Han, Y.; Kuhn, S.; Horlacher, O.; Luttmann, E.;
Willighagen, E. The Chemistry Development Kit (CDK): an open-source Java library for chemo- and bioinformatics. J. Chem. Inf.Comput. Sci. 2003, 43, 493–500.
(28) QikProp, vers. 2.5; Schrodinger: New York, 2005.(29) The Unscrambler, vers. 7.6.; CAMO ASA: Trondheim, Norway.(30) Matlab, vers. 5.3; MathWorks: Natick, MA.(31) Latentix, vers. 1.0; Latent5: Copenhagen, Denmark.(32) Nielsen, M. S.; Jespersen, B. M.; Karlsson, A.; Simonsen, H. T.;
Møller, B. L.; Lærke, H. N.; Larsen, F. H.; Engelsen, S. B.Comparative structural and rheological studies on barley and oat�-glucan products: Glucagel and PromOat. Cereal Chem., 2008,submitted for publication.
Received for review July 7, 2008. Revised manuscript received October14, 2008. Accepted October 25, 2008. We thank the programs BuildYour Food supported by the Danish Council for Strategic Research,Program Commission of Health, Food and Welfare, and the strategicresearch initiative BEST funded by the University of Copenhagen forfinancial support.
JF802057V
2064 J. Agric. Food Chem., Vol. 57, No. 5, 2009 Simonsen et al.
Paper IV
Mikkelsen MS, Jespersen BM, Mehlsen A, Engelsen SB, Frøkjær H
Cereal β-glucan immune modulating activity depends on polymer
fine structure and in turn the polymer solubility and
aggregation in solution
Molecular Nutrition & Food Research, 2012, Submitted
Cereal β-glucan immune modulating activity depends on polymer fine
structure and in turn the polymer solubility and aggregation in solution
Mette Skau Mikkelsen1*, Birthe Møller Jespersen1, Anni Mehlsen2, Søren Balling Engelsen1, Hanne
Frøkiær2
1Quality & Technology, Department of Food Science, Faculty of Science, University of Copenhagen,
Rolighedsvej 30, 1958 Frederiksberg C, Denmark; 2Department of Veterinary Disease Biology, Faculty of
Health and Medical Sciences, University of Copenhagen, Ridebanvej 9, 1871 Frederiksberg C, Denmark
*Corresponding author: Mette Skau Mikkelsen; Tel: +45 35 33 35 07; Fax: +45 35 33 32 45; E-mail:
Abstract
The relationship between the immune modulatory properties of different mixed linkage β-
glucans from microbial and plant origin and their structure and physico-chemical traits is
elusive. This study addresses the importance of the physico-chemical properties of barley and
oat β-glucans for their capacity to modulate immune responses. A total of 23 different β-
glucan samples characterised with respect to compositional, molecular, structural and
rheological properties was investigated for their immune modulatory properties. It was found
that the β-glucans modulate LPS induced cytokine production in dendritic cells as IL-12
levels decreased and IL-10 levels increased. In dendritic cells stimulated with the probiotic
Lactobacillus acidophilus the β-glucans up-regulated IL-10 production but showed no effect
on the IL-12 levels. The extent to which β-glucan modulated the cytokine responses depended
on the β-glucan block structure as expressed by the ratio of tri- to tetraosyl units, solubility
and especially the polysaccharide aggregation structures in solution. Speculations on β-glucan
fringed micelle interaction with dendritic cell receptors are presented. This comparative study
reveals that the β-glucan fine structure and in turn their intermolecular organisation are key
elements for understanding their immune modulatory capacity.
Keywords
β-Glucan, barley, oat, dendritic cell, immune modulation, cytokine
1
Introduction
β-Glucans comprise non-starch polysaccharides build of glucose as the structural component
and interlinked by different and alternating β-glucosidic bonds (β-1,3; β-1,4 and β-1,6),
resulting in a great variability in structural composition. It is well-established that many
dietary β-glucans hold health promoting properties as they may reduce serum cholesterol
levels and serve as prebiotics [1-3]. Recently, it has been proposed that β-glucans of both
microbial and plant origin may hold immune modulatory properties [4;5]. The structure of the
β-glucan largely depends on the origin of the β-glucan, e.g. branched β-(1,3)(1,6)-glucans are
found in fungi and yeasts [6;7] while mixed linked β-(1,3)(1,4)-glucans are present in cereals
such as barley and oat [8], or β-glucan may be straight β-(1,4)-glucans as cellulose or β-(1,3)-
glucans as found in curdlan [9]. Thus, structural differences in β-glucans from microbial and
plant origin exist and this may influence the immune modulatory properties.
Recognition of molecular motifs by the cells of the immune system is a key element in the
mammalian defense against pathogens. The immune cells express different types of pattern
recognition receptors (PRRs) on their surface including Toll like receptors (TLRs)
recognising various microbial structures such as lipopolysaccaride (LPS) and peptidoglycan
(PNG) and C-type lectins (CTLs) which recognise specific carbohydrates [10;11]. Upon
ligation of the PRR, the cell responds by initiating the transcription of genes encoding
cytokines and surface receptors of importance for the interaction with and signaling to other
cells. The resulting response in the immune cell depends on the combination of PRRs that are
being ligated as well as the cell type. β-Glucans from yeast and fungi have been demonstrated
to bind to the CTL receptor dectin-1 as well as to Complement receptor CR3. In particular, β-
1,3-glucan structures bind to dectin-1 [12;13], while the CR3 is more promiscuous, binding
carbohydrates containing mannose, N-acetyl-D-glucosamine and glucose as well as non-
carbohydrate molecules [14].
Antigen presenting cells of the innate immunity, are key cells in the recognition of
microorganisms and foreign molecules and express a rich repertoire of PRRs, including the
TLRs and CTLs. Of these cells, the dendritic cells (DCs) play a key role in initiation and
orchestration of the innate as well as the adaptive immunity [15]. Through the ligation to
PRRs, most bacteria and bacterial constituents are potent stimulators of cytokine production
in the DCs. LPS is often used to assess the immune modulatory effect of microbes and
bioactive molecules, but the use of other stimuli, e.g. other TLR ligands or whole bacteria
2
may also be used to stimulate the cells and may in fact induce different effects through
different cellular mechanisms [16;17]. While many bacteria and microbial components induce
maturation and cytokine production, some molecules of microbial as well as plant origin may
act as antagonists when binding to the PRR. In particular ligation of CTLs has been suggested
to down-regulate TLR induced cytokine production [13;18].
Although the plant derived β-glucan structures differ from those of microbial origin, it has
been speculated whether the plant β-glucans are able to bind to the same receptors as the
microbe derived β-glucans or to other receptors on immune cells. In fact, Brown and Gordon
[12] demonstrated that β-(1,4) structures bound to dectin-1 tranfected HEK cells although the
binding affinity was several fold lower than the binding of β-(1,3) and β-(1,6) structures. We
have also recently shown that β-glucans purified from barley and oat modulated the cytokine
production in LPS stimulated DCs albeit not as strongly as β-glucans of microbial origin [19].
The results indicated that linkage type, molecular mass and solubility impact the immune
modulatory capacity of the β-glucans but the contribution of the different properties was not
examined in details. Adams et al. [20] suggested that binding affinities of dectin-1 to various
β-glucans vary according to the side-branching frequency and chain length of the polymer. In
an immuno test system favouring complement activation via the alternative pathway
aggregated barley β-glucan showed significant activity in contrast to a high molecular mass
soluble β-glucan [21] whereas increased β-glucan immunological activity depending on
higher β-(1,4)/β-(1,3) linkage ratios was indicated by Samuelsen et al. [22].
The present study specificly adress the physico–chemical properties for the immuno
modulatory capacity of β-glucans from barley and oat. β-Glucans purified from different
barley and oat varieties and characterised with respect to compositional, molecular, structural
and rheological features [23] were tested for their ability to affect immune responses in DCs
stimulated with either LPS or the probiotic bacterium Lactobacillus acidophilus NCFM.
Material and methods
Beta-glucan materials and sample preparations
A total of 19 concentrated barley and oat mixed linkage β-glucan samples along with curdlan
(β-1,3), cellulose (β-1,4), lichenan (β-1,3; β-1,4) and yeast (β-1,3; β-1,6) reference β-glucans
were tested. Sample compositional, structural and rheological properties were analysed by
Mikkelsen et al. [23] and data are shown in Appendix A. Considerable variation in the β-
3
glucan structure of barley was found as compared to oat and low solubility of the barley β-
glucan samples was ascribed the relative higher proportion of cellotriosyl units in barley β-
glucans, which might form substructures consisting of longer repetitive cellotriosyl sequences
that are prone to aggregate. Especially, the large-scale extracted barley (Bm1-4 and B1-4) β-
glucans showed low solubility as compared to oat (O1-2) when using the AACC Total dietary
fibre Method 32-07 where soluble (SDF) and insoluble dietary fibre (IDF) fractionation is
based on filtration after β-glucan pre-solubilisation (35 min at 100°C). IDF is retained in the
filtrate whereas SDF is comprised in the supernatant.
A schematic overview of the various β-glucan preparations tested in the immune assay is
presented in Fig. 1. Dispensed β-glucan samples (1% v/w) were prepared from 20 mg sample
in 2 mL distilled water and stirred for 30 min at 25°C. Additionally, a pre-solubilisation
procedure was introduced to achieve standardised and fully dissolved β-glucans [23]. Solutions
(1% w/v) were prepared from 20 mg sample in 2 mL distilled water with continuous stirring
for 30 min at 80°C. The above corresponds to preparations used for experiment I. Furthermore,
a subset of samples (Bm2, O1 and OM) was fractionated into SDF and IDF fractions using the
AACC Method 32-07 until the filtration step. SDF and IDF preparations were tested in
experiment II as dissolved or dispensed samples. Finally, the dissolved SDF fractions were
either sedimented for 2 hours or centrifuged at 10,000 g to remove soluble aggregates and from
this either the top fraction or supernatant was tested in stimulated DCs, which correspond to
experiment III. All β-glucan samples were diluted × 30 prior to cell culturing.
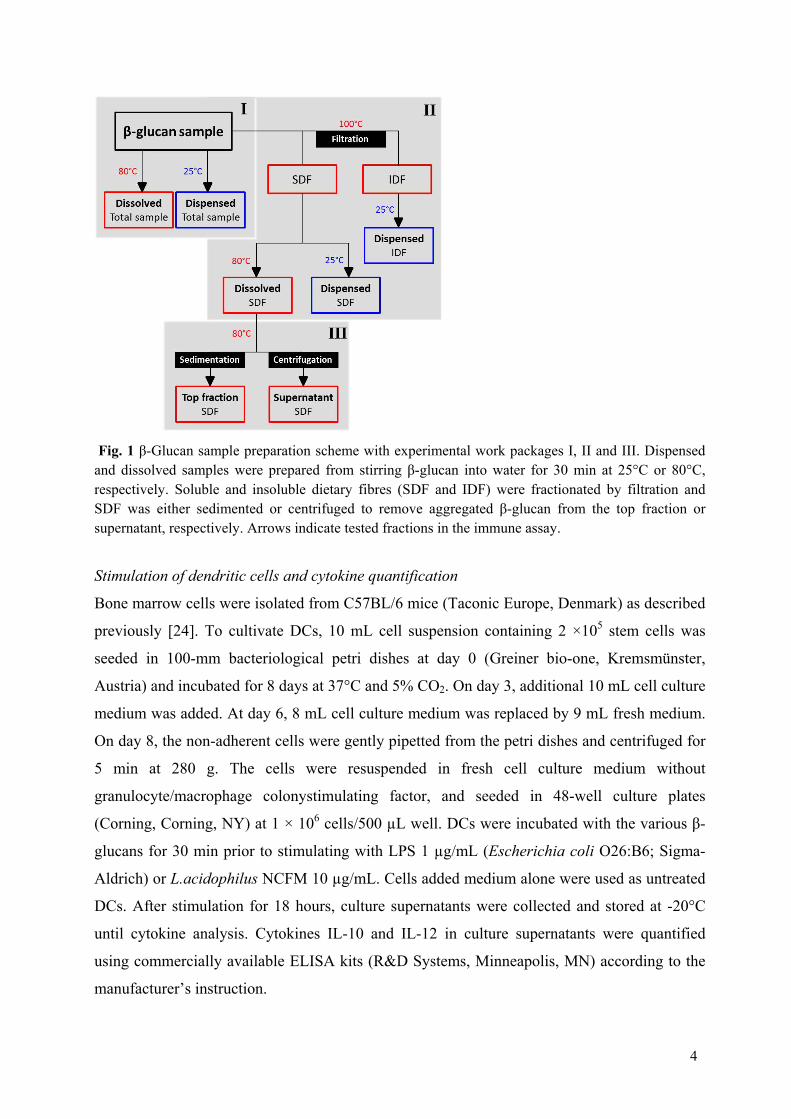
4
Fig. 1 β-Glucan sample preparation scheme with experimental work packages I, II and III. Dispensed and dissolved samples were prepared from stirring β-glucan into water for 30 min at 25°C or 80°C, respectively. Soluble and insoluble dietary fibres (SDF and IDF) were fractionated by filtration and SDF was either sedimented or centrifuged to remove aggregated β-glucan from the top fraction or supernatant, respectively. Arrows indicate tested fractions in the immune assay.
Stimulation of dendritic cells and cytokine quantification
Bone marrow cells were isolated from C57BL/6 mice (Taconic Europe, Denmark) as described
previously [24]. To cultivate DCs, 10 mL cell suspension containing 2 ×10⁵ stem cells was
seeded in 100-mm bacteriological petri dishes at day 0 (Greiner bio-one, Kremsmünster,
Austria) and incubated for 8 days at 37°C and 5% CO2. On day 3, additional 10 mL cell culture
medium was added. At day 6, 8 mL cell culture medium was replaced by 9 mL fresh medium.
On day 8, the non-adherent cells were gently pipetted from the petri dishes and centrifuged for
5 min at 280 g. The cells were resuspended in fresh cell culture medium without
granulocyte/macrophage colonystimulating factor, and seeded in 48-well culture plates
(Corning, Corning, NY) at 1 × 10⁶ cells/500 µL well. DCs were incubated with the various β-
glucans for 30 min prior to stimulating with LPS 1 µg/mL (Escherichia coli O26:B6; Sigma-
Aldrich) or L.acidophilus NCFM 10 µg/mL. Cells added medium alone were used as untreated
DCs. After stimulation for 18 hours, culture supernatants were collected and stored at -20°C
until cytokine analysis. Cytokines IL-10 and IL-12 in culture supernatants were quantified
using commercially available ELISA kits (R&D Systems, Minneapolis, MN) according to the
manufacturer’s instruction.
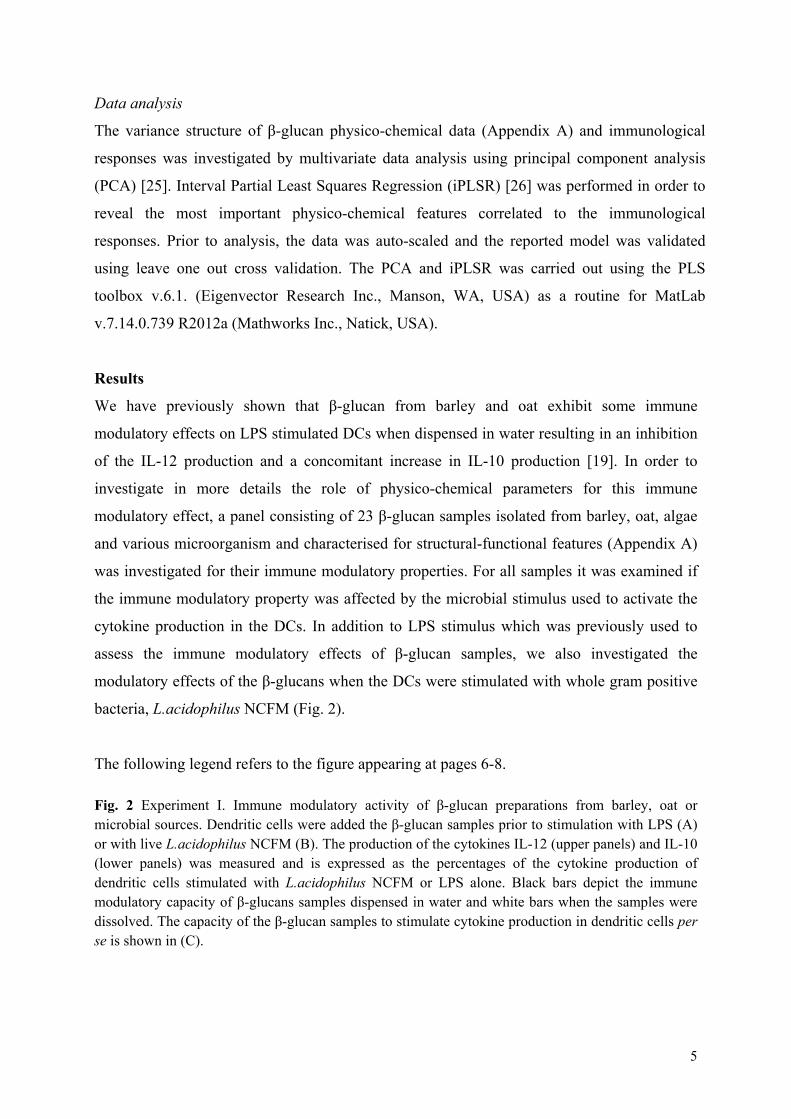
5
Data analysis
The variance structure of β-glucan physico-chemical data (Appendix A) and immunological
responses was investigated by multivariate data analysis using principal component analysis
(PCA) [25]. Interval Partial Least Squares Regression (iPLSR) [26] was performed in order to
reveal the most important physico-chemical features correlated to the immunological
responses. Prior to analysis, the data was auto-scaled and the reported model was validated
using leave one out cross validation. The PCA and iPLSR was carried out using the PLS
toolbox v.6.1. (Eigenvector Research Inc., Manson, WA, USA) as a routine for MatLab
v.7.14.0.739 R2012a (Mathworks Inc., Natick, USA).
Results
We have previously shown that β-glucan from barley and oat exhibit some immune
modulatory effects on LPS stimulated DCs when dispensed in water resulting in an inhibition
of the IL-12 production and a concomitant increase in IL-10 production [19]. In order to
investigate in more details the role of physico-chemical parameters for this immune
modulatory effect, a panel consisting of 23 β-glucan samples isolated from barley, oat, algae
and various microorganism and characterised for structural-functional features (Appendix A)
was investigated for their immune modulatory properties. For all samples it was examined if
the immune modulatory property was affected by the microbial stimulus used to activate the
cytokine production in the DCs. In addition to LPS stimulus which was previously used to
assess the immune modulatory effects of β-glucan samples, we also investigated the
modulatory effects of the β-glucans when the DCs were stimulated with whole gram positive
bacteria, L.acidophilus NCFM (Fig. 2).
The following legend refers to the figure appearing at pages 6-8. Fig. 2 Experiment I. Immune modulatory activity of β-glucan preparations from barley, oat or microbial sources. Dendritic cells were added the β-glucan samples prior to stimulation with LPS (A) or with live L.acidophilus NCFM (B). The production of the cytokines IL-12 (upper panels) and IL-10 (lower panels) was measured and is expressed as the percentages of the cytokine production of dendritic cells stimulated with L.acidophilus NCFM or LPS alone. Black bars depict the immune modulatory capacity of β-glucans samples dispensed in water and white bars when the samples were dissolved. The capacity of the β-glucan samples to stimulate cytokine production in dendritic cells per se is shown in (C).
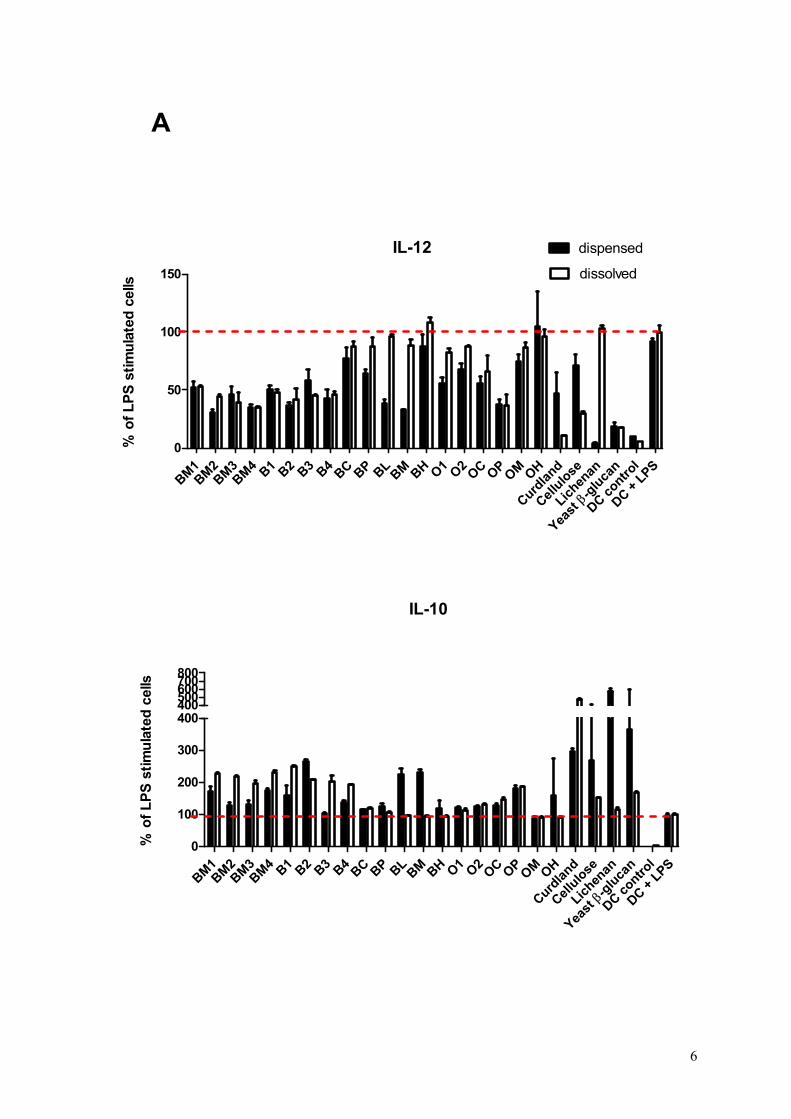
6
IL-12
BM1BM
2BM
3BM
4 B1 B2 B3 B4BC BP BL
BM BH O1 O2OC OP
OM OH
Curdla
nd
Cellu
lose
Lichen
an
-glu
can
Yeast
DC contro
l
DC + L
PS
0
50
100
150
dispensed
dissolved
% o
f L
PS
sti
mu
late
d c
ells
IL-10
BM1BM
2BM
3BM
4 B1 B2 B3 B4BC BP BL
BM BH O1 O2OC OP
OM OH
Curdla
nd
Cellu
lose
Lichen
an
-glu
can
Yeast
DC contro
l
DC + L
PS
0
100
200
300
400400500600700800
% o
f L
PS
sti
mu
late
d c
ells
A
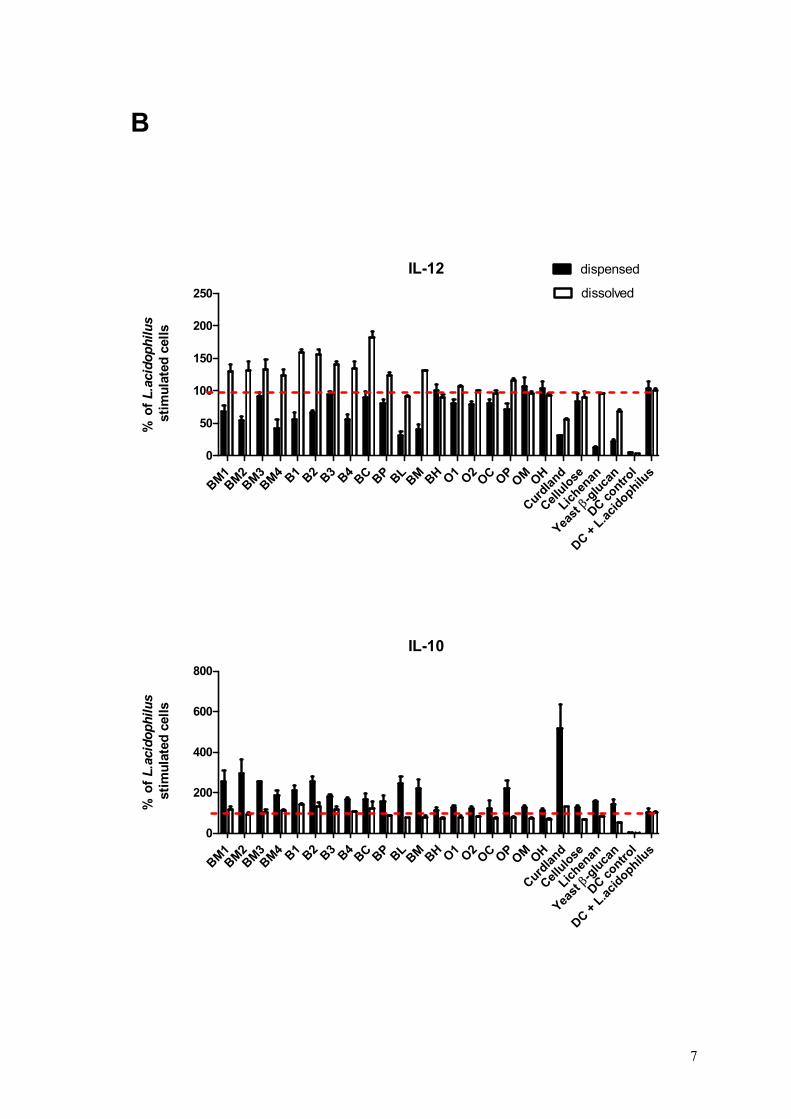
7
IL-12
BM1BM
2BM
3BM
4 B1 B2 B3 B4BC BP BL
BM BH O1 O2OC OP
OM OH
Curdla
nd
Cellu
lose
Lichen
an
-glu
can
Yeast
DC contro
l
DC + L
.aci
dophilus
0
50
100
150
200
250
dispensed
dissolved
% o
fL.acidophilus
sti
mu
late
d c
ells
IL-10
BM1BM
2BM
3BM
4 B1 B2 B3 B4BC BP BL
BM BH O1 O2OC OP
OM OH
Curdla
nd
Cellu
lose
Lichen
an
-glu
can
Yeast
DC contro
l
DC + L
.aci
dophilus
0
200
400
600
800
% o
fL.acidophilus
sti
mu
late
d c
ells
B
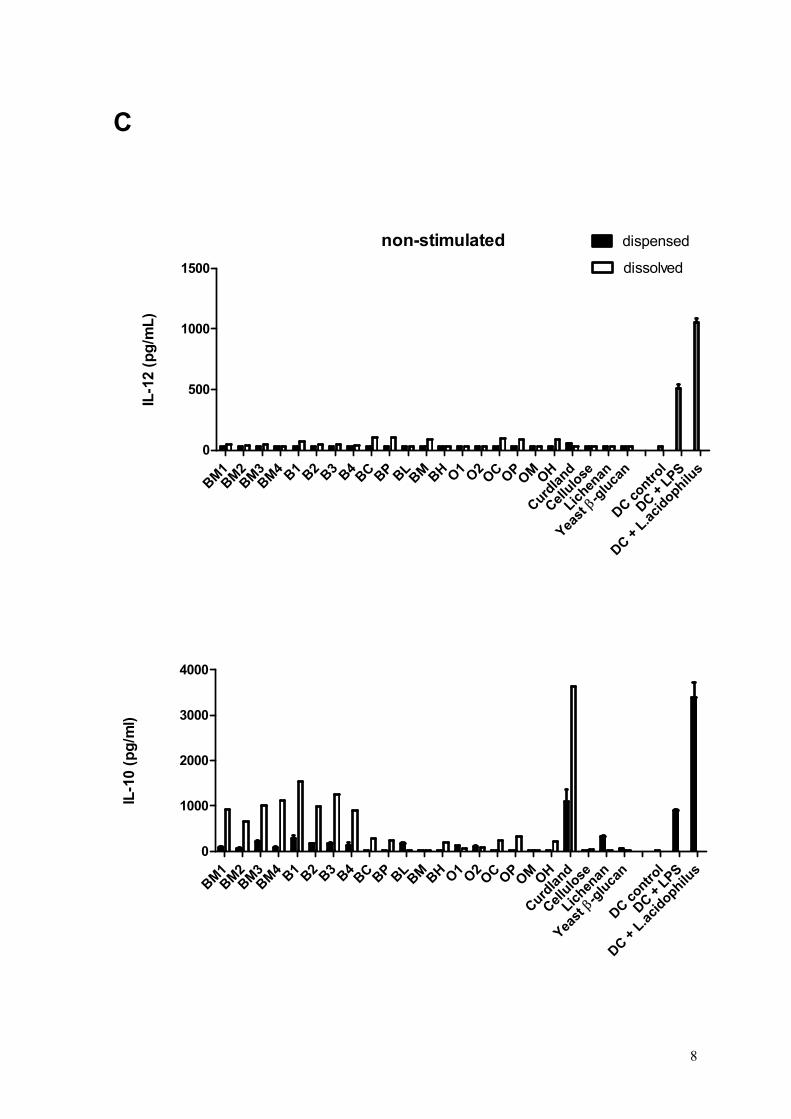
8
non-stimulated
BM1BM
2BM
3BM
4 B1 B2 B3 B4BC BP BL
BM BH O1 O2OC OP
OM OH
Curdla
nd
Cellu
lose
Lichen
an
-glu
can
Yeast
DC contro
l
DC + L
PS
DC + L
.aci
dophilus
0
500
1000
1500
dispensed
dissolved
IL-1
2 (p
g/m
L)
BM1BM
2BM
3BM
4 B1 B2 B3 B4BC BP BL
BM BH O1 O2OC OP
OM OH
Curdla
nd
Cellu
lose
Lichen
an
-glu
can
Yeast
DC contro
l
DC + L
PS
DC + L
.aci
dophilus
0
1000
2000
3000
4000
IL-1
0 (p
g/m
l)C
9
Effect of β-glucan preparation on immuno modulation
The procedure for preparation of the β-glucans for testing in the cellular system influenced the
modulatory capacity of the β-glucans in microbially stimulated DCs (Experiment I). All β-
glucan samples exhibited inhibitory activity on the LPS induced IL-12 production when
added in a water dispensed form. When added after being solubilised (80ºC for 30 min),
however, the IL-12 inhibitory capacity of some of the samples changed dramatically (Fig. 2A,
upper panel). Also, the solubilisation procedure had highly diverse effects on the different β-
glucans capacity to affect the LPS induced IL-10 production (Fig. 2A, lower panel). Pre-
solubilisation of β-glucans significantly increased the IL-10 production in cells treated with
Bm1-4 and B1-4 samples of low solubility suggesting an incomplete hydration of these fibres
in the dispensed samples. Highly soluble BL and BM samples along with cellulose, lichenan
and yeast β-glucans did not or only modestly affect the IL-10 production after the
standardised solubilisation as compared to their dispensed counterparts which might indicate
the presence of lumps or sediments as a source of variation in the dispensed samples. The
solubilisation procedure especially affected the modulatory capability of Bm1-4 and B1-4
barley samples in the L.acidophilus NCMF stimulated DCs (Fig. 2B). The IL-12 production
in cells treated with Bm1-4 and B1-4 β-glucans was inhibited by dispensed, however,
stimulated by dissolved samples and the significantly increased IL-10 production as an effect
of dispensed samples was almost eliminated in dissolved samples. In the PCA score plot on
the barley and oat β-glucan physico-chemical properties and immunological responses (Fig.
3A) a mismatch is observed between the modulatory capacities of the dispensed (blue) and
dissolved (red) samples as manifested by a non-systematic varying distance between replicate
samples. This indicates the importance of the standardised pre-solubilisation procedure
introduced to the dissolved samples for correct interpretation of β-glucan immune modulatory
functionality and further interpretation of the results will be founded on the dissolved
samples.
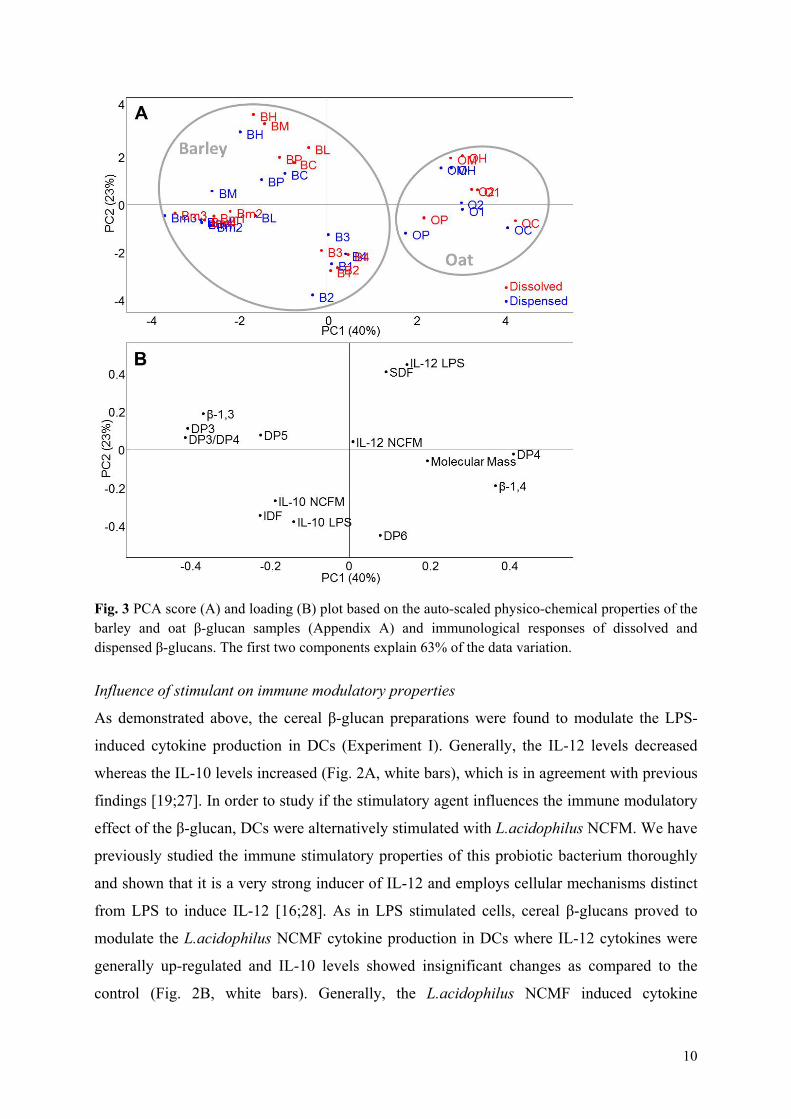
10
Fig. 3 PCA score (A) and loading (B) plot based on the auto-scaled physico-chemical properties of the barley and oat β-glucan samples (Appendix A) and immunological responses of dissolved and dispensed β-glucans. The first two components explain 63% of the data variation.
Influence of stimulant on immune modulatory properties
As demonstrated above, the cereal β-glucan preparations were found to modulate the LPS-
induced cytokine production in DCs (Experiment I). Generally, the IL-12 levels decreased
whereas the IL-10 levels increased (Fig. 2A, white bars), which is in agreement with previous
findings [19;27]. In order to study if the stimulatory agent influences the immune modulatory
effect of the β-glucan, DCs were alternatively stimulated with L.acidophilus NCFM. We have
previously studied the immune stimulatory properties of this probiotic bacterium thoroughly
and shown that it is a very strong inducer of IL-12 and employs cellular mechanisms distinct
from LPS to induce IL-12 [16;28]. As in LPS stimulated cells, cereal β-glucans proved to
modulate the L.acidophilus NCMF cytokine production in DCs where IL-12 cytokines were
generally up-regulated and IL-10 levels showed insignificant changes as compared to the
control (Fig. 2B, white bars). Generally, the L.acidophilus NCMF induced cytokine
11
production seemed to be more sensitive to the potential solution conformational differences of
dispensed and dissolved samples as exemplified by Bm and B samples. Figure 2C depicts the
immune stimulatory effects of the samples per se. Even though this revealed some
dependency as to whether the samples were dispensed or dissolved, overall the samples
except for curdlan showed no or only modest cytokine stimulatory capacities. Whereas none
of the dissolved samples were capable of inducing a IL-12 production above 100 pg/mL
(corresponding to less than 3 times the detection limit), Bm and B β-glucan samples induced
an IL-10 production corresponding to that induced by LPS (900 pg/mL) and curdlan induced
an IL-10 production slightly higher than that induced by L.acidophilus NCFM (3,300 pg/mL).
Effect of molecular structure, solubility and aggregation of β-glucans on modulatory capacity
The cereal β-glucan preparations generally exhibited great variability in their capacity to
modulate the LPS and L.acidophilus NCFM induced cytokine production in DCs (Experiment
I). This shows in the PCA score plot in Fig. 3 where barley and oat samples divide according
to crop type (Fig. 3.A) and inspection of the loading plot (Fig. 3.B) confirms that the main
variance among samples (PC1, 40%) can be ascribed to β-glucan block structural differences.
The immunological variables and solubility features of the different β-glucans are spanned
along PC2, explaining 23% of the systematic variance. The apparent correlation between
responses to different stimuli and β-glucan solubility was further investigated in a PCA
performed solely on data from the dissolved β-glucans. The combined score and loading plot
in Fig. 4 shows that the β-glucan samples are systematically distributed between the stimulant
and cytokine variables according to their content of insoluble fibres (PC1, 73%). Samples
Bm1-4 and B1-4, high in IDF, are located near IL-10 LPS, IL-10 NCFM and IL-12 NCFM
loadings corresponding to the up-regulating immune modulatory capacity of these samples.
The IL-12 LPS loading is located opposite to the other cytokine responses due to the
inhibitory activity of β-glucans on this cytokine.
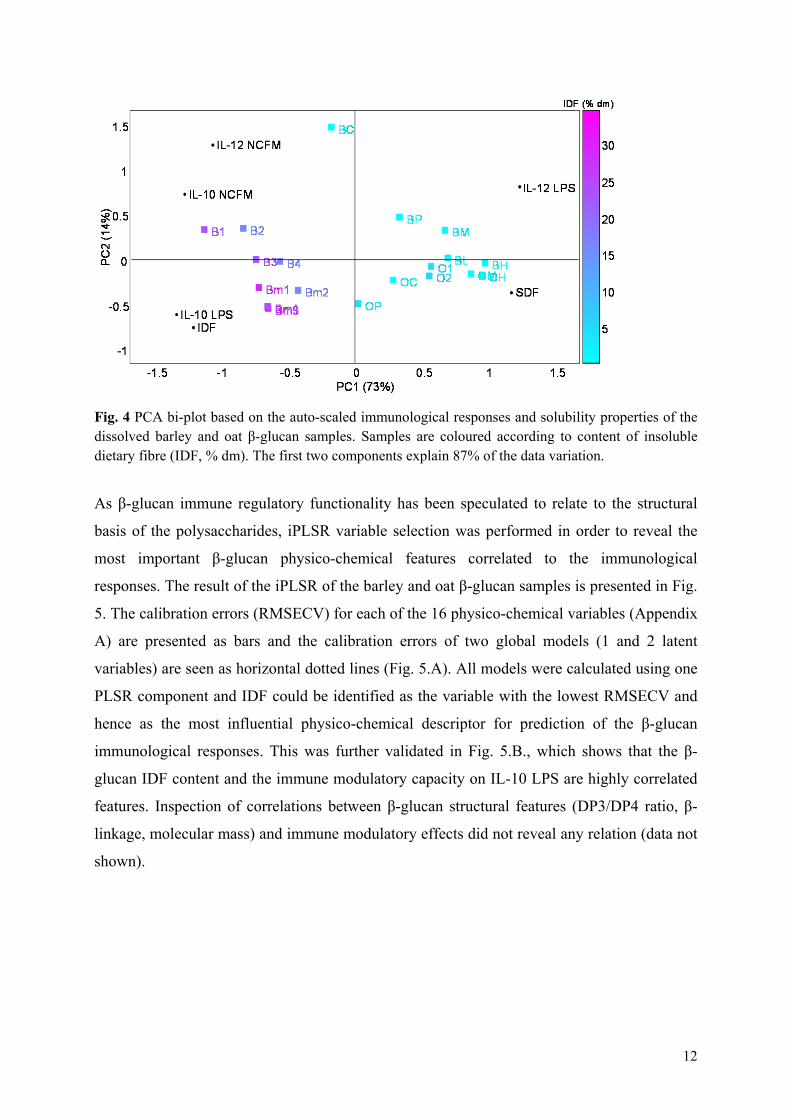
12
Fig. 4 PCA bi-plot based on the auto-scaled immunological responses and solubility properties of the dissolved barley and oat β-glucan samples. Samples are coloured according to content of insoluble dietary fibre (IDF, % dm). The first two components explain 87% of the data variation.
As β-glucan immune regulatory functionality has been speculated to relate to the structural
basis of the polysaccharides, iPLSR variable selection was performed in order to reveal the
most important β-glucan physico-chemical features correlated to the immunological
responses. The result of the iPLSR of the barley and oat β-glucan samples is presented in Fig.
5. The calibration errors (RMSECV) for each of the 16 physico-chemical variables (Appendix
A) are presented as bars and the calibration errors of two global models (1 and 2 latent
variables) are seen as horizontal dotted lines (Fig. 5.A). All models were calculated using one
PLSR component and IDF could be identified as the variable with the lowest RMSECV and
hence as the most influential physico-chemical descriptor for prediction of the β-glucan
immunological responses. This was further validated in Fig. 5.B., which shows that the β-
glucan IDF content and the immune modulatory capacity on IL-10 LPS are highly correlated
features. Inspection of correlations between β-glucan structural features (DP3/DP4 ratio, β-
linkage, molecular mass) and immune modulatory effects did not reveal any relation (data not
shown).
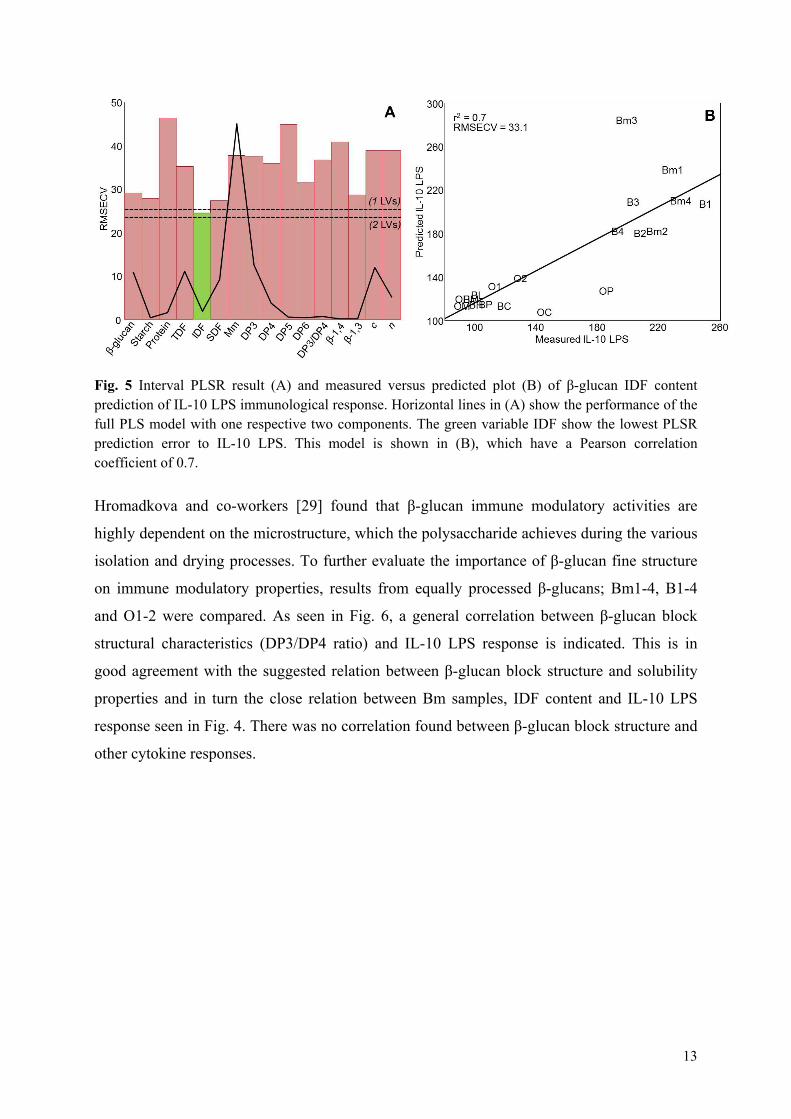
13
Fig. 5 Interval PLSR result (A) and measured versus predicted plot (B) of β-glucan IDF content prediction of IL-10 LPS immunological response. Horizontal lines in (A) show the performance of the full PLS model with one respective two components. The green variable IDF show the lowest PLSR prediction error to IL-10 LPS. This model is shown in (B), which have a Pearson correlation coefficient of 0.7.
Hromadkova and co-workers [29] found that β-glucan immune modulatory activities are
highly dependent on the microstructure, which the polysaccharide achieves during the various
isolation and drying processes. To further evaluate the importance of β-glucan fine structure
on immune modulatory properties, results from equally processed β-glucans; Bm1-4, B1-4
and O1-2 were compared. As seen in Fig. 6, a general correlation between β-glucan block
structural characteristics (DP3/DP4 ratio) and IL-10 LPS response is indicated. This is in
good agreement with the suggested relation between β-glucan block structure and solubility
properties and in turn the close relation between Bm samples, IDF content and IL-10 LPS
response seen in Fig. 4. There was no correlation found between β-glucan block structure and
other cytokine responses.
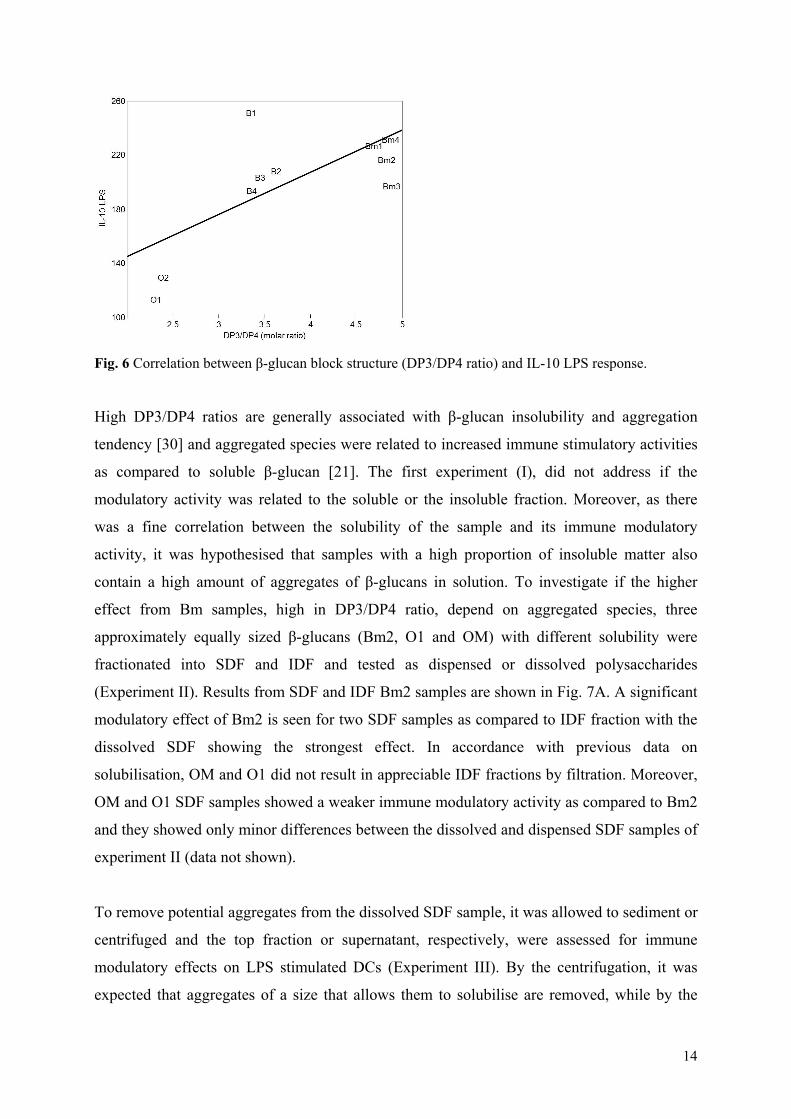
14
Fig. 6 Correlation between β-glucan block structure (DP3/DP4 ratio) and IL-10 LPS response.
High DP3/DP4 ratios are generally associated with β-glucan insolubility and aggregation
tendency [30] and aggregated species were related to increased immune stimulatory activities
as compared to soluble β-glucan [21]. The first experiment (I), did not address if the
modulatory activity was related to the soluble or the insoluble fraction. Moreover, as there
was a fine correlation between the solubility of the sample and its immune modulatory
activity, it was hypothesised that samples with a high proportion of insoluble matter also
contain a high amount of aggregates of β-glucans in solution. To investigate if the higher
effect from Bm samples, high in DP3/DP4 ratio, depend on aggregated species, three
approximately equally sized β-glucans (Bm2, O1 and OM) with different solubility were
fractionated into SDF and IDF and tested as dispensed or dissolved polysaccharides
(Experiment II). Results from SDF and IDF Bm2 samples are shown in Fig. 7A. A significant
modulatory effect of Bm2 is seen for two SDF samples as compared to IDF fraction with the
dissolved SDF showing the strongest effect. In accordance with previous data on
solubilisation, OM and O1 did not result in appreciable IDF fractions by filtration. Moreover,
OM and O1 SDF samples showed a weaker immune modulatory activity as compared to Bm2
and they showed only minor differences between the dissolved and dispensed SDF samples of
experiment II (data not shown).
To remove potential aggregates from the dissolved SDF sample, it was allowed to sediment or
centrifuged and the top fraction or supernatant, respectively, were assessed for immune
modulatory effects on LPS stimulated DCs (Experiment III). By the centrifugation, it was
expected that aggregates of a size that allows them to solubilise are removed, while by the
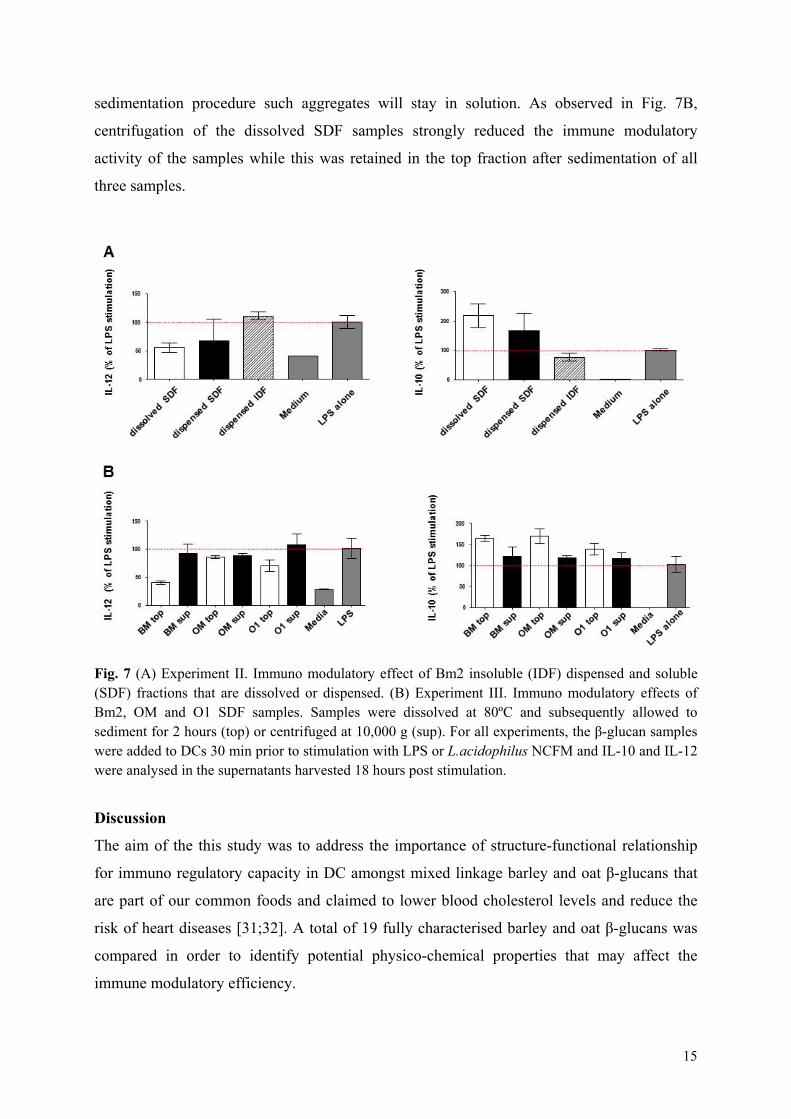
15
sedimentation procedure such aggregates will stay in solution. As observed in Fig. 7B,
centrifugation of the dissolved SDF samples strongly reduced the immune modulatory
activity of the samples while this was retained in the top fraction after sedimentation of all
three samples.
Fig. 7 (A) Experiment II. Immuno modulatory effect of Bm2 insoluble (IDF) dispensed and soluble (SDF) fractions that are dissolved or dispensed. (B) Experiment III. Immuno modulatory effects of Bm2, OM and O1 SDF samples. Samples were dissolved at 80ºC and subsequently allowed to sediment for 2 hours (top) or centrifuged at 10,000 g (sup). For all experiments, the β-glucan samples were added to DCs 30 min prior to stimulation with LPS or L.acidophilus NCFM and IL-10 and IL-12 were analysed in the supernatants harvested 18 hours post stimulation.
Discussion
The aim of the this study was to address the importance of structure-functional relationship
for immuno regulatory capacity in DC amongst mixed linkage barley and oat β-glucans that
are part of our common foods and claimed to lower blood cholesterol levels and reduce the
risk of heart diseases [31;32]. A total of 19 fully characterised barley and oat β-glucans was
compared in order to identify potential physico-chemical properties that may affect the
immune modulatory efficiency.
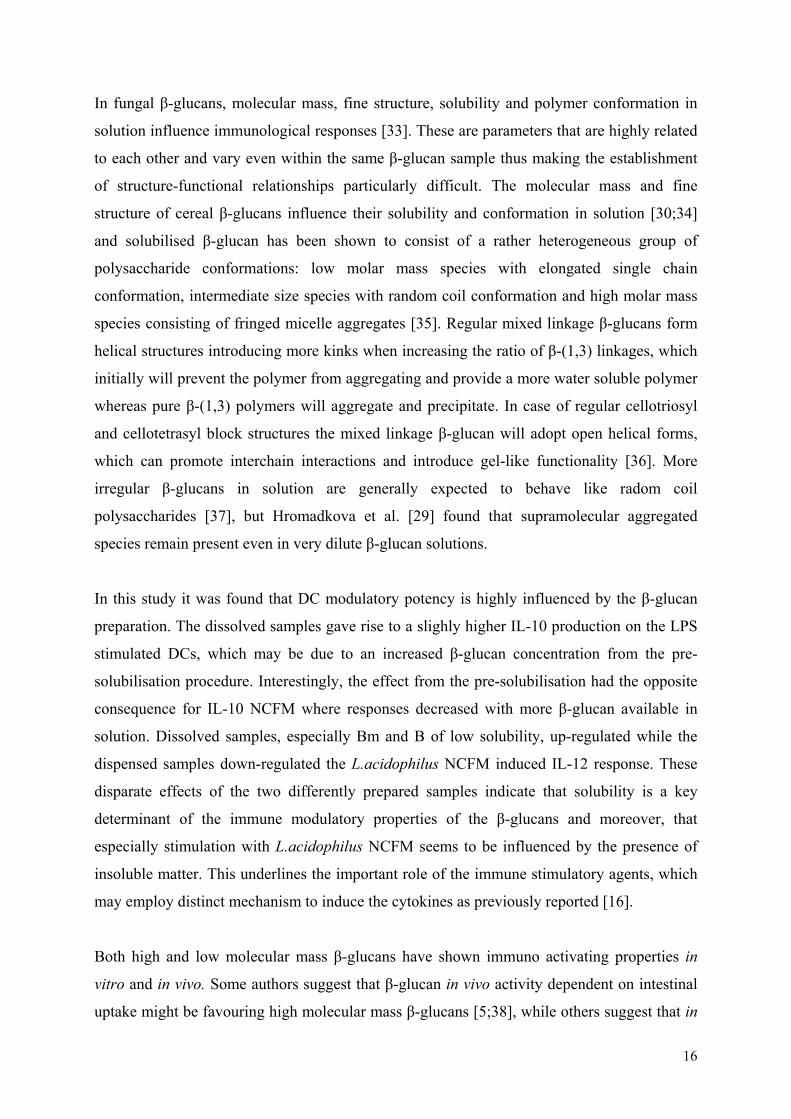
16
In fungal β-glucans, molecular mass, fine structure, solubility and polymer conformation in
solution influence immunological responses [33]. These are parameters that are highly related
to each other and vary even within the same β-glucan sample thus making the establishment
of structure-functional relationships particularly difficult. The molecular mass and fine
structure of cereal β-glucans influence their solubility and conformation in solution [30;34]
and solubilised β-glucan has been shown to consist of a rather heterogeneous group of
polysaccharide conformations: low molar mass species with elongated single chain
conformation, intermediate size species with random coil conformation and high molar mass
species consisting of fringed micelle aggregates [35]. Regular mixed linkage β-glucans form
helical structures introducing more kinks when increasing the ratio of β-(1,3) linkages, which
initially will prevent the polymer from aggregating and provide a more water soluble polymer
whereas pure β-(1,3) polymers will aggregate and precipitate. In case of regular cellotriosyl
and cellotetrasyl block structures the mixed linkage β-glucan will adopt open helical forms,
which can promote interchain interactions and introduce gel-like functionality [36]. More
irregular β-glucans in solution are generally expected to behave like radom coil
polysaccharides [37], but Hromadkova et al. [29] found that supramolecular aggregated
species remain present even in very dilute β-glucan solutions.
In this study it was found that DC modulatory potency is highly influenced by the β-glucan
preparation. The dissolved samples gave rise to a slighly higher IL-10 production on the LPS
stimulated DCs, which may be due to an increased β-glucan concentration from the pre-
solubilisation procedure. Interestingly, the effect from the pre-solubilisation had the opposite
consequence for IL-10 NCFM where responses decreased with more β-glucan available in
solution. Dissolved samples, especially Bm and B of low solubility, up-regulated while the
dispensed samples down-regulated the L.acidophilus NCFM induced IL-12 response. These
disparate effects of the two differently prepared samples indicate that solubility is a key
determinant of the immune modulatory properties of the β-glucans and moreover, that
especially stimulation with L.acidophilus NCFM seems to be influenced by the presence of
insoluble matter. This underlines the important role of the immune stimulatory agents, which
may employ distinct mechanism to induce the cytokines as previously reported [16].
Both high and low molecular mass β-glucans have shown immuno activating properties in
vitro and in vivo. Some authors suggest that β-glucan in vivo activity dependent on intestinal
uptake might be favouring high molecular mass β-glucans [5;38], while others suggest that in
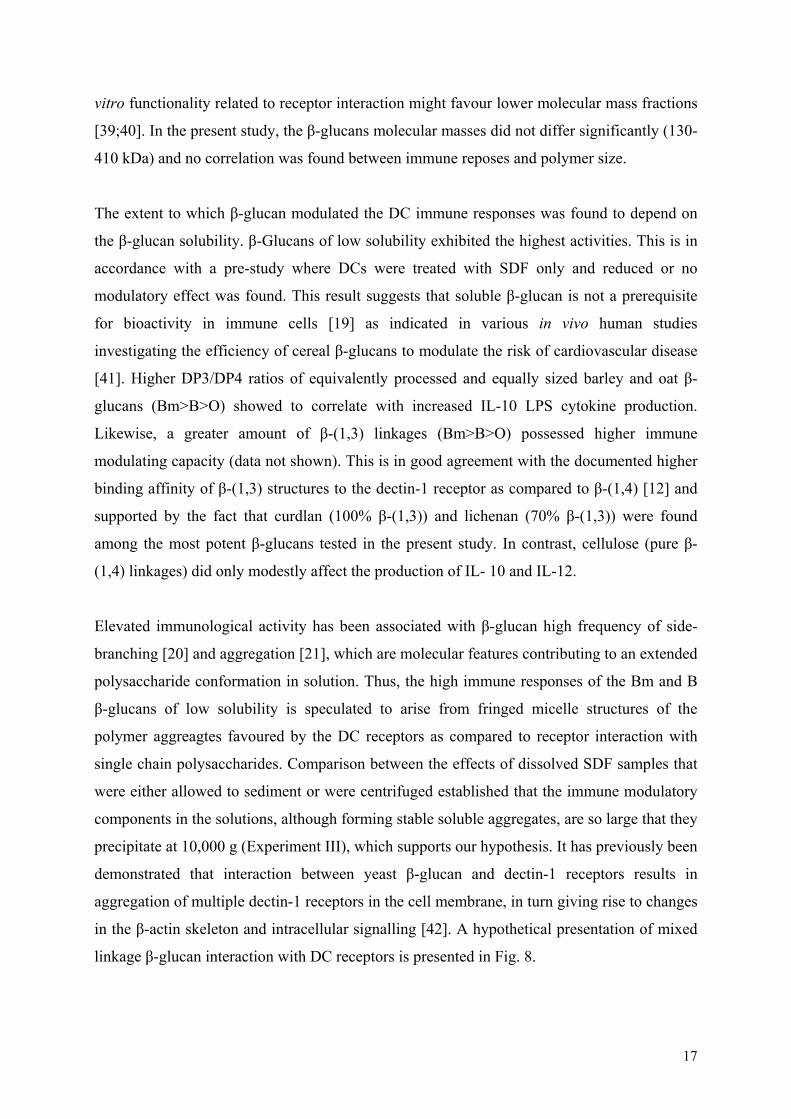
17
vitro functionality related to receptor interaction might favour lower molecular mass fractions
[39;40]. In the present study, the β-glucans molecular masses did not differ significantly (130-
410 kDa) and no correlation was found between immune reposes and polymer size.
The extent to which β-glucan modulated the DC immune responses was found to depend on
the β-glucan solubility. β-Glucans of low solubility exhibited the highest activities. This is in
accordance with a pre-study where DCs were treated with SDF only and reduced or no
modulatory effect was found. This result suggests that soluble β-glucan is not a prerequisite
for bioactivity in immune cells [19] as indicated in various in vivo human studies
investigating the efficiency of cereal β-glucans to modulate the risk of cardiovascular disease
[41]. Higher DP3/DP4 ratios of equivalently processed and equally sized barley and oat β-
glucans (Bm>B>O) showed to correlate with increased IL-10 LPS cytokine production.
Likewise, a greater amount of β-(1,3) linkages (Bm>B>O) possessed higher immune
modulating capacity (data not shown). This is in good agreement with the documented higher
binding affinity of β-(1,3) structures to the dectin-1 receptor as compared to β-(1,4) [12] and
supported by the fact that curdlan (100% β-(1,3)) and lichenan (70% β-(1,3)) were found
among the most potent β-glucans tested in the present study. In contrast, cellulose (pure β-
(1,4) linkages) did only modestly affect the production of IL- 10 and IL-12.
Elevated immunological activity has been associated with β-glucan high frequency of side-
branching [20] and aggregation [21], which are molecular features contributing to an extended
polysaccharide conformation in solution. Thus, the high immune responses of the Bm and B
β-glucans of low solubility is speculated to arise from fringed micelle structures of the
polymer aggreagtes favoured by the DC receptors as compared to receptor interaction with
single chain polysaccharides. Comparison between the effects of dissolved SDF samples that
were either allowed to sediment or were centrifuged established that the immune modulatory
components in the solutions, although forming stable soluble aggregates, are so large that they
precipitate at 10,000 g (Experiment III), which supports our hypothesis. It has previously been
demonstrated that interaction between yeast β-glucan and dectin-1 receptors results in
aggregation of multiple dectin-1 receptors in the cell membrane, in turn giving rise to changes
in the β-actin skeleton and intracellular signalling [42]. A hypothetical presentation of mixed
linkage β-glucan interaction with DC receptors is presented in Fig. 8.
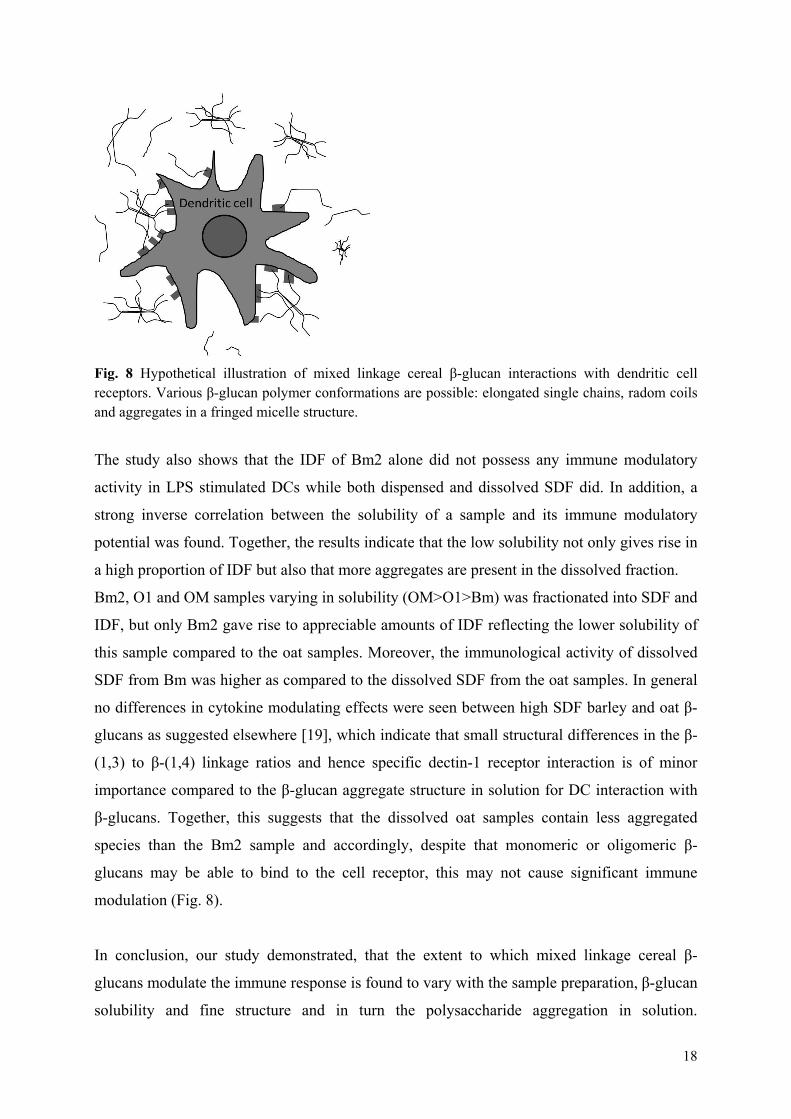
18
Fig. 8 Hypothetical illustration of mixed linkage cereal β-glucan interactions with dendritic cell receptors. Various β-glucan polymer conformations are possible: elongated single chains, radom coils and aggregates in a fringed micelle structure.
The study also shows that the IDF of Bm2 alone did not possess any immune modulatory
activity in LPS stimulated DCs while both dispensed and dissolved SDF did. In addition, a
strong inverse correlation between the solubility of a sample and its immune modulatory
potential was found. Together, the results indicate that the low solubility not only gives rise in
a high proportion of IDF but also that more aggregates are present in the dissolved fraction.
Bm2, O1 and OM samples varying in solubility (OM>O1>Bm) was fractionated into SDF and
IDF, but only Bm2 gave rise to appreciable amounts of IDF reflecting the lower solubility of
this sample compared to the oat samples. Moreover, the immunological activity of dissolved
SDF from Bm was higher as compared to the dissolved SDF from the oat samples. In general
no differences in cytokine modulating effects were seen between high SDF barley and oat β-
glucans as suggested elsewhere [19], which indicate that small structural differences in the β-
(1,3) to β-(1,4) linkage ratios and hence specific dectin-1 receptor interaction is of minor
importance compared to the β-glucan aggregate structure in solution for DC interaction with
β-glucans. Together, this suggests that the dissolved oat samples contain less aggregated
species than the Bm2 sample and accordingly, despite that monomeric or oligomeric β-
glucans may be able to bind to the cell receptor, this may not cause significant immune
modulation (Fig. 8).
In conclusion, our study demonstrated, that the extent to which mixed linkage cereal β-
glucans modulate the immune response is found to vary with the sample preparation, β-glucan
solubility and fine structure and in turn the polysaccharide aggregation in solution.
19
References
[1] Kendall CWC, Esfahani A, Jenkins DJA. The link between dietary fibre and human health. Food Hydrocoll. 2010, 24, 42-48.
[2] Anderson JW, Baird P, Davis RH, Ferreri S, Knudtson M, Koraym A, et al. Health benefits of dietary fiber. Nutr. Rev. 2009, 67, 188-205.
[3] Cloetens L, Ulmius M, Johansson-Persson A, Akesson B, Onning G. Role of dietary beta-glucans in the prevention of the metabolic syndrome. Nutr. Rev. 2012, 70, 444-458.
[4] Murphy EA, Davis JM, Carmichael MD. Immune modulating effects of beta-glucan. Curr. Opin Clin. Nutr. Metab. Care. 2010, 13, 656-661.
[5] Rieder A, Samuelsen AB. Do cereal mixed-linked beta-glucans possess immune-modulating activities? Mol. Nutr. Food Res. 2012, 56, 536-547.
[6] Manners DJ, Masson AJ, Patterso JC. Structure of a beta-(1→3)-D-glucan from yeast-cell walls. Biochem. J. 1973, 135, 19-30.
[7] Manners DJ, Masson AJ, Patterso JC, Bjorndal H, Lindberg B. Structure of a beta-(1→6)-D-glucan from yeast-cell walls. Biochem. J. 1973, 135, 31-36.
[8] Papageorgiou M, Lakhdara N, Lazaridou A, Biliaderis CG, Izydorczyk MS. Water extractable (1→3),(1→4)-beta-D-glucans from barley and oats: An intervarietal study on their structural features and rheological behaviour. J. Cereal Sci. 2005, 42, 213-224.
[9] Marchessault RH, Deslandes Y. Fine-Structure of (1→3)-Beta-D-glucans - curdlan and paramylon. Carbohydr. Res. 1979, 75, 231-242.
[10] Geijtenbeek TBH, Gringhuis SI. Signalling through C-type lectin receptors: shaping immune responses. Nature Rev. Immunol. 2009, 9, 465-479.
[11] t Hart BA, van Kooyk Y. Yin-Yang regulation of autoimmunity by DCs. Trends in Immunol. 2004, 25, 353-359.
[12] Brown GD, Gordon S. Immune recognition - A new receptor for beta-glucans. Nature. 2001, 413, 36-37.
[13] Brown GD. Dectin-1: a signalling non-TLR pattern-recognition receptor. Nature Rev. Immunol. 2006, 6, 33-43.
[14] Thornton BP, Vetvicka V, Pitman M, Goldman RC, Ross GD. Analysis of the sugar specificity and molecular location of the beta-glucan-binding lectin site of complement receptor type 3 (CD11b/CD18). J. Immunol. 1996, 156, 1235-1246.
[15] Banchereau J, Briere F, Caux C, Davoust J, Lebecque S, Liu YT, et al. Immunobiology of dendritic cells. Annu. Rev. Immunol. 2000, 18, 767-811.
20
[16] Weiss G, Maaetoft-Udsen K, Stifter SA, Hertzog P, Goriely S, Thomsen AR, et al. MyD88 drives the IFN-beta response to lactobacillus acidophilus in dendritic cells through a mechanism involving IRF1, IRF3, and IRF7. J. Immunol. 2012, 189, 2860-2868.
[17] Willment JA, Lin HH, Reid DM, Taylor PR, Williams DL, Wong SYC, et al. Dectin-1 expression and function are enhanced on alternatively activated and GM-CSF-treated macrophages and are negatively regulated by IL-10, dexamethasone, and lipopolysaccharide. J. Immunol. 2003, 171, 4569-4573.
[18] Wismar R, Brix S, Frokiaer H, Laerke HN. Dietary fibers as immunoregulatory compounds in health and disease. Ann. N.Y. Acad. Sci. 2010, 1190, 70-85.
[19] Wismar R, Brix S, Laerke HN, Frokiaer H. Comparative analysis of a large panel of non-starch polysaccharides reveals structures with selective regulatory properties in dendritic cells. Mol. Nutr. Food. Res. 2011, 55, 443-454.
[20] Adams EL, Rice PJ, Graves B, Ensley HE, Yu H, Brown GD, et al. Differential high-affinity interaction of dectin-1 with natural or synthetic glucans is dependent upon primary structure and is influenced by polymer chain length and side-chain branching. J. Pharmacol. Exp. Ther. 2008, 325, 115-123.
[21] Czop JK, Austen KF. Properties of glycans that activate the human alternative complement pathway and interact with the human monocyte beta-glucan receptor. J. Immunol. 1985, 135, 3388-3393.
[22] Samuelsen AB, Rieder A, Grimmer S, Michaelsen TE, Knutsen SH. Immunomodulatory activity of dietary fiber: Arabinoxylan and mixed-linked beta-glucan isolated from barley show modest activities in vitro. Int. J. Mol. Sci. 2011, 12, 570-587.
[23] Mikkelsen MS, Jespersen BM, Larsen FH, Blennow A, Engelsen SrB. Molecular structure of large-scale extracted beta-glucan from barley and oat: Identification of a significantly changed block structure in a high beta-glucan barley mutant. Food Chem. 2013, 136, 130-138.
[24] Christensen HR, Frokiaer H, Pestka JJ. Lactobacilli differentially modulate expression of cytokines and maturation surface markers in murine dendritic cells. J. Immunol. 2002, 168, 171-178.
[25] Wold S, Esbensen K, Geladi P. Principal Component Analysis. Chemomet. Intel. Lab. Sys. 1987, 2, 37-52.
[26] Nørgaard L, Saudland A, Wagner J, Nielsen JP, Munck L, Engelsen SB. Interval partial least-squares regression (iPLS): A comparative chemometric study with an example from near-infrared spectroscopy. App. Spectroscopy 2000, 54, 413-419.
[27] DeSmedt T, VanMechelen M, DeBecker G, Urbain J, Leo O, Moser M. Effect of interleukin-10 on dendritic cell maturation and function. Eur. J. Immunol. 1997, 27, 1229-1235.
21
[28] Zeuthen LH, Fink LN, Frokiaer H. Toll-like receptor 2 and nucleotide-binding oligomerization domain-2 play divergent roles in the recognition of gut-derived lactobacilli and bifidobacteria in dendritic cells. Immunol. 2008, 124, 489-502.
[29] Hromadkova Z, Ebringerova A, Sasinkova V, Sandula J, Hribalova V, Omelkova J. Influence of the drying method on the physical properties and immunomodulatory activity of the particulate (1→3)-beta-D-glucan from Saccharomyces cerevisiae. Carbohydr. Polym. 2003, 51, 9-15.
[30] Bohm N, Kulicke WM. Rheological studies of barley (1→3)(1→4)-beta-glucan in concentrated solution: mechanistic and kinetic investigation of the gel formation. Carbohydr. Res. 1999, 315, 302-311.
[31] EFSA, Panel on Dietetic Products,nutrition and allegies.. Scientific opinion on the substantiation of health claims related to beta-glucans and maintenance of normal blood cholesterol concentrations and maintenance or achievement of a normal body weight. EFSA J. 2009, 7, 1254.
[32] FDA, US Food and Drug Administration. Food labeling: Health claims, Soluble fiber from whole oats and risk of coronary heart disease. Federal Register. 1997, 62, 15343-15344.
[33] Bohn JA, BeMiller JN. (1→3)-beta-D-glucans as biological response modifiers: A review of structure-functional activity relationships. Carbohydr. Polym. 1995, 28, 3-14.
[34] Tosh SM, Brummer Y, Wood PJ, Wang Q, Weisz J. Evaluation of structure in the formation of gels by structurally diverse (1→3)(1→ 4)-beta-D-glucans from four cereal and one lichen species. Carbohydr. Polym. 2004, 57, 249-259.
[35] Hakansson A, Ulmius M, Nilsson L. Asymmetrical flow field-flow fractionation enables the characterization of molecular and supramolecular properties of cereal beta-glucan dispersions. Carbohydr. Polym. 2012, 87, 518-523.
[36] Christensen NJ, Hansen PI, Larsen FH, Folkerman T, Motawia MS, Engelsen SB. A combined nuclear magnetic resonance and molecular dynamics study of the two structural motifs for mixed-linkage beta-glucans: methyl beta-cellobioside and methyl beta-laminarabioside. Carbohydr. Res. 2010, 345, 474-486.
[37] Wood PJ. Relationships between solution properties of cereal beta-glucans and physiological effects - a review. Trends in Food Sci. Tech. 2004, 15(6), 313-320.
[38] Cheung NKV, Modak S, Vickers A, Knuckles B. Orally administered beta-glucans enhance anti-tumor effects of monoclonal antibodies. Cancer Immunol. Immunotherapy. 2002, 51, 557-564.
[39] Rieder A, Grimmer S, Kolset SO, Michaelsen TE, Knutsen SH. Cereal beta-glucan preparations of different weight average molecular weights induce variable cytokine secretion in human intestinal epithelial cell lines. Food Chem. 2011, 128, 1037-1043.
22
[40] Roubroeks JP, Skjak-Braek G, Ryan L, Christensen BE. Molecular weight dependency on the production of the TNF stimulated by fractions of rye (1→3),(1→4)-beta-D-glucan. Scand. J. Immunol. 2000, 52, 584-587.
[41] Theuwissen E, Mensink RP. Water-soluble dietary fibers and cardiovascular disease. Phys. & Behav. 2008, 94, 285-292.
[42] Goodridge HS, Reyes CN, Becker CA, Katsumoto TR, Ma J, Wolf AJ, et al. Activation of the innate immune receptor Dectin-1 upon formation of a 'phagocytic synapse'. Nature. 2011, 472, 471-541.
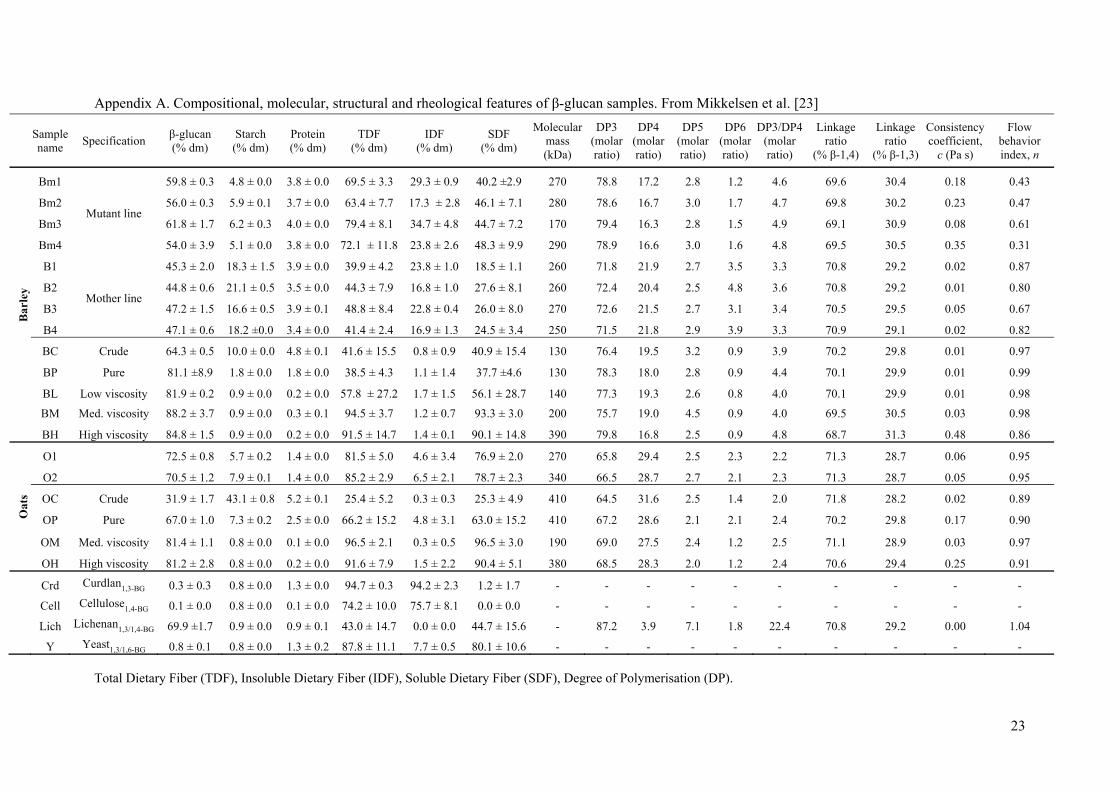
23
Appendix A. Compositional, molecular, structural and rheological features of β-glucan samples. From Mikkelsen et al. [23]
Sample name
Specification β-glucan (% dm)
Starch (% dm)
Protein (% dm)
TDF (% dm)
IDF (% dm)
SDF (% dm)
Molecular mass (kDa)
DP3 (molar ratio)
DP4 (molar ratio)
DP5 (molar ratio)
DP6 (molar ratio)
DP3/DP4 (molar ratio)
Linkage ratio
(% β-1,4)
Linkage ratio
(% β-1,3)
Consistency coefficient,
c (Pa s)
Flow behavior index, n
Bar
ley
Bm1
Mutant line
59.8 ± 0.3 4.8 ± 0.0 3.8 ± 0.0 69.5 ± 3.3 29.3 ± 0.9 40.2 ±2.9 270 78.8 17.2 2.8 1.2 4.6 69.6 30.4 0.18 0.43
Bm2 56.0 ± 0.3 5.9 ± 0.1 3.7 ± 0.0 63.4 ± 7.7 17.3 ± 2.8 46.1 ± 7.1 280 78.6 16.7 3.0 1.7 4.7 69.8 30.2 0.23 0.47
Bm3 61.8 ± 1.7 6.2 ± 0.3 4.0 ± 0.0 79.4 ± 8.1 34.7 ± 4.8 44.7 ± 7.2 170 79.4 16.3 2.8 1.5 4.9 69.1 30.9 0.08 0.61
Bm4 54.0 ± 3.9 5.1 ± 0.0 3.8 ± 0.0 72.1 ± 11.8 23.8 ± 2.6 48.3 ± 9.9 290 78.9 16.6 3.0 1.6 4.8 69.5 30.5 0.35 0.31
B1
Mother line
45.3 ± 2.0 18.3 ± 1.5 3.9 ± 0.0 39.9 ± 4.2 23.8 ± 1.0 18.5 ± 1.1 260 71.8 21.9 2.7 3.5 3.3 70.8 29.2 0.02 0.87
B2 44.8 ± 0.6 21.1 ± 0.5 3.5 ± 0.0 44.3 ± 7.9 16.8 ± 1.0 27.6 ± 8.1 260 72.4 20.4 2.5 4.8 3.6 70.8 29.2 0.01 0.80
B3 47.2 ± 1.5 16.6 ± 0.5 3.9 ± 0.1 48.8 ± 8.4 22.8 ± 0.4 26.0 ± 8.0 270 72.6 21.5 2.7 3.1 3.4 70.5 29.5 0.05 0.67
B4 47.1 ± 0.6 18.2 ±0.0 3.4 ± 0.0 41.4 ± 2.4 16.9 ± 1.3 24.5 ± 3.4 250 71.5 21.8 2.9 3.9 3.3 70.9 29.1 0.02 0.82
BC Crude 64.3 ± 0.5 10.0 ± 0.0 4.8 ± 0.1 41.6 ± 15.5 0.8 ± 0.9 40.9 ± 15.4 130 76.4 19.5 3.2 0.9 3.9 70.2 29.8 0.01 0.97
BP Pure 81.1 ±8.9 1.8 ± 0.0 1.8 ± 0.0 38.5 ± 4.3 1.1 ± 1.4 37.7 ±4.6 130 78.3 18.0 2.8 0.9 4.4 70.1 29.9 0.01 0.99
BL Low viscosity 81.9 ± 0.2 0.9 ± 0.0 0.2 ± 0.0 57.8 ± 27.2 1.7 ± 1.5 56.1 ± 28.7 140 77.3 19.3 2.6 0.8 4.0 70.1 29.9 0.01 0.98
BM Med. viscosity 88.2 ± 3.7 0.9 ± 0.0 0.3 ± 0.1 94.5 ± 3.7 1.2 ± 0.7 93.3 ± 3.0 200 75.7 19.0 4.5 0.9 4.0 69.5 30.5 0.03 0.98
BH High viscosity 84.8 ± 1.5 0.9 ± 0.0 0.2 ± 0.0 91.5 ± 14.7 1.4 ± 0.1 90.1 ± 14.8 390 79.8 16.8 2.5 0.9 4.8 68.7 31.3 0.48 0.86
Oat
s
O1 72.5 ± 0.8 5.7 ± 0.2 1.4 ± 0.0 81.5 ± 5.0 4.6 ± 3.4 76.9 ± 2.0 270 65.8 29.4 2.5 2.3 2.2 71.3 28.7 0.06 0.95
O2 70.5 ± 1.2 7.9 ± 0.1 1.4 ± 0.0 85.2 ± 2.9 6.5 ± 2.1 78.7 ± 2.3 340 66.5 28.7 2.7 2.1 2.3 71.3 28.7 0.05 0.95
OC Crude 31.9 ± 1.7 43.1 ± 0.8 5.2 ± 0.1 25.4 ± 5.2 0.3 ± 0.3 25.3 ± 4.9 410 64.5 31.6 2.5 1.4 2.0 71.8 28.2 0.02 0.89
OP Pure 67.0 ± 1.0 7.3 ± 0.2 2.5 ± 0.0 66.2 ± 15.2 4.8 ± 3.1 63.0 ± 15.2 410 67.2 28.6 2.1 2.1 2.4 70.2 29.8 0.17 0.90
OM Med. viscosity 81.4 ± 1.1 0.8 ± 0.0 0.1 ± 0.0 96.5 ± 2.1 0.3 ± 0.5 96.5 ± 3.0 190 69.0 27.5 2.4 1.2 2.5 71.1 28.9 0.03 0.97
OH High viscosity 81.2 ± 2.8 0.8 ± 0.0 0.2 ± 0.0 91.6 ± 7.9 1.5 ± 2.2 90.4 ± 5.1 380 68.5 28.3 2.0 1.2 2.4 70.6 29.4 0.25 0.91
Crd Curdlan1,3-BG
0.3 ± 0.3 0.8 ± 0.0 1.3 ± 0.0 94.7 ± 0.3 94.2 ± 2.3 1.2 ± 1.7 - - - - - - - - - -
Cell Cellulose1,4-BG
0.1 ± 0.0 0.8 ± 0.0 0.1 ± 0.0 74.2 ± 10.0 75.7 ± 8.1 0.0 ± 0.0 - - - - - - - - - -
Lich Lichenan1,3/1,4-BG
69.9 ±1.7 0.9 ± 0.0 0.9 ± 0.1 43.0 ± 14.7 0.0 ± 0.0 44.7 ± 15.6 - 87.2 3.9 7.1 1.8 22.4 70.8 29.2 0.00 1.04
Y Yeast1,3/1,6-BG
0.8 ± 0.1 0.8 ± 0.0 1.3 ± 0.2 87.8 ± 11.1 7.7 ± 0.5 80.1 ± 10.6 - - - - - - - - - -
Total Dietary Fiber (TDF), Insoluble Dietary Fiber (IDF), Soluble Dietary Fiber (SDF), Degree of Polymerisation (DP).
Paper V
Ibrügger S, Kristensen M, Poulsen MW, Mikkelsen MS, Ejsing J, Knudsen KEB,
Jespersen BM, Dragsted LO, Engelsen SE, Bügel S
Effect of oat and barley β-glucans on cholesterol metabolism in
young healthy adults: a randomized controlled trial
Journal of Nutrition, 2012, Submitted
Effect of oat and barley β-glucans on cholesterol metabolism in young
healthy adults: a randomized controlled trial
Sabine Ibrügger1, Mette Kristensen1*, Malene Wibe Poulsen1, Mette Skau Mikkelsen2, Johnny Ejsing1,
Knud Erik Bach Knudsen3, Birthe Møller Jespersen2, Lars Ove Dragsted1, Søren Balling Engelsen2,
Susanne Bügel1
1Department of Human Nutrition, Faculty of Life Sciences, University of Copenhagen, Denmark; 2Quality &
Technology, Department of Food Science, Faculty of Life Sciences, University of Copenhagen, Denmark; 3Department of Animal Science, Aarhus University, Denmark.
*Corresponding author: Mette Kristensen, PhD; Tel: +45 3533 3536; Fax: +45 3533 2483; E-mail:
ABSTRACT
Background β-glucans are known to exhibit hypocholesterolemic effects. Increased intestinal
viscosity, as a function of β-glucan concentration and molecular mass, may be crucial for cholesterol-
lowering effect. Structural differences, including the ratio of (1→3) to (1→4) glucan bonds (DP3:DP4
ratio) between β-glucans, may also be of importance for β-glucan functionality. Objective This work
investigates the effects of three different β-glucan sources on blood lipids and fecal endpoints. Design
Fourteen participants (8F/6M) completed this randomized, crossover, single-blinded study with four 3-
wk periods with 3.3g/d of fibers: control and oat, barley, and barley mutant β-glucan of similar
molecular mass. Before and after each period fasting and postprandial blood samples were drawn and
3-d fecal collections were made. Results No effect of treatment was observed for changes in total,
LDL, and HDL cholesterol compared to control; however, consumption of 3.3g oat β-glucans for three
weeks resulted in lower total (-0.29±0.09mmol/L; P<0.01), LDL (-0.23±0.07mmol/L, P<0.01), and
HDL cholesterol (-0.05±0.0.3mmol/L, P<0.05) compared to baseline. No relationship between the β-
glucan structure (DP3:DP4) and changes in LDL cholesterol could be established. Overall, treatment
affected changes in fasting triacylglycerol (P=0.05) as well as total SCFA and acetate (P<0.01). Fecal
dry and wet weight, stool frequency, fecal pH and energy excretion was not affected. Conclusions The
results do not fully support the hypocholesterolemic effects by differently structured oat and barley β-
glucans. However, a greater potential was observed for oat β-glucan, presumably due to higher
solubility and viscosity. This underlines the importance of elusive structural β-glucan features for
beneficial physiological effects.
This trial was registered at www.clinicaltrial.gov as NCT 01317264. The study was carried out as a part of the research program of the UNIK: Food, Fitness & Pharma for Health and Disease. The UNIK project is supported by the Danish Ministry of Science, Technology and Innovation. The study was also supported by the strategic research program “BEST” at Faculty of Science, University of Copenhagen. Denmark. All authors declared no conflict of interest.
1
INTRODUCTION
Dietary fibers have been recognized for their positive effects on health for a long time (1).
Observational studies have shown an association between dietary fiber intake and a reduced
risk for the development of cardiovascular diseases (CVD) (2). This is partly due to their
hypocholesterolemic properties, observed especially for soluble dietary fibers(3), as high
serum cholesterol concentration represents a major cardiovascular risk factor and cholesterol
reduction is a target in the management of CVD risk (4).
In a meta-analysis by Brown et al. it was shown that oat products lower LDL cholesterol by
0.037 mmol/ L per gram of soluble fiber; however, the included studies constitute a
heterogeneous group of studies in terms of both study design and intervention product
characteristics (3). Molecular mass (MM) and molecular structure of the β-glucan are
assumed to be the most important determinants of physico-chemical properties, which in turn
influence their physiological impact following consumption. Thus, differences in MM and
structural characteristics constitute the most likely reason for the successful cholesterol
lowering seen in some human intervention studies and the lack of effect in other studies on
oat and barley β-glucans (5;6).
Both oat and barley are rich sources of soluble (1→3), (1→4)-β-D-glucan (β-glucan), a linear,
non-starch polysaccharide consisting of about 70% of 1-4-O-linked and 30% 1-3-O-linked β-
D-glucopyranosyl units (7). The polymer chain is composed of 85 - 90% of cellotriosyl and
cellotetraosyl units connected by β-D-(1→3) linkages (7). The relative proportion of
cellotriosyl and cellotetrasyl units is also referred to as the DP3:DP4 ratio (8), which differs
between cereal genera as well as genotypes of the same genera and is considered a
‘fingerprint’ of the individual β-glucans (8). Generally, β-glucans derived from oat have been
reported to exhibit smaller DP3:DP4 ratios (1.5 – 2.3) than those derived from barley (1.8 –
3.5) (8).
The primary aim of the present study was to relate structural characteristics of three β-glucans
from oat and barley, but of similar MM (9), with cholesterol-lowering properties. Secondly,
we report differences between the three β-glucans on blood pressure, body weight, and
concentrations of triacylglycerol and plasma short chain fatty acid (SCFA) as well as fecal
output, dry matter, fecal pH and energy excretion. Results on appetite regulation, tolerability,
2
insulin and glucose metabolism, product palatability, and plasma and urine metabolomics will
be reported elsewhere.
SUBJECTS AND METHODS
Study subjects
Sixteen young adults were recruited through advertising at university campuses in the
Copenhagen area. The exclusion criteria were as follows: known chronic illnesses (such as
diabetes, hypertension, hyperlipidemia), smoking, excessive physical activity (>10h/wk),
regular use of medication (oral contraceptives were allowed), use of dietary supplements, and
food intolerances relevant to the protocol. All study subjects gave written consent after having
received verbal and written information about the study. The study was carried out at the
Department of Human Nutrition, Faculty of Science, University of Copenhagen, Denmark,
and was approved by the Municipal Ethical Committee of The Capital Region of Denmark in
accordance with the Helsinki declaration (H-4-2009-111) and registered in the database at
http://www.clinicaltrials.gov (NCT 01317264).
Randomization and concealment
Subjects were randomly assigned to the order of the four treatments by simple randomization
generated by a computer. Treatment assignment was done by a person (MK) not involved
with the study subjects and assigned in the order of the day of enrolment. The subjects were
instructed not to discuss the product appearance with the study staff to prevent un-blinding of
the outcome assessors.
Study design
The study was designed as a single-blind randomized crossover trial examining four different
intervention products during four 3-wk dietary intervention periods, which were separated by
2 weeks washout. The study was performed at the Department of Human Nutrition at the
University of Copenhagen. During each of the four intervention periods, the subjects
consumed both a beverage and a serving of yoghurt with/without added β-glucan derived
from the three different sources. Participants did not know which study product they received.
They were instructed to consume each serving of β-glucan with a meal. The study subjects
received freshly prepared products twice weekly. Aside from the two daily doses of
intervention products, they consumed their habitual diet and were asked to maintain their
habitual activity level throughout the study. Further, they were instructed to abstain from oat
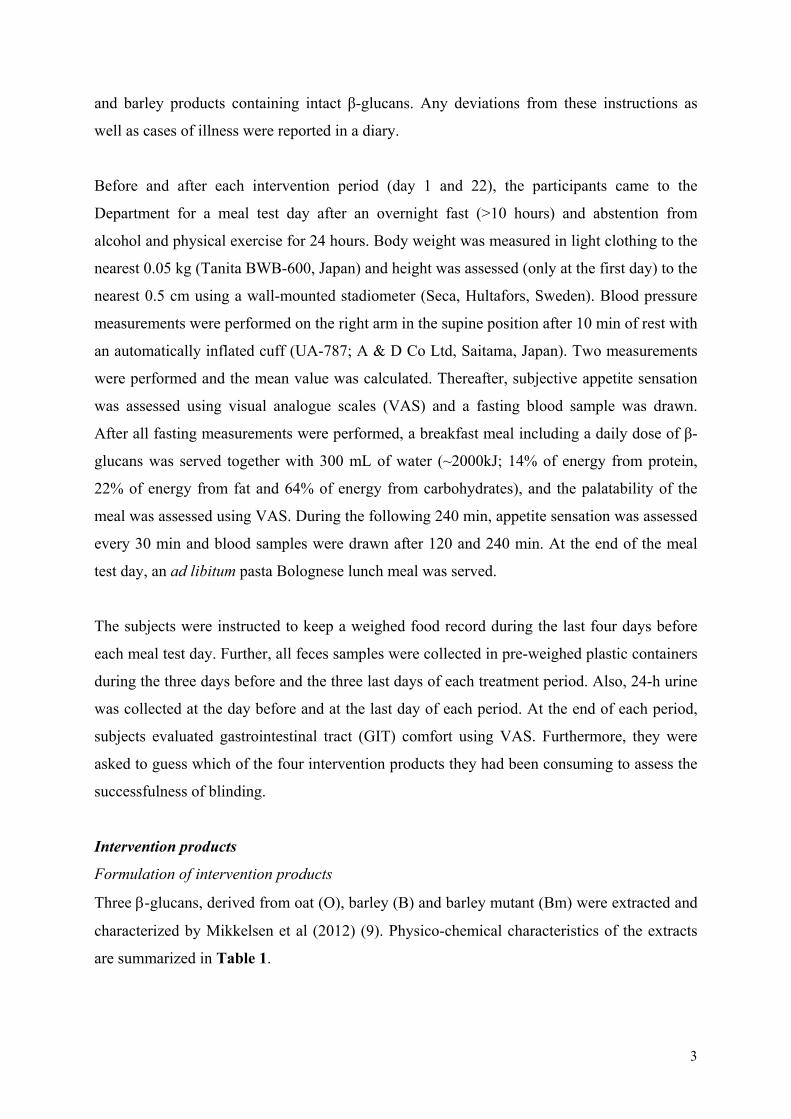
3
and barley products containing intact β-glucans. Any deviations from these instructions as
well as cases of illness were reported in a diary.
Before and after each intervention period (day 1 and 22), the participants came to the
Department for a meal test day after an overnight fast (>10 hours) and abstention from
alcohol and physical exercise for 24 hours. Body weight was measured in light clothing to the
nearest 0.05 kg (Tanita BWB-600, Japan) and height was assessed (only at the first day) to the
nearest 0.5 cm using a wall-mounted stadiometer (Seca, Hultafors, Sweden). Blood pressure
measurements were performed on the right arm in the supine position after 10 min of rest with
an automatically inflated cuff (UA-787; A & D Co Ltd, Saitama, Japan). Two measurements
were performed and the mean value was calculated. Thereafter, subjective appetite sensation
was assessed using visual analogue scales (VAS) and a fasting blood sample was drawn.
After all fasting measurements were performed, a breakfast meal including a daily dose of β-
glucans was served together with 300 mL of water (~2000kJ; 14% of energy from protein,
22% of energy from fat and 64% of energy from carbohydrates), and the palatability of the
meal was assessed using VAS. During the following 240 min, appetite sensation was assessed
every 30 min and blood samples were drawn after 120 and 240 min. At the end of the meal
test day, an ad libitum pasta Bolognese lunch meal was served.
The subjects were instructed to keep a weighed food record during the last four days before
each meal test day. Further, all feces samples were collected in pre-weighed plastic containers
during the three days before and the three last days of each treatment period. Also, 24-h urine
was collected at the day before and at the last day of each period. At the end of each period,
subjects evaluated gastrointestinal tract (GIT) comfort using VAS. Furthermore, they were
asked to guess which of the four intervention products they had been consuming to assess the
successfulness of blinding.
Intervention products
Formulation of intervention products
Three -glucans, derived from oat (O), barley (B) and barley mutant (Bm) were extracted and
characterized by Mikkelsen et al (2012) (9). Physico-chemical characteristics of the extracts
are summarized in Table 1.
4
Table 1 Compositional and structural features of the β-glucan extracts and composition of the daily administered intervention product1 C O B Bm β-glucan extract characteristics β-glucan (% dm) - 72 46 58 TDF (% dm) - 83 44 71 IDF (% dm) - 6 20 26 SDF (% dm) - 78 24 45 Molecular mass (kDa) - 305 260 280 DP3/DP4 (molar ratio) - 2.3 3.5 4.7 Daily dose of intervention product β-glucan (g/d) - 3.3 3.3 3.3 TDF (g/d) - 3.8 3.2 4.0 IDF (g/d) - 0.3 1.4 1.5 SDF(g(d) - 3.6 1.7 2.6 1 DP3/DP4 = ratio between cellotriosyl and cellotetraosyl oligomer units in the β-glucan chain, IDF = insoluble dietary fiber, SDF = soluble dietary fiber, TDF = total dietary fiber.
Fresh 2% (w/v) β-glucan solutions were prepared from the dry β-glucan extracts by stirring
for 30 min at 80˚C to secure proper hydration of the fibers. The fresh solutions were then
mixed into a beverage with blackcurrant syrup (Minimum®) and low-fat vanilla yoghurt
(Arla Cheasy®) with a total content of 1.65g β-glucan in each preparation, corresponding to a
daily dose of 3.3g of β-glucan. All four beverage preparations had an equal total volume of
250 mL whereas the volume of the vanilla yoghurt preparation ranged from 100-174 mL, as
different amounts of β-glucan extract was added to 100 mL of yoghurt (Table 1).
Viscosity of intervention products
Viscosity measurements of the pure β-glucan solutions and the prepared intervention products
were performed with a StressTech rheometer (Reologica Instruments AB, Sweden) using a
cup (26.0 mm) and bob (25.0 mm) geometry over a shear rate range of 1-100 s-1 and
temperatures of 10 and 37˚C. The viscosity behavior was approximated with a consistency
coefficient c (related to viscosity, Pas) and flow behavior index n from the Power Law model
as SS = c SRn, where SS (Pa) is shear stress and SR (s-1) is shear rate. True replicate
measurements of β-glucan drink and yoghurt intervention products, control samples, and pure
β-glucan solutions were performed in separate weeks throughout the intervention period.
Intervention product stability over time, i.e. viscosity and flow behavior, was monitored over
a 4-d period corresponding to the time that test persons stored the products in their
refrigerators. Prior to the measurements the intervention products were shaken according to
the procedure the subjects were instructed to apply before consumption of the products.
5
Dietary intake assessment
All recorded foods and energy-containing beverages were entered into the Dankost 3000
dietary assessment software (Dankost 3000, version 2.5, Danish Catering Center, Herlev,
Denmark) and mean total intake of energy, fat, carbohydrates, protein, alcohol and total
dietary fiber was calculated for each 4-d registration period.
Analytical procedures
Blood samples
Fasting concentrations of serum total, and LDL cholesterol and both fasting and postprandial
plasma triacylglycerol were assessed using colorimetric test kits (Roche TG, Roche
Diagnostics GmbH, Mannheim, Germany); intra-assay variations were 0.6% and 0.9%,
respectively. Serum HDL-cholesterol was measured using a homogeneous enzymatic
colorimetric test kits (Roche HDL-C plus 2nd generation, Roche Diagnostics GmbH,
Mannheim, Germany); intra-assay variations were 1.8%. All analyses were performed on a
COBAS MIRA Plus (Roche Diagnostic Systems Inc., Mannheim, Germany). Plasma was
analyzed for SCFA (total SCFA, acetate, propionate, and butyrate) essentially as described by
Brighenti et al. (1998) using 2-ethyl butyrate (Fluka No. 03190; Sigma Aldrich, St. Louis,
MO), rather than isovaleric acid, as an internal standard (10).
Fecal endpoints
All fecal samples were weighed and the mean wet weight of the 3-day collection period was
calculated. One fecal sample from each subject in each 3-d collection period was mixed with
demineralized water (1:1) and homogenized for measurement of pH (PH-208, Lutron
Electronic Enterprise CO., Taipei, Taiwan). All fecal samples were freeze-dried, weighed, and
homogenized. For each subject, all samples of each 3-day collection period were pooled.
Fecal energy was measured by bomb calorimetry (Ika-calorimeter system C4000;
Heitersheim, Germany).
Sample size
The number of study participants was based on a power calculation of two previous
intervention studies on the effect of dietary fibers on fasting total cholesterol concentrations
conducted in our laboratory (11;12). Here, the change in total cholesterol differed from
control by -0.3 and -0.5 mmol/L, respectively, with corresponding standardized differences of
0.39 and 0.48 mmol/L. A total of 14 study subjects needed to complete the study in order to
6
have sufficient power (α=0.05; =0.20) to detect a 0.4 mmol/L difference with a standardized
difference of 0.5 mmol/L. In total, 16 subjects were recruited for the study to allow for a 10 %
dropout.
Calculations and statistical analysis
The area under the curve (AUC) for triacylglycerol was calculated using the trapezoidal
method. Energy digestibility was calculated as mean daily energy excreted based on the 3-d
fecal collection divided by mean energy intake based on the 4-d weighed food record
multiplied by 100.
All statistical analyses and calculations were performed using Data Analysis and Statistical
Software, release 11 (StataCorp LP, College Station, TX, USA). All dependent variables were
controlled for homogeneity of variance and normal distribution by investigation of residual
plots and normal probability plots. When not normally distributed, log-transformation was
applied. For all variables, an analysis of co-variance (ANCOVA) was performed using a
random effect model (xtmixed) to investigate if there was an overall effect of treatment on
changes from baseline to week three. The overall P-value for treatment was obtained by
performing a likelihood ratio test with and without the treatment variable. If P < 0.01,
pairwise comparisons of the three β-glucan treatments to control were made. Subject was
modeled as a random variable, sex and period were included as fixed variables and dietary
fiber intake at period baseline were included as co-variables. A likelihood ratio test was
performed to test whether an interaction of treatment sex or treatment period should be
included in the model. Moreover, an ANCOVA was performed to test for differences between
period baseline and three weeks of treatment within each of the four treatments. Results are
presented as means ± SEMs or as medians (95% CI), when data were log-transformed.
Statistical significance level was defined as p<0.05.
RESULTS
Of the 16 enrolled subjects (10F/6M), 13 persons completed all four dietary periods (7F/6M).
One person dropped out due to dislike of the intervention products and one for personal
reasons not related to the study. Finally, one female subject dropped out before the fourth
period due to pregnancy. Data from the three periods completed by this female was included
in the statistical analysis. Subjects were enrolled in January and February 2010, and the last
participant finished in October 2010. All 14 subjects were young healthy adults with BMI,
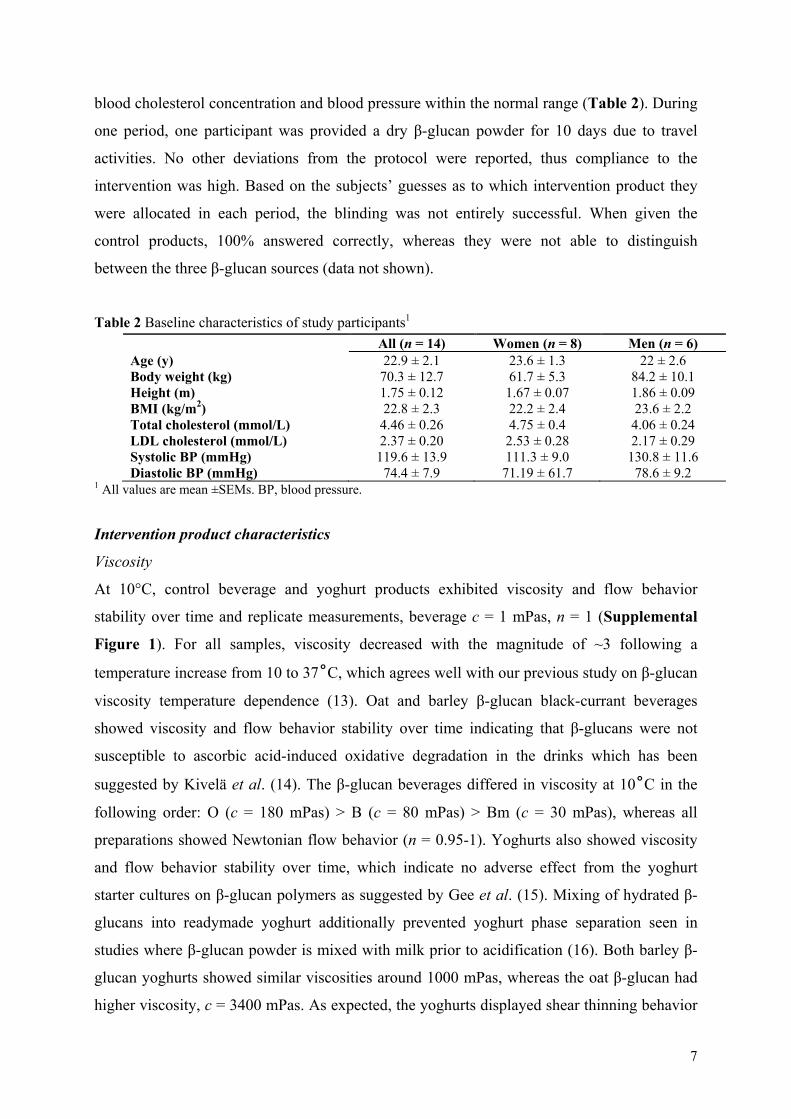
7
blood cholesterol concentration and blood pressure within the normal range (Table 2). During
one period, one participant was provided a dry β-glucan powder for 10 days due to travel
activities. No other deviations from the protocol were reported, thus compliance to the
intervention was high. Based on the subjects’ guesses as to which intervention product they
were allocated in each period, the blinding was not entirely successful. When given the
control products, 100% answered correctly, whereas they were not able to distinguish
between the three β-glucan sources (data not shown).
Table 2 Baseline characteristics of study participants1
All (n = 14) Women (n = 8) Men (n = 6) Age (y) 22.9 ± 2.1 23.6 ± 1.3 22 ± 2.6 Body weight (kg) 70.3 ± 12.7 61.7 ± 5.3 84.2 ± 10.1 Height (m) 1.75 ± 0.12 1.67 ± 0.07 1.86 ± 0.09 BMI (kg/m2) 22.8 ± 2.3 22.2 ± 2.4 23.6 ± 2.2 Total cholesterol (mmol/L) 4.46 ± 0.26 4.75 ± 0.4 4.06 ± 0.24 LDL cholesterol (mmol/L) 2.37 ± 0.20 2.53 ± 0.28 2.17 ± 0.29 Systolic BP (mmHg) 119.6 ± 13.9 111.3 ± 9.0 130.8 ± 11.6 Diastolic BP (mmHg) 74.4 ± 7.9 71.19 ± 61.7 78.6 ± 9.2
1 All values are mean ±SEMs. BP, blood pressure.
Intervention product characteristics
Viscosity
At 10°C, control beverage and yoghurt products exhibited viscosity and flow behavior
stability over time and replicate measurements, beverage c = 1 mPas, n = 1 (Supplemental
Figure 1). For all samples, viscosity decreased with the magnitude of ~3 following a
temperature increase from 10 to 37˚C, which agrees well with our previous study on β-glucan
viscosity temperature dependence (13). Oat and barley β-glucan black-currant beverages
showed viscosity and flow behavior stability over time indicating that β-glucans were not
susceptible to ascorbic acid-induced oxidative degradation in the drinks which has been
suggested by Kivelä et al. (14). The β-glucan beverages differed in viscosity at 10˚C in the
following order: O (c = 180 mPas) > B (c = 80 mPas) > Bm (c = 30 mPas), whereas all
preparations showed Newtonian flow behavior (n = 0.95-1). Yoghurts also showed viscosity
and flow behavior stability over time, which indicate no adverse effect from the yoghurt
starter cultures on β-glucan polymers as suggested by Gee et al. (15). Mixing of hydrated β-
glucans into readymade yoghurt additionally prevented yoghurt phase separation seen in
studies where β-glucan powder is mixed with milk prior to acidification (16). Both barley β-
glucan yoghurts showed similar viscosities around 1000 mPas, whereas the oat β-glucan had
higher viscosity, c = 3400 mPas. As expected, the yoghurts displayed shear thinning behavior
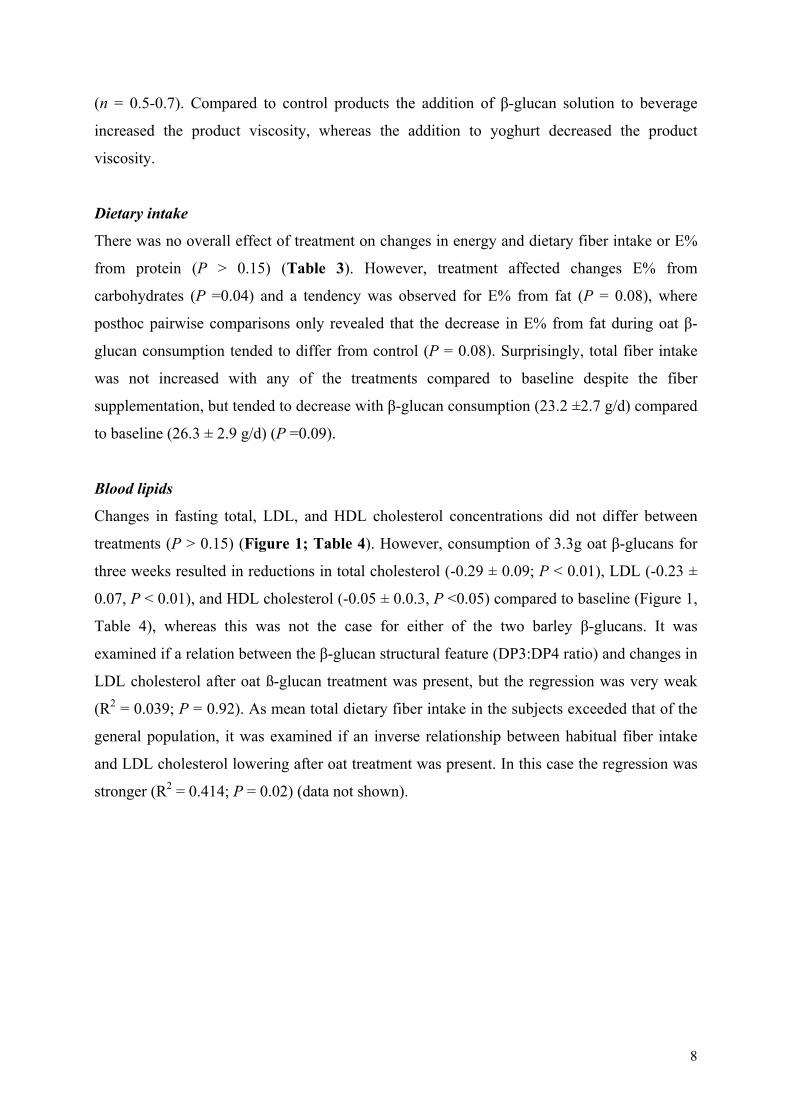
8
(n = 0.5-0.7). Compared to control products the addition of β-glucan solution to beverage
increased the product viscosity, whereas the addition to yoghurt decreased the product
viscosity.
Dietary intake
There was no overall effect of treatment on changes in energy and dietary fiber intake or E%
from protein (P > 0.15) (Table 3). However, treatment affected changes E% from
carbohydrates (P =0.04) and a tendency was observed for E% from fat (P = 0.08), where
posthoc pairwise comparisons only revealed that the decrease in E% from fat during oat β-
glucan consumption tended to differ from control (P = 0.08). Surprisingly, total fiber intake
was not increased with any of the treatments compared to baseline despite the fiber
supplementation, but tended to decrease with β-glucan consumption (23.2 ±2.7 g/d) compared
to baseline (26.3 ± 2.9 g/d) (P =0.09).
Blood lipids
Changes in fasting total, LDL, and HDL cholesterol concentrations did not differ between
treatments (P > 0.15) (Figure 1; Table 4). However, consumption of 3.3g oat β-glucans for
three weeks resulted in reductions in total cholesterol (-0.29 ± 0.09; P < 0.01), LDL (-0.23 ±
0.07, P < 0.01), and HDL cholesterol (-0.05 ± 0.0.3, P <0.05) compared to baseline (Figure 1,
Table 4), whereas this was not the case for either of the two barley β-glucans. It was
examined if a relation between the β-glucan structural feature (DP3:DP4 ratio) and changes in
LDL cholesterol after oat ß-glucan treatment was present, but the regression was very weak
(R2 = 0.039; P = 0.92). As mean total dietary fiber intake in the subjects exceeded that of the
general population, it was examined if an inverse relationship between habitual fiber intake
and LDL cholesterol lowering after oat treatment was present. In this case the regression was
stronger (R2 = 0.414; P = 0.02) (data not shown).
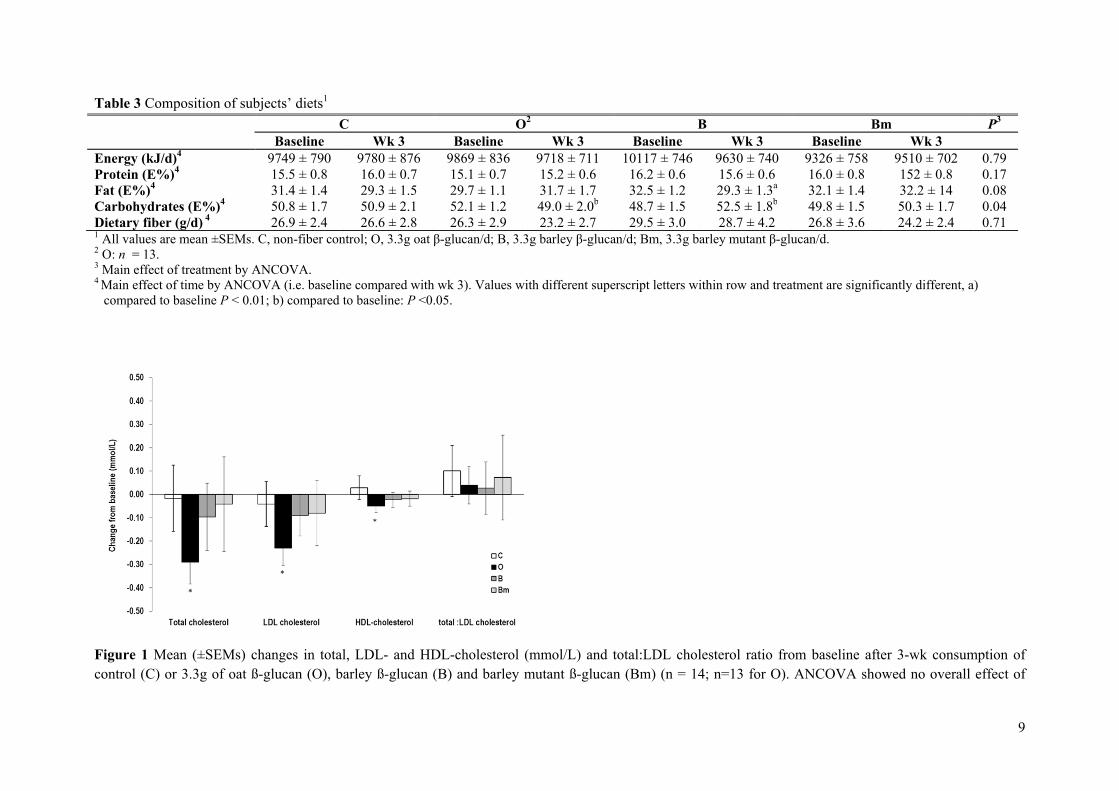
9
Table 3 Composition of subjects’ diets1
C O2 B Bm P3
Baseline Wk 3 Baseline Wk 3 Baseline Wk 3 Baseline Wk 3 Energy (kJ/d)4 9749 ± 790 9780 ± 876 9869 ± 836 9718 ± 711 10117 ± 746 9630 ± 740 9326 ± 758 9510 ± 702 0.79 Protein (E%)4 15.5 ± 0.8 16.0 ± 0.7 15.1 ± 0.7 15.2 ± 0.6 16.2 ± 0.6 15.6 ± 0.6 16.0 ± 0.8 152 ± 0.8 0.17 Fat (E%)4 31.4 ± 1.4 29.3 ± 1.5 29.7 ± 1.1 31.7 ± 1.7 32.5 ± 1.2 29.3 ± 1.3a 32.1 ± 1.4 32.2 ± 14 0.08 Carbohydrates (E%)4 50.8 ± 1.7 50.9 ± 2.1 52.1 ± 1.2 49.0 ± 2.0b 48.7 ± 1.5 52.5 ± 1.8b 49.8 ± 1.5 50.3 ± 1.7 0.04 Dietary fiber (g/d) 4 26.9 ± 2.4 26.6 ± 2.8 26.3 ± 2.9 23.2 ± 2.7 29.5 ± 3.0 28.7 ± 4.2 26.8 ± 3.6 24.2 ± 2.4 0.71 1 All values are mean ±SEMs. C, non-fiber control; O, 3.3g oat β-glucan/d; B, 3.3g barley β-glucan/d; Bm, 3.3g barley mutant β-glucan/d. 2 O: n = 13. 3 Main effect of treatment by ANCOVA. 4 Main effect of time by ANCOVA (i.e. baseline compared with wk 3). Values with different superscript letters within row and treatment are significantly different, a)
compared to baseline P < 0.01; b) compared to baseline: P <0.05.
Figure 1 Mean (±SEMs) changes in total, LDL- and HDL-cholesterol (mmol/L) and total:LDL cholesterol ratio from baseline after 3-wk consumption of control (C) or 3.3g of oat ß-glucan (O), barley ß-glucan (B) and barley mutant ß-glucan (Bm) (n = 14; n=13 for O). ANCOVA showed no overall effect of
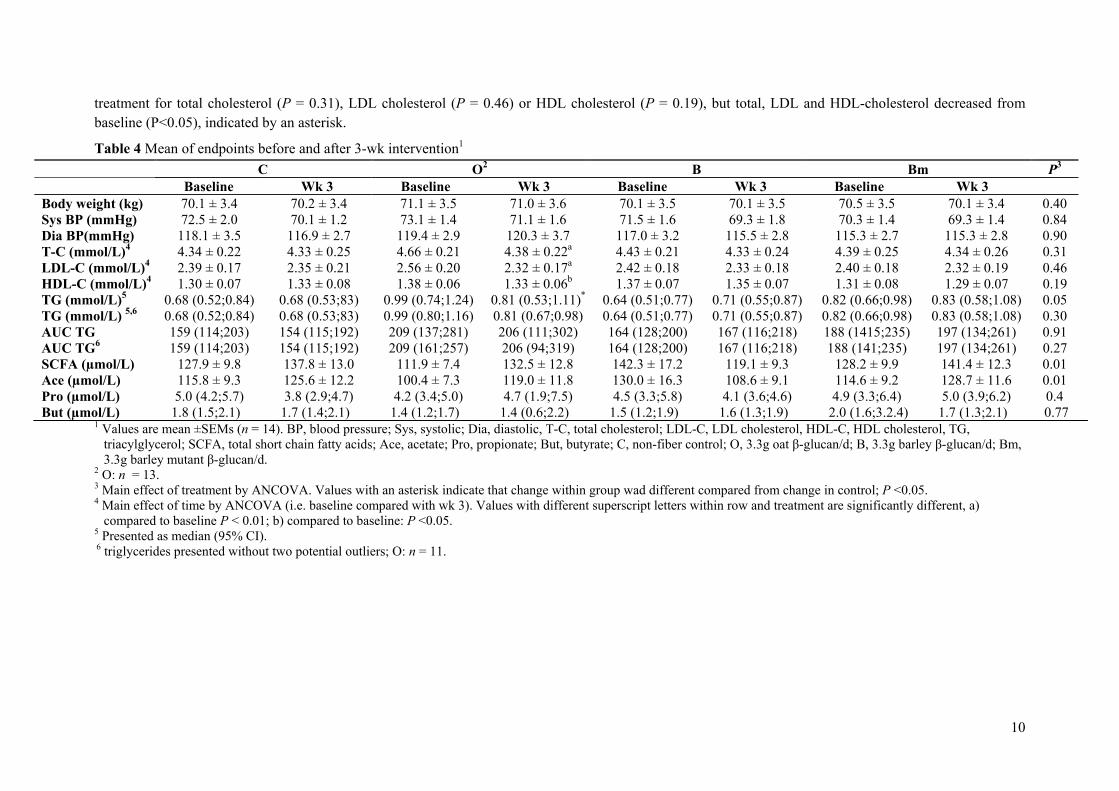
10
treatment for total cholesterol (P = 0.31), LDL cholesterol (P = 0.46) or HDL cholesterol (P = 0.19), but total, LDL and HDL-cholesterol decreased from baseline (P<0.05), indicated by an asterisk.
Table 4 Mean of endpoints before and after 3-wk intervention1
C O2 B Bm P3 Baseline Wk 3 Baseline Wk 3 Baseline Wk 3 Baseline Wk 3 Body weight (kg) 70.1 ± 3.4 70.2 ± 3.4 71.1 ± 3.5 71.0 ± 3.6 70.1 ± 3.5 70.1 ± 3.5 70.5 ± 3.5 70.1 ± 3.4 0.40 Sys BP (mmHg) 72.5 ± 2.0 70.1 ± 1.2 73.1 ± 1.4 71.1 ± 1.6 71.5 ± 1.6 69.3 ± 1.8 70.3 ± 1.4 69.3 ± 1.4 0.84 Dia BP(mmHg) 118.1 ± 3.5 116.9 ± 2.7 119.4 ± 2.9 120.3 ± 3.7 117.0 ± 3.2 115.5 ± 2.8 115.3 ± 2.7 115.3 ± 2.8 0.90 T-C (mmol/L)4 4.34 ± 0.22 4.33 ± 0.25 4.66 ± 0.21 4.38 ± 0.22a 4.43 ± 0.21 4.33 ± 0.24 4.39 ± 0.25 4.34 ± 0.26 0.31 LDL-C (mmol/L)4 2.39 ± 0.17 2.35 ± 0.21 2.56 ± 0.20 2.32 ± 0.17a 2.42 ± 0.18 2.33 ± 0.18 2.40 ± 0.18 2.32 ± 0.19 0.46 HDL-C (mmol/L)4 1.30 ± 0.07 1.33 ± 0.08 1.38 ± 0.06 1.33 ± 0.06b 1.37 ± 0.07 1.35 ± 0.07 1.31 ± 0.08 1.29 ± 0.07 0.19 TG (mmol/L)5 0.68 (0.52;0.84) 0.68 (0.53;83) 0.99 (0.74;1.24) 0.81 (0.53;1.11)* 0.64 (0.51;0.77) 0.71 (0.55;0.87) 0.82 (0.66;0.98) 0.83 (0.58;1.08) 0.05 TG (mmol/L) 5,6 0.68 (0.52;0.84) 0.68 (0.53;83) 0.99 (0.80;1.16) 0.81 (0.67;0.98) 0.64 (0.51;0.77) 0.71 (0.55;0.87) 0.82 (0.66;0.98) 0.83 (0.58;1.08) 0.30 AUC TG 159 (114;203) 154 (115;192) 209 (137;281) 206 (111;302) 164 (128;200) 167 (116;218) 188 (1415;235) 197 (134;261) 0.91 AUC TG6 159 (114;203) 154 (115;192) 209 (161;257) 206 (94;319) 164 (128;200) 167 (116;218) 188 (141;235) 197 (134;261) 0.27 SCFA (µmol/L) 127.9 ± 9.8 137.8 ± 13.0 111.9 ± 7.4 132.5 ± 12.8 142.3 ± 17.2 119.1 ± 9.3 128.2 ± 9.9 141.4 ± 12.3 0.01 Ace (µmol/L) 115.8 ± 9.3 125.6 ± 12.2 100.4 ± 7.3 119.0 ± 11.8 130.0 ± 16.3 108.6 ± 9.1 114.6 ± 9.2 128.7 ± 11.6 0.01 Pro (µmol/L) 5.0 (4.2;5.7) 3.8 (2.9;4.7) 4.2 (3.4;5.0) 4.7 (1.9;7.5) 4.5 (3.3;5.8) 4.1 (3.6;4.6) 4.9 (3.3;6.4) 5.0 (3.9;6.2) 0.4 But (µmol/L) 1.8 (1.5;2.1) 1.7 (1.4;2.1) 1.4 (1.2;1.7) 1.4 (0.6;2.2) 1.5 (1.2;1.9) 1.6 (1.3;1.9) 2.0 (1.6;3.2.4) 1.7 (1.3;2.1) 0.77
1 Values are mean ±SEMs (n = 14). BP, blood pressure; Sys, systolic; Dia, diastolic, T-C, total cholesterol; LDL-C, LDL cholesterol, HDL-C, HDL cholesterol, TG, triacylglycerol; SCFA, total short chain fatty acids; Ace, acetate; Pro, propionate; But, butyrate; C, non-fiber control; O, 3.3g oat β-glucan/d; B, 3.3g barley β-glucan/d; Bm, 3.3g barley mutant β-glucan/d.
2 O: n = 13. 3 Main effect of treatment by ANCOVA. Values with an asterisk indicate that change within group wad different compared from change in control; P <0.05. 4 Main effect of time by ANCOVA (i.e. baseline compared with wk 3). Values with different superscript letters within row and treatment are significantly different, a)
compared to baseline P < 0.01; b) compared to baseline: P <0.05. 5 Presented as median (95% CI). 6 triglycerides presented without two potential outliers; O: n = 11.
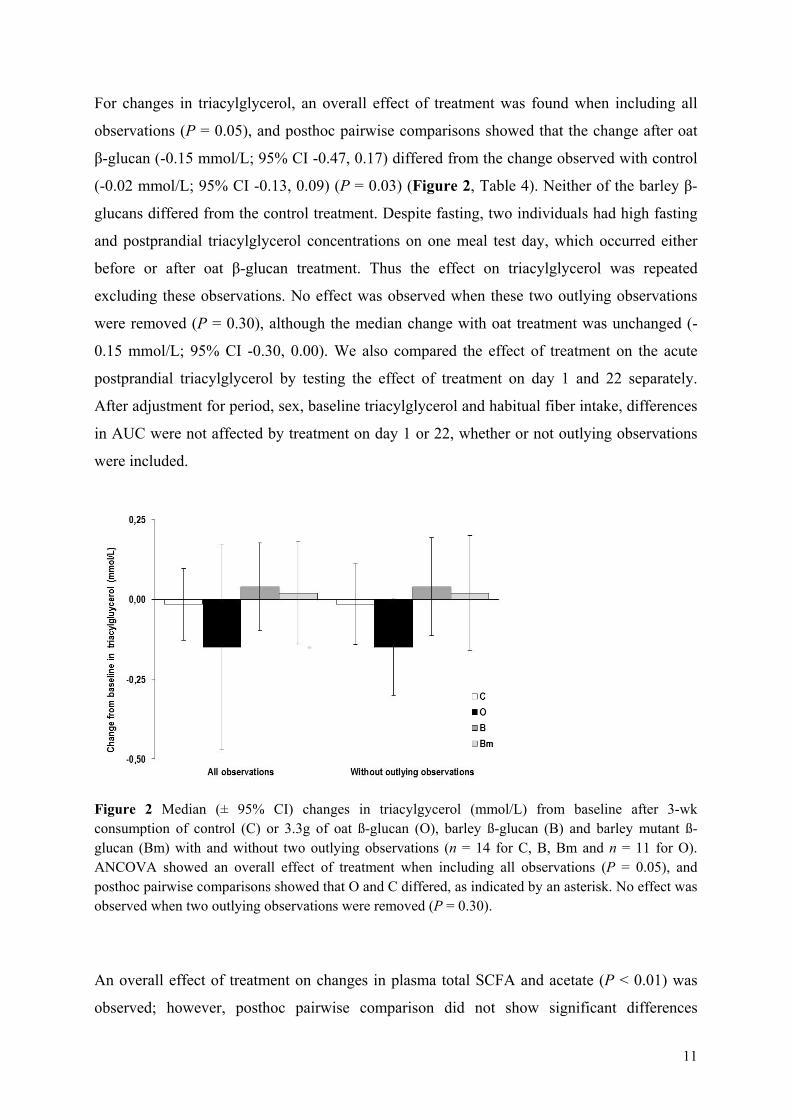
11
For changes in triacylglycerol, an overall effect of treatment was found when including all
observations (P = 0.05), and posthoc pairwise comparisons showed that the change after oat
β-glucan (-0.15 mmol/L; 95% CI -0.47, 0.17) differed from the change observed with control
(-0.02 mmol/L; 95% CI -0.13, 0.09) (P = 0.03) (Figure 2, Table 4). Neither of the barley β-
glucans differed from the control treatment. Despite fasting, two individuals had high fasting
and postprandial triacylglycerol concentrations on one meal test day, which occurred either
before or after oat β-glucan treatment. Thus the effect on triacylglycerol was repeated
excluding these observations. No effect was observed when these two outlying observations
were removed (P = 0.30), although the median change with oat treatment was unchanged (-
0.15 mmol/L; 95% CI -0.30, 0.00). We also compared the effect of treatment on the acute
postprandial triacylglycerol by testing the effect of treatment on day 1 and 22 separately.
After adjustment for period, sex, baseline triacylglycerol and habitual fiber intake, differences
in AUC were not affected by treatment on day 1 or 22, whether or not outlying observations
were included.
Figure 2 Median (± 95% CI) changes in triacylgycerol (mmol/L) from baseline after 3-wk consumption of control (C) or 3.3g of oat ß-glucan (O), barley ß-glucan (B) and barley mutant ß-glucan (Bm) with and without two outlying observations (n = 14 for C, B, Bm and n = 11 for O). ANCOVA showed an overall effect of treatment when including all observations (P = 0.05), and posthoc pairwise comparisons showed that O and C differed, as indicated by an asterisk. No effect was observed when two outlying observations were removed (P = 0.30).
An overall effect of treatment on changes in plasma total SCFA and acetate (P < 0.01) was
observed; however, posthoc pairwise comparison did not show significant differences
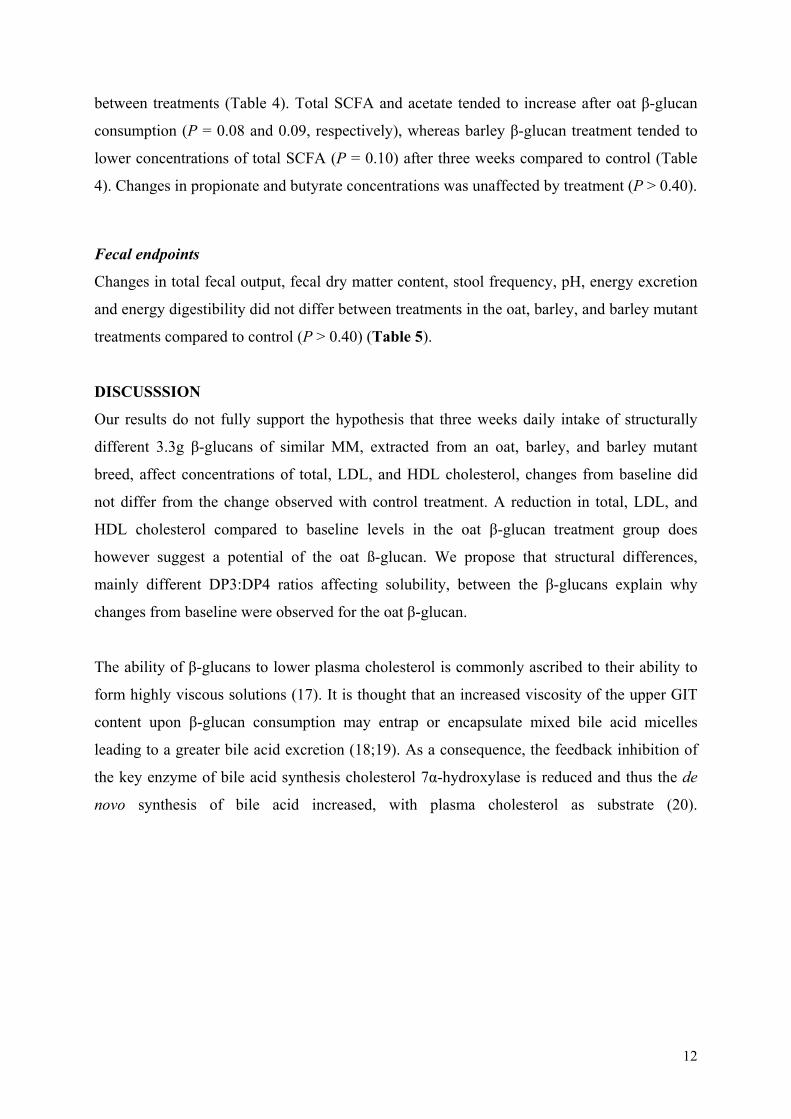
12
between treatments (Table 4). Total SCFA and acetate tended to increase after oat β-glucan
consumption (P = 0.08 and 0.09, respectively), whereas barley β-glucan treatment tended to
lower concentrations of total SCFA (P = 0.10) after three weeks compared to control (Table
4). Changes in propionate and butyrate concentrations was unaffected by treatment (P > 0.40).
Fecal endpoints
Changes in total fecal output, fecal dry matter content, stool frequency, pH, energy excretion
and energy digestibility did not differ between treatments in the oat, barley, and barley mutant
treatments compared to control (P > 0.40) (Table 5).
DISCUSSSION
Our results do not fully support the hypothesis that three weeks daily intake of structurally
different 3.3g β-glucans of similar MM, extracted from an oat, barley, and barley mutant
breed, affect concentrations of total, LDL, and HDL cholesterol, changes from baseline did
not differ from the change observed with control treatment. A reduction in total, LDL, and
HDL cholesterol compared to baseline levels in the oat β-glucan treatment group does
however suggest a potential of the oat ß-glucan. We propose that structural differences,
mainly different DP3:DP4 ratios affecting solubility, between the β-glucans explain why
changes from baseline were observed for the oat β-glucan.
The ability of β-glucans to lower plasma cholesterol is commonly ascribed to their ability to
form highly viscous solutions (17). It is thought that an increased viscosity of the upper GIT
content upon β-glucan consumption may entrap or encapsulate mixed bile acid micelles
leading to a greater bile acid excretion (18;19). As a consequence, the feedback inhibition of
the key enzyme of bile acid synthesis cholesterol 7α-hydroxylase is reduced and thus the de
novo synthesis of bile acid increased, with plasma cholesterol as substrate (20).
13
Table 5 Mean of endpoint before and after 3-wk intervention1
C O2 B Bm p3
Baseline Wk 3 Baseline Wk 3 Baseline Wk 3 Baseline Wk 3 Fecal output (g/d) 185 ±22 160 ± 20 175 ± 29 175 ± 23 177 ± 15 179 ± 28 155 ± 21 147 ± 17 0.76 Fecal dry matter (g/d) 44.4 ± 5.4 36.2 ± 3.9 42.8 ± 6.7 41.8 ± 4.9 44.9 ± 4.4 42.4 ± 7.0 43.3 ± 5.6 40.0 ± 6.2 0.82 Stool frequency (n/d) 1.2 ± 0.1 1.1 ± 0.1 1.2 ± 0.2 1.2 ± 0.1 1.2 ± 0.1 1.1 ± 0.1 1.0 ± 0.1 1.0 ± 0.1 0.86 Fecal pH 6.61 ± 0.17 6.54 ± 0.14 6.66 ± 0.12 6.55 ± 0.14 6.78 ± 0.14 6.62 ± 0.16 6.54 ± 0.15 6.64 ± 10 0.44 EE (kJ/d) 968 ± 129 770 ± 86 931 ± 149 885 ± 108 965 ± 103 915 ± 158 958 ±139 865 ± 142 0.73 ED (% of intake) 89.7 ± 1.2 91.6 ± 0.9 90.6 ± 1.4 91.1± 0.8 89.9 ± 1.2 90.5 ± 1.5 89.6 ± 1.2 90.4 ± 1.8 0.93 1 All values are mean ±SEMs (n = 14). EE, Energy excretion; ED, Energy digestibility; C, non-fiber control; O, 3.3g oat β-glucan/d; B, 3.3g barley β-glucan/d; Bm, 3.3g
barley mutant β-glucan/d. 2 n = 13 for oat treatment. 3 Main effect of treatment by ANCOVA.
14
Viscosity measurements of the β-glucan beverages, at a concentration of 0.7%, showed a
greater apparent viscosity for the oat β-glucan at both 10 and 37 °C than for both the barley
and the barley mutant β-glucan most likely reflecting a higher solubility for oat ß-glucan. The
viscous properties of β-glucans are determined by their MM, concentration, and molecular
structure which in turn determines the solubility (17). The MM of the extracted β-glucans in
our study ranged from 250 to 300 kDa (9), which is medium compared to other extracted β-
glucans (21) but low in comparison to the average MM from 2,000 to 3,000 kDa reported for
native cereal β-glucans (22). However, it has previously been shown in a large intervention
study that 3g high (2,100 kDa) and medium (530 kDa) MM oat β-glucans lowered LDL
cholesterol similarly, but that the efficacy was reduced by 50% when MM was reduced to 210
kDa (23). In this study the MM of the three β-glucans were similar, thus the observed
viscosity differences cannot be attributed to varying MM.
Another influencing factor on the viscosity is the solubility of the β-glucan molecules, as only
solubilized β-glucan polymers are able to entangle and form highly viscous solutions (17).
Although cereal β-glucans are classified as soluble fibers, they are only partly soluble in water
and the extent to which they are soluble is closely related to their molecular structure (8).
Significant block structural differences were found for mutant barley, mother barley and oat
β-glucans with DP3:DP4 ratios of 4.7 > 3.5 > 2.3, respectively, implying a greater relative
amount of DP3 oligomers in the barley β-glucans relative to the oat β-glucan. The higher
number of DP3 units of the barley β-glucans may result in lower solubility, as DP3 units are
likely to be organized in longer, repetitive cellotriosyl sequences, which are prone to
aggregate and form insoluble species (8;24). Therefore, the amount of insoluble β-glucan may
determine viscosity and in turn physiological effects. The same solubilization procedure was
applied for all three dry extracts, thus it is likely that a greater proportion of the oat β-glucan
than of the two barley β-glucans was solubilized as indicated by the dietary fiber assay. We
propose that this accounts for the cholesterol reductions compared to baseline observed for
the oat β-glucan treatment and not for the two barley β-glucan treatments.
The importance of solubility was also highlighted by others. In a study by Beer et al. (1995)
9g/ d of an oat gum β-glucan incorporated into a milk-based instant whip did not affect total
cholesterol concentrations despite a relatively high MM of 1000 kDa (5). In contrast, Braaten
et al. (1994) effectively lowered serum cholesterol with a smaller dose of 5.6 g of an oat gum
β-glucan of similar MM (1200 kDa) given as a beverage (25). Apparently the main difference
15
between the two studies was the solubility of the applied β-glucans, which was reported as
high in the study by Braaten et al. and poor in the study by Beer et al. (5;25). Furthermore,
low solubility is likely the reason why daily administration of 10g barley β-glucan in the form
of a concentrated powder that was incorporated into various food products such as bread,
waffles, and cookies exhibited poor cholesterol-lowering properties in a study by Keogh et al.
(2003) (6). The pure β-glucan powder was described as largely insoluble in cold water and
apparently it was not solubilized before incorporating it into food products or in the upper
GIT.
In addition to MM and solubility, also β-glucan concentration strongly influences the
viscosity of a solution(26). Thus, β-glucan intake needs to be sufficient to increase intestinal
β-glucan concentration and hence viscosity of GIT content. In this study, a daily dose of 3.3g
β-glucan was applied which corresponds to the dose used in a recent study by Wolever et al.
(2010). However, they found that a daily dose of 3g of β-glucans with a MM ≤ 210kDa had a
50 % lower effectiveness in lowering LDL cholesterol than β-glucans with a MM ≥ 530kDa.
They suggest that higher doses of soluble β-glucan might compensate for a low MM, although
a significantly greater concentration is needed for compensation, as this relationship is not
linear (23). In addition, it can be speculated whether the β-glucan content of a single load
rather than the daily dose as such is pivotal. In the present study, the daily dose was spread
over two servings, which may have resulted in too small intestinal β-glucan concentrations
considering the low MM. A minimum daily dose of 3 g β-glucan is suggested by the
European Food Safety Authority (EFSA) to obtain a beneficial effect on blood cholesterol
with oat and barley β-glucans (27). Further, the EFSA opinion only refers to ‘non-processed
or minimally processed’ oat and barley products (27) which naturally contain β-glucans of
high MM (28). Our results support that not only dose, but also physico-chemical properties,
including MM, molecular structure and solubility should be considered.
Besides a higher bile acid excretion due to an increased intestinal viscosity, it is also
suggested that β-glucans may directly bind to bile acids leading to excess fecal bile acid
excretion (29). However, the present study does not allow conclusions in regard to the
structural composition of the β-glucans and their potential bile acid binding capacity. Finally,
it has been proposed that the fermentation of β-glucan to SCFA by the intestinal microflora
may lower serum cholesterol, as the generated SCFA propionate was found to inhibit de novo
cholesterol synthesis in rats (30). However, this needs to be supported by studies conducted in
16
humans. In the present study, no changes in peripheral plasma SCFA concentrations were
observed following β-glucan consumption, which may be linked to a high habitual dietary
fiber intake of the participants. Also, measuring peripheral SCFA is not optimal, as the
majority of SCFA metabolism occurs in the liver, and thus before they reach the peripheral
circulation (31). Nonetheless, others have been able to detect differences in fasting plasma
SCFA following a dietary fiber intervention (32).
Normally, dietary fibers are recognized for their cholesterol-reducing properties rather than
lowering of fasting triacylglycerol. This study, however, showed that oat β-glucan resulted in
a greater decrease in fasting triacylglycerol compared to control. This appear to be in
agreement with our previous finding that oat bran consumption lowered triacylglycerol by as
much as 21% (11) and with other studies that have shown that oat bran can reduce
postprandial plasma triacylglycerol responses (33;34). It is likely that a decreased
postprandial lipemia, if occurring repeatedly over a 3-wk period, may reduce fasting
triacylglycerol. However, in the present study, we did not observe a diminished postprandial
triacylglycerol response, which is likely accountable to a too small fat load of the
standardized breakfast meal (10 g).
During the course of the study subjects maintained their habitual diet. Dietary food records
revealed that the average dietary fiber intake was high and meeting the Nordic nutrition
recommendations of 25-30 g /day (35). Moreover, some individuals consumed quite large
amounts of rye bread, which is another source of soluble fibes (36). As also indicated by the
inverse relation between habitual dietary fiber intake and changes in LDL cholesterol with oat
ß-glucan, it is possible that supplementing the diet with 3.3 g of extracted β-glucan may be
more relevant in a population with a low habitual dietary fiber intake. We also found an
inverse relation between baseline LDL cholesterol and changes in LDL cholesterol, which is
in agreement with other studies where lack of hypo-cholesterolemic effects of β-glucan was
observed in persons exhibiting low initial cholesterol concentrations (5;37). Most studies that
report reduction in cholesterol levels were conducted in hypercholesterolemic individuals
(25;38;39). Therefore it can be speculated that a similar β-glucan intervention might show
more pronounced cholesterol-lowering effects if added to the diet of moderately hyper-
cholesterolemic individuals consuming a typical Western diet that is low in dietary fibers.
Finally, it should be noted that only 13 as opposed to 14 of the 16 subjects completed the oat
17
treatment, thus the study was sufficiently powered for the difference between treatments to
become significant.
The current study does not provide strong support for the hypocholesterolemic effects of
extracted oat, barley and barley mutant β-glucans with major structural differences in
comparison to a control treatment. However, the higher solubility and viscosity of the oat β-
glucan suggest a certain hypocholesterolemic potential, which is also indicated by the
reductions in total and LDL cholesterol compared to baseline. Mildly hyper-cholesterolemic
individuals, consuming a diet low in dietary fibers, might benefit by adding oat β-glucan to
their diet. Further studies are required to investigate the hypocholesterolemic potential of
structurally different barley and oat β-glucans in more susceptible groups of volunteers.
ACKNOWLEDGEMENT
We express gratitude to all subjects who participated in the intervention and to the staff at the
Department of Human Nutrition and Quality & Technology, Department of Food Sciences.
The authors’ responsibilities were as follows: SI, MK and MSM wrote the manuscript; MK
wrote the protocol; SI, MWP, and JE conducted the study; MSM and BMP prepared the β-
glucan solutions; All authors planned the study, analyzed data, reviewed the manuscript, and
approved the final manuscript. The study was carried out as a part of the research program of
the UNIK: Food, Fitness & Pharma for Health and Disease. The UNIK project is supported
by the Danish Ministry of Science, Technology and Innovation. The study was also supported
by the strategic research program “BEST” at Faculty of Science, University of Copenhagen.
Denmark. All authors declared no conflict of interest.
18
REFERENCES
1. Anderson JW, Baird P, Davis RH, Jr. et al. Health benefits of dietary fiber. Nutr Rev 2009;67:188-205.
2. Pereira MA, O'Reilly E, Augustsson K et al. Dietary fiber and risk of coronary heart disease: a pooled analysis of cohort studies. Arch Intern Med 2004;164:370-6.
3. Brown L, Rosner B, Willett WW, Sacks FM. Cholesterol-lowering effects of dietary fiber: a meta-analysis. Am J Clin Nutr 1999;69:30-42.
4. US Department of Health and Human Services.Third Report of the National Cholesterol Education Program (NCEP) Expert Panel on Detection, Evaluation, and Treatment of High Blood Cholesterol in Adults (Adult Treatment Panel III) - Executive Summary. 2001. [NIH publication No. 01-3670.]
5. Beer MU, Arrigoni E, Amado R. Effects of oat gum on blood cholesterol levels in healthy young men. Eur J Clin Nutr 1995;49:517-22.
6. Keogh GF, Cooper GJ, Mulvey TB et al. Randomized controlled crossover study of the effect of a highly β-glucan-enriched barley on cardiovascular disease risk factors in mildly hypercholesterolemic men. Am J Clin Nutr 2003;78:711-8.
7. Wood PJ. Cereal β-glucans in diet and health. J Cereal Sci 2007;46:230-8.
8. Lazaridou A, Biliaderis CG. Molecular aspects of cereal β-glucan functionality: Physical properties, technological applications and physiological effects. J Cereal Sci 2007;46:101-18.
9. Mikkelsen MS, Jespersen BM, Larsen FH, Blennow A, Engelsen SB. Molecular structure of large scale β-glucan from barley and oat: Identification of a significantly changes block structure in a high β-glucan barley mutant. Food Chem 2012;136:130-8.
10. Brighenti F. Summary of the conclusion of the working group on Profibre interlaboratory study on determination of short chain fatty acids in blood. In: Functional Properties of Non-digestible Carbohydrates. Brussels. 1998:150-3.
11. Kristensen M, Bugel S. A diet rich in oat bran improves blood lipids and hemostatic factors, and reduces apparent energy digestibility in young healthy volunteers. Eur J Clin Nutr 2011;65:1053-8.
12. Kristensen M, Jensen MG, Aarestrup J et al. Flaxseed dietary fibers lower cholesterol and increase fecal fat excretion, but magnitude of effect depend on food type. Nutr Metab 2012;9:8.
19
13. Mikkelsen MS, Jespersen BM, Møller BL, Laerke HN, Larsen FH, Engelsen SB. Comparative spectroscopic and rheological studies on crude and purified soluble barley and oat β-glucan preparations. Food Res Int 2010;43:2417-24.
14. Kivela R, Nystrøm L, Salovaara H, Sontag-Strohm T. Role of oxidative cleavage and acid hydrolysis of oat β-glucan in modelled beverage conditions. J Cereal Sci 2009;50:190-7.
15. Gee JM, Blackburn NA, Johnson IT. The influence of guar gum on intestinal cholesterol transport in the rat. Br J Nutr 1983;50:215-24.
16. Vasiljevic T, Kealy T, Mishra VK. Effects of β-glucan addition to a Probiotic containing yogurt. J Food Sci 2007;72:C405-C411.
17. Anntila H, Sontag-Strohm T, Salovaara H. Viscosity of β-glucan in oat products. Agric Food Sci 2004;13:80-7.
18. Ellegård L, Andersson H. Oat bran rapidly increases bile acid excretion and bile acid synthesis: an ileostomy study. Eur J Clin Nutr 2007;61:938-45.
19. Lia A, Andersson H, Mekki N, Juhel C, Senft M, Lairon D. Postprandial lipemia in relation to sterol and fat excretion in ileostomy subjects given oat-bran and wheat test meals. Am J Clin Nutr 1997;66:357-65.
20. Andersson M, Ellegård L, Andersson H. Oat bran stimulates bile acid synthesis within 8 h as measured by 7alpha-hydroxy-4-cholesten-3-one. Am J Clin Nutr 2002;76:1111-6.
21. Beer MU, Wood PJ, Weisz J. Molecular Weight Distribution and (1-3)(1-4)-β-D-Glucan Content of Consecutive Extracts of Various Oat and Barley Cultivars. Food Chem 1997;74:476-80.
22. Kumar V, Sinha AK, Makkar HP, de BG, Becker K. Dietary roles of non-starch polysachharides in human nutrition: a review. Crit Rev Food Sci Nutr 2012;52:899-935.
23. Wolever TM, Tosh SM, Gibbs AL et al. Physicochemical properties of oat β-glucan influence its ability to reduce serum LDL cholesterol in humans: a randomized clinical trial. Am J Clin Nutr 2010;92:723-32.
24. Tosh S.M. Factors affecting bioactivity of cereal β-glucans. In: Dietary fibre components and functions. Wageningen: Wageningen Academic Publishers, 2007:75-89.
25. Braaten JT, Wood PJ, Scott FW et al. Oat β-glucan reduces blood cholesterol concentration in hypercholesterolemic subjects. Eur J Clin Nutr 1994;48:465-74.
26. Wood PJ. Rheology and physiology of soluble fibers: what are the relationship and what use can be made of them? In: Dieteary fibre components and functions. Wageningen: Wageningen Academic Publishers, 2007:113-26.
20
27. European Food Safety Authority. Scientific Opinion on the substantiation of health claims related to β-glucans and maintainance of normal blood cholesterol concentrations (ID 754, 755, 801, 1465, 2934) and maintainance or achievement of a normal body weight (ID 820, 823) pursuant to article 13 (1) of Regulation (EC) No 1924/2006. EFSA Journal 2009;7.
28. Åman P., Rimsten L, Andersson R. Molecular weight distribution of β-glucan in oat-based foods. Cereal Chem 2004;81:356-60.
29. Simonsen HT, Nielsen MS, Christensen NJ et al. Molecular Interactions between Barley and Oat β-Glucans and Phenolic Derivatives. J Agr Food Chem 2009;57:2056-64.
30. Hara H, Haga S, Aoyama Y, Kiriyama S. Short-chain fatty acids suppress cholesterol synthesis in rat liver and intestine. J Nutr 1999;129:942-8.
31. Cummings JH, Pomare EW, Branch WJ, Naylor CP, Macfarlane GT. Short chain fatty acids in human large intestine, portal, hepatic and venous blood. Gut 1987;28:1221-7.
32. Nilsson AC, Östman EM, Knudsen KE, Holst JJ, Björck IM. A cereal-based evening meal rich in indigestible carbohydrates increases plasma butyrate the next morning. J Nutr 2010;140:1932-6.
33. Cara L, Dubois C, Borel P et al. Effects of oat bran, rice bran, wheat fiber, and wheat germ on postprandial lipemia in healthy adults. Am J Clin Nutr 1992;55:81-8.
34. Dubois C, Armand M, Senft M et al. Chronic oat bran intake alters postprandial lipemia and lipoproteins in healthy adults. Am J Clin Nutr 1995;61:325-33.
35. Nordic Council of Ministers. Carbohydrates. 4th. ed. In: Nordic Nutrition Recommendations 2004 Integrating nutrition and physical activity. Copenhagen: Norden 2004:173-98.
36. Leinonen KS, Poutanen KS, Mykkanen HM. Rye bread decreases serum total and LDL cholesterol in men with moderately elevated serum cholesterol. J Nutr 2000;130:164-70.
37. Chen J, He J, Wildman RP, Reynolds K, Streiffer RH, Whelton PK. A randomized controlled trial of dietary fiber intake on serum lipids. Eur J Clin Nutr 2006;60:62-8.
38. Behall KM, Scholfield DJ, Hallfrisch J. Lipids significantly reduced by diets containing barley in moderately hypercholesterolemic men. J Am Coll Nutr 2004;23:55-62.
39. Keenan JM, Goulson M, Shamliyan T, Knutson N, Kolberg L, Curry L. The effects of concentrated barley β-glucan on blood lipids in a population of hypercholesterolaemic men and women. Br J Nutr 2007;97:1162-8.
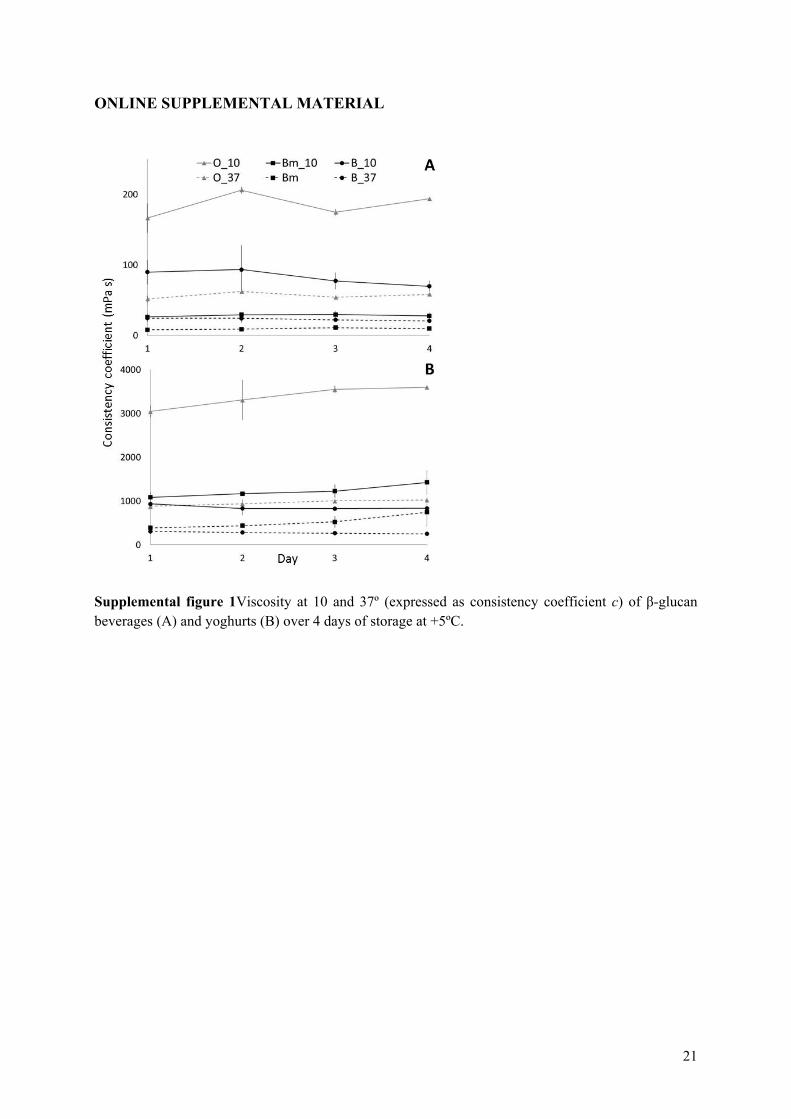
21
ONLINE SUPPLEMENTAL MATERIAL
Supplemental figure 1Viscosity at 10 and 37º (expressed as consistency coefficient c) of β-glucan beverages (A) and yoghurts (B) over 4 days of storage at +5ºC.
Paper VI
Mikkelsen MS, Rasmussen MA, Savorani F, Jespersen BM,
Kristensen M, Engelsen SB
Observations from a non-confirmatory dietary fibre intervention
study with barley and oat β-glucans using NMR metabolomics
Manuscript
Observations from a non-confirmatory dietary fibre intervention study
with barley and oat β-glucans using NMR metabolomics
Mette Skau Mikkelsen*1, Morten Arendt Rasmussen1, Francesco Savorani1, Birthe Møller Jespersen1,
Mette Kristensen2, Søren Balling Engelsen1
1Quality & Technology, Department of Food Science, Faculty of Science, University of Copenhagen,
Rolighedsvej 30, 1958 Frederiksberg C, Denmark; 2Department of Department of Nutrition, Exercise and
Sports, Faculty of Science, University of Copenhagen, Rolighedsvej 30, 1958 Frederiksberg C, Denmark
*Corresponding author: Mette Skau Mikkelsen; Tel: +45 35 33 35 07; Fax: +45 35 33 32 45; E-mail:
Abstract
Employing 1H NMR spectroscopy and multivariate data analysis, this study investigate the
plasma metabolic effectiveness from 3.3 g mixed linkage barley or oat β-glucan fibre per day.
Three large-scale extracted, equally sized but structurally different β-glucans, were tested in a
blinded randomised cross-over design using young healthy adults, where the β-glucans were
compared to a non-fibre control during a 21 day dietary intervention period. It was shown that
the plasma metabolic data correlated well with reference plasma glucose and plasma
triglyceride measurements. Subject variance was found to significantly dominate data
although participant age and BMI exhibited little variance. The second most influential
variation was due to gender and characteristic lipoprotein profiles were found for male and
female samples. No significant metabolic difference in plasma between 3-week β-glucan
treatments and control was found. However, a tendency to postprandial effect of barley β-
glucan compared to control was indicated and most pronounced in males. Two sets of
measurements (0, 2 and 4 hour), one male and one female, appeared to represent fat boosted
systems prior to β-glucan treatment and these systems might be more sensitive to β-glucan
fibre exposure compared to average metabolomes of young healthy adults.
Keywords
Human study, NMR spectroscopy, metabolomics, β-glucan, barley, oat
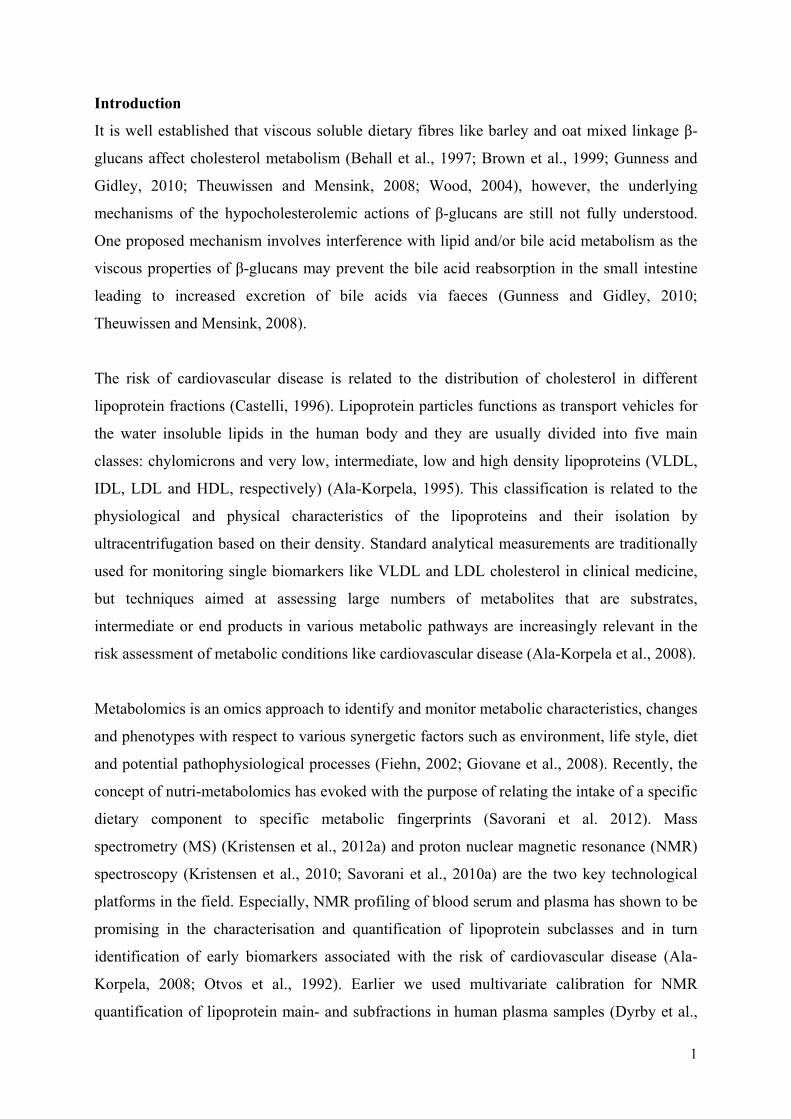
1
Introduction
It is well established that viscous soluble dietary fibres like barley and oat mixed linkage β-
glucans affect cholesterol metabolism (Behall et al., 1997; Brown et al., 1999; Gunness and
Gidley, 2010; Theuwissen and Mensink, 2008; Wood, 2004), however, the underlying
mechanisms of the hypocholesterolemic actions of β-glucans are still not fully understood.
One proposed mechanism involves interference with lipid and/or bile acid metabolism as the
viscous properties of β-glucans may prevent the bile acid reabsorption in the small intestine
leading to increased excretion of bile acids via faeces (Gunness and Gidley, 2010;
Theuwissen and Mensink, 2008).
The risk of cardiovascular disease is related to the distribution of cholesterol in different
lipoprotein fractions (Castelli, 1996). Lipoprotein particles functions as transport vehicles for
the water insoluble lipids in the human body and they are usually divided into five main
classes: chylomicrons and very low, intermediate, low and high density lipoproteins (VLDL,
IDL, LDL and HDL, respectively) (Ala-Korpela, 1995). This classification is related to the
physiological and physical characteristics of the lipoproteins and their isolation by
ultracentrifugation based on their density. Standard analytical measurements are traditionally
used for monitoring single biomarkers like VLDL and LDL cholesterol in clinical medicine,
but techniques aimed at assessing large numbers of metabolites that are substrates,
intermediate or end products in various metabolic pathways are increasingly relevant in the
risk assessment of metabolic conditions like cardiovascular disease (Ala-Korpela et al., 2008).
Metabolomics is an omics approach to identify and monitor metabolic characteristics, changes
and phenotypes with respect to various synergetic factors such as environment, life style, diet
and potential pathophysiological processes (Fiehn, 2002; Giovane et al., 2008). Recently, the
concept of nutri-metabolomics has evoked with the purpose of relating the intake of a specific
dietary component to specific metabolic fingerprints (Savorani et al. 2012). Mass
spectrometry (MS) (Kristensen et al., 2012a) and proton nuclear magnetic resonance (NMR)
spectroscopy (Kristensen et al., 2010; Savorani et al., 2010a) are the two key technological
platforms in the field. Especially, NMR profiling of blood serum and plasma has shown to be
promising in the characterisation and quantification of lipoprotein subclasses and in turn
identification of early biomarkers associated with the risk of cardiovascular disease (Ala-
Korpela, 2008; Otvos et al., 1992). Earlier we used multivariate calibration for NMR
quantification of lipoprotein main- and subfractions in human plasma samples (Dyrby et al.,
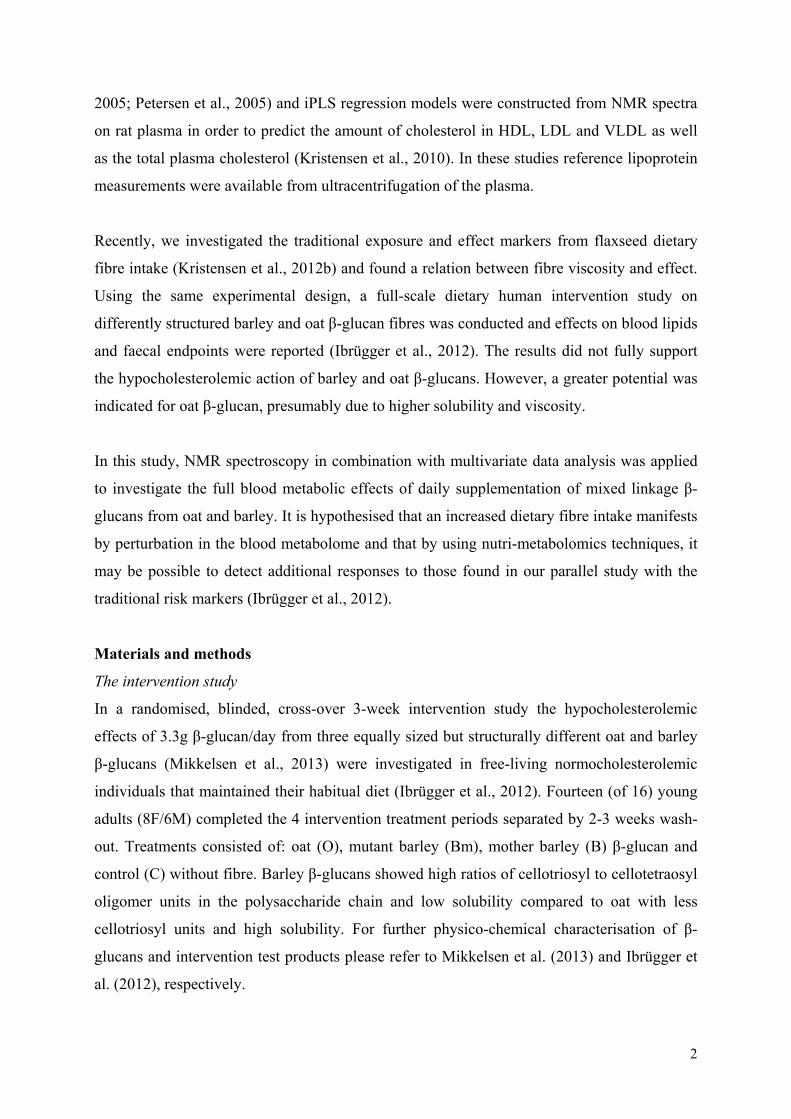
2
2005; Petersen et al., 2005) and iPLS regression models were constructed from NMR spectra
on rat plasma in order to predict the amount of cholesterol in HDL, LDL and VLDL as well
as the total plasma cholesterol (Kristensen et al., 2010). In these studies reference lipoprotein
measurements were available from ultracentrifugation of the plasma.
Recently, we investigated the traditional exposure and effect markers from flaxseed dietary
fibre intake (Kristensen et al., 2012b) and found a relation between fibre viscosity and effect.
Using the same experimental design, a full-scale dietary human intervention study on
differently structured barley and oat β-glucan fibres was conducted and effects on blood lipids
and faecal endpoints were reported (Ibrügger et al., 2012). The results did not fully support
the hypocholesterolemic action of barley and oat β-glucans. However, a greater potential was
indicated for oat β-glucan, presumably due to higher solubility and viscosity.
In this study, NMR spectroscopy in combination with multivariate data analysis was applied
to investigate the full blood metabolic effects of daily supplementation of mixed linkage β-
glucans from oat and barley. It is hypothesised that an increased dietary fibre intake manifests
by perturbation in the blood metabolome and that by using nutri-metabolomics techniques, it
may be possible to detect additional responses to those found in our parallel study with the
traditional risk markers (Ibrügger et al., 2012).
Materials and methods
The intervention study
In a randomised, blinded, cross-over 3-week intervention study the hypocholesterolemic
effects of 3.3g β-glucan/day from three equally sized but structurally different oat and barley
β-glucans (Mikkelsen et al., 2013) were investigated in free-living normocholesterolemic
individuals that maintained their habitual diet (Ibrügger et al., 2012). Fourteen (of 16) young
adults (8F/6M) completed the 4 intervention treatment periods separated by 2-3 weeks wash-
out. Treatments consisted of: oat (O), mutant barley (Bm), mother barley (B) β-glucan and
control (C) without fibre. Barley β-glucans showed high ratios of cellotriosyl to cellotetraosyl
oligomer units in the polysaccharide chain and low solubility compared to oat with less
cellotriosyl units and high solubility. For further physico-chemical characterisation of β-
glucans and intervention test products please refer to Mikkelsen et al. (2013) and Ibrügger et
al. (2012), respectively.
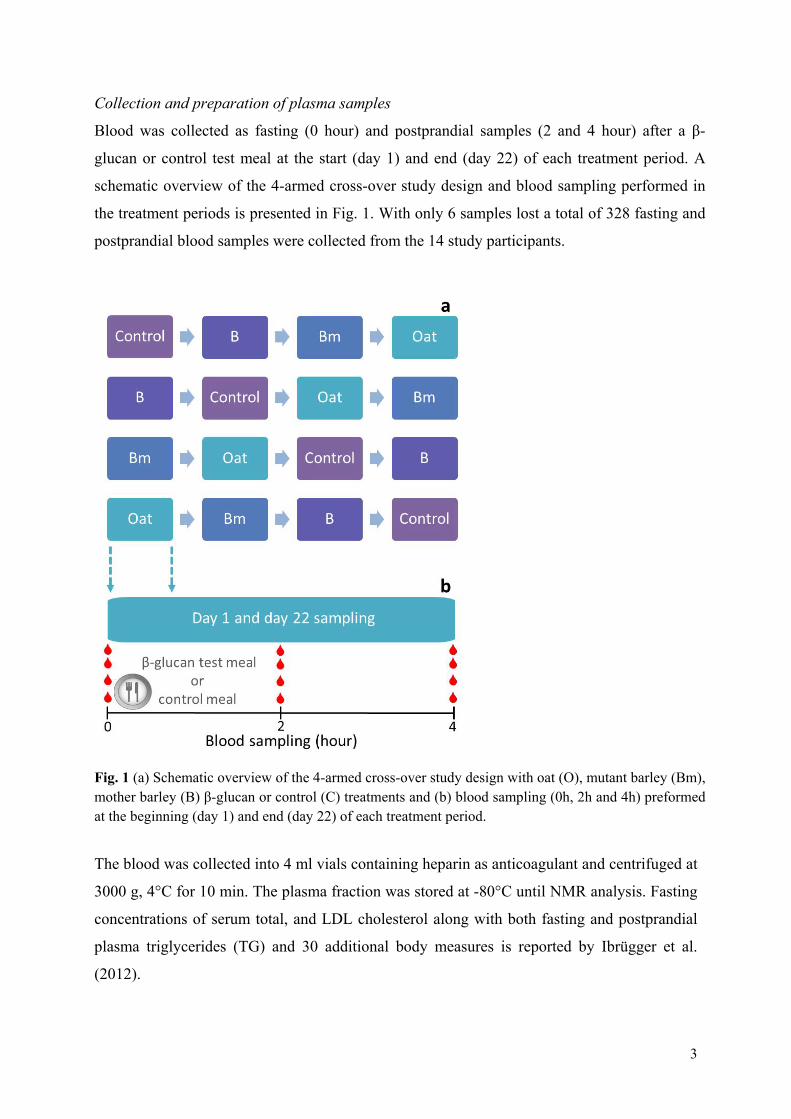
3
Collection and preparation of plasma samples
Blood was collected as fasting (0 hour) and postprandial samples (2 and 4 hour) after a β-
glucan or control test meal at the start (day 1) and end (day 22) of each treatment period. A
schematic overview of the 4-armed cross-over study design and blood sampling performed in
the treatment periods is presented in Fig. 1. With only 6 samples lost a total of 328 fasting and
postprandial blood samples were collected from the 14 study participants.
Fig. 1 (a) Schematic overview of the 4-armed cross-over study design with oat (O), mutant barley (Bm), mother barley (B) β-glucan or control (C) treatments and (b) blood sampling (0h, 2h and 4h) preformed at the beginning (day 1) and end (day 22) of each treatment period.
The blood was collected into 4 ml vials containing heparin as anticoagulant and centrifuged at
3000 g, 4°C for 10 min. The plasma fraction was stored at -80°C until NMR analysis. Fasting
concentrations of serum total, and LDL cholesterol along with both fasting and postprandial
plasma triglycerides (TG) and 30 additional body measures is reported by Ibrügger et al.
(2012).
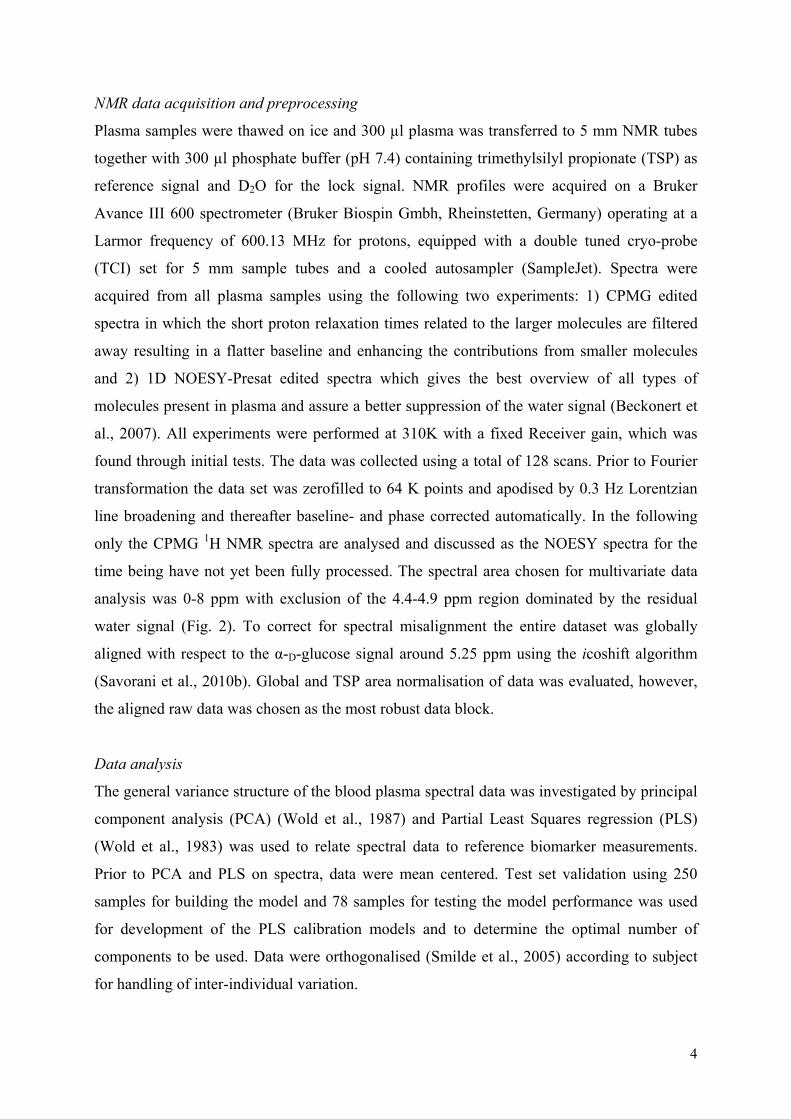
4
NMR data acquisition and preprocessing
Plasma samples were thawed on ice and 300 µl plasma was transferred to 5 mm NMR tubes
together with 300 µl phosphate buffer (pH 7.4) containing trimethylsilyl propionate (TSP) as
reference signal and D2O for the lock signal. NMR profiles were acquired on a Bruker
Avance III 600 spectrometer (Bruker Biospin Gmbh, Rheinstetten, Germany) operating at a
Larmor frequency of 600.13 MHz for protons, equipped with a double tuned cryo-probe
(TCI) set for 5 mm sample tubes and a cooled autosampler (SampleJet). Spectra were
acquired from all plasma samples using the following two experiments: 1) CPMG edited
spectra in which the short proton relaxation times related to the larger molecules are filtered
away resulting in a flatter baseline and enhancing the contributions from smaller molecules
and 2) 1D NOESY-Presat edited spectra which gives the best overview of all types of
molecules present in plasma and assure a better suppression of the water signal (Beckonert et
al., 2007). All experiments were performed at 310K with a fixed Receiver gain, which was
found through initial tests. The data was collected using a total of 128 scans. Prior to Fourier
transformation the data set was zerofilled to 64 K points and apodised by 0.3 Hz Lorentzian
line broadening and thereafter baseline- and phase corrected automatically. In the following
only the CPMG 1H NMR spectra are analysed and discussed as the NOESY spectra for the
time being have not yet been fully processed. The spectral area chosen for multivariate data
analysis was 0-8 ppm with exclusion of the 4.4-4.9 ppm region dominated by the residual
water signal (Fig. 2). To correct for spectral misalignment the entire dataset was globally
aligned with respect to the α-D-glucose signal around 5.25 ppm using the icoshift algorithm
(Savorani et al., 2010b). Global and TSP area normalisation of data was evaluated, however,
the aligned raw data was chosen as the most robust data block.
Data analysis
The general variance structure of the blood plasma spectral data was investigated by principal
component analysis (PCA) (Wold et al., 1987) and Partial Least Squares regression (PLS)
(Wold et al., 1983) was used to relate spectral data to reference biomarker measurements.
Prior to PCA and PLS on spectra, data were mean centered. Test set validation using 250
samples for building the model and 78 samples for testing the model performance was used
for development of the PLS calibration models and to determine the optimal number of
components to be used. Data were orthogonalised (Smilde et al., 2005) according to subject
for handling of inter-individual variation.
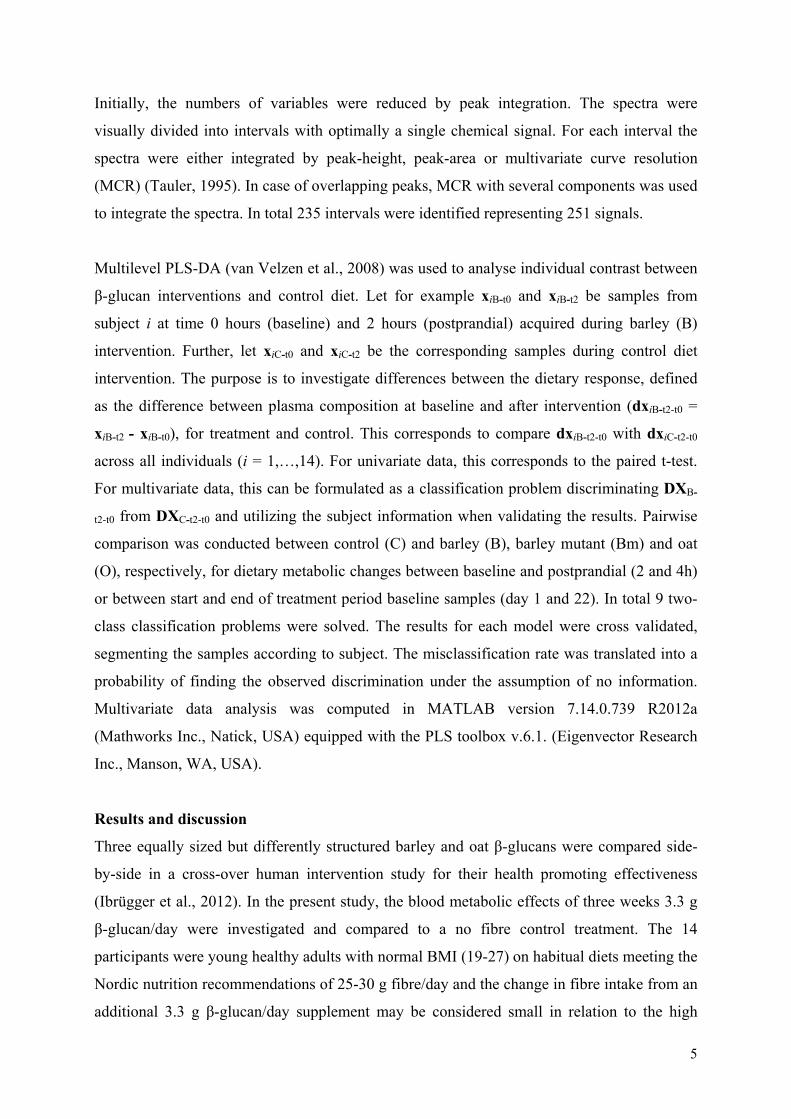
5
Initially, the numbers of variables were reduced by peak integration. The spectra were
visually divided into intervals with optimally a single chemical signal. For each interval the
spectra were either integrated by peak-height, peak-area or multivariate curve resolution
(MCR) (Tauler, 1995). In case of overlapping peaks, MCR with several components was used
to integrate the spectra. In total 235 intervals were identified representing 251 signals.
Multilevel PLS-DA (van Velzen et al., 2008) was used to analyse individual contrast between
β-glucan interventions and control diet. Let for example xiB-t0 and xiB-t2 be samples from
subject i at time 0 hours (baseline) and 2 hours (postprandial) acquired during barley (B)
intervention. Further, let xiC-t0 and xiC-t2 be the corresponding samples during control diet
intervention. The purpose is to investigate differences between the dietary response, defined
as the difference between plasma composition at baseline and after intervention (dxiB-t2-t0 =
xiB-t2 - xiB-t0), for treatment and control. This corresponds to compare dxiB-t2-t0 with dxiC-t2-t0
across all individuals (i = 1,…,14). For univariate data, this corresponds to the paired t-test.
For multivariate data, this can be formulated as a classification problem discriminating DXB-
t2-t0 from DXC-t2-t0 and utilizing the subject information when validating the results. Pairwise
comparison was conducted between control (C) and barley (B), barley mutant (Bm) and oat
(O), respectively, for dietary metabolic changes between baseline and postprandial (2 and 4h)
or between start and end of treatment period baseline samples (day 1 and 22). In total 9 two-
class classification problems were solved. The results for each model were cross validated,
segmenting the samples according to subject. The misclassification rate was translated into a
probability of finding the observed discrimination under the assumption of no information.
Multivariate data analysis was computed in MATLAB version 7.14.0.739 R2012a
(Mathworks Inc., Natick, USA) equipped with the PLS toolbox v.6.1. (Eigenvector Research
Inc., Manson, WA, USA).
Results and discussion
Three equally sized but differently structured barley and oat β-glucans were compared side-
by-side in a cross-over human intervention study for their health promoting effectiveness
(Ibrügger et al., 2012). In the present study, the blood metabolic effects of three weeks 3.3 g
β-glucan/day were investigated and compared to a no fibre control treatment. The 14
participants were young healthy adults with normal BMI (19-27) on habitual diets meeting the
Nordic nutrition recommendations of 25-30 g fibre/day and the change in fibre intake from an
additional 3.3 g β-glucan/day supplement may be considered small in relation to the high
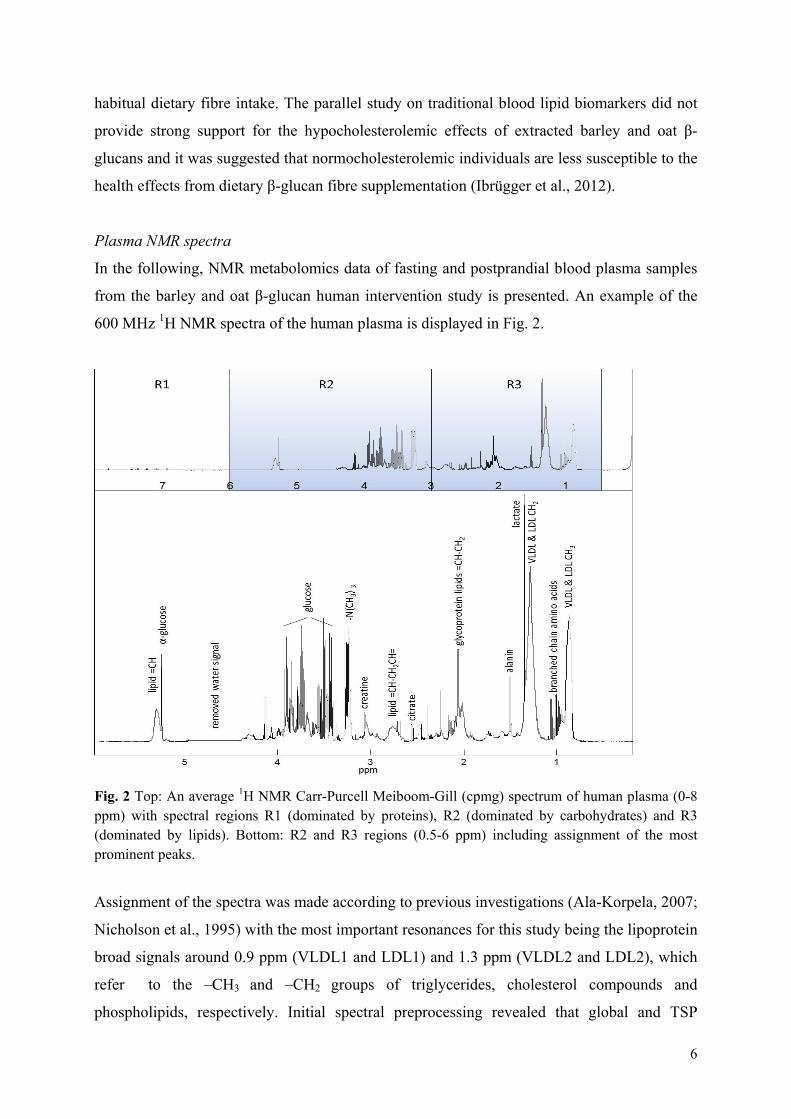
6
habitual dietary fibre intake. The parallel study on traditional blood lipid biomarkers did not
provide strong support for the hypocholesterolemic effects of extracted barley and oat β-
glucans and it was suggested that normocholesterolemic individuals are less susceptible to the
health effects from dietary β-glucan fibre supplementation (Ibrügger et al., 2012).
Plasma NMR spectra
In the following, NMR metabolomics data of fasting and postprandial blood plasma samples
from the barley and oat β-glucan human intervention study is presented. An example of the
600 MHz 1H NMR spectra of the human plasma is displayed in Fig. 2.
Fig. 2 Top: An average 1H NMR Carr-Purcell Meiboom-Gill (cpmg) spectrum of human plasma (0-8 ppm) with spectral regions R1 (dominated by proteins), R2 (dominated by carbohydrates) and R3 (dominated by lipids). Bottom: R2 and R3 regions (0.5-6 ppm) including assignment of the most prominent peaks.
Assignment of the spectra was made according to previous investigations (Ala-Korpela, 2007;
Nicholson et al., 1995) with the most important resonances for this study being the lipoprotein
broad signals around 0.9 ppm (VLDL1 and LDL1) and 1.3 ppm (VLDL2 and LDL2), which
refer to the –CH3 and –CH2 groups of triglycerides, cholesterol compounds and
phospholipids, respectively. Initial spectral preprocessing revealed that global and TSP
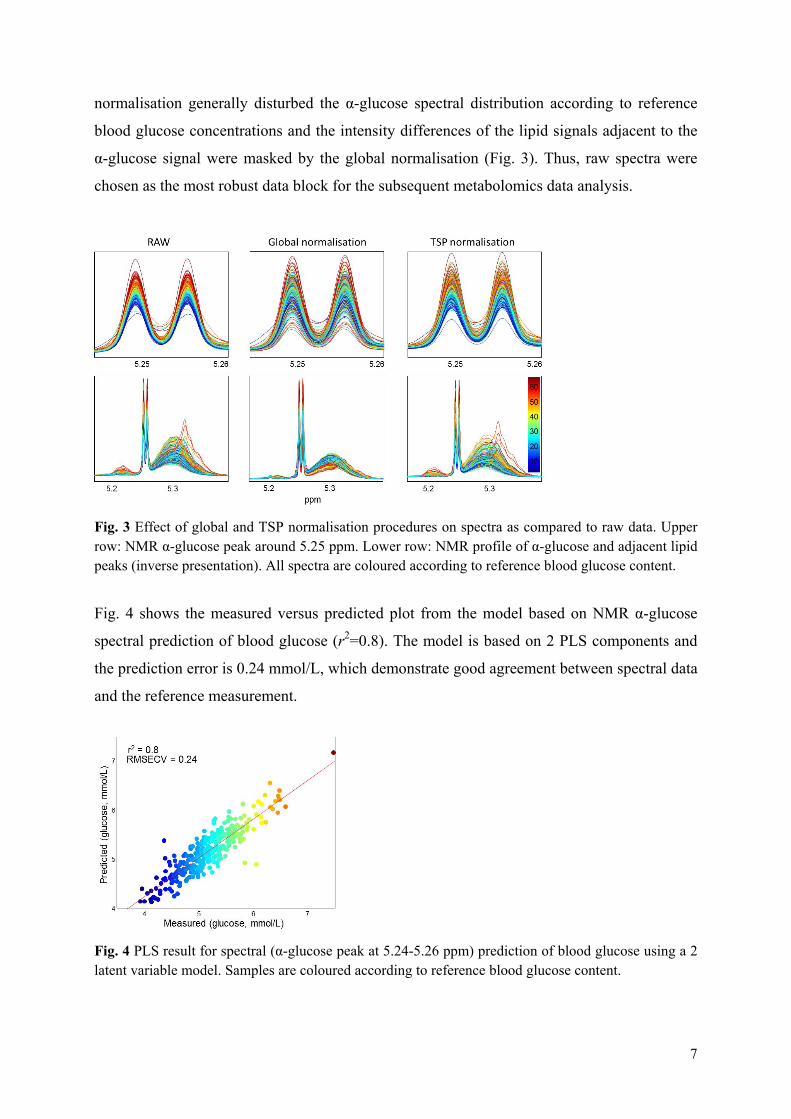
7
normalisation generally disturbed the α-glucose spectral distribution according to reference
blood glucose concentrations and the intensity differences of the lipid signals adjacent to the
α-glucose signal were masked by the global normalisation (Fig. 3). Thus, raw spectra were
chosen as the most robust data block for the subsequent metabolomics data analysis.
Fig. 3 Effect of global and TSP normalisation procedures on spectra as compared to raw data. Upper row: NMR α-glucose peak around 5.25 ppm. Lower row: NMR profile of α-glucose and adjacent lipid peaks (inverse presentation). All spectra are coloured according to reference blood glucose content.
Fig. 4 shows the measured versus predicted plot from the model based on NMR α-glucose
spectral prediction of blood glucose (r2=0.8). The model is based on 2 PLS components and
the prediction error is 0.24 mmol/L, which demonstrate good agreement between spectral data
and the reference measurement.
Fig. 4 PLS result for spectral (α-glucose peak at 5.24-5.26 ppm) prediction of blood glucose using a 2 latent variable model. Samples are coloured according to reference blood glucose content.
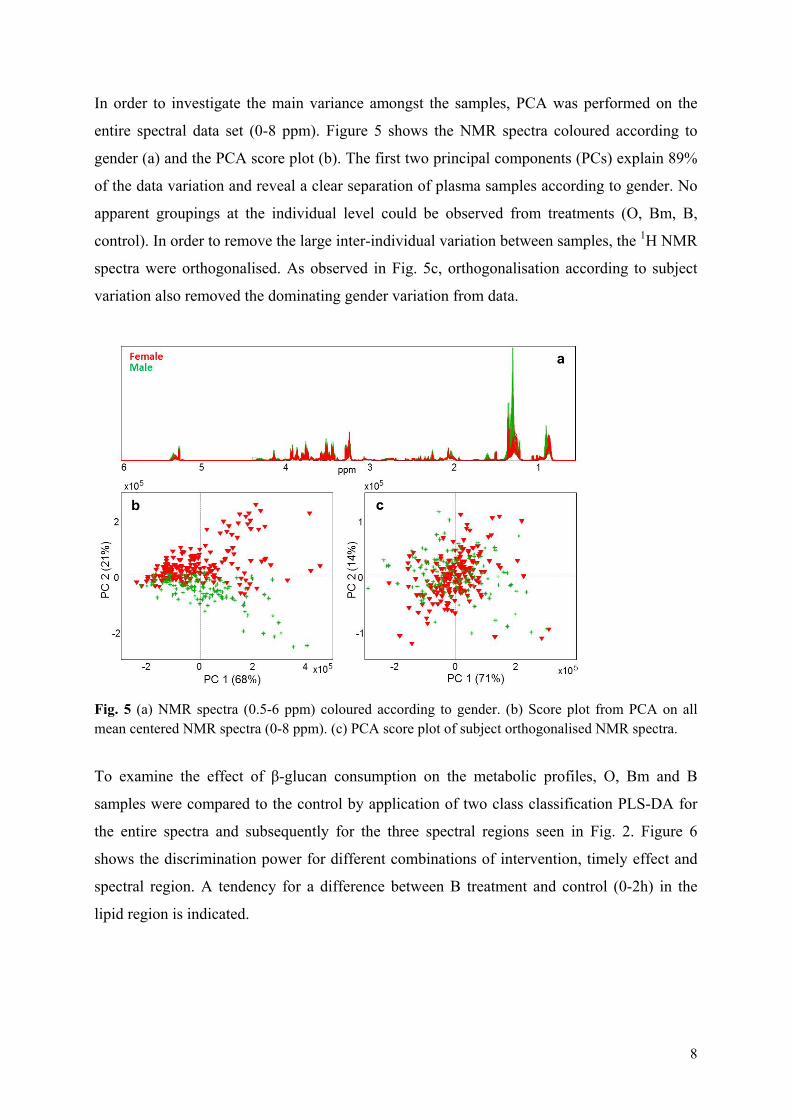
8
In order to investigate the main variance amongst the samples, PCA was performed on the
entire spectral data set (0-8 ppm). Figure 5 shows the NMR spectra coloured according to
gender (a) and the PCA score plot (b). The first two principal components (PCs) explain 89%
of the data variation and reveal a clear separation of plasma samples according to gender. No
apparent groupings at the individual level could be observed from treatments (O, Bm, B,
control). In order to remove the large inter-individual variation between samples, the 1H NMR
spectra were orthogonalised. As observed in Fig. 5c, orthogonalisation according to subject
variation also removed the dominating gender variation from data.
Fig. 5 (a) NMR spectra (0.5-6 ppm) coloured according to gender. (b) Score plot from PCA on all mean centered NMR spectra (0-8 ppm). (c) PCA score plot of subject orthogonalised NMR spectra.
To examine the effect of β-glucan consumption on the metabolic profiles, O, Bm and B
samples were compared to the control by application of two class classification PLS-DA for
the entire spectra and subsequently for the three spectral regions seen in Fig. 2. Figure 6
shows the discrimination power for different combinations of intervention, timely effect and
spectral region. A tendency for a difference between B treatment and control (0-2h) in the
lipid region is indicated.
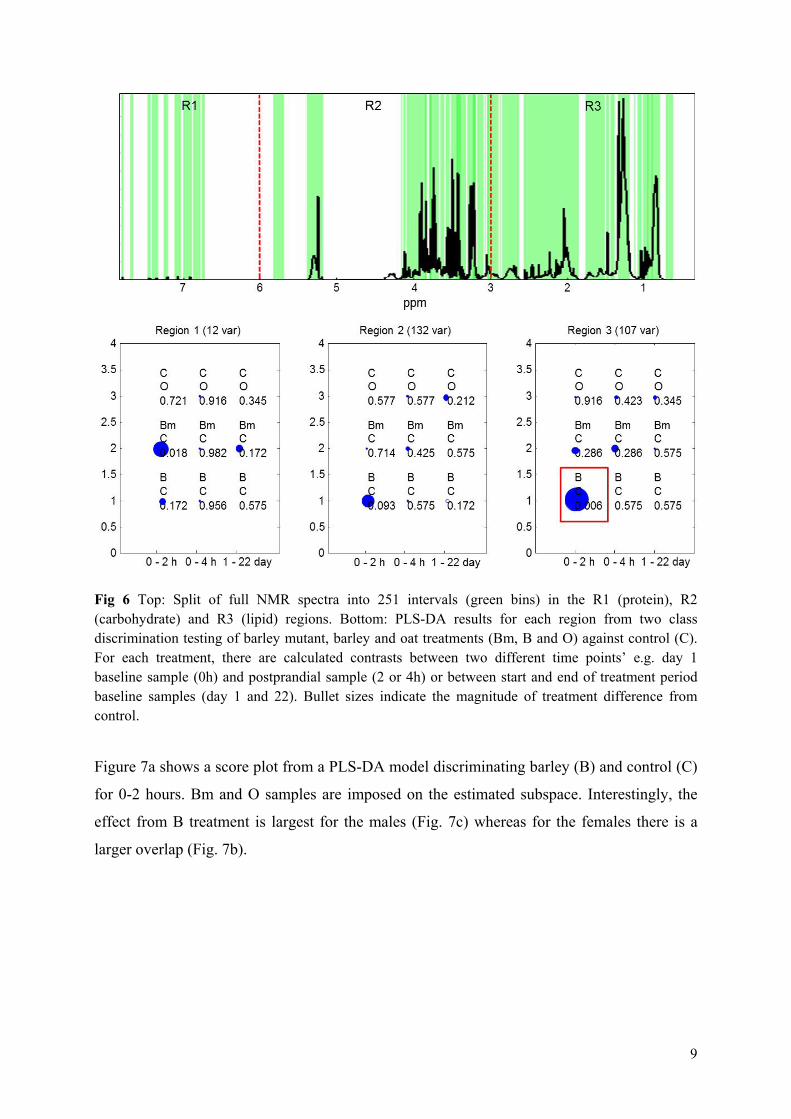
9
Fig 6 Top: Split of full NMR spectra into 251 intervals (green bins) in the R1 (protein), R2 (carbohydrate) and R3 (lipid) regions. Bottom: PLS-DA results for each region from two class discrimination testing of barley mutant, barley and oat treatments (Bm, B and O) against control (C). For each treatment, there are calculated contrasts between two different time points’ e.g. day 1 baseline sample (0h) and postprandial sample (2 or 4h) or between start and end of treatment period baseline samples (day 1 and 22). Bullet sizes indicate the magnitude of treatment difference from control.
Figure 7a shows a score plot from a PLS-DA model discriminating barley (B) and control (C)
for 0-2 hours. Bm and O samples are imposed on the estimated subspace. Interestingly, the
effect from B treatment is largest for the males (Fig. 7c) whereas for the females there is a
larger overlap (Fig. 7b).
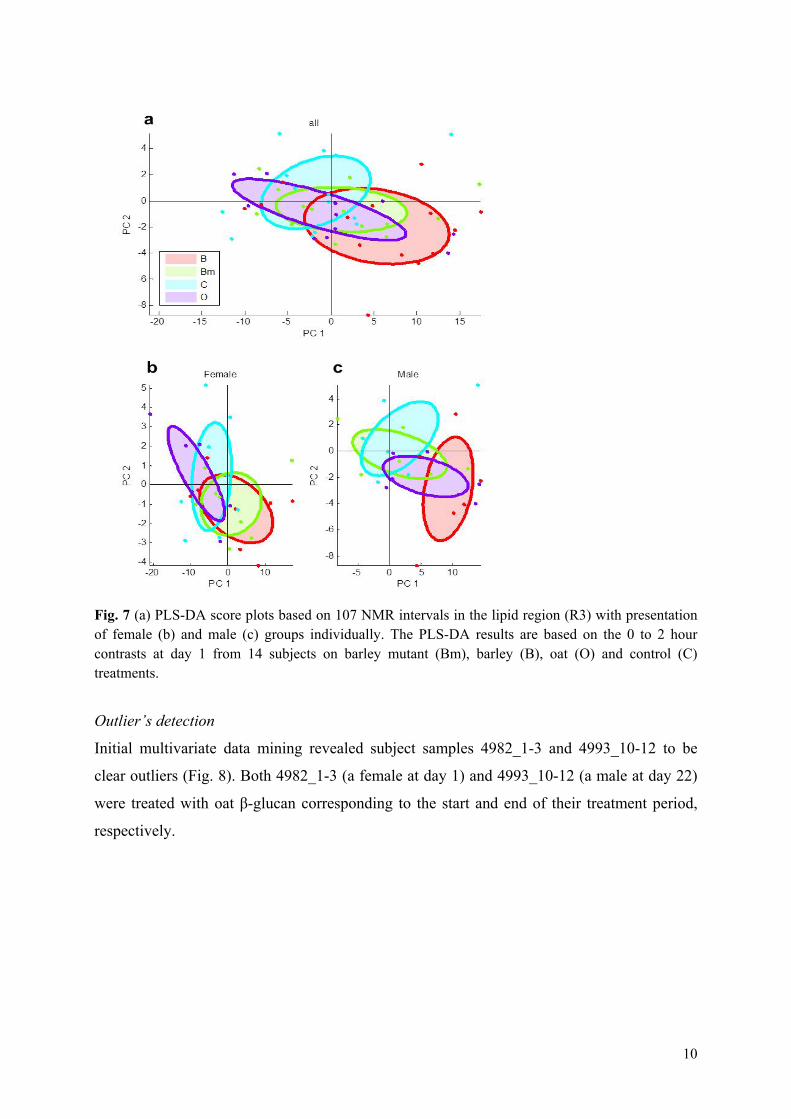
10
Fig. 7 (a) PLS-DA score plots based on 107 NMR intervals in the lipid region (R3) with presentation of female (b) and male (c) groups individually. The PLS-DA results are based on the 0 to 2 hour contrasts at day 1 from 14 subjects on barley mutant (Bm), barley (B), oat (O) and control (C) treatments.
Outlier’s detection
Initial multivariate data mining revealed subject samples 4982_1-3 and 4993_10-12 to be
clear outliers (Fig. 8). Both 4982_1-3 (a female at day 1) and 4993_10-12 (a male at day 22)
were treated with oat β-glucan corresponding to the start and end of their treatment period,
respectively.
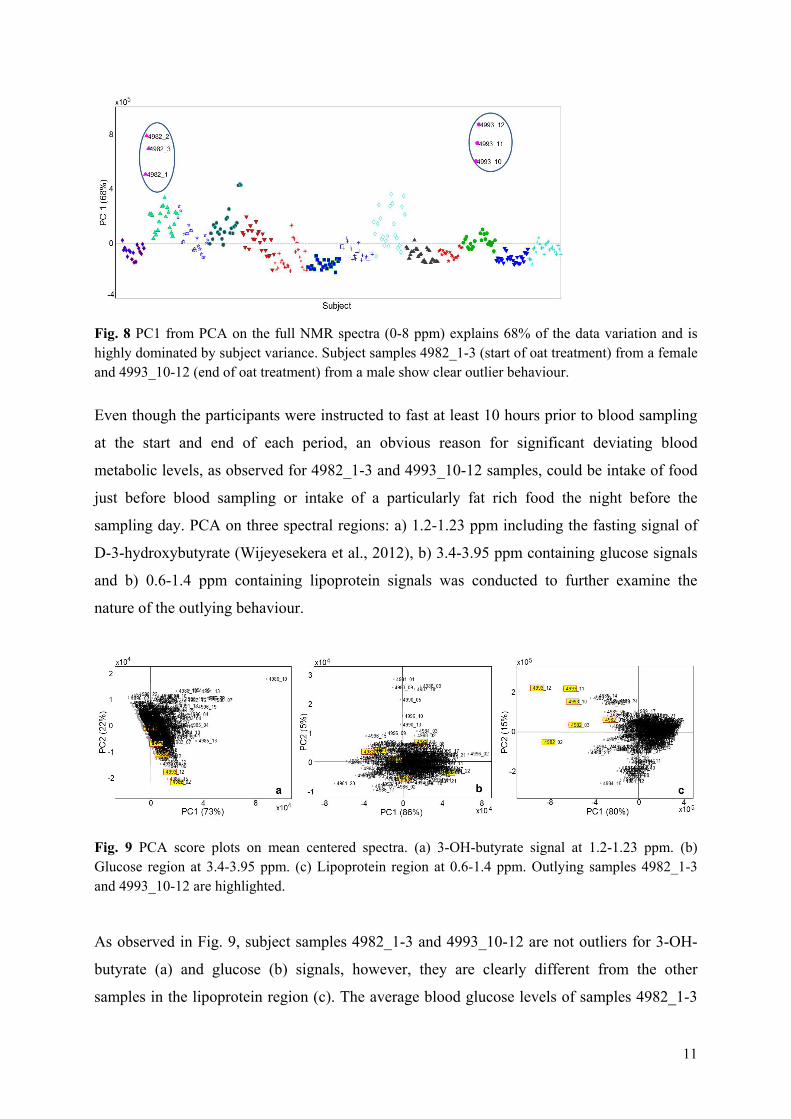
11
Fig. 8 PC1 from PCA on the full NMR spectra (0-8 ppm) explains 68% of the data variation and is highly dominated by subject variance. Subject samples 4982_1-3 (start of oat treatment) from a female and 4993_10-12 (end of oat treatment) from a male show clear outlier behaviour.
Even though the participants were instructed to fast at least 10 hours prior to blood sampling
at the start and end of each period, an obvious reason for significant deviating blood
metabolic levels, as observed for 4982_1-3 and 4993_10-12 samples, could be intake of food
just before blood sampling or intake of a particularly fat rich food the night before the
sampling day. PCA on three spectral regions: a) 1.2-1.23 ppm including the fasting signal of
D-3-hydroxybutyrate (Wijeyesekera et al., 2012), b) 3.4-3.95 ppm containing glucose signals
and b) 0.6-1.4 ppm containing lipoprotein signals was conducted to further examine the
nature of the outlying behaviour.
Fig. 9 PCA score plots on mean centered spectra. (a) 3-OH-butyrate signal at 1.2-1.23 ppm. (b) Glucose region at 3.4-3.95 ppm. (c) Lipoprotein region at 0.6-1.4 ppm. Outlying samples 4982_1-3 and 4993_10-12 are highlighted.
As observed in Fig. 9, subject samples 4982_1-3 and 4993_10-12 are not outliers for 3-OH-
butyrate (a) and glucose (b) signals, however, they are clearly different from the other
samples in the lipoprotein region (c). The average blood glucose levels of samples 4982_1-3
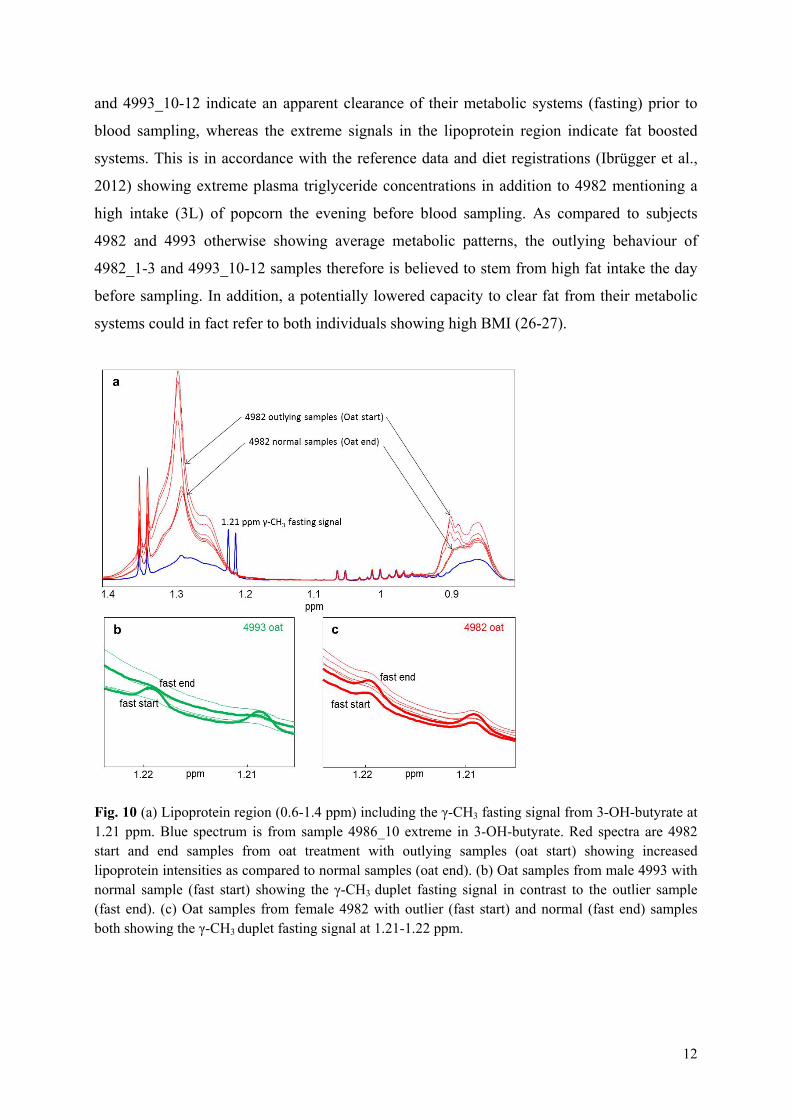
12
and 4993_10-12 indicate an apparent clearance of their metabolic systems (fasting) prior to
blood sampling, whereas the extreme signals in the lipoprotein region indicate fat boosted
systems. This is in accordance with the reference data and diet registrations (Ibrügger et al.,
2012) showing extreme plasma triglyceride concentrations in addition to 4982 mentioning a
high intake (3L) of popcorn the evening before blood sampling. As compared to subjects
4982 and 4993 otherwise showing average metabolic patterns, the outlying behaviour of
4982_1-3 and 4993_10-12 samples therefore is believed to stem from high fat intake the day
before sampling. In addition, a potentially lowered capacity to clear fat from their metabolic
systems could in fact refer to both individuals showing high BMI (26-27).
Fig. 10 (a) Lipoprotein region (0.6-1.4 ppm) including the γ-CH3 fasting signal from 3-OH-butyrate at 1.21 ppm. Blue spectrum is from sample 4986_10 extreme in 3-OH-butyrate. Red spectra are 4982 start and end samples from oat treatment with outlying samples (oat start) showing increased lipoprotein intensities as compared to normal samples (oat end). (b) Oat samples from male 4993 with normal sample (fast start) showing the γ-CH3 duplet fasting signal in contrast to the outlier sample (fast end). (c) Oat samples from female 4982 with outlier (fast start) and normal (fast end) samples both showing the γ-CH3 duplet fasting signal at 1.21-1.22 ppm.
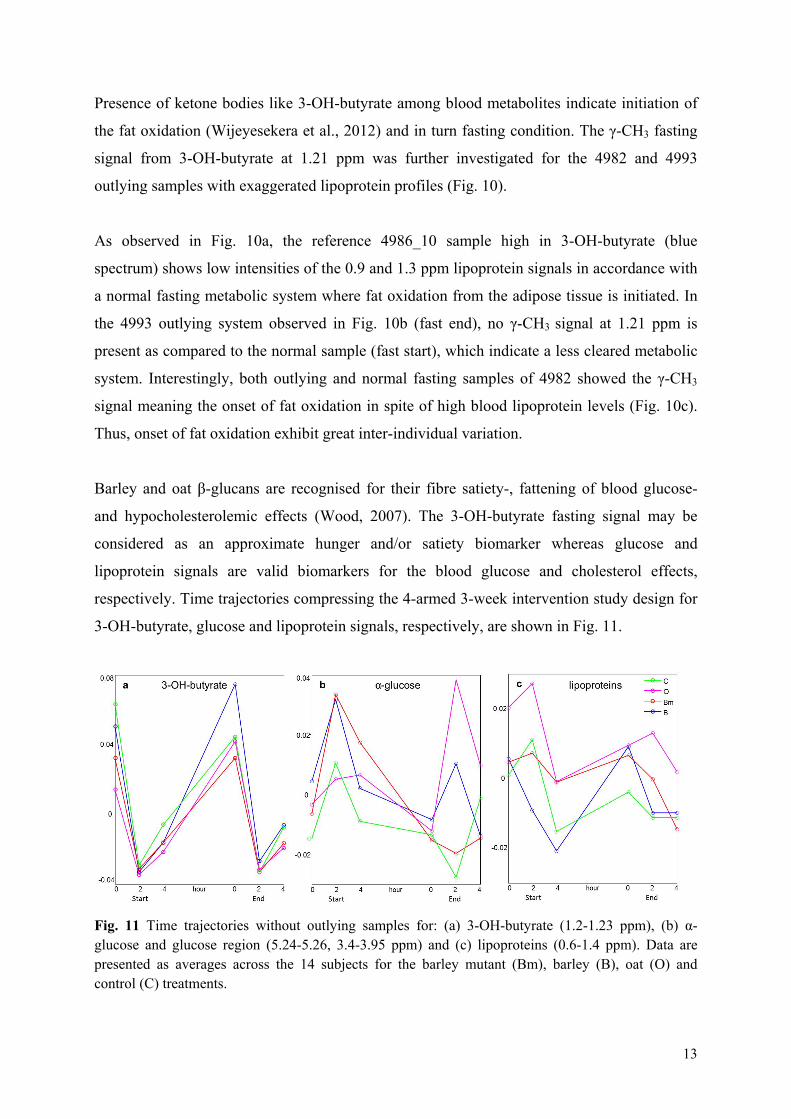
13
Presence of ketone bodies like 3-OH-butyrate among blood metabolites indicate initiation of
the fat oxidation (Wijeyesekera et al., 2012) and in turn fasting condition. The γ-CH3 fasting
signal from 3-OH-butyrate at 1.21 ppm was further investigated for the 4982 and 4993
outlying samples with exaggerated lipoprotein profiles (Fig. 10).
As observed in Fig. 10a, the reference 4986_10 sample high in 3-OH-butyrate (blue
spectrum) shows low intensities of the 0.9 and 1.3 ppm lipoprotein signals in accordance with
a normal fasting metabolic system where fat oxidation from the adipose tissue is initiated. In
the 4993 outlying system observed in Fig. 10b (fast end), no γ-CH3 signal at 1.21 ppm is
present as compared to the normal sample (fast start), which indicate a less cleared metabolic
system. Interestingly, both outlying and normal fasting samples of 4982 showed the γ-CH3
signal meaning the onset of fat oxidation in spite of high blood lipoprotein levels (Fig. 10c).
Thus, onset of fat oxidation exhibit great inter-individual variation.
Barley and oat β-glucans are recognised for their fibre satiety-, fattening of blood glucose-
and hypocholesterolemic effects (Wood, 2007). The 3-OH-butyrate fasting signal may be
considered as an approximate hunger and/or satiety biomarker whereas glucose and
lipoprotein signals are valid biomarkers for the blood glucose and cholesterol effects,
respectively. Time trajectories compressing the 4-armed 3-week intervention study design for
3-OH-butyrate, glucose and lipoprotein signals, respectively, are shown in Fig. 11.
Fig. 11 Time trajectories without outlying samples for: (a) 3-OH-butyrate (1.2-1.23 ppm), (b) α-glucose and glucose region (5.24-5.26, 3.4-3.95 ppm) and (c) lipoproteins (0.6-1.4 ppm). Data are presented as averages across the 14 subjects for the barley mutant (Bm), barley (B), oat (O) and control (C) treatments.
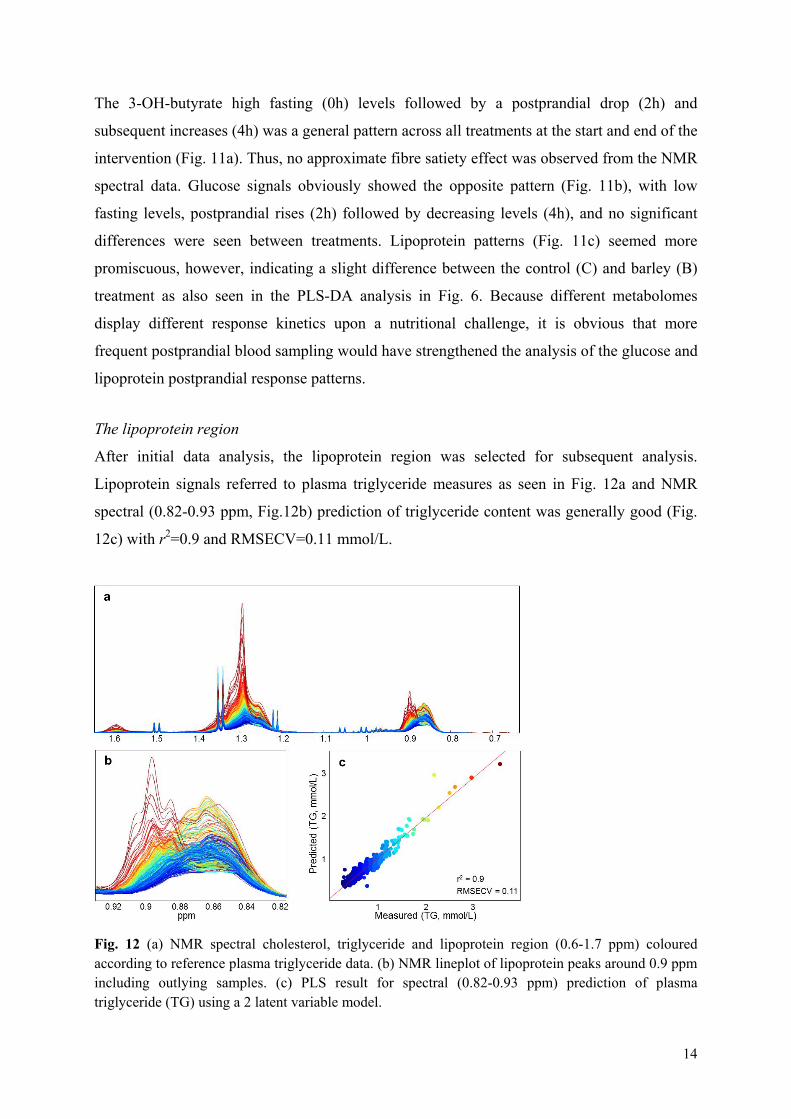
14
The 3-OH-butyrate high fasting (0h) levels followed by a postprandial drop (2h) and
subsequent increases (4h) was a general pattern across all treatments at the start and end of the
intervention (Fig. 11a). Thus, no approximate fibre satiety effect was observed from the NMR
spectral data. Glucose signals obviously showed the opposite pattern (Fig. 11b), with low
fasting levels, postprandial rises (2h) followed by decreasing levels (4h), and no significant
differences were seen between treatments. Lipoprotein patterns (Fig. 11c) seemed more
promiscuous, however, indicating a slight difference between the control (C) and barley (B)
treatment as also seen in the PLS-DA analysis in Fig. 6. Because different metabolomes
display different response kinetics upon a nutritional challenge, it is obvious that more
frequent postprandial blood sampling would have strengthened the analysis of the glucose and
lipoprotein postprandial response patterns.
The lipoprotein region
After initial data analysis, the lipoprotein region was selected for subsequent analysis.
Lipoprotein signals referred to plasma triglyceride measures as seen in Fig. 12a and NMR
spectral (0.82-0.93 ppm, Fig.12b) prediction of triglyceride content was generally good (Fig.
12c) with r2=0.9 and RMSECV=0.11 mmol/L.
Fig. 12 (a) NMR spectral cholesterol, triglyceride and lipoprotein region (0.6-1.7 ppm) coloured according to reference plasma triglyceride data. (b) NMR lineplot of lipoprotein peaks around 0.9 ppm including outlying samples. (c) PLS result for spectral (0.82-0.93 ppm) prediction of plasma triglyceride (TG) using a 2 latent variable model.
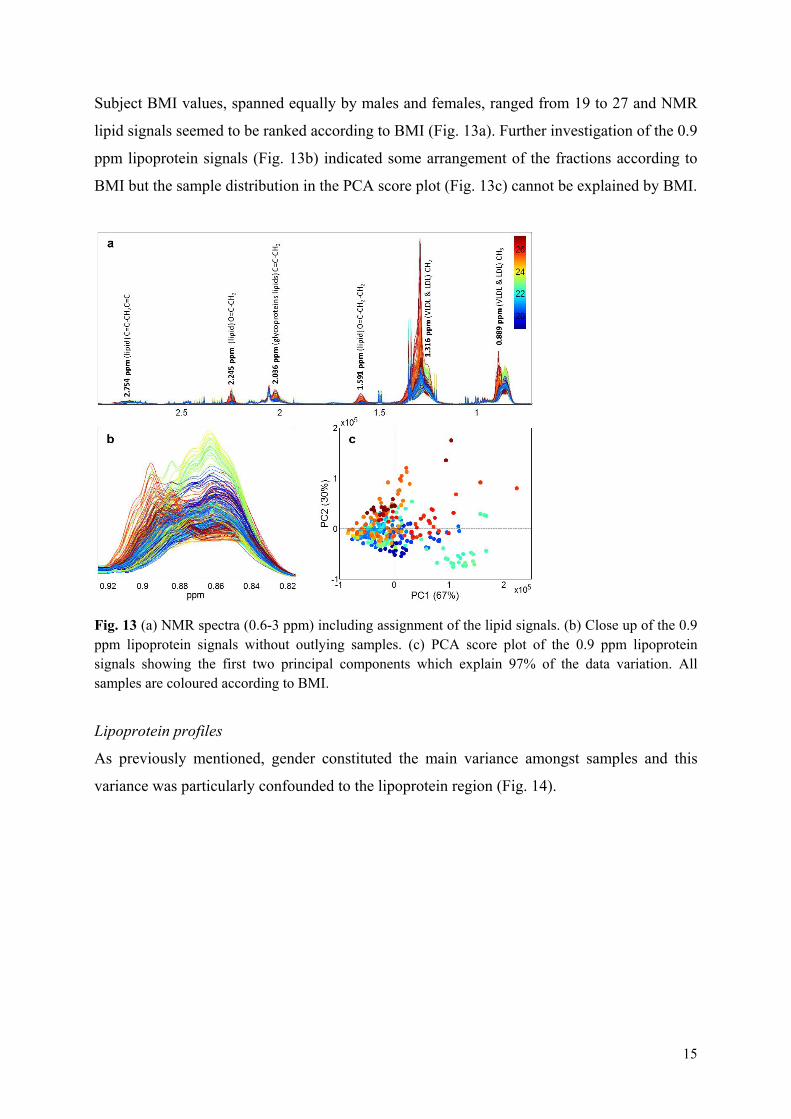
15
Subject BMI values, spanned equally by males and females, ranged from 19 to 27 and NMR
lipid signals seemed to be ranked according to BMI (Fig. 13a). Further investigation of the 0.9
ppm lipoprotein signals (Fig. 13b) indicated some arrangement of the fractions according to
BMI but the sample distribution in the PCA score plot (Fig. 13c) cannot be explained by BMI.
Fig. 13 (a) NMR spectra (0.6-3 ppm) including assignment of the lipid signals. (b) Close up of the 0.9 ppm lipoprotein signals without outlying samples. (c) PCA score plot of the 0.9 ppm lipoprotein signals showing the first two principal components which explain 97% of the data variation. All samples are coloured according to BMI.
Lipoprotein profiles
As previously mentioned, gender constituted the main variance amongst samples and this
variance was particularly confounded to the lipoprotein region (Fig. 14).
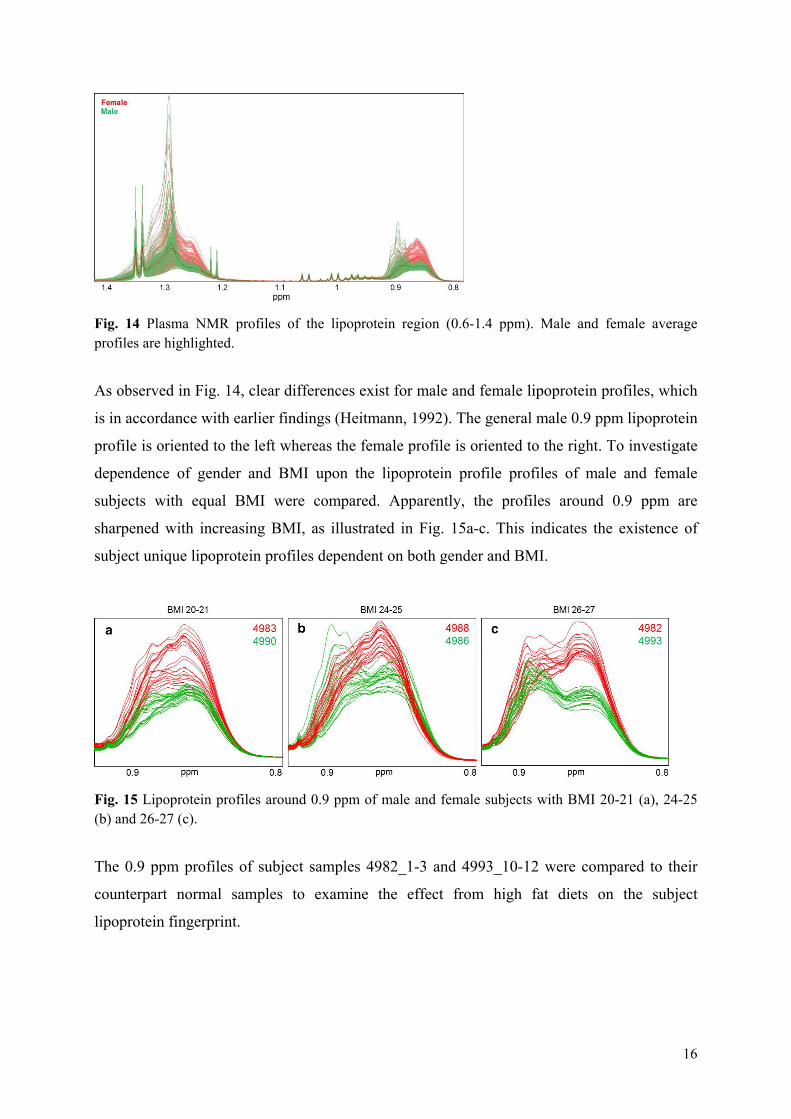
16
Fig. 14 Plasma NMR profiles of the lipoprotein region (0.6-1.4 ppm). Male and female average profiles are highlighted.
As observed in Fig. 14, clear differences exist for male and female lipoprotein profiles, which
is in accordance with earlier findings (Heitmann, 1992). The general male 0.9 ppm lipoprotein
profile is oriented to the left whereas the female profile is oriented to the right. To investigate
dependence of gender and BMI upon the lipoprotein profile profiles of male and female
subjects with equal BMI were compared. Apparently, the profiles around 0.9 ppm are
sharpened with increasing BMI, as illustrated in Fig. 15a-c. This indicates the existence of
subject unique lipoprotein profiles dependent on both gender and BMI.
Fig. 15 Lipoprotein profiles around 0.9 ppm of male and female subjects with BMI 20-21 (a), 24-25 (b) and 26-27 (c).
The 0.9 ppm profiles of subject samples 4982_1-3 and 4993_10-12 were compared to their
counterpart normal samples to examine the effect from high fat diets on the subject
lipoprotein fingerprint.
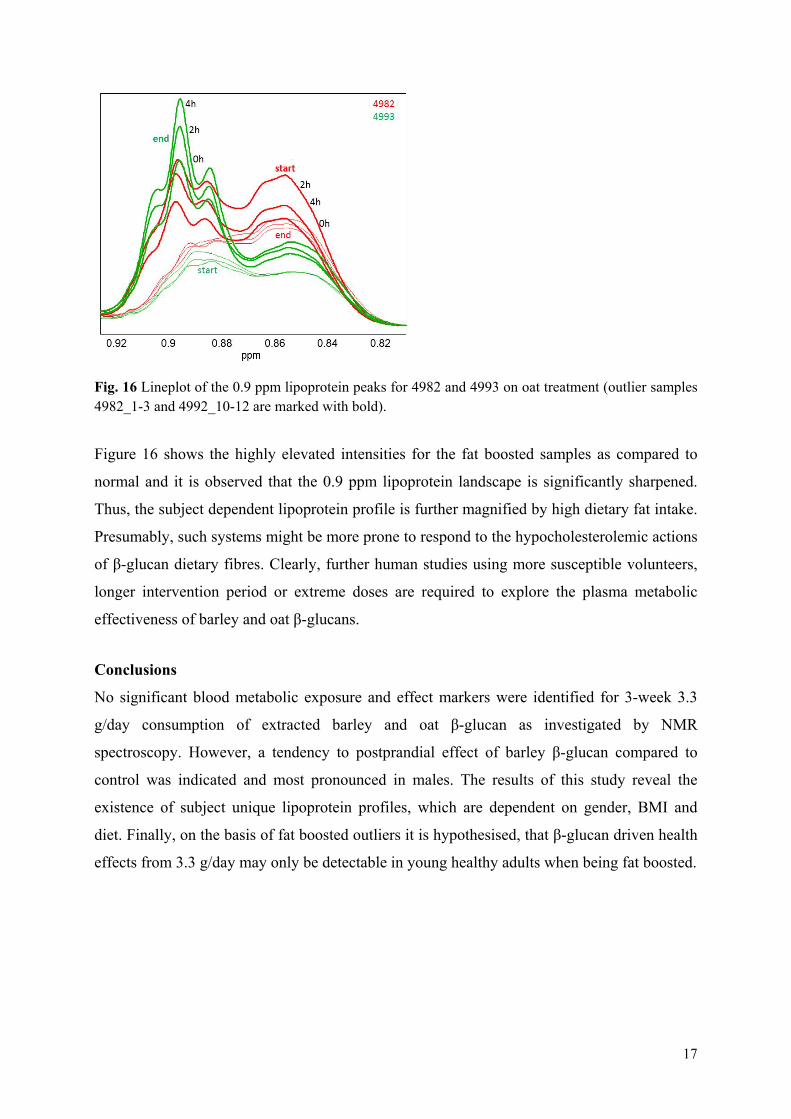
17
Fig. 16 Lineplot of the 0.9 ppm lipoprotein peaks for 4982 and 4993 on oat treatment (outlier samples 4982_1-3 and 4992_10-12 are marked with bold).
Figure 16 shows the highly elevated intensities for the fat boosted samples as compared to
normal and it is observed that the 0.9 ppm lipoprotein landscape is significantly sharpened.
Thus, the subject dependent lipoprotein profile is further magnified by high dietary fat intake.
Presumably, such systems might be more prone to respond to the hypocholesterolemic actions
of β-glucan dietary fibres. Clearly, further human studies using more susceptible volunteers,
longer intervention period or extreme doses are required to explore the plasma metabolic
effectiveness of barley and oat β-glucans.
Conclusions
No significant blood metabolic exposure and effect markers were identified for 3-week 3.3
g/day consumption of extracted barley and oat β-glucan as investigated by NMR
spectroscopy. However, a tendency to postprandial effect of barley β-glucan compared to
control was indicated and most pronounced in males. The results of this study reveal the
existence of subject unique lipoprotein profiles, which are dependent on gender, BMI and
diet. Finally, on the basis of fat boosted outliers it is hypothesised, that β-glucan driven health
effects from 3.3 g/day may only be detectable in young healthy adults when being fat boosted.
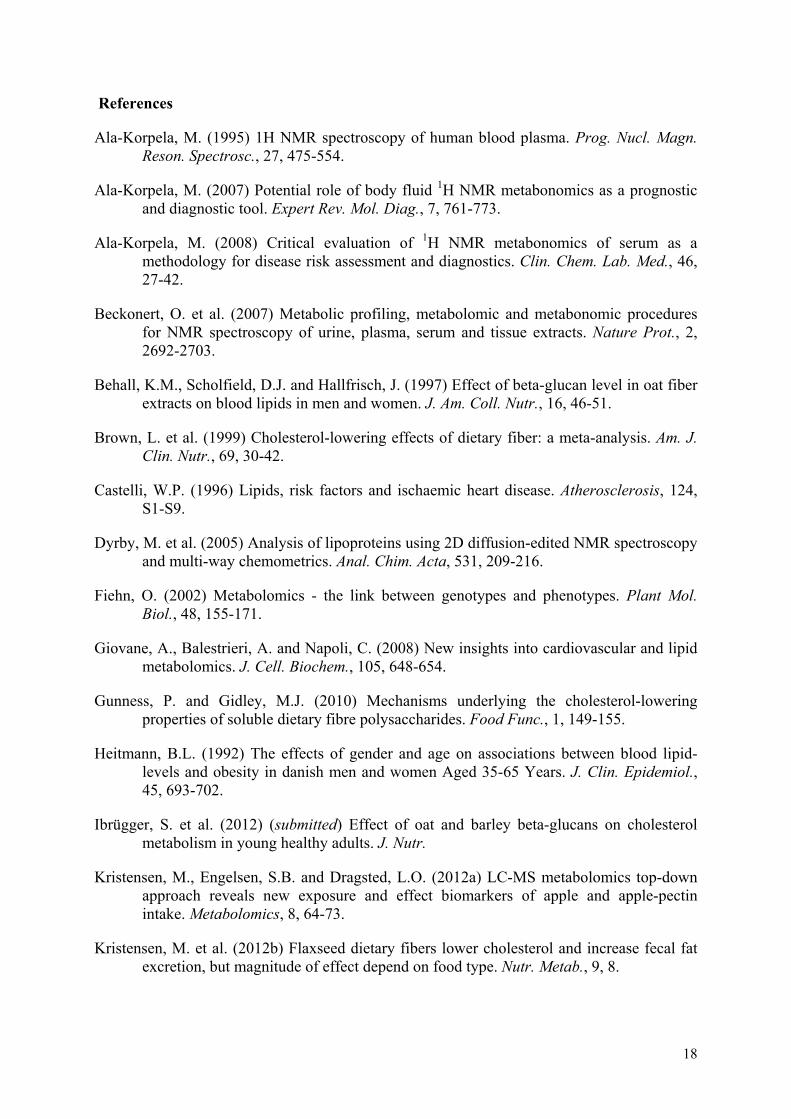
18
References
Ala-Korpela, M. (1995) 1H NMR spectroscopy of human blood plasma. Prog. Nucl. Magn. Reson. Spectrosc., 27, 475-554.
Ala-Korpela, M. (2007) Potential role of body fluid 1H NMR metabonomics as a prognostic and diagnostic tool. Expert Rev. Mol. Diag., 7, 761-773.
Ala-Korpela, M. (2008) Critical evaluation of 1H NMR metabonomics of serum as a methodology for disease risk assessment and diagnostics. Clin. Chem. Lab. Med., 46, 27-42.
Beckonert, O. et al. (2007) Metabolic profiling, metabolomic and metabonomic procedures for NMR spectroscopy of urine, plasma, serum and tissue extracts. Nature Prot., 2, 2692-2703.
Behall, K.M., Scholfield, D.J. and Hallfrisch, J. (1997) Effect of beta-glucan level in oat fiber extracts on blood lipids in men and women. J. Am. Coll. Nutr., 16, 46-51.
Brown, L. et al. (1999) Cholesterol-lowering effects of dietary fiber: a meta-analysis. Am. J. Clin. Nutr., 69, 30-42.
Castelli, W.P. (1996) Lipids, risk factors and ischaemic heart disease. Atherosclerosis, 124, S1-S9.
Dyrby, M. et al. (2005) Analysis of lipoproteins using 2D diffusion-edited NMR spectroscopy and multi-way chemometrics. Anal. Chim. Acta, 531, 209-216.
Fiehn, O. (2002) Metabolomics - the link between genotypes and phenotypes. Plant Mol. Biol., 48, 155-171.
Giovane, A., Balestrieri, A. and Napoli, C. (2008) New insights into cardiovascular and lipid metabolomics. J. Cell. Biochem., 105, 648-654.
Gunness, P. and Gidley, M.J. (2010) Mechanisms underlying the cholesterol-lowering properties of soluble dietary fibre polysaccharides. Food Func., 1, 149-155.
Heitmann, B.L. (1992) The effects of gender and age on associations between blood lipid-levels and obesity in danish men and women Aged 35-65 Years. J. Clin. Epidemiol., 45, 693-702.
Ibrügger, S. et al. (2012) (submitted) Effect of oat and barley beta-glucans on cholesterol metabolism in young healthy adults. J. Nutr.
Kristensen, M., Engelsen, S.B. and Dragsted, L.O. (2012a) LC-MS metabolomics top-down approach reveals new exposure and effect biomarkers of apple and apple-pectin intake. Metabolomics, 8, 64-73.
Kristensen, M. et al. (2012b) Flaxseed dietary fibers lower cholesterol and increase fecal fat excretion, but magnitude of effect depend on food type. Nutr. Metab., 9, 8.
19
Kristensen, M. et al. (2010) NMR and interval PLS as reliable methods for determination of cholesterol in rodent lipoprotein fractions. Metabolomics, 6, 129-136.
Mikkelsen, M.S. et al. (2013) Molecular structure of large-scale extracted beta-glucan from barley and oat: Identification of a significantly changed block structure in a high beta-glucan barley mutant. Food Chem., 136, 130-138.
Nicholson, J.K. et al. (1995) 750-Mhz 1H and 1H-13C NMR-spectroscopy of human blood-plasma. Anal. Chem., 67, 793-811.
Otvos, J.D. et al. (1992) Development of a proton nuclear-magnetic-resonance spectroscopic method for determining plasma-lipoprotein concentrations and subspecies distributions from a single, rapid measurement. Clin. Chem., 38, 1632-1638.
Petersen, M. et al. (2005) Quantification of lipoprotein subclasses by proton nuclear magnetic resonance-based partial least-squares regression models. Clin. Chem., 51, 1457-1461.
Savorani, F. et al. (2010a) High throughput prediction of chylomicron triglycerides in human plasma by nuclear magnetic resonance and chemometrics. Nutr. Metab., 7, 43.
Savorani, F., Tomasi, G. and Engelsen, S.B. (2010b) icoshift: A versatile tool for the rapid alignment of 1D NMR spectra. J. Magn. Reson., 202, 190-202.
Savorani, F. et al. (2012) (submitted) The NMR nutri-metabolomics platform: facts, opportunities and challenges. Food Res. Int.
Smilde, A.K. et al. (2005) ANOVA-simultaneous component analysis (ASCA): a new tool for analyzing designed metabolomics data. Bioinfo., 21, 3043.
Tauler, R. (1995) Multivariate curve resolution applied to second order data. Chemo. Intel. Lab. Sys., 30, 133-146.
Theuwissen, E. and Mensink, R.P. (2008) Water-soluble dietary fibers and cardiovascular disease. Physiol. Behav., 94, 285-292.
van Velzen, E.J.J. et al. (2008) Multilevel data analysis of a crossover designed human nutritional intervention study. J.Proteome Res., 7, 4483-4491.
Wijeyesekera, A. et al. (2012) Metabotyping of long-lived mice using 1H NMR spectroscopy. J.Proteome Res., 11, 2224-2235.
Wold, S., Esbensen, K. and Geladi, P. (1987) Principal component analysis. Chemo. Intel. Lab. Sys., 2, 37-52.
Wold, S., Martens, H. and Wold, H. (1983) The multivariate calibration-problem in chemistry solved by the pls method. Lec. Notes Math., 973, 286-293.
Wood, P.J. (2004) Relationships between solution properties of cereal beta-glucans and physiological effects - a review. Trends Food Sci. Tech., 15, 313-320.
Wood, P.J. (2007) Cereal beta-glucans in diet and health. J. Cereal Sci., 46, 230-238.


![12 ΡΟΓΡΑΜΜΑ_ΣΥΝΕΔΡΙΟΥ.pdf12 @r xw G yw 4 r | 4 r v r [Updated 02 -05 -2018 ] 8 C rW Nutritional Assessment in patients using BIA Lisa Cha , InBody Clinical research](https://static.fdocument.org/doc/165x107/5aefd2c67f8b9ad0618d5326/12-pdf12-r-xw-g-yw-4-r-4-r-v-r-updated.jpg)