A novel biological rote of α l-fucose in mutans group streptococci
S1
Supporting Information for:
Chemoenzymatic Probes for Detecting and Imaging
Fucose-α(1-2)-Galactose Glycan Biomarkers
Jean-Luc Chaubard, Chithra Krishnamurthy, Wen Yi, David F. Smith, and Linda C. Hsieh-Wilson
This file includes:
SI Materials and Methods
SI References

S2
SI Materials and Methods
General Methods for Chemical Synthesis. Unless otherwise stated, all starting materials and
reagents were purchased from Sigma-Aldrich and used without further purification. All 1H and 13C
NMR spectra were recorded on a Varian Innova 600 spectrometer and referenced to solvent peaks.
Data for 1H NMR spectra are reported as follows: chemical shift (δ ppm), multiplicity (s = singlet, d =
doublet, t = triplet, q = quartet, m = multiplet), coupling constant in Hz, and integration. Low-
resolution mass spectra were recorded on an 1100 Agilent Liquid Chromatograph Mass Spectrometer
with an Agilent SB-C18 reverse-phase column (3.5 µm, 4.6 x 250 mm) with monitoring at 280 and
310 nm. High-resolution mass spectra (HRMS) were obtained using an Agilent 6200 Series Time of
Flight Mass Spectrometer with an Agilent G1978A Multimode source using mixed electrospray
ionization/atmospheric pressure chemical ionization (MultiMode ESI/APCI).
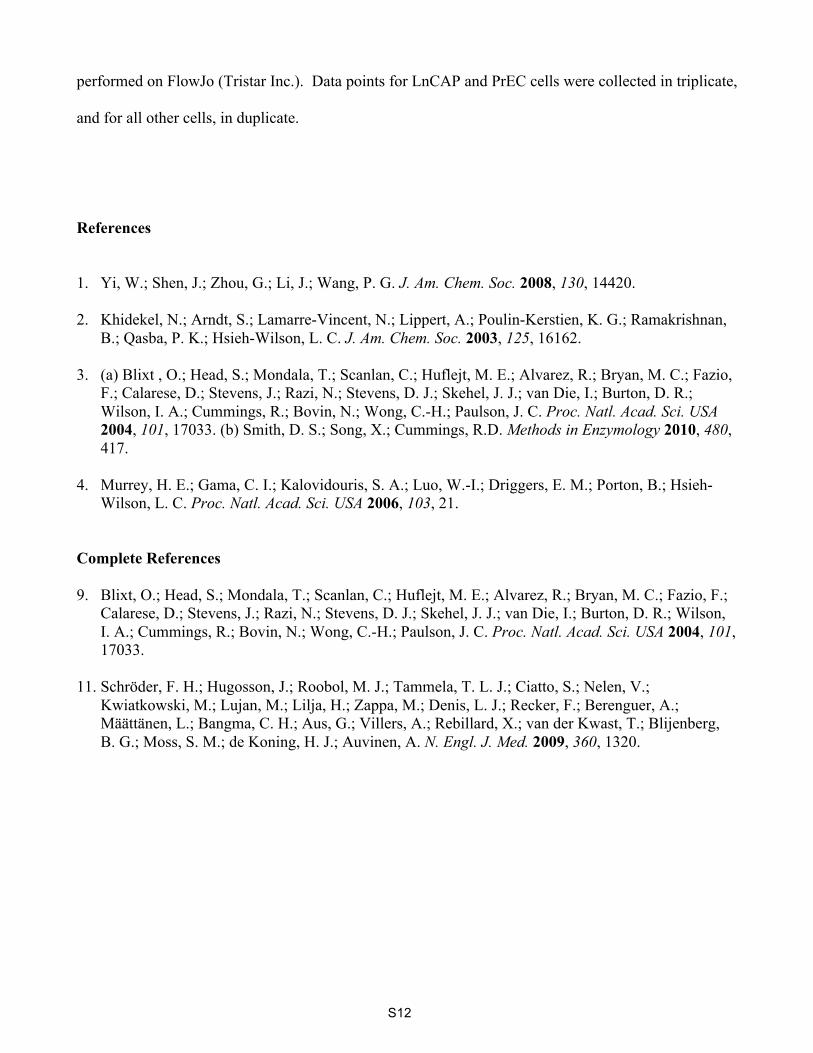
Synthesis of 1-p-Nitrobenzyl-(2-fucosyl)-lactose (1). A 0.35 M solution of p-nitrobenzylamine in 7:3
(v/v) DMSO/AcOH (50 µL, 18 µmol) was added slowly to 2’-fucosyllactose (1.0 mg, 2.0 µmol) at rt.
NaCNBH3 (50 µL of a 1 M solution in 7:3 (v/v) DMSO/AcOH, 50 µmol) was then added slowly at rt,
and the solution was stirred at 65 °C for 4 h. The reaction was quenched by adding 10 volumes of
MeCN and incubated at -20 °C for 2 h. The precipitated mixture was then centrifuged at 10,000 x g for
5 min at 4 °C, and the supernatant was discarded. Ten additional volumes of MeCN were added to the
pellet, and the vortexed mixture was incubated at -20 °C for 2 h and centrifuged as above. This step
was repeated two more times to remove the excess p-nitrobenzylamine. The pellet was then
resuspended in 5% MeCN and the product purified by semi-preparative HPLC (Agilent 1100) using
two preparative reverse-phase columns (Agilent Eclipse XDB-C18; 5 µm, 9.4 x 250 mm) connected in
series and a gradient of 5-20% B over 20 min at 4 mL/min (A, 0.5% aqueous AcOH; B, 100% MeCN).
S3
The product eluted at approximately 9.5 min. Lyophilization afforded a fluffy white solid (0.72 mg;
56% yield): 1H NMR (600 MHz, D2O) δ 8.33 (d, J = 8.6 Hz, 2H), 7.72 (d, J = 8.7 Hz, 2H), 5.31 (s,
1H), 4.60 (d, J = 7.8 Hz, 1H), 4.33 (q, J = 13.7 Hz, 2H), 4.23 (t, J = 6.3 Hz, 2H), 3.93 (d, J = 3.4 Hz,
1H), 3.91–3.86 (m, 4H), 3.83 (t, J = 4.4 Hz, 4H), 3.79–3.71 (m, 4H), 3.67 (dd, J = 9.5, 7.9 Hz, 1H),
3.32 (d, J = 11.7 Hz, 1H), 3.10 (t, J = 11.1 Hz, 1H), 1.23 (d, J = 6.6 Hz, 3H). 13C NMR (151 MHz,
D2O) δ 147.86, 130.43, 124.09, 109.99, 107.14, 100.42, 99.65, 76.94, 76.65, 75.19, 73.42, 71.69,
70.48, 70.19, 69.45, 68.97, 68.51, 68.21, 67.18, 61.93, 60.90, 50.51, 49.52, 23.19, 15.29. HRMS:
[M+H]+ calculated for C25H40N2O16 625.5996, found 625.2451.
Expression and Purification of BgtA. E. coli BL21 (DE3) harboring the recombinant plasmid vector
pET28a-BtgA-His was kindly provided by Dr. Peng George Wang (Ohio State University). The
protein was expressed and purified as described.1 Briefly, the cells were grown in LB medium (1L) at
37 °C. Isopropyl-1-thio-β-D-galactospyranoside (IPTG, 0.8 mM final concentration; Sigma) was
added when the cells reached an OD600 of 0.8, and the cells were incubated for an additional 18 h at 16
°C. The pelleted cells were lysed in Cell Lytic B Lysis Reagent (Sigma-Aldrich) supplemented with
EDTA-free Complete™ protease inhibitors (Roche), 0.5 M NaCl, and 20 mM imidazole (Sigma-
Aldrich) by rotating end-over-end for 20 min at rt. After centrifugation, the clarified lysate was added
to prewashed Ni-NTA beads and incubated at 4 °C for 1 h, washed in 20 mM Tris•HCl pH 7.5, 0.5 M
NaCl and 50 mM imidazole, and eluted in a step gradient with the elution buffer (20 mM Tris•HCl pH
7.5, 0.5 M NaCl, and 100, 200 or 500 mM imidazole). After SDS–PAGE analysis, the purified protein
was concentrated with 10,000 Da molecular weight cut-off (MWCO) spin filters (Millipore) and
dialyzed into 20 mM Tris•HCl pH 7.5 containing 10% glycerol and stored at 4 °C.

S4
BgtA Activity Assay and Monitoring of Chemoenzymatic Labeling Reactions by LC-MS/MS.
The Fucα(1-2)Gal substrate 1 (10 µM) was dissolved in 20 mM Tris•HCl pH 7.5, 50 mM NaCl, and 5
mM MnCl2. BgtA enzyme1 and UDP-ketoGal 32 or UDP-GalNAz 2 (Invitrogen) were added to final
concentrations of 0.16 mg/mL and 50 µM, respectively, in a final volume of 100 µL. The reaction was
incubated at 4 °C in the dark for 12-16 h, and the reaction progress was monitored by LC-MS/MS. To
label with aminooxy-biotin 7, the reactions were diluted 5-fold with saturated urea, 2.7 M NaOAc pH
3.9 (50 mM final concentration and pH 4.8), and 7 (5 mM final concentration, Dojindo) and incubated
for 20–24 h at rt. To label with ADIBO-biotin 6, 250 µM of 6 (Click Chemistry Tools) was added, and
the reaction was incubated for 3 h at rt. Following the labeling steps, the azido-labeled samples were
filtered through a 3,000 Da MWCO Vivaspin 500 spin filter (GE Lifesciences) and injected on a
reverse-phase HPLC column (Phenomenex Gemini; 5 m, 2.0 x 100 mm), fitted with a C8 guard
column, using a ThermoScientific Accela 600 HPLC pump interfaced with a ThermoScientific LTQ
mass spectrometer. A linear 3-90% gradient of B (A: 0.1% aqueous formic acid, B: 0.1% formic acid
in MeCN) over 7 min was used to resolve peaks with a flow rate of 0.21 mL/min. Mass analysis was
performed in positive ion mode except in the case of sulfated compound 8, where the analysis was
performed in negative ion mode.
Kinetic Analysis of BgtA with UDP-GalNAz and UDP-GalNAc. Reactions were performed in
duplicate with 100 µM acceptor substrate (1), 0.7 µg BgtA, and varying concentrations of UDP-
GalNAz or UDP-GalNAc (50 to 800 µM) in 20 mM Tris-HCl pH 7.5, 50 mM NaCl, 10 mM MnCl2 at
rt in a total volume volume of 20 µL. Product formation was monitored at 280 nm by reverse phase-
HPLC (Agilent 1100), and time points were taken over the course of 5 min using a linear, 3-95%
gradient of B (A: 0.1% aqueous trifluoroacetic acid B: 0.1% trifluoroacetic acid in MeCN) over 8 min
with a flow rate of 1 mL/min. The kinetic parameters, apparent Km, Vmax, and kcat, were obtained by
S5
linear regression analysis of initial velocity vs. donor substrate concentration using KaleidaGraph
(version 4.1.2).
Chemoenzymatic Labeling on the Glycan Array. Glycan Array version 5.0 was provided by the
Consortium for Functional Glycomics (CFG). Pre-equilibrated arrays were treated with BgtA enzyme
(0.16 mg/mL) and 500 µM UDP-GalNAz 2 in 20 mM Tris•HCl pH 7.4, 50 mM NaCl, 2 mM MnCl2
containing 1% bovine serum albumin (BSA) for various times (0, 0.5, 2, and 12 h) at rt, washed 4
times with wash buffer (20 mM Tris•HCl pH 7.4, 50 mM NaCl, 0.1% Triton X-100) and then 4 times
with rinse buffer (20 mM Tris•HCl pH 7.4, 50 mM NaCl). The arrays were then incubated with
ADIBO-biotin (5 µM) in 20 mM Tris•HCl pH 7.4, 50 mM NaCl for 2 h at rt. After washing as
described above, the arrays were washed further with 20% aqueous MeOH and then incubated with
streptavidin Cy-5 (0.5 µg/mL; eBioScience) in 20 mM Tris•HCl pH 7.4, 50 mM NaCl, 0.05% Tween-
20, 1% BSA, for 1 h at rt. The arrays were then washed 4 times with wash buffer (containing 0.05%
Tween-20 instead of 0.1% Triton X-100), 4 times with rinse buffer, 4 times with water, dried under a
low stream of filtered air, and scanned using a PerkinElmer ScanArray Express fluorescence scanner
and ImaGene data analysis software (BioDiscovery). Data were analyzed per the guidelines of the
CFG.3 The background fluorescence for each spot was determined as the fluorescence signal outside of
the area designated as a positive spot on the array. Because background fluorescence can be
heterogeneous across the array, each array was divided into areas of 10 by 10 spots, or sub-arrays, and
a background fluorescence value was calculated within each sub-array by the software. This value was
then subtracted from the fluorescence signal for each glycan spot within the sub-array by the software.
Note that each glycan is printed six different times on the array. To calculate the relative fluorescence
intensity for a given glycan, the highest and lowest intensities for each glycan were discarded, and the
mean and standard deviation of four fluorescence intensities were calculated. All microarray data will
S6
be uploaded on the Consortium of Functional Glycomics website (www.functionalglycomics.org) upon
publication.
Chemoenzymatic Labeling of Cell Lysates. The olfactory bulbs of postnatal day 3 rat pups were
dissected on ice and lysed in boiling 1% SDS (5 volumes/weight) with sonication until the mixture was
homogeneous. Protein was precipitated using methanol/chloroform/water. Briefly, protein was diluted
to 200 µL and precipitated by sequential mixing with 600 µL of MeOH, 200 µL of CHCl3 and 450 µL
H2O, after which the mixture was centrifuged at 23,000 x g for 15 min. Precipitated protein was
washed with 450 µL of MeOH and centrifuged at 23,000 x g for 10 min. After the protein pellet was
allowed to dry briefly, the pellet was re-dissolved at 5 mg/mL in 20 mM HEPES pH 7.9 containing 1%
SDS, and diluted 5-fold into a buffer with the following final concentrations: 20 mM HEPES pH 7.9,
50 mM NaCl, 2% NP-40, 5 mM MnCl2. UDP-GalNAz 2 (25 µM; Invitrogen) and BgtA (0.16 mg/mL)
were added, and the samples were incubated at 4 °C for 16-20 h. The labeled proteins were
precipitated as above and resuspended in 50 mM Tris pH 7.4 containing 1% SDS at 4 mg/mL.
The resuspended proteins were subsequently reacted with alkyne-TAMRA 10 (Invitrogen) or
alkyne-biotin 11 (Invitrogen) as per the Click-It™ TAMRA and Biotin Glycoprotein Detection Kit
(Invitrogen) instructions, except that EDTA-free Complete™ protease inhibitors were added during the
reaction. For TAMRA labeling, negative controls were performed under identical conditions except
that BgtA, UDP-GalNAz 2, or alkyne-TAMRA 10 was omitted from the labeling reaction. For biotin
labeling, negative controls were performed under identical conditions except that BgtA was omitted
from the labeling reaction. After the labeling reactions, protein was precipitated using
chloroform/methanol/water as described above and re-dissolved in boiling 2% SDS. This precipitation
and resolubilization was then repeated once more to ensure removal of non-specific interactions.
TAMRA-labeled proteins were resolved by SDS-PAGE and visualized in-gel using a Typhoon
S7
Scanner (GE Healthcare). Interestingly, BgtA itself was labeled, and attempts to remove the signal by
precipitation or heat and detergent denaturation were unsuccessful, suggesting covalent modification of
the protein.
Purification of Biotin-Labeled Fucα(1-2)Gal Proteins. Chemoenzymatically labeled samples were
precipitated using methanol/chloroform/water as described above and re-dissolved in boiling 1% SDS
plus Complete™ protease inhibitors at a concentration of 2 mg/mL. The SDS was quenched with 1
volume of NETFD buffer (100 mM NaCl, 50 mM Tris•HCl pH 7.4, 5 mM EDTA, 6% NP-40) plus
protease inhibitors. The samples were incubated with pre-washed streptavidin resin (Pierce; 100 µL/1
mg protein) for 2 h at 4 °C. The resin was washed twice with 10 column volumes each of low salt
buffer (0.1 M Na2HPO4 pH 7.5, 0.15 M NaCl, 1% Triton X-100, 0.1% SDS), twice with 10 column
volumes each of high salt buffer (0.1 M Na2HPO4 pH 7.5, 0.5 M NaCl, 0.2% Triton X-100), and once
with 10 column volumes of 50 mM Tris•HCl pH 7.4. Captured protein was eluted in boiling 2X
sample buffer (100 mM Tris pH 6.8, 4% SDS, 200 mM DTT, 20% glycerol, 0.1% bromophenol blue;
50 µL /100 µL resin) for 5 min.
Western Blotting for Parallel Identification of Fucα(1-2)Gal Glycoproteins. The purified, labeled
material from above was resolved on a NuPAGE 4-12% Bis-Tris gel (Invitrogen) and transferred to a
polyvinylidene difluoride (PVDF) membrane (Millipore). The membrane was blocked in 5% milk
(BioRad) in TBST (50 mM Tris•HCl, 150 mM NaCl, 0.05% Tween 20, pH 7.4) for 1 h at rt. Primary
antibodies in 5% milk in TBST were added overnight at 4 °C at the following concentrations: mouse
anti-NCAM monoclonal antibody (Abcam) at 1 µg/mL, mouse anti-synapsin I ascites (Synaptic
Systems) at 0.1 µg/ml, mouse anti-munc18-1 (Synaptic Systems) at 0.1 µg/mL, or mouse p44 MAPK
monoclonal antibody (Cell Signaling) at 1:2000 dilution. Membranes were washed with TBST,
S8
incubated with the appropriate Alexa Fluor 680-conjugated (Invitrogen) or IR800-conjugated
(Rockland) secondary antibody, and visualized using a LiCOR Odyssey Imaging System.
Lectin Affinity Chromatography with UEAI. UEAI lectin conjugated to agarose (Vector
Laboratories) or control protein A conjugated to agarose (Vector Laboratories) was packed into a
minicolumn (50 µL bed volume; Bio-Rad), and the columns were run in parallel. The resin was
equilibrated with 10 column volumes of lectin binding buffer (100 mM Tris pH 7.5, 150 mM NaCl, 1
mM CaCl2, 1 mM MgCl2, 0.5% NP-40, and 0.2% sodium deoxycholate supplemented with EDTA-free
Complete™ protease inhibitors). Olfactory bulb tissue from P3 rat pups was lysed in lectin binding
buffer by sonication on ice. The lysate was clarified by centrifugation at 12000 x g for 10 min, and the
total protein concentration was determined using the BCA protein assay (Pierce). Lysate (500 µg) was
bound batch-wise with gentle end-over-end mixing at rt for 4 h. The agarose was then allowed to
settle and the flow-through was passed over the column three additional times. The columns were
washed with 40 column volumes of lectin binding buffer, followed by 10 column volumes of lectin
binding buffer lacking detergent. Proteins were eluted in 10 column volumes of lectin binding buffer
lacking detergent and supplemented with 200 mM L-fucose and Complete™ protease inhibitors.
Protein eluates were concentrated to a volume of 100 µL using a Vivaspin 500 spin filter (10,000 Da
MWCO). Following concentration, samples were boiled in 1X sample buffer (35 µL of 200 mM Tris
pH 6.8, 400 mM DTT, 8% SDS, 0.2% bromophenol blue, and 40% glycerol) and analyzed by SDS-
PAGE and western blotting as described above. Synapsin I was detected using mouse anti-synapsin I
ascites (Synaptic Systems) at 0.1 µg/mL.
Cell Culture. HeLa, MCF-7, and MDA-mb-231 cells grown in DMEM medium supplemented with
10% fetal bovine serum (FBS), 100 units/mL penicillin, and 0.1 mg/mL streptomycin (Gibco). LNCaP
S9
and H1299 cells were grown in RPMI medium 1640 supplemented with 10% FBS, 100 units/mL
penicillin, and 0.1 mg/mL streptomycin (Gibco). The PrEC line was maintained in PrEBM medium
(Lonza). All transfections were carried out in antibiotic-free media. In all cases, cells were incubated
in a 5% CO2 humidified chamber at 37 °C. The PrEC line was obtained from Lonza; all other cell
lines were obtained from ATCC.
Immunoprecipitation of TAMRA-Labeled Synapsin I from HeLa Cell Lysates. HeLa cells were
transfected with pCMV-FLAG-synapsin Ia4 using Lipofectamine LTX reagent (Invitrogen). The cells
were lysed and chemoenzymatically labeled and protein was precipitated as described above. After the
protein pellet was allowed to dry briefly, the pellet was re-dissolved in boiling 1% SDS plus
Complete™ protease inhibitors at a concentration of 2 mg/mL. The SDS was quenched with 1 volume
of NETFD buffer plus protease inhibitors, and the lysate was incubated with 40 µL of prewashed anti-
Flag M2 Affinity Gel (Sigma-Aldrich) for 90 min at 4 °C. The resin was washed once with 4 column
volumes of NETFD buffer and three times with 4 column volumes of NETF buffer (100 mM NaCl, 50
mM Tris•HCl pH 7.4, 5 mM EDTA). Captured protein was eluted in boiling 2X sample buffer (50 µL
buffer/100 µL resin). Purified, labeled material was resolved by SDS-PAGE and transferred to a
polyvinylidene fluoride (PVDF) membrane (Millipore). Western blotting was performed as above
except the primary anti-TAMRA rabbit antibody (0.1 µg/µL; Invitrogen) was used.
Detection of Cell-Surface Fucα(1-2)Gal Glycans on Live MCF-7 Cells by Fluorescence
Microscopy. MCF-7 cells (ATCC) were seeded at 2 x 10⁵ cells/coverslip. Twelve hours after plating,
the cells were washed twice with 1% FBS, 10 mM HEPES in calcium and magnesium free Hank’s
Balanced Salt Solution (CMF HBSS, Gibco) and incubated in the chemoenzymatic labeling buffer (2%
FBS, 10 mM HEPES pH 7.9 in HBSS) with UDP-GalNAz 2 (500 µM) and BgtA (0.17 mg/mL) in a

S10
total volume of 100 µL for 2 h at 37 ºC. Mock reactions were performed without the addition of BgtA.
After chemoenzymatic labeling, the cells were washed twice with 100% FBS and twice with the
chemoenzymatic labeling buffer. Enzymatic addition of GalNAz onto Fucα(1-2)Gal glycans was
detected by incubating the cells with ADIBO-biotin (20 µM in the chemoenzymatic labeling buffer;
500 µL) for 1 h at rt, washing the coverslips as described, and then incubation with streptavidin-Alexa
Fluor 488 (1 µg/mL in PBS containing 3% BSA; Invitrogen) for 30 min at rt. Cells were washed once
with PBS, after which nuclei were stained with Hoechst-33342 (1 µg/µL; Invitrogen) in PBS for 15
min at rt. Coverslips were washed twice with 100% FBS and mounted in media (on ice), sealed with
paraffin, and imaged immediately using a 40x Plan-Achromat objective on a Zeiss Meta510 inverted
microscope.
Detection of Fucα(1-2)-Gal Glycans on Synapsin I in Fixed HeLa Cells by Fluorescence
Microscopy. HeLa cells were plated onto 15 mm coverslips (Carolina Biological) at a density of 75
cells/mm2. After 12 h, cells were transfected with pCMV-Flag-synapsin Ia (0.5 µg DNA/coverslip)
using Lipofectamine LTX (4 µL in 200 µL Optimem; Invitrogen). After 24 h, the media was removed,
and the cells were rinsed one time with PBS, fixed in 4% paraformaldehyde in PBS, pH 7.5 for 20 min
at rt, washed twice with PBS, permeabilized in 0.3% Triton X-100 in PBS for 10 min at rt, and washed
twice with the enzymatic labeling buffer (50 mM HEPES, 125 mM NaCl, pH 7.9). Reaction mixtures
and negative controls (without BgtA) were prepared by adding 100 µL of 20 mM HEPES pH 7.9, 50
mM NaCl, 2% NP-40, 5 mM MnCl2, UDP-GalNAz 1 (25 µM), and BgtA (0.17 mg/mL) at 4 °C for 24
h (100 µL/coverslip) in a humidified chamber. After chemoenzymatic labeling, the cells were washed
twice with the chemoenzymatic labeling buffer. Enzymatic addition of GalNAz onto Fucα(1-2)Gal
glycans was detected by treating the cells with 5 µM alkyne-functionalized Alexa Fluor 488
(Invitrogen), 0.1 mM triazoleamine ligand (Invitrogen), 2 mM sodium ascorbate (Sigma-Aldrich), and
S11
1 mM CuSO4 (Sigma-Aldrich) in 2% FBS (Gibco) in PBS at rt for 1 h. Synapsin I was detected by
immunostaining with an anti-synapsin I antibody (Millipore, 1:250 in 3% BSA) for 1 h at rt, followed
by an anti-rabbit secondary antibody conjugated to Alexa Fluor 546 (Invitrogen; 1:1000 in 3% BSA)
for 1 h at rt. The coverslips were washed with PBS, mounted onto glass slides using Vectashield
mounting medium with DAPI (4 µL; Vector Labs) and sealed with clear nail polish. Cells were imaged
using a Nikon Eclipse TE2000-S inverted microscope, and images were captured with Metamorph
software using a 20x Plan Fluor objective.
Detection of Cell-Surface Fucα(1-2)Gal Glycans on Live Cancer Cells by Flow Cytometry. All
cells were seeded at 4 x 10⁶ cells per 10-cm plate in 10 mL of the appropriate media. On the day of
analysis, cells were lifted off the plate with DNase (0.4 mg/mL; Worthington) and 1 mM EDTA and
washed with 1% FBS, 10 mM HEPES in CMF HBSS. One million cells were chemoenzymatically
labeled with UDP-GalNAz (500 µM) and BgtA (0.17 µg/µL) in 1% FBS, 10 mM HEPES in CMF
HBSS (100 µL) for 2 h at 37 °C. Cells were spun twice through 100% FBS (1 mL) to remove excess
reagent (500 x g, 5 min) and resupended in 1% FBS, 10 mM HEPES in CMF HBSS (100 µL)
containing ADIBO-biotin (20 µM) and incubated for 1 h at rt. Cells were again spun twice through
100% FBS (1 mL), and washed with 3% BSA in PBS (1 mL). Cells were then resuspended in 3%
BSA in PBS (100 µL) containing streptavidin-Alexa Fluor 488 (1 µg/mL) and incubated for 20 min at
4 °C. Cells were subsequently spun twice through 100% FBS (1 mL) and resuspended in 2% FBS, 10
mM HEPES in CMF HBSS (750 µL) for flow cytometry analysis. Immediately before analysis, 7-
amino-actinomycin D (7-AAD, 5 µL; eBioscience) was added to measure cell viability. Cells were
analyzed for FITC intensity on a Beckman Dickenson FACSCalibur flow cytometer equipped with a
488-nm argon laser. For each experiment, 10,000 live cells were analyzed, and data analysis was
S12
performed on FlowJo (Tristar Inc.). Data points for LnCAP and PrEC cells were collected in triplicate,
and for all other cells, in duplicate.
References
1. Yi, W.; Shen, J.; Zhou, G.; Li, J.; Wang, P. G. J. Am. Chem. Soc. 2008, 130, 14420.
2. Khidekel, N.; Arndt, S.; Lamarre-Vincent, N.; Lippert, A.; Poulin-Kerstien, K. G.; Ramakrishnan,
B.; Qasba, P. K.; Hsieh-Wilson, L. C. J. Am. Chem. Soc. 2003, 125, 16162. 3. (a) Blixt , O.; Head, S.; Mondala, T.; Scanlan, C.; Huflejt, M. E.; Alvarez, R.; Bryan, M. C.; Fazio,
F.; Calarese, D.; Stevens, J.; Razi, N.; Stevens, D. J.; Skehel, J. J.; van Die, I.; Burton, D. R.; Wilson, I. A.; Cummings, R.; Bovin, N.; Wong, C.-H.; Paulson, J. C. Proc. Natl. Acad. Sci. USA 2004, 101, 17033. (b) Smith, D. S.; Song, X.; Cummings, R.D. Methods in Enzymology 2010, 480, 417.
4. Murrey, H. E.; Gama, C. I.; Kalovidouris, S. A.; Luo, W.-I.; Driggers, E. M.; Porton, B.; Hsieh-Wilson, L. C. Proc. Natl. Acad. Sci. USA 2006, 103, 21.
Complete References
9. Blixt, O.; Head, S.; Mondala, T.; Scanlan, C.; Huflejt, M. E.; Alvarez, R.; Bryan, M. C.; Fazio, F.; Calarese, D.; Stevens, J.; Razi, N.; Stevens, D. J.; Skehel, J. J.; van Die, I.; Burton, D. R.; Wilson, I. A.; Cummings, R.; Bovin, N.; Wong, C.-H.; Paulson, J. C. Proc. Natl. Acad. Sci. USA 2004, 101, 17033.
11. Schröder, F. H.; Hugosson, J.; Roobol, M. J.; Tammela, T. L. J.; Ciatto, S.; Nelen, V.;
Kwiatkowski, M.; Lujan, M.; Lilja, H.; Zappa, M.; Denis, L. J.; Recker, F.; Berenguer, A.; Määttänen, L.; Bangma, C. H.; Aus, G.; Villers, A.; Rebillard, X.; van der Kwast, T.; Blijenberg, B. G.; Moss, S. M.; de Koning, H. J.; Auvinen, A. N. Engl. J. Med. 2009, 360, 1320.
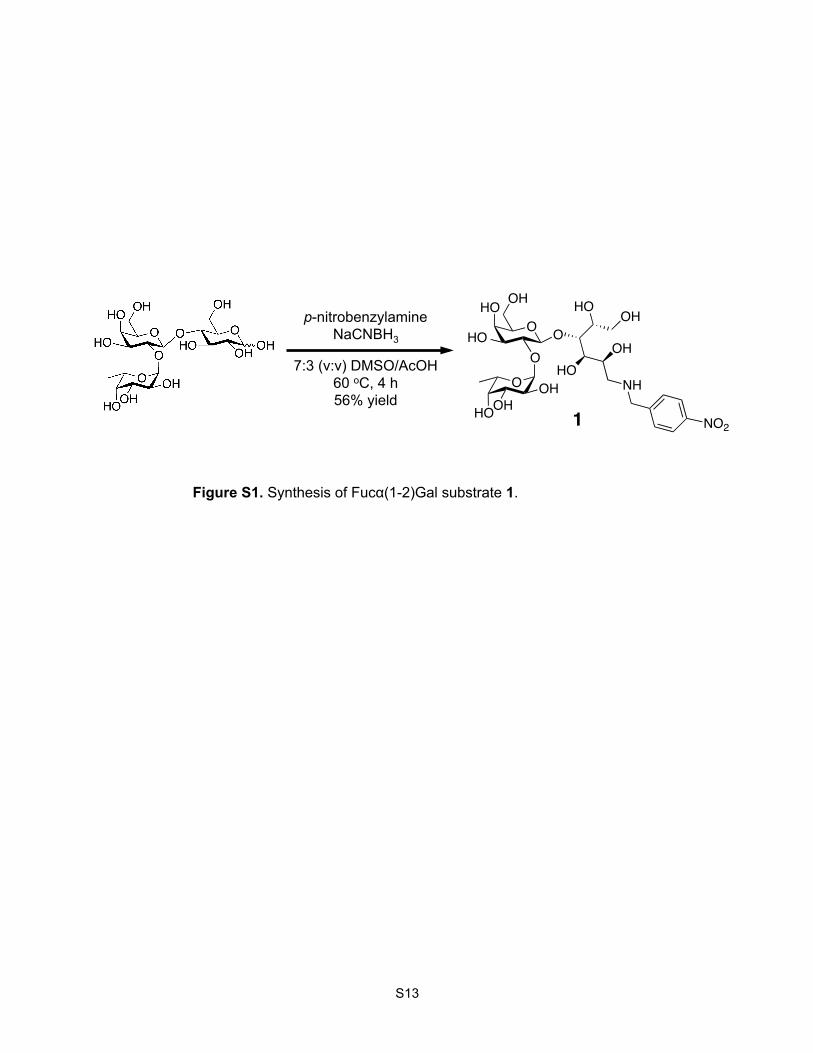
Figure S1. Synthesis of Fucα(1-2)Gal substrate 1.
p-nitrobenzylamine NaCNBH3
7:3 (v:v) DMSO/AcOH 60 oC, 4 h 56% yield
1!
S13
O
O
HO
HO
OH
O
HOOHOH NH
OHHO
O
HOOH
NO2
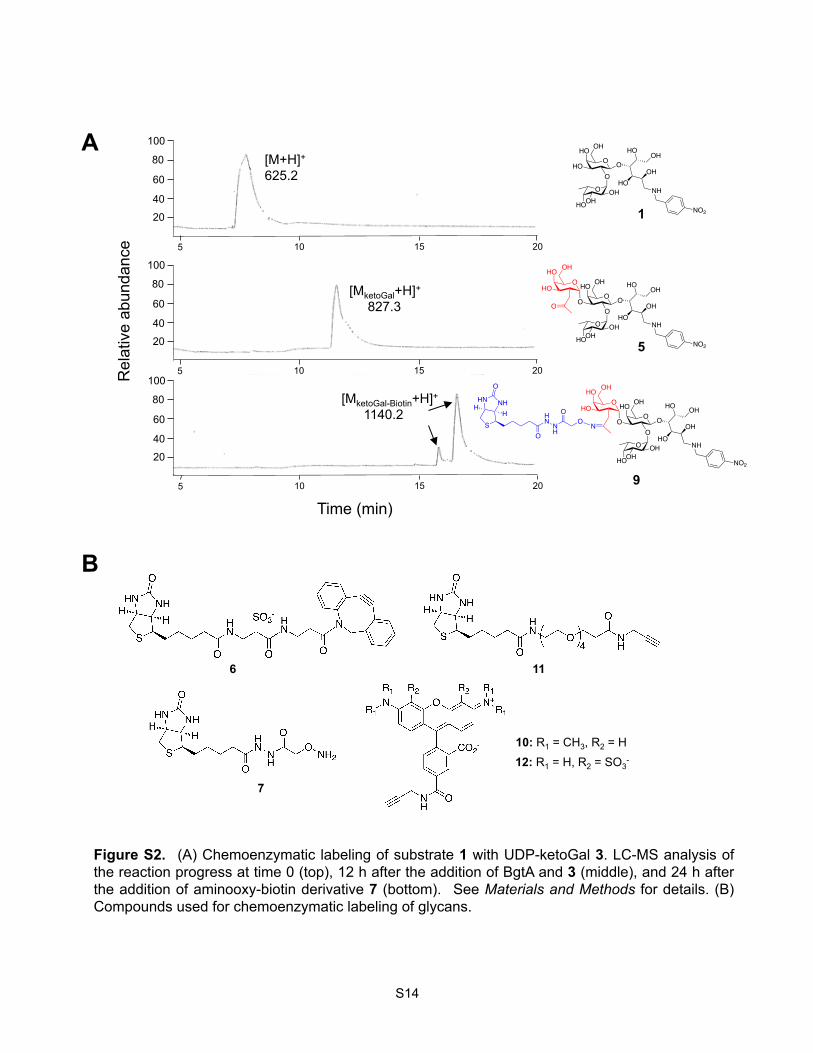
Figure S2. (A) Chemoenzymatic labeling of substrate 1 with UDP-ketoGal 3. LC-MS analysis of the reaction progress at time 0 (top), 12 h after the addition of BgtA and 3 (middle), and 24 h after the addition of aminooxy-biotin derivative 7 (bottom). See Materials and Methods for details. (B) Compounds used for chemoenzymatic labeling of glycans.
100
80
60
40
20
100
80
60
40
20
100
80
60
40
20
[M+H]+ 625.2
[MketoGal+H]+ 827.3
1
5
9
Time (min)
Rel
ativ
e ab
unda
nce
[MketoGal-Biotin+H]+ 1140.2
5 10 15 20
5 10 15 20
5 10 15 20
7
11 6
10: R1 = CH3, R2 = H 12: R1 = H, R2 = SO3
-
A
B
S14
O
O
HO
HO
OH
O
HOOHOH NH
OHHO
O
HOOH
NO2
O
O
HO
O
OH
O
HOOHOH NH
OHHO
O
HO OH
NO2
OHO OH
HO
O
O
O
HO
O
OH
O
HOOHOH NH
OHHO
O
HO OH
NO2
OHO OH
HO
NHN
OS
HN NH
O
HH
NH
OO
y2
O
O
HO
O
OH
O
HOOHOH
OHO OH
HONHO
N3
NH
OHHO
OHO OH
NO2
N
O
O
HOO
OH
O
HOOHOH
OHO OH
HONHO
NN N
O
HN
O
SO3-HN
S
HNNH
OH
H
O NH
OHHO
OHO
OH
NO2
Figure S3. LC-MS/MS analysis of 1, 4, and 8 during the chemoenzymatic labeling reaction. (A) Compound 1 at time 0. (B) Compound 4, generated 12 h after the addition of BgtA and UDP-GalNAz 2. (C) Biotinylated glycan 8, generated 3 h after reaction with ADIBO-biotin 6. The MS spectrum for each compound is shown on top; the MS/MS spectrum for the most abundant ion is shown on the bottom. The m/z of peaks found in each MS/MS analysis are shown as either b and y or c and z ions. The corresponding fragmentation products and probable cleavage sites are denoted in the respective structures. 1 and 4 were detected in positive scanning mode; 8 was detected in negative scanning mode.
200 300 400 500 600 700 800 900 1000 1100 1200 1300 1400 1500
20 40 60 80
100 [M+H]+ 625.25
[M+Na]+ 647.15
500 600 700 800 900 1000 1100 1200 1300 1400 1500
[MGalNAz+H]+ 869.19
200 300 400 500 600 700 900 1000 1100 1200 1300 1400 1500
m/z
317.11
723.18
479.10 299.17 625.02 570.97
500 600 700 800 900 1000 1100 1200 1300 1400 1500 1600
[MGalNAz-Biotin]- 1520.26
400 500 600 700 800 900 1000 1100 1200 1300 1400 1500 1600
m/z
1492.24
1374.24 1346.16
1204.26 896.16
200 300 400 500 600 700 800 900 1000 1100 1200 1300 1400 1500
m/z
317.05 479.12
463.10 299.07 20 40 60 80
100
20 40 60 80
100
20 40 60 80
100
20 40 60 80
100
20 40 60 80
100
800
A
B
C
y2 y1
z2 z1
z1
y1
c1 y3
y2
b3 b1
y2
b1 y2
b3
z1
z2
y1
y2
c1
z1 y1 y3
1
4
8
Rel
ativ
e ab
unda
nce
Rel
ativ
e ab
unda
nce
Rel
ativ
e ab
unda
nce
S15
O
O
HO
HO
OH
O
HOOHOH
NH
OHHO
OHO OH
NO2
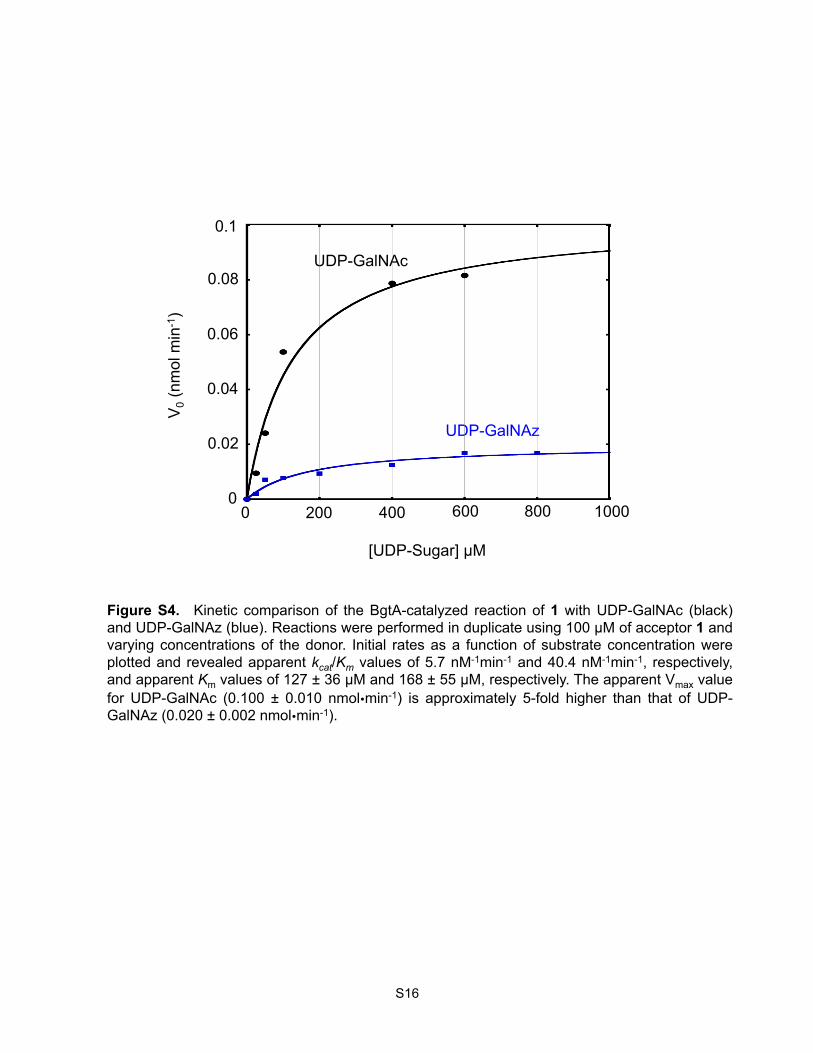
Figure S4. Kinetic comparison of the BgtA-catalyzed reaction of 1 with UDP-GalNAc (black) and UDP-GalNAz (blue). Reactions were performed in duplicate using 100 µM of acceptor 1 and varying concentrations of the donor. Initial rates as a function of substrate concentration were plotted and revealed apparent kcat/Km values of 5.7 nM-1min-1 and 40.4 nM-1min-1, respectively, and apparent Km values of 127 ± 36 µM and 168 ± 55 µM, respectively. The apparent Vmax value for UDP-GalNAc (0.100 ± 0.010 nmolmin-1) is approximately 5-fold higher than that of UDP-GalNAz (0.020 ± 0.002 nmolmin-1).
S16
UDP-GalNAc
UDP-GalNAz
V0 (
nmol
min
-1)
[UDP-Sugar] µM
0 0
200 400 600 800 1000
0.02
0.04
0.06
0.08
0.1

S17
23
34
Sp10
24
34
Sp0
24
3Sp14
24
6S6S
Sp0
2Sp8
24 6S
Sp0
23
Sp14
23
Sp0
23
Sp8
23
Sp8
24
Sp0
23
6S6S
Sp0
23
34
Sp02
23
26
44
Sp222
32
36
23
34
Sp02
23
44
Sp03
24
6SSp0
24
26
44
Sp226
24
23
24
6Sp14
23
Sp84
Fuc Gal GalNAc
GlcNAc
Glc
Man Neu5Ac
Sp Spacer
A
B
0
10000
20000
30000
40000
50000
67 74 401 223 79 263 63 68 69 62 76 502 390 427 391 64 221 421 495 61
Rela%v
e flu
orescence
0 h 0.5 h 2 h 12h 12 h (-‐ UDP-‐GalNAz)
0
10000
20000
30000
40000
50000
385 73 500 498 447 72 386 417 376 70 506 473 71 249 59 474 363 488
Rela%v
e flu
orescence
0 h 0.5 h 2 h 12h 12 h (-‐ UDP-‐GalNAz)
Figure S5. Additional Fucα(1-2)Gal structures on the microarray and their ability to be labeled by BgtA (see also Figure 2A). Relative fluorescence intensities are plotted as a function of time and represent the mean of 4 values. Error bars represent the standard deviation of the mean. Glycans were considered labeled if they showed a time-dependent increase in fluorescence labeling and their signal at 12 h after subtraction of the background in the absence of UDP-GalNAz (12 h, - UDP-GalNAz) was >1000 relative fluorescence units. The red asterisks indicate structures that were not considered to be labeled. W indicates very weak labeling.
46
4Sp21
43
23
24
Sp83
24
2Sp0
23
6SSp0
24
26
44
Sp123
33
24
4
32
42
24
Sp03
46
4Sp21
23
43
3
24
3Sp14
426
44
Sp192
3
23
4 23
24
34
Sp03
3
23
6Sp14
23
3
24
26
44
Sp242
42
33 3
6
24
34
34
Sp03
33
24
6SSp0
23
3Sp9
23
26
44
Sp192
32
34 4
66
24
26
44
Sp202
42
33 3
64
64
Sp21
32
43
****WW W W
W
WW
W*

Figure S6. The chemoenzymatic approach labels a variety of linear (A) and branched (B) Fucα(1-2)Gal structures. (A) The third sugar toward the reducing end of the glycan does not significantly affect the labeling reaction (eg. 62, 66, 74, and 78). Acceptor substrate structures that have a GlcNAc, instead of Gal, and change the linkage from α(1-2) to α(1-3), α(1-4), or β(1-3) are not modified by BgtA (eg 80, 81, and 82). Representative structures from the microarray are shown for comparison. Relative fluorescence intensities are plotted as a function of time to show how subtle changes in the structure affect the kinetics of labeling. Error bars represent the standard deviation of the mean of 4 values after removing the high and low values from n = 6 replicates of each glycan printed on the array.
2 4 3 4 Sp0
2 3 3 4 Sp8
2 4 Sp0
2 3 Sp8
A R
elat
ive
fluor
esce
nce
Fuc Gal GalNAc
GlcNAc
Glc
Man Neu5Ac
Sp Spacer
2 4 2 64 4 Sp20
2 4 2 3
B
0
5000
10000
15000
20000
25000
30000
35000
40000
45000
50000
0 2 4 6 8 10 12 Time (h)
450
362
361
457
Rel
ativ
e flu
ores
cenc
e
Sp142 4 6
2 4 3
2 3 2 64 4 Sp20
2 3 2 3
6 4 64 Sp21
2 3 3
3 Sp8
4 Sp8
3 Sp80
5000
10000
15000
20000
25000
30000
35000
40000
45000
50000
0 2 4 6 8 10 12 Time (h)
74
66
78
62
80
81
82
S18
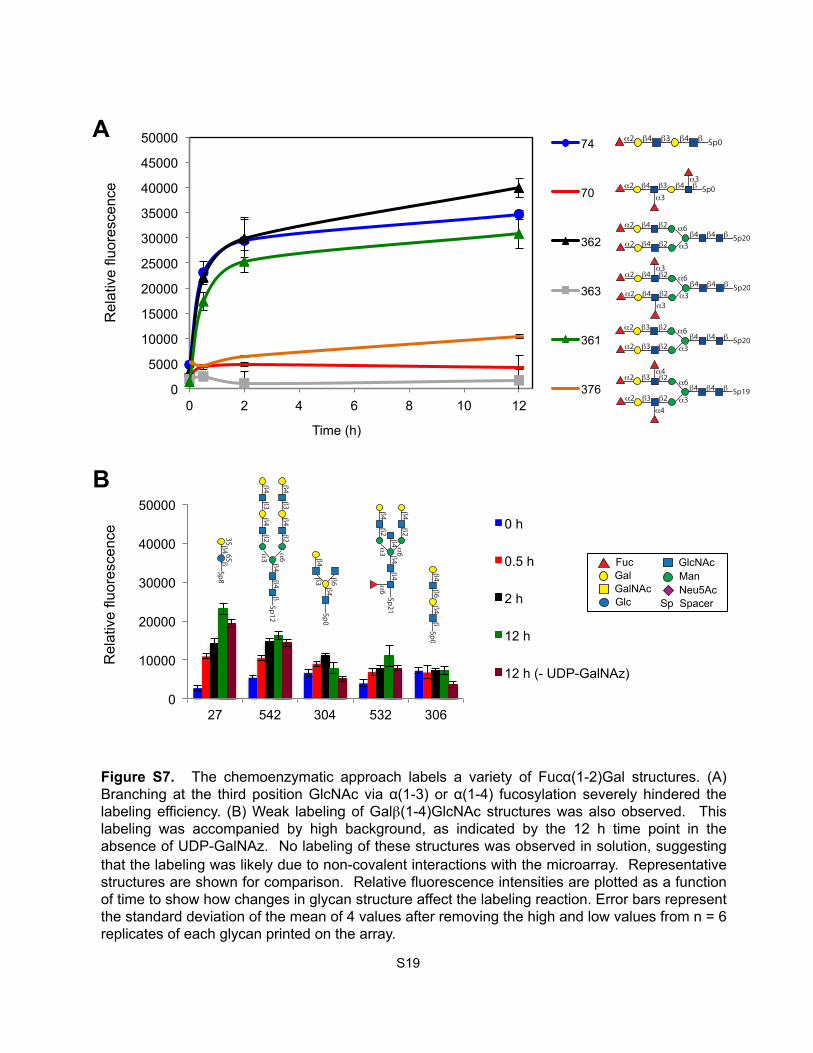
Figure S7. The chemoenzymatic approach labels a variety of Fucα(1-2)Gal structures. (A) Branching at the third position GlcNAc via α(1-3) or α(1-4) fucosylation severely hindered the labeling efficiency. (B) Weak labeling of Galβ(1-4)GlcNAc structures was also observed. This labeling was accompanied by high background, as indicated by the 12 h time point in the absence of UDP-GalNAz. No labeling of these structures was observed in solution, suggesting that the labeling was likely due to non-covalent interactions with the microarray. Representative structures are shown for comparison. Relative fluorescence intensities are plotted as a function of time to show how changes in glycan structure affect the labeling reaction. Error bars represent the standard deviation of the mean of 4 values after removing the high and low values from n = 6 replicates of each glycan printed on the array.
0
5000
10000
15000
20000
25000
30000
35000
40000
45000
50000
0 2 4 6 8 10 12
Time (h)
74
70
362
363
361
376
A
B
2 4 3 4 Sp0
2 4 3 4 Sp03
3
2 4 2 64 4 Sp20
2 4 2 3
2 4 2 64 4 Sp20
2 4 2 33
3
2 3 2 64 4 Sp20
2 3 2 3
42 6
4 4 Sp192 3
2 3
42 3
Fuc Gal GalNAc
GlcNAc
Glc
Man Neu5Ac
Sp Spacer
Rel
ativ
e flu
ores
cenc
e
0
10000
20000
30000
40000
50000
27 542 304 532 306
0 h
0.5 h
2 h
12 h
12 h (- UDP-GalNAz)
Rel
ativ
e flu
ores
cenc
e
43S
6SSp8
43
42
6
43
42
34
4Sp12
6
43
4Sp0
42
64
42
34
46Sp21
46
4Sp0
S19

Figure S8. In-gel fluorescence detection of Fucα(1-2)Gal glycoproteins from neuronal cell lysates. Low background fluorescence was observed in the absence of BgtA, UDP-GalNAz 2, or alkyne-TAMRA 10. The band at ~35 kDa is BgtA, which appears to label itself.
24
38
52
76
102
150
+ + +
-‐ + +
+ -‐ +
+ + -‐
BgtA UDP-GalNAz
Alkyne 10
S20
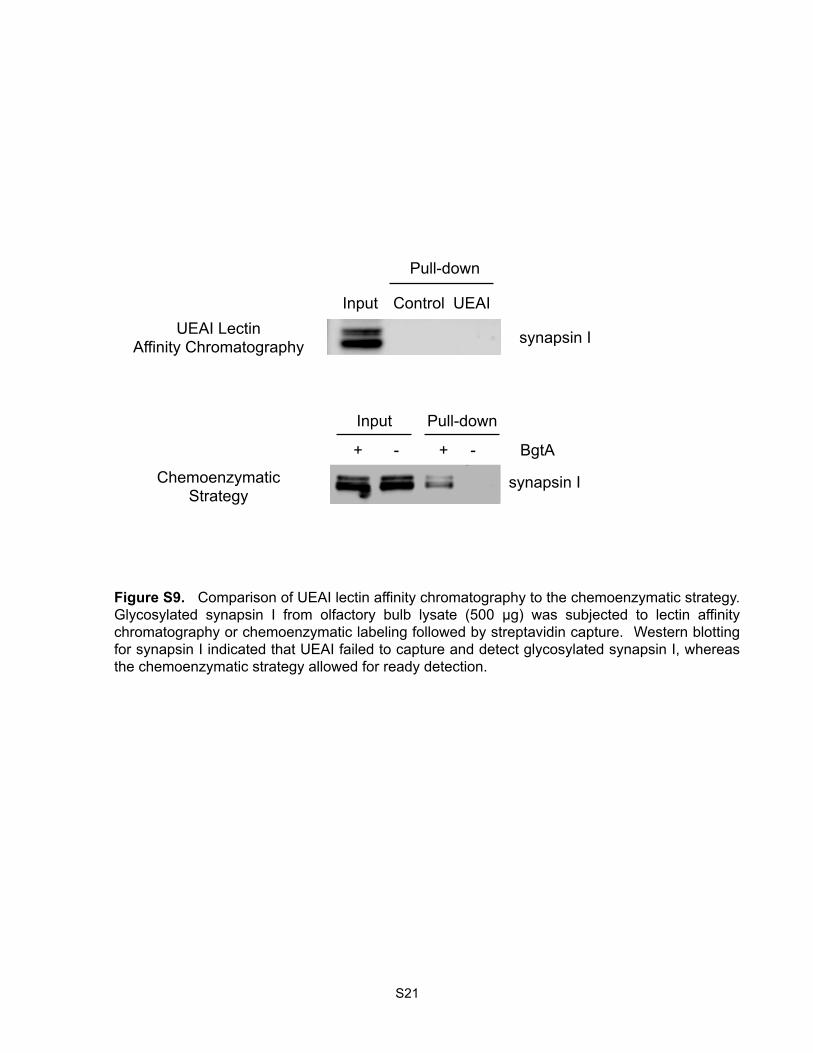
Figure S9. Comparison of UEAI lectin affinity chromatography to the chemoenzymatic strategy. Glycosylated synapsin I from olfactory bulb lysate (500 µg) was subjected to lectin affinity chromatography or chemoenzymatic labeling followed by streptavidin capture. Western blotting for synapsin I indicated that UEAI failed to capture and detect glycosylated synapsin I, whereas the chemoenzymatic strategy allowed for ready detection.
synapsin I
Input Pull-down
BgtA + - + -
Input
Pull-down
Control UEAI
synapsin I UEAI Lectin Affinity Chromatography
Chemoenzymatic Strategy
S21

Figure S10. Low fluorescence labeling of endogenous Fucα(1-2)Gal glycoproteins in HeLa cells. Cells were mock-transfected with an empty FLAG-vector and chemoenzymatically labeled with UDP-GalNAz and BgtA, followed by Alexa-Fluor (AF) 488 alkyne. Weak labeling of the glycoproteins (green) was observed in cells not transfected with synapsin I, suggesting low expression levels of endogenous Fucα(1-2)Gal glycoproteins. Nuclei were stained with 4',6-diamidino-2-phenylindole (DAPI; blue).
50 µm
Synapsin I Alkyne AF 488 Overlay DAPI
S22