Beta Ray Spectrometer lab -...
13
14 Sep 07 β-Ray.1 BETA-RAY SPECTROMETER In this experiment, a 180°, constant-radius magnetic spectrometer consisting of an electromagnet with a Geiger-Muller detector, will be used to detect and analyze the β-rays emitted by 137 Cs. Theory: A number of radioactive nuclei are characterized by emitting electrons or positrons, commonly called β-rays. Measurements show that β-rays are not monoenergetic, as one would expect from the discrete energy levels of the nucleus. Figure 1 shows a typical β-spectrum. Figure 1 β spectra have a characteristic maximum total energy E max , equal to the total disintegration energy (the difference in energy of the levels of the initial and final nuclei between which the β- decay occurs), the recoil energy of the nucleus being negligible. The β energy distribution reaches a maximum for the energy E prob . The continuous energy distribution was explained by Pauli, in 1930, when he postulated that a third particle, the neutrino, is involved in β-decay. This particle would have the energy E max – E in order for the β-decay process to satisfy conservation of energy. The neutrino has no charge, zero (?) rest mass, spin of ½, and interacts with matter by the weak interaction only. The theory of β-decay was developed by Fermi under the assumption that neutrons and protons are two quantum states of the same particle, the nucleon.
Transcript of Beta Ray Spectrometer lab -...

14 Sep 07 β-Ray.1
BETA-RAY SPECTROMETER In this experiment, a 180°, constant-radius magnetic spectrometer consisting of an electromagnet with a Geiger-Muller detector, will be used to detect and analyze the β-rays emitted by 137Cs. Theory: A number of radioactive nuclei are characterized by emitting electrons or positrons, commonly called β-rays. Measurements show that β-rays are not monoenergetic, as one would expect from the discrete energy levels of the nucleus. Figure 1 shows a typical β-spectrum.
Figure 1 β spectra have a characteristic maximum total energy Emax, equal to the total disintegration energy (the difference in energy of the levels of the initial and final nuclei between which the β-decay occurs), the recoil energy of the nucleus being negligible. The β energy distribution reaches a maximum for the energy Eprob. The continuous energy distribution was explained by Pauli, in 1930, when he postulated that a third particle, the neutrino, is involved in β-decay. This particle would have the energy Emax – E in order for the β-decay process to satisfy conservation of energy. The neutrino has no charge, zero (?) rest mass, spin of ½, and interacts with matter by the weak interaction only. The theory of β-decay was developed by Fermi under the assumption that neutrons and protons are two quantum states of the same particle, the nucleon.
14 Sep 07 β-Ray.2
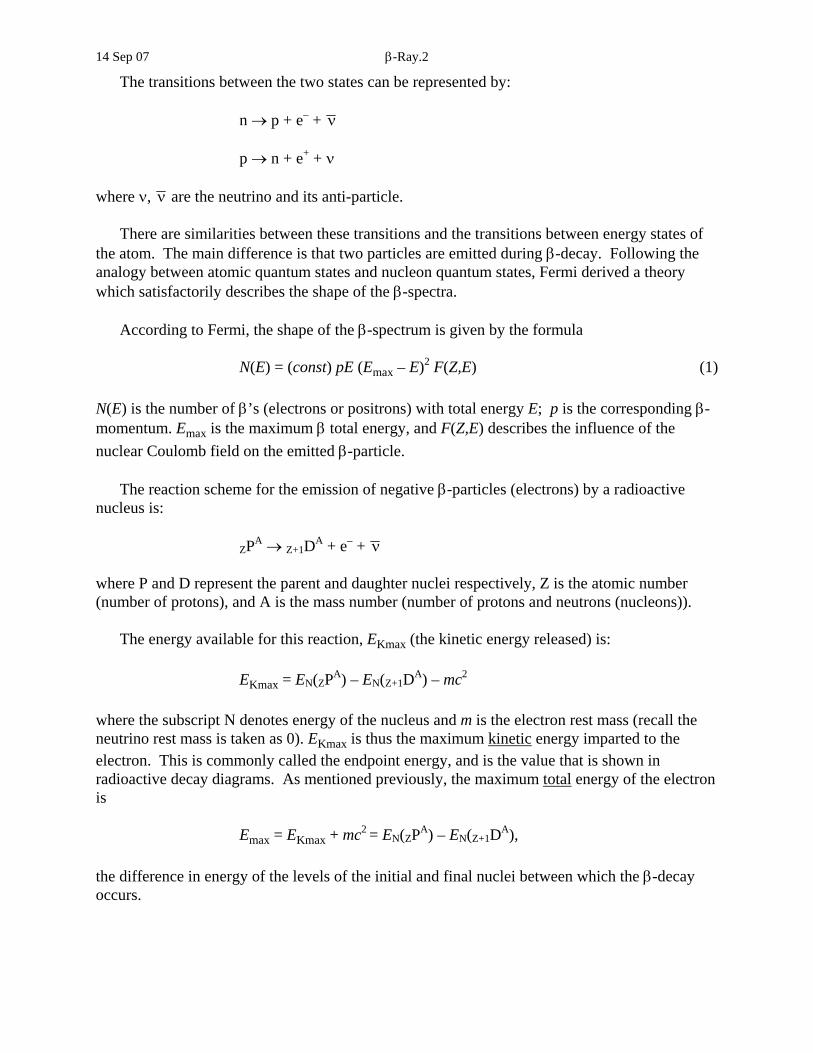
The transitions between the two states can be represented by: n → p + e– + ν p → n + e+ + ν where ν, ν are the neutrino and its anti-particle. There are similarities between these transitions and the transitions between energy states of the atom. The main difference is that two particles are emitted during β-decay. Following the analogy between atomic quantum states and nucleon quantum states, Fermi derived a theory which satisfactorily describes the shape of the β-spectra. According to Fermi, the shape of the β-spectrum is given by the formula N(E) = (const) pE (Emax – E)2 F(Z,E) (1) N(E) is the number of β’s (electrons or positrons) with total energy E; p is the corresponding β-momentum. Emax is the maximum β total energy, and F(Z,E) describes the influence of the nuclear Coulomb field on the emitted β-particle. The reaction scheme for the emission of negative β-particles (electrons) by a radioactive nucleus is: ZPA → Z+1DA + e– + ν where P and D represent the parent and daughter nuclei respectively, Z is the atomic number (number of protons), and A is the mass number (number of protons and neutrons (nucleons)). The energy available for this reaction, EKmax (the kinetic energy released) is: EKmax = EN(ZPA) – EN(Z+1DA) – mc2 where the subscript N denotes energy of the nucleus and m is the electron rest mass (recall the neutrino rest mass is taken as 0). EKmax is thus the maximum kinetic energy imparted to the electron. This is commonly called the endpoint energy, and is the value that is shown in radioactive decay diagrams. As mentioned previously, the maximum total energy of the electron is Emax = EKmax + mc2 = EN(ZPA) – EN(Z+1DA), the difference in energy of the levels of the initial and final nuclei between which the β-decay occurs.
14 Sep 07 β-Ray.3
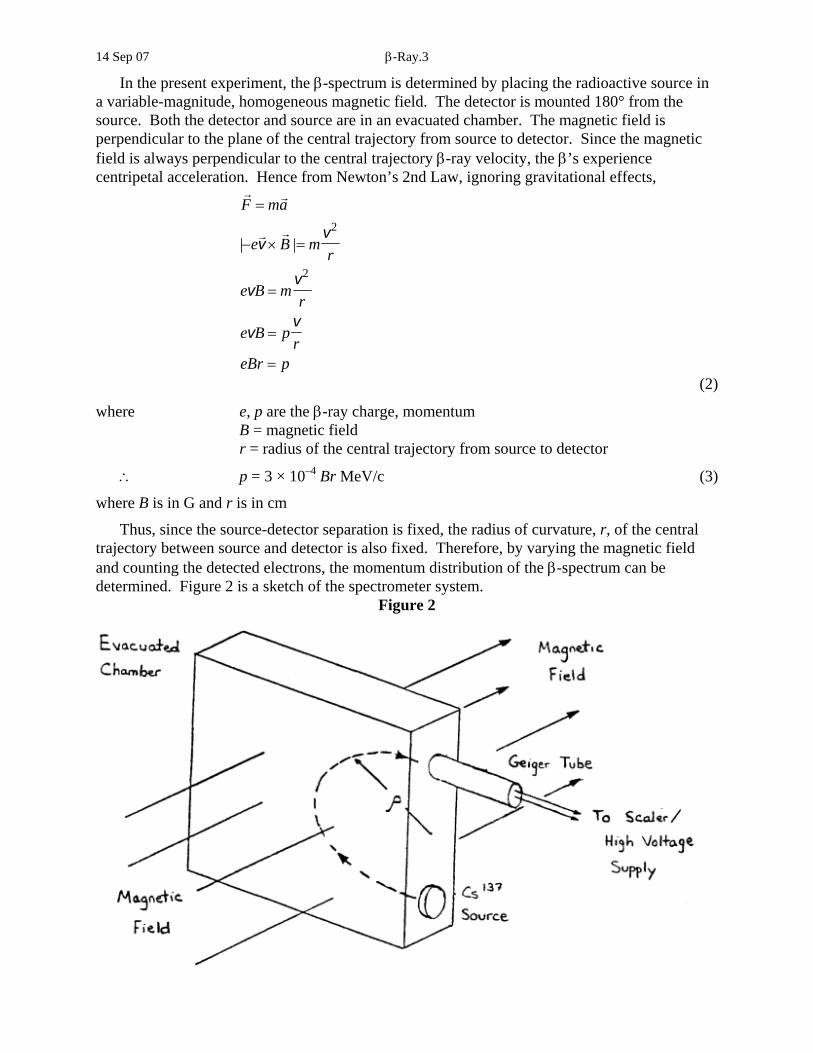
In the present experiment, the β-spectrum is determined by placing the radioactive source in a variable-magnitude, homogeneous magnetic field. The detector is mounted 180° from the source. Both the detector and source are in an evacuated chamber. The magnetic field is perpendicular to the plane of the central trajectory from source to detector. Since the magnetic field is always perpendicular to the central trajectory β-ray velocity, the β’s experience centripetal acceleration. Hence from Newton’s 2nd Law, ignoring gravitational effects,
r r
r r
F ma
e B mr
e B mr
e B pr
eBr p
=
− × =
=
=
=
| |vv
vv
vv
2
2
(2)
where e, p are the β-ray charge, momentum B = magnetic field r = radius of the central trajectory from source to detector
∴ p = 3 × 10⁻⁴ Br MeV/c (3)
where B is in G and r is in cm
Thus, since the source-detector separation is fixed, the radius of curvature, r, of the central trajectory between source and detector is also fixed. Therefore, by varying the magnetic field and counting the detected electrons, the momentum distribution of the β-spectrum can be determined. Figure 2 is a sketch of the spectrometer system.
Figure 2
14 Sep 07 β-Ray.4
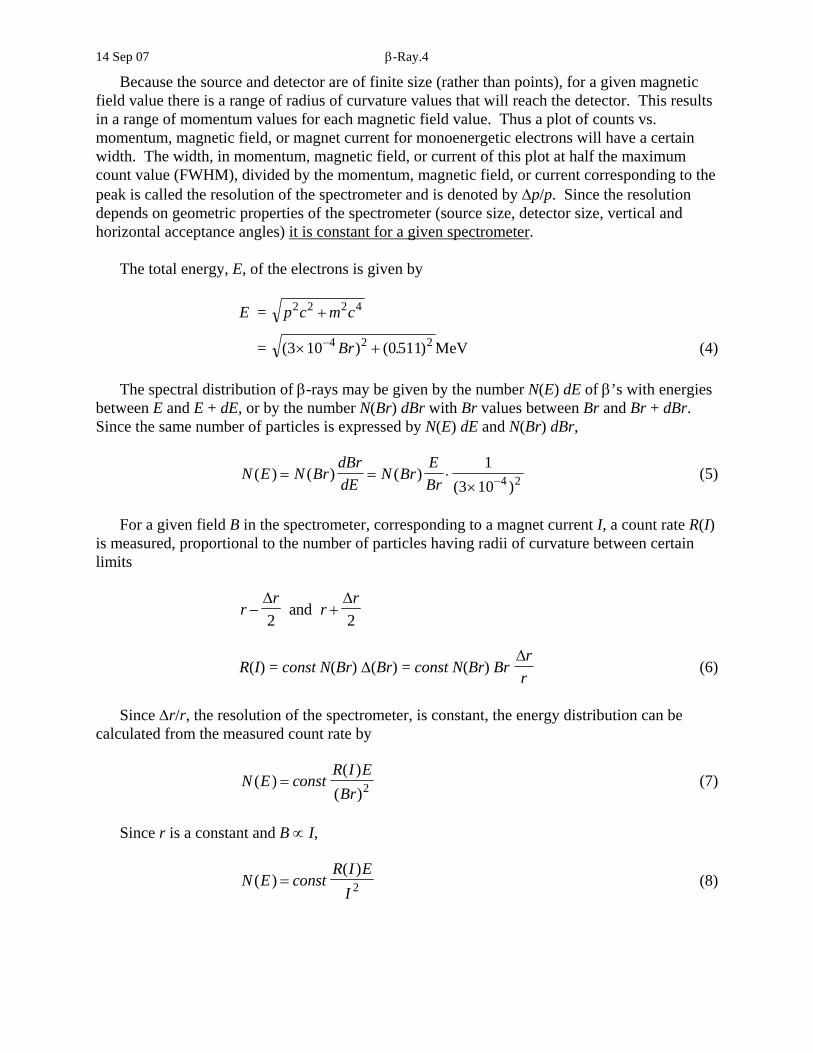
Because the source and detector are of finite size (rather than points), for a given magnetic field value there is a range of radius of curvature values that will reach the detector. This results in a range of momentum values for each magnetic field value. Thus a plot of counts vs. momentum, magnetic field, or magnet current for monoenergetic electrons will have a certain width. The width, in momentum, magnetic field, or current of this plot at half the maximum count value (FWHM), divided by the momentum, magnetic field, or current corresponding to the peak is called the resolution of the spectrometer and is denoted by ∆p/p. Since the resolution depends on geometric properties of the spectrometer (source size, detector size, vertical and horizontal acceptance angles) it is constant for a given spectrometer. The total energy, E, of the electrons is given by E = p c m c2 2 2 4+
= ( ) ( . )3 10 05114 2 2× +− Br MeV (4) The spectral distribution of β-rays may be given by the number N(E) dE of β’s with energies between E and E + dE, or by the number N(Br) dBr with Br values between Br and Br + dBr. Since the same number of particles is expressed by N(E) dE and N(Br) dBr,
N E N BrdBrdE
N BrEBr
( ) ( ) ( )( )
= = ⋅× −
13 10 4 2 (5)
For a given field B in the spectrometer, corresponding to a magnet current I, a count rate R(I) is measured, proportional to the number of particles having radii of curvature between certain limits
rr
rr
− +∆ ∆2 2
and
R(I) = const N(Br) ∆(Br) = const N(Br) Br ∆rr
(6)
Since ∆r/r, the resolution of the spectrometer, is constant, the energy distribution can be calculated from the measured count rate by
N E constR I EBr
( )( )
( )= 2 (7)
Since r is a constant and B ∝ I,
N E constR I E
I( )
( )= 2 (8)
14 Sep 07 β-Ray.5
Similarly, the momentum distribution is given by
N p constR I
I( )
( )= (9)
Recall the theoretical equation for the shape of the β-spectrum, equation (1): N(E) = (const) pE (Emax – E)2 F(Z,E) (1)
N E
pE F Z Econst E E
( )( , )
( max= )− (10)
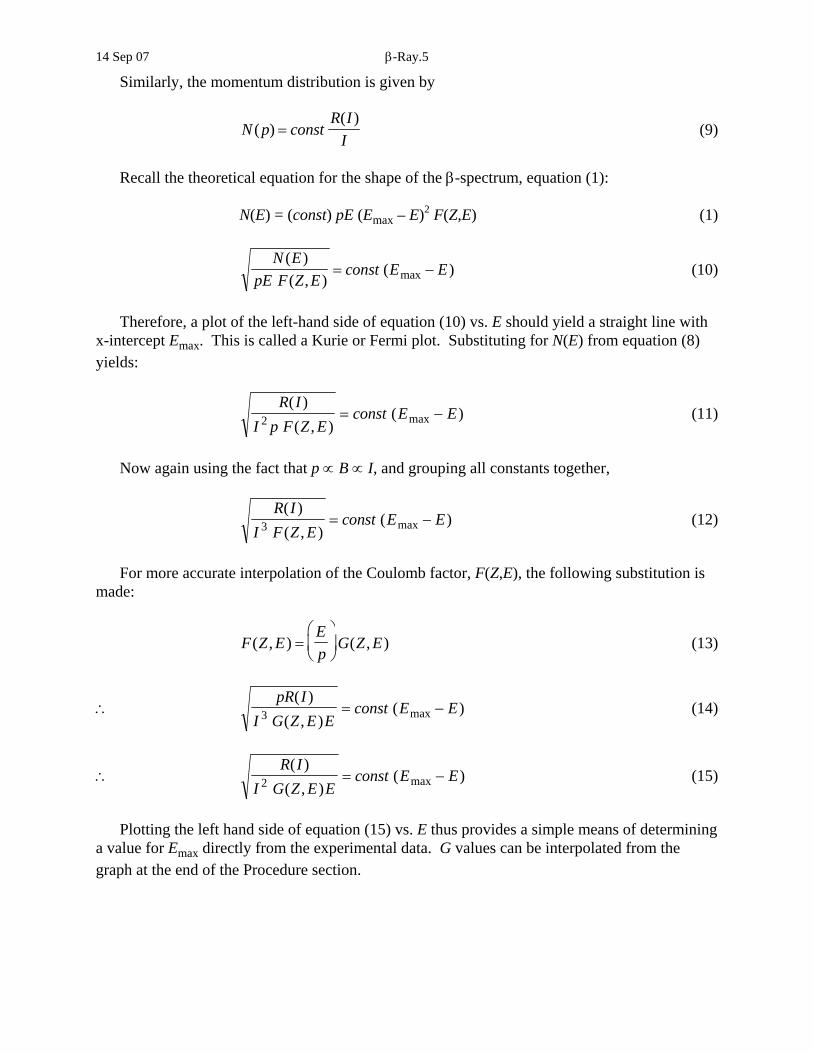
Therefore, a plot of the left-hand side of equation (10) vs. E should yield a straight line with x-intercept Emax. This is called a Kurie or Fermi plot. Substituting for N(E) from equation (8) yields:
R I
I p F Z Econst E E
( )( , )
( max2 = )− (11)
Now again using the fact that p ∝ B ∝ I, and grouping all constants together,
R I
I F Z Econst E E
( )( , )
( max3 = )− (12)
For more accurate interpolation of the Coulomb factor, F(Z,E), the following substitution is made:
F Z EEp
G Z E( , ) ( , )=⎛
⎝⎜
⎞
⎠⎟ (13)
∴ pR I
I G Z E Econst E E
( )( , )
( max3 = )− (14)
∴ R I
I G Z E Econst E E
( )( , )
( max2 = )− (15)
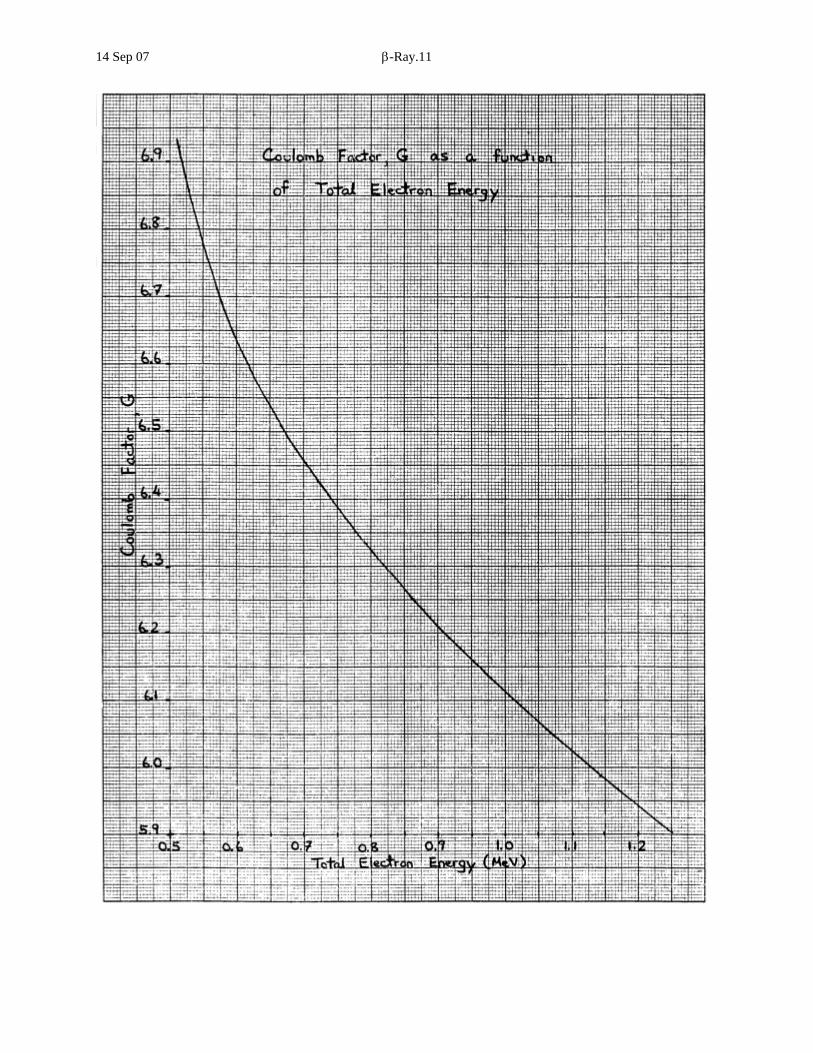
Plotting the left hand side of equation (15) vs. E thus provides a simple means of determining a value for Emax directly from the experimental data. G values can be interpolated from the graph at the end of the Procedure section.
14 Sep 07 β-Ray.6
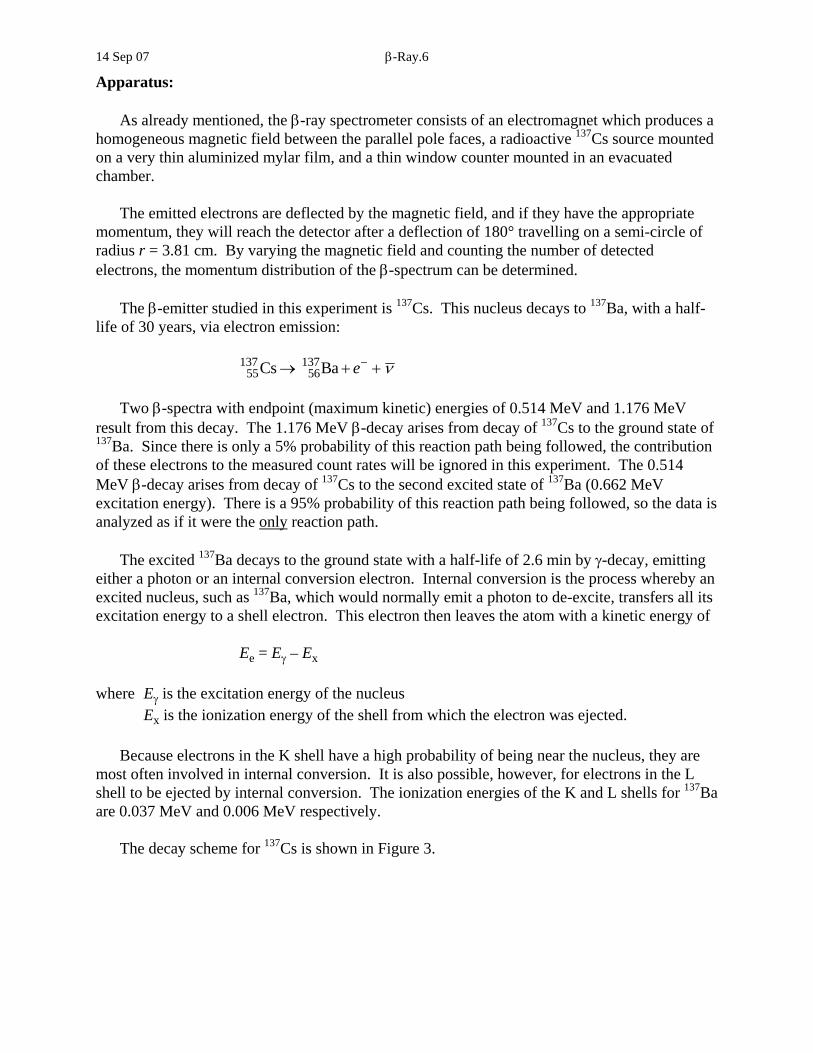
Apparatus: As already mentioned, the β-ray spectrometer consists of an electromagnet which produces a homogeneous magnetic field between the parallel pole faces, a radioactive 137Cs source mounted on a very thin aluminized mylar film, and a thin window counter mounted in an evacuated chamber. The emitted electrons are deflected by the magnetic field, and if they have the appropriate momentum, they will reach the detector after a deflection of 180° travelling on a semi-circle of radius r = 3.81 cm. By varying the magnetic field and counting the number of detected electrons, the momentum distribution of the β-spectrum can be determined. The β-emitter studied in this experiment is 137Cs. This nucleus decays to 137Ba, with a half-life of 30 years, via electron emission: 55
13756
137Cs Ba→ + +−e ν Two β-spectra with endpoint (maximum kinetic) energies of 0.514 MeV and 1.176 MeV result from this decay. The 1.176 MeV β-decay arises from decay of 137Cs to the ground state of 137Ba. Since there is only a 5% probability of this reaction path being followed, the contribution of these electrons to the measured count rates will be ignored in this experiment. The 0.514 MeV β-decay arises from decay of 137Cs to the second excited state of 137Ba (0.662 MeV excitation energy). There is a 95% probability of this reaction path being followed, so the data is analyzed as if it were the only reaction path. The excited 137Ba decays to the ground state with a half-life of 2.6 min by γ-decay, emitting either a photon or an internal conversion electron. Internal conversion is the process whereby an excited nucleus, such as 137Ba, which would normally emit a photon to de-excite, transfers all its excitation energy to a shell electron. This electron then leaves the atom with a kinetic energy of Ee = Eγ – Ex where Eγ is the excitation energy of the nucleus Ex is the ionization energy of the shell from which the electron was ejected. Because electrons in the K shell have a high probability of being near the nucleus, they are most often involved in internal conversion. It is also possible, however, for electrons in the L shell to be ejected by internal conversion. The ionization energies of the K and L shells for 137Ba are 0.037 MeV and 0.006 MeV respectively. The decay scheme for 137Cs is shown in Figure 3.

14 Sep 07 β-Ray.7
Figure 3 The monoenergetic electrons arising from the partially converted γ-ray from 137Ba will be detected by the β-ray spectrometer. The result is a monoenergetic peak superimposed on the continuous β-decay spectrum (see Figure 4).
Figure 4

14 Sep 07 β-Ray.8
where Emax = maximum total β energy = EKmax + mc2 = 0.514 MeV + 0.511 MeV = 1.025 MeV Ee + mc2 = total energy of internal conversion electrons = Eγ – Ex + mc2 = 0.662 MeV – 0.037 MeV + 0.511 MeV = 1.136 MeV The β-detector is an end window Geiger tube operated at 650 V. The voltage on the Geiger tube should not exceed 700 V. The detector is connected to a scaler/high voltage supply. Before turning on the scaler/high voltage supply, set the high voltage to its minimum value, then turn on the scaler/supply, and gradually increase the voltage to the operating value. The vacuum system consists of a mechanical roughing pump capable of pumping down to ~10–2 mm Hg, and oil diffusion pump which reduces the pressure to ~10–6 mm Hg. Since a diffusion pump cannot exhaust against atmospheric pressure, care must be taken to always have the mechanical pump first reduce the pressure to ~10–1 mm Hg. Under normal circumstances this will only take a few minutes. The vacuum meter operates essentially on the magnet chamber. See the page on vacuum system procedures at the end of the Procedure for operating instructions. An Excel spreadsheet, betaray.xls, which does the required calculations and graphs for the data from this experiment, is available on the Arts and Science computer lab network. Ask the lab instructor for the location of the file. A detailed description of this spreadsheet is included in the appendix at the end of this experiment. Note that you still must perform one complete set of sample calculations and sample error calculations 'by hand' (i.e. perform all the required calculations at one of the magnet current values). Procedure and Experiment: 1. Follow the procedure given on page β-ray.12 to evacuate the magnet chamber.
2. While the chamber is being evacuated, log on to the Arts and Science Computer Lab network and load the file betaray.xls from the lab web page. When the file has finished loading, save the spreadsheet to your home directory by selecting Save As... from the File menu.
3. Turn on the scaler/high voltage supply, and check that the tube voltage is set to 650 V.
4. Turn on the magnetic current power supply and adjust the rheostat for a current of about 0.50 A. Use a compass to determine the correct polarity of the magnet current. (Remember that you want to deflect electrons (negatively charged), and that the N pole of a compass points to the ‘north’ pole of the Earth (actually a S magnetic pole).) Also, magnetic field is

14 Sep 07 β-Ray.9
directed from N to S. After the instructor has verified your determination, note the position of the magnet current reversing switch that gives the proper polarity.
5. Because the magnet has an iron core, care must be taken to reduce hysteresis effects. The magnet is de-magnetized before starting the experiment, and magnet current must only be increased during the experiment (if you miss taking a count at a current value, do not go back to do it).
To demagnetize the magnet, gradually increase the current to 1 A, decrease to 0, reverse polarity with the reversing switch and continue decreasing to –1 A, then increase back to 0. Repeat for –0.9 < I < 0.9 A and continue by 0.1 A intervals until the cycle –0.1 A < I < 0.1 A has been completed. The magnet is now demagnetized.
6. Check that the reversing switch is in the position that gives the proper magnetic field polarity. With zero magnet current, measure the background radiation for 5 minutes.
7. Measure the β-ray (electron) count rate R(I) as a function of magnet current. Starting at 0.05 A use counting times of 2 minutes and use increments of 0.05 A, except take readings every 0.02 A for currents between 0.75 and 0.85 A.
The maximum current required is 1.0 A. To avoid hysteresis effects, remember to always change the current (and hence magnetic
field) in the same direction. That is, the current must only be increased, not decreased. Record your data into your lab notebook, and also enter it into the appropriate cells of the
spreadsheet. 8. From the spreadsheet plot of count rate vs. magnet current determine the magnet current that
corresponds to the monoenergetic electron peak. Calibrate the spectrometer as follows:
a) Calculate the momentum of the electrons of the monoenergetic peak. b) Given the assumed direct proportionality between electron momentum and magnet current,
use the observed magnet current corresponding to the monoenergetic peak to obtain the current-momentum conversion factor. i.e. Divide the electron momentum at the monoenergetic peak by the magnet current at the peak to obtain a ‘MeV/c per Amp’ factor. Enter this momentum factor in cell H7 of the spreadsheet.
9. Tabulate values for the momentum count rate, N(p), and the momentum, p, at each magnet
current. From equation (9), N(p) = const (R(I) / I). 'const' depends on the detector efficiency, spectrometer resolution, current-magnetic field calibration factor, and a number of other constants. 'const' is a constant for a given spectrometer system. Since the value of 'const' will not change the shape of the momentum count rate distribution, for ease of calculation set const = 1.
From the FWHM of the monoenergetic peak of the plot of the β-ray momentum distribution,
N(p) vs. p, determine the spectrometer resolution.
14 Sep 07 β-Ray.10
10. Tabulate values for the energy count rate, N(E), the electron total energy, E, and the electron kinetic energy, EK = E – 0.511 MeV at each value of the magnet current. Set 'const' = 1 when using equation (8) to calculate N(E).
From the plot of the β-ray kinetic energy distribution, N(E) vs. EK, determine values for
EKprob and EKmax (ignore the contribution of the monoenergetic peak, since it does not arise from β-decay).
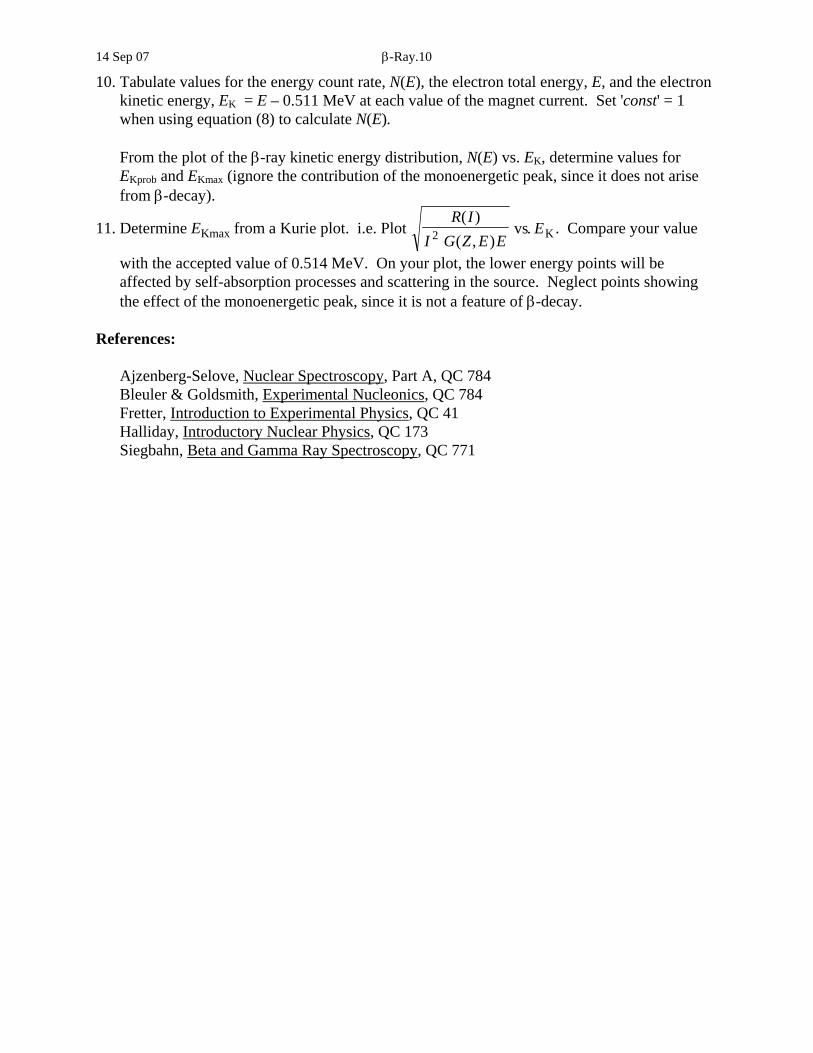
11. Determine EKmax from a Kurie plot. i.e. Plot R I
I G Z E EE
( )( , )
.2 vs K. Compare your value
with the accepted value of 0.514 MeV. On your plot, the lower energy points will be affected by self-absorption processes and scattering in the source. Neglect points showing the effect of the monoenergetic peak, since it is not a feature of β-decay.
References:
Ajzenberg-Selove, Nuclear Spectroscopy, Part A, QC 784 Bleuler & Goldsmith, Experimental Nucleonics, QC 784 Fretter, Introduction to Experimental Physics, QC 41 Halliday, Introductory Nuclear Physics, QC 173 Siegbahn, Beta and Gamma Ray Spectroscopy, QC 771
14 Sep 07 β-Ray.11
14 Sep 07 β-Ray.12
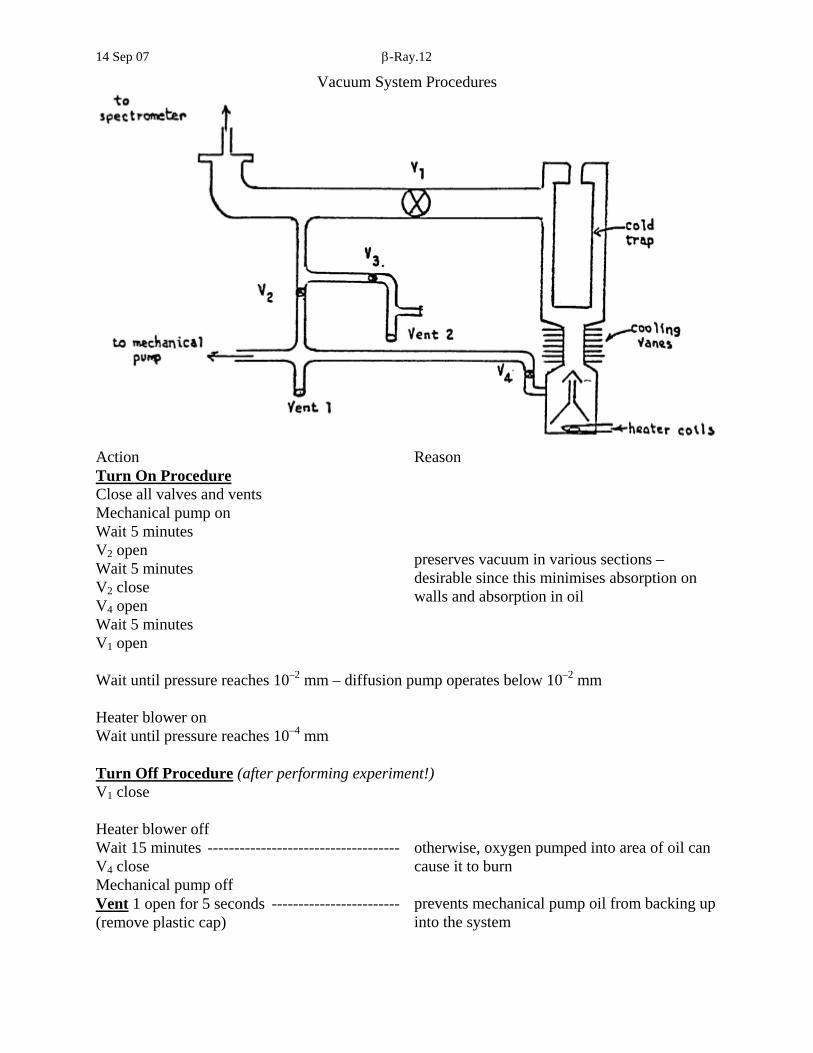
Vacuum System Procedures
Action Reason Turn On Procedure Close all valves and vents Mechanical pump on Wait 5 minutes V2 open Wait 5 minutes V2 close V4 open Wait 5 minutes V1 open
preserves vacuum in various sections – desirable since this minimises absorption on walls and absorption in oil
Wait until pressure reaches 10–2 mm – diffusion pump operates below 10–2 mm Heater blower on Wait until pressure reaches 10–4 mm
Turn Off Procedure (after performing experiment!) V1 close Heater blower off
Wait 15 minutes ------------------------------------V4 close
otherwise, oxygen pumped into area of oil can cause it to burn
Mechanical pump off Vent 1 open for 5 seconds ------------------------(remove plastic cap)
prevents mechanical pump oil from backing up into the system
14 Sep 07 β-Ray.13
Appendix Description of Analysis Spreadsheet for Beta Ray Spectrometer Experiment
This Excel spreadsheet performs the required calculations on the data obtained from the Beta Ray Spectrometer.
The columns of the spreadsheet contain the following values:
column A: magnet current (in Amps) (input by user) column C: error in the current (input by user) column D: counts recorded by the detector (input by user) column F: error in the counts (calculated by spreadsheet) column G: elapsed time over which counts were measured (minutes) (input by user) column H: count rate corrected for background (counts per minute) (calculated by
spreadsheet) column J: error in count rate (calculated by spreadsheet) column K: beta ray momentum (MeV/c) (calculated by spreadsheet) column M: error in momentum (calculated by spreadsheet) column N: momentum distribution values (no. of betas per unit momentum) (calculated by
spreadsheet) column P: error in momentum distribution values (calculated by spreadsheet) column Q: beta ray total energy (MeV) (calculated by spreadsheet) column S: error in total energy (calculated by spreadsheet) column T: beta ray kinetic energy (MeV) (calculated by spreadsheet) column V: error in kinetic energy (calculated by spreadsheet) column W: energy distribution values (no. of betas per unit energy) (calculated by
spreadsheet) column Y: error in energy distribution values (calculated by spreadsheet) column Z: G factor (input by user) column AB: error in G factor (input by user) column AC: values for Kurie plot (calculated by spreadsheet) column AE: error in Kurie plot values (calculated by spreadsheet)
The following information must be entered in the spreadsheet: ♦ background count and time (cells H3 and H4) ♦ current-to-momentum conversion factor (MeV/c per Amp) (cells H7 and J7) ♦ currents, counts, and times for beta measurements (columns A, C, D, and G) ♦ G factor values (columns Z and AB)