
Bauer Supply Chain Spring 2015 Symposium · Bauer Supply Chain Spring 2015 Symposium. ......
22
Bauer Supply Chain Spring 2015 Symposium Supply Chain Complexity March 6, 2015
Transcript of Bauer Supply Chain Spring 2015 Symposium · Bauer Supply Chain Spring 2015 Symposium. ......
Bauer Supply Chain Spring 2015 SymposiumSupply Chain Complexity
March 6, 2015

Wilson Perumal & Company, Inc.
Agenda
• Complexity facing companies today
• Quantifying the impact of complexity
• Eliminating and managing complexity
2
Wilson Perumal & Company, Inc.
Agenda
• Complexity facing companies today
• Quantifying the impact of complexity
• Eliminating and managing complexity
3
Wilson Perumal & Company, Inc.
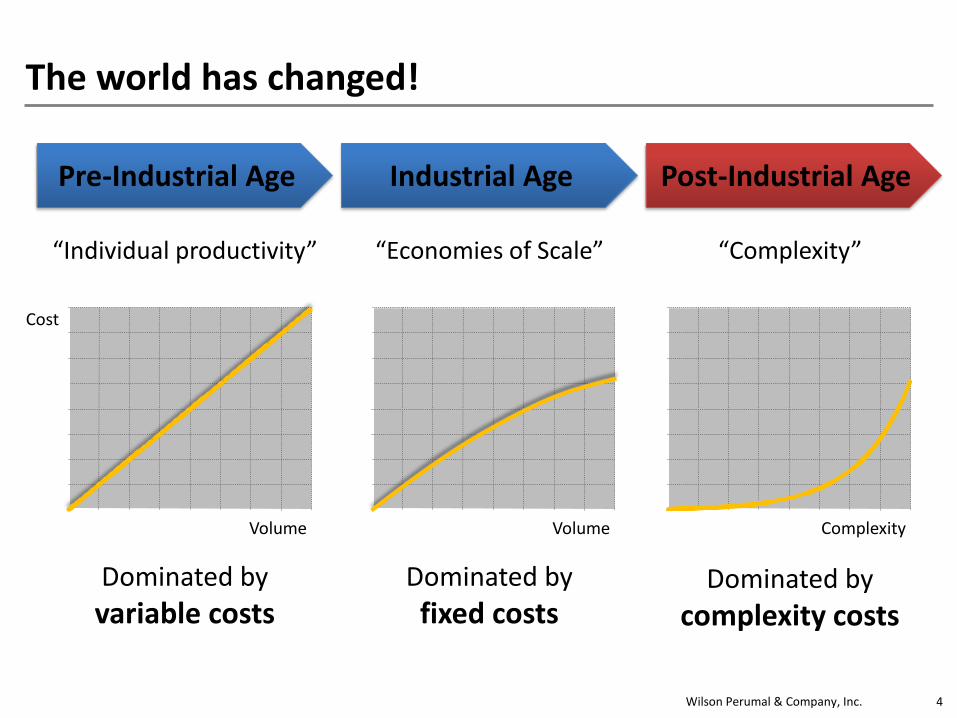
The world has changed!
Volume
Cost
Pre-Industrial Age
“Individual productivity”
Dominated by variable costs
Volume
Industrial Age
“Economies of Scale”
Dominated by fixed costs
Complexity
Post-Industrial Age
“Complexity”
Dominated by complexity costs
4
Wilson Perumal & Company, Inc.
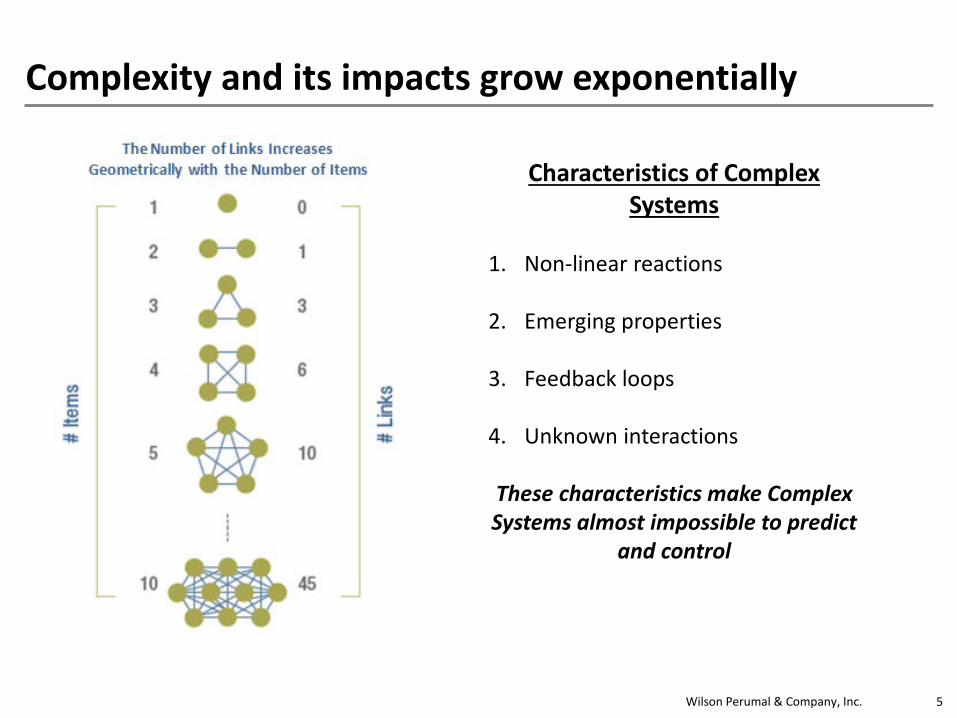
Complexity and its impacts grow exponentially
Characteristics of Complex Systems
1. Non-linear reactions
2. Emerging properties
3. Feedback loops
4. Unknown interactions
These characteristics make Complex Systems almost impossible to predict
and control
5

Wilson Perumal & Company, Inc.
Complexity is stretching companies’ capabilitiesTECHNOLOGY IS MORE COMPLEX PRODUCTS AND SERVICES MORE COMPLEX
PROCESSES MORE COMPLEX ORGANIZATIONS MORE COMPLEX
REGULATIONS MORE COMPLEX
MARKETS MORE COMPLEX
X
X
X
X X
6

Wilson Perumal & Company, Inc.
Many companies are passing a complexity threshold
VALUE(diminishing returns)
COST & RISK(exponential growth)
Level of complexity you can support
$
Complexity
Costs and operational risk grow exponentially with complexity
Few companies are still here
Many companies are here
An increasing number of companies are here
7
Wilson Perumal & Company, Inc.
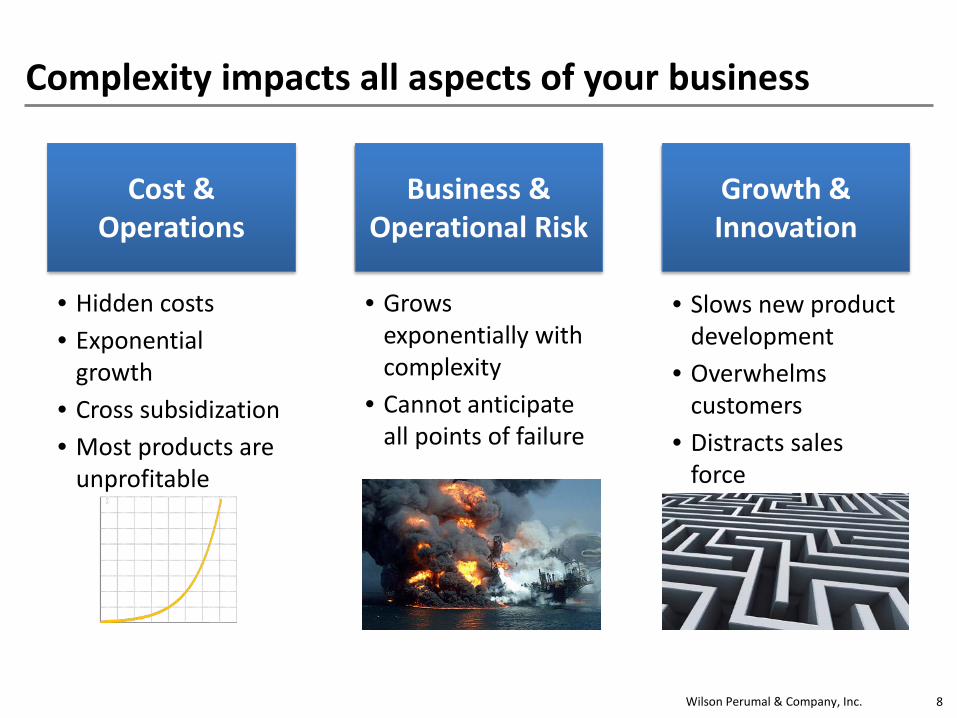
Complexity impacts all aspects of your business
Cost & Operations
Business & Operational Risk
Growth & Innovation
• Hidden costs• Exponential
growth• Cross subsidization• Most products are
unprofitable
• Grows exponentially with complexity
• Cannot anticipate all points of failure
• Slows new product development
• Overwhelms customers
• Distracts sales force
8

Wilson Perumal & Company, Inc.
Product, Process & Organization Complexity interact to drive higher costs & risk
Organization
Value add
Non-value add
The Complexity Cube
Product Process
Organization
Number of processes, steps,
handoffs, etc.
Number of products and
services you offer
Number of assets, facilities, entities,
partners, etc.
9

Wilson Perumal & Company, Inc.
Complexity impacts all aspects of supply chain performance
Complexity-driven supply chain challenges
Bloated Inventories
More Supply Chain
Disruptions
Increased NVA Cost/ Overhead
Slower Response
Times
Poor S&OP Accuracy
11
Presenter
Presentation Notes
So, my msg here, is complexity creeps in. And left unaddressed or ignored, can have an impact. It can certainly impact growth. Think about as complexity creeps in, it can impair service levels, or customer experiences, a driver of top-line growth We’ve seen a lot of examples wehre to feed multiple BUs, dfferent demnads, the innov pipe gets crowded and nothing gets out Customers may get confused. Lot of research on overchoise Portfolio mgmt – proliferation can consume resources that should be used on step-change products Trading scale for revenue – understanding from the whale curve how complexity consumes resources, it can fragment scale

Wilson Perumal & Company, Inc.
Agenda
• Complexity facing companies today
• Quantifying the impact of complexity
• Eliminating and managing complexity
12

Wilson Perumal & Company, Inc.
How do you allocate costs?
Total cost
Volume
Unit cost
Total cost
Volume
Unit cost
By “Volume”
Volume Volume
By “Item”
13

Wilson Perumal & Company, Inc.
Complexity costs follow a square root of volume relationship
Most NVA costs fall in between “by volume” and “by unit” extremes
We see the SQRT relationship over and over
• Cost rises with volume but not as much as in “by volume” approach
• Unit cost drops off with volume but not as much as in “by item” approach
15

Wilson Perumal & Company, Inc.
Cost allocation methods
Costing approach
By actual costs By allocation
By ‘volume’ By ‘SQRT vol.’ By ‘item’• Best approach• But not always practical
(e.g., activity-based costing) Cost allocated in
proportion to either # units, revenue, cost, etc.
I.e., “Peanut butter spread”
• Costs divided equally between products, stores, regions, etc. regardless of volume
• In between “by volume” and “by item” methods
• Higher-vol. items receive greater aggregate cost
• Lower-vol. items receive greater unit cost
• NVA/complexity costs follow the “SQRT of volume” relationship• Without this tool, most companies allocate these costs using the “by volume” method,
leading to over-costing of high-volume items and under-costing of low-volume items
16
Wilson Perumal & Company, Inc.
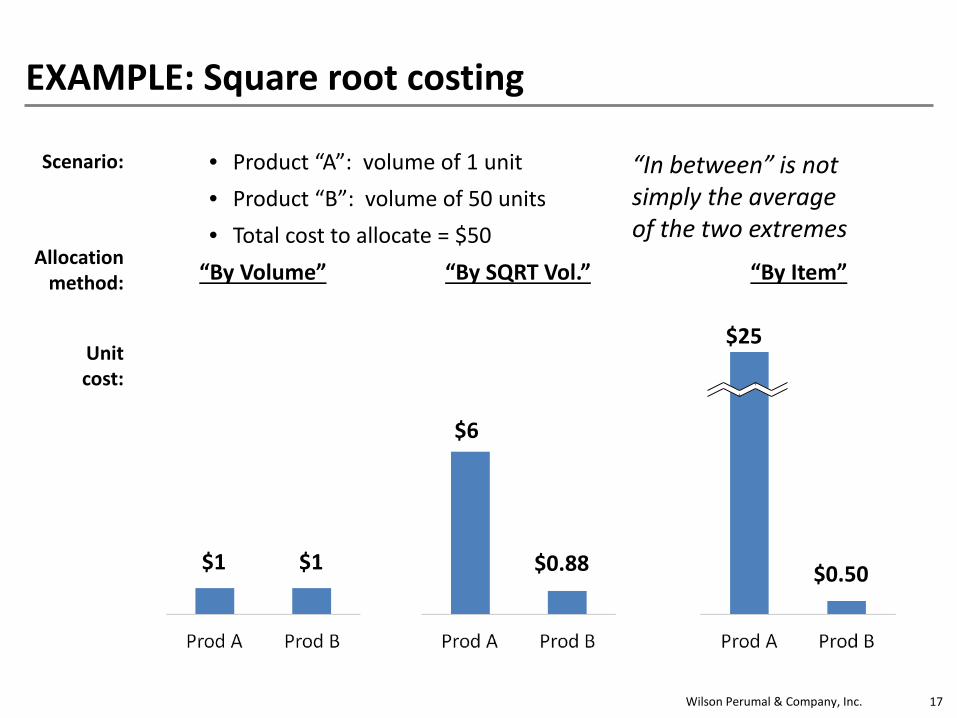
EXAMPLE: Square root costing
$1 $1
$6
$0.88
$25
$0.50
“By Volume” “By Item”“By SQRT Vol.”
• Product “A”: volume of 1 unit• Product “B”: volume of 50 units• Total cost to allocate = $50
“In between” is not simply the average of the two extremes
Unitcost:
Allocationmethod:
Scenario:
17

Wilson Perumal & Company, Inc.
Only complexity-driven costs are allocated using square root costing
Variable(α Vol.)
Fixed
Variable(α Vol.)
Fixed
SQRTcosts
Traditional Allocation
Categorization
“Square Root” Allocation
Categorization
• Unmasks cross-subsidization
• Corrects for under-costing small volume items/activities
• Corrects for over-estimating potential for fixed cost leverage
18

Wilson Perumal & Company, Inc.
Reallocating costs
Total Costs
Corporate SG&A
Packaging Materials
Marketing Spend
Distri-bution
Conversion Costs
Brewing Materials
11%
36%
19%
10%
14%
11%
100%
1044
3413
1860
920
1316
1058 9611Allocate only those costs driven by NVA complexity
Annual Costs ($M)
19
Wilson Perumal & Company, Inc.
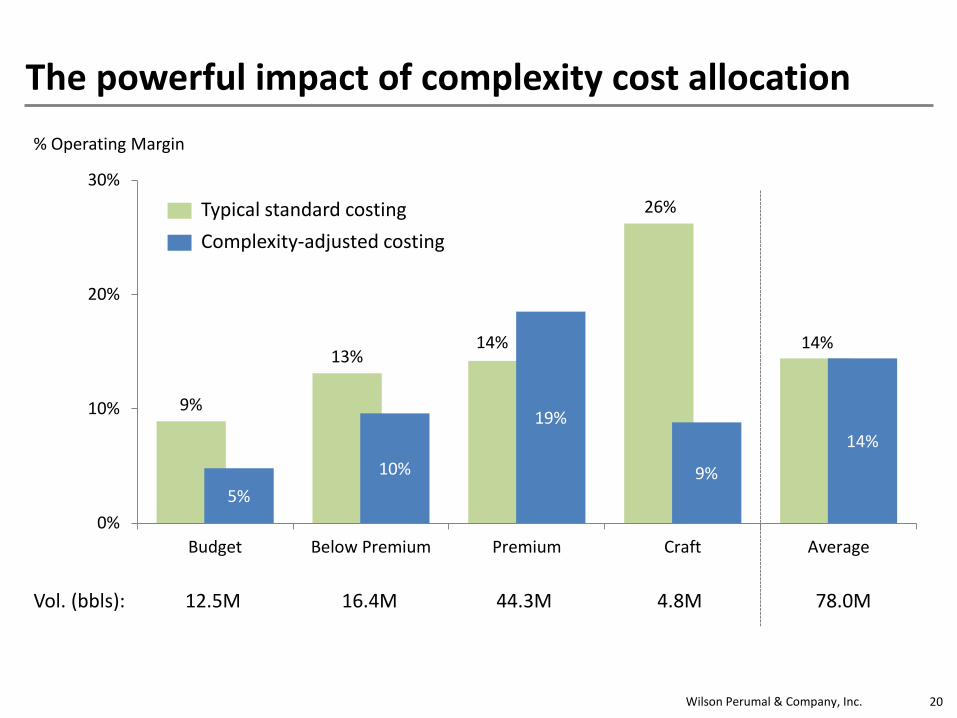
The powerful impact of complexity cost allocation
9%
13%14%
26%
14%
5%10%
19%
9%
14%
0%
10%
20%
30%
Budget Below Premium Premium Craft Average
% Operating Margin
Vol. (bbls): 12.5M 16.4M 44.3M 4.8M 78.0M
Typical standard costingComplexity-adjusted costing
20

Wilson Perumal & Company, Inc.
Agenda
• Complexity facing companies today
• Quantifying the impact of complexity
• Eliminating and managing complexity
22

Wilson Perumal & Company, Inc.
Complexity creates a vicious cycle
23
Presenter
Presentation Notes
What we have shown through the case study is evidence for why traditional forms of management no longer work, but the root cause for this is that companies today operate in amidst a level of complexity
Wilson Perumal & Company, Inc.
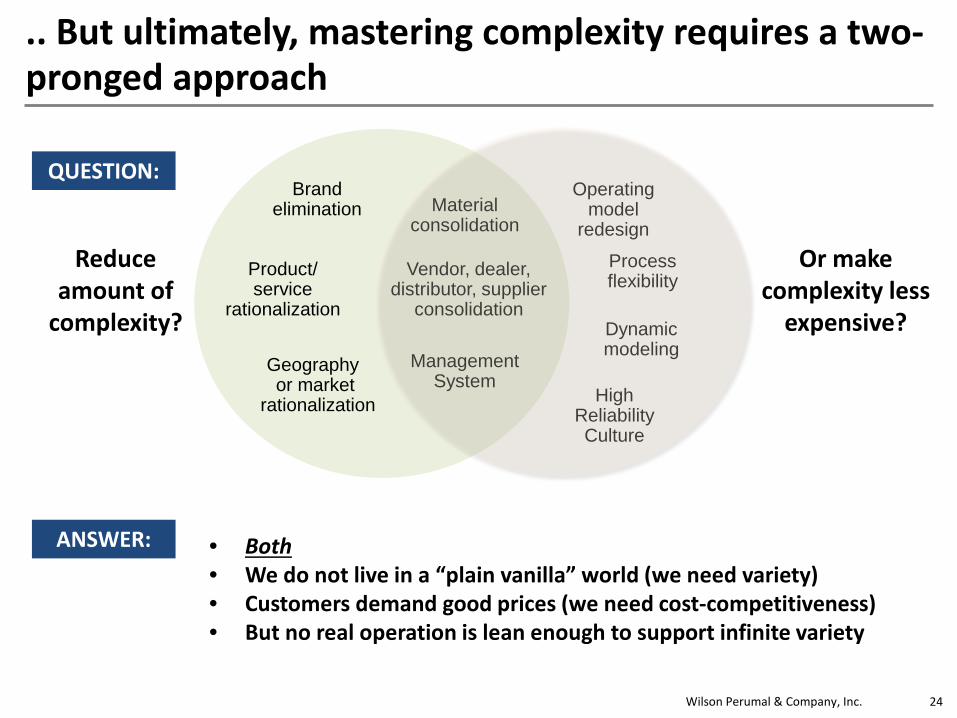
.. But ultimately, mastering complexity requires a two-pronged approach
Product/service
rationalization
Brand elimination Material
consolidation
Vendor, dealer, distributor, supplier
consolidation
Geography or market
rationalization
Management System
Reduce amount of
complexity?
Operating model
redesign
Process flexibility
Dynamicmodeling
High Reliability Culture
Or make complexity less
expensive?
QUESTION:
ANSWER: • Both• We do not live in a “plain vanilla” world (we need variety)• Customers demand good prices (we need cost-competitiveness)• But no real operation is lean enough to support infinite variety
24
Wilson Perumal & Company, Inc.
Conclusion
• Complexity has become a key factor driving performance for many companies…
• …but most companies are ill-prepared to identify and manage complexity in their operations
• Companies can better deal with increasing complexity by:
– Understanding the sources of complexity and the impacts (cost & performance)
– Eliminating NVA complexity and better managing necessary complexity
29