ars.els-cdn.com · Web viewover clean Ag single crystal surfaces is 10.35 molecules. Ethylene *cm...
18
Supporting information for Preparation and the particle size effects of Ag/α-Al 2 O 3 catalysts for ethylene epoxidation J.E. van den Reijen a , S. Kanungo b , T.A.J. Welling c , M. Versluijs- Helder a , T.A. Nijhuis b,d , K.P. de Jong a , P.E. de Jongh a, * a Inorganic Chemistry and Catalysis, Debye Institute for Nanomaterials Science, Utrecht University, Utrecht, The Netherlands b Laboratory of Chemical Reactor Engineering, Department of Chemical Engineering and Chemistry, Eindhoven University of Technology, Eindhoven, The Netherlands c Soft Condensed Matter, Debye Institute for Nanomaterials Science, Utrecht University, Utrecht, The Netherlands d present affilitation: SABIC, STC Geleen, PO Box 5151, 6130 PD Sittard, The Netherlands In this supporting information additional results are presented. This includes the tabulated silver particle sizes determined by electron microscopy and UV/Vis, and the dependency of the particle size on the gas composition during heat treatment. Furthermore, the analysis of the thermal stability of the silver oxalate precursor performed with TGA, MS and XRD is included. An estimation of the oxygen flow at the exit of the reactor using the oxygen mass balance presents an explanation for the unexpected temperature dependence of the ethylene conversion. Finally, the selectivity and conversion of a selection of catalysts is shown in comparison with an industrial catalyst. Table of contents: S1
Transcript of ars.els-cdn.com · Web viewover clean Ag single crystal surfaces is 10.35 molecules. Ethylene *cm...
Supporting information for Preparation and the particle size effects of Ag/α-Al2O3 catalysts for
ethylene epoxidation
J.E. van den Reijena, S. Kanungob, T.A.J. Wellingc, M. Versluijs-Heldera, T.A. Nijhuisb,d, K.P. de Jonga,
P.E. de Jongha,*
a Inorganic Chemistry and Catalysis, Debye Institute for Nanomaterials Science, Utrecht University,
Utrecht, The Netherlandsb Laboratory of Chemical Reactor Engineering, Department of Chemical Engineering and Chemistry,
Eindhoven University of Technology, Eindhoven, The Netherlandsc Soft Condensed Matter, Debye Institute for Nanomaterials Science, Utrecht University, Utrecht, The
Netherlandsd present affilitation: SABIC, STC Geleen, PO Box 5151, 6130 PD Sittard, The Netherlands
In this supporting information additional results are presented. This includes the tabulated silver particle
sizes determined by electron microscopy and UV/Vis, and the dependency of the particle size on the gas
composition during heat treatment. Furthermore, the analysis of the thermal stability of the silver oxalate
precursor performed with TGA, MS and XRD is included. An estimation of the oxygen flow at the exit of
the reactor using the oxygen mass balance presents an explanation for the unexpected temperature
dependence of the ethylene conversion. Finally, the selectivity and conversion of a selection of catalysts is
shown in comparison with an industrial catalyst.
Table of contents:
Section S1: Support grain size distribution S2
Section S2: Synthesis of catalysts with different silver particle size S2
Section S3: Thermal analysis silver oxalate S5
Section S4: Catalytic results S9
S1
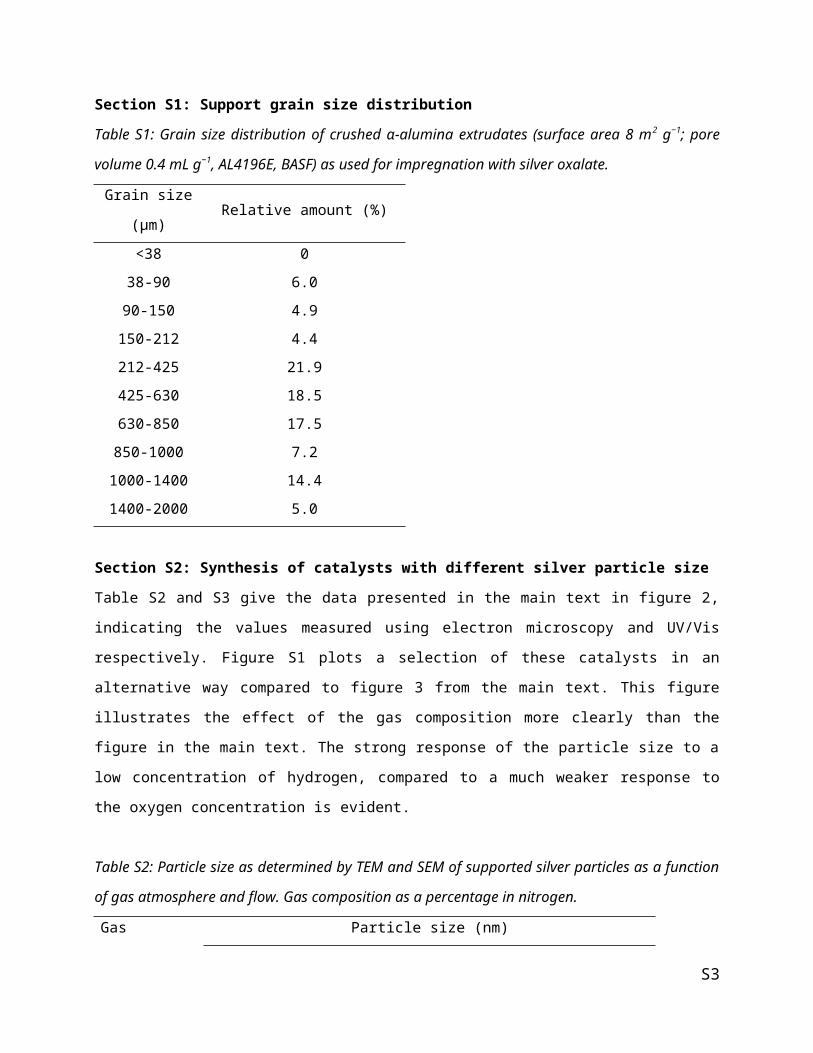
Section S1: Support grain size distribution
Table S1: Grain size distribution of crushed α-alumina extrudates (surface area 8 m2 g−1; pore volume 0.4
mL g−1, AL4196E, BASF) as used for impregnation with silver oxalate.
Grain size (μm) Relative amount (%)
<38 0
38-90 6.0
90-150 4.9
150-212 4.4
212-425 21.9
425-630 18.5
630-850 17.5
850-1000 7.2
1000-1400 14.4
1400-2000 5.0
Section S2: Synthesis of catalysts with different silver particle size
Table S2 and S3 give the data presented in the main text in figure 2, indicating the values measured using
electron microscopy and UV/Vis respectively. Figure S1 plots a selection of these catalysts in an
alternative way compared to figure 3 from the main text. This figure illustrates the effect of the gas
composition more clearly than the figure in the main text. The strong response of the particle size to a low
concentration of hydrogen, compared to a much weaker response to the oxygen concentration is evident.
Table S2: Particle size as determined by TEM and SEM of supported silver particles as a function of gas
atmosphere and flow. Gas composition as a percentage in nitrogen.
Gas
compositionParticle size (nm)
0 mL min-1 10 mL min-1 25 mL min-1 50 mL min-1 100 mL min-1
100% H2 36 31 28 28 20
50% H2 n.d. n.d. n.d. n.d. n.d.
20% H2 n.d. n.d. 29 n.d. n.d.
8.5% H2 40 45 33 48 37
100% N2 73 62 60 62 59
8.5% O2 65 58 69 67 66
S2
20% O2 n.d. n.d. 74 n.d. n.d.
50% O2 n.d. n.d. n.d. n.d. n.d.
100% O2 123 67 103 76 88
n.d.: Particle size is not determined using electron microscopy techniques
Table S3: Peak position of surface plasmon resonance peak as a function of gas atmosphere and flow
speed as determined by UV/Vis spectroscopy. Gas composition as a percentage in nitrogen.
Gas
compositionSurface Plasmon Resonance peak maximum (nm)
0 mL min-1 10 mL min-1 25 mL min-1 50 mL min-1 100 mL min-1
100% H2 419 411 406 413 413
50% H2 414 412 n.d. 427 422
20% H2 n.d. n.d. 411 n.d. n.d.
8.5% H2 406 418 412 422 420
100% N2 423 414 422 429 429
8.5% O2 442 440 428 443 439
20% O2 n.d. n.d. 451 n.d. n.d.
50% O2 n.d. 418 n.d. 435 458
100% O2 446 433 445 447 452
n.d.: Particle size is not determined using UV/Vis
The results obtained from simulations of a 40% α-alumina, 60% air environment are displayed in figure 2
of the main body text, but figure S1 shows the same figure as figure 2 with additional results from 30 and
50% α-alumina in air. This figure shows that, excluding particles larger than 100 nm, the 30 and 50% α-
alumina environments respectively under- and overestimate the peak position of the surface plasmon
resonance. For this reason, the 40% α-alumina environment was selected for estimating the silver particle
size from UV/Vis.
The surface plasmon resonance is related to the silver surface and the direct environment of the particle. 1
When assuming semi-spherical particles the 33.33% would be into contact with the support, while for flat
slab-like silver particles would be closer to 50%. 40% would therefore be a reasonable estimate for the
amount of silver surface in contact with the alumina support. However, theoretical approaches of
estimating the λmax of the surface plasmon resonance are known to have difficulty correctly predicting
the effect of the proximity of the support with a given refractive index.1 This means that while the trend
would be valid, the percentage cannot be directly correlated to the surface wetting and particle shape.
S3
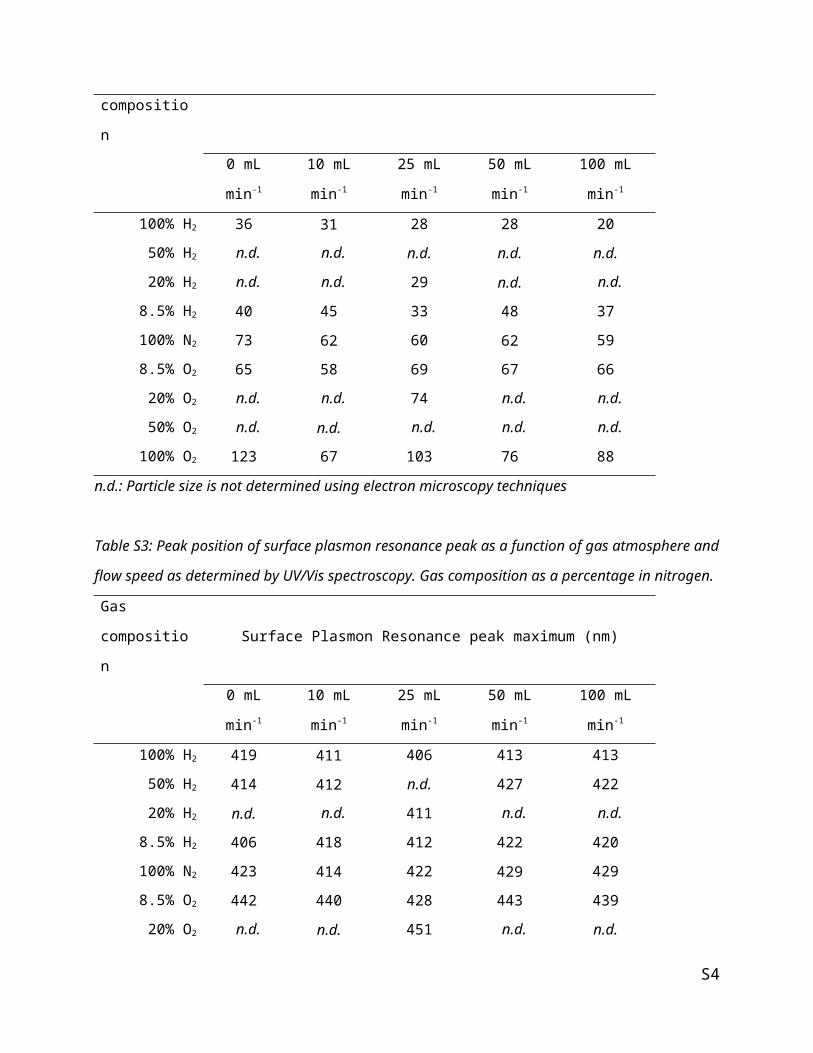
Figure S1: Surface plasmon resonance peak position as determined by UV/Vis compared to the particle
size of silver particles on α-alumina as determined by electron microscopy, corresponding to figure 2 in
the main body text. Three dashed lines indicate theoretical SPR peak positions obtained from simulations
of silver particles in a 50:50, 40:60 and 30:70 α-alumina:air environment obtained with Lumerical
software package.
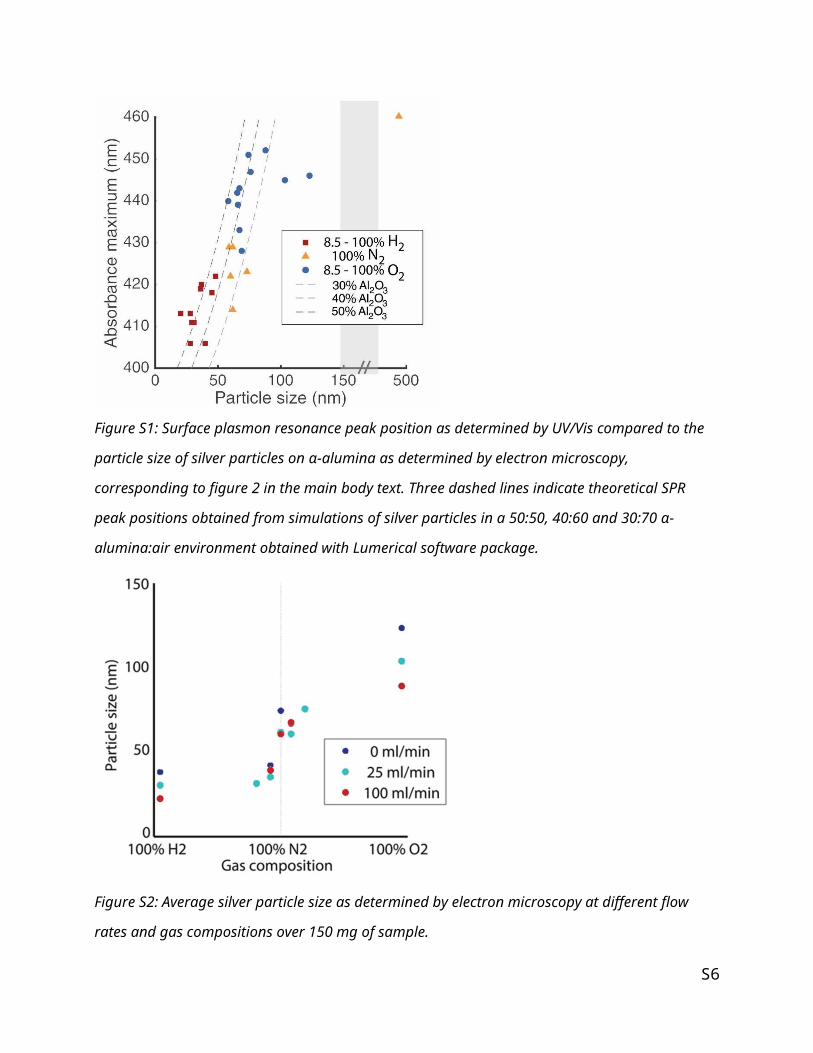
Figure S2: Average silver particle size as determined by electron microscopy at different flow rates and
gas compositions over 150 mg of sample.
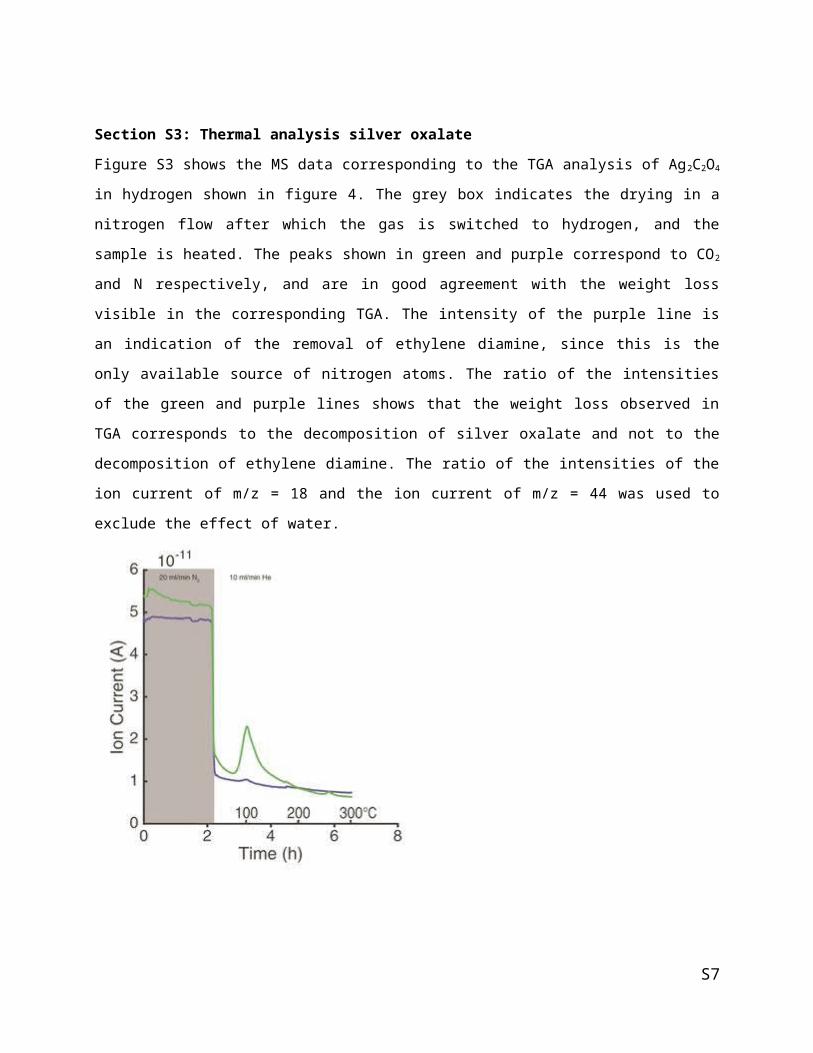
Section S3: Thermal analysis silver oxalate
S4
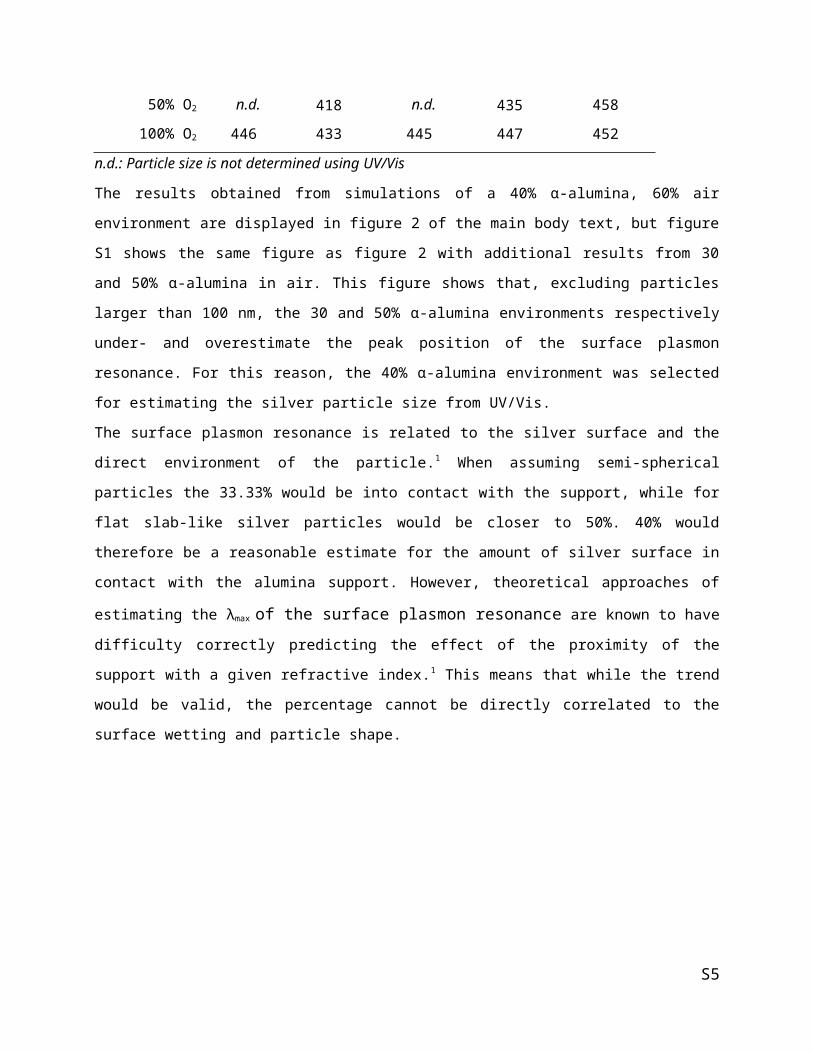
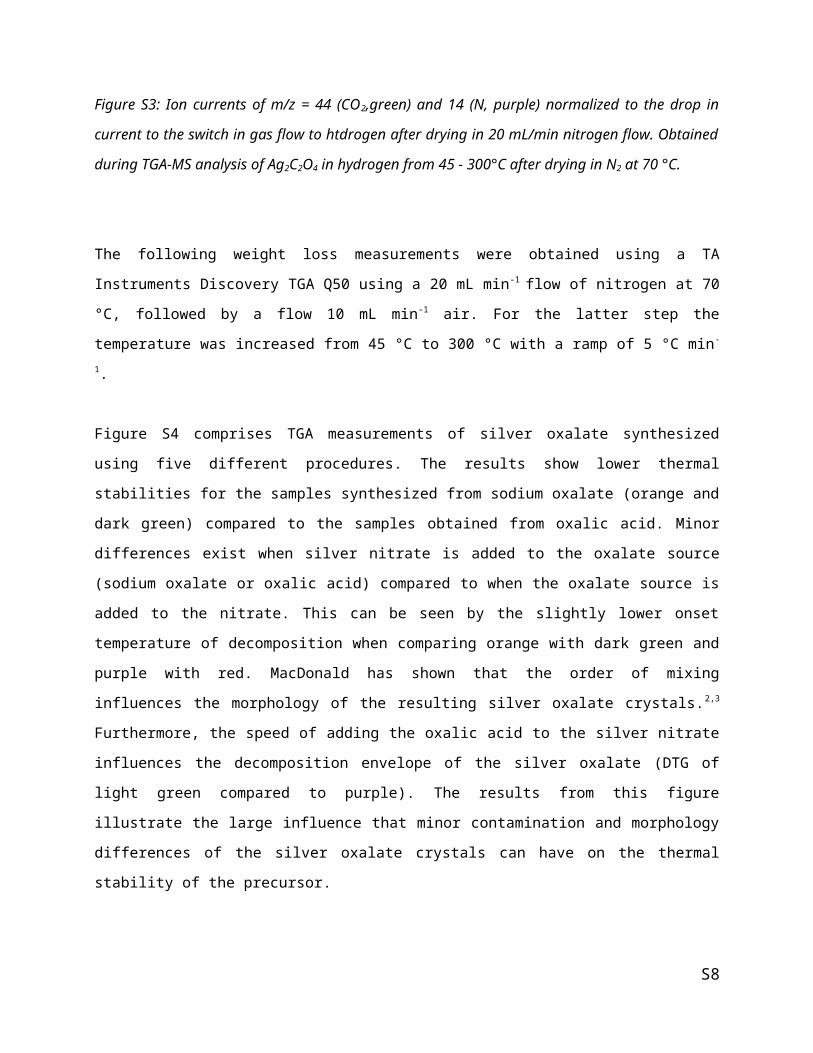
Figure S3 shows the MS data corresponding to the TGA analysis of Ag2C2O4 in hydrogen shown in figure
4. The grey box indicates the drying in a nitrogen flow after which the gas is switched to hydrogen, and
the sample is heated. The peaks shown in green and purple correspond to CO2 and N respectively, and are
in good agreement with the weight loss visible in the corresponding TGA. The intensity of the purple line
is an indication of the removal of ethylene diamine, since this is the only available source of nitrogen
atoms. The ratio of the intensities of the green and purple lines shows that the weight loss observed in
TGA corresponds to the decomposition of silver oxalate and not to the decomposition of ethylene
diamine. The ratio of the intensities of the ion current of m/z = 18 and the ion current of m/z = 44 was
used to exclude the effect of water.
Figure S3: Ion currents of m/z = 44 (CO2,green) and 14 (N, purple) normalized to the drop in current to
the switch in gas flow to htdrogen after drying in 20 mL/min nitrogen flow. Obtained during TGA-MS
analysis of Ag2C2O4 in hydrogen from 45 - 300°C after drying in N2 at 70 °C.
The following weight loss measurements were obtained using a TA Instruments Discovery TGA Q50
using a 20 mL min-1 flow of nitrogen at 70 °C, followed by a flow 10 mL min-1 air. For the latter step the
temperature was increased from 45 °C to 300 °C with a ramp of 5 °C min-1.
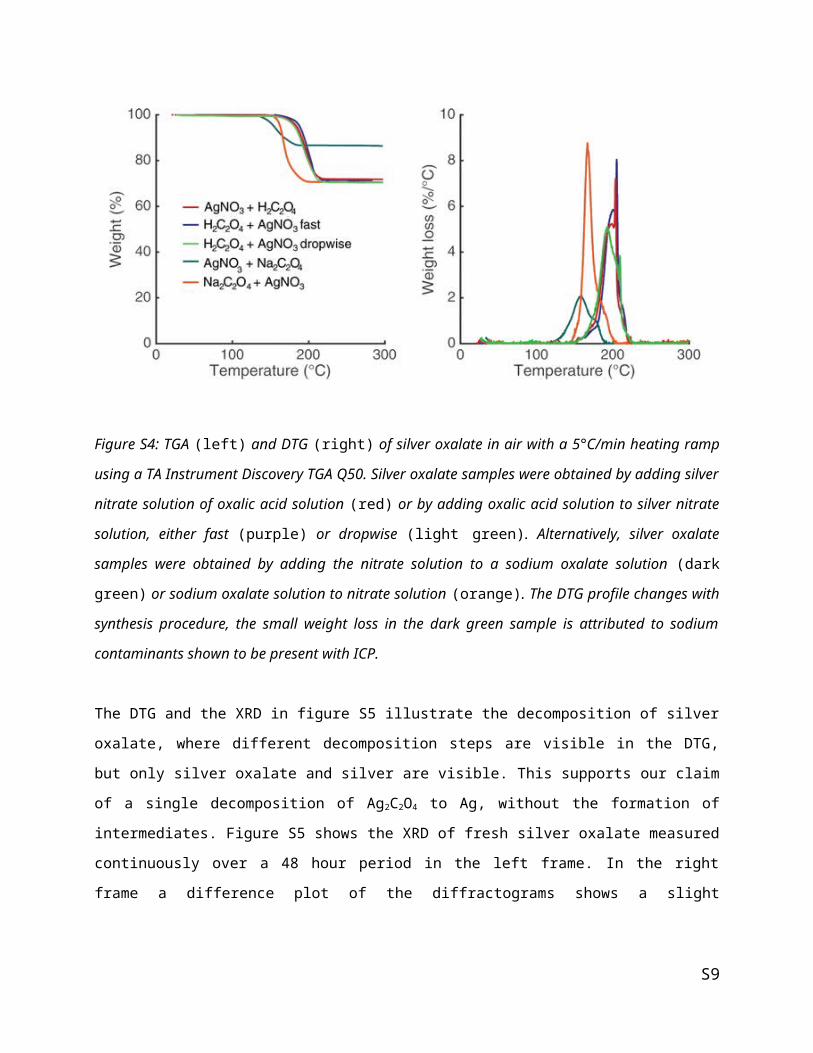
Figure S4 comprises TGA measurements of silver oxalate synthesized using five different procedures. The
results show lower thermal stabilities for the samples synthesized from sodium oxalate (orange and dark
green) compared to the samples obtained from oxalic acid. Minor differences exist when silver nitrate is
S5
added to the oxalate source (sodium oxalate or oxalic acid) compared to when the oxalate source is added
to the nitrate. This can be seen by the slightly lower onset temperature of decomposition when comparing
orange with dark green and purple with red. MacDonald has shown that the order of mixing influences the
morphology of the resulting silver oxalate crystals.2,3 Furthermore, the speed of adding the oxalic acid to
the silver nitrate influences the decomposition envelope of the silver oxalate (DTG of light green
compared to purple). The results from this figure illustrate the large influence that minor contamination
and morphology differences of the silver oxalate crystals can have on the thermal stability of the
precursor.
Figure S4: TGA (left) and DTG (right) of silver oxalate in air with a 5°C/min heating ramp using a TA
Instrument Discovery TGA Q50. Silver oxalate samples were obtained by adding silver nitrate solution of
oxalic acid solution (red) or by adding oxalic acid solution to silver nitrate solution, either fast (purple) or
dropwise (light green). Alternatively, silver oxalate samples were obtained by adding the nitrate solution
to a sodium oxalate solution (dark green) or sodium oxalate solution to nitrate solution (orange). The DTG
profile changes with synthesis procedure, the small weight loss in the dark green sample is attributed to
sodium contaminants shown to be present with ICP.
The DTG and the XRD in figure S5 illustrate the decomposition of silver oxalate, where different
decomposition steps are visible in the DTG, but only silver oxalate and silver are visible. This supports
our claim of a single decomposition of Ag2C2O4 to Ag, without the formation of intermediates. Figure S5
shows the XRD of fresh silver oxalate measured continuously over a 48 hour period in the left frame. In
S6
the right frame a difference plot of the diffractograms shows a slight decomposition of the oxalate to silver
under the measurement conditions.
Figure S5: DTG (left) and XRD (right) of silver oxalate after treatment at different temperatures, showing
primarily silver oxalate diffractions in the fresh sample (small silver diffractions visible due to
decomposition in the instrument) and solely silver diffractions in the sample treated overnight (ON) at
142°C.
Figure S6: XRD diffractograms of silver oxalate taken over 48 hours under atmospheric conditions.
Measurements shaded from black to light grey with time showing silver diffractions increasing with time
at 44.5 and 52° 2θ (left). Difference-XRD of the diffractograms on the left with the XRD diffractogram of
S7
the fresh sample subtracted (right). In this frame the increase of the silver diffraction peaks is clearly
visible, while also showing zigzag patterns corresponding to peak broadening, and shifting to heating of
the sample in the instrument.
S8
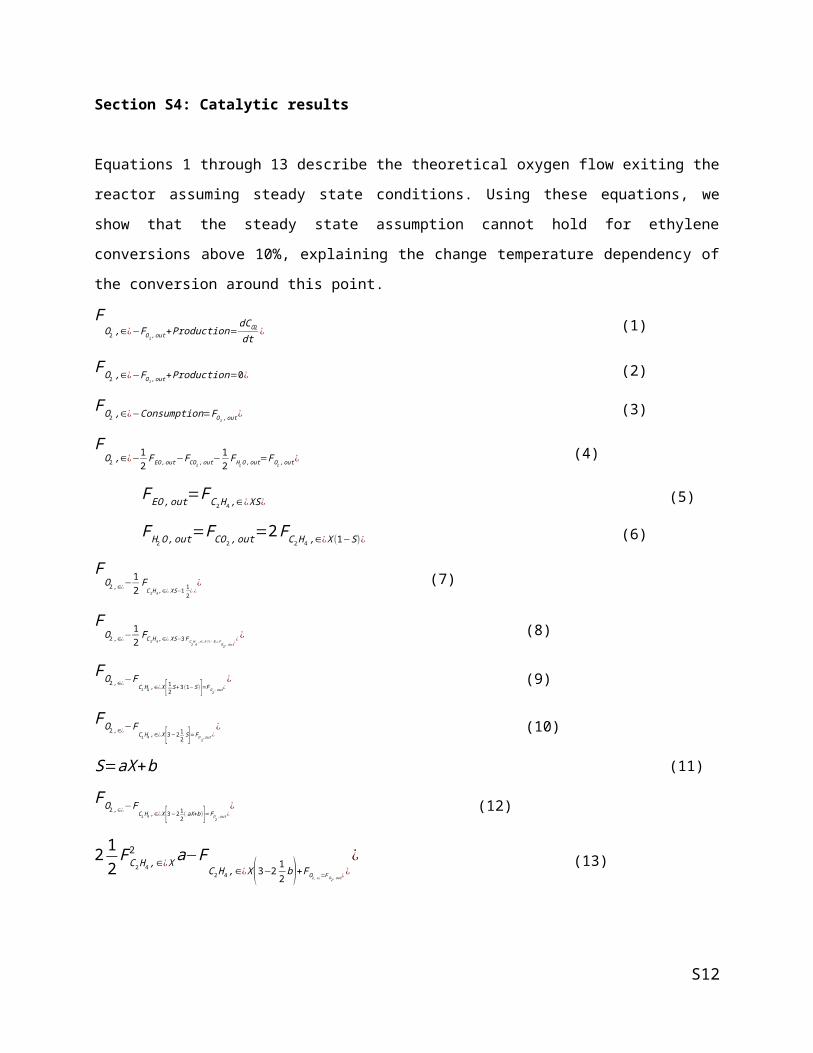
Section S4: Catalytic results
Equations 1 through 13 describe the theoretical oxygen flow exiting the reactor assuming steady state
conditions. Using these equations, we show that the steady state assumption cannot hold for ethylene
conversions above 10%, explaining the change temperature dependency of the conversion around this
point.
FO2 ,∈¿− FO2 ,out+Production=
d CO2
dt ¿ (1)
FO2 ,∈¿−FO2 ,out+Production=0¿ (2)
FO2 ,∈¿−Consumption=FO2 ,out ¿ (3)
FO2 ,∈¿− 1
2F EO, out−FCO2 ,out−
12
FH 2O ,out=FO2 ,out ¿ (4)
FEO, out=FC2 H 4 ,∈¿ XS ¿ (5)
FH 2 O, out=FCO2 , out=2FC2 H 4 ,∈¿ X (1−S)¿ (6)
FO2,∈¿−
12
FC 2H 4 ,∈¿ XS−1 1
2¿¿¿ (7)
FO2,∈¿−
12
FC 2H 4 ,∈¿ XS−3 FC 2H 4 ,∈¿ X( 1−S)=F O2 ,out ¿¿¿ (8)
FO2,∈¿−FC2 H4 ,∈¿X [12 S+3(1−S)]=FO2, out¿
¿ (9)
FO2,∈¿−FC2 H4 ,∈¿X [3−2 1
2S]=FO2 , out¿
¿ (10)
S=aX+b (11)
FO2,∈¿−FC2 H4 ,∈¿X [3−2 1
2( aX+b )]=FO 2 ,out¿
¿ (12)
2 12
FC2 H 4 ,∈¿ X2 a−F
C2 H 4 ,∈¿ X (3−2 12 b )+FO2 ,∈¿=FO2,out ¿¿
¿ (13)
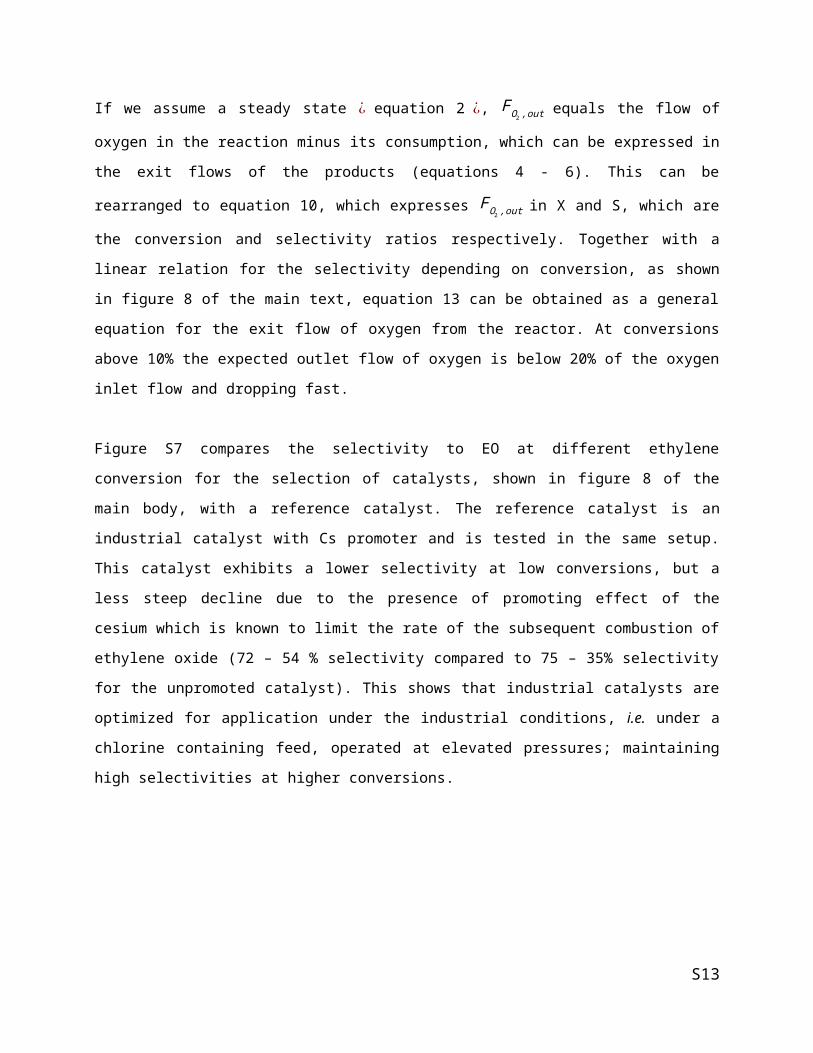
If we assume a steady state ¿ equation 2 ¿, FO2 ,out equals the flow of oxygen in the reaction minus its
consumption, which can be expressed in the exit flows of the products (equations 4 - 6). This can be
rearranged to equation 10, which expresses FO2 ,out in X and S, which are the conversion and selectivity
ratios respectively. Together with a linear relation for the selectivity depending on conversion, as shown in
figure 8 of the main text, equation 13 can be obtained as a general equation for the exit flow of oxygen
from the reactor. At conversions above 10% the expected outlet flow of oxygen is below 20% of the
oxygen inlet flow and dropping fast.
S9
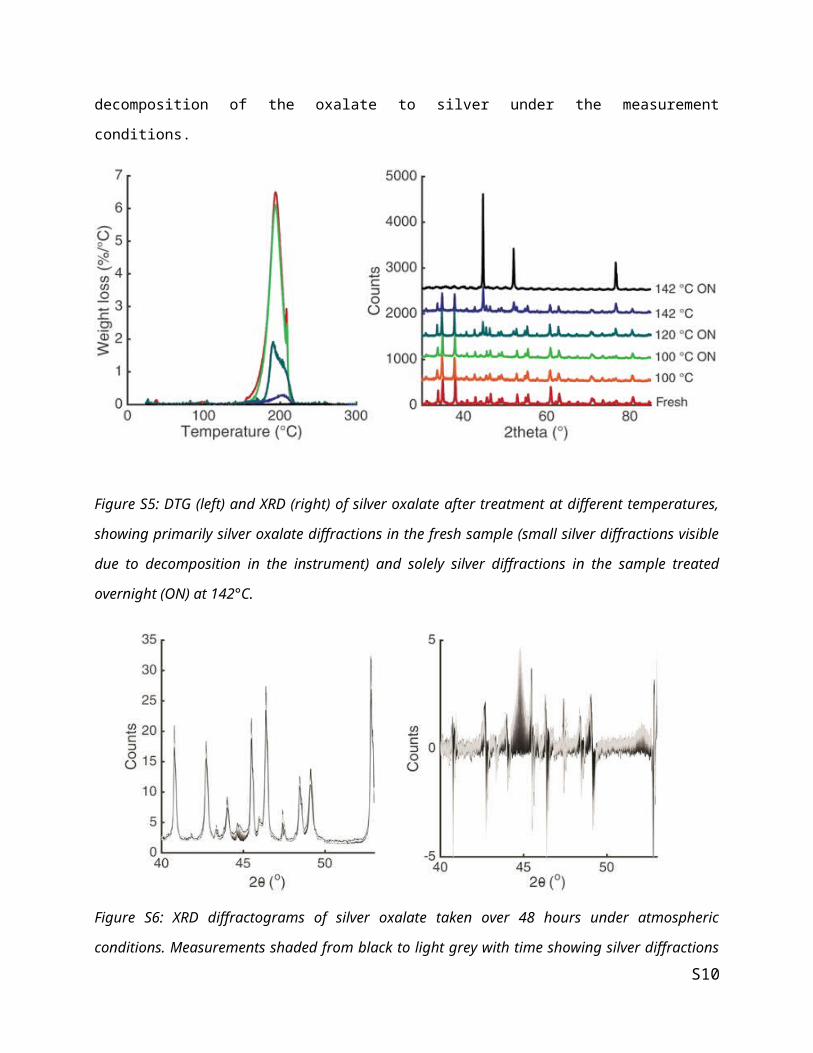
Figure S7 compares the selectivity to EO at different ethylene conversion for the selection of catalysts,
shown in figure 8 of the main body, with a reference catalyst. The reference catalyst is an industrial
catalyst with Cs promoter and is tested in the same setup. This catalyst exhibits a lower selectivity at low
conversions, but a less steep decline due to the presence of promoting effect of the cesium which is known
to limit the rate of the subsequent combustion of ethylene oxide (72 – 54 % selectivity compared to 75 –
35% selectivity for the unpromoted catalyst). This shows that industrial catalysts are optimized for
application under the industrial conditions, i.e. under a chlorine containing feed, operated at elevated
pressures; maintaining high selectivities at higher conversions.
Figure S7: Selectivity versus conversion of silver catalyzed epoxidation obtained from selection of
catalysts, as also shown in figure 8 in main text (left). In black an industrial reference catalyst is shown,
following a slightly different slope than the unpromoted catalyst due to the presence of cesium promotors
in this sample.4
The turnover frequency reported by Campbell et al. over clean Ag single crystal surfaces is 10.35
moleculesEthylene*cmAg-2*s-1 220 °C.5 The TOF reported in our paper is 3.4 molethylene*molAg
-1 s-1 at 190 °C,
which corresponds to about 4.1 moleculesEthylene*cmAg-2*s. At 220 °C the turnover frequency at 235 °C is
therefore comparable with the turn over frequencies reported in literature when extrapolated. Similarly,
the TOF of industrial catalysts can be estimated to be 1.2 s -1, taking a production of 160 kgEO*m-3*h-1.6
This corresponds to a TOF of 1.2 moleculesEthylene*cmAg-2*s. The TOF observed in our work is therefore
lower than the TOF observed over clean single crystal surfaces at higher temperatures, but exceeding
TOF’s observed in industrial applications. In the latter case selectivity promotors are present, which are
known to reduce the activity of the catalyst.7
S10

To estimate the influence of temperature on selectivity at a constant low conversion, we have estimated
the effect of temperature on the r1 and r2 reactions and compared this to the effect of changes in the partial
pressures of the different reactants and products, caused by conversion differences. Expressions for both X
and X*S were obtained from the mass balances for ethylene (Et, (14)) and ethylene oxide (EO, (19))
respectively. Combining the resulting equations (18) and (22) gives an expression for selectivity (23). This
can be expressed in the ratio of the rates of r1 and r2 (24). For this estimate we assume the selectivity is
determined primarily by r1 and r2 (the partial oxidation to ethylene oxide and the full oxidation of
ethylene forming CO2 and H2O respectively) and not r3 (the oxidation of ethylene oxide), allowing the
simplification in equation 24, leading to an estimate for selectivity 1
1+r2
r1
(25).
FEt , 0−FEt+(−r1−r2 )=0 (14)
F CEt ,0−F C Et=r1 +r2 (15)
F [CEt ,0−C Et ,0(1−X )]=r1 +r2 (16)
F CEt ,0 X=r 1+r2 (17)
X=r1+r2
F CEt ,0(18)
FEO , 0−FEO+(r¿¿1−r3)=0¿ (19)
0−F CEO=−(r¿¿1−r3)¿ (20)
−F CEt ,0 XS=−(r¿¿1−r3)¿ (21)
XS=r1−r3
F CEt , 0(22)
XSX
=
r1−r3
F C Et ,0
r1+r2
F C Et ,0
=r1−r3
r1+r2(23)
S=r1−r3
r1 +r2≈
r 1
r1+r2(24)
S11
S=( r1
r1+
r2
r1)−1
= 1
1+r2
r1
(25)
Equation 25 can be used to estimate the effect of temperature on the observed selectivity. To calculate the
temperature dependence of r2
r1, we introduce a parameter C. (equation 26). Lafarga et al. Ind. Eng. Chem.
Res. (2000) 39, 2148-2156 reports the activation energies of these reaction 60.7 and 73.2 kJ/mol
respectively. Since we are focusing on the effect of temperature, we are assuming near constant partial
pressures and reaction orders. Filling these assumptions into equation 28, we get an estimation for
parameter C, which can be used to estimate the temperature dependence of the selectivity of a catalyst.
r2180
r1180=C
r2220
r1220 (26)
r2180
r2220=C
r1180
r1220 (27)
ν2 exp[ −Eact , 2
R (273.15+180) ] pEthylenen pOxygen
m
ν2 exp[ −Eact , 2
R (273.15+220) ] pEthylenen pOxygen
m
=Cν1exp [ −Eact ,1
R(273.15+180) ] pEthylenek pOxygen
l
ν1exp [ −Eact ,1
R(273.15+220) ] pEthylenek pOxygen
l
(28)
ex p [ −70R(273.15+180) ]
exp [ −70R(273.15+220) ]
=Cexp[ −60
R (273.15+180) ]exp[ −60
R (273.15+220) ](29)
C=1.01
If the observed selectivity at 180°C is 55%, r2
r1 would correspond to 0.65 (using equation 25). Using
equation 26 and a value of 1.01 for C, we can estimate r2
r1at 220 °C, which corresponds to a selectivity of
53 %.
S12
The effect of temperature on selectivity is therefore not large enough to explain the differences observed
in the selectivities between figure 7 and 8; the effect of conversion on the selectivity is larger than the
effect of temperature. This is due to the large differences in ethylene oxide partial pressures for different
conversion levels. In this computation r3 is excluded, but as the activation energy of the secondary
reaction is low, including this would not considerably change the calculated result.
(1) Duval Malinsky, M.; Kelly, K. L.; Schatz, G. C.; Van Duyne, R. P. J. Phys. Chem. B 2001, 105
(12), 2343–2350.
(2) Macdonald, J. Y. Nature 1936, 137 (3456), 152–153.
(3) Leiga, A. G. J. Phys. Chem. 1966, 70 (10), 3254–3259.
(4) Nijhuis, T. A. Towards a new propene epoxidation process; 1997.
(5) Campbell, C. T. J. Catal. 1985, 444, 436–444.
(6) Evans, W. E.; Chipman, P. I. United States Patent. US 6717011 B2, 2004.
(7) Rebsdat, S.; Mayer, D. Ullmann’s Encycl. Ind. Chem. 2012, 547–572.
S13