Application of Venn's diagram in the diagnosis of pleural ...
19
RESEARCH ARTICLE Application of Venn’s diagram in the diagnosis of pleural tuberculosis using IFN-γ, IP-10 and adenosine deaminase Ana Paula Santos 1 , Raquel da Silva Corrêa 2 , Marcelo Ribeiro-Alves 3 , Ana Carolina Oliveira Soares da Silva 2 , Thiago Thomaz Mafort 1 , Janaı ´na Leung 1 , Geraldo Moura Batista Pereira 2,4 , Luciana Silva Rodrigues 2☯ *, Roge ´ rio Rufino 1☯ 1 Department of Pulmonary Care, Pedro Ernesto University Hospital (HUPE)—State University of Rio de Janeiro (UERJ), Rio de Janeiro, RJ, Brazil, 2 Laboratory of Immunopathology, Medical Sciences Faculty (FCM)—State University of Rio de Janeiro (UERJ), Rio de Janeiro, RJ, Brazil, 3 Laboratory of Clinical Research on STD/AIDS, National Institute of Infectology Evandro Chagas (INI)–Oswaldo Cruz Foundation (FIOCRUZ), Rio de Janeiro, RJ, Brazil, 4 Laboratory of Cellular Microbiology, Oswaldo Cruz Foundation (FIOCRUZ), Rio de Janeiro, RJ, Brazil ☯ These authors contributed equally to this work. * [email protected] Abstract Background Pleural tuberculosis (PlTB) is the most common extrapulmonary manifestation of this infec- tious disease which still presents high mortality rates worldwide. Conventional diagnostic tests for PlTB register multiple limitations, including the lack of sensitivity of microbiological methods on pleural specimens and the need of invasive procedures such as pleural biopsy performance. In this scenario, the search for biological markers on pleural fluid (PF) has been the target of several studies as a strategy to overcome the limitations of PlTB diagno- sis. This study aims to evaluate the use either isolated or in combination with adenosine deaminase (ADA), interferon-gamma (IFN-γ), interferon-gamma inducible protein of 10-kD (IP-10) levels on PF in order to guide an accurate anti-TB treatment in microbiologically non- confirmed cases. Methods and findings Eighty patients presenting pleural effusion under investigation were enrolled in a cross-sec- tional study conducted at Pedro Ernesto University Hospital, Rio de Janeiro, RJ, Brazil. Peripheral blood (PB) and PF samples collected from all patients were applied to the com- mercial IFN-γ release assay, QuantiFERON-TB Gold In-Tube, and samples were analyzed for IFN-γ and IP-10 by immunoassays. ADA activity was determined on PF by the colorimet- ric method. Based on microbiological and histological criteria, patients were categorized as follow: confirmed PlTB (n = 16), non-confirmed PlTB (n = 17) and non-PlTB (n = 47). The Mycobacterium tuberculosis antigen-specific production of IFN-γ and IP-10 on PB or PF did not show significant differences. However, the basal levels of these biomarkers, as well as the ADA activity on PF, were significantly increased in confirmed PlTB in comparison to PLOS ONE | https://doi.org/10.1371/journal.pone.0202481 August 27, 2018 1 / 19 a1111111111 a1111111111 a1111111111 a1111111111 a1111111111 OPEN ACCESS Citation: Santos AP, Corrêa RdS, Ribeiro-Alves M, Soares da Silva ACO, Mafort TT, Leung J, et al. (2018) Application of Venn’s diagram in the diagnosis of pleural tuberculosis using IFN-γ, IP-10 and adenosine deaminase. PLoS ONE 13(8): e0202481. https://doi.org/10.1371/journal. pone.0202481 Editor: Katalin Andrea Wilkinson, University of Cape Town, SOUTH AFRICA Received: June 8, 2018 Accepted: August 4, 2018 Published: August 27, 2018 Copyright: © 2018 Santos et al. This is an open access article distributed under the terms of the Creative Commons Attribution License, which permits unrestricted use, distribution, and reproduction in any medium, provided the original author and source are credited. Data Availability Statement: All relevant data are within the paper and its Supporting Information files. Funding: This work was supported by the Fundac ¸ão Carlos Chagas de Amparo a ´ pesquisa no Estado do Rio de Janeiro (grant #261101792014). Competing interests: The authors have declared that no competing interests exist.
Transcript of Application of Venn's diagram in the diagnosis of pleural ...
RESEARCH ARTICLE
Application of Venn’s diagram in the diagnosis
of pleural tuberculosis using IFN-γ, IP-10 and
adenosine deaminase
Ana Paula Santos1, Raquel da Silva Corrêa2, Marcelo Ribeiro-Alves3, Ana Carolina
Oliveira Soares da Silva2, Thiago Thomaz Mafort1, Janaına Leung1, Geraldo Moura
Batista Pereira2,4, Luciana Silva Rodrigues2☯*, Rogerio Rufino1☯
1 Department of Pulmonary Care, Pedro Ernesto University Hospital (HUPE)—State University of Rio de
Janeiro (UERJ), Rio de Janeiro, RJ, Brazil, 2 Laboratory of Immunopathology, Medical Sciences Faculty
(FCM)—State University of Rio de Janeiro (UERJ), Rio de Janeiro, RJ, Brazil, 3 Laboratory of Clinical
Research on STD/AIDS, National Institute of Infectology Evandro Chagas (INI)–Oswaldo Cruz Foundation
(FIOCRUZ), Rio de Janeiro, RJ, Brazil, 4 Laboratory of Cellular Microbiology, Oswaldo Cruz Foundation
(FIOCRUZ), Rio de Janeiro, RJ, Brazil
☯ These authors contributed equally to this work.
Abstract
Background
Pleural tuberculosis (PlTB) is the most common extrapulmonary manifestation of this infec-
tious disease which still presents high mortality rates worldwide. Conventional diagnostic
tests for PlTB register multiple limitations, including the lack of sensitivity of microbiological
methods on pleural specimens and the need of invasive procedures such as pleural biopsy
performance. In this scenario, the search for biological markers on pleural fluid (PF) has
been the target of several studies as a strategy to overcome the limitations of PlTB diagno-
sis. This study aims to evaluate the use either isolated or in combination with adenosine
deaminase (ADA), interferon-gamma (IFN-γ), interferon-gamma inducible protein of 10-kD
(IP-10) levels on PF in order to guide an accurate anti-TB treatment in microbiologically non-
confirmed cases.
Methods and findings
Eighty patients presenting pleural effusion under investigation were enrolled in a cross-sec-
tional study conducted at Pedro Ernesto University Hospital, Rio de Janeiro, RJ, Brazil.
Peripheral blood (PB) and PF samples collected from all patients were applied to the com-
mercial IFN-γ release assay, QuantiFERON-TB Gold In-Tube, and samples were analyzed
for IFN-γ and IP-10 by immunoassays. ADA activity was determined on PF by the colorimet-
ric method. Based on microbiological and histological criteria, patients were categorized as
follow: confirmed PlTB (n = 16), non-confirmed PlTB (n = 17) and non-PlTB (n = 47). The
Mycobacterium tuberculosis antigen-specific production of IFN-γ and IP-10 on PB or PF did
not show significant differences. However, the basal levels of these biomarkers, as well as
the ADA activity on PF, were significantly increased in confirmed PlTB in comparison to
PLOS ONE | https://doi.org/10.1371/journal.pone.0202481 August 27, 2018 1 / 19
a1111111111
a1111111111
a1111111111
a1111111111
a1111111111
OPENACCESS
Citation: Santos AP, Corrêa RdS, Ribeiro-Alves M,
Soares da Silva ACO, Mafort TT, Leung J, et al.
(2018) Application of Venn’s diagram in the
diagnosis of pleural tuberculosis using IFN-γ, IP-10
and adenosine deaminase. PLoS ONE 13(8):
e0202481. https://doi.org/10.1371/journal.
pone.0202481
Editor: Katalin Andrea Wilkinson, University of
Cape Town, SOUTH AFRICA
Received: June 8, 2018
Accepted: August 4, 2018
Published: August 27, 2018
Copyright: © 2018 Santos et al. This is an open
access article distributed under the terms of the
Creative Commons Attribution License, which
permits unrestricted use, distribution, and
reproduction in any medium, provided the original
author and source are credited.
Data Availability Statement: All relevant data are
within the paper and its Supporting Information
files.
Funding: This work was supported by the
Fundacão Carlos Chagas de Amparo a pesquisa no
Estado do Rio de Janeiro (grant #261101792014).
Competing interests: The authors have declared
that no competing interests exist.

non-PlTB group. Receiver operating characteristics curves were performed and the best
cut-off points of these three biomarkers were estimated. Their either isolated or combined
performances (sensitivity [Se], specificity [Sp], positive predictive value [PPV], negative pre-
dictive value [NPV] and accuracy [Acc]) were determined and applied to Venn’s diagrams
among the groups. Based on the confirmed PlTB cases, IFN-γ showed the best perfor-
mance of them at a cut-off point of 2.33 IU/mL (Se = 93.8% and Sp = 97.9%) followed by
ADA at a cut-off of 25.80 IU/L (Se = 100% and Sp = 84.8%) and IP-10 (Cut-point = 4,361.90
pg/mL, Se = 75% and Sp = 82.6%). IFN-γ plus ADA (cut-point: 25.80 IU/L) represent the most
accurate biomarker combination (98.4%), showing Se = 93.7%, Sp = 100%, PPV = 100%
and NPV = 97.9%. When this analysis was applied in non-confirmed PlTB, 15/17 (88.2%)
presented at least two positive biomarkers in combination.
Conclusion
IFN-γ, IP-10, and ADA in PlTB effusions are significantly higher than in non-PlTB cases.
IFN-γ is an excellent rule-in and rule-out test compared to IP-10 and ADA. The combination
of IFN-γ and ADA, in a reviewed cut-off point, showed to be particularly useful to clinicians
as their positive results combined prompts immediate treatment for TB while both negative
results suggest further investigation.
Introduction
Tuberculosis (TB) remains a global public health problem ranking above the Acquired Immuno-
deficiency Syndrome (AIDS) as a leading cause of death between infectious diseases [1]. Among
extrapulmonary presentations of the disease, pleural tuberculosis (PlTB) is the most common [2],
summing 42% of these cases [3]. Despite its frequency, PlTB remains a challenge for diagnosis
due to the paucibacillary nature in patients’ biological specimens and the need for invasive proce-
dures, which are not free from complications, are relatively expensive and time demanding [4–7].
Based on TB’s pathophysiology that represents largely an immunological reaction in which
a vast category of cytokines and chemokines are intimately involved, the evaluation of bio-
markers on pleural fluid (PF) configures an alternative for TB diagnosis [8–10]. Until now,
adenosine deaminase (ADA) is a useful and cost-effective PF marker routinely used in high
prevalence settings for diagnosis of PlTB [11]. However, high levels of ADA can also be
observed in other types of infections, malignant pleural effusion, and rheumatic diseases, and
thus is not specific for PlTB [12].
The role of interferon-gamma release assays (IGRA) adapted to PF for PlTB diagnosis is still
under evaluation. Several studies in this line of investigations have been published using the
enzyme-linked immunospot (ELISPOT) assay T-SPOT.TB (T-SPOT.TB; Oxford Immunotec
Limited, United Kingdom) or the enzyme-linked immunosorbent assay (ELISA) QuantiFER-
ON-TB Gold In-Tube (QFT-GIT; Cellestis Limited, Australia), both IGRA tests approved by
World Health Organization to be used only for latent TB diagnosis [13], however showing con-
flicting results [5, 14–18]. Since that there is an extensive literature [8, 9, 19, 20] regarding the eval-
uation of PF biomarkers showing that the TB’s lymphocytic pleural effusion presents an increased
expression of interferon-γ (IFN-γ) and its inducible chemokines, such as interferon-γ inducible
protein of 10-kD (IP-10) [19, 21], we speculate that the application of IGRA could be extremely
promising and show considerable adjuvant value on diagnosis of paucibacillary patients.
Combination of IFN-γ, IP-10 and ADA in the diagnosis of pleural tuberculosis
PLOS ONE | https://doi.org/10.1371/journal.pone.0202481 August 27, 2018 2 / 19
Given the importance of ADA for PlTB diagnosis and the unsolved determination of the bet-
ter cut-off value of this marker associated with the advent of new PlTB biomarkers, we aimed to
evaluate the use, either isolated or in combination, of ADA, IFN-γ, IP-10 as well as the Mtb-spe-
cific immune responses in PF samples based on QFT-GIT system in order to improve the differ-
ential diagnosis of PlTB. Receiver operating characteristics (ROC) curves were generated to
calculate the best cut-off value for each immunological marker on PF. Further, their perfor-
mances were estimated in a cohort of patients presenting pleural effusion under investigation
and results applied to Venn’s diagrams. The data showed here revealed an effort to apply avail-
able diagnostic tools, either alone or in combination, to be used as potential candidates for dif-
ferential diagnosis of PlTB, especially in cases that do not fit into the TB gold standard methods.
Material and methods
Ethics statement
The study protocol was approved by the biomedical research ethics committee of Pedro
Ernesto University Hospital, Rio de Janeiro State University (HUPE/UERJ; #1.100.772). All
individuals signed a free written informed consent. All samples were fully anonymized before
processing to protect the study participants’ identities.
Study design, samples and data collection
A cross-sectional study was conducted at HUPE/UERJ a tertiary care center at RJ, Brazil.
Patients aged� 18 years with pleural effusion under investigation and with an indication of
thoracentesis were consecutively enrolled from June 2015 to February 2017. Patients who
refused being submitted to the procedure and pregnant women were excluded.
Peripheral blood (PB) was collected and drawn directly into each vacutainer tube provided
as part of the QFT-GIT system (QFT-GIT; Cellestis Limited, Australia). Ultrasound-guided
thoracentesis was performed by a trained pulmonologist who collected PF which was directly
drawn into each tube of QFT-GIT and also sent for routine diagnostic tests, including chemis-
try panel, total and differential cell count, ADA measurement [22], cytopathology, Xpert
MTB/RIF1 assay and microbiological analysis [bacteria, fungi and mycobacteria (Lowenstein
Jensen solid media)]. Pleural biopsy with Cope’s needle was performed when there were no
contraindications and pleural tissue was evaluated for histopathology analysis, acid-fast bacilli
(AFB) staining and mycobacterial culture.
We reviewed the medical records of these patients to evaluate physical, clinical and demo-
graphic information, medical history and laboratory data. Signs and symptoms included sub-
jective reported presence and duration such as a cough, fever, chest pain, dyspnea, night
sweats and weight loss. HIV test was offered to all patients included in the study and their
results, as well as the presence of other comorbidities, were also recorded. Radiological finds
were based on the chest X-ray and were classified either as: unilateral pleural effusion (UPE)
or bilateral pleural effusion (BPE). Data on the respiratory specimen (spontaneous sputum,
induced sputum or bronchoalveolar lavage) were collected when available. http://dx.doi.org/
10.17504/protocols.io.saceaaw
Study population and diagnostic criteria
Confirmed PlTB cases were defined based on a positive result of the following microbiological
and/or histopathological tests on PF or pleural tissue: AFB smear microscopy, mycobacterial
culture or Xpert MTB/RIF1 and/or evidence of granuloma with or without caseous necrosis.
Combination of IFN-γ, IP-10 and ADA in the diagnosis of pleural tuberculosis
PLOS ONE | https://doi.org/10.1371/journal.pone.0202481 August 27, 2018 3 / 19

Non-confirmed PlTB cases were consisted of: i) possible PlTB–clinical manifestations sug-
gesting TB (fever, chest pain, dyspnea, cough night sweats, hyporexia and/or weight loss), and
a lymphocytic and exudative pleural effusion associated with ADA levels above 40 IU/L, fol-
lowed by a full recovery after at least six months of anti-TB treatment; or ii) empiric PlTB–
cases with clinical manifestations suggesting TB (as previously described above) which do not
fill the criteria of confirmed or possible PlTB and that fully recover after at least six months of
anti-TB treatment.
Non-PlTB cases were defined as those with pleural or pleuropulmonary diseases, excluding
active TB based on clinical, laboratory, radiological, microbiological and/or pathological fea-
tures. Malignant pleural effusions were diagnosed by a positive PF cytologic result or malig-
nant cells identified in the pleural tissue. Even when both of these tests results were negative,
malignant effusion was diagnosed when a primary cancer was known to have disseminated
and no other cause of pleural effusion was identified. Patients who did not fit the criteria used
for PlTB diagnosis defined as above and with unknown cause of pleural effusion were classified
as “undefined” (UND) pleural effusion and considered as non-PlTB.
QuantiFERON-TB Gold In-Tube assay
QFT-GIT was performed in all patients with pleural effusion under investigation. Briefly, one
milliliter of both PB and PF were directly drawn in each of the three tubes of QFT-GIT pre-
coated with saline (Nil; negative control) or Mtb-specific antigens [early secretory antigenic
target -6 (ESAT-6), culture filtrate protein-10 (CFP-10) and TB 7.7] or mitogen (Mit; positive
control) and incubated for 24 h at 37˚C. After centrifugation, the supernatant was collected
and stored frozen at– 20˚C until the IFN-γ determination by an ELISA using QFT-GIT kit
according to the manufacturer’s instruction (Cellestis Limited, Australia). IFN-γ-Mtb-specific
levels were calculated by subtracting the obtained value with the Nil/control tube. QFT-GIT
applied on PB was defined with a positive result when IFN-γ levels in response to Mtb-specific
antigens� 0.35 IU/mL and IFN-γ levels in response to mitogen (mitogen minus Nil/control)
� 0.5 IU/mL. Indeterminate result was defined as IFN-γ of Nil/control > 8.0 IU/mL or posi-
tive control value < 0.5 IU/mL. Results were calculated according to the manufacturer´s soft-
ware. http://dx.doi.org/10.17504/protocols.io.saseaee
IP-10 quantification
IP-10 supernatant levels were measured using the Duoset ELISA kit according to the manufac-
turer’s instructions (R&D Systems Inc, MN, USA). Results were expressed in pg/mL after pro-
cessing the data with software SoftMax Pro. The lower level of this assay was 31.3 pg/mL while
its upper limit was 20,000 pg/mL and readings greater than this were set at 20,000 pg/mL for
the purpose of analysis.
Statistical analysis
In the evaluation of the sociodemographic, clinical and laboratory features among the different
groups of individuals, for continuous numerical variables, Kruskal-Wallis ANOVA by Ranks
tests was used for assessing the hypothesis that the different samples in the comparison were
drawn from the same distribution or from distributions with the same median. Likewise, for
categorical nominal variables, Fisher’s exact tests were used in the evaluation of frequencies
among the three different groups (confirmed PlTB, non-confirmed PlTB, and non-PlTB) for
assessing the hypothesis of independence between the groups of individuals and these
variables.
Combination of IFN-γ, IP-10 and ADA in the diagnosis of pleural tuberculosis
PLOS ONE | https://doi.org/10.1371/journal.pone.0202481 August 27, 2018 4 / 19
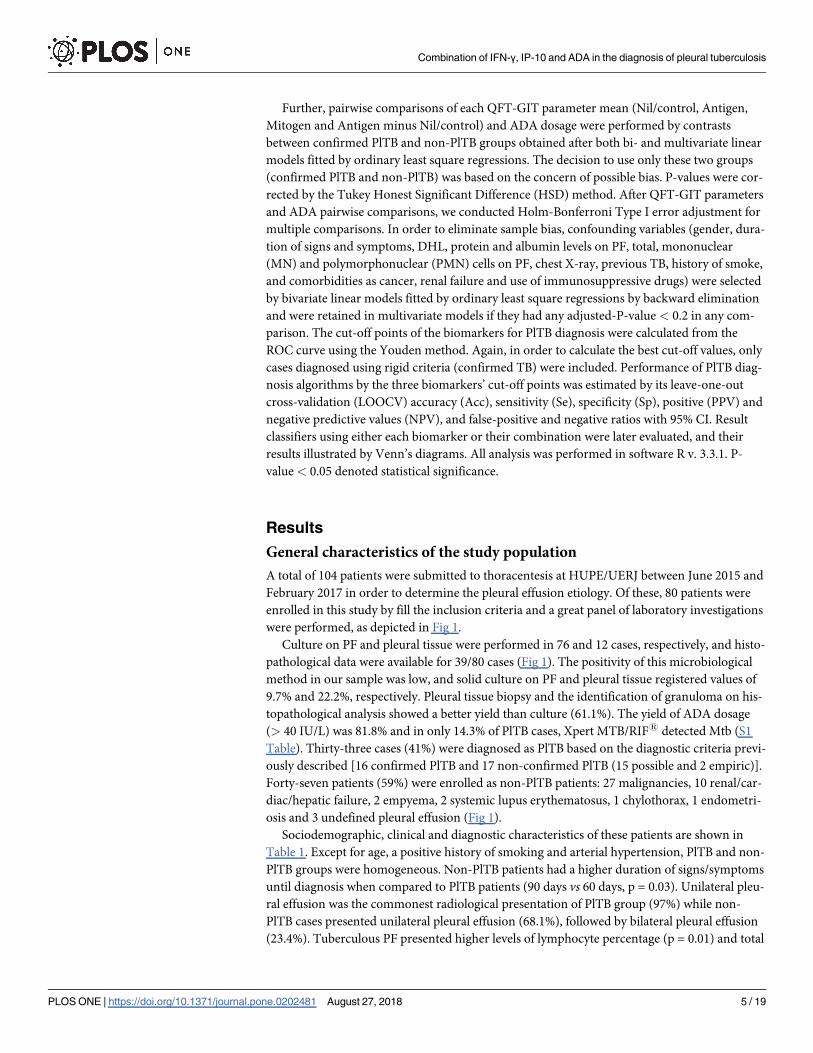
Further, pairwise comparisons of each QFT-GIT parameter mean (Nil/control, Antigen,
Mitogen and Antigen minus Nil/control) and ADA dosage were performed by contrasts
between confirmed PlTB and non-PlTB groups obtained after both bi- and multivariate linear
models fitted by ordinary least square regressions. The decision to use only these two groups
(confirmed PlTB and non-PlTB) was based on the concern of possible bias. P-values were cor-
rected by the Tukey Honest Significant Difference (HSD) method. After QFT-GIT parameters
and ADA pairwise comparisons, we conducted Holm-Bonferroni Type I error adjustment for
multiple comparisons. In order to eliminate sample bias, confounding variables (gender, dura-
tion of signs and symptoms, DHL, protein and albumin levels on PF, total, mononuclear
(MN) and polymorphonuclear (PMN) cells on PF, chest X-ray, previous TB, history of smoke,
and comorbidities as cancer, renal failure and use of immunosuppressive drugs) were selected
by bivariate linear models fitted by ordinary least square regressions by backward elimination
and were retained in multivariate models if they had any adjusted-P-value < 0.2 in any com-
parison. The cut-off points of the biomarkers for PlTB diagnosis were calculated from the
ROC curve using the Youden method. Again, in order to calculate the best cut-off values, only
cases diagnosed using rigid criteria (confirmed TB) were included. Performance of PlTB diag-
nosis algorithms by the three biomarkers’ cut-off points was estimated by its leave-one-out
cross-validation (LOOCV) accuracy (Acc), sensitivity (Se), specificity (Sp), positive (PPV) and
negative predictive values (NPV), and false-positive and negative ratios with 95% CI. Result
classifiers using either each biomarker or their combination were later evaluated, and their
results illustrated by Venn’s diagrams. All analysis was performed in software R v. 3.3.1. P-
value < 0.05 denoted statistical significance.
Results
General characteristics of the study population
A total of 104 patients were submitted to thoracentesis at HUPE/UERJ between June 2015 and
February 2017 in order to determine the pleural effusion etiology. Of these, 80 patients were
enrolled in this study by fill the inclusion criteria and a great panel of laboratory investigations
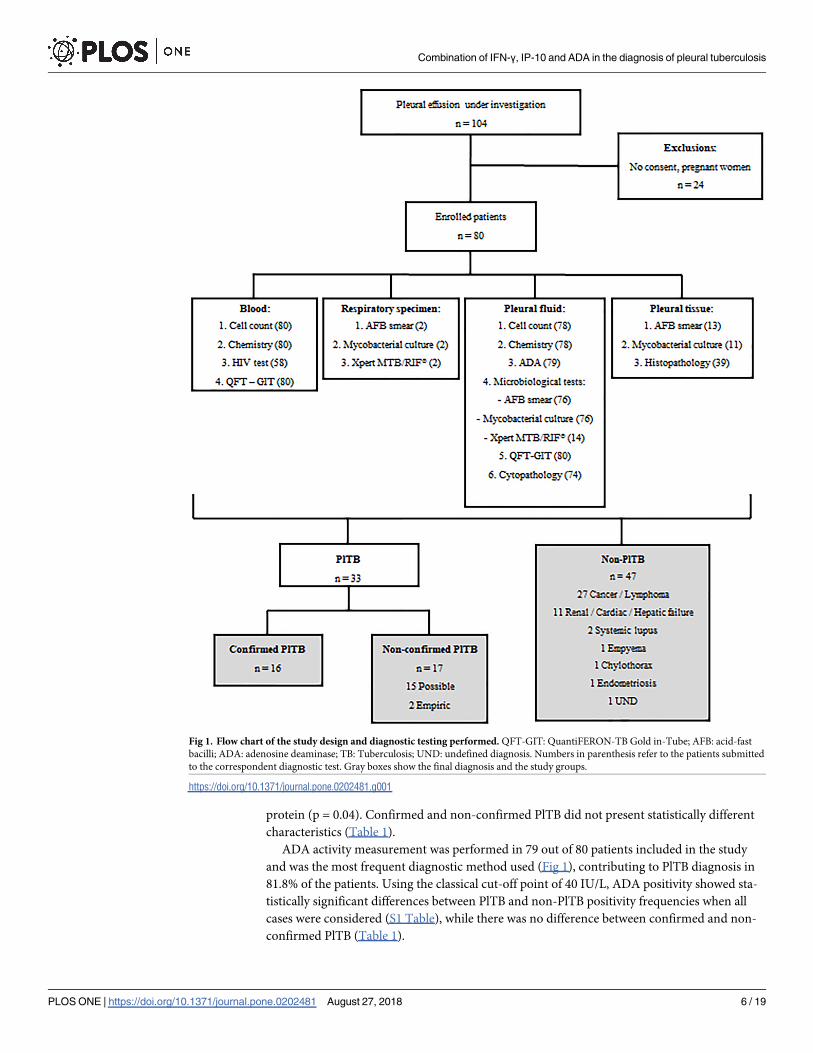
were performed, as depicted in Fig 1.
Culture on PF and pleural tissue were performed in 76 and 12 cases, respectively, and histo-
pathological data were available for 39/80 cases (Fig 1). The positivity of this microbiological
method in our sample was low, and solid culture on PF and pleural tissue registered values of
9.7% and 22.2%, respectively. Pleural tissue biopsy and the identification of granuloma on his-
topathological analysis showed a better yield than culture (61.1%). The yield of ADA dosage
(> 40 IU/L) was 81.8% and in only 14.3% of PlTB cases, Xpert MTB/RIF1 detected Mtb (S1
Table). Thirty-three cases (41%) were diagnosed as PlTB based on the diagnostic criteria previ-
ously described [16 confirmed PlTB and 17 non-confirmed PlTB (15 possible and 2 empiric)].
Forty-seven patients (59%) were enrolled as non-PlTB patients: 27 malignancies, 10 renal/car-
diac/hepatic failure, 2 empyema, 2 systemic lupus erythematosus, 1 chylothorax, 1 endometri-
osis and 3 undefined pleural effusion (Fig 1).
Sociodemographic, clinical and diagnostic characteristics of these patients are shown in
Table 1. Except for age, a positive history of smoking and arterial hypertension, PlTB and non-
PlTB groups were homogeneous. Non-PlTB patients had a higher duration of signs/symptoms
until diagnosis when compared to PlTB patients (90 days vs 60 days, p = 0.03). Unilateral pleu-
ral effusion was the commonest radiological presentation of PlTB group (97%) while non-
PlTB cases presented unilateral pleural effusion (68.1%), followed by bilateral pleural effusion
(23.4%). Tuberculous PF presented higher levels of lymphocyte percentage (p = 0.01) and total
Combination of IFN-γ, IP-10 and ADA in the diagnosis of pleural tuberculosis
PLOS ONE | https://doi.org/10.1371/journal.pone.0202481 August 27, 2018 5 / 19
protein (p = 0.04). Confirmed and non-confirmed PlTB did not present statistically different
characteristics (Table 1).
ADA activity measurement was performed in 79 out of 80 patients included in the study
and was the most frequent diagnostic method used (Fig 1), contributing to PlTB diagnosis in
81.8% of the patients. Using the classical cut-off point of 40 IU/L, ADA positivity showed sta-
tistically significant differences between PlTB and non-PlTB positivity frequencies when all
cases were considered (S1 Table), while there was no difference between confirmed and non-
confirmed PlTB (Table 1).
Fig 1. Flow chart of the study design and diagnostic testing performed. QFT-GIT: QuantiFERON-TB Gold in-Tube; AFB: acid-fast
bacilli; ADA: adenosine deaminase; TB: Tuberculosis; UND: undefined diagnosis. Numbers in parenthesis refer to the patients submitted
to the correspondent diagnostic test. Gray boxes show the final diagnosis and the study groups.
https://doi.org/10.1371/journal.pone.0202481.g001
Combination of IFN-γ, IP-10 and ADA in the diagnosis of pleural tuberculosis
PLOS ONE | https://doi.org/10.1371/journal.pone.0202481 August 27, 2018 6 / 19

Table 1. Baseline characteristics of the study population. Socio-demographic, clinical, laboratory and radiological features according to the diagnosis of PlTB (con-
firmed and non-confirmed cases) and non-PlTB.
Characteristics Non-PlTB C-PlTB NC-PlTB Non-TB vs TB C-PlTB vs NC-PlTB
(N = 47) (N = 16) (N = 17) p-Value p-Value
Sex, (%)
Male 26 (55) 11 (69 12 (71) 0.25 1.0
Female 21 (45) 5 (31) 5 (29)
Age, years
Median (IQR) 62 (49–76) 42.5 (33–49) 45 (26–54) < 0.0001 0.70
Smoke, (%)
Yes 24 (51) 4 (25) 4 (23.5) 0.03 0.57
HIV status, (%)
Positive 3 (4) 1 (6) - 0.35
Negative 29 (62) 12 (75) 15 (88) 0.15
Refuse testing 15 (34) 3 (19) 2 (12)
Previous comorbidities, (%)
Arterial hypertension 17 (36) 1 (6) 4 (23.5) 0.04 0.33
Diabetes mellitus 7 (15) - 1 (6) 0.13 1.0
Renal failure 3 (6) - - 0.26 -
Systemic lupus 1 (2) - - 1 -
Viral hepatitis 3 (6) - - 0.26 -
Inflammatory bowel disease - 1 (6) - 0.41 0.48
Cancer 5 (11) 1 (6) - 0.39 0.48
Corticosteroids use - 1 (6) - 0.24 0.48
Immunosuppressive therapy 3 (6) - - 0.26 -
Previous transplant 3 (6) - - 0.26 -
Previous tuberculosis 2 (4) 1 (6) 2 (12) 0.66 0.51
Signs/symptoms, (%)
Fever 8 (17) 8 (50) 4 (23.5) 0.14 0.28
Cough 22 (47) 6 (37.5) 8 (47) 0.93 0.66
Chest pain 15 (32) 8 (50) 8 (47) 0.22 0.86
Dyspnea 34 (72) 12 (75) 7 (41) 0.47 0.14
Weight loss 13 (28) 6 (37.5) 6 (35) 0.81 0.86
Duration of signs/symptoms
Median days (IQR) 90 (45–195) 60 (27.5–90) 52.5 (30–90) 0.03 0.55
Pleural fluid, Median (IQR)
Total cell count, mm3 1,150 2,100 3,600 0.04 0.41
(500–2600) (635–3882) (707–5000)
Lymphocyte, % 73 90 95 < 0.0001 0.55
(56–90) (61–96) (90–97)
Total protein, g/dL 4.1 5.55 5.65 < 0.0001 0.35
(3.6–5.3) (4.90–6.17) (4.92–6.15)
Albumin, g/dL 2.6 2.80 3.00 0.05 0.50
(1.9–3.0) (2.60–3.10) (2.30–3.10)
DHL, IU/L 185 457 393.5 0.003 0.90
(137–597) (214–876) (259.5–654)
ADA, (%)
� 40 IU/L 2 (4.3) 12 (75) 15 (88.2) < 0.0001 0.40
< 40 IU/L 44 (93.6) 4 (25) 2 (11.8)
(Continued)
Combination of IFN-γ, IP-10 and ADA in the diagnosis of pleural tuberculosis
PLOS ONE | https://doi.org/10.1371/journal.pone.0202481 August 27, 2018 7 / 19
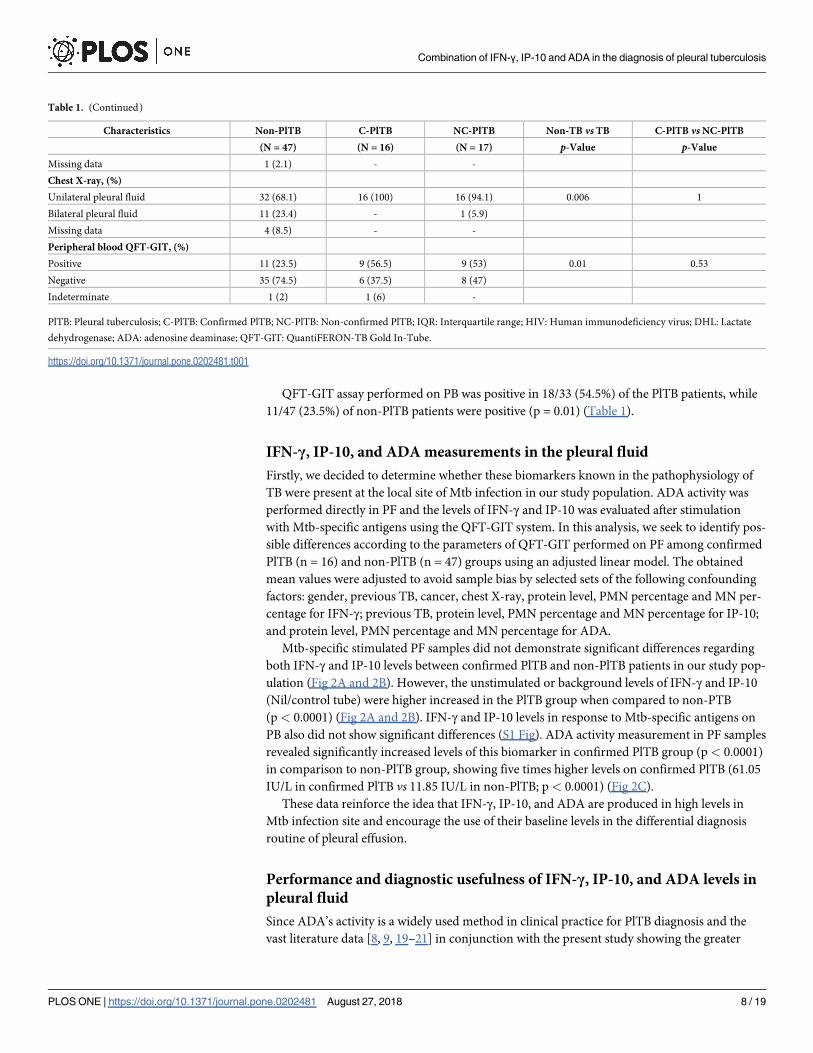
QFT-GIT assay performed on PB was positive in 18/33 (54.5%) of the PlTB patients, while
11/47 (23.5%) of non-PlTB patients were positive (p = 0.01) (Table 1).
IFN-γ, IP-10, and ADA measurements in the pleural fluid
Firstly, we decided to determine whether these biomarkers known in the pathophysiology of
TB were present at the local site of Mtb infection in our study population. ADA activity was
performed directly in PF and the levels of IFN-γ and IP-10 was evaluated after stimulation
with Mtb-specific antigens using the QFT-GIT system. In this analysis, we seek to identify pos-
sible differences according to the parameters of QFT-GIT performed on PF among confirmed
PlTB (n = 16) and non-PlTB (n = 47) groups using an adjusted linear model. The obtained
mean values were adjusted to avoid sample bias by selected sets of the following confounding
factors: gender, previous TB, cancer, chest X-ray, protein level, PMN percentage and MN per-
centage for IFN-γ; previous TB, protein level, PMN percentage and MN percentage for IP-10;
and protein level, PMN percentage and MN percentage for ADA.
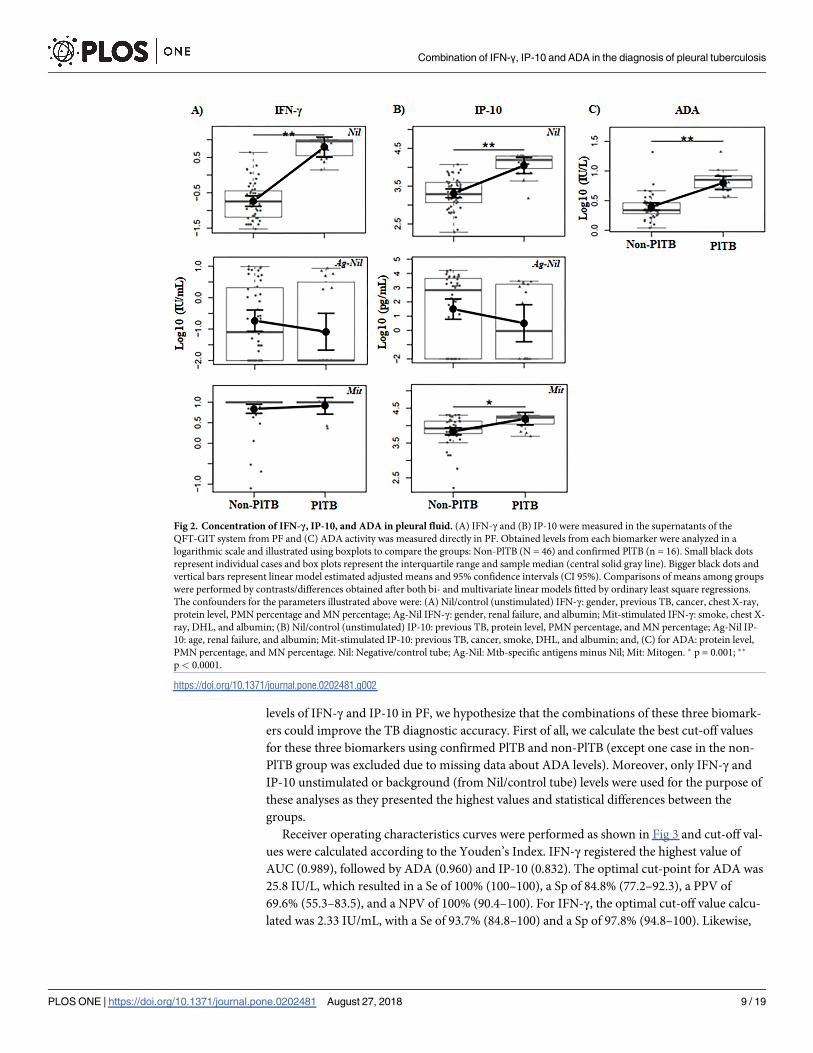
Mtb-specific stimulated PF samples did not demonstrate significant differences regarding
both IFN-γ and IP-10 levels between confirmed PlTB and non-PlTB patients in our study pop-
ulation (Fig 2A and 2B). However, the unstimulated or background levels of IFN-γ and IP-10
(Nil/control tube) were higher increased in the PlTB group when compared to non-PTB
(p< 0.0001) (Fig 2A and 2B). IFN-γ and IP-10 levels in response to Mtb-specific antigens on
PB also did not show significant differences (S1 Fig). ADA activity measurement in PF samples
revealed significantly increased levels of this biomarker in confirmed PlTB group (p< 0.0001)
in comparison to non-PlTB group, showing five times higher levels on confirmed PlTB (61.05
IU/L in confirmed PlTB vs 11.85 IU/L in non-PlTB; p< 0.0001) (Fig 2C).
These data reinforce the idea that IFN-γ, IP-10, and ADA are produced in high levels in
Mtb infection site and encourage the use of their baseline levels in the differential diagnosis
routine of pleural effusion.
Performance and diagnostic usefulness of IFN-γ, IP-10, and ADA levels in
pleural fluid
Since ADA’s activity is a widely used method in clinical practice for PlTB diagnosis and the
vast literature data [8, 9, 19–21] in conjunction with the present study showing the greater
Table 1. (Continued)
Characteristics Non-PlTB C-PlTB NC-PlTB Non-TB vs TB C-PlTB vs NC-PlTB
(N = 47) (N = 16) (N = 17) p-Value p-Value
Missing data 1 (2.1) - -
Chest X-ray, (%)
Unilateral pleural fluid 32 (68.1) 16 (100) 16 (94.1) 0.006 1
Bilateral pleural fluid 11 (23.4) - 1 (5.9)
Missing data 4 (8.5) - -
Peripheral blood QFT-GIT, (%)
Positive 11 (23.5) 9 (56.5) 9 (53) 0.01 0.53
Negative 35 (74.5) 6 (37.5) 8 (47)
Indeterminate 1 (2) 1 (6) -
PlTB: Pleural tuberculosis; C-PlTB: Confirmed PlTB; NC-PlTB: Non-confirmed PlTB; IQR: Interquartile range; HIV: Human immunodeficiency virus; DHL: Lactate
dehydrogenase; ADA: adenosine deaminase; QFT-GIT: QuantiFERON-TB Gold In-Tube.
https://doi.org/10.1371/journal.pone.0202481.t001
Combination of IFN-γ, IP-10 and ADA in the diagnosis of pleural tuberculosis
PLOS ONE | https://doi.org/10.1371/journal.pone.0202481 August 27, 2018 8 / 19
levels of IFN-γ and IP-10 in PF, we hypothesize that the combinations of these three biomark-
ers could improve the TB diagnostic accuracy. First of all, we calculate the best cut-off values
for these three biomarkers using confirmed PlTB and non-PlTB (except one case in the non-
PlTB group was excluded due to missing data about ADA levels). Moreover, only IFN-γ and
IP-10 unstimulated or background (from Nil/control tube) levels were used for the purpose of
these analyses as they presented the highest values and statistical differences between the
groups.
Receiver operating characteristics curves were performed as shown in Fig 3 and cut-off val-
ues were calculated according to the Youden’s Index. IFN-γ registered the highest value of
AUC (0.989), followed by ADA (0.960) and IP-10 (0.832). The optimal cut-point for ADA was
25.8 IU/L, which resulted in a Se of 100% (100–100), a Sp of 84.8% (77.2–92.3), a PPV of
69.6% (55.3–83.5), and a NPV of 100% (90.4–100). For IFN-γ, the optimal cut-off value calcu-
lated was 2.33 IU/mL, with a Se of 93.7% (84.8–100) and a Sp of 97.8% (94.8–100). Likewise,
Fig 2. Concentration of IFN-γ, IP-10, and ADA in pleural fluid. (A) IFN-γ and (B) IP-10 were measured in the supernatants of the
QFT-GIT system from PF and (C) ADA activity was measured directly in PF. Obtained levels from each biomarker were analyzed in a
logarithmic scale and illustrated using boxplots to compare the groups: Non-PlTB (N = 46) and confirmed PlTB (n = 16). Small black dots
represent individual cases and box plots represent the interquartile range and sample median (central solid gray line). Bigger black dots and
vertical bars represent linear model estimated adjusted means and 95% confidence intervals (CI 95%). Comparisons of means among groups
were performed by contrasts/differences obtained after both bi- and multivariate linear models fitted by ordinary least square regressions.
The confounders for the parameters illustrated above were: (A) Nil/control (unstimulated) IFN-γ: gender, previous TB, cancer, chest X-ray,
protein level, PMN percentage and MN percentage; Ag-Nil IFN-γ: gender, renal failure, and albumin; Mit-stimulated IFN-γ: smoke, chest X-
ray, DHL, and albumin; (B) Nil/control (unstimulated) IP-10: previous TB, protein level, PMN percentage, and MN percentage; Ag-Nil IP-
10: age, renal failure, and albumin; Mit-stimulated IP-10: previous TB, cancer, smoke, DHL, and albumin; and, (C) for ADA: protein level,
PMN percentage, and MN percentage. Nil: Negative/control tube; Ag-Nil: Mtb-specific antigens minus Nil; Mit: Mitogen. � p = 0.001; ��
p< 0.0001.
https://doi.org/10.1371/journal.pone.0202481.g002
Combination of IFN-γ, IP-10 and ADA in the diagnosis of pleural tuberculosis
PLOS ONE | https://doi.org/10.1371/journal.pone.0202481 August 27, 2018 9 / 19
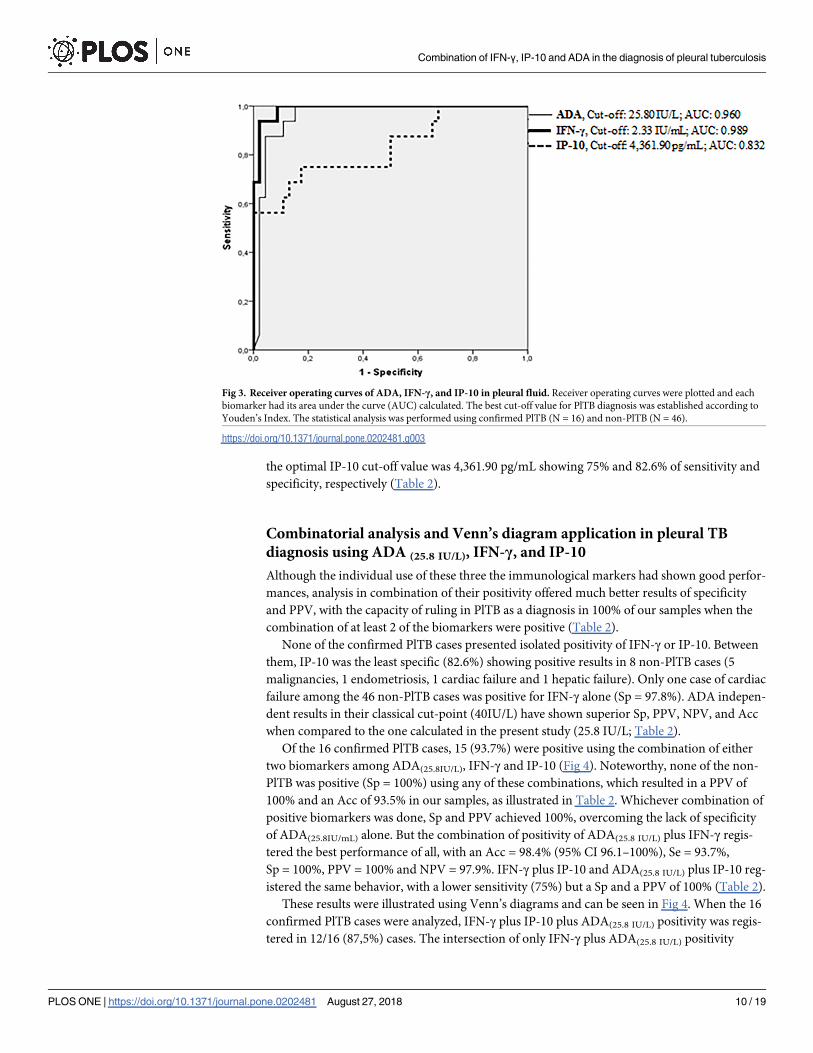
the optimal IP-10 cut-off value was 4,361.90 pg/mL showing 75% and 82.6% of sensitivity and
specificity, respectively (Table 2).
Combinatorial analysis and Venn’s diagram application in pleural TB
diagnosis using ADA (25.8 IU/L), IFN-γ, and IP-10
Although the individual use of these three the immunological markers had shown good perfor-
mances, analysis in combination of their positivity offered much better results of specificity
and PPV, with the capacity of ruling in PlTB as a diagnosis in 100% of our samples when the
combination of at least 2 of the biomarkers were positive (Table 2).
None of the confirmed PlTB cases presented isolated positivity of IFN-γ or IP-10. Between
them, IP-10 was the least specific (82.6%) showing positive results in 8 non-PlTB cases (5
malignancies, 1 endometriosis, 1 cardiac failure and 1 hepatic failure). Only one case of cardiac
failure among the 46 non-PlTB cases was positive for IFN-γ alone (Sp = 97.8%). ADA indepen-
dent results in their classical cut-point (40IU/L) have shown superior Sp, PPV, NPV, and Acc
when compared to the one calculated in the present study (25.8 IU/L; Table 2).
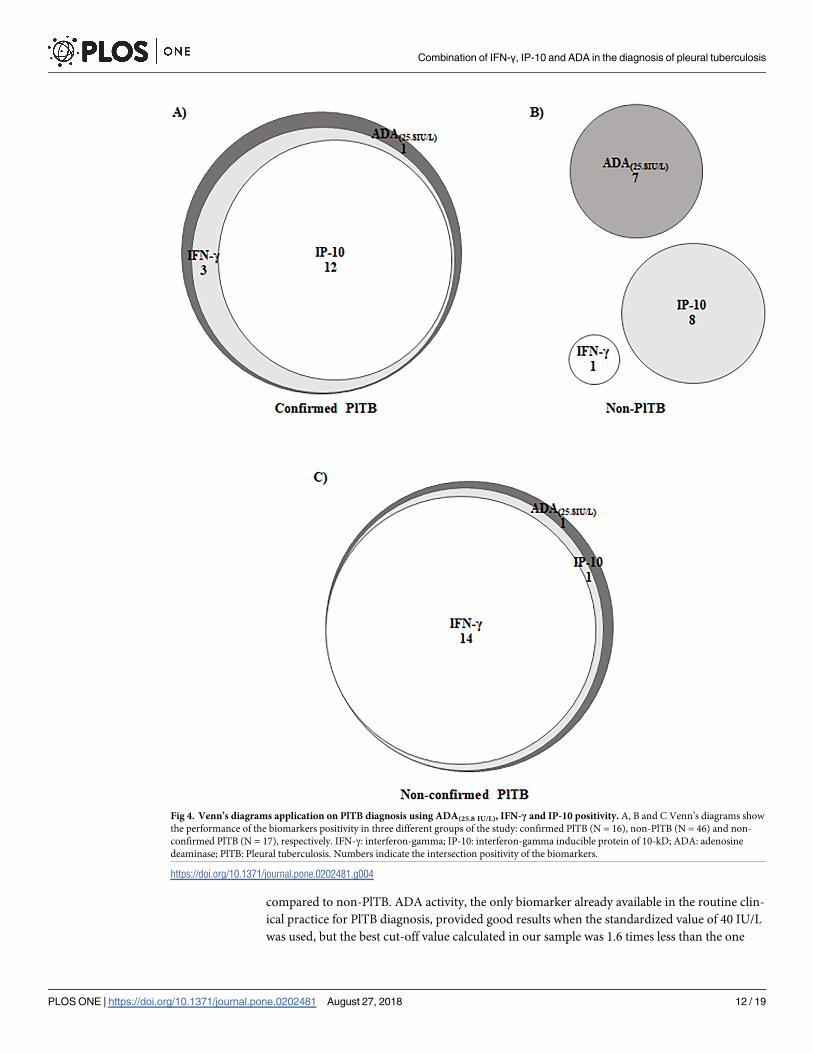
Of the 16 confirmed PlTB cases, 15 (93.7%) were positive using the combination of either
two biomarkers among ADA(25.8IU/L), IFN-γ and IP-10 (Fig 4). Noteworthy, none of the non-
PlTB was positive (Sp = 100%) using any of these combinations, which resulted in a PPV of
100% and an Acc of 93.5% in our samples, as illustrated in Table 2. Whichever combination of
positive biomarkers was done, Sp and PPV achieved 100%, overcoming the lack of specificity
of ADA(25.8IU/mL) alone. But the combination of positivity of ADA(25.8 IU/L) plus IFN-γ regis-
tered the best performance of all, with an Acc = 98.4% (95% CI 96.1–100%), Se = 93.7%,
Sp = 100%, PPV = 100% and NPV = 97.9%. IFN-γ plus IP-10 and ADA(25.8 IU/L) plus IP-10 reg-
istered the same behavior, with a lower sensitivity (75%) but a Sp and a PPV of 100% (Table 2).
These results were illustrated using Venn’s diagrams and can be seen in Fig 4. When the 16
confirmed PlTB cases were analyzed, IFN-γ plus IP-10 plus ADA(25.8 IU/L) positivity was regis-
tered in 12/16 (87,5%) cases. The intersection of only IFN-γ plus ADA(25.8 IU/L) positivity
Fig 3. Receiver operating curves of ADA, IFN-γ, and IP-10 in pleural fluid. Receiver operating curves were plotted and each
biomarker had its area under the curve (AUC) calculated. The best cut-off value for PlTB diagnosis was established according to
Youden’s Index. The statistical analysis was performed using confirmed PlTB (N = 16) and non-PlTB (N = 46).
https://doi.org/10.1371/journal.pone.0202481.g003
Combination of IFN-γ, IP-10 and ADA in the diagnosis of pleural tuberculosis
PLOS ONE | https://doi.org/10.1371/journal.pone.0202481 August 27, 2018 10 / 19
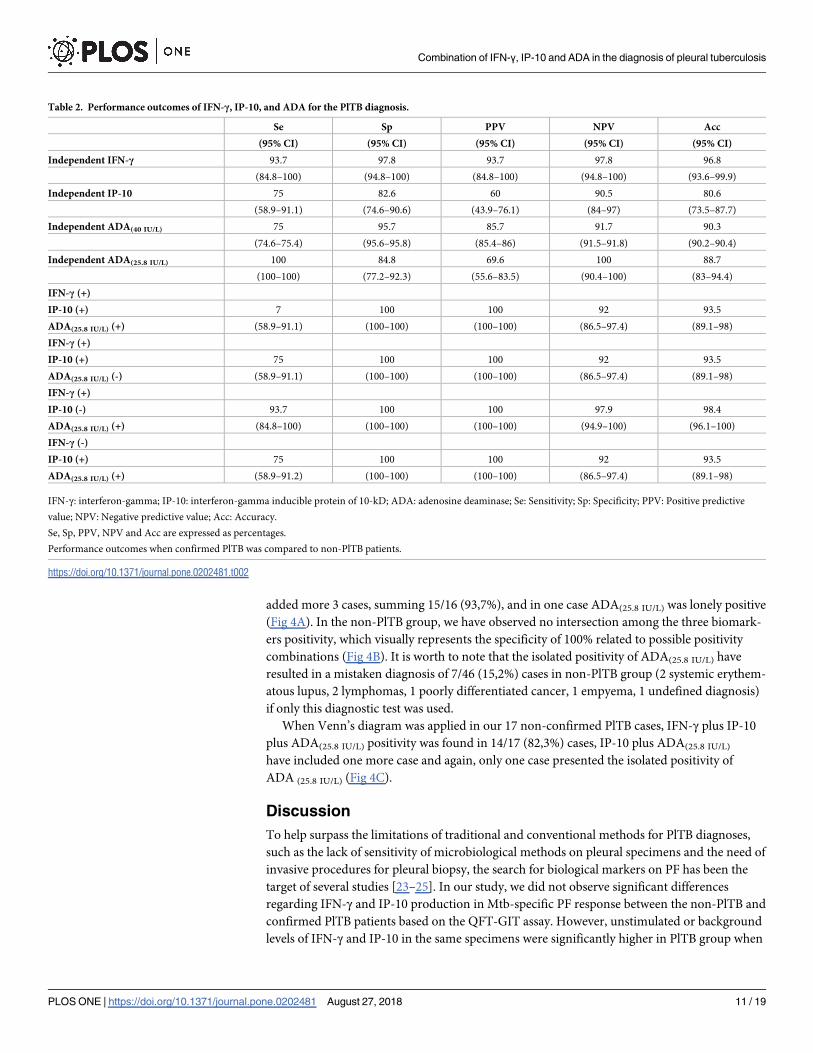
added more 3 cases, summing 15/16 (93,7%), and in one case ADA(25.8 IU/L) was lonely positive
(Fig 4A). In the non-PlTB group, we have observed no intersection among the three biomark-
ers positivity, which visually represents the specificity of 100% related to possible positivity
combinations (Fig 4B). It is worth to note that the isolated positivity of ADA(25.8 IU/L) have
resulted in a mistaken diagnosis of 7/46 (15,2%) cases in non-PlTB group (2 systemic erythem-
atous lupus, 2 lymphomas, 1 poorly differentiated cancer, 1 empyema, 1 undefined diagnosis)
if only this diagnostic test was used.
When Venn’s diagram was applied in our 17 non-confirmed PlTB cases, IFN-γ plus IP-10
plus ADA(25.8 IU/L) positivity was found in 14/17 (82,3%) cases, IP-10 plus ADA(25.8 IU/L)
have included one more case and again, only one case presented the isolated positivity of
ADA (25.8 IU/L) (Fig 4C).
Discussion
To help surpass the limitations of traditional and conventional methods for PlTB diagnoses,
such as the lack of sensitivity of microbiological methods on pleural specimens and the need of
invasive procedures for pleural biopsy, the search for biological markers on PF has been the
target of several studies [23–25]. In our study, we did not observe significant differences
regarding IFN-γ and IP-10 production in Mtb-specific PF response between the non-PlTB and
confirmed PlTB patients based on the QFT-GIT assay. However, unstimulated or background
levels of IFN-γ and IP-10 in the same specimens were significantly higher in PlTB group when
Table 2. Performance outcomes of IFN-γ, IP-10, and ADA for the PlTB diagnosis.
Se Sp PPV NPV Acc
(95% CI) (95% CI) (95% CI) (95% CI) (95% CI)
Independent IFN-γ 93.7 97.8 93.7 97.8 96.8
(84.8–100) (94.8–100) (84.8–100) (94.8–100) (93.6–99.9)
Independent IP-10 75 82.6 60 90.5 80.6
(58.9–91.1) (74.6–90.6) (43.9–76.1) (84–97) (73.5–87.7)
Independent ADA(40 IU/L) 75 95.7 85.7 91.7 90.3
(74.6–75.4) (95.6–95.8) (85.4–86) (91.5–91.8) (90.2–90.4)
Independent ADA(25.8 IU/L) 100 84.8 69.6 100 88.7
(100–100) (77.2–92.3) (55.6–83.5) (90.4–100) (83–94.4)
IFN-γ (+)
IP-10 (+) 7 100 100 92 93.5
ADA(25.8 IU/L) (+) (58.9–91.1) (100–100) (100–100) (86.5–97.4) (89.1–98)
IFN-γ (+)
IP-10 (+) 75 100 100 92 93.5
ADA(25.8 IU/L) (-) (58.9–91.1) (100–100) (100–100) (86.5–97.4) (89.1–98)
IFN-γ (+)
IP-10 (-) 93.7 100 100 97.9 98.4
ADA(25.8 IU/L) (+) (84.8–100) (100–100) (100–100) (94.9–100) (96.1–100)
IFN-γ (-)
IP-10 (+) 75 100 100 92 93.5
ADA(25.8 IU/L) (+) (58.9–91.2) (100–100) (100–100) (86.5–97.4) (89.1–98)
IFN-γ: interferon-gamma; IP-10: interferon-gamma inducible protein of 10-kD; ADA: adenosine deaminase; Se: Sensitivity; Sp: Specificity; PPV: Positive predictive
value; NPV: Negative predictive value; Acc: Accuracy.
Se, Sp, PPV, NPV and Acc are expressed as percentages.
Performance outcomes when confirmed PlTB was compared to non-PlTB patients.
https://doi.org/10.1371/journal.pone.0202481.t002
Combination of IFN-γ, IP-10 and ADA in the diagnosis of pleural tuberculosis
PLOS ONE | https://doi.org/10.1371/journal.pone.0202481 August 27, 2018 11 / 19
compared to non-PlTB. ADA activity, the only biomarker already available in the routine clin-
ical practice for PlTB diagnosis, provided good results when the standardized value of 40 IU/L
was used, but the best cut-off value calculated in our sample was 1.6 times less than the one
Fig 4. Venn’s diagrams application on PlTB diagnosis using ADA(25.8 IU/L), IFN-γ and IP-10 positivity. A, B and C Venn’s diagrams show
the performance of the biomarkers positivity in three different groups of the study: confirmed PlTB (N = 16), non-PlTB (N = 46) and non-
confirmed PlTB (N = 17), respectively. IFN-γ: interferon-gamma; IP-10: interferon-gamma inducible protein of 10-kD; ADA: adenosine
deaminase; PlTB: Pleural tuberculosis. Numbers indicate the intersection positivity of the biomarkers.
https://doi.org/10.1371/journal.pone.0202481.g004
Combination of IFN-γ, IP-10 and ADA in the diagnosis of pleural tuberculosis
PLOS ONE | https://doi.org/10.1371/journal.pone.0202481 August 27, 2018 12 / 19
already used. Based on these results, the combinations of positive results of these three bio-
markers showed to be useful, especially when IFN-γ and ADA(25.8 IU/L) were both positive,
allowing rule-in of PlTB diagnosis in 100% of the cases.
Several studies had already been published about the IGRAs performance on PB or adapted
to PF in the PlTB diagnosis [5, 14, 15, 17]. T-SPOT.TB1 and QFT-GIT, two IGRAs approved
by WHO for latent TB diagnosis [13], have been applied on PF for tuberculous pleurisy diag-
nosis based on the publication of Wilkinson et al [26], which showed that effective T-cells are
15 times higher on PF of PlTB patients than on their PB. So, it was speculated that IGRAs
could also be used on active sites of the disease in order to measure the Mtb-specific response
according to the amount of cytokines and chemokines produced after the stimulation by the
antigens. In our sample, TB group presented a higher percentage of QFT-GIT positivity on PB
when compared to non-PlTB (54.5% vs 23.5%, p = 0.01). However, the failure of IGRAs on PB
in differentiating active from latent TB have shown to be associated with low specificity in
regions with high TB burden, as in Brazil. We agree with other previous results that do not
suggest the use of IGRAs on PB to differentiate active and latent TB. Our results are in accor-
dance with others which did not find benefits in the use of QFT-GIT on PF, with results of
IFN-γ Mtb-specific antigens minus Nil/negative control showing the same behavior in TB and
non-PlTB groups. Neither the application of the same method for IP-10 showed significance.
These results are possibly explained by the high basal levels of IFN-γ and IP-10 on tuberculous
PF, leading to an increase lower than expected after in vitro antigen stimulation as they were
already and naturally stimulated. Consequently, levels of Mtb-specific antigens minus Nil/neg-
ative control biomarkers on PF of TB patients did not show a substantial increase. Moreover,
both IFN-γ and IP-10 basal levels proved to be good biomarkers to differentiate TB and non-
TB pleural effusions and the use of QFT-GIT kit would only make the diagnosis of PlTB
unnecessarily more expensive.
In the last years, PF IFN-γ levels have been reported as a valuable diagnostic tool for PlTB
[7, 5, 27–30]. Our results are in accordance with previous reports, including two meta-analysis
studies published in 2003 and 2007, which showed a wide range of values for IFN-γ (0.3 to 13
IU/mL) [28, 29]. Other investigations on PlTB diagnosis evaluated the performance IFN-γ lev-
els measured in pg/mL. Ambade et al [25] calculated a cut-off of 1,090 pg/mL to differentiate
TB pleural effusions from non-PlTB, with a Se = 88%, Sp = 85%. The levels generated by Liu
et al [30] showed a best performance of this biological marker when compared to ADA to dif-
ferentiate TB from malignant pleural effusions (IFN-γ: Cut-off = 70 pg/mL, AUC = 0.960,
Se = 91.7%, Sp = 97.6%, PPV = 95.7%, NPV = 95.3%; ADA: Cut-off = 30 IU/L, AUC = 0.760,
Se = 70.8%, Sp = 95.2%, PPV = 89.5%, NPV = 85.1%). IFN- γ levels applied in a high burden
setting for TB [7], presented a better performance than ADA and Xpert MTB/RIF1, and based
on a cut-off point of 107.7 pg/mL provided a Se of 92.5% and a Sp of 95.9% versus a 79% sensi-
tive and 92.7% specific ADA (clinical cut point of 30 IU/L) and a 22.5% sensitive and 98% spe-
cific Xpert MTB/RIF1, which, in our sample, showed a positivity of 14.3% (S1 Table). Thus,
the comparison between different studies is impaired due to differences in the methods of esti-
mations, units and cut-off values applied. Besides that, the results found in the present study
are in agreement with previous reports which show IFN-γ as a better marker than ADA for the
diagnosis of tuberculous pleurisy, and bringing IP-10 as an alternative method, although its
poor performance.
IP-10, a relatively recent studied biomarker is a chemokine involved in trafficking mono-
cytes and activated T-helper type 1 lymphocytes to the TB inflammation site [19, 31]. Previous
studies summed 629 patients (304 with pleural TB) in whom IP-10 concentrations measured
by ELISA, showed a mean sensitivity and specificity of 84% and 90%, respectively, to discrimi-
nate TB and non-PlTB [32]. At a cut-off of 4,361.90 pg/mL, IP-10 was 75% sensitive and 82.6%
Combination of IFN-γ, IP-10 and ADA in the diagnosis of pleural tuberculosis
PLOS ONE | https://doi.org/10.1371/journal.pone.0202481 August 27, 2018 13 / 19
specific in our sample. Dheda et al [33] calculated a ROC-derived cut-point of 28,170 pg/mL
for IP-10, which missed approximately 20% of their TB cases and misdiagnosed another 20%
of non-PlTB cases. But when a lower cut-point (4,035 pg/mL) was used the NPV achieved
100%, which means that a negative test could exclude TB. Even though the average perfor-
mance of IP-10, in accordance with Dheda’s results, we presented a considerable number of
false positives (5 malignancies, 1 endometriosis, 1 cardiac failure and 1 hepatic failure). In a
study published in 2016, TB and malignant pleural effusions were compared using several bio-
markers, including IFN-γ and IP-10 [34]. In their sample of 27 patients (5 pleural TB and 22
malignant pleural effusion), IP-10 presented the best AUC when compared to IFN-γ (AUC
0.950 and cut-off 4,005 pg/mL vs AUC 0.830 and 100.5 pg/mL), with both presenting the same
sensitivity and specificity.
Tuberculous pleurisy is one of the most important differential diagnosis in cases with pleu-
ral effusion under investigation with high ADA levels [28]. Our results showed that tubercu-
lous PF presented ADA levels 5 times higher than non-PlTB effusions. A lower ADA cut-off
point leads to a sensitivity of 100%, although a fall in specificity to 84.8%. The literature usually
reports ADA levels between 30–60 IU/L for PlTB diagnosis [25, 32]. Our value was slightly
smaller than this range of values, even though other groups had reported values as low as 10
IU/L, 15 IU/L, 26 IU/L, 30 IU/L and 35 IU/L [2, 28, 35, 36]. There are also other reports sug-
gesting that ADA values can vary according to age, protein, DHL and absolute lymphocyte
count on PF, CD4 lymphocyte counts and geographic area [37–41] but these were not our
scope. The use of a smaller ADA cut-point lead to seven false positive TB cases (2 systemic ery-
thematous lupus, 2 lymphomas, 1 poorly differentiated cancer, 1 empyema, 1 undefined diag-
nosis) that could have been diagnosed with PlTB if it was considered alone. These specific
conditions are already known as possible false positive when it comes to PlTB diagnosis using
ADA and even the use of the standard cut-point of 40 IU/L generated 2 false positives PlTB (1
systemic erythematous lupus and 1 empyema).
The combinatorial analysis of the biomarkers positivity showed an impressing good perfor-
mance, in particular when IFN-γ plus ADA (25.8 IU/L) was analyzed. In the clinical practice, few
studies used two or three assays in combination to improve their isolated diagnostic power for
PlTB: QFT-GIT plus polymerase chain reaction [42]; ADA plus lymphocyte percentage on PF
[43]; QFT-GIT on PB, ADA and carcinoembryonic antigen (CEA) on PF [2]; T-SPOT.TB on
PB and PF combined with ADA on PF [44]. In all cases, the diagnostic yield enhanced when at
least two assays were combined. But, despite their performance, our results presented a better
behavior, with cut-off point calculated based on a sample with very rigid criteria for PlTB. To
the best of our knowledge, we only found one study who tested the combination of IFN-γ plus
ADA on PF. Keng et al [45], studied 88 patients only with lymphocytic pleural effusions and
although they found a specificity of 100% when ADA� 40 IU/L and IFN-γ� 75 pg/mL were
combined, their combination was poor accurate and sensitive (41.9% and 79.5%). In the same
study, the authors also tested a new cut-off of 15.5 IU/L for ADA, which improved its perfor-
mance. Maybe, if this lower cut-off was used, like we did in the present study, the combinato-
rial analysis with IFN-γ could approximate their results with ours. Moreover, we also used
neutrophilic pleural effusions, which can be encountered in tuberculous pleurisy, and even so
our results were better than theirs.
Finally, the performance of an internal validation of the positive combinations in the non-
confirmed PlTB cases showed a sensitivity of 88.2% (15/17), when at least two biomarkers
were used. The two exceptions were: i) an empiric case, woman, 22 years old, HIV negative,
with an exudative and lymphocytic pleural effusion who had complete clinical and radiological
improvement after TB treatment and who presented IFN-γ, IP-10, and ADA(25.8 IU/L) negative
results. She also presented 36,000 red blood cells count in PF, which could have influenced the
Combination of IFN-γ, IP-10 and ADA in the diagnosis of pleural tuberculosis
PLOS ONE | https://doi.org/10.1371/journal.pone.0202481 August 27, 2018 14 / 19
production and consequently, the measurement of these biomarkers; ii) a possible TB, woman,
19 years old, unknown HIV status, with an exudative and lymphocytic pleural effusion, with
the highest ADA levels registered in the study (259 IU/L) and false negative results for IFN-γand IP-10.
Some limitations should be considered in our study. Pleural biopsies were not performed in
all patients due to various reasons (old age, coagulopathy, a small amount of PF and refusal of
consent the procedure). In two non-PlTB cases (small cell lung cancer and renal failure) AFB
smear and culture were lost, both showed all three biomarkers negative. Also, Xpert MTB/
RIF1 was performed only in 14 cases (seven each group, with only one case of positivity in the
TB group), but as already reported, the sensitivity of molecular tests on pleural specimens is
low [46–48]. Besides being offered, HIV status was only known in 59 subjects, with only 3
cases of positivity (one undefined pleural effusion with positive ADA and negative IFN-γ and
IP-10, one renal failure with all three biomarkers negative, 1 probable TB with all the biomark-
ers positive). Between the 21 cases of unknown HIV status only one presented an indetermi-
nate QFT-GIT on PB, which means that in 20 cases, besides the unknown immunological
condition, they presented a positive response on mitogen tube which represents the positive
response of lymphocytes of each patient. Finally, all measurements of IFN-γ and IP-10 were
performed using the supernatant from QFT-GIT tubes, and not directly on PF without any
processing.
In our study, as in previous data, PlTB patients were more likely to be younger than non-
TB ones (Table 1) [7, 15, 30]. Besides the clinical similarities between tuberculous and nontu-
berculous patients that were possibly related to the magnitude of effusion and to constitutional
symptoms [15], time until diagnosis was higher in non-TB patients (Table 1). Tuberculous PF
presented higher levels of total cell count, lymphocytic percentage, protein, albumin and DHL
levels in the present study (Table 1) and also in previous data [15, 27, 49]. Moreover, we
observed that unilateral pleural effusion was the most frequent radiological presentation
among cases with TB (Table 1) in accordance to the previous publications [32, 50].
Of the three biomarkers analyzed in this study, IFN-γ showed the best performance. In
addition, a lower cut-off point of ADA was identified as a perfect rule-in parameter to PlTB,
although showing lower specificity, when combined with IFN-γ it ensured the correct diagno-
sis in almost 99% of cases. The results should be extrapolated to countries with a similar preva-
lence of Brazil and be validated in different populations. Although measurements of IFN-γ are
relatively expensive and not easily affordable, its use should be considered in future cost-effec-
tive studies which could balance the cost of a minimally invasive exam versus invasive pleural
biopsy procedures, time demanding culture results and the possible adverse effects due to
empirical TB treatment.
In conclusion, IFN-γ, IP-10 and ADA levels were significantly higher in the PF from PlTB
than in non-PlTB patients. IFN-γ is an excellent rule-in and rule-out test compared to IP-10
and ADA, whether used at its routine value of 40 IU/L or at a lower cut-off point calculated for
the purposes of this study. The combination of IFN-γ and ADA (25.8 IU/L) showed to be particu-
larly useful to clinicians as it prompts immediately treatment for TB when both biomarkers
are positive or further investigation in cases of both negatives.
Supporting information
S1 Table. Results with classical methods for pleural tuberculosis diagnosis in the study
population.
(DOCX)
Combination of IFN-γ, IP-10 and ADA in the diagnosis of pleural tuberculosis
PLOS ONE | https://doi.org/10.1371/journal.pone.0202481 August 27, 2018 15 / 19
S1 Fig. Concentration of IFN-γ and IP-10 in peripheral blood. Both biomarkers were mea-
sured on peripheral blood in the supernatants of QFT-GIT. Obtained levels from each bio-
marker were analyzed in a logarithmic scale and illustrated using boxplots to compare the
groups: Non-PlTB (N = 47) and PlTB (n = 33). Small gray dots represent individual cases and
box plots represent the interquartile range and sample median (central solid gray line). Bigger
black dots and vertical bars represent linear model estimated adjusted means and 95% confi-
dence intervals (CI 95%). PlTB: Pleural tuberculosis; Non-PlTB: Non-pleural tuberculosis; Nil:
Negative control tube; Ag: Mycobacterium tuberculosis-specific antigen tube; Mit: Mitogen
tube; � p = 0.001; �� p< 0.0001.
(TIF)
Acknowledgments
We would like to thank Dr. Domenico Capone, Dr. Walter Costa, and Dr. Helio Siqueira, phy-
sicians of Tuberculosis Outpatient Clinics of HUPE/UERJ, which contributed in the medical
care of the patients included in the study.
Author Contributions
Conceptualization: Geraldo Moura Batista Pereira, Luciana Silva Rodrigues.
Data curation: Ana Paula Santos.
Formal analysis: Ana Paula Santos, Marcelo Ribeiro-Alves.
Investigation: Ana Paula Santos, Thiago Thomaz Mafort, Janaına Leung.
Methodology: Ana Paula Santos, Raquel da Silva Corrêa, Ana Carolina Oliveira Soares da
Silva.
Resources: Rogerio Rufino.
Supervision: Luciana Silva Rodrigues, Rogerio Rufino.
Validation: Ana Paula Santos.
Writing – original draft: Ana Paula Santos.
Writing – review & editing: Ana Paula Santos, Luciana Silva Rodrigues, Rogerio Rufino.
References1. World Health Organization. Global Tuberculosis Report 2016. Available in: http://www.who.int.tb.
Accessed on June 15, 2017
2. Liu Y, Ou Q, Zheng J, Shen L, Zhang B, Weng X et al. A combination of the QuantiFERON-TB Gold In-
Tube assay and the detection of adenosine deaminase improves the diagnosis of tuberculous pleural
effusion. Emerg Microb & Infec 2016; 5: e83
3. Gomes T, Reis-Santos B, Bertolde A, Johnson JL, Riley LW and Maciel EL. Epidemiology of extrapul-
monary tuberculosis in Brazil: a hierarchical model. BMC Infectious Diseases 2014; 14: 9 https://doi.
org/10.1186/1471-2334-14-9 PMID: 24400848
4. Trajman A, Pai M, Dheda K. Novel tests for diagnosing tuberculous pleural effusion: what Works and
what does not? Eur Respir J 2008; 31: 1098–106 https://doi.org/10.1183/09031936.00147507 PMID:
18448504
5. Lee LN, Chou CH, Wang JY, Hsu HL, Tsai TH, Jan IS, et al. Enzyme-linked immunospot assay for inter-
feron-gamma in the diagnosis of tuberculosis pleurisy. Clin Microbiol Infect 2009; 15: 173–9
6. Liu F, Gao M, Zhang X, Du F, Jia H, Yang X, et al. Interferon-Gamma Release Assay Performance of
Pleural Fluid and Peripheral Blood in Pleural Tuberculosis. PlosOne 2013; 8 (12): 83857
Combination of IFN-γ, IP-10 and ADA in the diagnosis of pleural tuberculosis
PLOS ONE | https://doi.org/10.1371/journal.pone.0202481 August 27, 2018 16 / 19
7. Meldau R, Peter J, Theron G, Calligaro G, Allwood B, Symons G, et al. Comparison of same day diag-
nostic tools including Gene Xpert and unistimulated IFN-γ for the evaluation of pleural tuberculosis: a
prospective cohort study. BMC Pulm Med 2014; 14: 58 https://doi.org/10.1186/1471-2466-14-58
PMID: 24708530
8. Shimokata K, Saka H, Murate T, Hasegawa Y, Hasegawa T. Cytokine content in pleural effusion. Chest
1991; 99: 1103–7 PMID: 1902158
9. Nemeth J, Winkler HM, Zwick RH, Rumetshofer R, Schenk P, Burghuber OC, et al. Recruitment of
Mycobacterium tuberculosis specific CD4+ T cells to the site of infection for diagnosis of active tubercu-
losis. J Int Med 2009; 265: 163–8
10. Sutherland JS, Garba D, Fombah AE, Mendy-Gomez A, Mendy FS, Antonio M, et al. Highly Accurate
Diagnosis of Pleural Tuberculosis by Immunological Analysis of the Pleural Effusion. PLoS ONE 2012;
7(1): e30324 https://doi.org/10.1371/journal.pone.0030324 PMID: 22295081
11. Gopi A, Madhavan SM, Sharma SK, Sahn SA. Diagnosis and treatment of tuberculosis pleural effusion
in 2006. Chest 2007; 131: 880–9 https://doi.org/10.1378/chest.06-2063 PMID: 17356108
12. Light RW. Update on tuberculous pleural effusion. Respirology 2010; 15(3):451 https://doi.org/10.
1111/j.1440-1843.2010.01723.x PMID: 20345583
13. World Health Organization. Implementing tuberculosis diagnosis. Policy framework 2015. Available in:
http://www.who.int.tb. Accessed on January 18, 2018
14. Losi M, Bossink A, Codecasa L, Jafari C, Ernst M, Thijsen S, et al. Use of a T-cell interferon-γ release
assay for the diagnosis of tuberculosis pleurisy. Eur Respir J 2007; 30: 1173–9 https://doi.org/10.1183/
09031936.00067307 PMID: 17715165
15. Dheda K, Zyl-Smit RN, Seche LA, Badri M, Meldau R, Meldau S, et al. Utility of quantitative T-cell
responses versus unstimulated interferon-γ for the diagnosis of pleural tuberculosis. Eur Respir J 2009;
34: 1118–26 https://doi.org/10.1183/09031936.00005309 PMID: 19386693
16. Aggarwal AN, Agarwal R, Gupta D, Dhooria S and Behera D. Interferon Gamma Release Assays for
Diagnosis of Pleural Tuberculosis: a Systematic Review and Meta-Analysis. J Clin Microbiol 2015; 53:
2451–9 https://doi.org/10.1128/JCM.00823-15 PMID: 25994163
17. Li ZZ, Qin WZ, Li L, Wu Q, Wang YJ. Accuracy of enzyme-linked immunospot assay for diagnosis of
pleural tuberculosis: a meta-analysis. Gen and Mol Res 2015; 14 (3): 11672–80
18. Pang CS, Shen YC, Tian PW, Zhu J, Feng M, Wan C, et al. Accuracy of the interferon-gamma release
assay for the diagnosis of tuberculous pleurisy: an updated meta-analysis. Peer J 2015; 3: e951 https://
doi.org/10.7717/peerj.951 PMID: 26038718
19. Okamoto M, Kawabe T, Iwasaki Y, Hara T, Hashimoto N, Imaizumi K, et al. Evaluation of interferon-γ,interferon-γ-inducing cytokines, and interferon-γ-inducible chemokines in tuberculous pleural effusions.
J Lab Clin Med 2005; 145: 88–93 https://doi.org/10.1016/j.lab.2004.11.013 PMID: 15746651
20. El Fenniri L, Toossi Z, Aung H, El Iraki G, Bourkkadi J, Benamor J, et al. Polyfunctional Mycobacterium
tuberculosis-specific effector memory CD4+ T cells at sites of pleural TB. Tuberculosis 2011; 91: 224–
30 https://doi.org/10.1016/j.tube.2010.12.005 PMID: 21459675
21. Kabeer BSA, Paramasivam P, Raja A. Interferon gamma and interferon gamma inducible protein-10 in
detecting tuberculosis infection. J Infec 2012; 64 (6): 573–9
22. Giusti G. Adenosine deaminase. In: Bergmeyer HU, editor. Methods of enzymatic analysis. 2nd edition.
New York: Academic Press; 1974. p. 1092–99
23. Hiraki A, Aoe K, Matsuo K, Murakami K, Murakami T, Onoda T, et al. Simultaneous measurement of T-
helper 1 cytokines in tuberculous pleural effusion. Int J Tuberc Lung Dis 2003; 7: 1172–7 PMID:
14677892
24. Tiwari RP; Hattikudur NS, Bharmal RN, Kartikekeyan S, Deshmukh NM, and Bisen PS. Modern
approaches to a rapid diagnosis of tuberculosis: promises and challenges ahead. Tuberculosis 2007;
87: 193–201 https://doi.org/10.1016/j.tube.2006.07.005 PMID: 17029964
25. Ambade V, Arora B, Rai C, Nikumb SK, Basannar DR. Markers for differentiation of tubercular pleural
effusion from non-tubercular effusion. MJAFI 2011; 67: 338–42
26. Wilkinson KA, Wilkinson RJ, Pathan A, Ewer K, Prakash M, Klenerman P, et al. Ex vivo Characteriza-
tion of Early Secretory Antigenic Target 6 –Specific T Cells at Sites of Active Disease in Pleural Tuber-
culosis. Clin Infec Dis 2005; 40: 184–7
27. Aoe K, Hiraki A, Murakami T, Eda R, Maeda T, Sugi K, et al. Diagnostic significance of interferon-γ in
tuberculous pleural effusions. Chest 2003; 123: 740–4 PMID: 12628872
28. Greco S, Girardi E, Masciangelo R, Capocceta GB, Saltini C. Adenosine deaminase and interferon
gamma measurements for the diagnosis of tuberculous pleurisy: a meta-analysis. Int J Tuberc Lung Dis
2003; 7 (8): 777–86 PMID: 12921155
Combination of IFN-γ, IP-10 and ADA in the diagnosis of pleural tuberculosis
PLOS ONE | https://doi.org/10.1371/journal.pone.0202481 August 27, 2018 17 / 19

29. Jiang J, Shi HZ, Liang QL, Qin SM, Qin XJ. Diagnostic value of interferon-γ in tuberculous pleurisy.
Chest 2007; 131: 1133–41 https://doi.org/10.1378/chest.06-2273 PMID: 17426220
30. Liu YC, Lee SS, Chen YS, Tu HZ, Chen BC, and Huang TS. Differential diagnosis of tuberculous and
malignant pleurisy using pleural fluid adenosine deaminase and interferon gamma in Taiwan. J Micro-
biol Immunol Infect 2011; 44: 88–94 https://doi.org/10.1016/j.jmii.2010.04.001 PMID: 21439509
31. Pokkali S, Das SD. Expression of CXC and CC type of chemokines and its receptors in tuberculous and
non-tuberculous effusions. Cytokine 2008; 41: 307–14 https://doi.org/10.1016/j.cyto.2007.12.009
PMID: 18226915
32. Porcel JM. Advances in the diagnosis of tuberculous pleuritis. Ann Transl Med 2016; 4 (15): 282 https://
doi.org/10.21037/atm.2016.07.23 PMID: 27570776
33. Dheda K, Smit RN, Sechi L, Badri M, Meldau R, Symons G, et al. Clinical diagnostic utility of IP-10 and
LAM antigen levels for the diagnosis of tuberculous pleural effusions in a high burden setting. PLoS
ONE 2009; 4 (3): e4689 https://doi.org/10.1371/journal.pone.0004689 PMID: 19277111
34. Chen KY, Feng PH, Chang CC, Chen TT, Chuang HC, Lee CN, et al. Novel biomarker analysis of pleu-
ral effusion enhances differentiation of tuberculous from malignant pleural effusion. Int J Gen Med
2016; 9: 183–9 https://doi.org/10.2147/IJGM.S100237 PMID: 27354819
35. Helmy NA, Eissa SA, Masoud HH, Elessawy AF, Ahmed RI. Diagnostic value of adenosine deaminase
in tuberculous and malignant pleural effusion. Egypt J Chest Dis Tubercl 2012; 61 (4):413–7
36. Arnold DT, Bhatnagar R, Fairbanks LD, Zahan-Evans N, Clive AO, Morley AJ, et al. Pleural Fluid Aden-
osine Deaminase (PFADA) in the Diagnosis of Tuberculous Effusions in a Low Incidence Population.
PLoS One 2015; 10 (2): e0113047 https://doi.org/10.1371/journal.pone.0113047 PMID: 25647479
37. Niwa Y, Kishimoto H, Shimotaka K. Carcinomatous and tuberculous pleural effusions. Chest 1985; 87:
351–5 PMID: 3971760
38. Baganha MF, Pêgo A, Lima MA, Gaspar EV, Cordeiro AR. Serum and pleural adenosine deaminase.
Correlation with lymphocytic population. Chest 1990; 97: 605–10 PMID: 1689629
39. Tay TR, Tee A. Factors affecting pleural fluid adenosine deaminase level and the implication on the
diagnosis of tuberculous pleural effusion: a retrospective cohort study. BMC Infectious Diseases 2013,
13: 546 https://doi.org/10.1186/1471-2334-13-546 PMID: 24238276
40. Abrao FC, Abreu IR, Miyaki DH, Busico MA, Younes RN. Role of adenosine deaminase and the influ-
ence of age on the diagnosis of pleural tuberculosis. Int J Tuberc Lung Dis 2014; 18: 1363–9 https://doi.
org/10.5588/ijtld.14.0257 PMID: 25299872
41. Lee SJ, Kim HS, Lee SH, Lee TW, Lee HR, Cho YJ, et al. Factors influencing pleural adenosine deami-
nase level in patients with tuberculous pleurisy. Am J Med Sci 2014; 348: 362–5 https://doi.org/10.
1097/MAJ.0000000000000260 PMID: 24762755
42. Gao Y, Ou Q, Huang F, Wang S, Shen L, Shen Y, et al. Improved diagnostic power by combined inter-
feron-gamma release assay and nested-PCR in tuberculous pleurisy in high tuberculosis prevalence
area. FEMS Immunol Med Microbiol 2012; 66: 393–8 https://doi.org/10.1111/1574-695X.12006 PMID:
23163870
43. Garcia-Zamalloa A, Taboada-Gomez J. Diagnostic accuracy of adenosine deaminase and lymphocyte
proportion in pleural fluid for tuberculous pleurisy in different prevalence scenarios. PLoS ONE 2012; 7:
e38729 https://doi.org/10.1371/journal.pone.0038729 PMID: 22723878
44. Xu HY, Li CY, Su SS, Yang L, Ye M, Ye JR, et al. Diagnosis of tuberculous pleurisy with combination of
adenosine deaminase and interferon-γ immunospot assay in a tuberculosis-endemic population. Medi-
cine 2017; 96: 47
45. Keng LT, Shu CC, Chen JY, Liang SK, Lin CK, Chan gLY, et al. Evaluating pleural ADA, ADA2, IFN-γand IGRA for diagnosing tuberculous pleurisy. J Infect 2013; 67: 294–302 https://doi.org/10.1016/j.jinf.
2013.05.009 PMID: 23796864
46. Lusiba JK, Nakiyingi L, Kirenga BJ, Kiragga A, Lukande R, Nsereko M, et al. Evaluation of Cepheid’s
Xpert MTB/RIF test on pleural fluid in the diagnosis of pleural tuberculosis in a high prevalence HIV/TB
setting. PLoS ONE 2014; 9: e102702 https://doi.org/10.1371/journal.pone.0102702 PMID: 25051491
47. Maynard-Smith L, Larke N, Peters JA, Lawn SD. BMC Infec Dis 2014; 14: 709
48. Sehgal IS, Dhooria S, Aggarwal NA, Behera D, Agarwal R. Diagnostic performance of Xpert MTB/RIF
in tuberculous pleural effusion: systematic review and meta-analysis. J Clin Microbiol 2016; 54: 1133–6
https://doi.org/10.1128/JCM.03205-15 PMID: 26818675
49. Choi H, Chon HR, Kim K, Kim S, Oh KJ, Jeong SH, et al. Clinical and laboratory differences between
lymphocyte and neutrophil-predominant pleural tuberculosis. PLoS ONE 2016; 11 (10): e0165428
https://doi.org/10.1371/journal.pone.0165428 PMID: 27788218
Combination of IFN-γ, IP-10 and ADA in the diagnosis of pleural tuberculosis
PLOS ONE | https://doi.org/10.1371/journal.pone.0202481 August 27, 2018 18 / 19

50. Bielsa S, Palma R, Pardina M, Esquerda A, Light RW, Porcel JM. Comparison of polymorphonuclear
and lymphocyte rich tuberculous pleural effusions. Int J Tuberc Lung Dis 2013; 17: 85–9 https://doi.org/
10.5588/ijtld.12.0236 PMID: 23164256
Combination of IFN-γ, IP-10 and ADA in the diagnosis of pleural tuberculosis
PLOS ONE | https://doi.org/10.1371/journal.pone.0202481 August 27, 2018 19 / 19