Analysis of di usion in solid state electrolytes through ...
15
Analysis of diffusion in solid state electrolytes through MD-simulations, improvement of the Li-ion conductivity in β -Li 3 PS 4 as an example Niek J.J. de Klerk, Eveline van der Maas, and Marnix Wagemaker * Department of Radiation Science and Technology, Delft University of Technology, Mekelweg 15, 2629JB Delft, The Netherlands E-mail: [email protected] Abstract Molecular dynamics simulations are a powerful tool to study diffusion processes in battery elec- trolyte and electrode materials. From a single molecular dynamics simulation many proper- ties relevant to diffusion can be obtained, in- cluding the diffusion path, attempt frequency, activation energies, and collective diffusion pro- cesses. These detailed diffusion properties pro- vide a thorough understanding of diffusion in solid electrolytes, and provides direction for the design of improved solid electrolyte materials. Here a thorough analysis methodology is devel- oped, and applied to DFT MD simulations of Li-ion diffusion in β -Li 3 PS 4 . The methodology presented is generally applicable to crystalline materials and facilitates the analysis of molec- ular dynamics simulations. The code used for the analysis is freely available at: https://bitbucket.org/niekdeklerk/md-analysis- with-matlab. The results on β -Li 3 PS 4 demonstrate that jumps between bc-planes limit the conductiv- ity of this important class of solid electrolyte materials. The simulations indicate that by adding Li-interstitials or Li-vacancies the rate limiting jump process can be accelerated sig- nificantly, which induces three dimensional dif- fusion, resulting in an increased Li-ion diffu- sivity. Li-vacancies can be introduced through Br-doping, which is predicted to result in an order of magnitude larger Li-ion conductivity in β -Li 3 PS 4 . Furthermore, the present simula- tions rationalise the improved Li-ion diffusivity upon O-doping through the creation of local Li-interstitials. Introduction To prevent further global warming by green- house gas emissions it is necessary to move from fossil fuels towards renewable energy sources. For transport applications other energy carri- ers, such as hydrogen and batteries, are con- sidered. Of the current technologies which can replace fossil fuels in vehicles, batteries result in the lowest greenhouse gas emissions 1 , especially if renewable sources are used for the energy pro- duction. However, safety concerns and the limited range of current battery electric vehicles are slowing down their implementation. Solid state batter- ies are a promising technology 2,3 based on the much lower flammability risks, the higher en- ergy density on the cell level, and lower self- discharge rate. One of the prerequisites towards the realisa- tion of solid state batteries is the development of highly conductive solid electrolytes. In re- cent years several materials have been discov- ered which show conductivities comparable to liquid electrolytes. Room temperature ionic conductivities in the order of 10 -3 S/cm have been reported in a range of lithium contain- 1 arXiv:1712.06962v1 [physics.chem-ph] 19 Dec 2017
Transcript of Analysis of di usion in solid state electrolytes through ...
Analysis of diffusion in solid state electrolytesthrough MD-simulations, improvement of theLi-ion conductivity in β-Li3PS4 as an example
Niek J.J. de Klerk, Eveline van der Maas, and Marnix Wagemaker∗
Department of Radiation Science and Technology, Delft University of Technology, Mekelweg15, 2629JB Delft, The Netherlands
E-mail: [email protected]
Abstract
Molecular dynamics simulations are a powerfultool to study diffusion processes in battery elec-trolyte and electrode materials. From a singlemolecular dynamics simulation many proper-ties relevant to diffusion can be obtained, in-cluding the diffusion path, attempt frequency,activation energies, and collective diffusion pro-cesses. These detailed diffusion properties pro-vide a thorough understanding of diffusion insolid electrolytes, and provides direction for thedesign of improved solid electrolyte materials.Here a thorough analysis methodology is devel-oped, and applied to DFT MD simulations ofLi-ion diffusion in β-Li3PS4. The methodologypresented is generally applicable to crystallinematerials and facilitates the analysis of molec-ular dynamics simulations. The code used forthe analysis is freely available at:https://bitbucket.org/niekdeklerk/md-analysis-with-matlab.The results on β-Li3PS4 demonstrate thatjumps between bc-planes limit the conductiv-ity of this important class of solid electrolytematerials. The simulations indicate that byadding Li-interstitials or Li-vacancies the ratelimiting jump process can be accelerated sig-nificantly, which induces three dimensional dif-fusion, resulting in an increased Li-ion diffu-sivity. Li-vacancies can be introduced throughBr-doping, which is predicted to result in anorder of magnitude larger Li-ion conductivity
in β-Li3PS4. Furthermore, the present simula-tions rationalise the improved Li-ion diffusivityupon O-doping through the creation of localLi-interstitials.
Introduction
To prevent further global warming by green-house gas emissions it is necessary to move fromfossil fuels towards renewable energy sources.For transport applications other energy carri-ers, such as hydrogen and batteries, are con-sidered. Of the current technologies which canreplace fossil fuels in vehicles, batteries result inthe lowest greenhouse gas emissions1, especiallyif renewable sources are used for the energy pro-duction.However, safety concerns and the limited rangeof current battery electric vehicles are slowingdown their implementation. Solid state batter-ies are a promising technology2,3 based on themuch lower flammability risks, the higher en-ergy density on the cell level, and lower self-discharge rate.One of the prerequisites towards the realisa-tion of solid state batteries is the developmentof highly conductive solid electrolytes. In re-cent years several materials have been discov-ered which show conductivities comparable toliquid electrolytes. Room temperature ionicconductivities in the order of 10−3 S/cm havebeen reported in a range of lithium contain-
1
arX
iv:1
712.
0696
2v1
[ph
ysic
s.ch
em-p
h] 1
9 D
ec 2
017
ing compounds2, such as LLTO, argyrodites,LGPS, and LATP. Fewer sodium containingcompounds with such high conductivities areknown, most likely the result of less intensiveresearch in this area, but several have been es-tablished, including β-alumina4 and Na3PS4
5.The combination of high ionic conductivity andlarge electrochemical stability is challenging2,6,but electrochemical stability does not have verystrict requirements. A solid electrolyte canbe successful if its decomposition products arestable, have a reasonable ionic conductivityand low electronic conductivity6, similar to thefunctioning of solid-electrolyte interface (SEI)layers for liquid electrolytes. The complex de-mands on solid electrolytes necessitates funda-mental research towards solid electrolyte prop-erties and new solid electrolyte materials.Computer simulations are playing an impor-tant role in understanding and directing ma-terials design towards improved battery perfor-mance. For example, calculations have shownthat the electrochemical stability of solid elec-trolytes is enhanced by passivating decomposi-tion products6, that strain can enhance diffu-sion7, how Li-ion diffusion can be increased inanti-perovskites8 and Na3PS4
5,9, and why bondfrustration is beneficial for Li-ion diffusion10.In solid state electrolytes the high concentra-tion of diffusing atoms, 31 mol/L in β-Li3PS4,can lead to complex interactions and diffu-sion behaviour. Diffusion can involve collectivejumps11 and lattice vibrations9,12, which are allincluded in molecular dynamics (MD) simula-tions since all possible motions of ions and theirinteractions are taken into account. Further-more, MD simulations can show unanticipateddiffusion behaviour13, whereas static calcula-tions (e.g. nudged elastic band and bond va-lence) are limited by the imagination of the re-searcher. To understand diffusion in solid stateelectrolytes MD simulations are thus a powerfultool, allowing the dynamic diffusion processesto be studied in detail.Although MD simulations have been shown toprovide understanding of complicated diffusionprocesses, typically only the tracer diffusivityis extracted, from which an activation energyis calculated by assuming Arrhenius behaviour.
A thorough analysis of MD simulations is ableto give much more detailed results, potentiallyproviding more understanding and concrete di-rection towards the design of improved con-ductivities9,14,15. In order to make such thor-ough analysis of MD simulations more easilyavailable we present an approach, here demon-strated for β-Li3PS4, that allows to extract thedetailed diffusional properties based on a MDsimulation and the crystalline structure of thestudied material. The approach determinesjump rates, activation energies, attempt fre-quency, vibrational amplitude, radial distribu-tion functions, possible collective motions, siteoccupancies, tracer diffusivity, and the correla-tion factor.The first part of this paper describes the ap-proach that is followed to obtain the diffusionalproperties from a single MD simulation. In thesecond part MD simulations on β-Li3PS4 areanalysed, exemplifying how the developed ap-proach helps in understanding diffusion in solidstate electrolytes, and how this provides direc-tion to design improved solid electrolyte mate-rials. The Matlab code used for the analysis ofMD simulations is freely available online16.
Information from MD simu-
lations
After performing a MD simulation the positionof all the atoms at every time step is known.Typically, this result is used to determine thetracer diffusivity (D∗) via the mean squared dis-placement17:
D∗ =1
2dN
N∑i=1
(ri(t)
t
2)
(1)
where ri(t) is the displacement of a single atom,t the simulated time, N the number of diffus-ing atoms, and d the number of diffusion di-mensions. Using the diffusivity and the Nernst-Einstein relation the conductivity (σ) can bedetermined17:
σ =ne2z2
kBTD∗ (2)
2
where n is the diffusing particle density, e theelementary electron charge, z the ionic charge,kB Boltzmann’s constant, and T the tempera-ture in Kelvin. Provided that the atomic dis-placement is significantly larger than the vibra-tion amplitude, the tracer diffusivity provides agood quantitative indication of the ionic diffu-sion. However, to get a thorough understandingmuch more properties related to the diffusionprocess can be obtained from a single MD sim-ulation, including:
• Amplitude of vibrations
• Attempt frequency
• Site occupations
• Jump rates
• Correlation factor
• Activation energies
• Collective jumps
• Radial Distribution Functions
Amplitude of vibrations
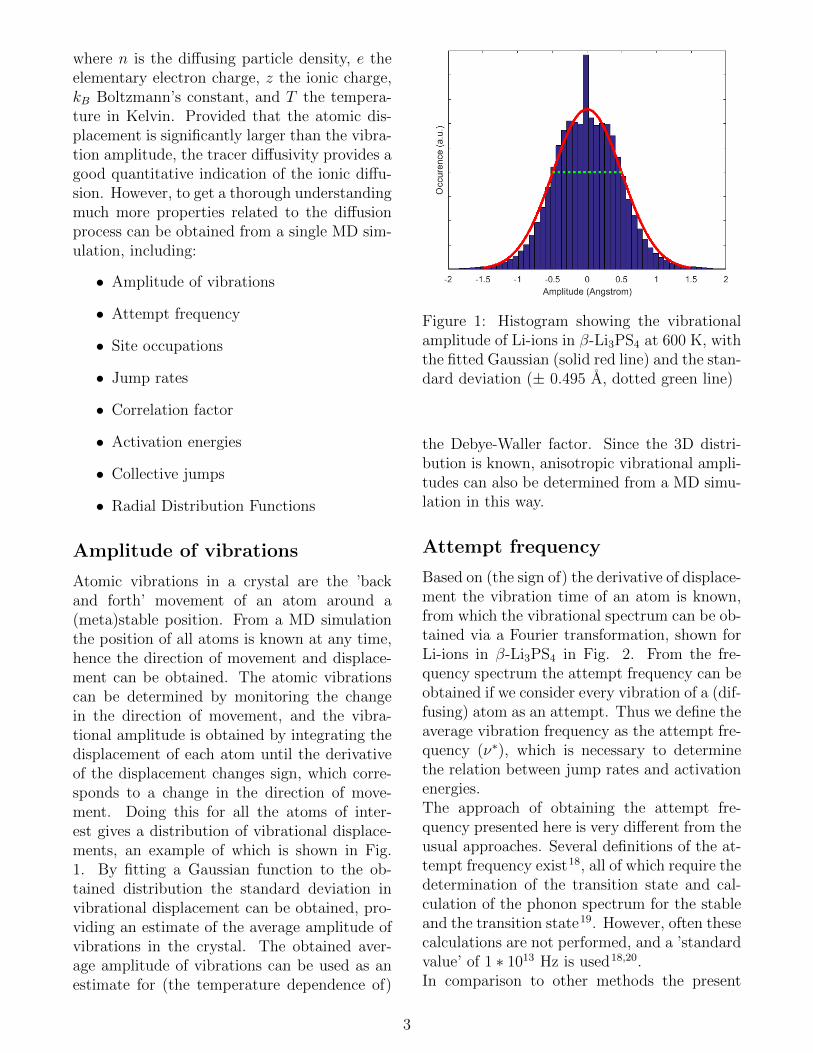
Atomic vibrations in a crystal are the ’backand forth’ movement of an atom around a(meta)stable position. From a MD simulationthe position of all atoms is known at any time,hence the direction of movement and displace-ment can be obtained. The atomic vibrationscan be determined by monitoring the changein the direction of movement, and the vibra-tional amplitude is obtained by integrating thedisplacement of each atom until the derivativeof the displacement changes sign, which corre-sponds to a change in the direction of move-ment. Doing this for all the atoms of inter-est gives a distribution of vibrational displace-ments, an example of which is shown in Fig.1. By fitting a Gaussian function to the ob-tained distribution the standard deviation invibrational displacement can be obtained, pro-viding an estimate of the average amplitude ofvibrations in the crystal. The obtained aver-age amplitude of vibrations can be used as anestimate for (the temperature dependence of)
Figure 1: Histogram showing the vibrationalamplitude of Li-ions in β-Li3PS4 at 600 K, withthe fitted Gaussian (solid red line) and the stan-dard deviation (± 0.495 A, dotted green line)
the Debye-Waller factor. Since the 3D distri-bution is known, anisotropic vibrational ampli-tudes can also be determined from a MD simu-lation in this way.
Attempt frequency
Based on (the sign of) the derivative of displace-ment the vibration time of an atom is known,from which the vibrational spectrum can be ob-tained via a Fourier transformation, shown forLi-ions in β-Li3PS4 in Fig. 2. From the fre-quency spectrum the attempt frequency can beobtained if we consider every vibration of a (dif-fusing) atom as an attempt. Thus we define theaverage vibration frequency as the attempt fre-quency (ν∗), which is necessary to determinethe relation between jump rates and activationenergies.The approach of obtaining the attempt fre-quency presented here is very different from theusual approaches. Several definitions of the at-tempt frequency exist18, all of which require thedetermination of the transition state and cal-culation of the phonon spectrum for the stableand the transition state19. However, often thesecalculations are not performed, and a ’standardvalue’ of 1 ∗ 1013 Hz is used18,20.In comparison to other methods the present
3
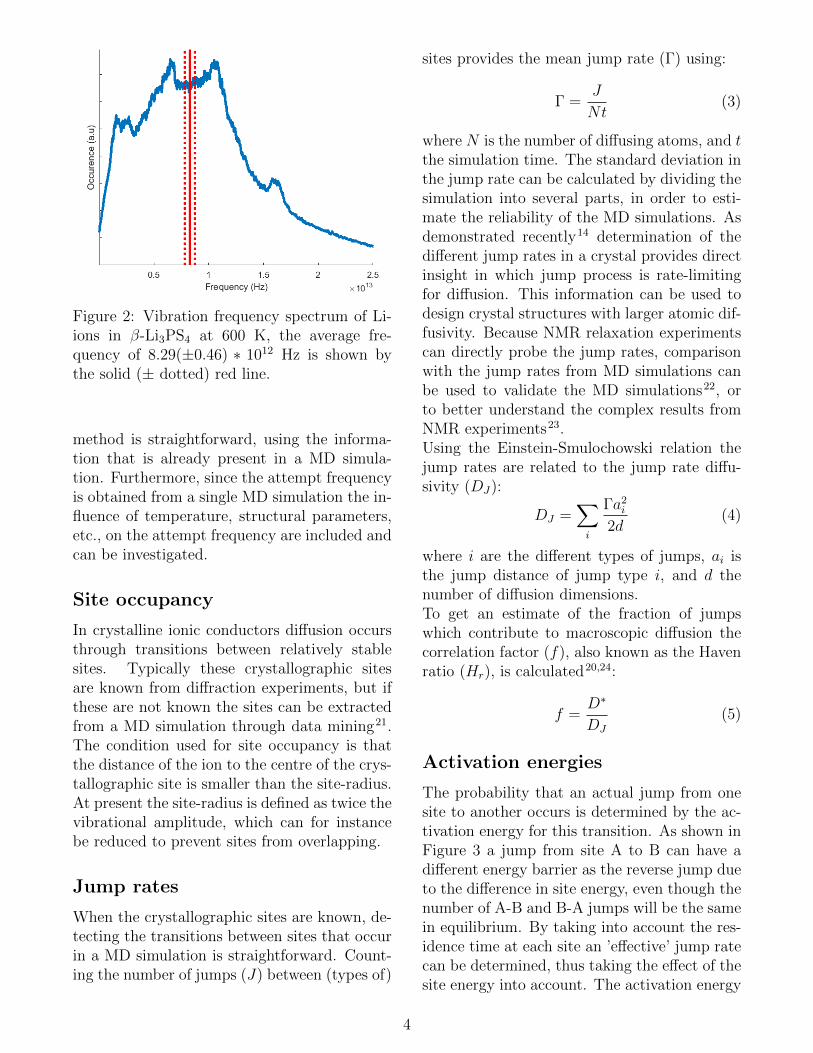
Figure 2: Vibration frequency spectrum of Li-ions in β-Li3PS4 at 600 K, the average fre-quency of 8.29(±0.46) ∗ 1012 Hz is shown bythe solid (± dotted) red line.
method is straightforward, using the informa-tion that is already present in a MD simula-tion. Furthermore, since the attempt frequencyis obtained from a single MD simulation the in-fluence of temperature, structural parameters,etc., on the attempt frequency are included andcan be investigated.
Site occupancy
In crystalline ionic conductors diffusion occursthrough transitions between relatively stablesites. Typically these crystallographic sitesare known from diffraction experiments, but ifthese are not known the sites can be extractedfrom a MD simulation through data mining21.The condition used for site occupancy is thatthe distance of the ion to the centre of the crys-tallographic site is smaller than the site-radius.At present the site-radius is defined as twice thevibrational amplitude, which can for instancebe reduced to prevent sites from overlapping.
Jump rates
When the crystallographic sites are known, de-tecting the transitions between sites that occurin a MD simulation is straightforward. Count-ing the number of jumps (J) between (types of)
sites provides the mean jump rate (Γ) using:
Γ =J
Nt(3)
where N is the number of diffusing atoms, and tthe simulation time. The standard deviation inthe jump rate can be calculated by dividing thesimulation into several parts, in order to esti-mate the reliability of the MD simulations. Asdemonstrated recently14 determination of thedifferent jump rates in a crystal provides directinsight in which jump process is rate-limitingfor diffusion. This information can be used todesign crystal structures with larger atomic dif-fusivity. Because NMR relaxation experimentscan directly probe the jump rates, comparisonwith the jump rates from MD simulations canbe used to validate the MD simulations22, orto better understand the complex results fromNMR experiments23.Using the Einstein-Smulochowski relation thejump rates are related to the jump rate diffu-sivity (DJ):
DJ =∑i
Γa2i
2d(4)
where i are the different types of jumps, ai isthe jump distance of jump type i, and d thenumber of diffusion dimensions.To get an estimate of the fraction of jumpswhich contribute to macroscopic diffusion thecorrelation factor (f), also known as the Havenratio (Hr), is calculated20,24:
f =D∗
DJ
(5)
Activation energies
The probability that an actual jump from onesite to another occurs is determined by the ac-tivation energy for this transition. As shown inFigure 3 a jump from site A to B can have adifferent energy barrier as the reverse jump dueto the difference in site energy, even though thenumber of A-B and B-A jumps will be the samein equilibrium. By taking into account the res-idence time at each site an ’effective’ jump ratecan be determined, thus taking the effect of thesite energy into account. The activation energy
4
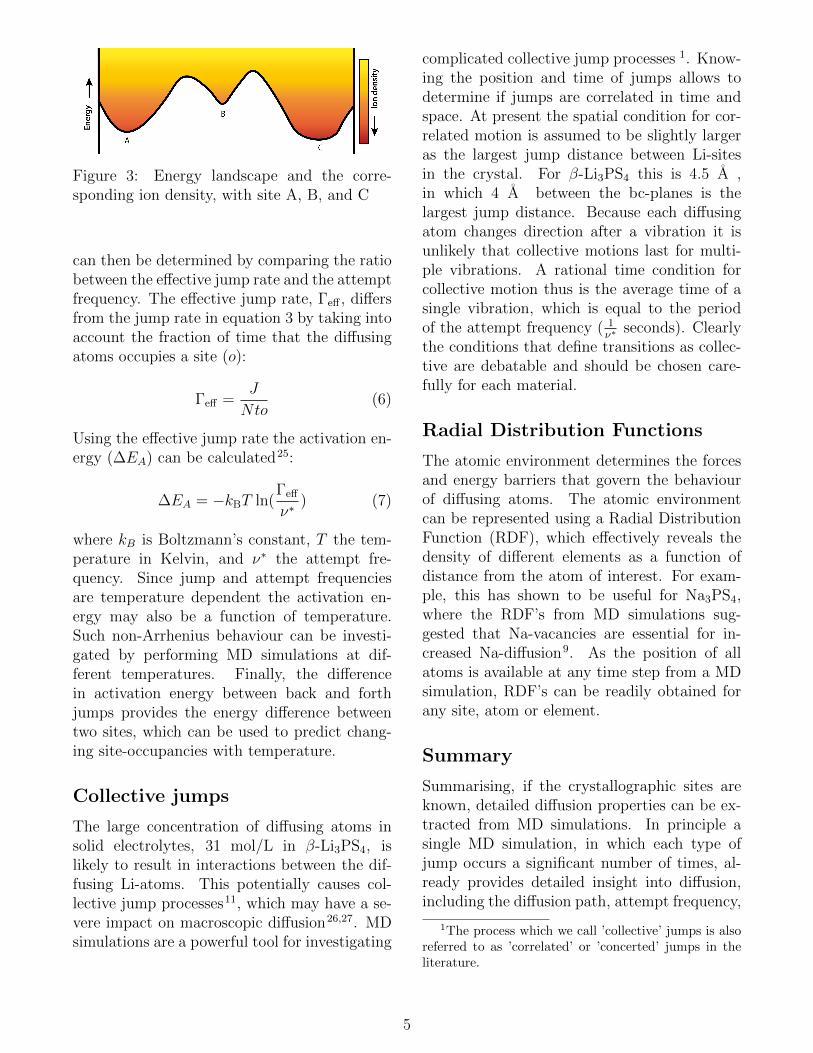
Figure 3: Energy landscape and the corre-sponding ion density, with site A, B, and C
can then be determined by comparing the ratiobetween the effective jump rate and the attemptfrequency. The effective jump rate, Γeff , differsfrom the jump rate in equation 3 by taking intoaccount the fraction of time that the diffusingatoms occupies a site (o):
Γeff =J
Nto(6)
Using the effective jump rate the activation en-ergy (∆EA) can be calculated25:
∆EA = −kBT ln(Γeff
ν∗) (7)
where kB is Boltzmann’s constant, T the tem-perature in Kelvin, and ν∗ the attempt fre-quency. Since jump and attempt frequenciesare temperature dependent the activation en-ergy may also be a function of temperature.Such non-Arrhenius behaviour can be investi-gated by performing MD simulations at dif-ferent temperatures. Finally, the differencein activation energy between back and forthjumps provides the energy difference betweentwo sites, which can be used to predict chang-ing site-occupancies with temperature.
Collective jumps
The large concentration of diffusing atoms insolid electrolytes, 31 mol/L in β-Li3PS4, islikely to result in interactions between the dif-fusing Li-atoms. This potentially causes col-lective jump processes11, which may have a se-vere impact on macroscopic diffusion26,27. MDsimulations are a powerful tool for investigating
complicated collective jump processes 1. Know-ing the position and time of jumps allows todetermine if jumps are correlated in time andspace. At present the spatial condition for cor-related motion is assumed to be slightly largeras the largest jump distance between Li-sitesin the crystal. For β-Li3PS4 this is 4.5 A ,in which 4 A between the bc-planes is thelargest jump distance. Because each diffusingatom changes direction after a vibration it isunlikely that collective motions last for multi-ple vibrations. A rational time condition forcollective motion thus is the average time of asingle vibration, which is equal to the periodof the attempt frequency ( 1
ν∗seconds). Clearly
the conditions that define transitions as collec-tive are debatable and should be chosen care-fully for each material.
Radial Distribution Functions
The atomic environment determines the forcesand energy barriers that govern the behaviourof diffusing atoms. The atomic environmentcan be represented using a Radial DistributionFunction (RDF), which effectively reveals thedensity of different elements as a function ofdistance from the atom of interest. For exam-ple, this has shown to be useful for Na3PS4,where the RDF’s from MD simulations sug-gested that Na-vacancies are essential for in-creased Na-diffusion9. As the position of allatoms is available at any time step from a MDsimulation, RDF’s can be readily obtained forany site, atom or element.
Summary
Summarising, if the crystallographic sites areknown, detailed diffusion properties can be ex-tracted from MD simulations. In principle asingle MD simulation, in which each type ofjump occurs a significant number of times, al-ready provides detailed insight into diffusion,including the diffusion path, attempt frequency,
1The process which we call ’collective’ jumps is alsoreferred to as ’correlated’ or ’concerted’ jumps in theliterature.
5
jump rates, activation energies, collective mo-tions, atomic environments, and the correlationfactor.For a thorough understanding MD simulationsat several temperatures might be necessary,for instance in the case of non-Arrhenius be-haviour, or to investigate the reliability of theresults over a range of temperatures. Extract-ing the described information is beneficial forunderstanding of the diffusion process, allowingfor a targeted approach to design and preparematerials with enhanced properties, as will bedemonstrated in this study for the Li-ion con-ductor β-Li3PS4.
Example: β-Li3PS4
Li3PS4 has been a well-known Li-ion conductorsince the 1980’s28, but interest grew after exper-iments with nano-sized crystals showed a Li-ionconductivity of 1.6 ∗ 10−4 S/cm29, approachingthe value that is required for solid state Li-ionbatteries. Three polymorphs of Li3PS4 havebeen reported30, the low-temperature γ-phase,the β-phase at intermediate temperatures, andthe high temperature α-phase. The β-phaseshows the highest room temperature conduc-tivity of the three polymorphs29, and is thusmost interesting for application as a solid elec-trolyte. A beneficial property of β-Li3PS4 is itsapparent stability against Li-metal29, althoughDFT-calculations report otherwise6,31. Li3PS4
can be prepared via a solvent route32,33, result-ing in a conductivity of 3.3*10−4 S/cm32, en-abling coating of cathode materials. In this wayno additional solid electrolyte material needs tobe added in the cathodic mixture33, resulting ina larger effective energy density in combinationwith a small interface resistance.Several studies28,30,34 investigating the struc-ture of β-Li3PS4 report significantly differentLi-ion positions and occupancies. Neutrondiffraction34 indicates that the coordinates ofthe Li-ion 4c position strongly depend on tem-perature, potentially explaining the differencesbetween X-ray diffraction studies28,30.Based on the larger sensitivity to Li-ions of neu-trons compared to X-rays, the Li-positions de-
termined from neutron diffraction34 at 413 Kare used for the analysis of the present MD sim-ulations on β-Li3PS4.
Effect of Li-vacancies and Li-interstitials
The introduction of Li-vacancies has been sug-gested to be beneficial for Li-ion conductivity inβ-Li3PS4
12, whereas the high ionic conductivityof the isostructural35 compound Li10GeP2S12
(= Li3.33Ge0.33P0.67S4) suggests that introduc-ing extra Li-ions in β-Li3PS4 can also lead toan increased Li-ion conductivity. To study theeffect of both Li-vacancies and Li-interstitialson the diffusion mechanism DFT MD simula-tions were performed for β-Li3PS4, β-Li2.75PS4,and β-Li3.25PS4 at 450, 600 and 750 K.
Li-ion diffusion
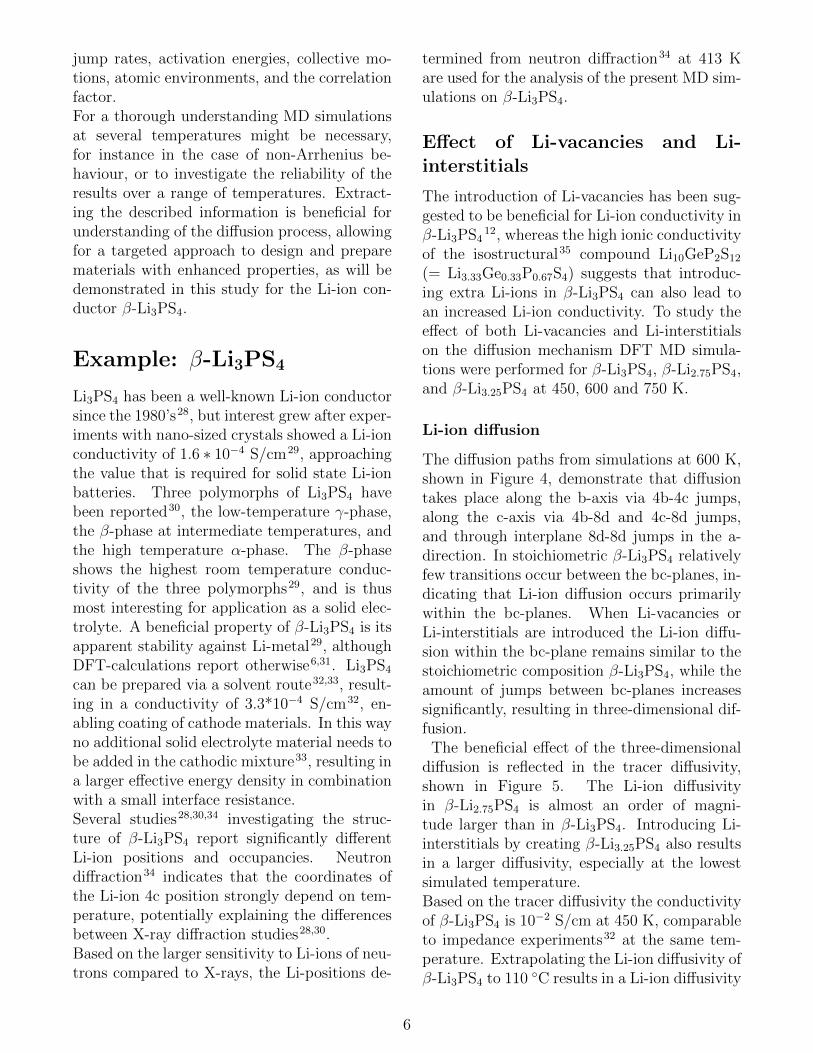
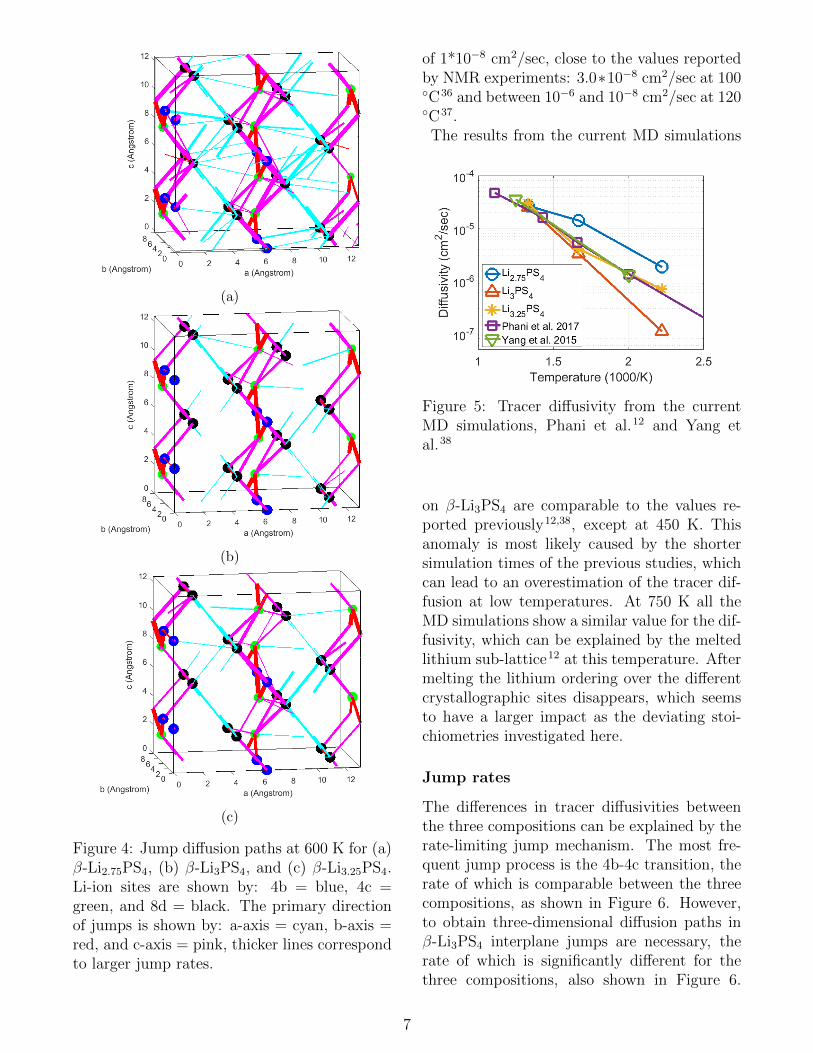
The diffusion paths from simulations at 600 K,shown in Figure 4, demonstrate that diffusiontakes place along the b-axis via 4b-4c jumps,along the c-axis via 4b-8d and 4c-8d jumps,and through interplane 8d-8d jumps in the a-direction. In stoichiometric β-Li3PS4 relativelyfew transitions occur between the bc-planes, in-dicating that Li-ion diffusion occurs primarilywithin the bc-planes. When Li-vacancies orLi-interstitials are introduced the Li-ion diffu-sion within the bc-plane remains similar to thestoichiometric composition β-Li3PS4, while theamount of jumps between bc-planes increasessignificantly, resulting in three-dimensional dif-fusion.
The beneficial effect of the three-dimensionaldiffusion is reflected in the tracer diffusivity,shown in Figure 5. The Li-ion diffusivityin β-Li2.75PS4 is almost an order of magni-tude larger than in β-Li3PS4. Introducing Li-interstitials by creating β-Li3.25PS4 also resultsin a larger diffusivity, especially at the lowestsimulated temperature.Based on the tracer diffusivity the conductivityof β-Li3PS4 is 10−2 S/cm at 450 K, comparableto impedance experiments32 at the same tem-perature. Extrapolating the Li-ion diffusivity ofβ-Li3PS4 to 110 ◦C results in a Li-ion diffusivity
6
(a)
(b)
(c)
Figure 4: Jump diffusion paths at 600 K for (a)β-Li2.75PS4, (b) β-Li3PS4, and (c) β-Li3.25PS4.Li-ion sites are shown by: 4b = blue, 4c =green, and 8d = black. The primary directionof jumps is shown by: a-axis = cyan, b-axis =red, and c-axis = pink, thicker lines correspondto larger jump rates.
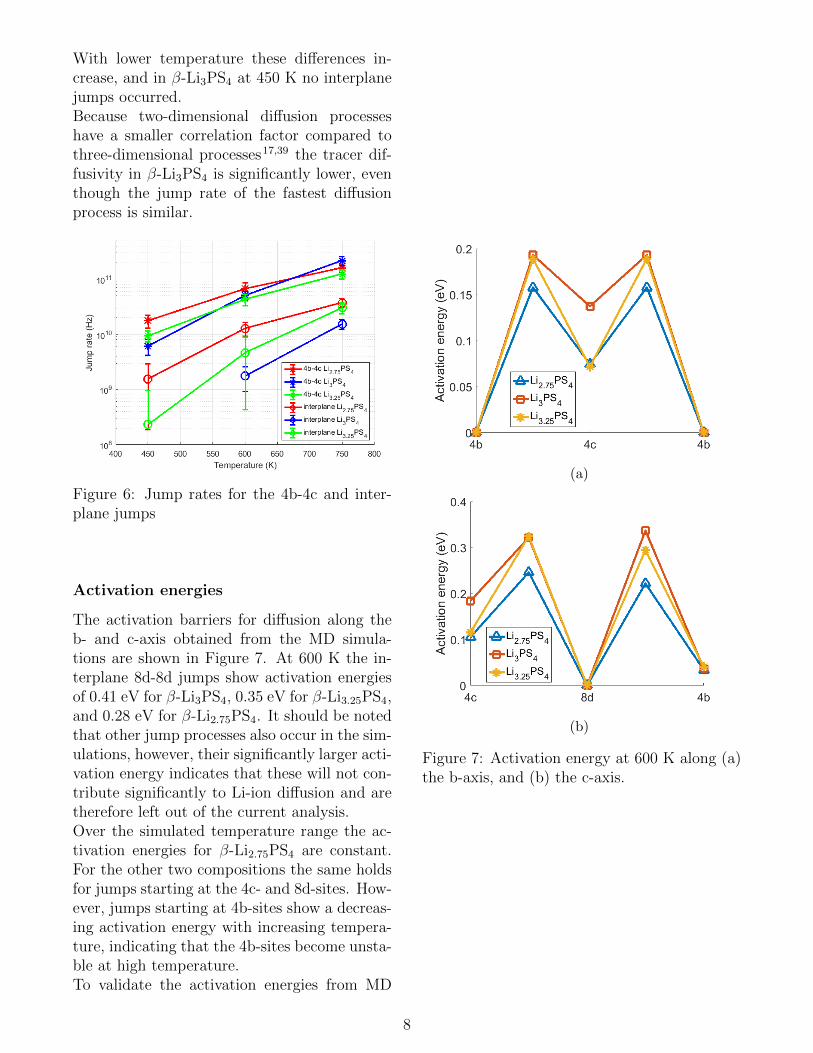
of 1*10−8 cm2/sec, close to the values reportedby NMR experiments: 3.0∗10−8 cm2/sec at 100◦C36 and between 10−6 and 10−8 cm2/sec at 120◦C37.The results from the current MD simulations
Figure 5: Tracer diffusivity from the currentMD simulations, Phani et al.12 and Yang etal.38
on β-Li3PS4 are comparable to the values re-ported previously12,38, except at 450 K. Thisanomaly is most likely caused by the shortersimulation times of the previous studies, whichcan lead to an overestimation of the tracer dif-fusion at low temperatures. At 750 K all theMD simulations show a similar value for the dif-fusivity, which can be explained by the meltedlithium sub-lattice12 at this temperature. Aftermelting the lithium ordering over the differentcrystallographic sites disappears, which seemsto have a larger impact as the deviating stoi-chiometries investigated here.
Jump rates
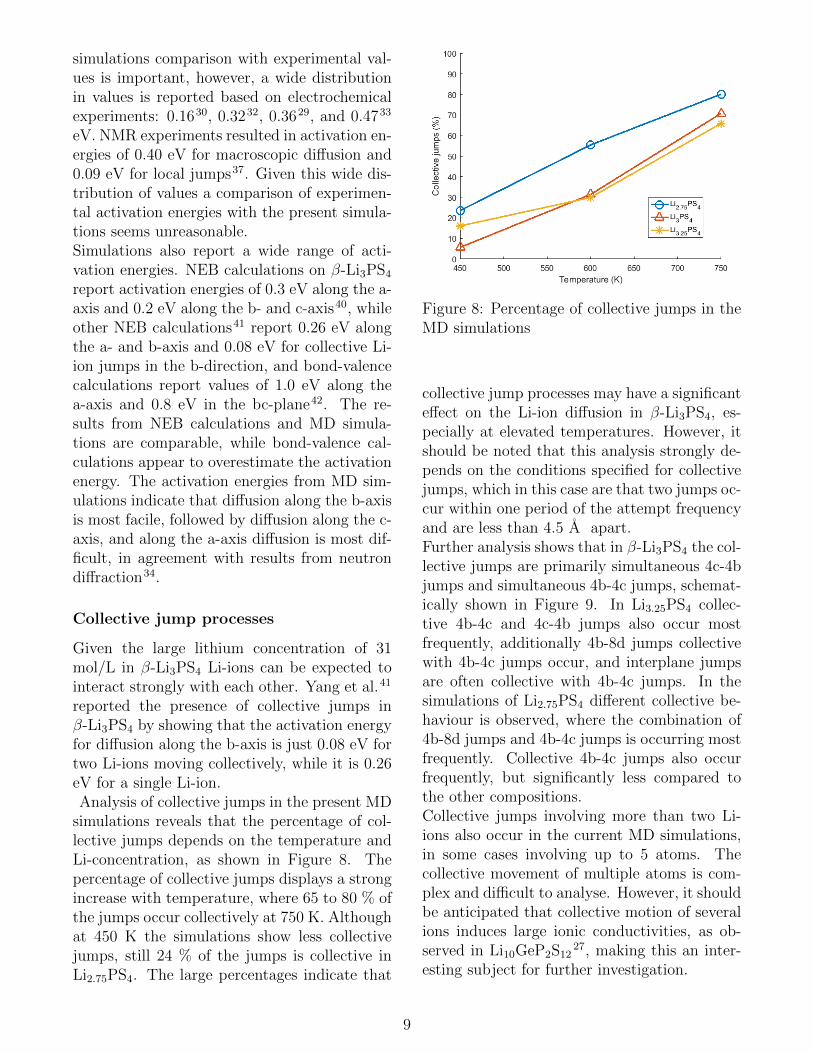
The differences in tracer diffusivities betweenthe three compositions can be explained by therate-limiting jump mechanism. The most fre-quent jump process is the 4b-4c transition, therate of which is comparable between the threecompositions, as shown in Figure 6. However,to obtain three-dimensional diffusion paths inβ-Li3PS4 interplane jumps are necessary, therate of which is significantly different for thethree compositions, also shown in Figure 6.
7
With lower temperature these differences in-crease, and in β-Li3PS4 at 450 K no interplanejumps occurred.Because two-dimensional diffusion processeshave a smaller correlation factor compared tothree-dimensional processes17,39 the tracer dif-fusivity in β-Li3PS4 is significantly lower, eventhough the jump rate of the fastest diffusionprocess is similar.
Figure 6: Jump rates for the 4b-4c and inter-plane jumps
Activation energies
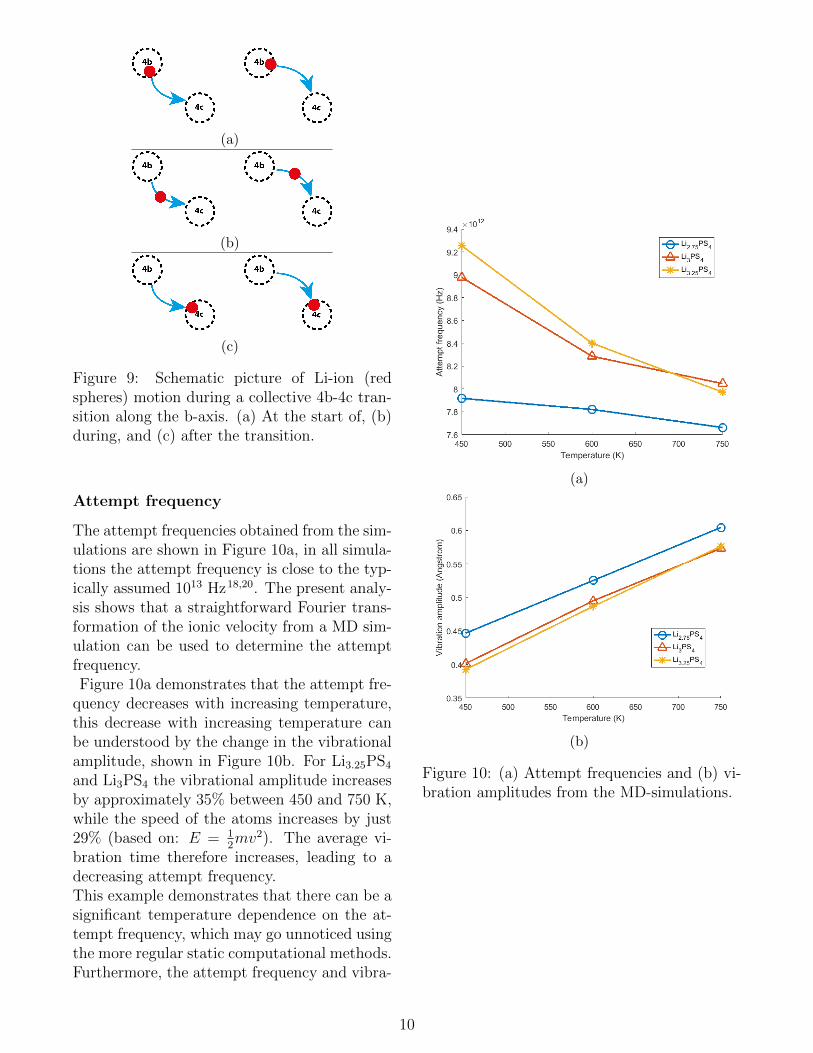
The activation barriers for diffusion along theb- and c-axis obtained from the MD simula-tions are shown in Figure 7. At 600 K the in-terplane 8d-8d jumps show activation energiesof 0.41 eV for β-Li3PS4, 0.35 eV for β-Li3.25PS4,and 0.28 eV for β-Li2.75PS4. It should be notedthat other jump processes also occur in the sim-ulations, however, their significantly larger acti-vation energy indicates that these will not con-tribute significantly to Li-ion diffusion and aretherefore left out of the current analysis.Over the simulated temperature range the ac-tivation energies for β-Li2.75PS4 are constant.For the other two compositions the same holdsfor jumps starting at the 4c- and 8d-sites. How-ever, jumps starting at 4b-sites show a decreas-ing activation energy with increasing tempera-ture, indicating that the 4b-sites become unsta-ble at high temperature.To validate the activation energies from MD
(a)
(b)
Figure 7: Activation energy at 600 K along (a)the b-axis, and (b) the c-axis.
8
simulations comparison with experimental val-ues is important, however, a wide distributionin values is reported based on electrochemicalexperiments: 0.1630, 0.3232, 0.3629, and 0.4733
eV. NMR experiments resulted in activation en-ergies of 0.40 eV for macroscopic diffusion and0.09 eV for local jumps37. Given this wide dis-tribution of values a comparison of experimen-tal activation energies with the present simula-tions seems unreasonable.Simulations also report a wide range of acti-vation energies. NEB calculations on β-Li3PS4
report activation energies of 0.3 eV along the a-axis and 0.2 eV along the b- and c-axis40, whileother NEB calculations41 report 0.26 eV alongthe a- and b-axis and 0.08 eV for collective Li-ion jumps in the b-direction, and bond-valencecalculations report values of 1.0 eV along thea-axis and 0.8 eV in the bc-plane42. The re-sults from NEB calculations and MD simula-tions are comparable, while bond-valence cal-culations appear to overestimate the activationenergy. The activation energies from MD sim-ulations indicate that diffusion along the b-axisis most facile, followed by diffusion along the c-axis, and along the a-axis diffusion is most dif-ficult, in agreement with results from neutrondiffraction34.
Collective jump processes
Given the large lithium concentration of 31mol/L in β-Li3PS4 Li-ions can be expected tointeract strongly with each other. Yang et al.41
reported the presence of collective jumps inβ-Li3PS4 by showing that the activation energyfor diffusion along the b-axis is just 0.08 eV fortwo Li-ions moving collectively, while it is 0.26eV for a single Li-ion.Analysis of collective jumps in the present MD
simulations reveals that the percentage of col-lective jumps depends on the temperature andLi-concentration, as shown in Figure 8. Thepercentage of collective jumps displays a strongincrease with temperature, where 65 to 80 % ofthe jumps occur collectively at 750 K. Althoughat 450 K the simulations show less collectivejumps, still 24 % of the jumps is collective inLi2.75PS4. The large percentages indicate that
Figure 8: Percentage of collective jumps in theMD simulations
collective jump processes may have a significanteffect on the Li-ion diffusion in β-Li3PS4, es-pecially at elevated temperatures. However, itshould be noted that this analysis strongly de-pends on the conditions specified for collectivejumps, which in this case are that two jumps oc-cur within one period of the attempt frequencyand are less than 4.5 A apart.Further analysis shows that in β-Li3PS4 the col-lective jumps are primarily simultaneous 4c-4bjumps and simultaneous 4b-4c jumps, schemat-ically shown in Figure 9. In Li3.25PS4 collec-tive 4b-4c and 4c-4b jumps also occur mostfrequently, additionally 4b-8d jumps collectivewith 4b-4c jumps occur, and interplane jumpsare often collective with 4b-4c jumps. In thesimulations of Li2.75PS4 different collective be-haviour is observed, where the combination of4b-8d jumps and 4b-4c jumps is occurring mostfrequently. Collective 4b-4c jumps also occurfrequently, but significantly less compared tothe other compositions.Collective jumps involving more than two Li-ions also occur in the current MD simulations,in some cases involving up to 5 atoms. Thecollective movement of multiple atoms is com-plex and difficult to analyse. However, it shouldbe anticipated that collective motion of severalions induces large ionic conductivities, as ob-served in Li10GeP2S12
27, making this an inter-esting subject for further investigation.
9
(a)
(b)
(c)
Figure 9: Schematic picture of Li-ion (redspheres) motion during a collective 4b-4c tran-sition along the b-axis. (a) At the start of, (b)during, and (c) after the transition.
Attempt frequency
The attempt frequencies obtained from the sim-ulations are shown in Figure 10a, in all simula-tions the attempt frequency is close to the typ-ically assumed 1013 Hz18,20. The present analy-sis shows that a straightforward Fourier trans-formation of the ionic velocity from a MD sim-ulation can be used to determine the attemptfrequency.Figure 10a demonstrates that the attempt fre-
quency decreases with increasing temperature,this decrease with increasing temperature canbe understood by the change in the vibrationalamplitude, shown in Figure 10b. For Li3.25PS4
and Li3PS4 the vibrational amplitude increasesby approximately 35% between 450 and 750 K,while the speed of the atoms increases by just29% (based on: E = 1
2mv2). The average vi-
bration time therefore increases, leading to adecreasing attempt frequency.This example demonstrates that there can be asignificant temperature dependence on the at-tempt frequency, which may go unnoticed usingthe more regular static computational methods.Furthermore, the attempt frequency and vibra-
(a)
(b)
Figure 10: (a) Attempt frequencies and (b) vi-bration amplitudes from the MD-simulations.
10
tion amplitude in Li2.75PS4 differ by approxi-mately 10% from the other simulations, show-ing that relatively small changes in the crys-tal structure can have a significant effect onthese properties. Thereby the present simula-tions and analysis indicate that considerationof the attempt frequency and its dependenceon structure and temperature is of significantimportance in quantifying and understandingionic diffusion.
Effects of doping
The MD simulations on β-Li3.25PS4 show thatcreating Li-interstitials in β-Li3PS4 inducesthree dimensional diffusion, increasing themacroscopic Li-ion conductivity, in line withexperimental work35. Li-vacancies also inducethree dimensional diffusion, and the MD simu-lations indicate significantly larger Li-ion con-ductivity compared to the introduction of Li-interstitials. However, we are unaware of workwhich has explored the impact of Li-vacancieson Li-ion diffusion in β-Li3PS4. To deter-mine the impact of introducing Li-vacanciesby doping MD simulations were performed onβ-Li2.75PS3.75Br0.25, in which two S-atoms werereplaced by Br-atoms.Additionally, the impact of oxygen doping isinvestigated, since this is also reported as astrategy to improve the Li-ion diffusivity36,42.However, O-doping does not change the Li-content, and the mechanism of higher Li-iondiffusivity by O-doping has not been revealed.To gain understanding of how oxygen dopingincreases the Li-ion diffusivity MD simulationson β-Li3PS3.75O0.25 were performed by replac-ing two S-atoms by O-atoms.
Br-doping
The jump diffusion path from the MD-simulation of β-Li2.75PS3.75Br0.25 is shown inFigure 11a. As should be anticipated from thesimulations of β-Li2.75PS4, Figure 11a showsthat Br-doping leads to three-dimensional dif-fusion paths. In β-Li2.75PS3.75Br0.25 the tracerdiffusivity results in 1.56*10−6, 1.01*10−5, and3.71*10−5 cm2/sec at 450, 600 and 750 K, re-
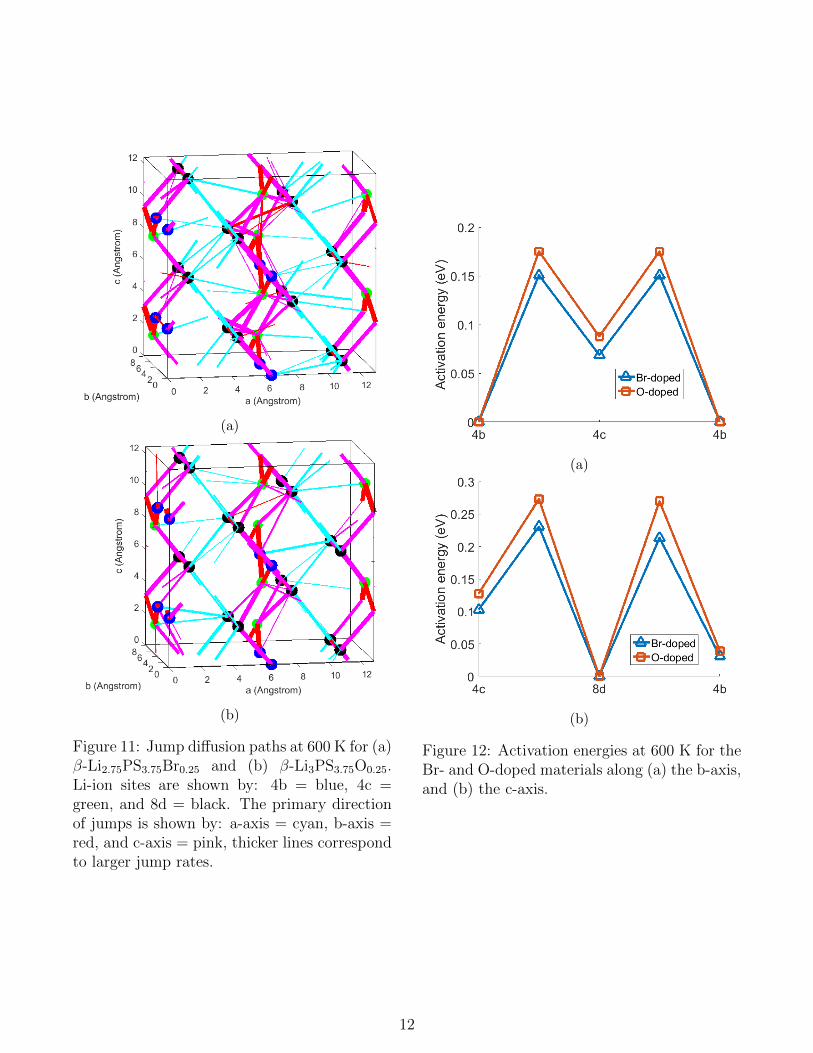
spectively, comparable to the diffusivities ofβ-Li2.75PS4. The activation energies for dif-fusion along the b- and c-axis in the Br-dopedcomposition at 600 K, shown in Figure 12, differby just 0.02 eV from the MD simulation with Li-vacancies. The activation energy for interplanejumps is 0.28 eV in both β-Li2.75PS3.75Br0.25
and β-Li2.75PS4.The similar activation energies in β-Li2.75PS4
and β-Li2.75PS3.75Br0.25 indicates that the pri-mary cause of the high Li-ion diffusivity in Br-doped β-Li3PS4 are the Li-vacancies. For otherdopants which introduce Li-vacancies similarresults are thus expected, suggesting that thereare many ways of increasing the Li-ion diffusiv-ity in β-Li3PS4.
O-doping
The jump diffusion paths from the present MD-simulations on β-Li3PS3.75O0.25, shown in Fig-ure 11b, demonstrate that O-doping also in-duces three-dimensional diffusion, as predictedby Xiao et al.42. Compared to β-Li3PS4 dopingwith oxygen leads to a larger Li-ion diffusivity,and tracer diffusivities of 6.96*10−7, 7.59*10−6,and 2.52*10−5 cm2/sec at 450, 600 and 750K, respectively. The introduction of oxygen re-sults in smaller activation energies compared toβ-Li3PS4, as shown in Figure 12. The biggestimpact is observed for the interplane jumps,which have an activation energy of just 0.32 eVin β-Li3PS3.75O0.25, comparable to the Li-richβ-Li3.25PS4.This is surprising because the introduction ofoxygen does not affect the Li-concentration.To investigate this the radial distributionfunctions (RDF’s) for oxygen and sulphur inβ-Li3PS3.75O0.25 are shown in Figure 13. Thesmaller ionic radius of oxygen43 results in asmaller O-Li distance compared to the S-Lidistance. However, the Li-density of the firstcoordination shell in the RDF is significantlylower around the O-atoms. Integrating the Li-density up to 3.5 A shows that (on average)there are 2.9 Li-atoms in the first coordinationshell of O-atoms, and 3.5 Li-atoms in the firstcoordination shell of S-atoms.This implies that it is unfavourable for Li-ions
11
(a)
(b)
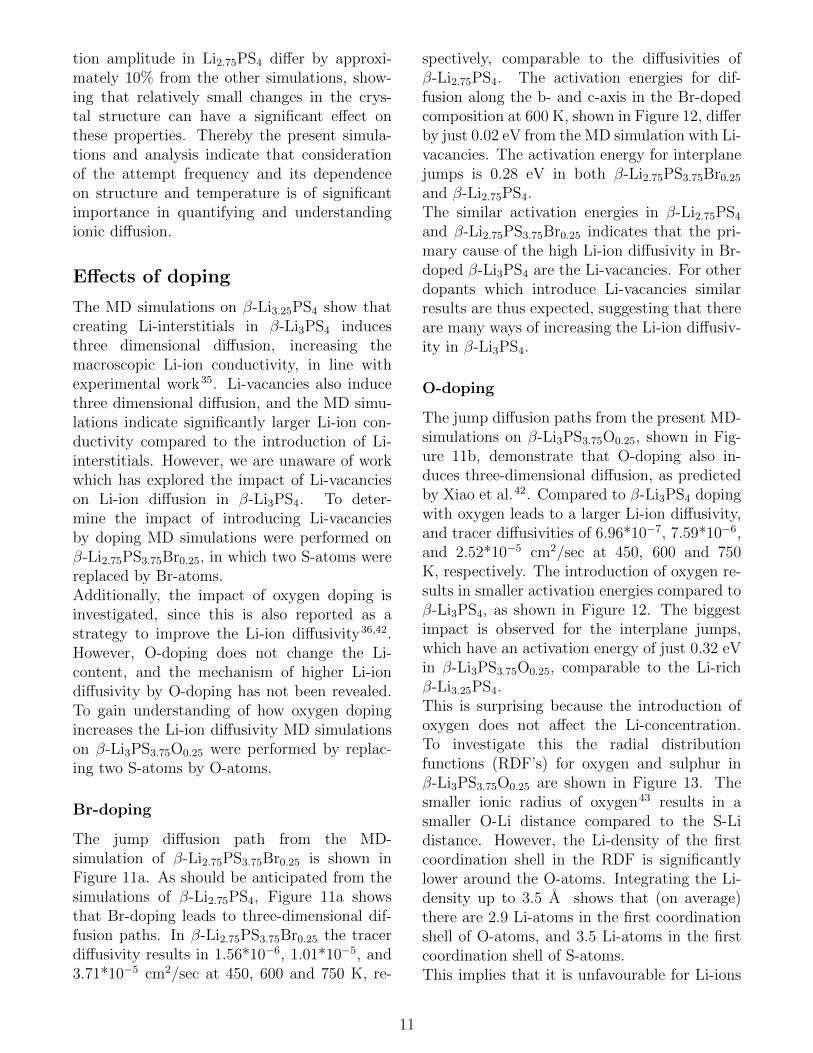
Figure 11: Jump diffusion paths at 600 K for (a)β-Li2.75PS3.75Br0.25 and (b) β-Li3PS3.75O0.25.Li-ion sites are shown by: 4b = blue, 4c =green, and 8d = black. The primary directionof jumps is shown by: a-axis = cyan, b-axis =red, and c-axis = pink, thicker lines correspondto larger jump rates.
(a)
(b)
Figure 12: Activation energies at 600 K for theBr- and O-doped materials along (a) the b-axis,and (b) the c-axis.
12
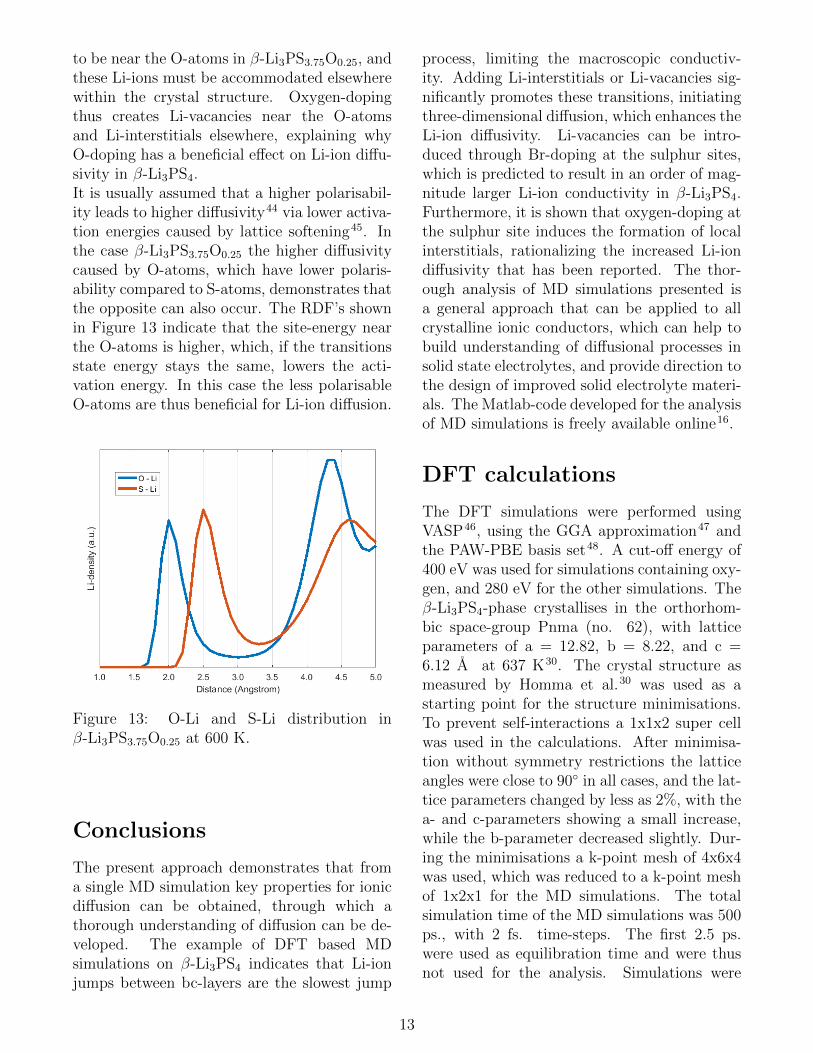
to be near the O-atoms in β-Li3PS3.75O0.25, andthese Li-ions must be accommodated elsewherewithin the crystal structure. Oxygen-dopingthus creates Li-vacancies near the O-atomsand Li-interstitials elsewhere, explaining whyO-doping has a beneficial effect on Li-ion diffu-sivity in β-Li3PS4.It is usually assumed that a higher polarisabil-ity leads to higher diffusivity44 via lower activa-tion energies caused by lattice softening45. Inthe case β-Li3PS3.75O0.25 the higher diffusivitycaused by O-atoms, which have lower polaris-ability compared to S-atoms, demonstrates thatthe opposite can also occur. The RDF’s shownin Figure 13 indicate that the site-energy nearthe O-atoms is higher, which, if the transitionsstate energy stays the same, lowers the acti-vation energy. In this case the less polarisableO-atoms are thus beneficial for Li-ion diffusion.
Figure 13: O-Li and S-Li distribution inβ-Li3PS3.75O0.25 at 600 K.
Conclusions
The present approach demonstrates that froma single MD simulation key properties for ionicdiffusion can be obtained, through which athorough understanding of diffusion can be de-veloped. The example of DFT based MDsimulations on β-Li3PS4 indicates that Li-ionjumps between bc-layers are the slowest jump
process, limiting the macroscopic conductiv-ity. Adding Li-interstitials or Li-vacancies sig-nificantly promotes these transitions, initiatingthree-dimensional diffusion, which enhances theLi-ion diffusivity. Li-vacancies can be intro-duced through Br-doping at the sulphur sites,which is predicted to result in an order of mag-nitude larger Li-ion conductivity in β-Li3PS4.Furthermore, it is shown that oxygen-doping atthe sulphur site induces the formation of localinterstitials, rationalizing the increased Li-iondiffusivity that has been reported. The thor-ough analysis of MD simulations presented isa general approach that can be applied to allcrystalline ionic conductors, which can help tobuild understanding of diffusional processes insolid state electrolytes, and provide direction tothe design of improved solid electrolyte materi-als. The Matlab-code developed for the analysisof MD simulations is freely available online16.
DFT calculations
The DFT simulations were performed usingVASP46, using the GGA approximation47 andthe PAW-PBE basis set48. A cut-off energy of400 eV was used for simulations containing oxy-gen, and 280 eV for the other simulations. Theβ-Li3PS4-phase crystallises in the orthorhom-bic space-group Pnma (no. 62), with latticeparameters of a = 12.82, b = 8.22, and c =6.12 A at 637 K30. The crystal structure asmeasured by Homma et al.30 was used as astarting point for the structure minimisations.To prevent self-interactions a 1x1x2 super cellwas used in the calculations. After minimisa-tion without symmetry restrictions the latticeangles were close to 90◦ in all cases, and the lat-tice parameters changed by less as 2%, with thea- and c-parameters showing a small increase,while the b-parameter decreased slightly. Dur-ing the minimisations a k-point mesh of 4x6x4was used, which was reduced to a k-point meshof 1x2x1 for the MD simulations. The totalsimulation time of the MD simulations was 500ps., with 2 fs. time-steps. The first 2.5 ps.were used as equilibration time and were thusnot used for the analysis. Simulations were
13
performed in the NVT ensemble, with temper-ature scaling after every 50 time-steps.
Acknowledgements
Financial support from the Advanced DutchEnergy Materials (ADEM) program of theDutch Ministry of Economic Affairs, Agricul-ture and Innovation is gratefully acknowledged.The research leading to these results has re-ceived funding from the European ResearchCouncil under the European Union’s SeventhFramework Programme (FP/2007-2013)/ERCGrant Agreement nr. [307161] of M.W. The au-thors would like to thank Tomas Verhallen andCasper Versteylen for fruitful discussions overmany cups of coffee and Alexandros Vasileiadisfor testing the Matlab code.
References
(1) Bauer, C.; Hofer, J.; Althaus, H.-J.;Del Duce, A.; Simons, A. Applied Energy2015, 157, 871–883.
(2) Lotsch, B. V.; Maier, J. J. Electroceram.2017,
(3) Placke, T.; Kloepsch, R.; Duhnen, S.;Winter, M. Journal of Solid State Electro-chemistry 2017, 21, 1939–1964.
(4) Lu, X. C.; Xia, G. G.; Lemmon, J. P.;Yang, Z. G. Journal of Power Sources2010, 195, 2431–2442.
(5) Chu, I. H.; Kompella, C. S.; Nguyen, H.;Zhu, Z.; Hy, S.; Deng, Z.; Meng, Y. S.;Ong, S. P. Sci Rep 2016, 6, 33733.
(6) Zhu, Y.; He, X.; Mo, Y. ACS Appl MaterInterfaces 2015, 7, 23685–93.
(7) Tealdi, C.; Heath, J.; Islam, M. S. J.Mater. Chem. A 2016, 4, 6998–7004.
(8) Deng, Z.; Radhakrishnan, B.; Ong, S. P.Chemistry of Materials 2015, 27, 3749–3755.
(9) de Klerk, N. J. J.; Wagemaker, M. Chem-istry of Materials 2016, 28, 3122–3130.
(10) Adelstein, N.; Wood, B. C. Chemistry ofMaterials 2016, 28, 7218–7231.
(11) Vasileiadis, A.; Wagemaker, M. Chemistryof Materials 2017, 29, 1076–1088.
(12) Phani Dathar, G. K.; Balachandran, J.;Kent, P. R. C.; Rondinone, A. J.;Ganesh, P. J. Mater. Chem. A 2017, 5,1153–1159.
(13) Yang, J.; Tse, J. S. J. Phys. Chem. A2011, 115, 13045–9.
(14) de Klerk, N. J. J.; Ros lon, I.; Wage-maker, M. Chemistry of Materials 2016,28, 7955–7963.
(15) Ganapathy, S.; Vasileiadis, A.;Heringa, J. R.; Wagemaker, M. Ad-vanced Energy Materials 2016, 1601781.
(16) de Klerk, N. J. J. MD Anal-ysis with Matlab. https://
bitbucket.org/niekdeklerk/
md-analysis-with-matlab.
(17) Friauf, R. J. J. Appl. Phys. 1962, 33, 494–505.
(18) Koettgen, J.; Zacherle, T.; Griesham-mer, S.; Martin, M. Physical chemistrychemical physics : PCCP 2017, 19, 9957–9973.
(19) Versteylen, C. D.; van Dijk, N. H.;Sluiter, M. H. F. Physical Review B 2017,96 .
(20) Van der Ven, A.; Ceder, G.; Asta, M.; Te-pesch, P. D. Physical Review B 2001, 64,184307.
(21) Chen, C.; Lu, Z.; Ciucci, F. Sci Rep 2017,7, 40769.
(22) Yu, C.; Ganapathy, S.; de Klerk, N. J. J.;van Eck, E. R. H.; Wagemaker, M. J.Mater. Chem. A 2016, 4, 15095–15105.
14
(23) Yu, C.; Ganapathy, S.; de Klerk, N. J. J.;Roslon, I.; van Eck, E. R.; Kentgens, A. P.;Wagemaker, M. J. Am. Chem. Soc. 2016,138, 11192–201.
(24) Uitz, M.; Epp, V.; Bottke, P.; Wilken-ing, M. J. Electroceram. 2017,
(25) Vineyard, G. H. J. Phys. Chem. Solids1957, 3, 121–127.
(26) He, X.; Zhu, Y.; Mo, Y. Nat Commun2017, 8, 15893.
(27) Xu, M.; Ding, J.; Ma, E. Applied PhysicsLetters 2012, 101, 031901.
(28) Mercier, R.; Malugani, J. P.; Fahys, B.;Robert, G.; Douglade, J. Acta Crystallo-graphica Section B Structural Crystallog-raphy and Crystal Chemistry 1982, 38,1887–1890.
(29) Liu, Z.; Fu, W.; Payzant, E. A.; Yu, X.;Wu, Z.; Dudney, N. J.; Kiggans, J.;Hong, K.; Rondinone, A. J.; Liang, C. J.Am. Chem. Soc. 2013, 135, 975–8.
(30) Homma, K.; Yonemura, M.;Kobayashi, T.; Nagao, M.; Hirayama, M.;Kanno, R. Solid State Ionics 2011, 182,53–58.
(31) Richards, W. D.; Miara, L. J.; Wang, Y.;Kim, J. C.; Ceder, G. Chemistry of Mate-rials 2016, 28, 266–273.
(32) Phuc, N. H. H.; Totani, M.; Morikawa, K.;Muto, H.; Matsuda, A. Solid State Ionics2016, 288, 240–243.
(33) Teragawa, S.; Aso, K.; Tadanaga, K.;Hayashi, A.; Tatsumisago, M. Journal ofMaterials Chemistry A 2014, 2, 5095.
(34) Chen, Y.; Cai, L.; Liu, Z.; delaCruz, C. R.; Liang, C.; An, K. AppliedPhysics Letters 2015, 107, 013904.
(35) Nishino, S.; Fujiwara, T.; Yamasaki, H.Physical Review B 2014, 90 .
(36) Gobet, M.; Greenbaum, S.; Sahu, G.;Liang, C. Chemistry of Materials 2014,26, 3558–3564.
(37) Hayamizu, K.; Aihara, Y.; Watanabe, T.;Yamada, T.; Ito, S.; Machida, N. SolidState Ionics 2016, 285, 51–58.
(38) Yang, J.; Tse, J. S. Computational Mate-rials Science 2015, 107, 134–138.
(39) Mehrer, H. Diffusion in solids: funda-mentals, methods, materials, diffusion-controlled processes ; Springer Science &Business Media, 2007; Vol. 155.
(40) Lepley, N. D.; Holzwarth, N. A. W.;Du, Y. A. Physical Review B 2013, 88 .
(41) Yang, Y.; Wu, Q.; Cui, Y.; Chen, Y.;Shi, S.; Wang, R. Z.; Yan, H. ACS ApplMater Interfaces 2016, 8, 25229–42.
(42) Xiao, R.; Li, H.; Chen, L. Sci Rep 2015,5, 14227.
(43) Shannon, R. D. Acta CrystallographicaSection A 1976, 32, 751–767.
(44) Bachman, J. C.; Muy, S.; Grimaud, A.;Chang, H. H.; Pour, N.; Lux, S. F.;Paschos, O.; Maglia, F.; Lupart, S.;Lamp, P.; Giordano, L.; Shao-Horn, Y.Chem. Rev. 2016, 116, 140–62.
(45) Kraft, M. A.; Culver, S. P.; Calderon, M.;Bocher, F.; Krauskopf, T.; Senyshyn, A.;Dietrich, C.; Zevalkink, A.; Janek, J.;Zeier, W. G. J. Am. Chem. Soc. 2017,139, 10909–10918.
(46) Kresse, G.; Hafner, J. Phys. Rev. B 1993,47, 558–561.
(47) Perdew, J. P.; Burke, K.; Ernzerhof, M.Phys. Rev. Lett. 1996, 77, 3865–3868.
(48) Blochl, P. E. Phys. Rev. B 1994, 50,17953–17979.
15