
AbstractHHS Public Access
35
Big GABA: Edited MR Spectroscopy at 24 Research Sites A full list of authors and affiliations appears at the end of the article. Abstract Magnetic resonance spectroscopy (MRS) is the only biomedical imaging method that can noninvasively detect endogenous signals from the neurotransmitter γ-aminobutyric acid (GABA) in the human brain. Its increasing popularity has been aided by improvements in scanner hardware and acquisition methodology, as well as by broader access to pulse sequences that can selectively detect GABA, in particular J-difference spectral editing sequences. Nevertheless, implementations of GABA-edited MRS remain diverse across research sites, making comparisons between studies challenging. This large-scale multi-vendor, multi-site study seeks to better understand the factors that impact measurement outcomes of GABA-edited MRS. An international consortium of 24 research sites was formed. Data from 272 healthy adults were acquired on scanners from the three major MRI vendors and analyzed using the Gannet processing pipeline. MRS data were acquired in the medial parietal lobe with standard GABA+ and macromolecule- (MM-) suppressed GABA editing. The coefficient of variation across the entire cohort was 12% for GABA+ measurements and 28% for MM-suppressed GABA measurements. A multilevel analysis revealed that most of the variance (72%) in the GABA+ data was accounted for by differences between participants within-site, while site-level differences accounted for comparatively more variance (20%) than vendor-level differences (8%). For MM-suppressed GABA data, the variance was distributed equally between site- (50%) and participant-level (50%) differences. The findings show that GABA+ measurements exhibit strong agreement when implemented with a standard protocol. There is, however, increased variability for MM-suppressed GABA measurements that is attributed in part to differences in site-to-site data acquisition. This study’s protocol establishes a framework for future methodological standardization of GABA-edited MRS, while the results provide valuable benchmarks for the MRS community. Keywords Editing; GABA; MEGA-PRESS; MRS; Multi-site study 1. Introduction Magnetic resonance spectroscopy (MRS) is unique amongst the neuroimaging modalities in detecting endogenous signals from complex molecules in the brain noninvasively. Of * Corresponding author: Richard A. E. Edden, Division of Neuroradiology, Park 367H, The Johns Hopkins University School of Medicine, 600 N Wolfe St, Baltimore, MD 21287, [email protected]. Publisher's Disclaimer: This is a PDF file of an unedited manuscript that has been accepted for publication. As a service to our customers we are providing this early version of the manuscript. The manuscript will undergo copyediting, typesetting, and review of the resulting proof before it is published in its final citable form. Please note that during the production process errors may be discovered which could affect the content, and all legal disclaimers that apply to the journal pertain. HHS Public Access Author manuscript Neuroimage. Author manuscript; available in PMC 2018 October 01. Published in final edited form as: Neuroimage. 2017 October 01; 159: 32–45. doi:10.1016/j.neuroimage.2017.07.021. Author Manuscript Author Manuscript Author Manuscript Author Manuscript
Transcript of AbstractHHS Public Access
Big GABA: Edited MR Spectroscopy at 24 Research Sites
A full list of authors and affiliations appears at the end of the article.
Abstract
Magnetic resonance spectroscopy (MRS) is the only biomedical imaging method that can
noninvasively detect endogenous signals from the neurotransmitter γ-aminobutyric acid (GABA)
in the human brain. Its increasing popularity has been aided by improvements in scanner hardware
and acquisition methodology, as well as by broader access to pulse sequences that can selectively
detect GABA, in particular J-difference spectral editing sequences. Nevertheless, implementations
of GABA-edited MRS remain diverse across research sites, making comparisons between studies
challenging. This large-scale multi-vendor, multi-site study seeks to better understand the factors
that impact measurement outcomes of GABA-edited MRS. An international consortium of 24
research sites was formed. Data from 272 healthy adults were acquired on scanners from the three
major MRI vendors and analyzed using the Gannet processing pipeline. MRS data were acquired
in the medial parietal lobe with standard GABA+ and macromolecule- (MM-) suppressed GABA
editing. The coefficient of variation across the entire cohort was 12% for GABA+ measurements
and 28% for MM-suppressed GABA measurements. A multilevel analysis revealed that most of
the variance (72%) in the GABA+ data was accounted for by differences between participants
within-site, while site-level differences accounted for comparatively more variance (20%) than
vendor-level differences (8%). For MM-suppressed GABA data, the variance was distributed
equally between site- (50%) and participant-level (50%) differences. The findings show that
GABA+ measurements exhibit strong agreement when implemented with a standard protocol.
There is, however, increased variability for MM-suppressed GABA measurements that is
attributed in part to differences in site-to-site data acquisition. This study’s protocol establishes a
framework for future methodological standardization of GABA-edited MRS, while the results
provide valuable benchmarks for the MRS community.
Keywords
Editing; GABA; MEGA-PRESS; MRS; Multi-site study
1. Introduction
Magnetic resonance spectroscopy (MRS) is unique amongst the neuroimaging modalities in
detecting endogenous signals from complex molecules in the brain noninvasively. Of
*Corresponding author: Richard A. E. Edden, Division of Neuroradiology, Park 367H, The Johns Hopkins University School of Medicine, 600 N Wolfe St, Baltimore, MD 21287, [email protected].
Publisher's Disclaimer: This is a PDF file of an unedited manuscript that has been accepted for publication. As a service to our customers we are providing this early version of the manuscript. The manuscript will undergo copyediting, typesetting, and review of the resulting proof before it is published in its final citable form. Please note that during the production process errors may be discovered which could affect the content, and all legal disclaimers that apply to the journal pertain.
HHS Public AccessAuthor manuscriptNeuroimage. Author manuscript; available in PMC 2018 October 01.
Published in final edited form as:Neuroimage. 2017 October 01; 159: 32–45. doi:10.1016/j.neuroimage.2017.07.021.
Author M
anuscriptA
uthor Manuscript
Author M
anuscriptA
uthor Manuscript
particular interest is the detection and measurement of γ-aminobutyric acid (GABA), the
major inhibitory neurotransmitter in the mammalian brain (McCormick, 1989). Healthy
brain function relies on GABAergic inhibitory processes, and understanding GABAergic
mechanisms in both healthy and pathological brain function has been one core focus of
neuroscience. MRS measurements of GABA have been associated with individual
differences in hemodynamic and electrophysiological signals (Donahue et al., 2010; Hu et
al., 2013; Kapogiannis et al., 2013; Muthukumaraswamy et al., 2009) and a number of
measures of cognition (Fujihara et al., 2015; Shibata et al., 2017; Yoon et al., 2016) and
behavior (Boy et al., 2011; Greenhouse et al., 2017; Puts et al., 2011; Silveri et al., 2013).
Differential levels of GABA have been observed in a number of neuropsychiatric disorders,
such as schizophrenia (Kegeles et al., 2012; Öngür et al., 2010; Rowland et al., 2016; Yoon
et al., 2010) and depression (Bhagwagar et al., 2008; Hasler et al., 2007; Price et al., 2009),
neurodevelopmental disorders such as autism spectrum disorder (Drenthen et al., 2016;
Gaetz et al., 2014; Puts et al., 2016) and attention deficit hyperactivity disorder (Bollmann et
al., 2015; Edden et al., 2012a), and neurological diseases, such as Parkinson’s disease (Emir
et al., 2012), amyotrophic lateral sclerosis (Foerster et al., 2012; Foerster et al., 2013) and
diabetic neuropathy (Petrou et al., 2012).
The most common MRS approach for detecting the GABA signal is the Mescher– Garwood
(MEGA) editing sequence (Mescher et al., 1998), a J-difference spectral editing technique
that is typically implemented within a point resolved spectroscopy (PRESS) (Bottomley,
1987) acquisition. MEGA-PRESS and other spectral editing techniques exploit the known
scalar coupling properties of molecules in order to separate their associated signals from the
overlapping signals of other molecules. For lower-concentration metabolites such as GABA,
spectral editing differentiates the weak signals of interest from the stronger, overlapping
signals of higher-concentration metabolites. Difference editing techniques in particular use
frequency-selective inversion pulses to achieve this (for methodological reviews, see Harris
et al., 2017; Puts and Edden, 2012). The popularity of MEGA-PRESS is attributed to a
number of factors, including the wide availability of the basic PRESS sequence across
scanner platforms, its relatively straightforward implementation (Mullins et al., 2014), its
reproducibility (Bogner et al., 2010; Brix et al., 2017; Geramita et al., 2011; Mikkelsen et
al., 2016a; Near et al., 2014; O’Gorman et al., 2011; Shungu et al., 2016) and continued
development of acquisition methodology and data processing tools (Chan et al., 2016; Edden
et al., 2014).
However, despite these positive attributes, the diversity of implementations of MEGA-
PRESS across research sites and vendors has meant that comparing data between different
studies is difficult. For instance, pulse sequence parameters, and in particular pulse timings,
differ between vendor-specific PRESS sequences and lead to subtle but important
differences in the resolved GABA signal (Near et al., 2013b). Moreover, spectral editing of
GABA is associated with a number of complexities, including TE-dependent J-evolution of
the GABA spin system (Edden et al., 2012b), frequency and spatial effects of volume
localization (Edden and Barker, 2007; Kaiser et al., 2008), sensitivity to B0 field frequency
offsets (Edden et al., 2016; Harris et al., 2014) and contamination from co-edited
macromolecules (MM) (Henry et al., 2001; Rothman et al., 1993). It is generally assumed
Mikkelsen et al. Page 2
Neuroimage. Author manuscript; available in PMC 2018 October 01.
Author M
anuscriptA
uthor Manuscript
Author M
anuscriptA
uthor Manuscript
that these factors limit the degree to which a GABA-edited measurement from one site can
be compared to another at a different site.
In order to establish the extent to which site-, sequence- and vendor-specific differences
impact quantitative MEGA-PRESS measurement outcomes, a multi-vendor, multi-site
dataset has been assembled by an international consortium of GABA-edited MRS users. The
consortium was formed with the aim of building a normative database of MEGA-PRESS
data acquired on the major MRI scanner platforms at a range of imaging centers focused on
neuroscience research. This dataset aims to capture some of the diversity of the sequences
used, but within the framework of a standardized study design and acquisition protocol that
would reflect typical MEGA-PRESS parameters. This approach reduced the number of
confounding variables present within the dataset (e.g., standardizing key parameters such as
TE, TR and editing pulse bandwidth), while maintaining diversity at the level of pulse
sequence implementation (e.g., localization pulse waveforms/bandwidths, pulse timings and
crusher gradient schemes).
This paper presents initial results from this multi-site study, focusing on how variance in
creatine-referenced GABA measurements was distributed across research sites and scanner
vendors and examining the influence of various acquisition- and participant-related effects.
Given the complexity of this dataset, it is not possible to report on all aspects of the project
in a single article, so for example, water-referenced quantification (including tissue-
dependent correction factors) and site-to-site differences in voxel placement fidelity and
segmentation will be presented in a future report.
2. Methods
2.1 Data collection
A consortium of 24 research institutions based in nine countries participated in this
initiative, with each site contributing 5–12 datasets collected from consenting adult
volunteers. Specific guidelines for each site’s participant cohort were: 18–35 years old;
approximately 50:50 female/male split; no known neurological or psychiatric illness. In
total, data from 272 participants were collected. Participant demographics are provided in
Table 1. Scanning was conducted in accordance with ethical standards set by the institutional
review board (IRB) at each site, including the sharing of anonymized data. Anonymized data
files were shared securely with and analyzed by consortium members at the Johns Hopkins
University School of Medicine with local IRB approval.
2.2 Data acquisition
Each site acquired MEGA-PRESS data on a 3 T scanner by following a standard scan
protocol as closely as possible. Eight sites used GE scanners, nine used Philips scanners and
seven used Siemens scanners, with locally available phased-array head coils (see Table 2).
Two MRS acquisitions were run: a standard GABA+-edited acquisition where ON editing
pulses were placed at 1.9 ppm and OFF editing pulses were placed at 7.46 ppm; and an MM-
suppressed GABA-edited acquisition where the editing pulses were placed symmetrically
about the MM resonance at 1.7 ppm (ON/OFF = 1.9/1.5 ppm) (Henry et al., 2001). GE site 6
Mikkelsen et al. Page 3
Neuroimage. Author manuscript; available in PMC 2018 October 01.
Author M
anuscriptA
uthor Manuscript
Author M
anuscriptA
uthor Manuscript
(G6) did not acquire MM-suppressed data. For the sequences used in this study, GE and
Philips editing pulse offsets are calculated assuming a water frequency of 4.68 ppm and
Siemens assumes 4.7 ppm. Given that GABA editing involves the use of frequency-selective
editing pulses, their inversion frequency bandwidth has a significant impact on editing
efficiency, determining the extent of MM co-editing in GABA+ acquisitions and the extent
of GABA nulling in symmetric MM suppression (see Edden et al., 2016; Harris et al., 2014;
Terpstra et al., 2002). For GE and Philips implementations where editing pulse duration is
specified, editing pulse duration was set to 15 ms for the GABA+ acquisition and 20 ms for
the MM-suppressed GABA acquisition. This equated to inversion bandwidths at full-width
half-maximum (FWHM) of 81.7/82.5 Hz (GE/Philips) for the GABA+ acquisition and
61.3/61.9 Hz (GE/Philips) for the MM-suppressed GABA acquisition. For Siemens
implementations, where the editing pulse bandwidth specified on the scanner does not
correspond to the FWHM bandwidth (Lange et al., 2016), FWHM bandwidths were 82.4 Hz
for the GABA+ acquisition and 61.8 Hz for the MM-suppressed GABA acquisition. The TE
of the GABA+ acquisition was set to 68 ms. For the MM-suppressed acquisition, the TE was
set to 80 ms on the GE and Philips platforms (Edden et al., 2012c) and to 68 ms on the
Siemens platform. The higher peak B1 on some Siemens platforms makes the more selective
editing pulses possible without increasing the TE. For one Siemens site (S2), the TE of the
MM-suppressed acquisition was increased to 80 ms due to limited peak B1. Representative
vendor-specific MEGA-PRESS pulse sequence diagrams (at TE = 68 ms) are shown in Fig.
1A. Parameters common between the two acquisitions included: TR = 2000 ms; 320
averages (i.e., 160 ON and 160 OFF transients); ~10 min scan time. Although the spectral
width and number of discrete data points differed from site to site (see Table 2), in all cases
the aim was to achieve a data acquisition time of ~1 s. All Philips sites except P8 addressed
B0 field offsets with prospective frequency correction based on interleaved water referencing
(Edden et al., 2016). Specifically, for every 40 water-suppressed acquisitions, a water-
unsuppressed acquisition was performed and used to correct the center frequency in real-
time. This method was only available on the Philips platform at the time of data collection.
Details of B0 shimming approaches are provided in Table 2. All three vendors use a volume-
localized acquisition for center frequency calibration. They differ somewhat in terms of
localization method (e.g., STEAM on Siemens and semi-LASER on Philips) and acquisition
resolution; both GE and Philips suppress fat signals to make algorithmic determination of
center frequency more robust. GE data were saved in P-file format, Philips data were saved
in SDAT/SPAR format and Siemens data were saved in TWIX format.
All MEGA-PRESS data were acquired from a 30 × 30 × 30 mm3 voxel placed in the medial
parietal lobe (Fig. 1B). All sites followed the same protocol, using a guideline image, for
voxel placement. Briefly, the voxel was rotated in the sagittal plane to align it with a line
connecting the genu and splenium of the corpus callosum. Each site was instructed to
comply with the standardized protocol, but also to avoid ventricles and/or the outer surfaces
of the brain when necessary to ensure good data quality.
2.3 Data processing
Data from each site were processed in Gannet (Edden et al., 2014) using the software’s
automated analysis pipeline with some in-house customization for this study. Raw time-
Mikkelsen et al. Page 4
Neuroimage. Author manuscript; available in PMC 2018 October 01.
Author M
anuscriptA
uthor Manuscript
Author M
anuscriptA
uthor Manuscript
domain data were first corrected for frequency and phase errors by spectral registration
(Near et al., 2015) using the transient 10% into the acquisition (i.e., the 32nd transient) as a
reference. ON/OFF transient pairs were rejected from further processing if either of their
corresponding frequency/phase offset estimates were greater than 3 standard deviations
(SDs) from the mean of frequency/phase offset estimates for all pre-corrected transients. A
threshold of 3 SDs corresponds to 99.7% of (normally distributed) frequency/phase
estimates. ON/OFF transient pairs exceeding this threshold would be expected to introduce
more uncertainty into the data (Waddell et al., 2007) and were therefore removed. The data
were then filtered using a 3-Hz exponential weighting function and zero-filled so as to yield
a nominal spectral resolution of 0.061 Hz/point upon fast Fourier transformation. Individual
ON and OFF subspectra were then averaged and subtracted to produce the edited difference
(DIFF) spectrum.
Data were visually inspected for spectral artifacts, specifically lipid contamination,
subtraction errors and a non-constant baseline. Individual datasets were rejected if the signal
fitting routine (details below) was compromised. For instance, significant lipid
contamination can distort the baseline around the 3.0 ppm GABA signal, such that the
modeling algorithm converges on a clearly incorrect solution. In such cases, the data were
removed from further analysis. Quantitative data quality metrics were also measured,
including N-acetylaspartate (NAA) and GABA signal-to-noise ratios (SNR), linewidth and
average center frequency offset . SNR estimates were measured as the amplitude of the
given modeled signal (either NAA in the averaged OFF spectrum, fit with a Lorentzian
function, or GABA in the DIFF spectrum) divided by twice the SD of the noise signal.
Estimating noise using a consistent methodology across the whole dataset proved
surprisingly challenging. Examination of the downfield portion (> 8 ppm) of the frequency-
domain data revealed signal artifacts in some datasets, likely a result of suboptimal water
suppression. Therefore, the following algorithm was employed to estimate artifact-free
noise. First, two independent segments of the OFF or DIFF spectrum, 10–11 ppm and 11–12
ppm, were detrended using a second-order polynomial function and the SD of each
detrended segment was then calculated. Detrending is required to remove baseline artifacts
(often related to the water signal). The lesser of the two residuals was assumed to be the
better estimate of noise in each spectrum. The NAA and GABA signal amplitudes were then
divided by twice the respective SD of noise. This approach ensured that variations in
baseline and signal-related artifacts did not bias SNR measurements. Linewidth was
measured as the FWHM of the modeled NAA signal. was calculated as the mean (over
the course of the acquisition) difference between the observed frequency of the residual
water signal in the pre-frequency-corrected subspectra and the nominal water frequency at
δ0 4.68 ppm. It should be noted that using the mean of offset differences does not fully
characterize center frequency offsets but is a useful heuristic.
2.4 Quantification
The DIFF spectrum was modeled between 2.79 and 4.10 ppm with a three-Gaussian
function with a nonlinear baseline to quantify the 3.0 ppm GABA signal and 3.75 ppm
glutamate + glutamine (Glx) signals using nonlinear least-squares fitting. The OFF spectrum
was modeled between 2.6 and 3.6 ppm with a two-Lorentzian model to quantify creatine
Mikkelsen et al. Page 5
Neuroimage. Author manuscript; available in PMC 2018 October 01.
Author M
anuscriptA
uthor Manuscript
Author M
anuscriptA
uthor Manuscript
(Cr) as an internal reference signal. GABA measurements derived from the GABA+ and
MM-suppressed GABA acquisitions were quantified as signal integral ratios: IGABA/ICr,
where IGABA is the integral of the modeled 3.0 ppm GABA signal and ICr is the integral of
the modeled 3.0 ppm Cr signal. No signal scaling factors were applied. Measurements are
denoted GABA+/Cr and MM-suppressed GABA/Cr. Fit quality for each model (εGABA, εCr)
was assessed by normalizing the SD of the model residuals to the amplitude of the respective
modeled signal. For GABA, the residuals were limited to the frequency range between 2.79
and 3.55 ppm. Overall fit error was then defined as .
2.5 Statistical analysis
The data had a nested structure. That is, each participant was scanned at one site and each
site had a scanner manufactured by one of the three vendors. Therefore, a multilevel model
(Hayes, 2006; Peugh, 2010; Snijders and Bosker, 2012) was used for the primary statistical
analysis. This approach involves the use of a linear mixed-effects model, an extension of the
well-known general linear model, but one which explicitly takes into account systematic
effects ascribed to the hierarchical structure of data.
The principal aim of this study was to examine vendor-, site- and participant-related effects
on measurement outcomes of GABA-edited MRS. This was achieved by fitting a three-level
unconditional linear mixed-effects model to the GABA+ and MM-suppressed GABA data:
[1]
where yijk is the observed GABA measurement for participant i at site j on a scanner
manufactured by vendor k, β0 is the model intercept (the grand mean), v0k is the level-3
random effect of vendor, s0jk is the level-2 random effect of site and pijk is the level-1
random effect of participant (the residual error). The random effects are assumed to follow a
normal distribution with zero mean and constant variance. Since the total variance in the
model is equal to the sum of the variance attributed to the three effects, it follows that
vendor-, site- and participant-level variance partition coefficients (VPCs) can be respectively
calculated as:
Mikkelsen et al. Page 6
Neuroimage. Author manuscript; available in PMC 2018 October 01.
Author M
anuscriptA
uthor Manuscript
Author M
anuscriptA
uthor Manuscript
[2]
[3]
[4]
Each VPC represents the proportion of total variance in the data accounted for by the
specific random effect in the model (Goldstein et al., 2002), in this case, vendor, site and
participant.
Secondary multilevel analyses were also performed where fixed effects (predictors) were
tested to account for variance attributed to acquisition- and participant-related effects. In this
study, the effects of linewidth, NAA SNR, , age and sex on GABA measurement
outcome were tested. Such a conditional model with a single predictor is formulated as:
[5]
This model includes an explanatory variable (x1ijk) with a grand mean slope (β1) and by-
vendor and by-site random intercepts (v0k, s0jk) and random slopes (v1k, s1jk). At the vendor
level, the random effects v0k and v1k are assumed to follow a bivariate normal distribution
with zero means, variances and and covariance σv01. The covariance denotes the
correlation between the predictor slopes and intercepts. The same definitions apply to the
site-level parameters s0jk, s1jk, , and σs01. In this model, both the by-vendor and by-
site intercepts and slopes of the explanatory variable are allowed to vary across each level.
This “maximal” approach has been shown to reduce Type I error rates in linear mixed-
effects models (Barr et al., 2013).
Mikkelsen et al. Page 7
Neuroimage. Author manuscript; available in PMC 2018 October 01.
Author M
anuscriptA
uthor Manuscript
Author M
anuscriptA
uthor Manuscript
Linear mixed-effects models were fit in R (version 3.3.3; R Core Team, 2017) using the
lme4 package (Bates et al., 2015) and maximum likelihood for model estimation. The
outcome and continuous explanatory variables were standardized (by z-transformation) to
aid model convergence and interpretability of model parameter estimates (Schielzeth, 2010).
Goodness-of-fit was calculated as a log-likelihood statistic (−2logL). To test for significant
random or fixed effects, chi-square likelihood ratio tests were performed by comparing the
log-likelihood statistic of one model to that of a reduced model (i.e., a model excluding the
random or fixed effect of interest). Likelihood ratio tests were bootstrapped 2,000 times
using a parametric bootstrap method (Halekoh and Højsgaard, 2014). If an effect was
significant, it was retained in the next assessed model; if not, it was removed. Specifically,
the effects of vendor and site were tested first, the effects of acquisition-related variables
(linewidth, NAA SNR, ) were tested second and the effects of participant-related
variables (age, sex) were tested last.
A Pearson correlation coefficient was calculated to test the relationship between
participants’ GABA+/Cr and MM-suppressed GABA/Cr values. This was done by using the
residuals of the respective linear mixed-effects model that included only the effects that
accounted for a significant amount of variance in either dataset. To illustrate the importance
of accounting for systematic effects in the data, a correlational test was also conducted on
the raw GABA+/Cr and MM-suppressed GABA/Cr values. The correlations were
bootstrapped 10,000 times to produce 95% confidence intervals (CIs) using the bias-
corrected and accelerated nonparametric bootstrap method (DiCiccio and Efron, 1996). For
all inferential statistical tests, a p-value less than 0.05 was considered significant.
Corrections for multiple comparisons were not applied.
3. Results
GABA-edited MRS data were successfully acquired at all 24 sites. Following quality control
analysis, seven GABA+ and 19 MM-suppressed GABA datasets (3% and 7% of the total
collected data for either acquisition, respectively) were removed from further analysis. All
MM- suppressed GABA data from site G3 were excluded as consistent, excessive center
frequency offsets (approximately −0.1 ppm on average) resulted in extremely small or
absent GABA signals. Fig. 2 shows the mean ± 1 SD GABA+ and MM-suppressed GABA
DIFF spectra for each vendor. Examples of the GABA+Glx signal fitting on individual
acquisitions are provided in Fig. S1. Distinctive edited GABA peak lineshapes were seen for
each vendor, likely a consequence of the different implementations of the MEGA-PRESS
sequences between each vendor (Near et al., 2013b). GABA+/Cr and MM-suppressed
GABA/Cr values, broken down by site and by vendor, are shown in Fig. 3. Mean ± 1 SD
GABA+/Cr values were 0.123 ± 0.014 for GE, 0.111 ± 0.013 for Philips and 0.116 ± 0.012
for Siemens. Across all sites and vendors, GABA+/Cr was 0.116 ± 0.014. Coefficients of
variation (CVs) were 11.5%, 11.6%, and 10.7% for GE, Philips and Siemens, and 12.0%
across all vendors. The mean within-site CV was 9.5%. Mean MM-suppressed GABA/Cr
values (and CVs) were 0.043 ± 0.013 (29.6%) for GE, 0.044 ± 0.014 (30.7%) for Philips and
0.041 ± 0.007 (17.3%) for Siemens, and 0.043 ± 0.012 (27.6%) across all sites and vendors.
The mean within-site CV was 18.8%. The average ratio between MM-suppressed GABA/Cr
Mikkelsen et al. Page 8
Neuroimage. Author manuscript; available in PMC 2018 October 01.
Author M
anuscriptA
uthor Manuscript
Author M
anuscriptA
uthor Manuscript
and GABA+/Cr was 0.38 ± 0.11. Site-level GABA+/Cr and MM-suppressed GABA/Cr
values are listed in Table 3.
Fig. 4 shows the distribution of data quality metrics, by site and by vendor, with numerical
values also included in Table 3. Mean vendor fit error ranged from 5–6% for GABA+
editing and 7–9% for MM-suppressed GABA editing (Fig. 4A). NAA linewidth was within
acceptable ranges for 3 T MRS, and approximately equal between the two edited
acquisitions (overall: 8.10 Hz [GABA+] vs. 8.07 Hz [MM-suppressed GABA]) (Fig. 4B).
The Philips data, however, showed lower linewidths on average over both acquisitions (7.73
Hz) compared to the GE (8.56 Hz; pairwise comparison: p < 0.001) and Siemens (8.09 Hz;
pairwise comparison: p < 0.01) data. NAA SNR estimates were also consistent across
acquisition type (overall: 447 [GABA+] vs. 439 [MM-suppressed GABA]), though some
sites’ data exhibited relatively higher SNR values (Fig. 4C). This was most likely driven by
differences in RF coil hardware. GABA SNR estimates were mostly consistent within
acquisition type (Fig. 4D), with site-to-site variability tending to match the site-to-site
variability in NAA SNR estimates. Average frequency offset varied to a degree across
sites, with all Philips sites except P8 having relatively low offset due to the employment of
frequency correction during data acquisition (Fig. 4E). As can be seen in Figs. 5A and S2A,
the pattern of center frequency offset during acquisition was dominated by random effects
and linear drift. In the case of Philips sites, there were additional regular corrections due to
real-time center frequency updates. Occasional step-changes or spikes were observed due to
participant motion, but these were relatively minor features. The median within-participant
standard deviation of estimated phase offsets (averaged across acquisition type) was 2.74
degrees (GE), 1.09 degrees (Philips) and 5.93 degrees (Siemens).
3.1 Multilevel analyses
Summaries of the linear mixed-effects models for the GABA+ and MM-suppressed GABA
data are given in Tables S1 and S2. The initial unconditional multilevel analysis revealed
significant effects of vendor [χ2(1) = 2.95, pboot = 0.02] and site [χ2(1) = 27.93, pboot <
0.001] on GABA+/Cr measurements. For the MM-suppressed GABA data, site effects were
significant [χ2(1) = 111.49, pboot = 0.001] but vendor effects were not [χ2(1) < 0.1, pboot =
0.60]. The nonsignificant effect of vendor can be better understood by noticing that there
was a strong overlap of the vendor-level distributions of MM-suppressed GABA/Cr as
shown in Fig. 3B. Consequently, the vendor-level random effect was removed from
subsequent models with the MM-suppressed data to simplify model fitting. The variance
partition coefficients (VPCs) for the unconditional model of the GABA+ dataset showed that
out of the total variance, 8.2% was attributed to vendor-level differences, 19.7% was
attributed to site-level differences and 72.1% was attributed to participant-level differences.
In the MM-suppressed GABA data, 50.4% of the total variance was attributed to site-level
differences and 49.6% was attributed to participant-level differences.
Results of the secondary multilevel analyses showed no significant effects of linewidth or
NAA SNR on GABA+/Cr [χ2(5) = 3.30, pboot = 0.31 and χ2(5) = 0.25, pboot = 0.95,
respectively] or on MM-suppressed GABA/Cr [χ2(3) = 0.08, pboot = 0.98 and χ2(3) = 5.32,
pboot = 0.10, respectively]. Average frequency offset was, however, significantly
Mikkelsen et al. Page 9
Neuroimage. Author manuscript; available in PMC 2018 October 01.
Author M
anuscriptA
uthor Manuscript
Author M
anuscriptA
uthor Manuscript
associated with both GABA+/Cr [χ2(5) = 11.72, pboot = 0.005] and MM-suppressed
GABA/Cr [χ2(3) = 44.31, pboot <0.001] measurements. Of the variance remaining after
accounting for site and vendor effects, accounted for 4.0% of variance in the GABA+
data and 21.0% of variance in the MM-suppressed GABA data. The association between
and MM-suppressed GABA/Cr is shown in Fig. 5. By-site regression lines are
consistent across sites and vendor, indicating a robust relationship. The same plot for GABA
+/Cr is shown in Fig. S2.
Finally, the effects of age and sex on GABA measurement outcome were examined, after
adjusting for , but no significant effects on either GABA+/Cr [age: χ2(7) = 3.52, pboot =
0.31; sex: χ2(7) = 0.37, pboot = 0.95] or MM-suppressed GABA/Cr [age: χ2(4) = 3.21, pboot
= 0.33; sex: χ2(4) = 3.87, pboot = 0.24] were observed.
3.2 Correlational analysis
A correlational analysis of the residuals of the linear mixed-models including as a
predictor showed that GABA+/Cr and MM-suppressed GABA/Cr were significantly
correlated (r = 0.25, 95% CI: [0.15, 0.35], p < 0.001) (Fig. 6). Specifically, the shared
variance between the two measurements, after adjusting for site, vendor and frequency offset
effects, amounted to 6.3%.
4. Discussion
This is the largest multi-site study to date applying GABA-edited MRS in the human brain.
The aims at the outset were to establish the extent to which GABA-edited measurements are
influenced by site-, sequence- and vendor-specific differences, and to investigate sources of
observed variance. Overall, the major findings can be summarized as follows:
1. The agreement between GABA+ values was surprisingly good, with whole-
dataset CV (12%) not much higher than the mean within-site CV (10%),
although site and vendor both contributed significantly to total variance.
2. Agreement between MM-suppressed GABA values was less good than GABA+,
with much higher whole-dataset (28%) and mean within-site (19%) CVs. The
amount of absolute variance in the MM-suppressed GABA data was, however,
similar to the GABA+ data.
3. Average center frequency offset was a significant factor in both experiments,
explaining a greater percentage of variance in the MM-suppressed experiment
(21%) than in the GABA+ experiment (4%) after accounting for variance
attributed to site and vendor effects.
The level of agreement between GABA+ measurement outcomes was better than
anticipated. The whole-dataset CV reported in this study falls well within the range of inter-
individual CVs observed for edited GABA+ measurements in the literature: 6–24% (Bogner
et al., 2010; Evans et al., 2010; Geramita et al., 2011; Long et al., 2015; Mikkelsen et al.,
2016a; O’Gorman et al., 2011). That a majority of the total variance in the data was
participant-level variance indicates that initial steps taken to standardize acquisition
Mikkelsen et al. Page 10
Neuroimage. Author manuscript; available in PMC 2018 October 01.
Author M
anuscriptA
uthor Manuscript
Author M
anuscriptA
uthor Manuscript
parameters across vendors (most notably TR, TE and editing pulse bandwidth) were largely
successful. The dominant proportion of variance attributed to within-site (i.e., between-
participant) variability may in large part reflect a greater level of experience with the GABA
+-edited acquisition across all platforms and greater success in standardizing the acquisitions
(as well as a greater inherent robustness of this sequence to minor differences such as B0
field offsets).
The protocols used in this study may be considered as a standard, with the currently
published data serving as a benchmark for sites applying GABA-edited MRS. Although the
majority of sites within-vendor used the same pulse sequence, there were differences. One
GE site (G1) used a different MEGA-PRESS implementation to the others, and had the
lowest average GABA+ and highest average MM-suppressed GABA values. One Philips site
did not use prospective frequency correction (P8), and gave the lowest average GABA+
values and highest average MM-suppressed GABA values. Two Siemens sites had locally
modified sequences (compared to the rest), and one of these (S7) had the highest average
GABA+ values. Thus, even small differences in sequence implementation seem to be
enough to differentiate sites from the group. Further efforts to standardize sequence timings
and editing pulse shapes within and between vendors would be expected to reduce vendor-
and site-level variance. At this stage, both GE and Siemens have vendor-distributed research
sequences in place, using proprietary RF pulse shapes, so this further standardization is a
challenge to be taken up by the edited MRS community.
At this stage, it is clear that the MM suppression methodology is less consistent than the
GABA+ method, with higher rates of data rejection (19 MM-suppressed GABA datasets vs.
seven GABA+ datasets) and greater relative variance. One major contributor of variance that
has been identified is frequency offset, with the data reproducing the approximately linear
relationship observed by Edden et al. (2016). The ratio between MM-suppressed GABA and
GABA+ measurements (0.38) is lower than expected. Typically, it is assumed that ~50% of
the GABA+ signal is GABA (Harris et al., 2015a; Mikkelsen et al., 2016a; Shungu et al.,
2016). This is largely explained by differential T2 relaxation between GABA signal at TE =
68 ms and TE = 80 ms (13% edited signal loss based on a T2 of 88 ms (Edden et al., 2012b))
and artificially reduced “MM-suppressed GABA” values due to negative MM co-editing
(~5% edited signal loss due to mean of −0.005 ppm (see Edden et al., 2016)). The
fraction of GABA+ signal that is MM will depend on the bandwidth of the editing pulse
used, as will GABA signal losses in the MM-suppressed experiment. While differences in
TE between vendors in the MM-suppressed acquisition added a level of methodological
heterogeneity, the multilevel analysis did not consider vendor-level effects in the MM-
suppressed data to be of statistical importance, in line with previous findings of a minimal
effect of TE on the edited GABA signal between 68 and 80 ms (Edden et al., 2012c;
Mikkelsen et al., 2016a). These data provide further evidence to support the
recommendation of prospective frequency correction for MM-suppressed GABA-edited
acquisitions (Edden et al., 2016). For most applications, it is more important that MM
suppression removes MM-related variance, rather than MM signal per se. The greater
variance in the MM-suppressed GABA results may also explain the weak correlation
between GABA+/Cr and MM-suppressed GABA/Cr to some degree (although the statistical
Mikkelsen et al. Page 11
Neuroimage. Author manuscript; available in PMC 2018 October 01.
Author M
anuscriptA
uthor Manuscript
Author M
anuscriptA
uthor Manuscript
modeling approach used, which removes, e.g., site-level variance in the measures, is
relatively conservative and will remove some real biologically driven variance).
One important strength of this dataset, in support of edited MRS of GABA, is the fact that,
even over so large a dataset as this, there was no significant relationship between GABA
measurements and independent metrics of data quality, such as NAA SNR and linewidth.
Thus, even though the data quality metrics did vary site-to-site to some degree, tolerable
levels (in the sense of not impacting GABA measurements) were achieved at all sites.
However, it is acknowledged that these data were homogeneously acquired from a large
voxel in a brain region where relatively favorable linewidth and SNR can be achieved. In
contrast, associations between metabolite measurements, or their uncertainty, and SNR
and/or linewidth are widely observed in investigations of linear combination modeling of
unedited spectra (Bartha et al., 2007; Kanowski et al., 2004; Near et al., 2013a). With
spectral editing, the goal is to attain an unambiguously resolved signal that allows for simple
peak fitting and integration (Bogner et al., 2016; Harris et al., 2017), but with (short-TE)
unedited spectra quantification is based on linear-combination fitting, the outcome of which
depends on the degree of orthogonality of the basis-set, which itself depends on data quality
(Graveron-Demilly, 2014). Although edited MRS of lower-concentration metabolites
typically necessitates comparatively longer scan durations or larger voxels to achieve
reasonable SNR, the advent of multiplexed editing (Chan et al., 2016, 2017a, 2017b;
Oeltzschner et al., 2017; Saleh et al., 2016) and development of edited MRSI (Bogner et al.,
2014; Hnilicová et al., 2016; Zhu et al., 2011) continues to improve the efficiency of spectral
editing approaches.
A number of multi-site MRS studies have been conducted in the past, each with a specific
focus. These focuses have included: unedited, short-TE MRS (Deelchand et al., 2015); low-
field MRS (Träber et al., 2006); ultra-high field MRS (van de Bank, 2015); absolute
quantification (Bovée et al., 1998; De Beer et al., 1998; Keevil et al., 1998; Soher et al.,
1996); MRSI (Sabati et al., 2015; Wijnen et al., 2010); body MRS (Bolan et al., 2016;
Scheenen et al., 2011); brain tumor classification (García-Gómez et al., 2009; Julià-Sapé et
al., 2006; Tate et al., 2003; Vicente et al., 2013); and HIV-associated dementia (Chang et al.,
2004; Lee et al., 2003; Sacktor et al., 2005). Even for short-TE methods, the degree of
agreement between sites and scanners is highly dependent on the degree of acquisition
homogeneity.
Edited MRS of GABA has a number of limitations, which are not directly addressed in this
paper. The fact that MM-suppressed GABA measurements are so susceptible to B0 field
changes resulting from scanner drift and participant head motion means that GABA+ is still
the most widely used edited GABA measure, in spite of the ~50% MM contribution.
However, measures of GABA that effectively remove the MM contamination would have
clearer biochemical significance than GABA+ measurements, and this paper establishes the
importance of future research dedicated to obtaining MM-suppressed GABA measures with
less sensitivity to B0 field offsets. The application of MM suppression is strongly motivated
by the desire to remove MM-related variance, and further development to improve the
robustness of MM suppression remains important. Even without this MM contamination, the
interpretation of MRS measures of total GABA concentration is complex – and the extent to
Mikkelsen et al. Page 12
Neuroimage. Author manuscript; available in PMC 2018 October 01.
Author M
anuscriptA
uthor Manuscript
Author M
anuscriptA
uthor Manuscript
which it is an index of GABAergic neurotransmission (beyond simply being a marker of
GABAergic interneuron cell density) is the subject of ongoing debate (Myers et al., 2016;
Rae, 2014; Stagg et al., 2011). This paper also does not explore the complexities of GABA
quantification by tissue water-referencing, a popular alternative to Cr-referencing.
Additional aspects of water-referenced quantification (such as site-to-site segmentation
differences) will contribute to the variability of water-referenced GABA measurements
across vendors, research sites and individuals (e.g., see Gasparovic et al., 2006; Harris et al.,
2015b; Mikkelsen et al., 2016b).
In conclusion, an international consortium collected a large dataset of GABA-edited MRS
measurements, the first study of this size for in vivo MRS of GABA. These data support the
use of GABA-edited MRS for multi-site, multi-vendor studies, with site and vendor
contributing a surprisingly small amount of total variance to GABA+ measurements.
Supplementary Material
Refer to Web version on PubMed Central for supplementary material.
Authors
Mark Mikkelsena,b, Peter B. Barkera,b, Pallab K. Bhattacharyyac,d, Maiken K. Brixe,f, Pieter F. Buurg, Kim M. Cecilh, Kimberly L. Chana,b,i, David Y.-T. Chenj, Alexander R. Cravenk,l, Koen Cuypersm,n, Michael Dackoo, Niall W. Duncanp, Ulrike Dydakq, David A. Edmondsonq, Gabriele Ender, Lars Erslandk,l,s, Fei Gaot, Ian Greenhouseu, Ashley D. Harrisv, Naying Hew, Stefanie Hebax, Nigel Hoggardy, Tun-Wei Hsuz, Jacobus F. A. Jansenaa, Alayar Kangarluab,ac, Thomas Langeo, R. Marc Lebelad, Yan Liw, Chien-Yuan E. Linae, Jy-Kang Liouz, Jiing-Feng Lirngz, Feng Liuac, Ruoyun Maq, Celine Maesm, Marta Moreno-Ortegaab, Scott O. Murrayaf, Sean Noahu, Ralph Noeskeag, Michael D. Noseworthyah, Georg Oeltzschnera,b, James J. Prisciandaroai, Nicolaas A. J. Putsa,b, Timothy P. L. Robertsaj, Markus Sackr, Napapon Sailasutaak,al, Muhammad G. Saleha,b, Michael-Paul Schallmoaf, Nicholas Simardam, Stephan P. Swinnenm,an, Martin Tegenthoffx, Peter Truongak, Guangbin Wangt, Iain D. Wilkinsony, Hans-Jörg Wittsackao, Hongmin Xuw, Fuhua Yanw, Chencheng Zhangap, Vadim Zipunnikovaq, Helge J. Zöllnerao,ar, and Richard A. E. Eddena,b,*
AffiliationsaRussell H. Morgan Department of Radiology and Radiological Science, The Johns Hopkins University School of Medicine, Baltimore, MD, USA bF. M. Kirby Research Center for Functional Brain Imaging, Kennedy Krieger Institute, Baltimore, MD, USA cImaging Institute, Cleveland Clinic Foundation, Cleveland, OH, USA dRadiology, Cleveland Clinic Lerner College of Medicine of Case Western Reserve University, Cleveland, OH, USA eDepartment of Radiology, Haukeland University Hospital, Bergen, Norway fDepartment of Clinical Medicine, University of Bergen, Bergen, Norway gSpinoza Centre for Neuroimaging, Amsterdam, The Netherlands hDepartment of Radiology, Cincinnati Children’s Hospital Medical Center, Cincinnati,
Mikkelsen et al. Page 13
Neuroimage. Author manuscript; available in PMC 2018 October 01.
Author M
anuscriptA
uthor Manuscript
Author M
anuscriptA
uthor Manuscript
OH, USA iDepartment of Biomedical Engineering, The Johns Hopkins University School of Medicine, Baltimore, MD, USA jDepartment of Radiology, Taipei Medical University Shuang Ho Hospital, New Taipei City, Taiwan kDepartment of Biological and Medical Psychology, University of Bergen, Bergen, Norway lNORMENT – Norwegian Center for Mental Disorders Research, University of Bergen, Bergen, Norway mDepartment of Kinesiology, KU Leuven, Leuven, Belgium nREVAL Rehabilitation Research Center, Hasselt University, Diepenbeek, Belgium oDepartment of Radiology, Medical Physics, Medical Center - University of Freiburg, Faculty of Medicine, Freiburg, Germany pBrain and Consciousness Research Centre, Taipei Medical University, Taipei, Taiwan qSchool of Health Sciences, Purdue University, West Lafayette, IN, USA rDepartment of Neuroimaging, Central Institute of Mental Health, Mannheim, Germany sDepartment of Clinical Engineering, Haukeland University Hospital, Bergen, Norway tShandong Medical Imaging Research Institute, Shandong University, Jinan, China uHelen Wills Neuroscience Institute, University of California, Berkeley, Berkeley, CA, USA vDepartment of Radiology, University of Calgary, Calgary, AB, Canada wDepartment of Radiology, Ruijin Hospital, Shanghai Jiao Tong University School of Medicine, Shanghai, China xDepartment of Neurology, BG University Hospital Bergmannsheil, Bochum, Germany yAcademic Unit of Radiology, University of Sheffield, Sheffield, UK zDepartment of Radiology, Taipei Veterans General Hospital, National Yang-Ming University School of Medicine, Taipei, Taiwan aaDepartment of Radiology, Maastricht University Medical Center, Maastricht, The Netherlands abDepartment of Psychiatry, Columbia University, New York, NY, USA acNew York State Psychiatric Institute, New York, NY, USA adGE Healthcare, Calgary, AB, Canada aeGE Healthcare, Taipei, Taiwan afDepartment of Psychology, University of Washington, Seattle, WA, USA agGE Healthcare, Berlin, Germany ahDepartment of Electrical and Computer Engineering, McMaster University, Hamilton, ON, Canada aiDepartment of Psychiatry and Behavioral Sciences, Medical University of South Carolina, Charleston, SC, USA ajDepartment of Radiology, Children’s Hospital of Philadelphia, Philadelphia, PA, USA akResearch Imaging Centre, Centre for Addiction and Mental Health, Toronto, ON, Canada alDepartment of Psychiatry, University of Toronto, Toronto, ON, Canada amSchool of Biomedical Engineering, McMaster University, Hamilton, ON, Canada anLeuven Research Institute for Neuroscience & Disease (LIND), KU Leuven, Leuven, Belgium aoDepartment of Diagnostic and Interventional Radiology, Medical Faculty, Heinrich-Heine-University, Duesseldorf, Germany apDepartment of Functional Neurosurgery, Ruijin Hospital, Shanghai Jiao Tong University School of Medicine, Shanghai, China aqDepartment of Biostatistics, Johns Hopkins Bloomberg School of Public Health, Baltimore, MD, USA arInstitute of Clinical Neuroscience and Medical Psychology, Medical Faculty, Heinrich-Heine-University, Duesseldorf, Germany
Acknowledgments
This work was supported by NIH grants R01 EB016089, R01 EB023963 and P41 EB015909. Data collection was supported by the Shandong Provincial Key Research and Development Plan of China (2016ZDJS07A16) and the
Mikkelsen et al. Page 14
Neuroimage. Author manuscript; available in PMC 2018 October 01.
Author M
anuscriptA
uthor Manuscript
Author M
anuscriptA
uthor Manuscript
National Natural Science Foundation of China for Young Scholars (no. 81601479). IDW thanks Mrs. J. Bigley of the University of Sheffield MRI Unit for her assistance with data acquisition. JJP was supported by NIAAA grant K23 AA020842. MPS was supported by NIH grant F32 EY025121. NAJP receives salary support from NIH grant K99 MH107719. The authors acknowledge implementation contributions from a number of employees of Siemens Medical Solutions, including Dr. Keith Heberlein and Dr. Sinyeob Ahn, to the Siemens WIP sequences, which are shared with several research sites under sequence-specific agreements.
References
Barr DJ, Levy R, Scheepers C, Tily HJ. Random effects structure for confirmatory hypothesis testing: Keep it maximal. J Mem Lang. 2013; 68:255–278. DOI: 10.1016/j.jml.2012.11.001
Bartha R. Effect of signal-to-noise ratio and spectral linewidth on metabolite quantification at 4 T. NMR Biomed. 2007; 20:512–521. DOI: 10.1002/nbm.1122 [PubMed: 17205487]
Bates D, Mächler M, Bolker BM, Walker SC. Fitting linear mixed-effects models using lme4. J Stat Softw. 2015; 67doi: 10.18637/jss.v067.i01
Bhagwagar Z, Wylezinska M, Jezzard P, Evans J, Boorman E, M Matthews P, J Cowen P. Low GABA concentrations in occipital cortex and anterior cingulate cortex in medication-free, recovered depressed patients. Int J Neuropsychopharmacol. 2008; 11:255–260. DOI: 10.1017/S1461145707007924 [PubMed: 17625025]
Bogner W, Gagoski B, Hess AT, Bhat H, Tisdall MD, van der Kouwe AJW, Strasser B, Marjańska M, Trattnig S, Grant E, Rosen B, Andronesi OC. 3D GABA imaging with real-time motion correction, shim update and reacquisition of adiabatic spiral MRSI. Neuroimage. 2014; 103:290–302. DOI: 10.1016/j.neuroimage.2014.09.032 [PubMed: 25255945]
Bogner W, Gruber S, Doelken M, Stadlbauer A, Ganslandt O, Boettcher U, Trattnig S, Doerfler A, Stefan H, Hammen T. In vivo quantification of intracerebral GABA by single-voxel 1H-MRS—How reproducible are the results? Eur J Radiol. 2010; 73:526–531. DOI: 10.1016/j.ejrad.2009.01.014 [PubMed: 19201120]
Bogner W, Hangel G, Esmaeili M, Andronesi OC. 1D-spectral editing and 2D multispectral in vivo 1H-MRS and 1H-MRSI - Methods and applications. Anal Biochem. 2016; doi: 10.1016/j.ab.2016.12.020
Bolan PJ, Kim E, Herman BA, Newstead GM, Rosen MA, Schnall MD, Pisano ED, Weatherall PT, Morris EA, Lehman CD, Garwood M, Nelson MT, Yee D, Polin SM, Esserman LJ, Gatsonis CA, Metzger GJ, Newitt DC, Partridge SC, Hylton NM. MR spectroscopy of breast cancer for assessing early treatment response: Results from the ACRIN 6657 MRS trial. J Magn Reson Imaging. 2016; doi: 10.1002/jmri.25560
Bollmann S, Ghisleni C, Poil S, Martin E, Ball J, Eich-Höchli D, Edden RAE, Klaver P, Michels L, Brandeis D, O’Gorman RL. Developmental changes in gamma-aminobutyric acid levels in attention-deficit/hyperactivity disorder. Transl Psychiatry. 2015; 5:e589.doi: 10.1038/tp.2015.79 [PubMed: 26101852]
Bottomley PA. Spatial localization in NMR spectroscopy in vivo. Ann N Y Acad Sci. 1987; 508:333–348. DOI: 10.1111/j.1749-6632.1987.tb32915.x [PubMed: 3326459]
Bovée W, Canese R, Decorps M, Forssell-Aronsson E, Le Fur Y, Howe F, Karlsen O, Knijn A, Kontaxis G, Kg̋el H, McLean M, Podo F, Slotboom J, Vikhoff B, Ziegler A. Absolute metabolite quantification by in vivo NMR spectroscopy: IV. Multicentre trial on MRSI localisation tests. Magn Reson Imaging. 1998; 16:1113–1125. DOI: 10.1016/S0730-725X(98)00120-9 [PubMed: 9839995]
Boy F, Evans CJ, Edden RAE, Lawrence AD, Singh KD, Husain M, Sumner P. Dorsolateral prefrontal γ-aminobutyric acid in men predicts individual differences in rash impulsivity. Biol Psychiatry. 2011; 70:866–872. DOI: 10.1016/j.biopsych.2011.05.030 [PubMed: 21757187]
Brix MK, Ersland L, Hugdahl K, Dwyer GE, Grüner R, Noeske R, Beyer MK, Craven AR. Within- and between-session reproducibility of GABA measurements with MR spectroscopy. J Magn Reson Imaging. 2017; doi: 10.1002/jmri.25588
Chan KL, Oeltzschner G, Schär M, Barker PB, Edden RAE. Spatial Hadamard encoding of J-edited spectroscopy using slice-selective editing pulses. NMR Biomed. 2017a; 30:e3688.doi: 10.1002/nbm.3688
Mikkelsen et al. Page 15
Neuroimage. Author manuscript; available in PMC 2018 October 01.
Author M
anuscriptA
uthor Manuscript
Author M
anuscriptA
uthor Manuscript
Chan KL, Puts NAJ, Schär M, Barker PB, Edden RAE. HERMES: Hadamard encoding and reconstruction of MEGA-edited spectroscopy. Magn Reson Med. 2016; 76:11–19. DOI: 10.1002/mrm.26233 [PubMed: 27089868]
Chan KL, Saleh MG, Oeltzschner G, Barker PB, Edden RAE. Simultaneous measurement of Aspartate, NAA, and NAAG using HERMES spectral editing at 3 Tesla. Neuroimage. 2017b; doi: 10.1016/j.neuroimage.2017.04.043
Chang L, Lee PL, Yiannoutsos CT, Ernst T, Marra CM, Richards T, Kolson D, Schifitto G, Jarvik JG, Miller EN, Lenkinski R, Gonzalez G, Navia BA. A multicenter in vivo proton-MRS study of HIV-associated dementia and its relationship to age. Neuroimage. 2004; 23:1336–1347. DOI: 10.1016/j.neuroimage.2004.07.067 [PubMed: 15589098]
De Beer R, Barbiroli B, Gobbi G, Knijn A, Kg̋el H, Langenberger K, Tkac I, Topp S. Absolute metabolite quantification by in vivo NMR spectroscopy: III. Multicentre 1H MRS of the human brain addressed by one and the same data-analysis protocol. Magn Reson Imaging. 1998; 16:1107–1111. DOI: 10.1016/S0730-725X(98)00119-2 [PubMed: 9839994]
Deelchand DK, Adanyeguh IM, Emir UE, Nguyen TM, Valabregue R, Henry PG, Mochel F, Öz G. Two-site reproducibility of cerebellar and brainstem neurochemical profiles with short-echo, single-voxel MRS at 3T. Magn Reson Med. 2015; 73:1718–1725. DOI: 10.1002/mrm.25295 [PubMed: 24948590]
DiCiccio TJ, Efron B. Bootstrap confidence intervals. Stat Sci. 1996; 11:189–228. DOI: 10.1214/ss/1032280214
Donahue MJ, Near J, Blicher JU, Jezzard P. Baseline GABA concentration and fMRI response. Neuroimage. 2010; 53:392–398. DOI: 10.1016/j.neuroimage.2010.07.017 [PubMed: 20633664]
Drenthen GS, Barendse EM, Aldenkamp AP, van Veenendaal TM, Puts NAJ, Edden RAE, Zinger S, Thoonen G, Hendriks MPH, Kessels RPC, Jansen JFA. Altered neurotransmitter metabolism in adolescents with high-functioning autism. Psychiatry Res Neuroimaging. 2016; 256:44–49. DOI: 10.1016/j.pscychresns.2016.09.007 [PubMed: 27685800]
Edden RAE, Barker PB. Spatial effects in the detection of γ-aminobutyric acid: Improved sensitivity at high fields using inner volume saturation. Magn Reson Med. 2007; 58:1276–1282. DOI: 10.1002/mrm.21383 [PubMed: 17969062]
Edden RAE, Crocetti D, Zhu H, Gilbert DL, Mostofsky SH. Reduced GABA concentration in attention-deficit/hyperactivity disorder. Arch Gen Psychiatry. 2012a; 69:750–753. DOI: 10.1001/archgenpsychiatry.2011.2280 [PubMed: 22752239]
Edden RAE, Intrapiromkul J, Zhu H, Cheng Y, Barker PB. Measuring T2 in vivo with J-difference editing: Application to GABA at 3 Tesla. J Magn Reson Imaging. 2012b; 35:229–234. DOI: 10.1002/jmri.22865 [PubMed: 22045601]
Edden RAE, Oeltzschner G, Harris AD, Puts NAJ, Chan KL, Boer VO, Schär M, Barker PB. Prospective frequency correction for macromolecule-suppressed GABA editing at 3T. J Magn Reson Imaging. 2016; 44:1474–1482. DOI: 10.1002/jmri.25304 [PubMed: 27239903]
Edden RAE, Puts NAJ, Barker PB. Macromolecule-suppressed GABA-edited magnetic resonance spectroscopy at 3T. Magn Reson Med. 2012c; 68:657–661. DOI: 10.1002/mrm.24391 [PubMed: 22777748]
Edden RAE, Puts NAJ, Harris AD, Barker PB, Evans CJ. Gannet: A batch-processing tool for the quantitative analysis of gamma-aminobutyric acid-edited MR spectroscopy spectra. J Magn Reson Imaging. 2014; 40:1445–1452. DOI: 10.1002/jmri.24478 [PubMed: 25548816]
Emir UE, Tuite PJ, Öz G. Elevated pontine and putamenal GABA levels in mild-moderate Parkinson disease detected by 7 Tesla proton MRS. PLoS One. 2012; 7:e30918.doi: 10.1371/journal.pone.0030918 [PubMed: 22295119]
Evans CJ, McGonigle DJ, Edden RAE. Diurnal stability of γ-aminobutyric acid concentration in visual and sensorimotor cortex. J Magn Reson Imaging. 2010; 31:204–209. DOI: 10.1002/jmri.21996 [PubMed: 20027589]
Foerster BR, Callaghan BC, Petrou M, Edden RAE, Chenevert TL, Feldman EL. Decreased motor cortex γ-aminobutyric acid in amyotrophic lateral sclerosis. Neurology. 2012; 78:1596–1600. DOI: 10.1212/WNL.0b013e3182563b57 [PubMed: 22517106]
Mikkelsen et al. Page 16
Neuroimage. Author manuscript; available in PMC 2018 October 01.
Author M
anuscriptA
uthor Manuscript
Author M
anuscriptA
uthor Manuscript
Foerster BR, Pomper MG, Callaghan BC, Petrou M, Edden RAE, Mohamed MA, Welsh RC, Carlos RC, Barker PB, Feldman EL. An imbalance between excitatory and inhibitory neurotransmitters in amyotrophic lateral sclerosis revealed by use of 3-T proton magnetic resonance spectroscopy. JAMA Neurol. 2013; 70:1009–1016. DOI: 10.1001/jamaneurol.2013.234 [PubMed: 23797905]
Frahm J, Merboldt KD, Hänicke W. Localized proton spectroscopy using stimulated echoes. J Magn Reson. 1987; 72:502–508. DOI: 10.1016/0022-2364(87)90154-5
Fujihara K, Narita K, Suzuki Y, Takei Y, Suda M, Tagawa M, Ujita K, Sakai Y, Narumoto J, Near J, Fukuda M. Relationship of γ-aminobutyric acid and glutamate+glutamine concentrations in the perigenual anterior cingulate cortex with performance of Cambridge Gambling Task. Neuroimage. 2015; 109:102–108. DOI: 10.1016/j.neuroimage.2015.01.014 [PubMed: 25583607]
Gaetz W, Bloy L, Wang DJ, Port RG, Blaskey L, Levy SE, Roberts TPL. GABA estimation in the brains of children on the autism spectrum: Measurement precision and regional cortical variation. Neuroimage. 2014; 86:1–9. DOI: 10.1016/j.neuroimage.2013.05.068 [PubMed: 23707581]
García-Gómez JM, Luts J, Julià-Sapé M, Krooshof P, Tortajada S, Robledo JV, Melssen W, Fuster-García E, Olier I, Postma G, Monleón D, Moreno-Torres À, Pujol J, Candiota AP, Martínez-Bisbal MC, Suykens J, Buydens L, Celda B, Van Huffel S, Arús C, Robles M. Multiproject–multicenter evaluation of automatic brain tumor classification by magnetic resonance spectroscopy. Magn Reson Mater Physics, Biol Med. 2009; 22:5–18. DOI: 10.1007/s10334-008-0146-y
Gasparovic C, Song T, Devier D, Bockholt HJ, Caprihan A, Mullins PG, Posse S, Jung RE, Morrison LA. Use of tissue water as a concentration reference for proton spectroscopic imaging. Magn Reson Med. 2006; 55:1219–1226. DOI: 10.1002/mrm.20901 [PubMed: 16688703]
Geramita M, van der Veen JW, Barnett AS, Savostyanova AA, Shen J, Weinberger DR, Marenco S. Reproducibility of prefrontal γ-aminobutyric acid measurements with J-edited spectroscopy. NMR Biomed. 2011; 24:1089–1098. DOI: 10.1002/nbm.1662 [PubMed: 21290458]
Goldstein H, Browne W, Rasbash J. Partitioning variation in multilevel models. Underst Stat. 2002; 1:223–231. DOI: 10.1207/S15328031US0104_02
Graveron-Demilly D. Quantification in magnetic resonance spectroscopy based on semi-parametric approaches. Magn Reson Mater Physics, Biol Med. 2014; 27:113–130. DOI: 10.1007/s10334-013-0393-4
Greenhouse I, King M, Noah S, Maddock RJ, Ivry RB. individual differences in resting corticospinal excitability are correlated with reaction time and GABA content in motor cortex. J Neurosci. 2017; 37:2686–2696. DOI: 10.1523/JNEUROSCI.3129-16.2017 [PubMed: 28179557]
Halekoh U, Højsgaard S. A Kenward-Roger approximation and parametric bootstrap methods for tests in linear mixed models - The R package pbkrtest. J Stat Softw. 2014; 59:1–32. DOI: 10.18637/jss.v059.i09 [PubMed: 26917999]
Harris AD, Glaubitz B, Near J, John Evans C, Puts NAJ, Schmidt-Wilcke T, Tegenthoff M, Barker PB, Edden RAE. Impact of frequency drift on gamma-aminobutyric acid-edited MR spectroscopy. Magn Reson Med. 2014; 72:941–8. DOI: 10.1002/mrm.25009 [PubMed: 24407931]
Harris AD, Puts NAJ, Barker PB, Edden RAE. Spectral-editing measurements of GABA in the human brain with and without macromolecule suppression. Magn Reson Med. 2015a; 74:1523–1529. DOI: 10.1002/mrm.25549 [PubMed: 25521836]
Harris AD, Puts NAJ, Edden RAE. Tissue correction for GABA-edited MRS: Considerations of voxel composition, tissue segmentation, and tissue relaxations. J Magn Reson Imaging. 2015b; 42:1431–1440. DOI: 10.1002/jmri.24903 [PubMed: 26172043]
Harris AD, Saleh MG, Edden RAE. Edited 1H magnetic resonance spectroscopy in vivo: Methods and metabolites. Magn Reson Med. 2017; 77:1377–1389. DOI: 10.1002/mrm.26619 [PubMed: 28150876]
Hasler G, van der Veen JW, Tumonis T, Meyers N, Shen J, Drevets WC. Reduced prefrontal glutamate/glutamine and γ-aminobutyric acid levels in major depression determined using proton magnetic resonance spectroscopy. Arch Gen Psychiatry. 2007; 64:193.doi: 10.1001/archpsyc.64.2.193 [PubMed: 17283286]
Hayes AF. A primer on multilevel modeling. Hum Commun Res. 2006; 32:385–410. DOI: 10.1111/j.1468-2958.2006.00281.x
Mikkelsen et al. Page 17
Neuroimage. Author manuscript; available in PMC 2018 October 01.
Author M
anuscriptA
uthor Manuscript
Author M
anuscriptA
uthor Manuscript
Henry PG, Dautry C, Hantraye P, Bloch G. Brain GABA editing without macromolecule contamination. Magn Reson Med. 2001; 45:517–520. DOI: 10.1002/1522-2594(200103)45:3<517::AID-MRM1068>3.0.CO;2-6 [PubMed: 11241712]
Hnilicová P, Považan M, Strasser B, Andronesi OC, Gajdošík M, Dydak U, Ukropec J, Dobrota D, Trattnig S, Bogner W. Spatial variability and reproducibility of GABA-edited MEGA-LASER 3D-MRSI in the brain at 3 T. NMR Biomed. 2016; 29:1656–1665. DOI: 10.1002/nbm.3613 [PubMed: 27717093]
Hu Y, Chen X, Gu H, Yang Y. Resting-state glutamate and GABA concentrations predict task-induced deactivation in the default mode network. J Neurosci. 2013; 33:18566–18573. DOI: 10.1523/JNEUROSCI.1973-13.2013 [PubMed: 24259578]
Julià-Sapé M, Acosta D, Mier M, Arùs C, Watson D. A multi-centre, web-accessible and quality control-checked database of in vivo MR spectra of brain tumour patients. Magn Reson Mater Physics, Biol Med. 2006; 19:22–33. DOI: 10.1007/s10334-005-0023-x
Kaiser LG, Young K, Meyerhoff DJ, Mueller SG, Matson GB. A detailed analysis of localized J-difference GABA editing: theoretical and experimental study at 4T. NMR Biomed. 2008; 21:22–32. DOI: 10.1002/nbm.1150 [PubMed: 17377933]
Kanowski M, Kaufmann J, Braun J, Bernarding J, Tempelmann C. Quantitation of simulated short echo time 1H human brain spectra by LCModel and AMARES. Magn Reson Med. 2004; 51:904–912. DOI: 10.1002/mrm.20063 [PubMed: 15122672]
Kapogiannis D, Reiter DA, Willette AA, Mattson MP. Posteromedial cortex glutamate and GABA predict intrinsic functional connectivity of the default mode network. Neuroimage. 2013; 64:112–119. DOI: 10.1016/j.neuroimage.2012.09.029 [PubMed: 23000786]
Keevil S, Barbiroli B, Brooks JC, Cady E, Canese R, Carlier P, Collins D, Gilligan P, Gobbi G, Hennig J, Kügel H, Leach M, Metzler D, Mlynárik V, Moser E, Newbold M, Payne G, Ring P, Roberts J, Rowland I, Thiel T, Tkác I, Topp S, Wittsack H, Wylezinska M, Zaniol P, Henriksen O, Podo F. Absolute metabolite quantification by in vivo NMR spectroscopy: II. A multicentre trial of protocols for in vivo localised proton studies of human brain Magn Reson Imaging. 1998; 16:1093–1106. DOI: 10.1016/S0730-725X(98)00118-0 [PubMed: 9839993]
Kegeles LS, Mao X, Stanford AD, Girgis R, Ojeil N, Xu X, Gil R, Slifstein M, Abi-Dargham A, Lisanby SH, Shungu DC. Elevated prefrontal cortex γ-aminobutyric acid and glutamate-glutamine levels in schizophrenia measured in vivo with proton magnetic resonance spectroscopy. Arch Gen Psychiatry. 2012; 69:449–59. DOI: 10.1001/archgenpsychiatry.2011.1519 [PubMed: 22213769]
Lange T, Ko CW, Lai PH, Dacko M, Tsai SY, Buechert M. Simultaneous detection of valine and lactate using MEGA-PRESS editing in pyogenic brain abscess. NMR Biomed. 2016; 29:1739–1747. DOI: 10.1002/nbm.3660 [PubMed: 27779348]
Lee PL, Yiannoutsos CT, Ernst T, Chang L, Marra CM, Jarvik JG, Richards TL, Kwok EW, Kolson DL, Simpson D, Tang CY, Schifitto G, Ketonen LM, Meyerhoff DJ, Lenkinski RE, Gonzalez RG, Navia BA. A multi-center 1H MRS study of the AIDS dementia complex: Validation and preliminary analysis. J Magn Reson Imaging. 2003; 17:625–633. DOI: 10.1002/jmri.10295 [PubMed: 12766890]
Long Z, Dyke JP, Ma R, Huang CC, Louis ED, Dydak U. Reproducibility and effect of tissue composition on cerebellar γ-aminobutyric acid (GABA) MRS in an elderly population. NMR Biomed. 2015; 28:1315–1323. DOI: 10.1002/nbm.3381 [PubMed: 26314380]
McCormick DA. GABA as an inhibitory neurotransmitter in human cerebral cortex. J Neurophysiol. 1989; 62:1018–1027. [PubMed: 2573696]
Mescher M, Merkle H, Kirsch J, Garwood M, Gruetter R. Simultaneous in vivo spectral editing and water suppression. NMR Biomed. 1998; 11:266–272. DOI: 10.1002/(SICI)1099-1492(199810)11:6<266::AID-NBM530>3.0.CO;2-J [PubMed: 9802468]
Mikkelsen M, Singh KD, Sumner P, Evans CJ. Comparison of the repeatability of GABA-edited magnetic resonance spectroscopy with and without macromolecule suppression. Magn Reson Med. 2016a; 75:946–953. DOI: 10.1002/mrm.25699 [PubMed: 25920455]
Mikkelsen M, Singh KD, Brealy JA, Linden DEJ, Evans CJ. Quantification of γ-aminobutyric acid (GABA) in 1H MRS volumes composed heterogeneously of grey and white matter. NMR Biomed. 2016b; 29:1644–1655. DOI: 10.1002/nbm.3622 [PubMed: 27687518]
Mikkelsen et al. Page 18
Neuroimage. Author manuscript; available in PMC 2018 October 01.
Author M
anuscriptA
uthor Manuscript
Author M
anuscriptA
uthor Manuscript
Mullins PG, McGonigle DJ, O’Gorman RL, Puts NAJ, Vidyasagar R, Evans CJ, Cardiff Symposium on MRS of GABA. Edden RAE. Current practice in the use of MEGA-PRESS spectroscopy for the detection of GABA. Neuroimage. 2014; 86:43–52. DOI: 10.1016/j.neuroimage.2012.12.004 [PubMed: 23246994]
Muthukumaraswamy SD, Edden RAE, Jones DK, Swettenham JB, Singh KD. Resting GABA concentration predicts peak gamma frequency and fMRI amplitude in response to visual stimulation in humans. Proc Natl Acad Sci U S A. 2009; 106:8356–8361. DOI: 10.1073/pnas.0900728106 [PubMed: 19416820]
Myers JF, Nutt DJ, Lingford-ughes AR. γ-aminobutyric acid as a metabolite: Interpreting magnetic resonance spectroscopy experiments. J Psychopharmacol. 2016; 30:422–427. DOI: 10.1177/0269881116639298 [PubMed: 27005308]
Near J, Andersson J, Maron E, Mekle R, Gruetter R, Cowen P, Jezzard P. Unedited in vivo detection and quantification of γ-aminobutyric acid in the occipital cortex using short-TE MRS at 3 T. NMR Biomed. 2013a; 26:1353–1362. DOI: 10.1002/nbm.2960 [PubMed: 23696182]
Near J, Edden R, Evans CJ, Paquin R, Harris A, Jezzard P. Frequency and phase drift correction of magnetic resonance spectroscopy data by spectral registration in the time domain. Magn Reson Med. 2015; 73:44–50. DOI: 10.1002/mrm.25094 [PubMed: 24436292]
Near J, Evans CJ, Puts NAJ, Barker PB, Edden RAE. J-difference editing of gamma-aminobutyric acid (GABA): Simulated and experimental multiplet patterns. Magn Reson Med. 2013b; 70:1183–1191. DOI: 10.1002/mrm.24572 [PubMed: 23213033]
Near J, Ho YCL, Sandberg K, Kumaragamage C, Blicher JU. Long-term reproducibility of GABA magnetic resonance spectroscopy. Neuroimage. 2014; 99:191–196. DOI: 10.1016/j.neuroimage.2014.05.059 [PubMed: 24875142]
O’Gorman RL, Michels L, Edden RA, Murdoch JB, Martin E. In vivo detection of GABA and glutamate with MEGA-PRESS: Reproducibility and gender effects. J Magn Reson Imaging. 2011; 33:1262–1267. DOI: 10.1002/jmri.22520 [PubMed: 21509888]
Oeltzschner G, Puts NAJ, Chan KL, Boer VO, Barker PB, Edden RAE. Dual-volume excitation and parallel reconstruction for J-difference-edited MR spectroscopy. Magn Reson Med. 2017; 77:16–22. DOI: 10.1002/mrm.26536
Öngür D, Prescot AP, McCarthy J, Cohen BM, Renshaw PF. Elevated gamma-aminobutyric acid levels in chronic schizophrenia. Biol Psychiatry. 2010; 68:667–670. DOI: 10.1016/j.biopsych.2010.05.016 [PubMed: 20598290]
Petrou M, Pop-Busui R, Foerster BR, Edden RA, Callaghan BC, Harte SE, Harris RE, Clauw DJ, Feldman EL. Altered excitation-inhibition balance in the brain of patients with diabetic neuropathy. Acad Radiol. 2012; 19:607–612. DOI: 10.1016/j.acra.2012.02.004 [PubMed: 22463961]
Peugh JL. A practical guide to multilevel modeling. J Sch Psychol. 2010; 48:85–112. DOI: 10.1016/j.jsp.2009.09.002 [PubMed: 20006989]
Puts NAJ, Edden RAE, Evans CJ, McGlone F, McGonigle DJ. Regionally specific human GABA concentration correlates with tactile discrimination thresholds. J Neurosci. 2011; 31:16556–16560. DOI: 10.1523/JNEUROSCI.4489-11.2011 [PubMed: 22090482]
Puts NAJ, Wodka EL, Harris AD, Crocetti D, Tommerdahl M, Mostofsky SH, Edden RAE. Reduced GABA and altered somatosensory function in children with autism spectrum disorder. Autism Res. 2016; :1–12. DOI: 10.1002/aur.1691
Price RB, Shungu DC, Mao X, Nestadt P, Kelly C, Collins KA, Murrough JW, Charney DS, Mathew SJ. Amino acid neurotransmitters assessed by proton magnetic resonance spectroscopy: Relationship to treatment resistance in major depressive disorder. Biol Psychiatry. 2009; 65:792–800. DOI: 10.1016/j.biopsych.2008.10.025 [PubMed: 19058788]
Core Team, R. R: A language and environment for statistical computing. R Foundation for Statistical Computing; Vienna, Austria: 2017. https://www.R-project.org
Rae CD. A guide to the metabolic pathways and function of metabolites observed in human brain 1H magnetic resonance spectra. Neurochem Res. 2014; 39:1–36. DOI: 10.1007/s11064-013-1199-5 [PubMed: 24258018]
Mikkelsen et al. Page 19
Neuroimage. Author manuscript; available in PMC 2018 October 01.
Author M
anuscriptA
uthor Manuscript
Author M
anuscriptA
uthor Manuscript
Rothman DL, Petroff OA, Behar KL, Mattson RH. Localized 1H NMR measurements of γ-aminobutyric acid in human brain in vivo. Proc Natl Acad Sci U S A. 1993; 90:5662–6. [PubMed: 8516315]
Rowland LM, Krause BW, Wijtenburg SA, McMahon RP, Chiappelli J, Nugent KL, Nisonger SJ, Korenic SA, Kochunov P, Hong LE. Medial frontal GABA is lower in older schizophrenia: a MEGA-PRESS with macromolecule suppression study. Mol Psychiatry. 2016; 21:198–204. DOI: 10.1038/mp.2015.34 [PubMed: 25824298]
Sabati M, Sheriff S, Gu M, Wei J, Zhu H, Barker PB, Spielman DM, Alger JR, Maudsley AA. Multivendor implementation and comparison of volumetric whole-brain echo-planar MR spectroscopic imaging. Magn Reson Med. 2015; 74:1209–1220. DOI: 10.1002/mrm.25510 [PubMed: 25354190]
Sacktor N, Skolasky RL, Ernst T, Mao X, Selnes O, Pomper MG, Chang L, Zhong K, Shungu DC, Marder K, Shibata D, Schifitto G, Bobo L, Barker PB. A multicenter study of two magnetic resonance spectroscopy techniques in individuals with HIV dementia. J Magn Reson Imaging. 2005; 21:325–333. DOI: 10.1002/jmri.20272 [PubMed: 15779034]
Saleh MG, Oeltzschner G, Chan KL, Puts NAJ, Mikkelsen M, Schär M, Harris AD, Edden RAE. Simultaneous edited MRS of GABA and glutathione. Neuroimage. 2016; 142:576–582. DOI: 10.1016/j.neuroimage.2016.07.056 [PubMed: 27534734]
Scheenen TWJ, Fütterer J, Weiland E, van Hecke P, Lemort M, Zechmann C, Schlemmer HP, Broome D, Villeirs G, Lu J, Barentsz J, Roell S, Heerschap A. Discriminating cancer from noncancer tissue in the prostate by 3-dimensional proton magnetic resonance spectroscopic imaging: A prospective multicenter validation study. Invest Radiol. 2011; 46:25–33. DOI: 10.1097/RLI.0b013e3181f54081 [PubMed: 21188832]
Schielzeth H. Simple means to improve the interpretability of regression coefficients. Methods Ecol Evol. 2010; 1:103–113. DOI: 10.1111/j.2041-210X.2010.00012.x
Shibata K, Sasaki Y, Bang JW, Walsh EG, Machizawa MG, Tamaki M, Chang LH, Watanabe T. Overlearning hyperstabilizes a skill by rapidly making neurochemical processing inhibitory-dominant. Nat Neurosci. 2017; 20:470–475. DOI: 10.1038/nn.4490 [PubMed: 28135242]
Shungu DC, Mao X, Gonzales R, Soones TN, Dyke JP, van der Veen JW, Kegeles LS. Brain γ-aminobutyric acid (GABA) detection in vivo with the J-editing 1H MRS technique: a comprehensive methodological evaluation of sensitivity enhancement, macromolecule contamination and test-retest reliability. NMR Biomed. 2016; 29:932–942. DOI: 10.1002/nbm.3539 [PubMed: 27173449]
Silveri MM, Sneider JT, Crowley DJ, Covell MJ, Acharya D, Rosso IM, Jensen JE. rontal lobe γ-aminobutyric acid levels during adolescence: Associations with impulsivity and response inhibition. Biol Psychiatry. 2013; 74:296–304. DOI: 10.1016/j.biopsych.2013.01.033 [PubMed: 23498139]
Snijders, TAB., Bosker, RJ. Multilevel Analysis: An Introduction to Basic and Advanced Multilevel Modeling. SAGE Publications; London: 2012.
Soher BJ, Hurd RE, Sailasuta N, Barker PB. Quantitation of automated single-voxel proton MRS using cerebral water as an internal reference. Magn Reson Med. 1996; 36:335–339. DOI: 10.1002/mrm.1910360302 [PubMed: 8875401]
Stagg CJ, Bachtiar V, Johansen-Berg H. What are we measuring with GABA magnetic resonance spectroscopy? Commun Integr Biol. 2011; 4:573–575. DOI: 10.4161/cib.16213 [PubMed: 22046466]
Star-Lack J, Nelson SJ, Kurhanewicz J, Huang LR, Vigneron DB. Improved water and lipid suppression for 3D PRESS CSI using RF band selective inversion with gradient dephasing (BASING). Magn Reson Med. 1997; 38:311–321. DOI: 10.1002/mrm.1910380222 [PubMed: 9256113]
Tate AR, Majós C, Moreno A, Howe FA, Griffiths JR, Arús C. Automated classification of short echo time in in vivo 1H brain tumor spectra: A multicenter study. Magn Reson Med. 2003; 49:29–36. DOI: 10.1002/mrm.10315 [PubMed: 12509817]
Terpstra M, Ugurbil K, Gruetter R. Direct in vivo measurement of human cerebral GABA concentration using MEGA-editing at 7 Tesla. Magn Reson Med. 2002; 47:1009–1012. DOI: 10.1002/mrm.10146 [PubMed: 11979581]
Mikkelsen et al. Page 20
Neuroimage. Author manuscript; available in PMC 2018 October 01.
Author M
anuscriptA
uthor Manuscript
Author M
anuscriptA
uthor Manuscript
Träber F, Block W, Freymann N, Gür O, Kucinski T, Hammen T, Ende G, Pilatus U, Hampel H, Schild HH, Heun R, Jessen F. A multicenter reproducibility study of single-voxel 1H-MRS of the medial temporal lobe. Eur Radiol. 2006; 16:1096–1103. DOI: 10.1007/s00330-005-0108-y [PubMed: 16416279]
van de Bank BL, Emir UE, Boer VO, van Asten JJA, Maas MC, Wijnen JP, Kan HE, Oz G, Klomp DWJ, Scheenen TWJ. Multi-center reproducibility of neurochemical profiles in the human brain at 7T. NMR Biomed. 2015; 28:306–316. DOI: 10.1002/nbm.3252 [PubMed: 25581510]
Vicente J, Fuster-Garcia E, Tortajada S, García-Gómez JM, Davies N, Natarajan K, Wilson M, Grundy RG, Wesseling P, Monleón D, Celda B, Robles M, Peet AC. Accurate classification of childhood brain tumours by in vivo 1H MRS - a multicentre study. Eur J Cancer. 2013; 49:658–67. DOI: 10.1016/j.ejca.2012.09.003 [PubMed: 23036849]
Waddell KW, Avison MJ, Joers JM, Gore JC. A practical guide to robust detection of GABA in human brain by J-difference spectroscopy at 3 T using a standard volume coil. Magn Reson Imaging. 2007; 25:1032–1038. DOI: 10.1016/j.mri.2006.11.026 [PubMed: 17707165]
Wijnen JP, van Asten JJA, Klomp DWJ, Sjobakk TE, Gribbestad IS, Scheenen TWJ, Heerschap A. Short echo time 1H MRSI of the human brain at 3T with adiabatic slice-selective refocusing pulses; reproducibility and variance in a dual center setting. J Magn Reson Imaging. 2010; 31:61–70. DOI: 10.1002/jmri.21999 [PubMed: 20027568]
Yoon JH, Grandelis A, Maddock RJ. Dorsolateral prefrontal cortex GABA concentration in humans predicts working memory load processing capacity. J Neurosci. 2016; 36:11788–11794. DOI: 10.1523/JNEUROSCI.1970-16.2016 [PubMed: 27852785]
Yoon JH, Maddock RJ, Rokem A, Silver MA, Minzenberg MJ, Ragland JD, Carter CS. GABA concentration is reduced in visual cortex in schizophrenia and correlates with orientation-specific surround suppression. J Neurosci. 2010; 30:3777–3781. DOI: 10.1523/JNEUROSCI.6158-09.2010 [PubMed: 20220012]
Zhu H, Edden RAE, Ouwerkerk R, Barker PB. High resolution spectroscopic imaging of GABA at 3 Tesla. Magn Reson Med. 2011; 65:603–609. DOI: 10.1002/mrm.22671 [PubMed: 21337399]
Mikkelsen et al. Page 21
Neuroimage. Author manuscript; available in PMC 2018 October 01.
Author M
anuscriptA
uthor Manuscript
Author M
anuscriptA
uthor Manuscript
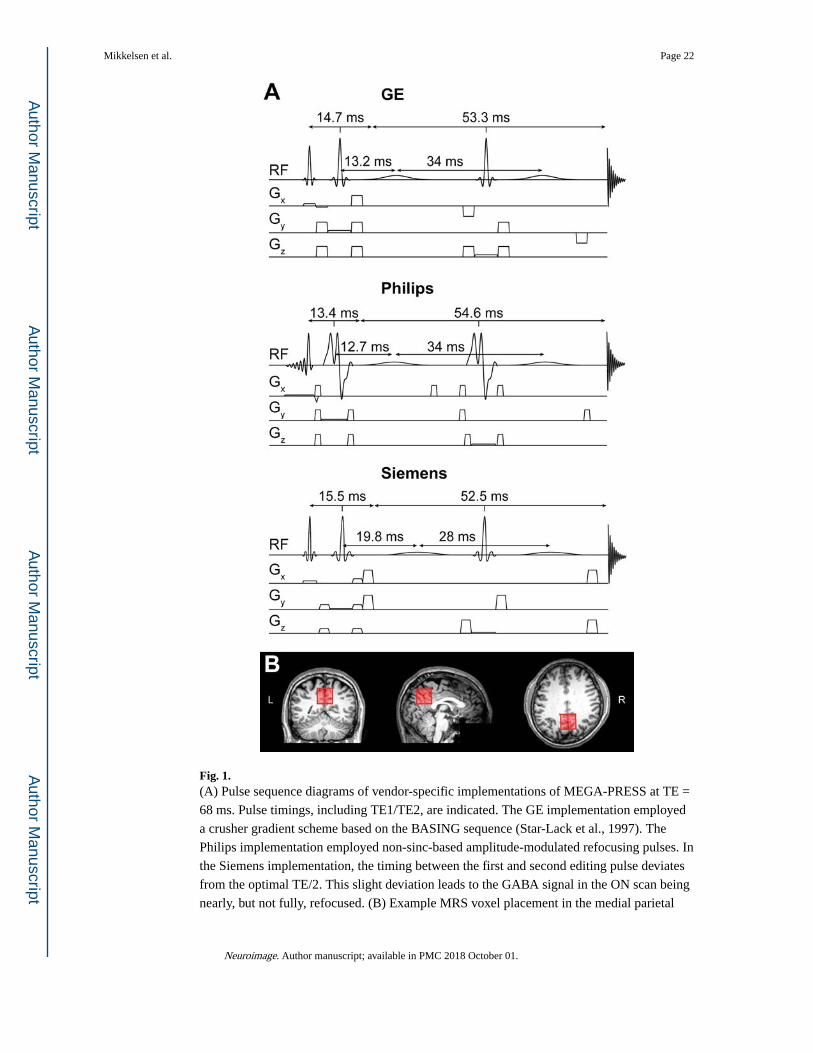
Fig. 1. (A) Pulse sequence diagrams of vendor-specific implementations of MEGA-PRESS at TE =
68 ms. Pulse timings, including TE1/TE2, are indicated. The GE implementation employed
a crusher gradient scheme based on the BASING sequence (Star-Lack et al., 1997). The
Philips implementation employed non-sinc-based amplitude-modulated refocusing pulses. In
the Siemens implementation, the timing between the first and second editing pulse deviates
from the optimal TE/2. This slight deviation leads to the GABA signal in the ON scan being
nearly, but not fully, refocused. (B) Example MRS voxel placement in the medial parietal
Mikkelsen et al. Page 22
Neuroimage. Author manuscript; available in PMC 2018 October 01.
Author M
anuscriptA
uthor Manuscript
Author M
anuscriptA
uthor Manuscript
lobe of one participant. At each research site, the voxel was rotated in the sagittal plane to be
parallel with a line connecting the genu and splenium of the corpus callosum.
Mikkelsen et al. Page 23
Neuroimage. Author manuscript; available in PMC 2018 October 01.
Author M
anuscriptA
uthor Manuscript
Author M
anuscriptA
uthor Manuscript
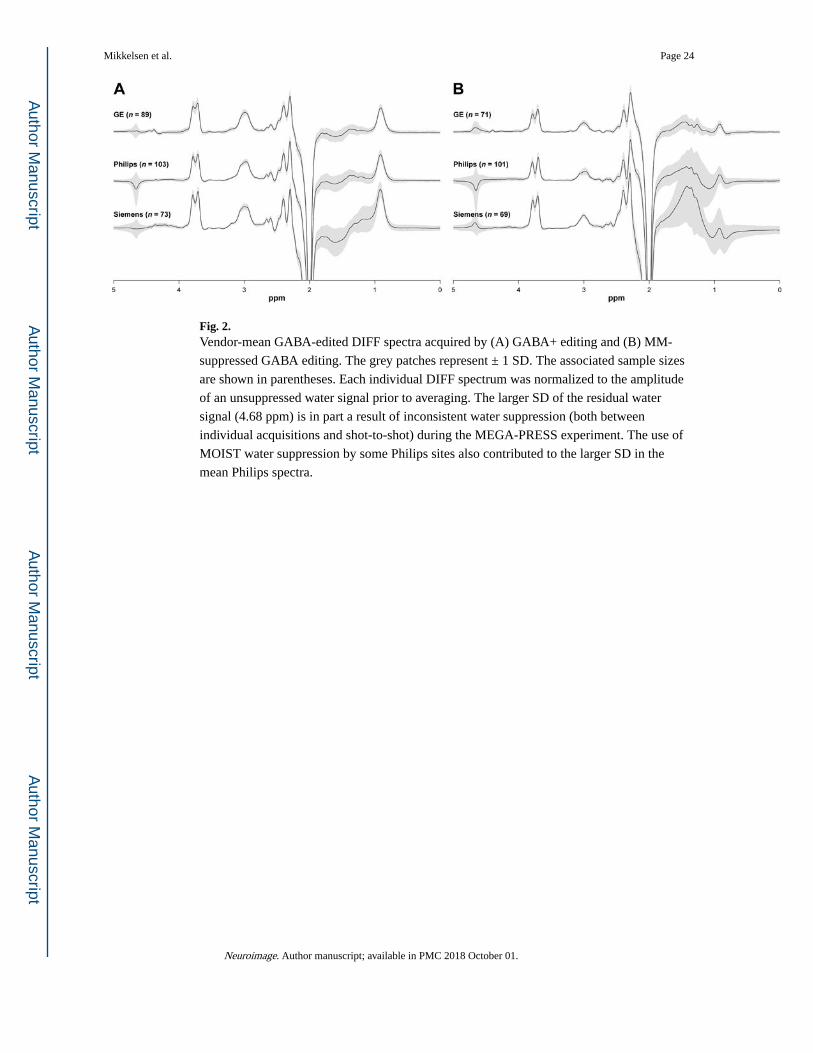
Fig. 2. Vendor-mean GABA-edited DIFF spectra acquired by (A) GABA+ editing and (B) MM-
suppressed GABA editing. The grey patches represent ± 1 SD. The associated sample sizes
are shown in parentheses. Each individual DIFF spectrum was normalized to the amplitude
of an unsuppressed water signal prior to averaging. The larger SD of the residual water
signal (4.68 ppm) is in part a result of inconsistent water suppression (both between
individual acquisitions and shot-to-shot) during the MEGA-PRESS experiment. The use of
MOIST water suppression by some Philips sites also contributed to the larger SD in the
mean Philips spectra.
Mikkelsen et al. Page 24
Neuroimage. Author manuscript; available in PMC 2018 October 01.
Author M
anuscriptA
uthor Manuscript
Author M
anuscriptA
uthor Manuscript
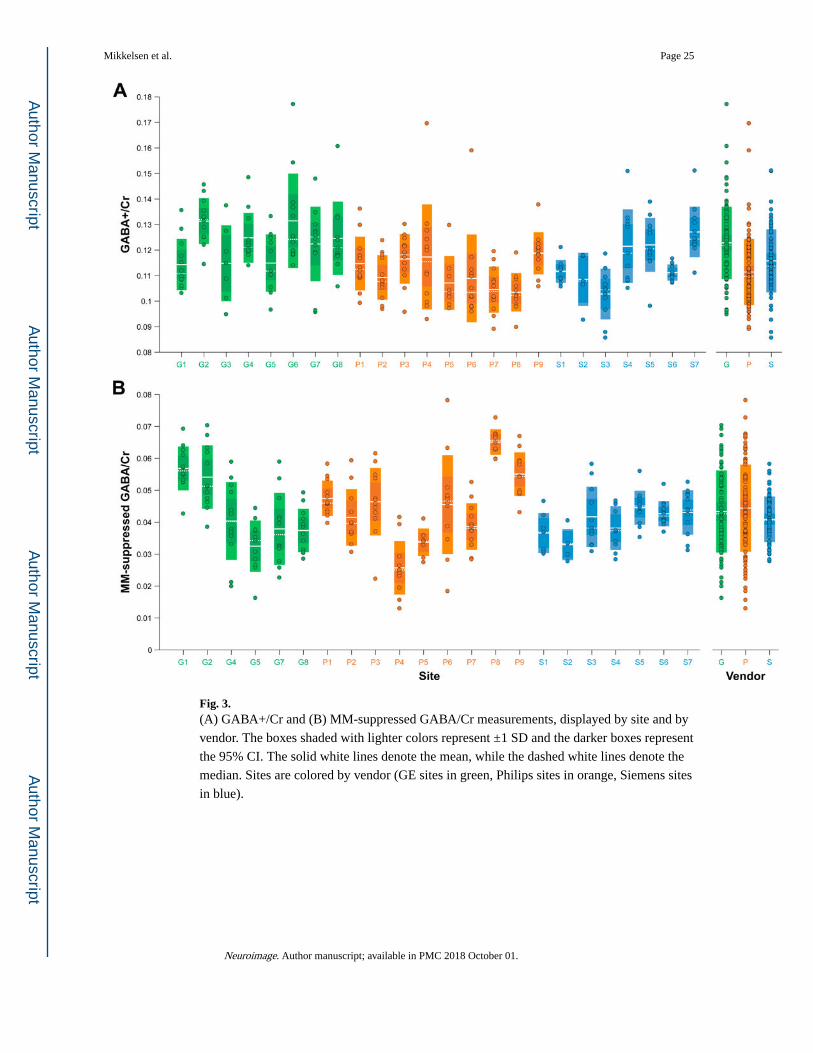
Fig. 3. (A) GABA+/Cr and (B) MM-suppressed GABA/Cr measurements, displayed by site and by
vendor. The boxes shaded with lighter colors represent ±1 SD and the darker boxes represent
the 95% CI. The solid white lines denote the mean, while the dashed white lines denote the
median. Sites are colored by vendor (GE sites in green, Philips sites in orange, Siemens sites
in blue).
Mikkelsen et al. Page 25
Neuroimage. Author manuscript; available in PMC 2018 October 01.
Author M
anuscriptA
uthor Manuscript
Author M
anuscriptA
uthor Manuscript
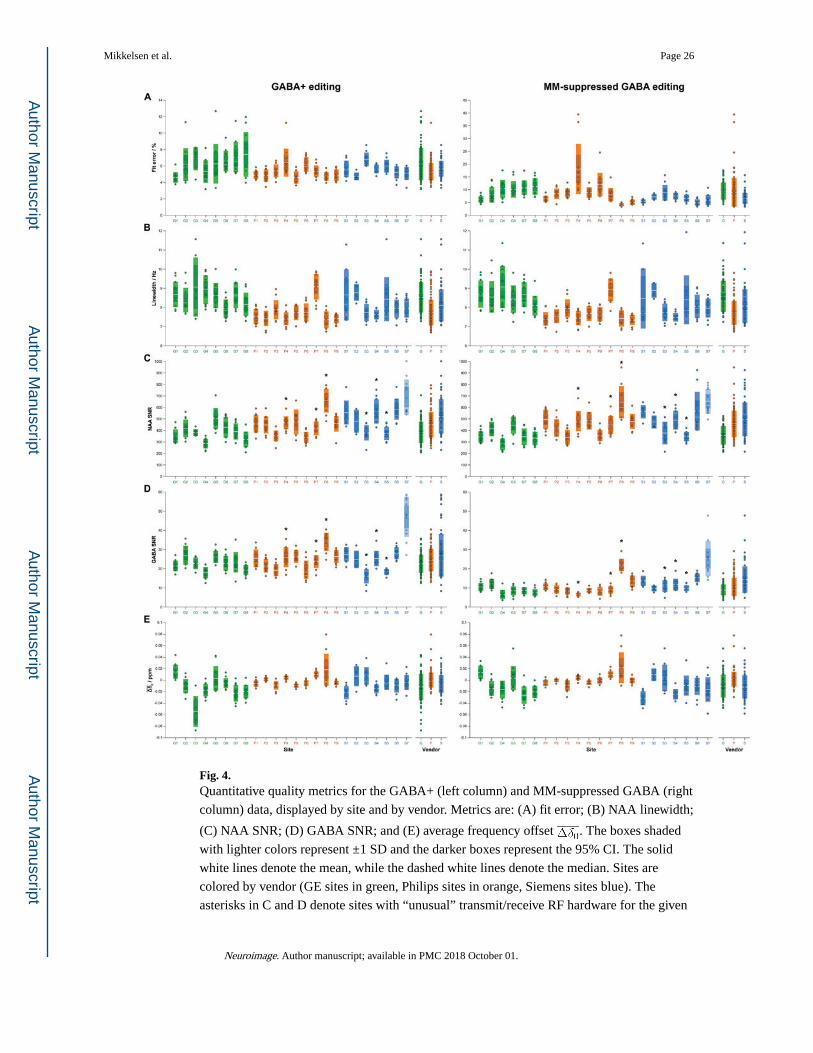
Fig. 4. Quantitative quality metrics for the GABA+ (left column) and MM-suppressed GABA (right
column) data, displayed by site and by vendor. Metrics are: (A) fit error; (B) NAA linewidth;
(C) NAA SNR; (D) GABA SNR; and (E) average frequency offset . The boxes shaded
with lighter colors represent ±1 SD and the darker boxes represent the 95% CI. The solid
white lines denote the mean, while the dashed white lines denote the median. Sites are
colored by vendor (GE sites in green, Philips sites in orange, Siemens sites blue). The
asterisks in C and D denote sites with “unusual” transmit/receive RF hardware for the given
Mikkelsen et al. Page 26
Neuroimage. Author manuscript; available in PMC 2018 October 01.
Author M
anuscriptA
uthor Manuscript
Author M
anuscriptA
uthor Manuscript
vendor: sites P4, P7 and P8 had fully digital broadband RF hardware; sites S3, S4 and S5
used 20–64- and 12-channel head coils, respectively. Note that site S7’s NAA and GABA
SNR estimates in C and D are transparent to highlight that the estimation of noise signal in
these data was unreliable. For the Siemens data, the noise in the up- and downfield
frequency ends of the spectrum was attenuated. Since site S7 acquired data with a spectral
width shorter than the other Siemens sites (−3.5–13 ppm), the attenuated noise led to
upward-biased SNR values.
Mikkelsen et al. Page 27
Neuroimage. Author manuscript; available in PMC 2018 October 01.
Author M
anuscriptA
uthor Manuscript
Author M
anuscriptA
uthor Manuscript
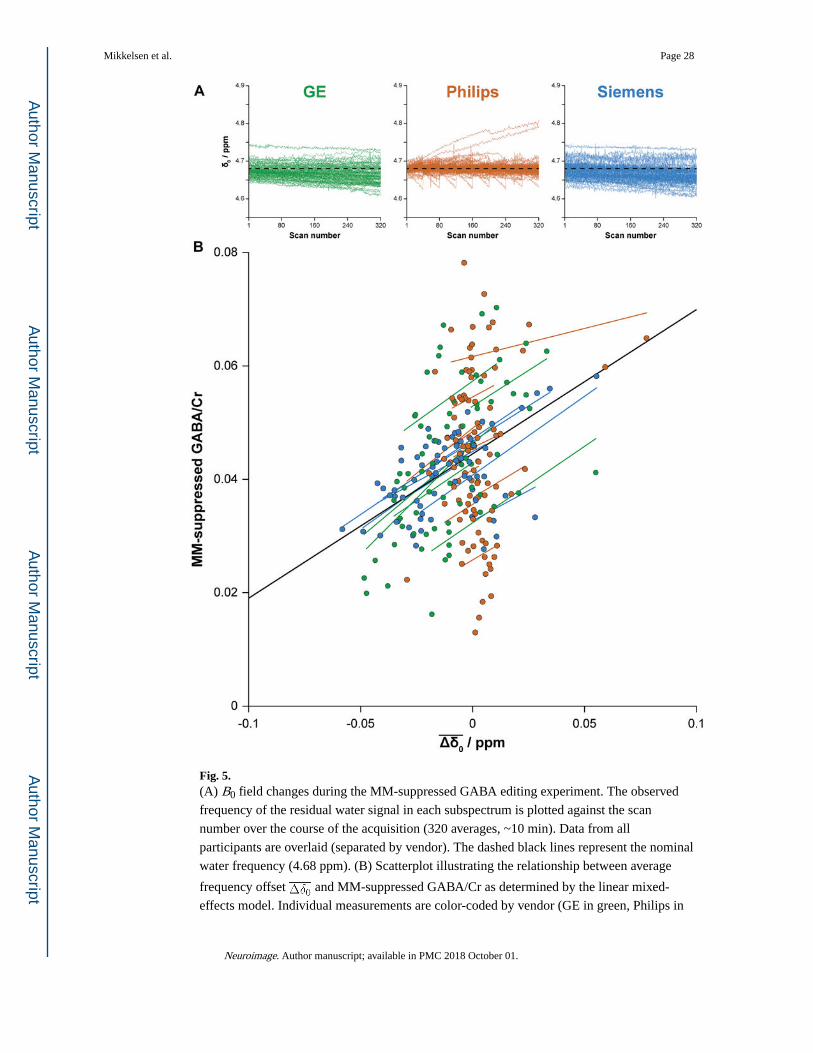
Fig. 5. (A) B0 field changes during the MM-suppressed GABA editing experiment. The observed
frequency of the residual water signal in each subspectrum is plotted against the scan
number over the course of the acquisition (320 averages, ~10 min). Data from all
participants are overlaid (separated by vendor). The dashed black lines represent the nominal
water frequency (4.68 ppm). (B) Scatterplot illustrating the relationship between average
frequency offset and MM-suppressed GABA/Cr as determined by the linear mixed-
effects model. Individual measurements are color-coded by vendor (GE in green, Philips in
Mikkelsen et al. Page 28
Neuroimage. Author manuscript; available in PMC 2018 October 01.
Author M
anuscriptA
uthor Manuscript
Author M
anuscriptA
uthor Manuscript
orange, Siemens in blue). The black regression line shows the relationship between and
MM-suppressed GABA/Cr over the entire dataset. Additional color-coded regression lines
are shown for each site.
Mikkelsen et al. Page 29
Neuroimage. Author manuscript; available in PMC 2018 October 01.
Author M
anuscriptA
uthor Manuscript
Author M
anuscriptA
uthor Manuscript
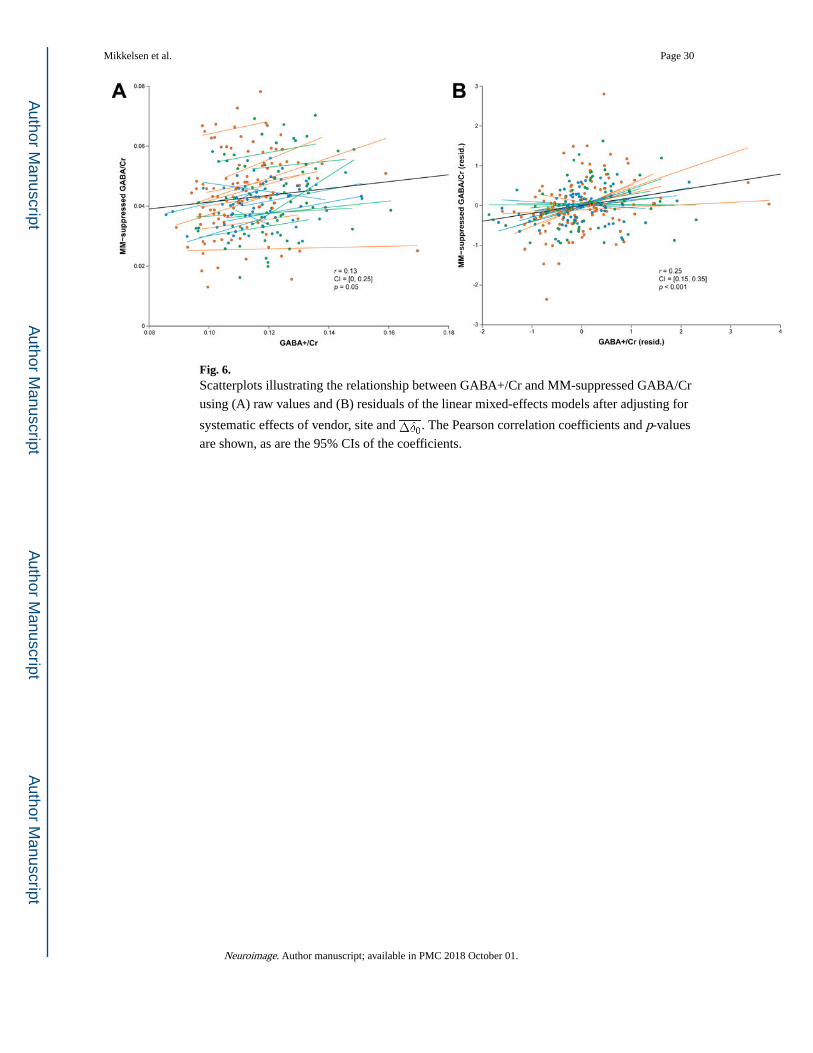
Fig. 6. Scatterplots illustrating the relationship between GABA+/Cr and MM-suppressed GABA/Cr
using (A) raw values and (B) residuals of the linear mixed-effects models after adjusting for
systematic effects of vendor, site and . The Pearson correlation coefficients and p-values
are shown, as are the 95% CIs of the coefficients.
Mikkelsen et al. Page 30
Neuroimage. Author manuscript; available in PMC 2018 October 01.
Author M
anuscriptA
uthor Manuscript
Author M
anuscriptA
uthor Manuscript
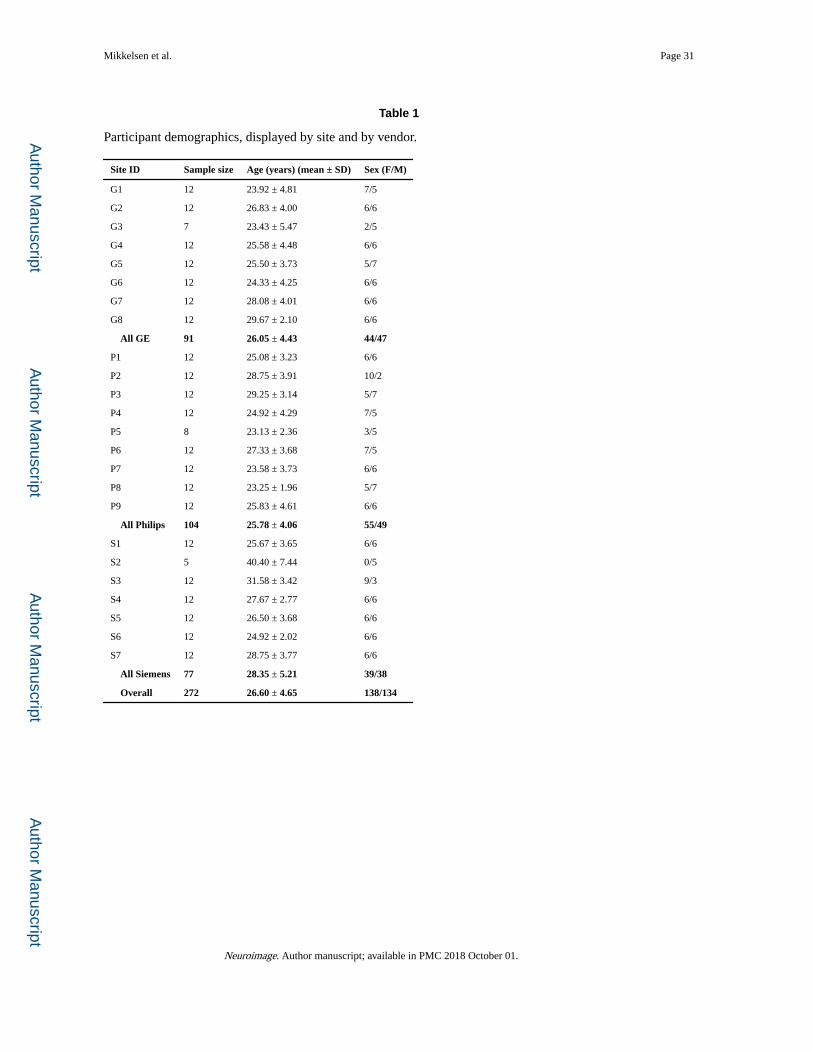
Author M
anuscriptA
uthor Manuscript
Author M
anuscriptA
uthor Manuscript
Mikkelsen et al. Page 31
Table 1
Participant demographics, displayed by site and by vendor.
Site ID Sample size Age (years) (mean ± SD) Sex (F/M)
G1 12 23.92 ± 4.81 7/5
G2 12 26.83 ± 4.00 6/6
G3 7 23.43 ± 5.47 2/5
G4 12 25.58 ± 4.48 6/6
G5 12 25.50 ± 3.73 5/7
G6 12 24.33 ± 4.25 6/6
G7 12 28.08 ± 4.01 6/6
G8 12 29.67 ± 2.10 6/6
All GE 91 26.05 ± 4.43 44/47
P1 12 25.08 ± 3.23 6/6
P2 12 28.75 ± 3.91 10/2
P3 12 29.25 ± 3.14 5/7
P4 12 24.92 ± 4.29 7/5
P5 8 23.13 ± 2.36 3/5
P6 12 27.33 ± 3.68 7/5
P7 12 23.58 ± 3.73 6/6
P8 12 23.25 ± 1.96 5/7
P9 12 25.83 ± 4.61 6/6
All Philips 104 25.78 ± 4.06 55/49
S1 12 25.67 ± 3.65 6/6
S2 5 40.40 ± 7.44 0/5
S3 12 31.58 ± 3.42 9/3
S4 12 27.67 ± 2.77 6/6
S5 12 26.50 ± 3.68 6/6
S6 12 24.92 ± 2.02 6/6
S7 12 28.75 ± 3.77 6/6
All Siemens 77 28.35 ± 5.21 39/38
Overall 272 26.60 ± 4.65 138/134
Neuroimage. Author manuscript; available in PMC 2018 October 01.
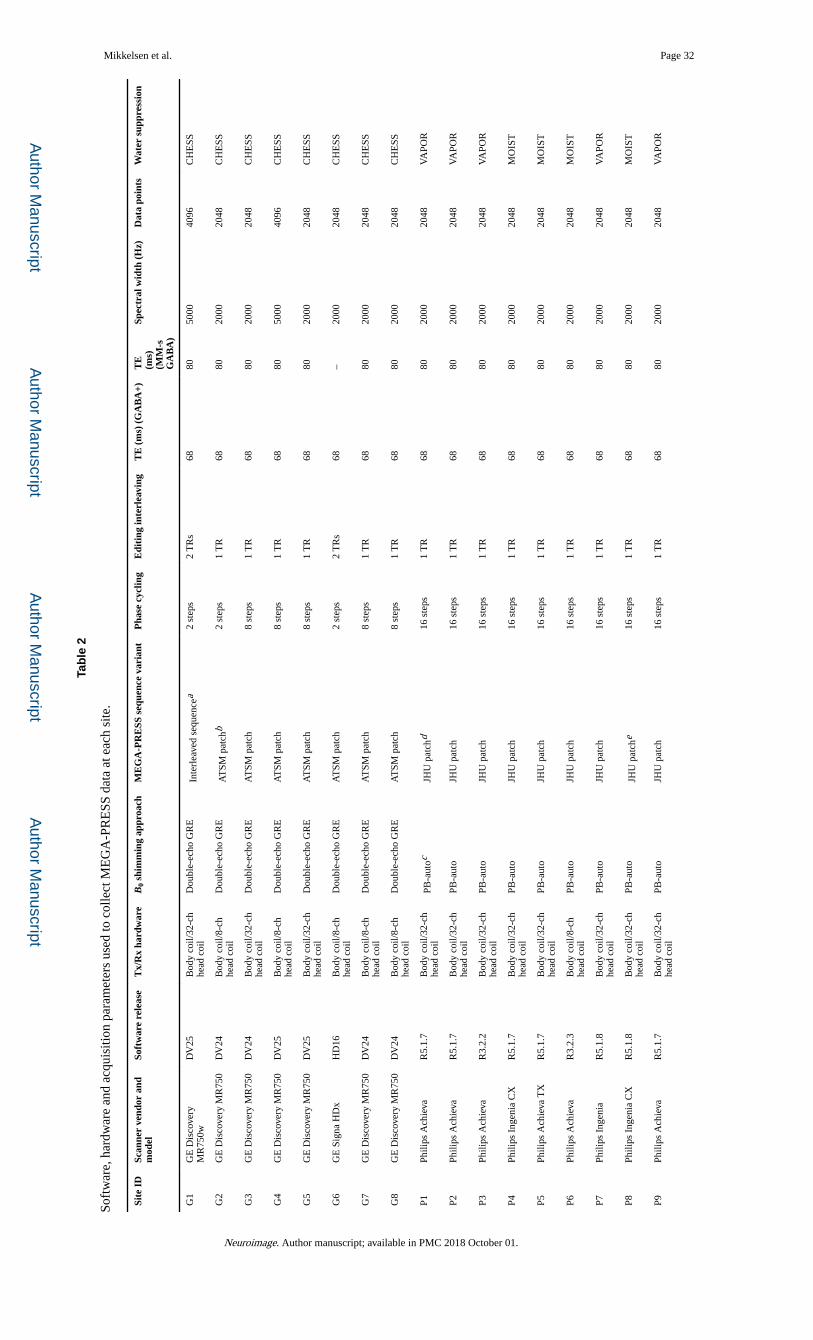
Author M
anuscriptA
uthor Manuscript
Author M
anuscriptA
uthor Manuscript
Mikkelsen et al. Page 32
Tab
le 2
Soft
war
e, h
ardw
are
and
acqu
isiti
on p
aram
eter
s us
ed to
col
lect
ME
GA
-PR
ESS
dat
a at
eac
h si
te.
Site
ID
Scan
ner
vend
or a
nd
mod
elSo
ftw
are
rele
ase
Tx/
Rx
hard
war
eB
0 sh
imm
ing
appr
oach
ME
GA
-PR
ESS
seq
uenc
e va
rian
tP
hase
cyc
ling
Edi
ting
inte
rlea
ving
TE
(m
s) (
GA
BA
+)T
E
(ms)
(M
M-s
G
AB
A)
Spec
tral
wid
th (
Hz)
Dat
a po
ints
Wat
er s
uppr
essi
on
G1
GE
Dis
cove
ryM
R75
0wD
V25
Bod
y co
il/32
-ch
head
coi
lD
oubl
e-ec
ho G
RE
Inte
rlea
ved
sequ
ence
a2
step
s2
TR
s68
8050
0040
96C
HE
SS
G2
GE
Dis
cove
ry M
R75
0D
V24
Bod
y co
il/8-
ch
head
coi
lD
oubl
e-ec
ho G
RE
AT
SM p
atch
b2
step
s1
TR
6880
2000
2048
CH
ESS
G3
GE
Dis
cove
ry M
R75
0D
V24
Bod
y co
il/32
-ch
head
coi
lD
oubl
e-ec
ho G
RE
AT
SM p
atch
8 st
eps
1 T
R68
8020
0020
48C
HE
SS
G4
GE
Dis
cove
ry M
R75
0D
V25
Bod
y co
il/8-
ch
head
coi
lD
oubl
e-ec
ho G
RE
AT
SM p
atch
8 st
eps
1 T
R68
8050
0040
96C
HE
SS
G5
GE
Dis
cove
ry M
R75
0D
V25
Bod
y co
il/32
-ch
head
coi
lD
oubl
e-ec
ho G
RE
AT
SM p
atch
8 st
eps
1 T
R68
8020
0020
48C
HE
SS
G6
GE
Sig
na H
Dx
HD
16B
ody
coil/
8-ch
he
ad c
oil
Dou
ble-
echo
GR
EA
TSM
pat
ch2
step
s2
TR
s68
–20
0020
48C
HE
SS
G7
GE
Dis
cove
ry M
R75
0D
V24
Bod
y co
il/8-
ch
head
coi
lD
oubl
e-ec
ho G
RE
AT
SM p
atch
8 st
eps
1 T
R68
8020
0020
48C
HE
SS
G8
GE
Dis
cove
ry M
R75
0D
V24
Bod
y co
il/8-
ch
head
coi
lD
oubl
e-ec
ho G
RE
AT
SM p
atch
8 st
eps
1 T
R68
8020
0020
48C
HE
SS
P1Ph
ilips
Ach
ieva
R5.
1.7
Bod
y co
il/32
-ch
head
coi
lPB
-aut
ocJH
U p
atch
d16
ste
ps1
TR
6880
2000
2048
VA
POR
P2Ph
ilips
Ach
ieva
R5.
1.7
Bod
y co
il/32
-ch
head
coi
lPB
-aut
oJH
U p
atch
16 s
teps
1 T
R68
8020
0020
48V
APO
R
P3Ph
ilips
Ach
ieva
R3.
2.2
Bod
y co
il/32
-ch
head
coi
lPB
-aut
oJH
U p
atch
16 s
teps
1 T
R68
8020
0020
48V
APO
R
P4Ph
ilips
Ing
enia
CX
R5.
1.7
Bod
y co
il/32
-ch
head
coi
lPB
-aut
oJH
U p
atch
16 s
teps
1 T
R68
8020
0020
48M
OIS
T
P5Ph
ilips
Ach
ieva
TX
R5.
1.7
Bod
y co
il/32
-ch
head
coi
lPB
-aut
oJH
U p
atch
16 s
teps
1 T
R68
8020
0020
48M
OIS
T
P6Ph
ilips
Ach
ieva
R3.
2.3
Bod
y co
il/8-
ch
head
coi
lPB
-aut
oJH
U p
atch
16 s
teps
1 T
R68
8020
0020
48M
OIS
T
P7Ph
ilips
Ing
enia
R5.
1.8
Bod
y co
il/32
-ch
head
coi
lPB
-aut
oJH
U p
atch
16 s
teps
1 T
R68
8020
0020
48V
APO
R
P8Ph
ilips
Ing
enia
CX
R5.
1.8
Bod
y co
il/32
-ch
head
coi
lPB
-aut
oJH
U p
atch
e16
ste
ps1
TR
6880
2000
2048
MO
IST
P9Ph
ilips
Ach
ieva
R5.
1.7
Bod
y co
il/32
-ch
head
coi
lPB
-aut
oJH
U p
atch
16 s
teps
1 T
R68
8020
0020
48V
APO
R
Neuroimage. Author manuscript; available in PMC 2018 October 01.
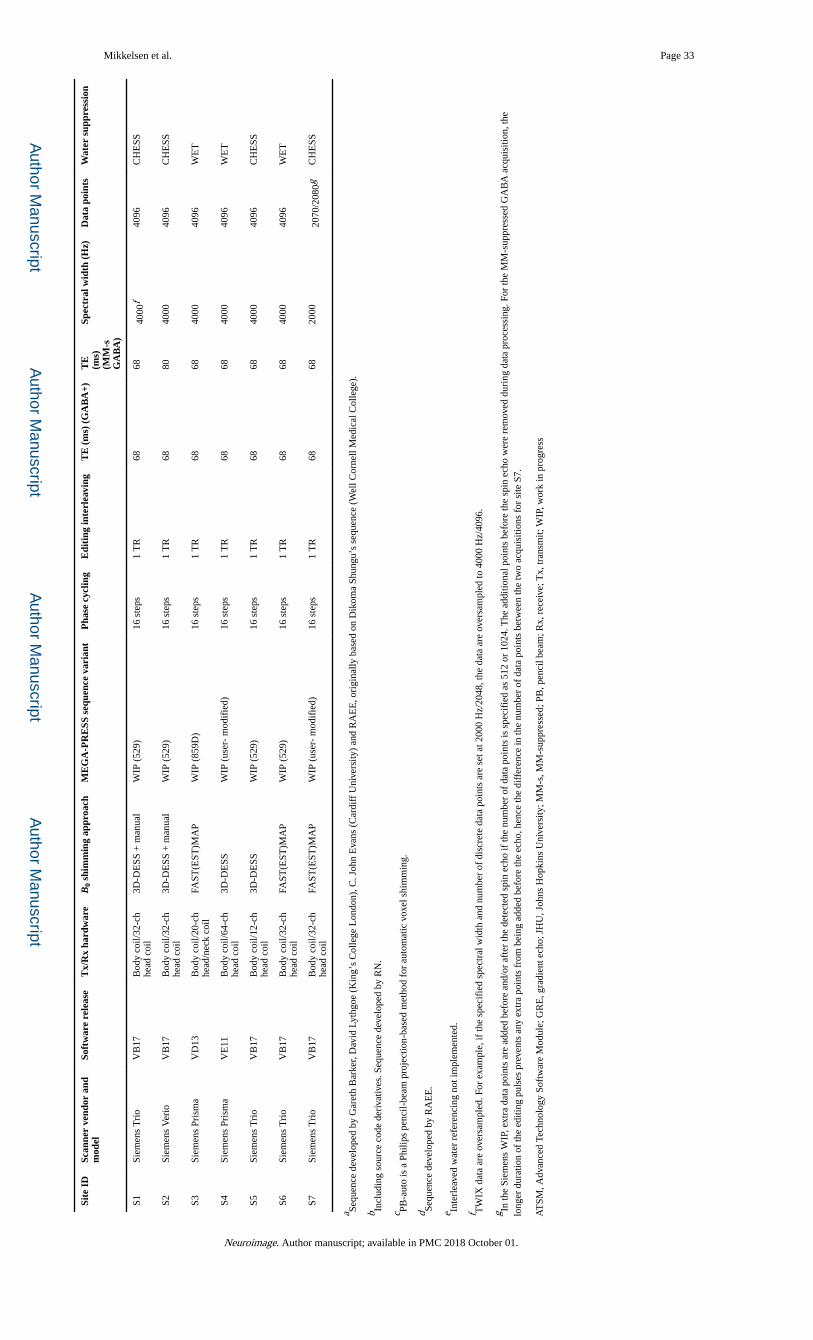
Author M
anuscriptA
uthor Manuscript
Author M
anuscriptA
uthor Manuscript
Mikkelsen et al. Page 33
Site
ID
Scan
ner
vend
or a
nd
mod
elSo
ftw
are
rele
ase
Tx/
Rx
hard
war
eB
0 sh
imm
ing
appr
oach
ME
GA
-PR
ESS
seq
uenc
e va
rian
tP
hase
cyc
ling
Edi
ting
inte
rlea
ving
TE
(m
s) (
GA
BA
+)T
E
(ms)
(M
M-s
G
AB
A)
Spec
tral
wid
th (
Hz)
Dat
a po
ints
Wat
er s
uppr
essi
on
S1Si
emen
s T
rio
VB
17B
ody
coil/
32-c
h he
ad c
oil
3D-D
ESS
+ m
anua
lW
IP (
529)
16 s
teps
1 T
R68
6840
00f
4096
CH
ESS
S2Si
emen
s V
erio
VB
17B
ody
coil/
32-c
h he
ad c
oil
3D-D
ESS
+ m
anua
lW
IP (
529)
16 s
teps
1 T
R68
8040
0040
96C
HE
SS
S3Si
emen
s Pr
ism
aV
D13
Bod
y co
il/20
-ch
head
/nec
k co
ilFA
ST(E
ST)M
AP
WIP
(85
9D)
16 s
teps
1 T
R68
6840
0040
96W
ET
S4Si
emen
s Pr
ism
aV
E11
Bod
y co
il/64
-ch
head
coi
l3D
-DE
SSW
IP (
user
- m
odif
ied)
16 s
teps
1 T
R68
6840
0040
96W
ET
S5Si
emen
s T
rio
VB
17B
ody
coil/
12-c
h he
ad c
oil
3D-D
ESS
WIP
(52
9)16
ste
ps1
TR
6868
4000
4096
CH
ESS
S6Si
emen
s T
rio
VB
17B
ody
coil/
32-c
h he
ad c
oil
FAST
(EST
)MA
PW
IP (
529)
16 s
teps
1 T
R68
6840
0040
96W
ET
S7Si
emen
s T
rio
VB
17B
ody
coil/
32-c
h he
ad c
oil
FAST
(EST
)MA
PW
IP (
user
- m
odif
ied)
16 s
teps
1 T
R68
6820
0020
70/2
080g
CH
ESS
a Sequ
ence
dev
elop
ed b
y G
aret
h B
arke
r, D
avid
Lyt
hgoe
(K
ing’
s C
olle
ge L
ondo
n), C
. Joh
n E
vans
(C
ardi
ff U
nive
rsity
) an
d R
AE
E, o
rigi
nally
bas
ed o
n D
ikom
a Sh
ungu
’s s
eque
nce
(Wel
l Cor
nell
Med
ical
Col
lege
).
b Incl
udin
g so
urce
cod
e de
riva
tives
. Seq
uenc
e de
velo
ped
by R
N.
c PB-a
uto
is a
Phi
lips
penc
il-be
am p
roje
ctio
n-ba
sed
met
hod
for
auto
mat
ic v
oxel
shi
mm
ing.
d Sequ
ence
dev
elop
ed b
y R
AE
E.
e Inte
rlea
ved
wat
er r
efer
enci
ng n
ot im
plem
ente
d.
f TW
IX d
ata
are
over
sam
pled
. For
exa
mpl
e, if
the
spec
ifie
d sp
ectr
al w
idth
and
num
ber
of d
iscr
ete
data
poi
nts
are
set a
t 200
0 H
z/20
48, t
he d
ata
are
over
sam
pled
to 4
000
Hz/
4096
.
g In th
e Si
emen
s W
IP, e
xtra
dat
a po
ints
are
add
ed b
efor
e an
d/or
aft
er th
e de
tect
ed s
pin
echo
if th
e nu
mbe
r of
dat
a po
ints
is s
peci
fied
as
512
or 1
024.
The
add
ition
al p
oint
s be
fore
the
spin
ech
o w
ere
rem
oved
dur
ing
data
pro
cess
ing.
For
the
MM
-sup
pres
sed
GA
BA
acq
uisi
tion,
the
long
er d
urat
ion
of th
e ed
iting
pul
ses
prev
ents
any
ext
ra p
oint
s fr
om b
eing
add
ed b
efor
e th
e ec
ho, h
ence
the
diff
eren
ce in
the
num
ber
of d
ata
poin
ts b
etw
een
the
two
acqu
isiti
ons
for
site
S7.
AT
SM, A
dvan
ced
Tech
nolo
gy S
oftw
are
Mod
ule;
GR
E, g
radi
ent e
cho;
JH
U, J
ohns
Hop
kins
Uni
vers
ity; M
M-s
, MM
-sup
pres
sed;
PB
, pen
cil b
eam
; Rx,
rec
eive
; Tx,
tran
smit;
WIP
, wor
k in
pro
gres
s
Neuroimage. Author manuscript; available in PMC 2018 October 01.
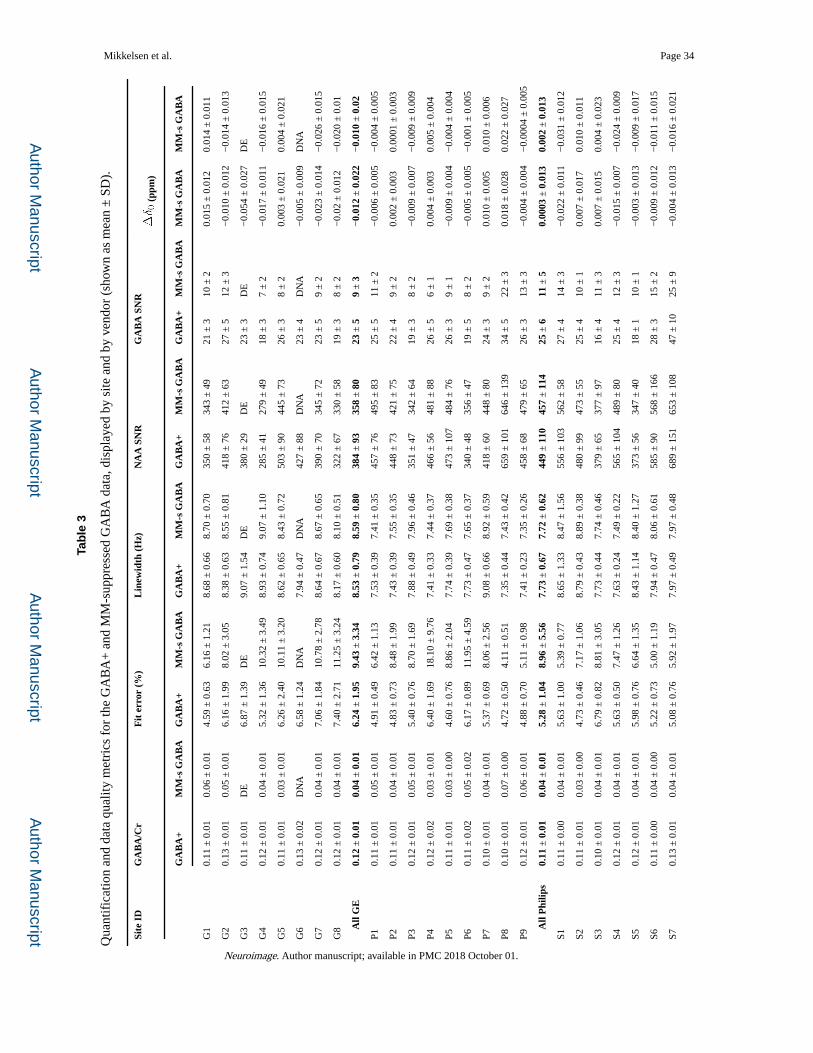
Author M
anuscriptA
uthor Manuscript
Author M
anuscriptA
uthor Manuscript
Mikkelsen et al. Page 34
Tab
le 3
Qua
ntif
icat
ion
and
data
qua
lity
met
rics
for
the
GA
BA
+ a
nd M
M-s
uppr
esse
d G
AB
A d
ata,
dis
play
ed b
y si
te a
nd b
y ve
ndor
(sh
own
as m
ean
± S
D).
Site
ID
GA
BA
/Cr
Fit
err
or (
%)
Lin
ewid
th (
Hz)
NA
A S
NR
GA
BA
SN
R (
ppm
)
GA
BA
+M
M-s
GA
BA
GA
BA
+M
M-s
GA
BA
GA
BA
+M
M-s
GA
BA
GA
BA
+M
M-s
GA
BA
GA
BA
+M
M-s
GA
BA
MM
-s G
AB
AM
M-s
GA
BA
G1
0.11
± 0
.01
0.06
± 0
.01
4.59
± 0
.63
6.16
± 1
.21
8.68
± 0
.66
8.70
± 0
.70
350
± 5
834
3 ±
49
21 ±
310
± 2
0.01
5 ±
0.0
120.
014
± 0
.011
G2
0.13
± 0
.01
0.05
± 0
.01
6.16
± 1
.99
8.02
± 3
.05
8.38
± 0
.63
8.55
± 0
.81
418
± 7
641
2 ±
63
27 ±
512
± 3
−0.
010
± 0
.012
−0.
014
± 0
.013
G3
0.11
± 0
.01
DE
6.87
± 1
.39
DE
9.07
± 1
.54
DE
380
± 2
9D
E23
± 3
DE
−0.
054
± 0
.027
DE
G4
0.12
± 0
.01
0.04
± 0
.01
5.32
± 1
.36
10.3
2 ±
3.4
98.
93 ±
0.7
49.
07 ±
1.1
028
5 ±
41
279
± 4
918
± 3
7 ±
2−
0.01
7 ±
0.0
11−
0.01
6 ±
0.0
15
G5
0.11
± 0
.01
0.03
± 0
.01
6.26
± 2
.40
10.1
1 ±
3.2
08.
62 ±
0.6
58.
43 ±
0.7
250
3 ±
90
445
± 7
326
± 3
8 ±
20.
003
± 0
.021
0.00
4 ±
0.0
21
G6
0.13
± 0
.02
DN
A6.
58 ±
1.2
4D
NA
7.94
± 0
.47
DN
A42
7 ±
88
DN
A23
± 4
DN
A−
0.00
5 ±
0.0
09D
NA
G7
0.12
± 0
.01
0.04
± 0
.01
7.06
± 1
.84
10.7
8 ±
2.7
88.
64 ±
0.6
78.
67 ±
0.6
539
0 ±
70
345
± 7
223
± 5
9 ±
2−
0.02
3 ±
0.0
14−
0.02
6 ±
0.0
15
G8
0.12
± 0
.01
0.04
± 0
.01
7.40
± 2
.71
11.2
5 ±
3.2
48.
17 ±
0.6
08.
10 ±
0.5
132
2 ±
67
330
± 5
819
± 3
8 ±
2−
0.02
± 0
.012
−0.
020
± 0
.01
A
ll G
E0.
12 ±
0.0
10.
04 ±
0.0
16.
24 ±
1.9
59.
43 ±
3.3
48.
53 ±
0.7
98.
59 ±
0.8
038
4 ±
93
358
± 8
023
± 5
9 ±
3−
0.01
2 ±
0.0
22−
0.01
0 ±
0.0
2
P10.
11 ±
0.0
10.
05 ±
0.0
14.
91 ±
0.4
96.
42 ±
1.1
37.
53 ±
0.3
97.
41 ±
0.3
545
7 ±
76
495
± 8
325
± 5
11 ±
2−
0.00
6 ±
0.0
05−
0.00
4 ±
0.0
05
P20.
11 ±
0.0
10.
04 ±
0.0
14.
83 ±
0.7
38.
48 ±
1.9
97.
43 ±
0.3
97.
55 ±
0.3
544
8 ±
73
421
± 7
522
± 4
9 ±
20.
002
± 0
.003
0.00
01 ±
0.0
03
P30.
12 ±
0.0
10.
05 ±
0.0
15.
40 ±
0.7
68.
70 ±
1.6
97.
88 ±
0.4
97.
96 ±
0.4
635
1 ±
47
342
± 6
419
± 3
8 ±
2−
0.00
9 ±
0.0
07−
0.00
9 ±
0.0
09
P40.
12 ±
0.0
20.
03 ±
0.0
16.
40 ±
1.6
918
.10
± 9
.76
7.41
± 0
.33
7.44
± 0
.37
466
± 5
648
1 ±
88
26 ±
56
± 1
0.00
4 ±
0.0
030.
005
± 0
.004
P50.
11 ±
0.0
10.
03 ±
0.0
04.
60 ±
0.7
68.
86 ±
2.0
47.
74 ±
0.3
97.
69 ±
0.3
847
3 ±
107
484
± 7
626
± 3
9 ±
1−
0.00
9 ±
0.0
04−
0.00
4 ±
0.0
04
P60.
11 ±
0.0
20.
05 ±
0.0
26.
17 ±
0.8
911
.95
± 4
.59
7.73
± 0
.47
7.65
± 0
.37
340
± 4
835
6 ±
47
19 ±
58
± 2
−0.
005
± 0
.005
−0.
001
± 0
.005
P70.
10 ±
0.0
10.
04 ±
0.0
15.
37 ±
0.6
98.
06 ±
2.5
69.
08 ±
0.6
68.
92 ±
0.5
941
8 ±
60
448
± 8
024
± 3
9 ±
20.
010
± 0
.005
0.01
0 ±
0.0
06
P80.
10 ±
0.0
10.
07 ±
0.0
04.
72 ±
0.5
04.
11 ±
0.5
17.
35 ±
0.4
47.
43 ±
0.4
265
9 ±
101
646
± 1
3934
± 5
22 ±
30.
018
± 0
.028
0.02
2 ±
0.0
27
P90.
12 ±
0.0
10.
06 ±
0.0
14.
88 ±
0.7
05.
11 ±
0.9
87.
41 ±
0.2
37.
35 ±
0.2
645
8 ±
68
479
± 6
526
± 3
13 ±
3−
0.00
4 ±
0.0
04−
0.00
04 ±
0.0
05
A
ll P
hilip
s0.
11 ±
0.0
10.
04 ±
0.0
15.
28 ±
1.0
48.
96 ±
5.5
67.
73 ±
0.6
77.
72 ±
0.6
244
9 ±
110
457
± 1
1425
± 6
11 ±
50.
0003
± 0
.013
0.00
2 ±
0.0
13
S10.
11 ±
0.0
00.
04 ±
0.0
15.
63 ±
1.0
05.
39 ±
0.7
78.
65 ±
1.3
38.
47 ±
1.5
655
6 ±
103
562
± 5
827
± 4
14 ±
3−
0.02
2 ±
0.0
11−
0.03
1 ±
0.0
12
S20.
11 ±
0.0
10.
03 ±
0.0
04.
73 ±
0.4
67.
17 ±
1.0
68.
79 ±
0.4
38.
89 ±
0.3
848
0 ±
99
473
± 5
525
± 4
10 ±
10.
007
± 0
.017
0.01
0 ±
0.0
11
S30.
10 ±
0.0
10.
04 ±
0.0
16.
79 ±
0.8
28.
81 ±
3.0
57.
73 ±
0.4
47.
74 ±
0.4
637
9 ±
65
377
± 9
716
± 4
11 ±
30.
007
± 0
.015
0.00
4 ±
0.0
23
S40.
12 ±
0.0
10.
04 ±
0.0
15.
63 ±
0.5
07.
47 ±
1.2
67.
63 ±
0.2
47.
49 ±
0.2
256
5 ±
104
489
± 8
025
± 4
12 ±
3−
0.01
5 ±
0.0
07−
0.02
4 ±
0.0
09
S50.
12 ±
0.0
10.
04 ±
0.0
15.
98 ±
0.7
66.
64 ±
1.3
58.
43 ±
1.1
48.
40 ±
1.2
737
3 ±
56
347
± 4
018
± 1
10 ±
1−
0.00
3 ±
0.0
13−
0.00
9 ±
0.0
17
S60.
11 ±
0.0
00.
04 ±
0.0
05.
22 ±
0.7
35.
00 ±
1.1
97.
94 ±
0.4
78.
06 ±
0.6
158
5 ±
90
568
± 1
6628
± 3
15 ±
2−
0.00
9 ±
0.0
12−
0.01
1 ±
0.0
15
S70.
13 ±
0.0
10.
04 ±
0.0
15.
08 ±
0.7
65.
92 ±
1.9
77.
97 ±
0.4
97.
97 ±
0.4
868
9 ±
151
653
± 1
0847
± 1
025
± 9
−0.
004
± 0
.013
−0.
016
± 0
.021
Neuroimage. Author manuscript; available in PMC 2018 October 01.
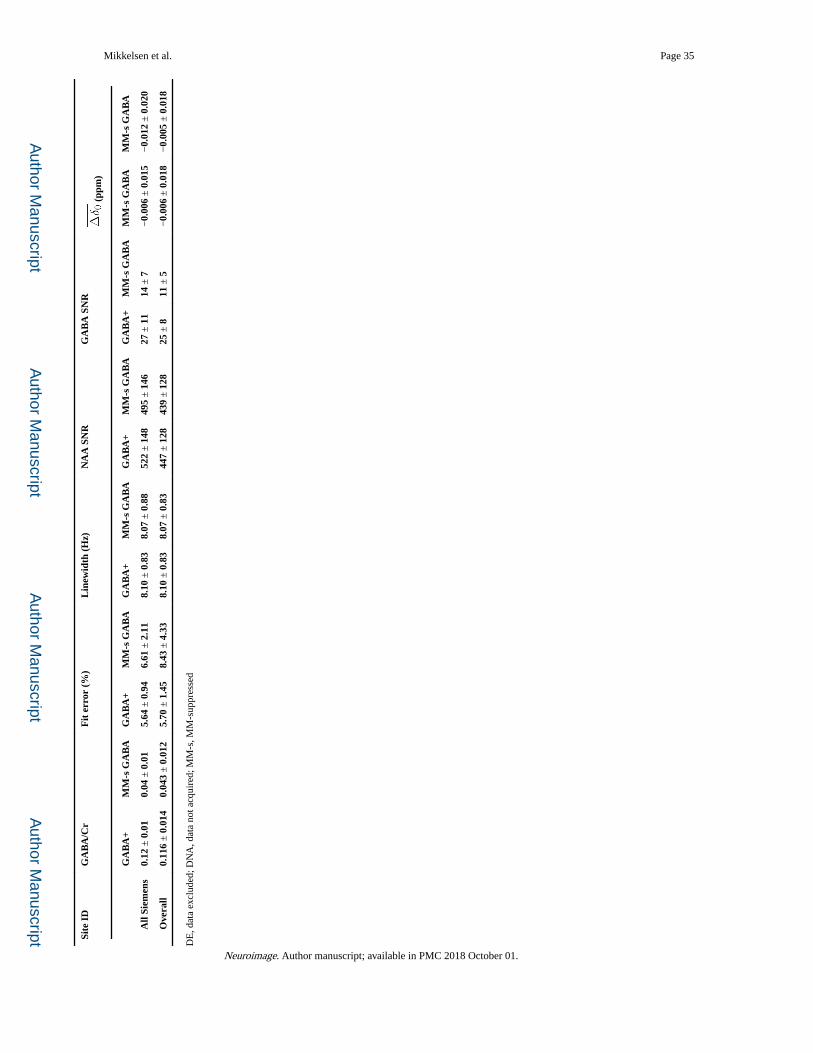
Author M
anuscriptA
uthor Manuscript
Author M
anuscriptA
uthor Manuscript
Mikkelsen et al. Page 35
Site
ID
GA
BA
/Cr
Fit
err
or (
%)
Lin
ewid
th (
Hz)
NA
A S
NR
GA
BA
SN
R (
ppm
)
GA
BA
+M
M-s
GA
BA
GA
BA
+M
M-s
GA
BA
GA
BA
+M
M-s
GA
BA
GA
BA
+M
M-s
GA
BA
GA
BA
+M
M-s
GA
BA
MM
-s G
AB
AM
M-s
GA
BA
A
ll Si
emen
s0.
12 ±
0.0
10.
04 ±
0.0
15.
64 ±
0.9
46.
61 ±
2.1
18.
10 ±
0.8
38.
07 ±
0.8
852
2 ±
148
495
± 1
4627
± 1
114
± 7
−0.
006
± 0
.015
−0.
012
± 0
.020
O
vera
ll0.
116
± 0
.014
0.04
3 ±
0.0
125.
70 ±
1.4
58.
43 ±
4.3
38.
10 ±
0.8
38.
07 ±
0.8
344
7 ±
128
439
± 1
2825
± 8
11 ±
5−
0.00
6 ±
0.0
18−
0.00
5 ±
0.0
18
DE
, dat
a ex
clud
ed; D
NA
, dat
a no
t acq
uire
d; M
M-s
, MM
-sup
pres
sed
Neuroimage. Author manuscript; available in PMC 2018 October 01.


![NIH Public Access - Oswaldo Cruz Foundation · PDF file(Sigma # P8340 and Sigma # P5726)]. To obtain the mitochondrial fraction, heart ventricles were homogenized in ice-cold mannitol](https://static.fdocument.org/doc/165x107/5abaee147f8b9a24028c0e51/nih-public-access-oswaldo-cruz-foundation-sigma-p8340-and-sigma-p5726-to.jpg)